the Creative Commons Attribution 4.0 License.
the Creative Commons Attribution 4.0 License.
 | 30 Jul 2020
Source attribution of Arctic black carbon and sulfate aerosols and associated Arctic surface warming during 1980–2018
Lili Ren
Hailong Wang
Rudong Zhang
Pinya Wang
Hong Liao
Observations show that the concentrations of Arctic sulfate and black carbon (BC) aerosols have declined since the early 1980s. Previous studies have reported that reducing sulfate aerosols potentially contributed to the recent rapid Arctic warming. In this study, a global aerosol–climate model (Community Atmosphere Model, version 5) equipped with Explicit Aerosol Source Tagging (CAM5-EAST) is applied to quantify the source apportionment of aerosols in the Arctic from 16 source regions and the role of aerosol variations in affecting changes in the Arctic surface temperature from 1980 to 2018. The CAM5-EAST simulated surface concentrations of sulfate and BC in the Arctic had a decrease of 43 % and 23 %, respectively, in 2014–2018 relative to 1980–1984 mainly due to the reduction of emissions from Europe, Russia and local Arctic sources. Increases in emissions from South and East Asia led to positive trends in Arctic sulfate and BC in the upper troposphere. All aerosol radiative impacts are considered including aerosol–radiation and aerosol–cloud interactions, as well as black carbon deposition on snow- and ice-covered surfaces. Within the Arctic, sulfate reductions caused a top-of-atmosphere (TOA) warming of 0.11 and 0.25 W m−2 through aerosol–radiation and aerosol–cloud interactions, respectively. While the changes in Arctic atmospheric BC has little impact on local radiative forcing, the decrease in BC in snow and ice led to a net cooling of 0.05 W m−2. By applying climate sensitivity factors for different latitudinal bands, global changes in sulfate and BC during 2014–2018 (with respect to 1980–1984) exerted a +0.088 and 0.057 K Arctic surface warming, respectively, through aerosol–radiation interactions. Through aerosol–cloud interactions, the sulfate reduction caused an Arctic warming of +0.193 K between the two time periods. The weakened BC effect on snow–ice albedo led to an Arctic surface cooling of −0.041 K. The changes in atmospheric sulfate and BC outside the Arctic produced a total Arctic warming of +0.25 K, the majority of which is due to the midlatitude changes in radiative forcing. Our results suggest that changes in aerosols over the midlatitudes of the Northern Hemisphere have a larger impact on Arctic temperature than other regions through enhanced poleward heat transport. The combined total effects of sulfate and BC produced an Arctic surface warming of +0.297 K, explaining approximately 20 % of the observed Arctic warming since the early 1980s.
- Article
(7906 KB) -
Supplement
(613 KB) - BibTeX
- EndNote


The Arctic has warmed rapidly since the 1980s with a 1.5 K increase in the surface air temperature, which is about 2 to 4 times faster than the global average (Trenberth et al., 2007; Serreze et al., 2009). The significant rise in air and ground temperatures occurred in phase with dramatic melting of Arctic sea ice and snow, potentially contributing to Arctic amplification (Pithan and Mauritsen, 2014; Zhang et al., 2019). A number of studies have examined possible mechanisms that caused the rapid Arctic warming (Graversen et al., 2008; Screen and Simmonds, 2010a, b; Alexeev et al., 2012; Zhang et al., 2018). Observations and modeling studies suggest that, although anthropogenic long-lived greenhouse gases (GHGs) dominate the radiative forcing of the climate system, variations in black carbon (BC) aerosol and other short-lived air pollutants are a good explanation for the faster Arctic warming (Law and Stohl, 2007; Quinn et al., 2008; Shindell et al., 2008). In particular, Shindell and Faluvegi (2009) found that aerosols may have warmed the Arctic surface during 1976–2010 based on model sensitivity experiments. The aerosols that caused Arctic warming are not only from local emissions. Studies have shown that changes in long-range transport of sulfate and BC aerosols from midlatitude regions have caused strong wintertime warming in the Arctic (e.g., Breider et al., 2014; Fisher et al., 2011; Shindell et al., 2008). In addition, the midlatitude aerosols can influence Arctic climate by changing poleward heat transport (Navarro et al., 2016).
Observed and modeled seasonal cycles of aerosol concentrations at the remote Arctic surface show a maximum in winter, a phenomenon commonly known as Arctic Haze, and a minimum in summer (Law and Andreas, 2007; Quinn et al., 2007; Eckhardt et al., 2015; Garrett et al., 2010; Sharma et al., 2006). The winter maximum has been attributed to the long-range transport of anthropogenic pollution from the midlatitudes of the Northern Hemisphere and weak removal in the Arctic (Stohl, 2006; Wang et al., 2014). In contrast, summer aerosol concentrations in the Arctic atmosphere reach a minimum value due to a reduced poleward aerosol transport from the midlatitudes and efficient wet scavenging processes during the transport (Bourgeois and Bey, 2011; Browse et al., 2012; Garrett et al., 2011). Anthropogenic aerosol species (e.g., sulfate, BC and organic matter) can affect Arctic climate by disturbing the energy balance of the earth system (Yang et al., 2019a). Sulfate aerosols directly scatter solar radiation and indirectly influence cloud processes by serving as cloud condensation nuclei (Yang et al., 2017a; Zamora et al., 2017; Zhao and Garrett, 2015). BC absorbs solar radiation and warms the atmosphere (Bond et al., 2013; Yang et al., 2017b; Lou et al., 2019a), which can increase or decrease cloud cover depending on the vertical distribution of BC relative to clouds (e.g., McFarquhar and Wang, 2006; Lou et al., 2019b). When it deposits on snow and ice, BC can reduce surface albedo and accelerate snowmelt (Flanner et al., 2007; Qian et al., 2015). Breider et al. (2017) estimated the aerosol radiative forcing due to aerosol–radiation interactions in the Arctic and found that, averaged over 2005–2010, the top-of-atmosphere (TOA) forcing is Wm−2 for sulfate and Wm−2 for BC over the Arctic.
Analysis of long-term changes in sulfate and BC can help to provide a comprehensive understanding of their past and present impacts on the Arctic climate. In situ observations of sulfate and BC concentrations in the Arctic (e.g., at Alert, Barrow, Station Nord and Zeppelin) have shown a declining trend since the 1980s (Gong et al., 2010; Heidam et al., 1999; Hirdman et al., 2010; Quinn et al., 2009; Sharma et al., 2004, 2006; Sinha et al., 2017; Sirois and Barrie, 1999). Based on the chemical transport model (GEOS-Chem) simulations, Breider et al. (2017) found that annual sulfate and BC concentrations decreased by 2 %–3 % per year over the Arctic during 1980–2010. McConnell et al. (2007) presented a historical BC trend derived from ice-core records, showing that BC concentration had been declining steadily after the peak around 1910.
Source attribution analysis of atmospheric aerosols in the Arctic, which can help us understand aerosol trends, is extremely important for air pollution research. There are fewer local anthropogenic aerosol emissions in the Arctic region than in polluted regions of the world. Pollutants in the Arctic are generally from midlatitude areas through long-distance transport (Fisher et al., 2011; Wang et al., 2014). Recent studies have found that Arctic aerosols mainly originate from Eurasia, Southeast Asia, Siberia and North America (Fisher et al., 2011; Qi et al., 2017; Sharma et al., 2013; Stohl, 2006). The contribution of Eurasia to Arctic sulfate and BC aerosol concentrations is dominant in the lower atmosphere, while South and Central Asia contributed the most at high altitudes (e.g., Wang et al., 2014). In general, northern Europe and Russia, with large industrial emissions, are the main source region of Arctic BC aerosols in spring (Rahn et al., 1977; Rahn, 1981; Raatz and Shaw, 1984; Barrie, 1986; Koch and Hansen, 2005; Sharma et al., 2006; Stohl, 2006). Shindell et al. (2008) studied the sensitivity of simulated Arctic aerosol concentrations to emission perturbations in 2001 and found that European emissions contributed to Arctic sulfate concentrations near the surface and at 500 hPa by 73 % and 51 %, respectively. East Asia has the largest contribution at 250 hPa, reaching 36 %. Based on simulations of a chemical transport model, Fisher et al. (2011) concluded that West Asian emissions dominated wintertime Arctic sulfate concentration with contributions between 30 % and 45 %. In the past few decades, anthropogenic emissions have changed rapidly, with a decrease in Europe and North America and an increase in South and East Asia. This may have had an important impact on the Arctic aerosols and climate (Breider et al., 2014).
In this study, the global aerosol–climate model CAM5 (Community Atmosphere Model, version 5) equipped with an Explicit Aerosol Source Tagging (CAM5-EAST) is used to examine the attribution of Arctic aerosols to 16 different source regions and the aerosol-related Arctic warming during 1980–2018. We focus on changes in sulfate and BC near-surface concentrations, total column burden, and radiative forcing, as well as their impacts on the surface temperature over the Arctic. Sulfate and BC concentrations from the CAM5-EAST model and observations at remote Arctic stations are compared. CAM5-EAST tagging results are used to quantify the contributions of different sources to the decadal changes in Arctic sulfate and BC surface concentrations and vertical profiles. Based on the Arctic climate sensitivity factors, we estimate the responses of the Arctic surface temperature to the variations in sulfate and BC during the analyzed time periods.
2.1 Model description and experimental setup
The global aerosol–climate model CAM5, which is the atmospheric component of the Community Earth System Model (CESM; Hurrell et al., 2013) developed at the National Center for Atmospheric Research (NCAR), is used to simulate Arctic aerosols and climate for the years 1980–2018 (after 1-year model spin-up). In this model version, mass and number concentrations of sulfate particles are predicted for the three lognormal modes (i.e., Aitken, accumulation and coarse modes) of the three-mode modal aerosol module (Liu et al., 2012) in CAM5. Aerosols are internally mixed in the same aerosol mode and then externally mixed between modes. Within each mode, sulfate is internally mixed with primary and/or secondary organic matter, BC, mineral dust, and/or sea salt. BC is mixed with other aerosol species (e.g., sulfate, primary organic aerosol, secondary organic aerosol, sea salt and dust) in the accumulation mode immediately after being emitted into the atmosphere without considering explicit aging processes. The optical properties and radiative impact of aerosols are calculated online. The model also includes climate effects of aerosols through aerosol–radiation and aerosol–cloud interactions.
In this study, the model is configured to run in a horizontal grid of latitude 1.9∘ × longitude 2.5∘ with 30 vertical layers up to 3.6 hPa. The CAM5 simulation is conducted with prescribed time-varying solar radiation, sea surface temperature, sea-ice concentration, GHGs, and emissions of aerosols and their precursor gases. Sea surface temperatures and sea-ice concentrations are created from the merged Reynolds–HadISST products, as described in Hurrell et al. (2008). Solar radiation and GHGs follow the CMIP6 (Coupled Model Intercomparison Project Phase 6) configuration for AMIP-type (Atmosphere Model Intercomparison Project) simulations. In order to better reproduce the aerosol transport driven by large-scale circulations in the model, the wind field is nudged toward the MERRA-2 (Modern-Era Retrospective analysis for Research and Applications, Version 2) reanalysis (Rienecker et al., 2011; Gelaro et al., 2017) at a 6-hourly relaxation timescale.
2.2 Explicit aerosol source tagging and source regions
EAST was implemented in CAM5 to quantify the source–receptor relationships of aerosols in recent studies (Wang et al., 2014; Yang et al., 2017a, b, 2018a, b, c). All physical, chemical and dynamical processes of aerosols for each tagged source region or sector are considered independently and consistently by using additional sets of aerosol variables in CAM5-EAST, which is different from the widely used emission sensitivity method that assumes a linear response to emission perturbation or the indirect method of tracing long-lived constituents associated with particular sources. Without such an assumption of linear response or constant decaying rate, EAST is more physically accurate than the source attribution methods mentioned above. In this study, sulfate and BC are explicitly tracked throughout the processes from source emissions to deposition in a single model simulation.
We focus on the Arctic (66.5–90∘ N) as the receptor region in this study. According to the source-region definitions of the Hemispheric Transport of Air Pollution model experiment phase 2 (HTAP2), sulfate and BC from 16 regions are tagged (Fig. 1): Europe (EUR), North America (NAM), Central America (CAM), South America (SAM), northern Africa (NAF), southern Africa (SAF), the Middle East (MDE), Southeast Asia (SEA), Central Asia (CAS), South Asia (SAS), East Asia (EAS), Russia–Belarus–Ukraine (RBU, hereafter Russia), Pacific–Australia–New Zealand (PAN), the Arctic (ARC), the Antarctic (ANT), and non-Arctic and non-Antarctic oceans (OCN). Note that the OCN tag includes sources from oceans and volcanic eruptions.

Figure 1(a) The 16 anthropogenic source regions – Europe (EUR), North America (NAM), Central America (CAM), South America (SAM), northern Africa (NAF), southern Africa (SAF), the Middle East (MDE), Southeast Asia (SEA), Central Asia (CAS), South Asia (SAS), East Asia (EAS), Russia–Belarus–Ukraine (RBU), Pacific–Australia–New Zealand (PAN), the Arctic (ARC), Antarctic (ANT), and non-Arctic and non-Antarctic oceans (OCN). Dots in (b) mark observational sites at Alert (A; 82∘ N, 62∘ W), Station Nord (S; 81∘ N, 16∘ W), Barrow (B; 71∘ N, 156∘ W), Ny-Ålesund (N; 78∘ N, 11∘ E) and Kevo (K; 69∘ N, 27∘ E). Spatial distribution of annual mean (c) SO2 (g S m−2 yr−1) and (d) BC (g C m−2 yr−1) emissions averaged over 1980–2018. The thick black circles mark the Arctic (66.5–90∘ N).
2.3 Radiative forcings and temperature response
Radiative forcing (RF) due to aerosol–radiation interactions is calculated as the difference of clear-sky net radiative fluxes at the TOA between two separate diagnostic calculations including and excluding specific aerosols in the radiative transfer calculation (Ghan et al., 2012). Aerosols interact with stratiform clouds through two-moment microphysics, in which the nucleation of stratiform cloud droplets is based on the scheme of Abdul-Razzak and Ghan et al. (2000). Although aerosols have no microphysical impact on convective clouds, the ambient temperature and convection can be affected by BC-induced atmospheric heating. The Arctic equilibrium temperature response is estimated using Arctic climate sensitivity factors (λ; K W−1m2), defined as the change in Arctic surface temperature per unit RF for different latitudinal bands from Sand et al. (2016) and Shindell and Faluvegi (2009). The change in equilibrium temperature response is defined as . The difference of the annual mean of a variable is represented by Δ for a specific year compared to the average during 1980–1984 in this study. RF is radiative forcing due to aerosol–radiation or aerosol–cloud interactions associated with sulfate or black carbon. LAT represents latitudinal bands over the Arctic (60–90∘ N), Northern Hemisphere midlatitudes (28–60∘ N), tropics (28∘ S–28∘ N) and Southern Hemisphere (90–28∘ S). Many studies used these climate sensitivity factors to estimate the Arctic temperature responses using RF calculated from different models (e.g., Sand et al., 2016). However, we note that, since the λ values were calculated with a different climate model (NASA-GISS), the estimated Arctic equilibrium temperature response based on these factors could be biased.
2.4 Aerosol and precursor emissions
In order to simulate the long-term temporal variations in aerosols, historical anthropogenic (Hoesly et al., 2018) and biomass combustion (van Marle et al., 2017) emissions of aerosols and precursor gases during 1980–2014 are used in the simulation following the CMIP6 protocol. For the most recent years (2015–2018), yearly interpolated emissions from the SSP (Shared Socioeconomic Pathway) 2-4.5 scenario are used, which is the modest scenario compared to other SSPs and is widely utilized in many model intercomparison projects in CMIP6 (O'Neill et al., 2016). Figures 1 and 2 (Fig. S1) show the spatial distribution and time series of annual anthropogenic SO2 and BC emissions, respectively, during 1980–2018 from the 16 source regions. The global total anthropogenic SO2 and BC emission rates, averaged over 1980–2018, are 118.4 and 8.1 Tg yr−1, respectively. SO2 emissions are relatively high in East Asia (23.6 Tg yr−1), Europe (15.8 Tg yr−1) and North America (15.4 Tg yr−1), while BC emissions show high values in East Asia (1.8 Tg yr−1), southern Africa (1.6 Tg yr−1) and South Asia (0.9 Tg yr−1). Comparing 2014–2018 to 1980–1984, global anthropogenic SO2 emissions were reduced by 32.2 Tg yr−1 (24.8 % relative to 1980–1984). The largest decreases took place in Europe (83.0 %), North America (80.7 %) and Russia (74.8 %). In East Asia, the emission of anthropogenic SO2 increased by a factor of 2.7 from 1980 to 2014, followed by a decreasing trend after 2014 due to stricter air pollution regulations. The global anthropogenic BC emissions increased from 6.5 Tg yr−1 in 1980 to a peak of 9.6 Tg yr−1 in 2014, followed by a slow decline and an overall increase of 42 % between the first and last 5 years of 1980–2018. Regionally, compared to 1980–1984, averaged BC emissions in 2014–2018 in Europe and Russia decreased by 45.2 % and 44.1 %, respectively, while BC emissions in East Asia and South Asia increased by a factor of almost 2. Within the Arctic, SO2 and BC emissions decreased by 5.8 % and 38.3 %, respectively.
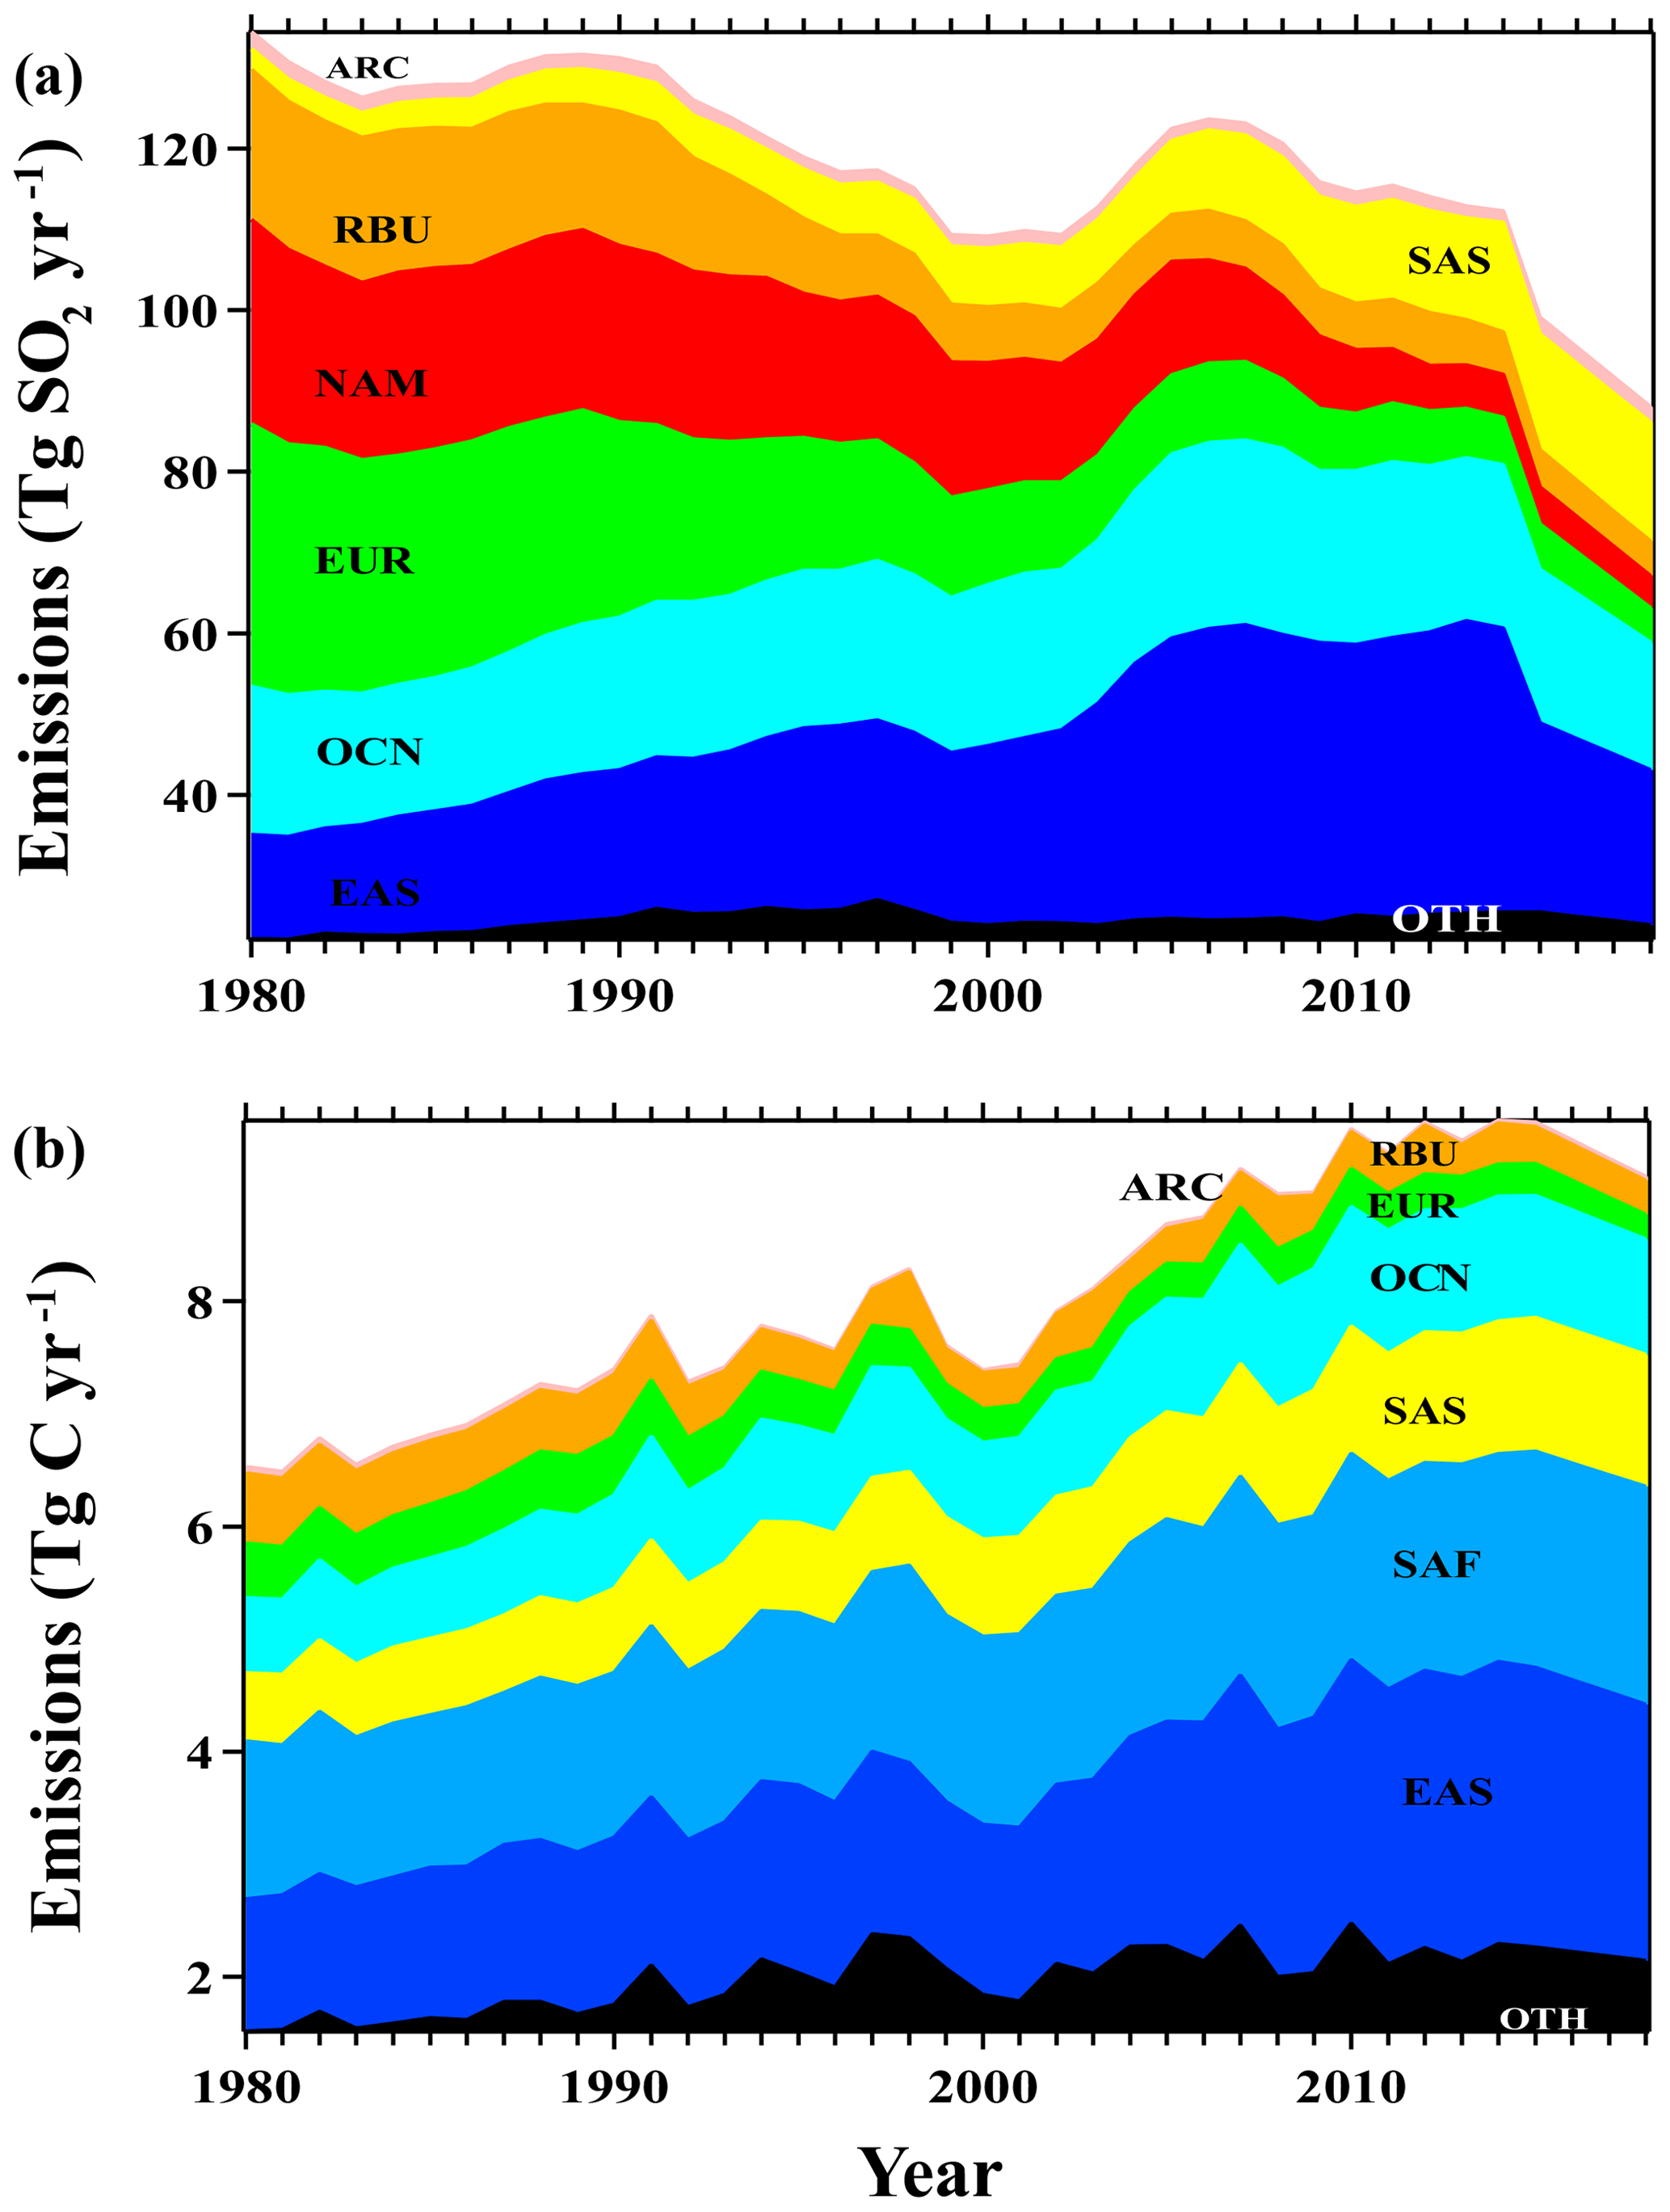
Figure 2Time series of global total anthropogenic emissions of (a) SO2 (Tg SO2 yr−1) and (b) BC (Tg C yr−1), classified by key anthropogenic source regions. Emissions from other regions (OTH), including those of ANT, CAM, CAS, MDE, NAF, PAN, SAM, SEA and SAF/NAM, can be found in Fig. S1. Abbreviations for the regions can be found in Fig. 1.
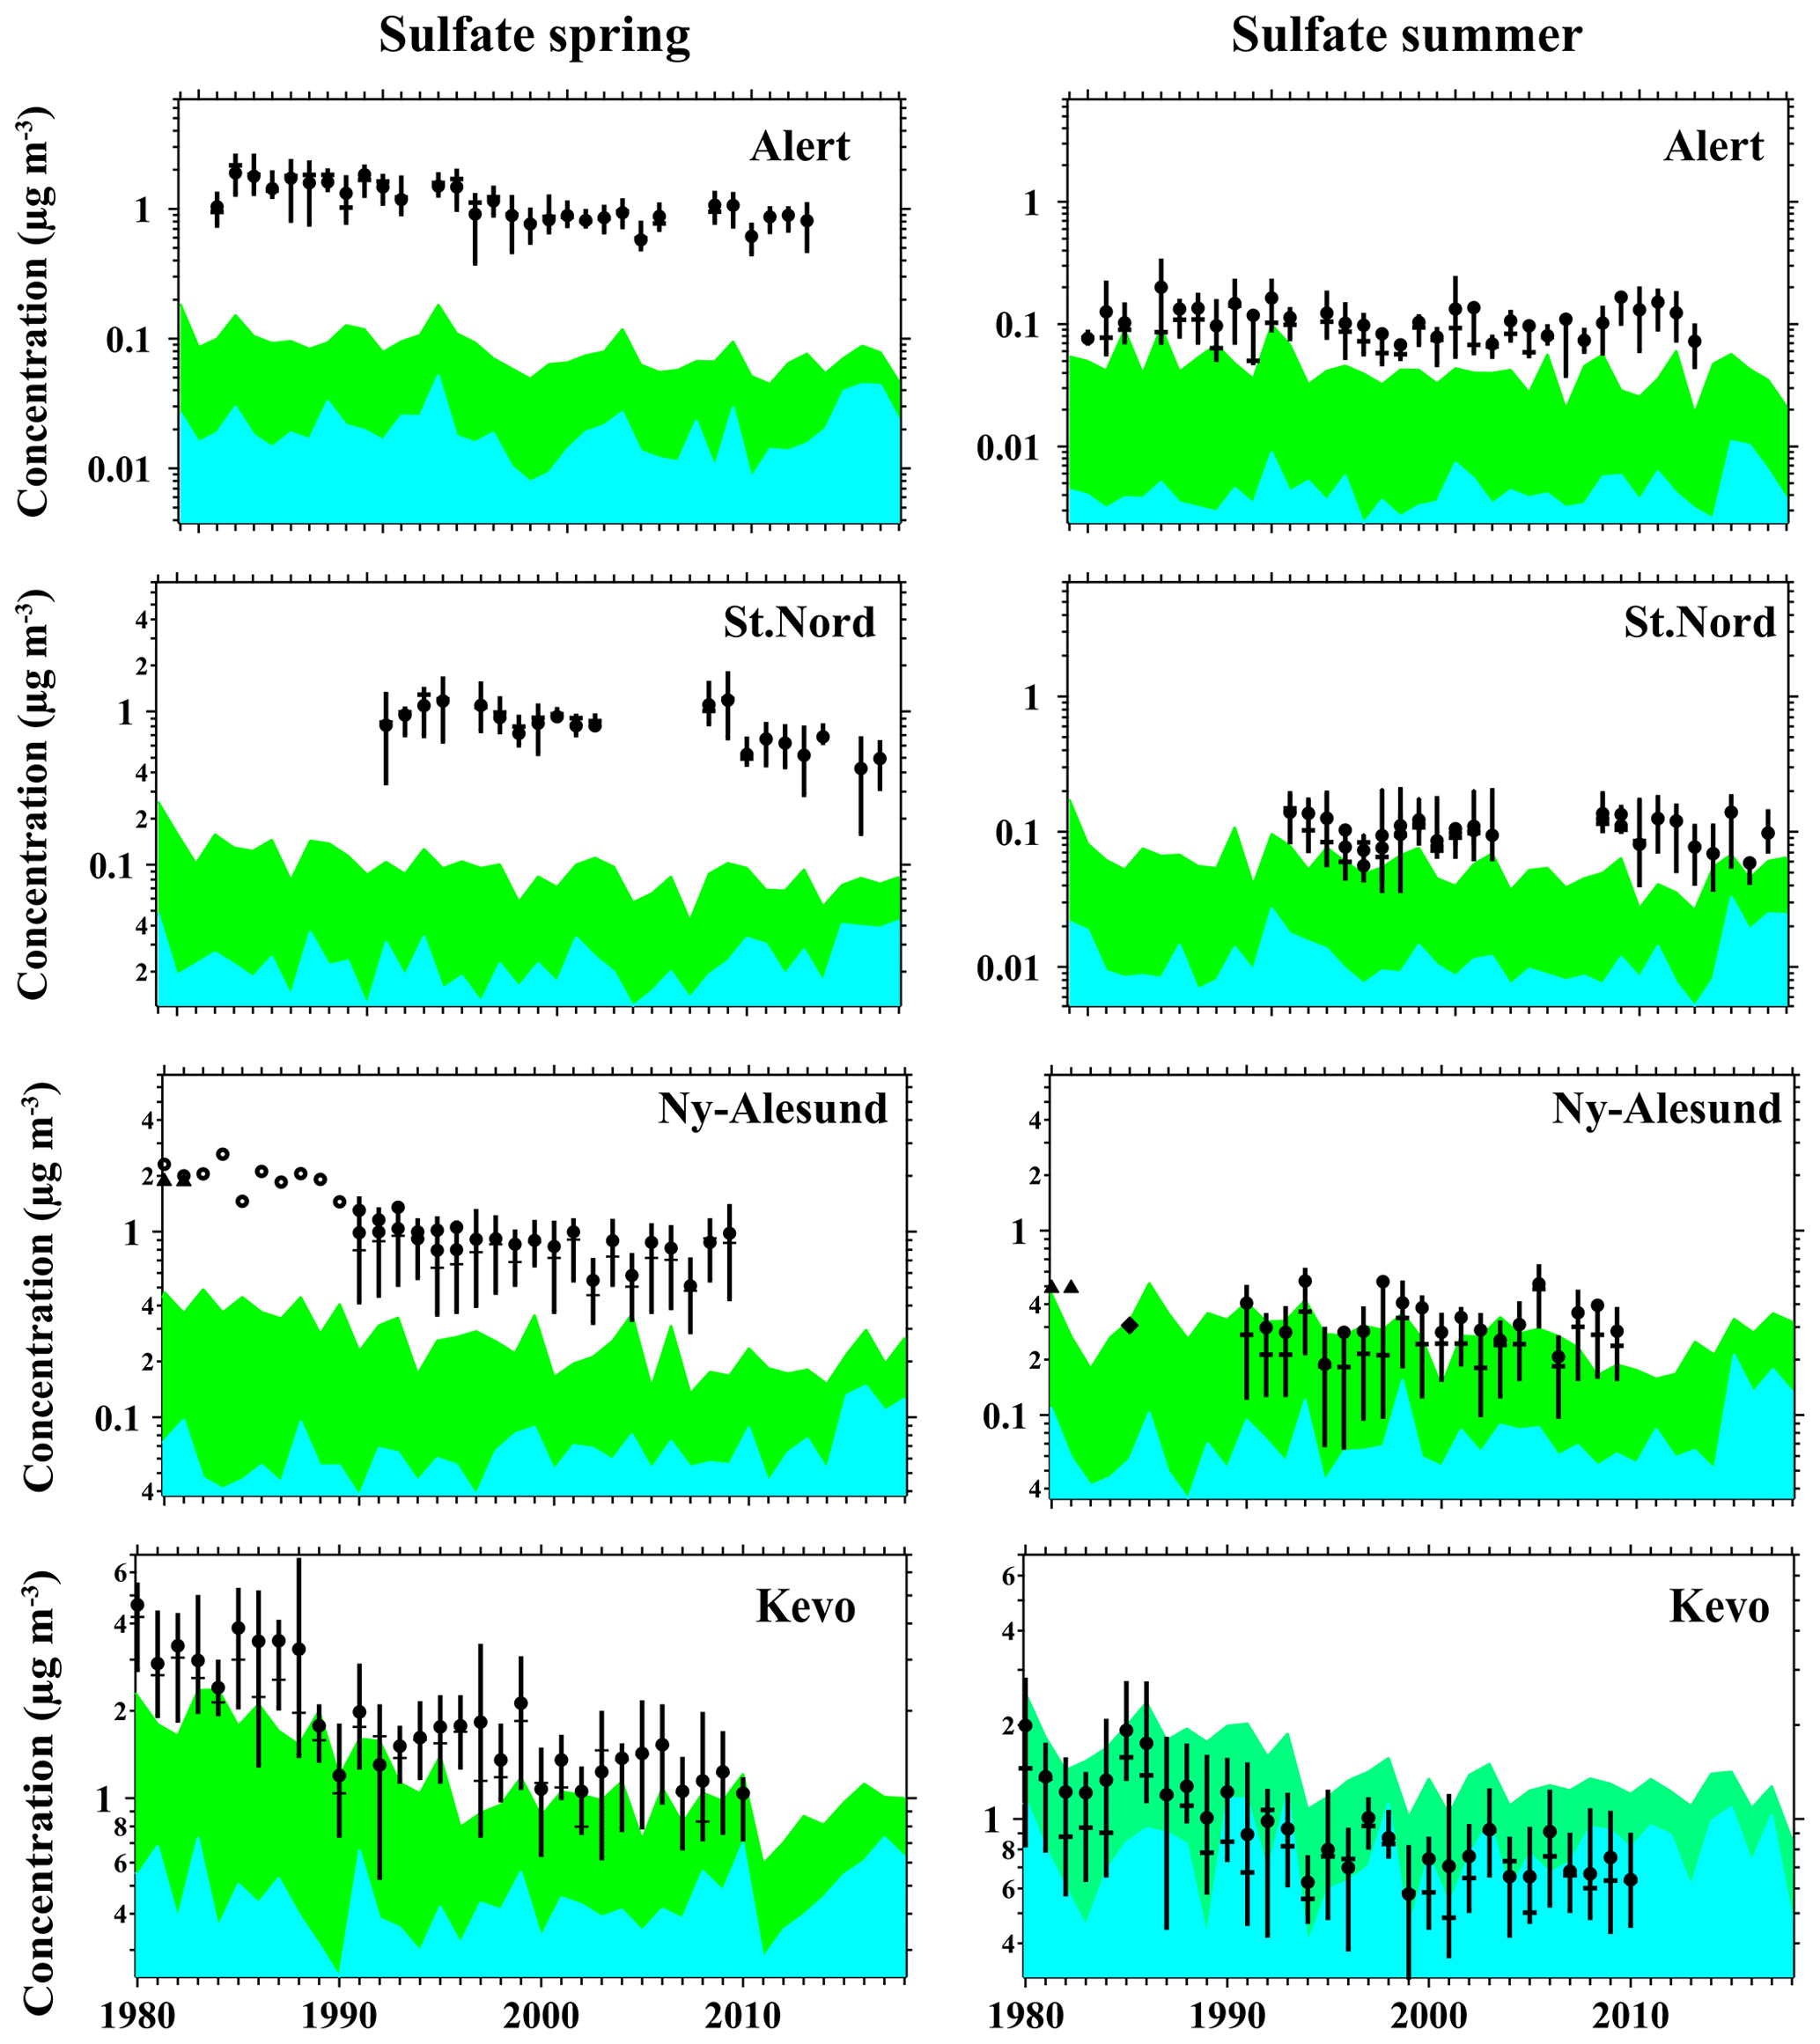
Figure 3Surface concentrations of sulfate aerosols (µg m−3) in spring (March–May) and summer (June–August) at four locations (Alert, Station Nord, Ny-Ålesund, Kevo) in the Arctic during 1980–2018. Seasonal means are denoted by solid black circles, medians as short horizontal bars, and the 25th to 75th percentile ranges as vertical bars. Stacked colors represent modeled contributions from the Arctic (blue) and non-Arctic (green) anthropogenic source region. The observations denoted by solid black circles are obtained from the European Monitoring and Evaluation Programme, World Data Centre for Aerosols database (http://ebas.nilu.no, last access: July 2020), and Breider et al. (2017). Black triangles at Ny-Ålesund for the period 1980–1981 show mean observations from Heintzenberg and Larssen (1983). The black diamond at Ny-Ålesund in summer shows the median non-sea-salt sulfate concentration from Maenhaut et al. (1989). Open circles in the spring for Ny-Ålesund are March–April mean values (Sirois and Barrie, 1999). Note that the vertical coordinates use logarithmic scales.
2.5 Model evaluation
To assess the ability of the model to simulate Arctic sulfate and BC, Figs. 3 and 4 compare simulated near-surface concentrations of sulfate and BC, respectively, in spring and summer during 1980–2018 with observations at five Arctic stations: Alert (82∘ N, 62∘ W), Station Nord (81∘ N, 16∘ W), Barrow (71∘ N, 156∘ W), Ny-Ålesund (78∘ N, 11∘ E) and Kevo (69∘ N, 27∘ E). The observations are derived from the European Monitoring and Evaluation Programme, the World Data Centre for Aerosols database (http://ebas.nilu.no, last access: July 2020), and Breider et al. (2017).
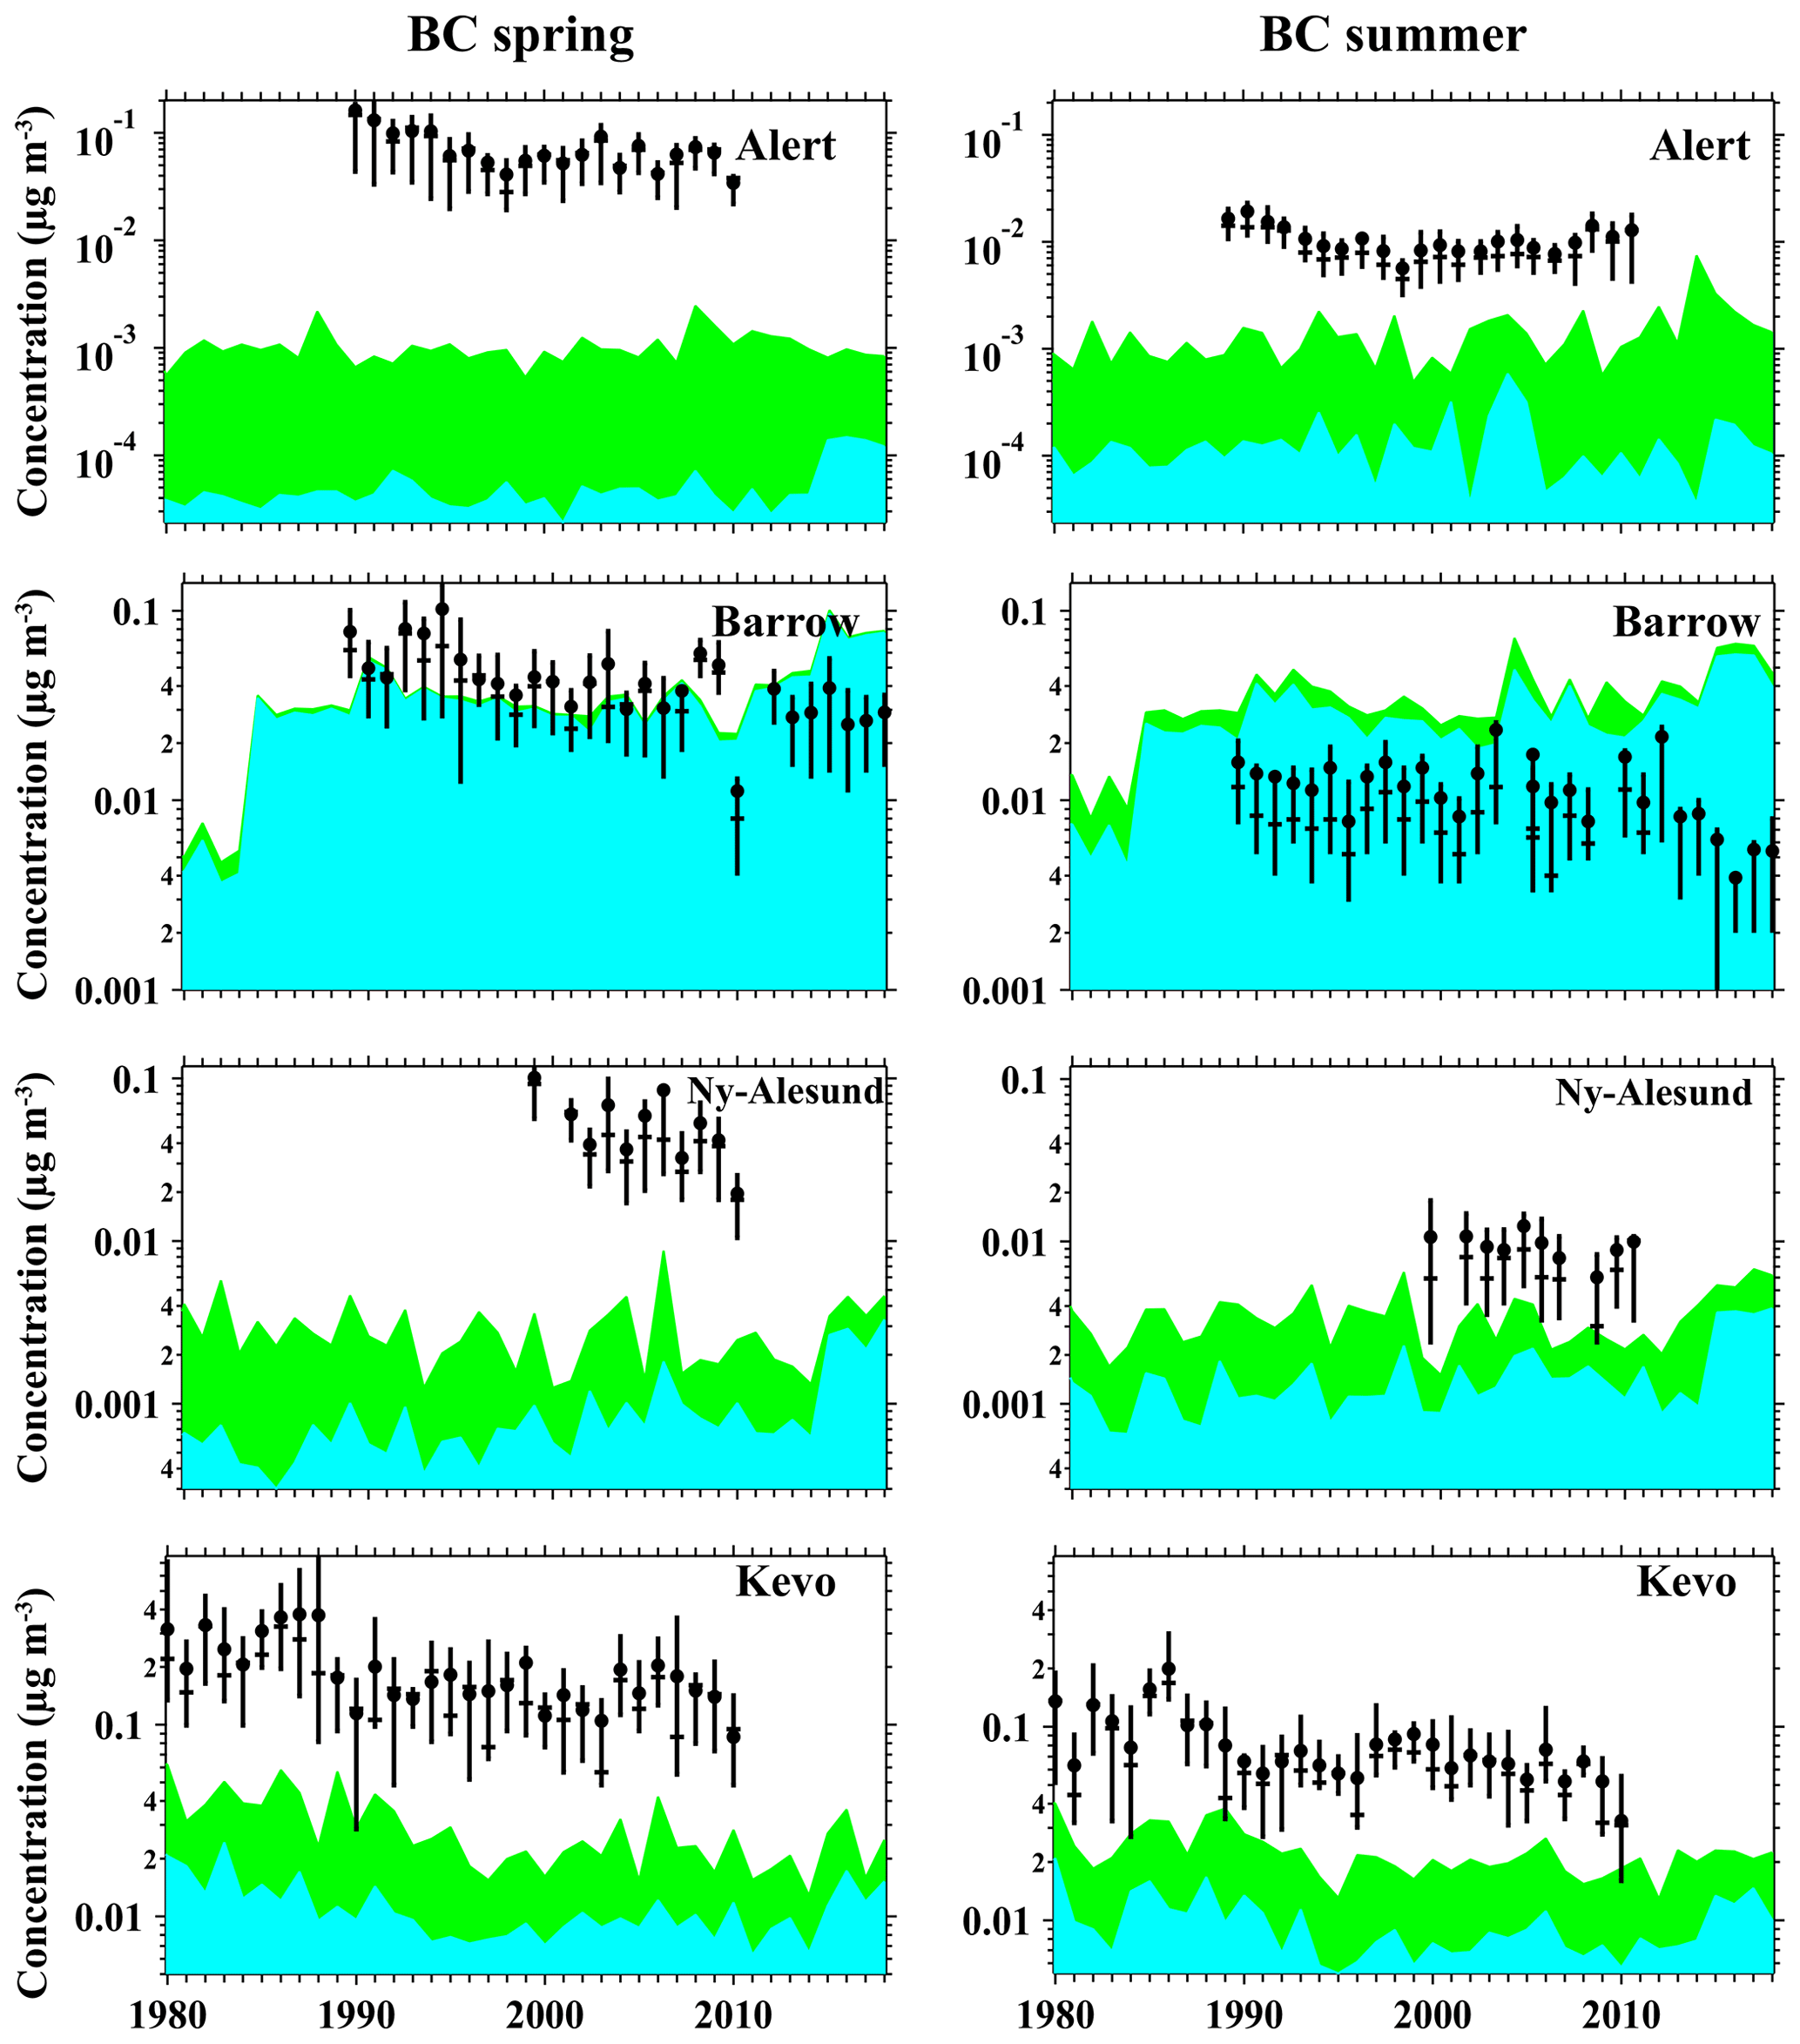
Figure 4Same as Fig. 3 but for surface BC (µg m−3) at four (Alert, Barrow, Ny-Ålesund, Kevo) Arctic sites.
Overall, the sulfate and BC concentrations in spring are higher than those in summer mainly due to a lower removal rate and more efficient transport (Stohl, 2006). According to previous CAM5 studies on aerosol wet removal and long-range transport, the model underestimates aerosol concentrations in spring likely due to biases in parameterizations of convective transport and the wet scavenging of aerosols (Bond et al., 2013; Liu et al., 2011; Wang et al., 2013; Qian et al., 2014; Yang et al., 2018a). All sites show that sulfate concentrations decreased during the analyzed time period, and BC decreased at specific sites, which can be explained by the reduction of non-local emissions as illustrated by the source attribution. Compared to the observed values, the model can reasonably simulate the time variations of sulfate and BC in the Arctic, but the magnitude at some of the sites is largely underestimated. The Kevo site (69∘ N, 27∘ E), which is close to western Eurasia, is the only site that has both sulfate and BC data for more than 30 years. At this site, the simulated sulfate in spring and summer decreased at a rate of 3.18 % and 1.92 % per year, respectively, which are similar values to 4.37 % and 3.26 % per year from observations. The decreasing rates of BC in spring and summer were 2.89 % and 1.74 %, respectively, which are also consistent with the observed values of 3.01 % and 2.82 %.
Observational data are very limited in the Arctic especially the long-term observations. The available BC measurements are equivalent black carbon (EBC), which is usually obtained by converting the light absorbed by the particles accumulated on the ground instrument filter into the BC concentration. The uncertainty in optical properties of BC makes this conversion challenging. Other light absorbing substances, such as dust and organic carbon, also affect the BC measurements, so EBC would tend to be higher than the actual BC concentration. Researchers found that BC observations could be biased by 30 % to 200 % (Sharma et al., 2017; Sinha et al., 2017) due to the inclusion of other light absorption components in the atmosphere. Shindell et al. (2008) and Koch et al. (2009) found great differences between the current models and observations of Arctic BC and sulfate through multi-model comparison studies, including incorrect seasonality and order of magnitude biases. Given the large apparent discrepancies in BC for all models, it is difficult to determine the relative authenticity of the models using currently available data (Shindell et al., 2008).
The near-surface concentrations of sulfate and BC over the Arctic can be quantitatively attributed to both local Arctic emissions and remote sources outside the Arctic through the source tagging in CAM5-EAST. The absolute and relative source contributions of emissions from the major source regions to the simulated annual mean near-surface sulfate and BC concentrations averaged over the Arctic (66.5–90∘ N) are shown in Figs. 5 and S2. Local arctic emissions and sources near the Arctic (e.g., Europe and Russia) are the main contributors to the near-surface concentrations of Arctic sulfate and BC. Relative to the average of 0.447 µg m−3 during 1980–1984, the simulated annual sulfate concentration over the Arctic shows a decrease of 42.8 % (0.191 µg m−3) in 2014–2018 (Table 1). The sulfate concentration shows a considerable decreasing trend from 1980 to 2000, which then slows down after 2000. The decrease in sulfate during this time period primarily results from the reduction in emissions from Europe and Russia, which contribute to 18.6 % (0.083 µg m−3) and 18.8 % (0.084 µg m−3) of the decline of the Arctic sulfate concentrations, respectively. The change in emissions from Central Asia and North America explains 1.6 % (0.007 µg m−3) and 3.4 % (0.015 µg m−3) of the reduced concentration, respectively.
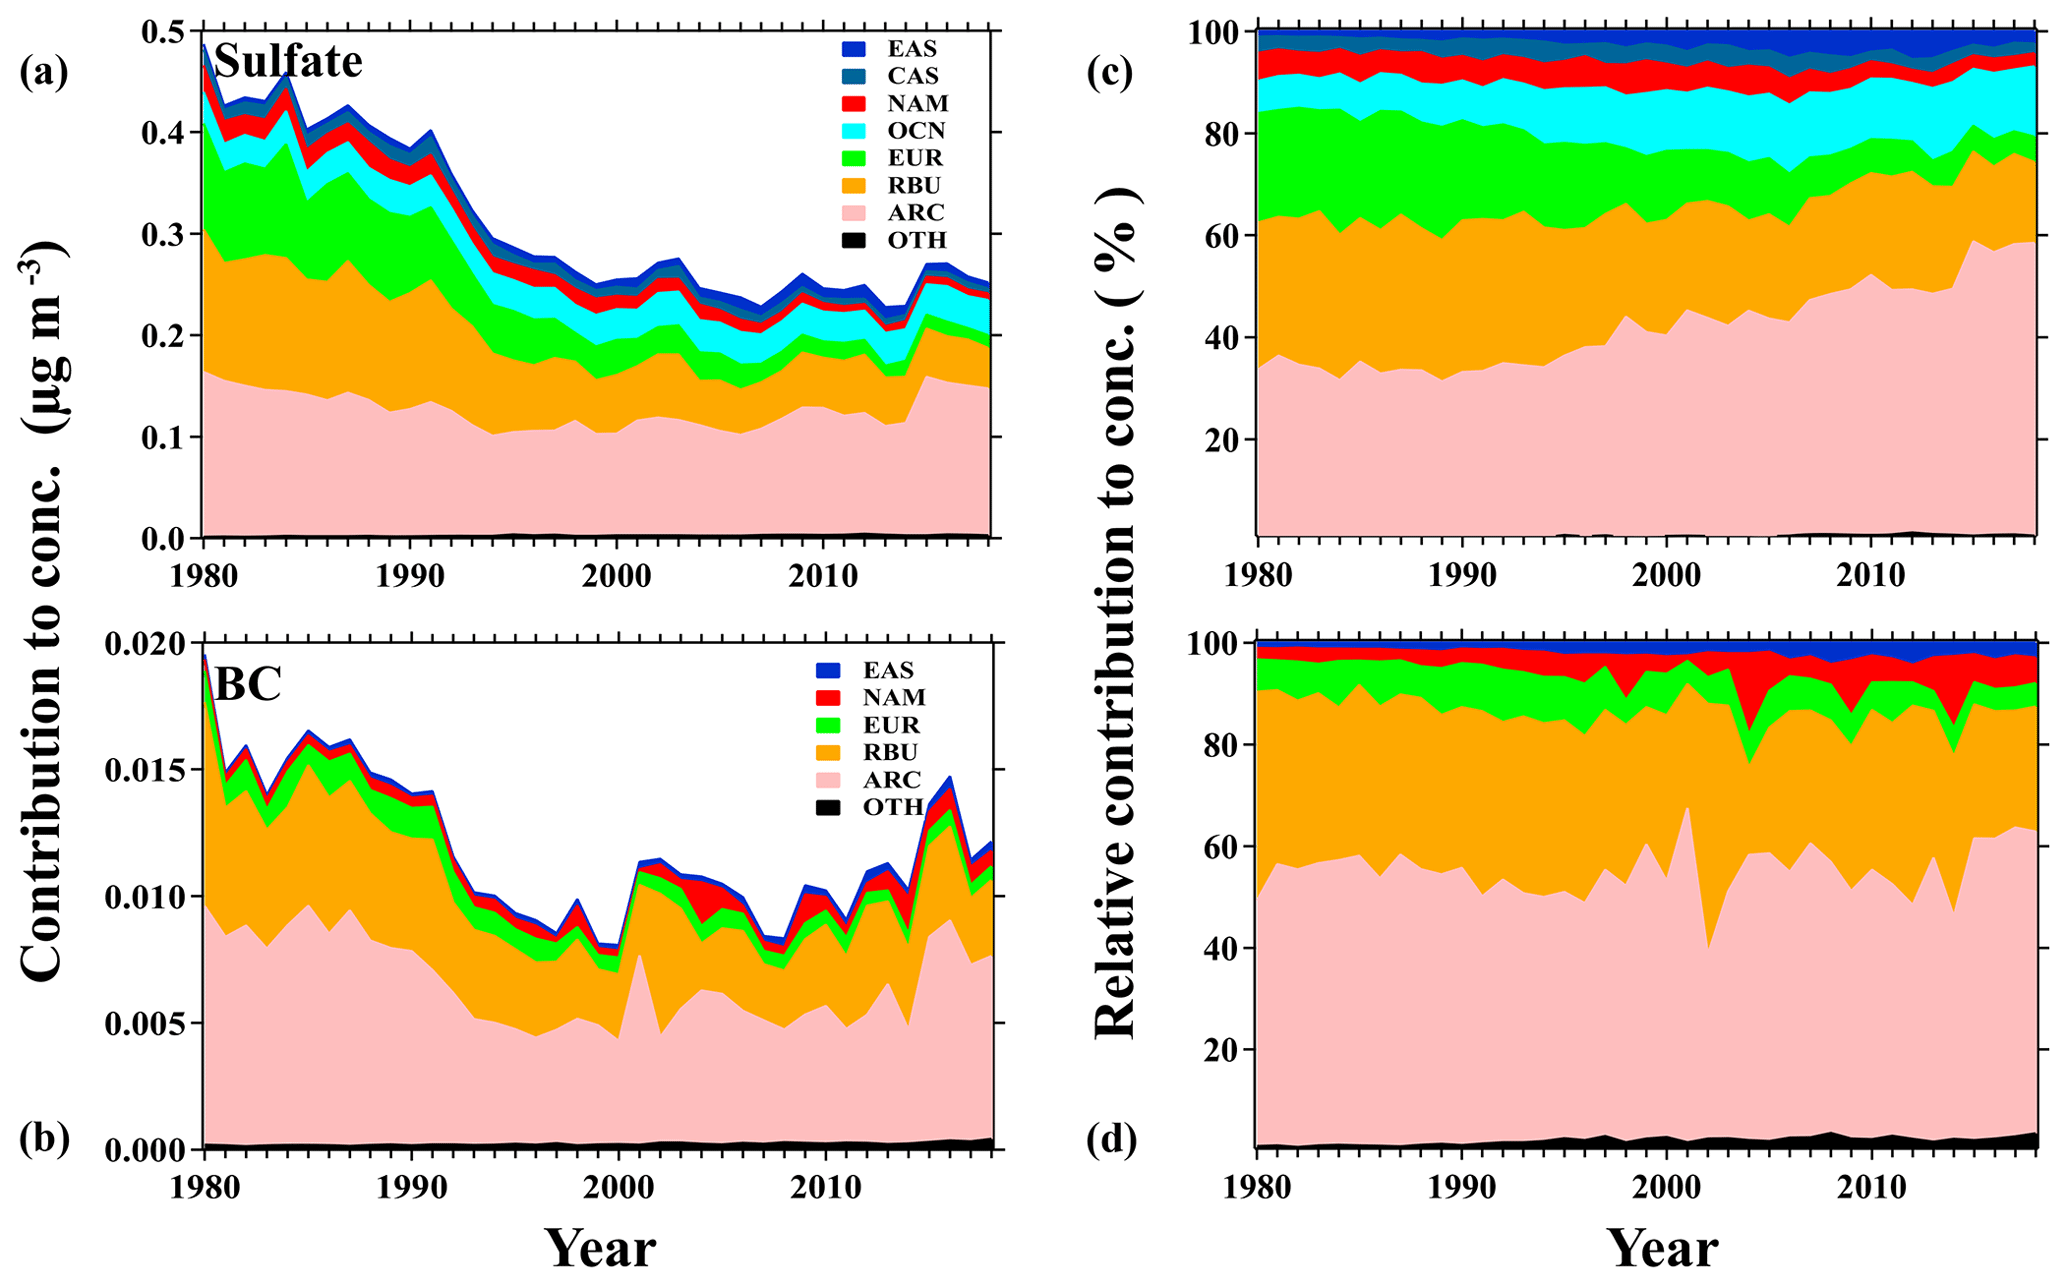
Figure 5Time series (1980–2018) of absolute (a, b; µg m−3) and relative (c, d; %) contributions of emissions from the major source regions to the simulated annual mean near-surface sulfate and BC concentrations averaged over the Arctic (66.5–90∘ N). The remaining source regions with annual contributions less than 3 % are combined and shown as OTH (other regions in Fig. S2).
Table 1Contributions of emissions from major source regions to the simulated annual mean near-surface sulfate and BC concentrations (µg m−3) averaged over the Arctic in 1980–1984 and 2014–2018, as well as the percentage differences (%) between 1980 and 1984 and 2014 and 2018 relative to 1980–1984.
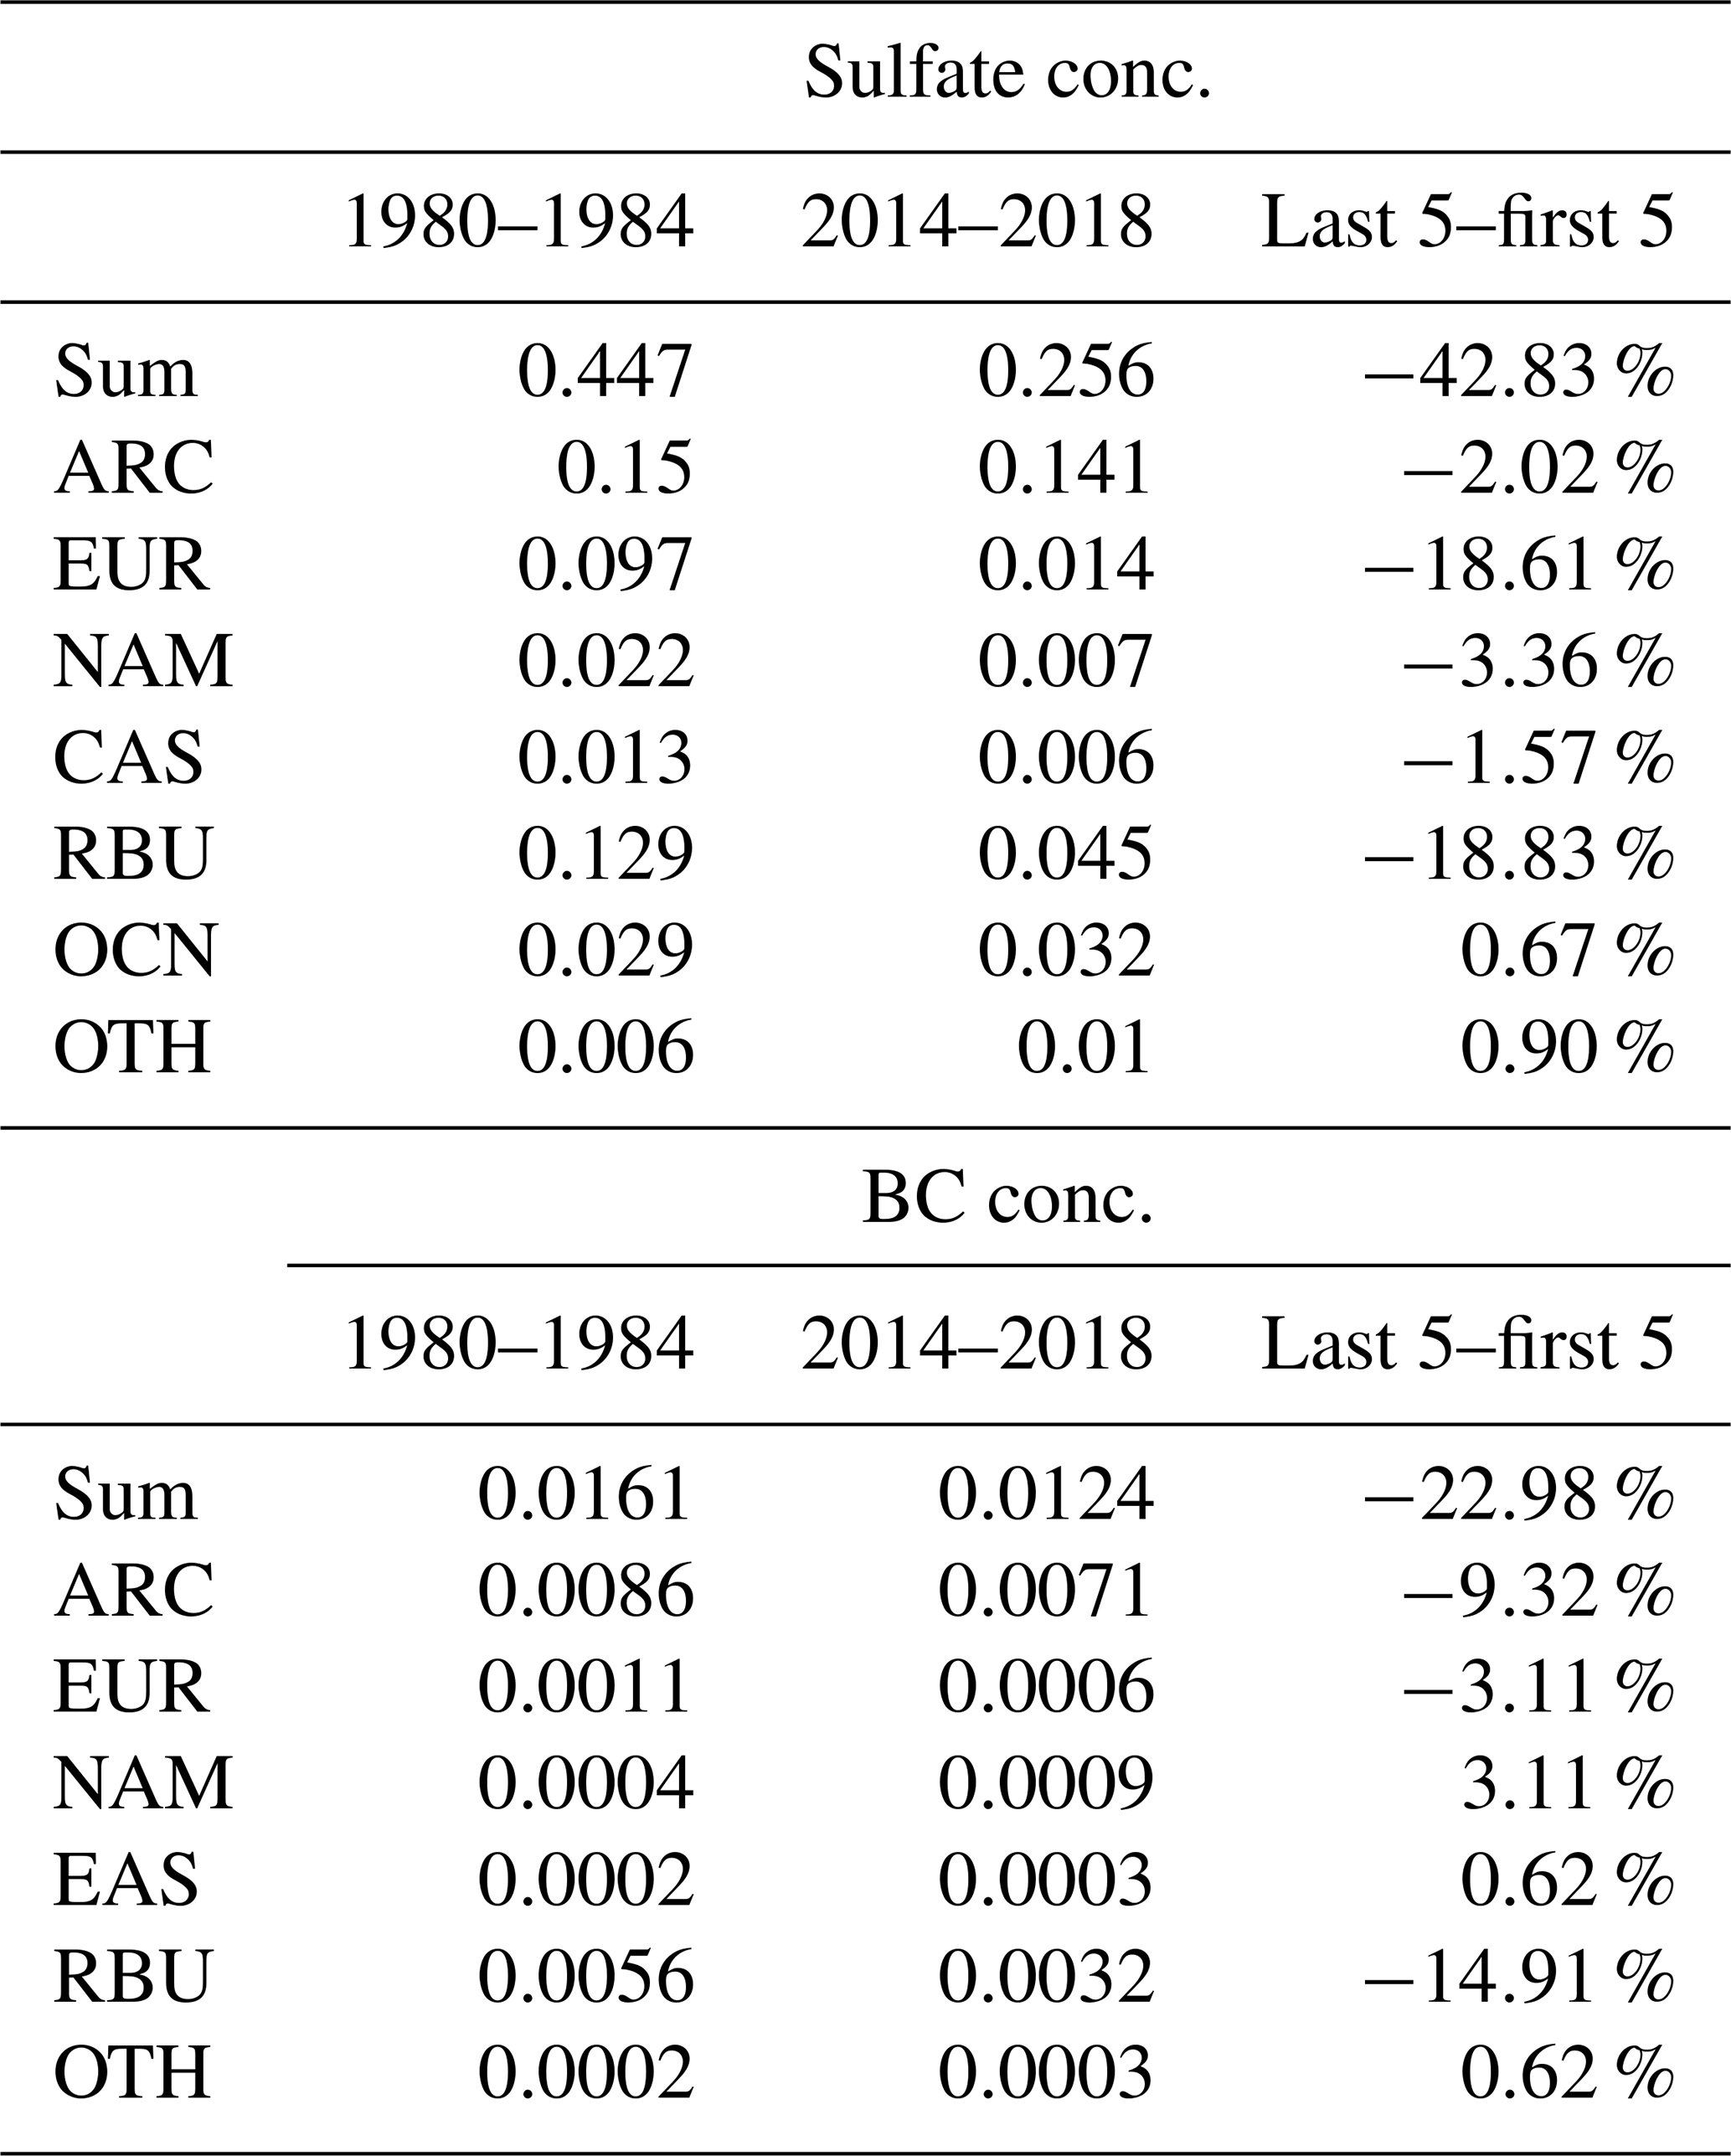
Simulated Arctic BC concentration also shows a considerable decline before 2000 but a slight rise after 2000, which is consistent with the BC observations at Alert. Overall, the average concentration of BC in the Arctic shows a decrease of 22.98 % (3.7 ng m−3 relative to the 1980–1984 average of 16.1 ng m−3) in 2014–2018 mainly due to the reductions in emissions originating from the Arctic and Russia, which make up 9.32 % (1.5 ng m−3) and 14.91 % (2.4 ng m−3) of the decrease (Table 1). Sources in Europe, North America and East Asia account for less than 4 % of the changes in Arctic near-surface BC concentration. The remaining source regions (Central America, South America, northern Africa, southern Africa, the Middle East, Southeast Asia, Central Asia, South Asia, Pacific–Australia–New Zealand, Antarctic, and non-Arctic and non-Antarctic oceans) have no substantial impact on the BC concentration in the Arctic (total contribution less than 2 %) due to the weak emission strength or long transport pathways. Since the Arctic sulfate and BC aerosol concentrations contributed by non-local sources have been reducing, the fractional contribution of local Arctic sources increased from 33.6 % and 53.4 % to 55.1 % and 57.3 %, respectively. To further reduce present-day or future aerosols in the Arctic, efforts can be made to control local sources in the Arctic, as well as emissions from Russia. The industry and energy sectors account for the majority of local sources in the Arctic (Fig. S4). Reducing the emissions of industry and energy sectors may be effective at reducing local sulfate and BC concentrations in the Arctic.
Aerosols are often transported across continents in the free troposphere rather than near the surface, resulting in a higher relative contribution of non-local sources to the aerosol concentration at higher altitudes than near the surface. Figure 6 shows the vertical profiles of absolute and relative contributions of major source regions to sulfate and BC concentrations in the Arctic. Different source regions have very distinct vertical distributions of their contributions. Below 1 km, local Arctic emissions account for the majority of Arctic sulfate and BC concentrations. For BC and sulfate located between 1 and 5 km, emissions from Russia are the major source. Above 8 km, East Asia and South Asia are the major source regions of the Arctic aerosol concentrations, which is consistent with results using other models (e.g., Shindell et al., 2008). The Arctic and Russia have their maximum absolute contributions at 0.2 and 1.4 km, respectively. Europe and North America have their maximum absolute contributions around 2 km. The contributions of East Asia and South Asia increase at higher altitudes, reaching their maximum contribution values at 8 and 11 km, respectively. Previous studies also pointed out that, in April 2008, BC showed a high concentration in the mid-troposphere of the Arctic mainly due to the effect of Asian anthropogenic aerosols that are transported to the Arctic through a warm conveyor belt (Wang et al., 2011). Evidence from aircraft and ground-based measurements showed that eastern and southern Asian source regions contributed the most to the BC concentration in the Arctic mid-troposphere, while northern Asia dominated the contribution to the Arctic surface BC (Abbatt et al., 2019).
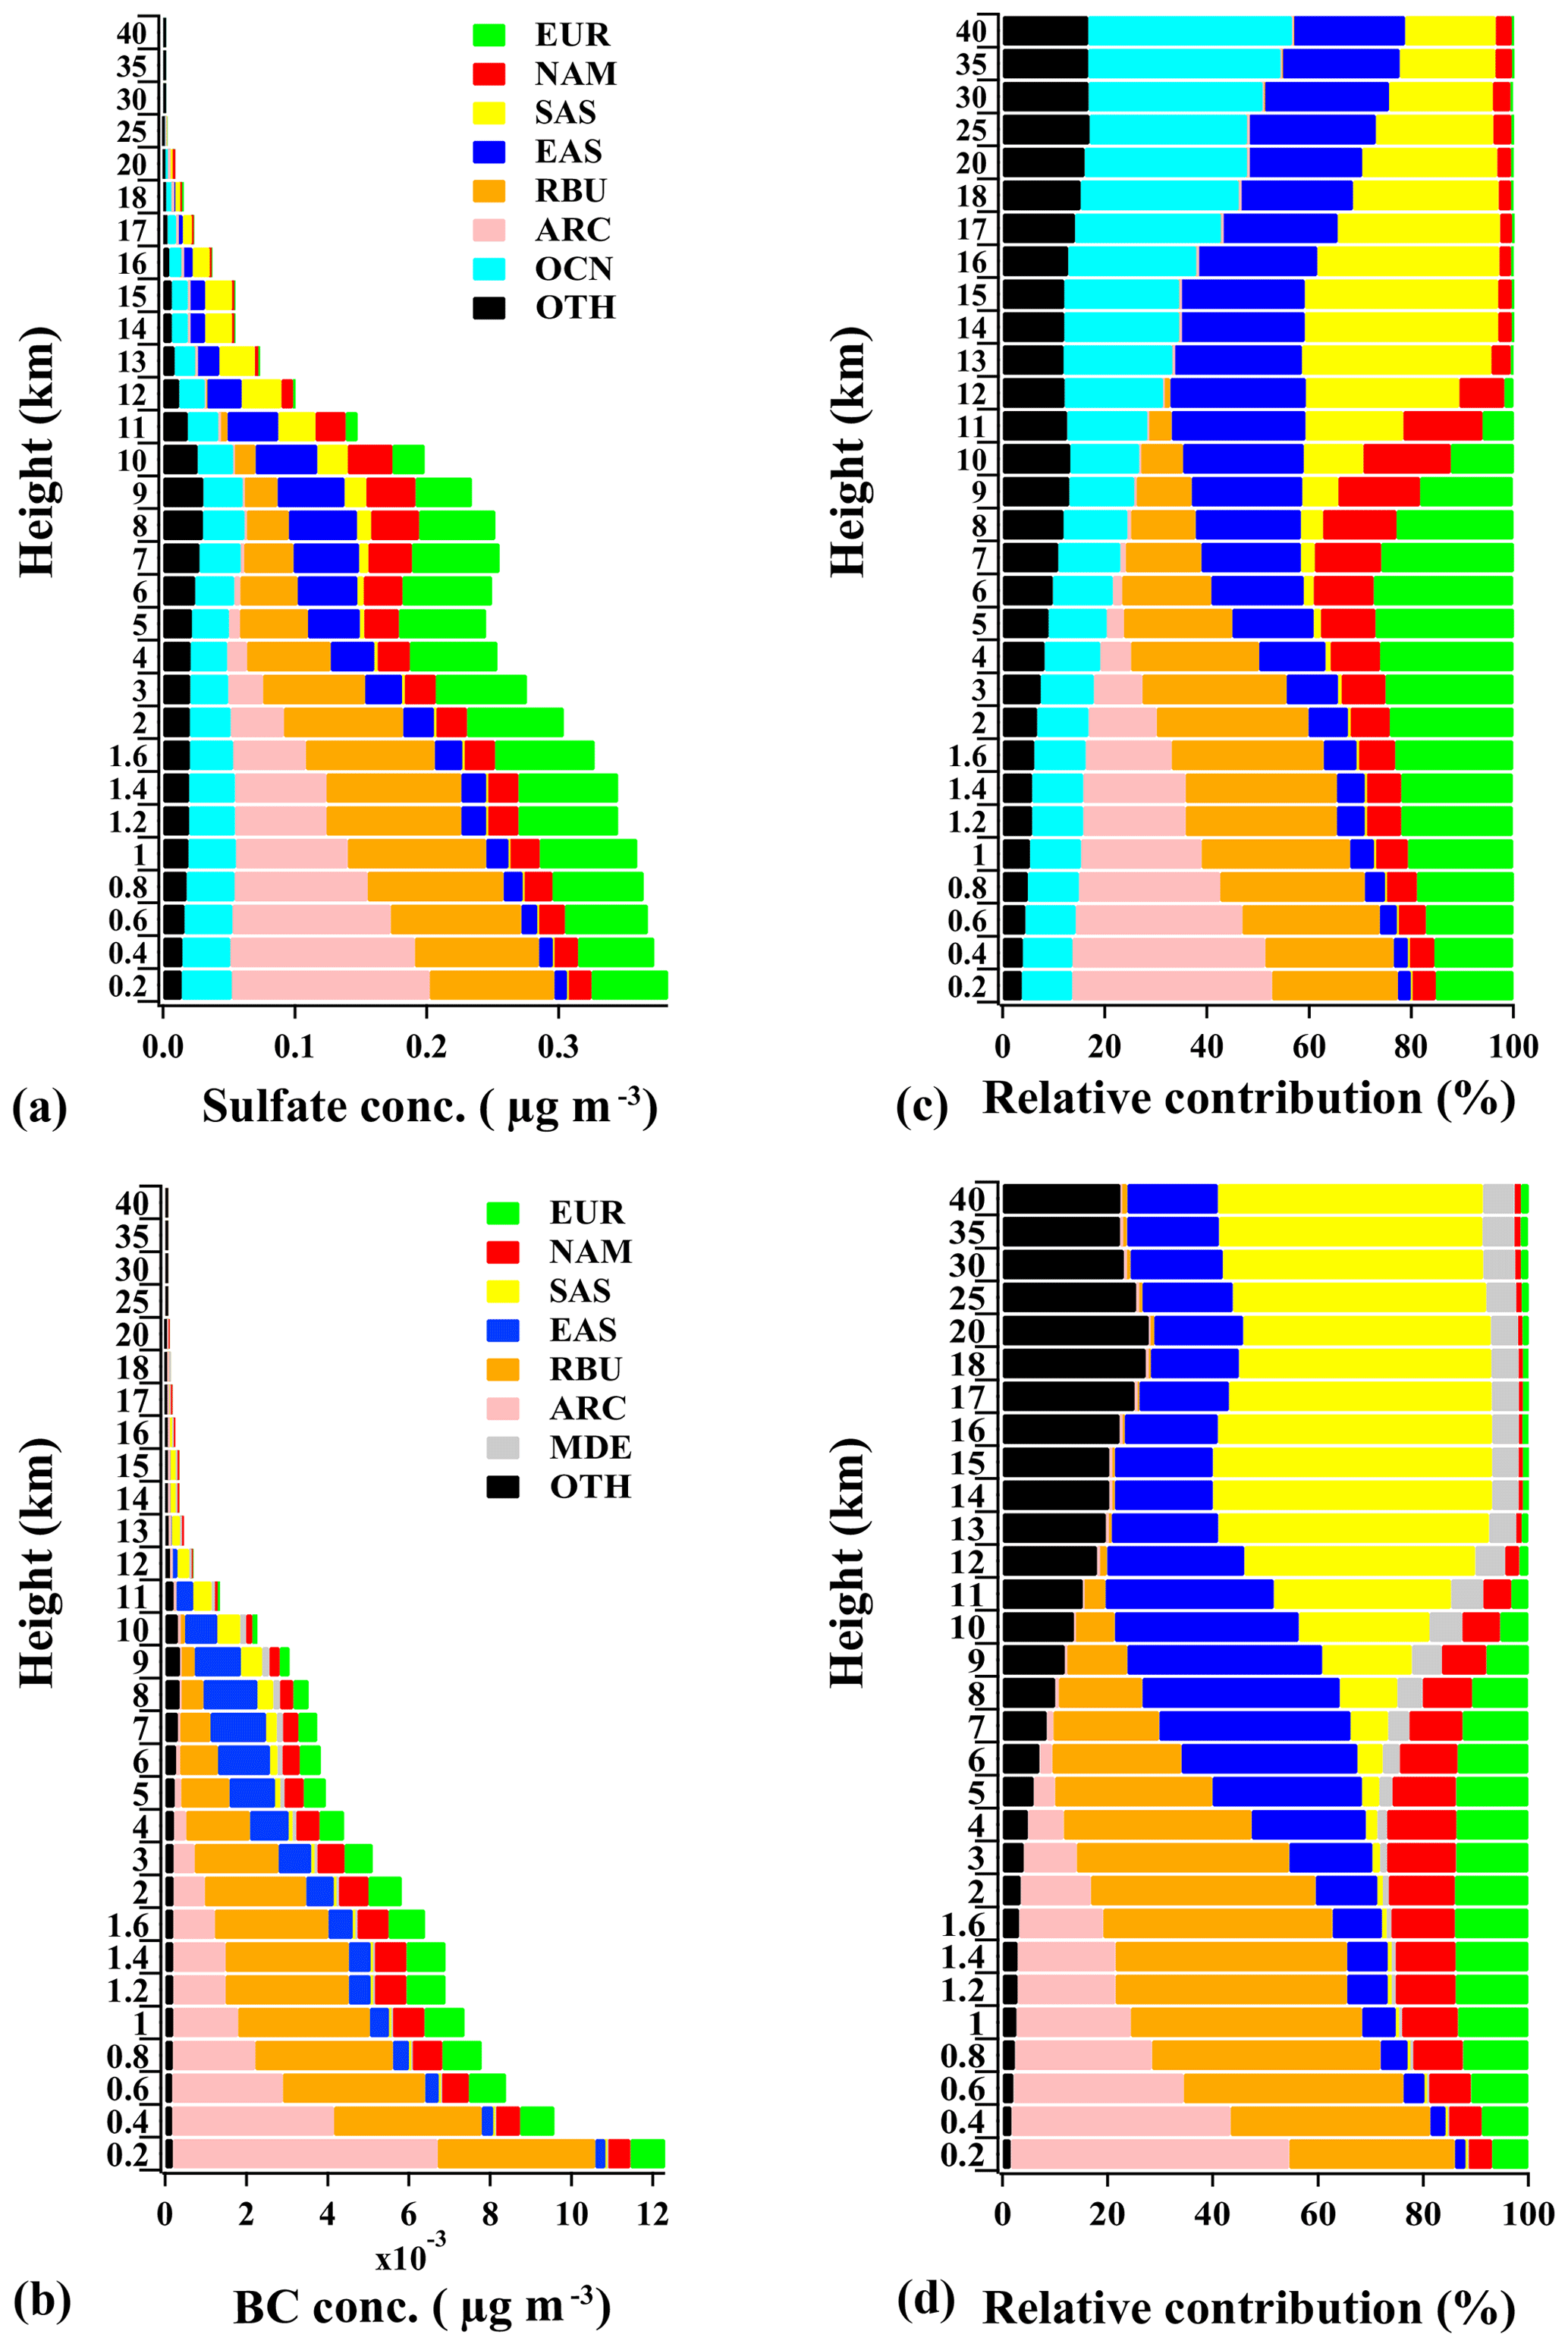
Figure 6Annual mean vertical profile of sulfate (a, c) and BC (b, d) concentrations (µg m−3) over the Arctic contributed by the tagged source regions (a, b) and their relative contributions (c, d; %) during 1980–2018. Sources with annual burden contributions less than 5 % are combined and shown as OTH.
The changes in source contributions to the annual mean vertical profile of sulfate and BC concentrations over the Arctic between 2014 and 2018 and 1980 and 1984 are shown in Fig. 7. Below 6 km, due to the effective emission reduction, the contribution from both Europe and Russia to the Arctic sulfate was decreased by nearly 0.1 µg m−3 in 2014–2018 compared to 1980–1984. The North American contribution also had a slight decline below 2 km. Between 10 and 15 km, contributions from South Asia and East Asia increased at the upper troposphere, which is consistent with the increase in emissions over these regions, leading to a combined increase in sulfate concentration of up to 0.1 µg m−3 at the upper troposphere of the Arctic. The BC concentration below 2 km contributed by Arctic and Russia emissions each had a decrease of up to 2 ng m−3, which dominated the decrease in BC concentration in the Arctic's lower atmosphere. Similar to sulfate, BC concentrations contributed by East Asia and South Asia increased in the high altitudes (Breider et al., 2017, Fisher et al., 2011; Qi et al., 2017; Sharma et al., 2013; Stohl, 2006) mainly due to increased emissions in these two regions which offset the decrease in column burden owing to the reduced loading in the lower atmosphere. Similar to our findings, Breider et al. (2017) found that the simulated decrease in aerosol optical depth in the Arctic from 1980 to 2010 was driven by a strong decrease in aerosol loading at lower altitudes due to the emission changes in western Eurasia, Russia and North America and an increase in aerosols at higher altitudes resulting from the changes in emissions in regions such as South Asia and East Asia.
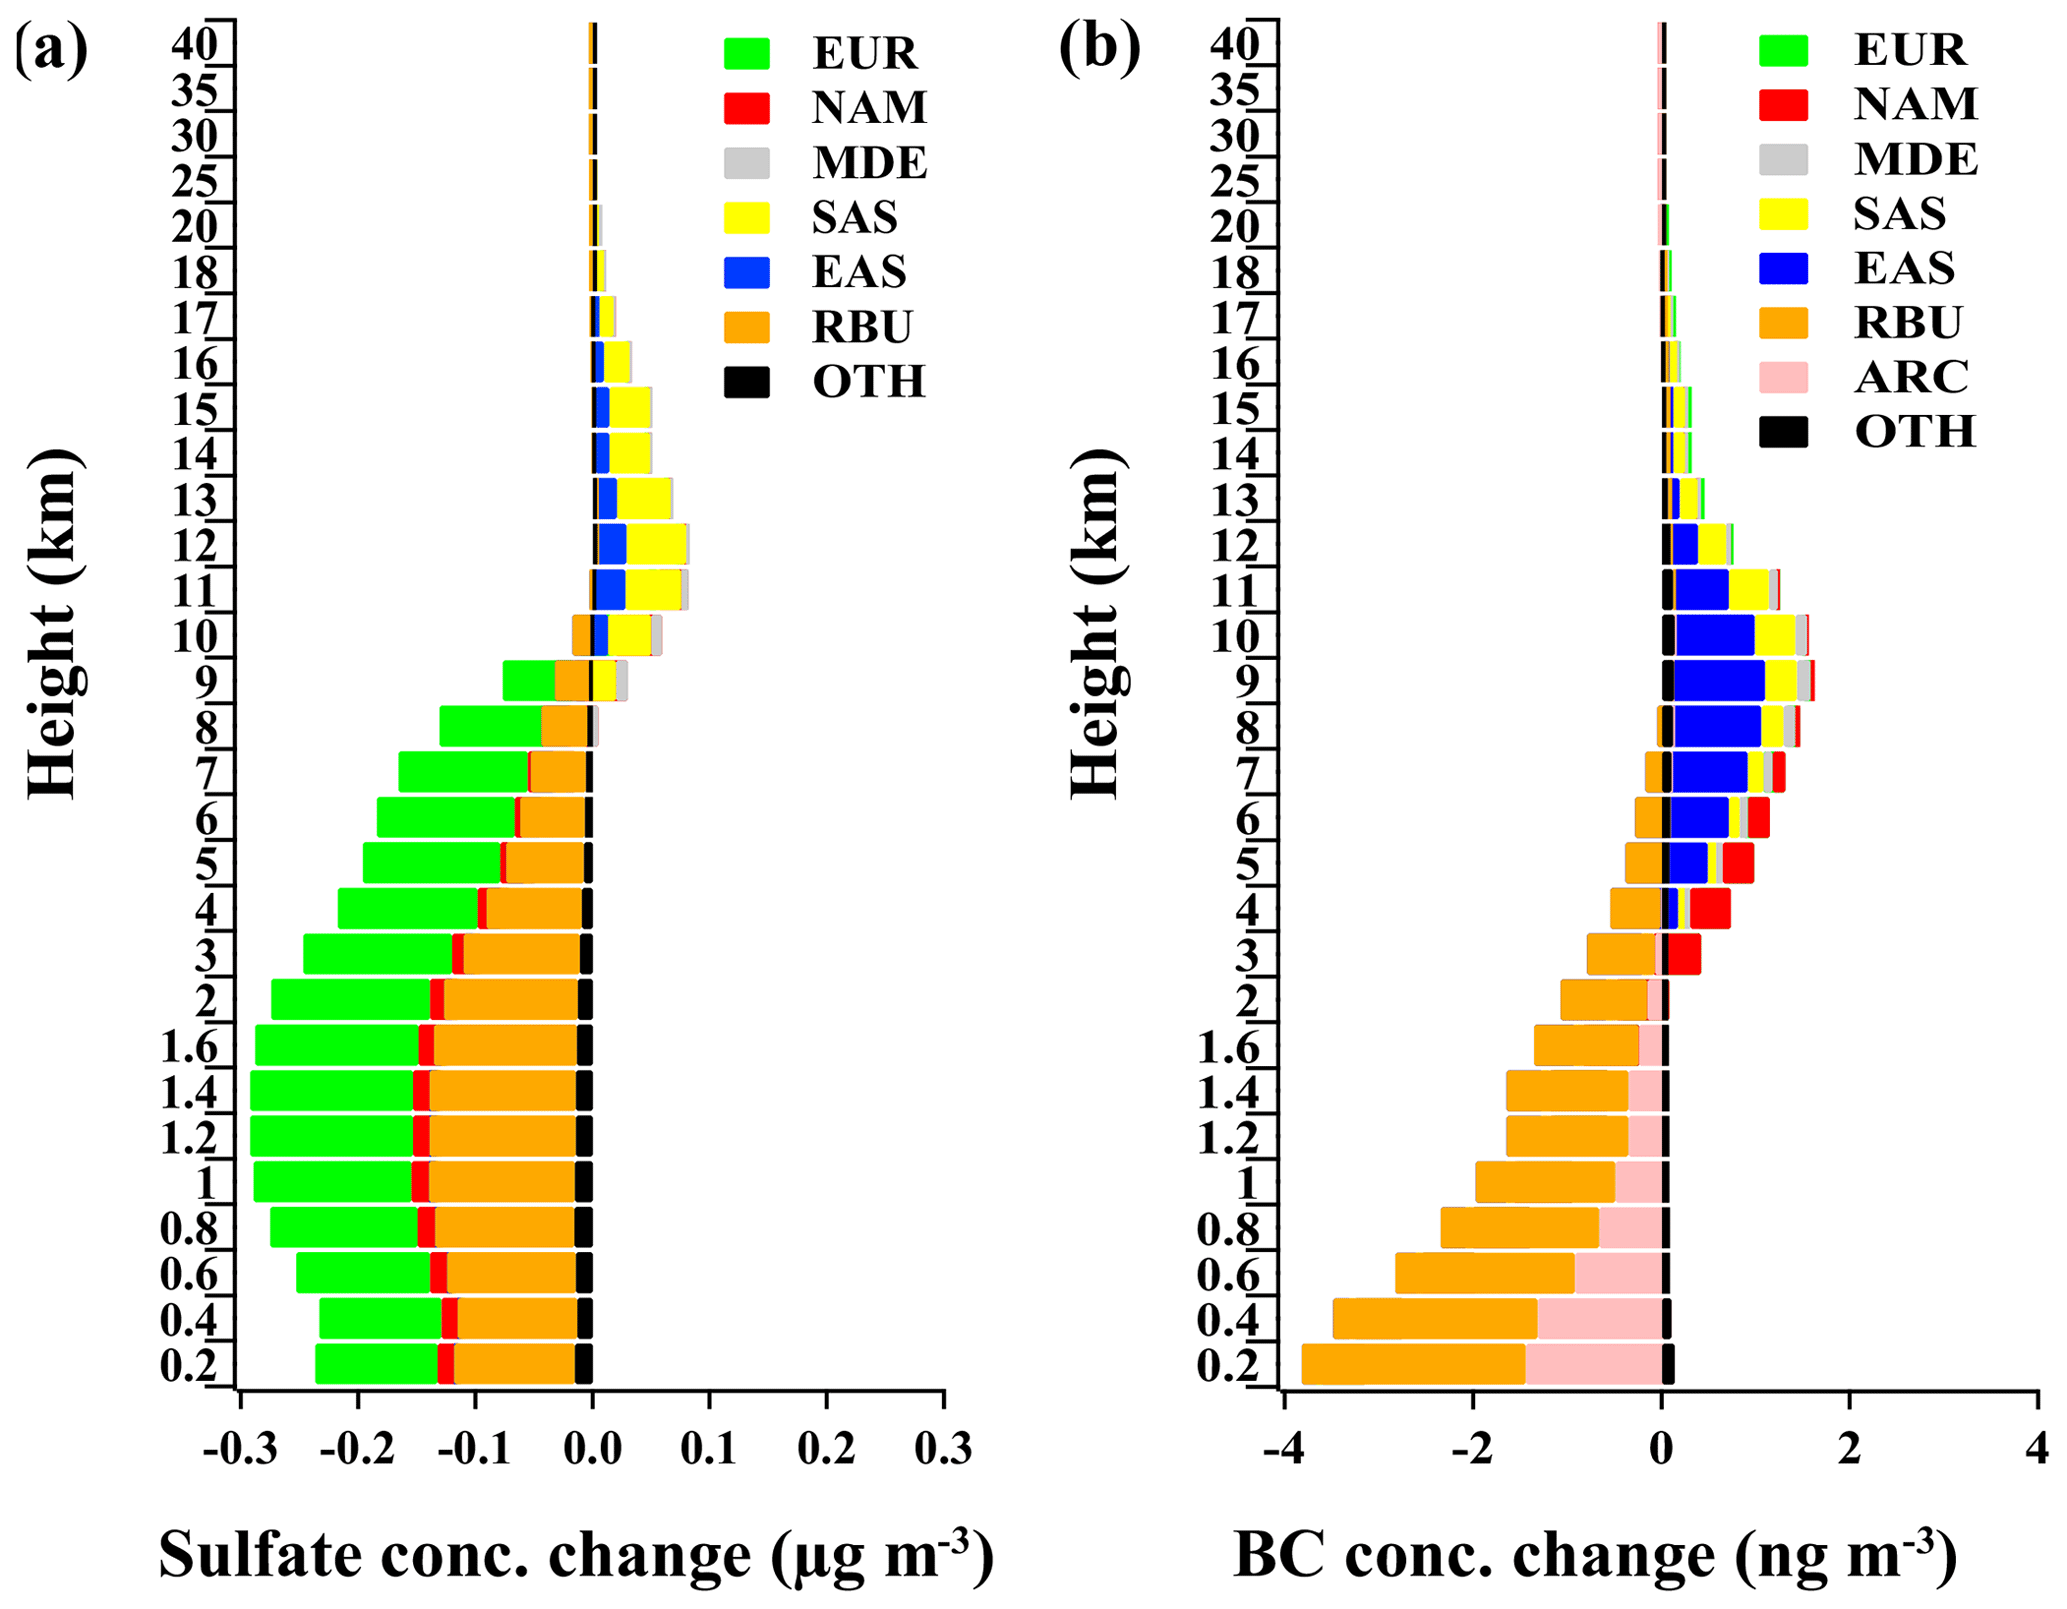
Figure 7Changes in annual mean vertical profile of sulfate (a; µg m−3) and BC (b; ng m−3) concentrations over the Arctic contributed by the tagged source regions between 1980 and 1984 and 2014 and 2018.
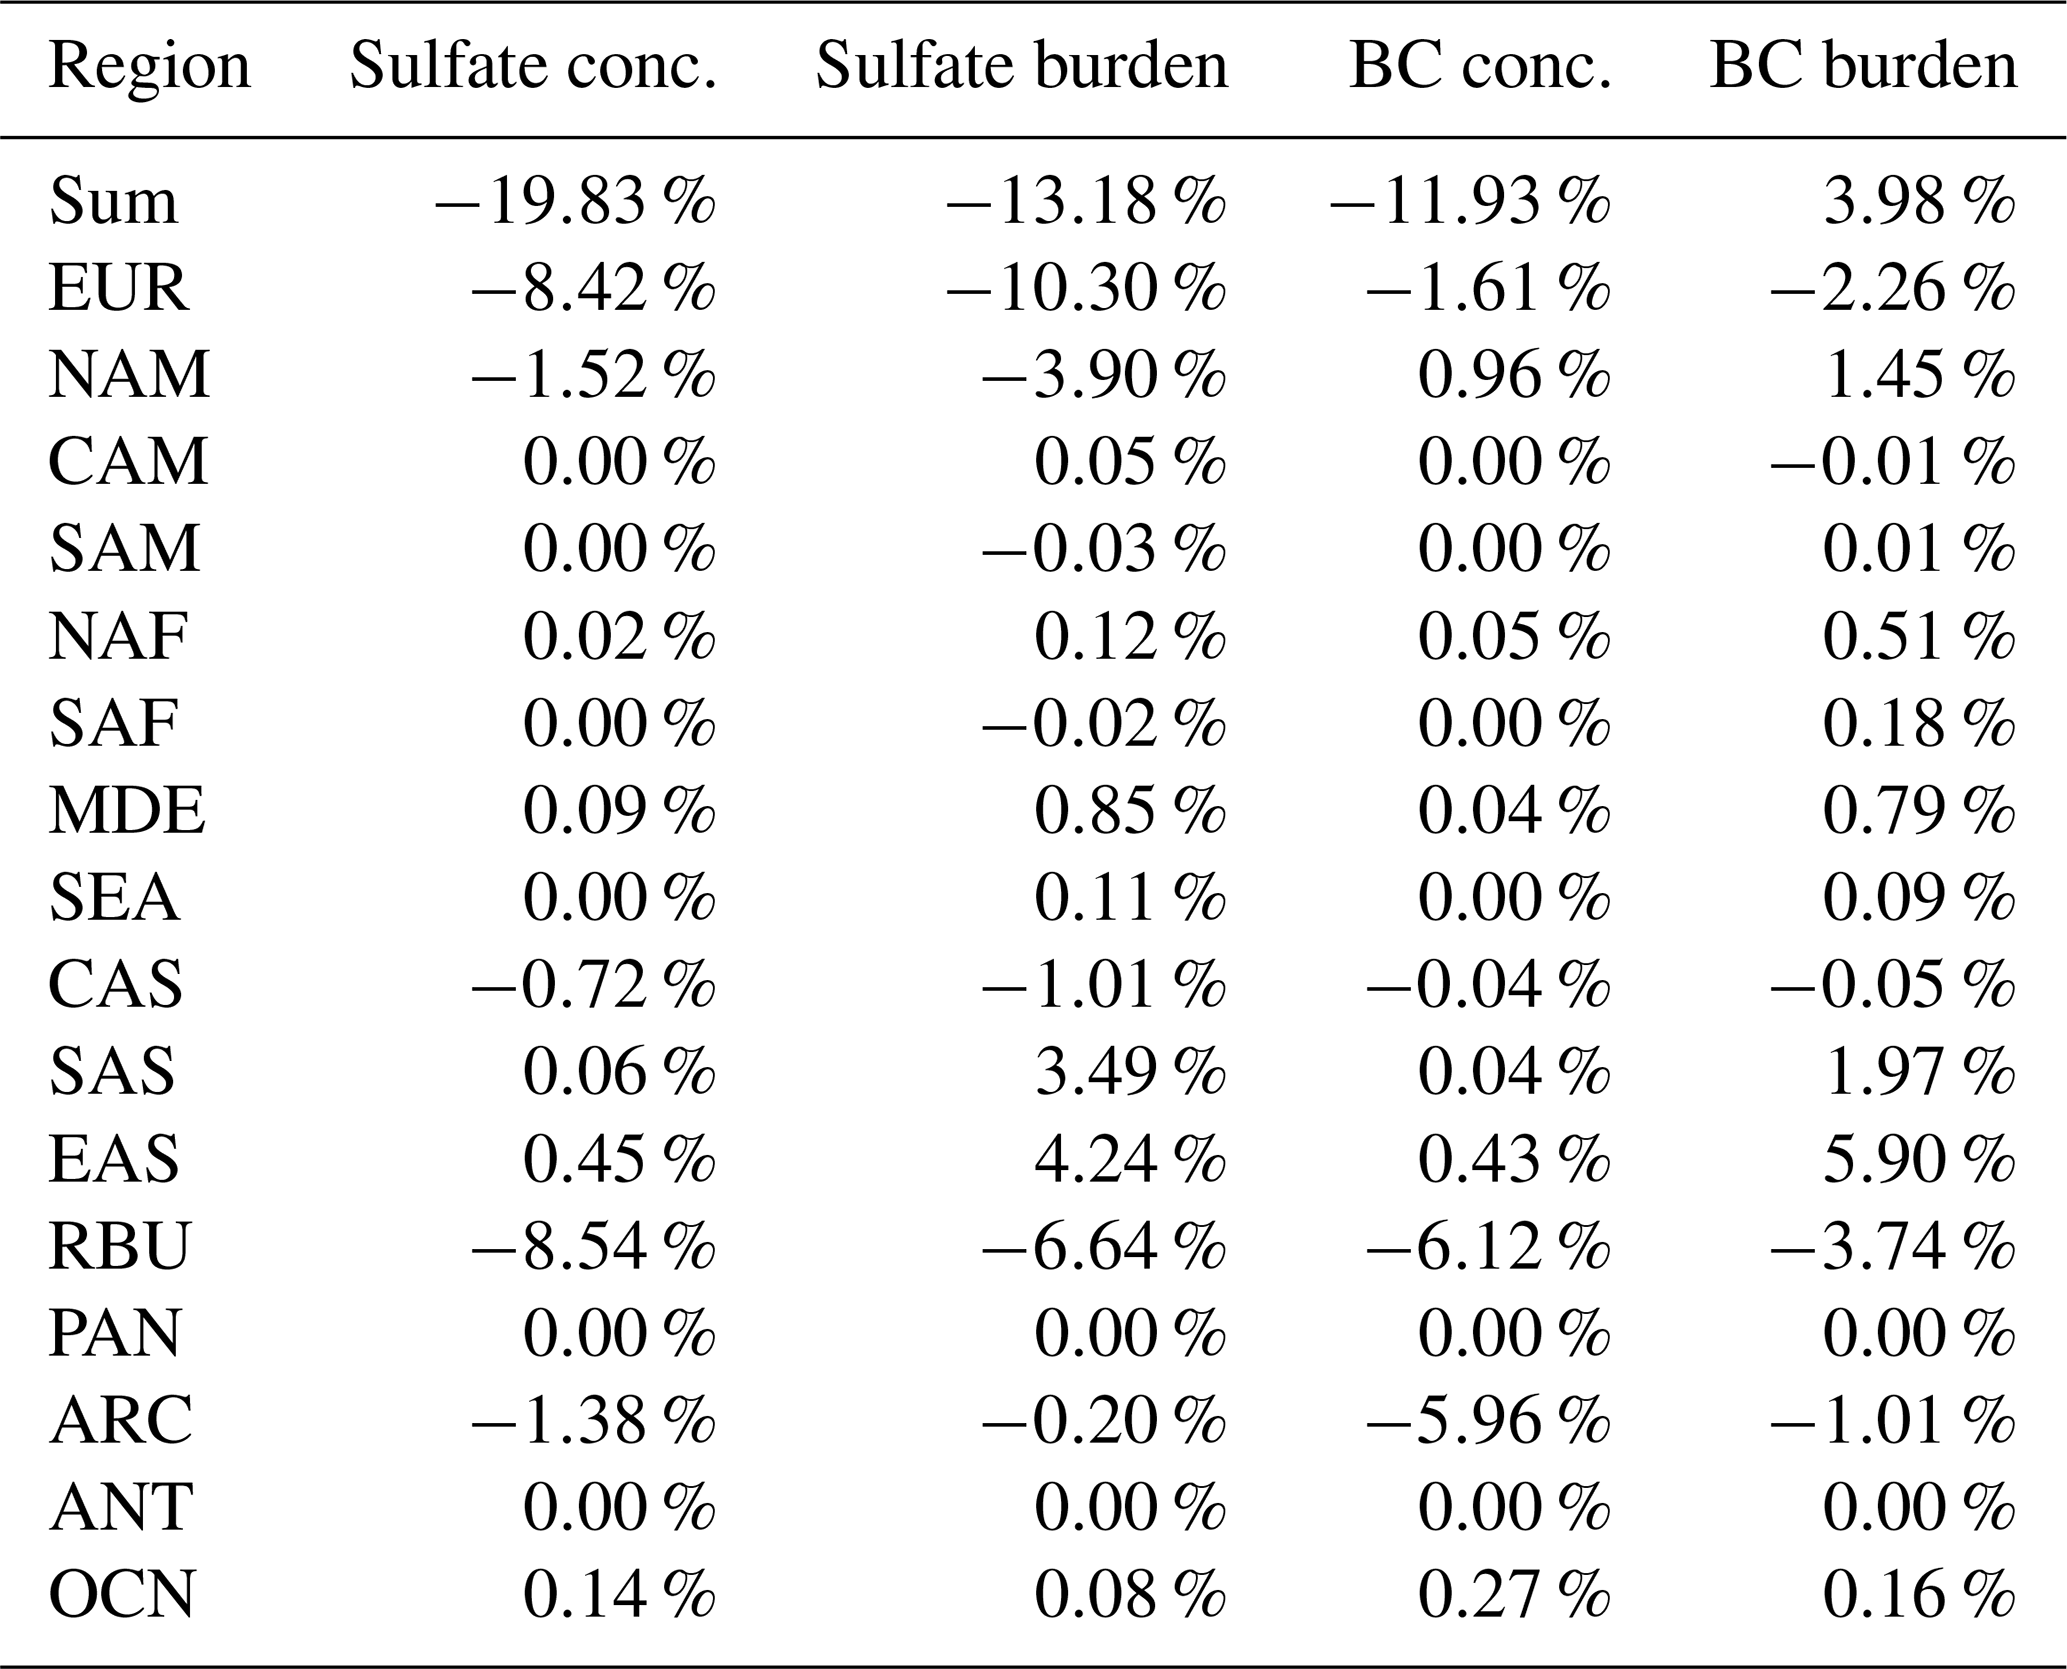
A linear regression approach, shown in Fig. 8, is applied in order to analyze the trends of the annual near-surface concentrations and column burden of sulfate and BC from 1980 to 2018, and the individual source contributions to these trends are summarized in Table 2. During 1980–2018, the simulated Arctic near-surface concentration and column burden of sulfate decreased by 20 % and 13 % per decade, respectively. Due to the air pollution regulations in Europe and the dissolution of the former Soviet Union, reductions in emissions from Europe and Russia led to decreasing trends of 7 %–10 % per decade in the near-surface concentration and column burden of sulfate, thus having the largest contributions to sulfate trends among all tagged source regions. In addition, the change in North American emissions contributed to a 2 %–4 % per decade decreasing trend in the Arctic sulfate concentration and burden, which is related to its emission control since the 1980s. South and East Asia together contributed to an increase in total Arctic sulfate burden at a rate of 8 % per decade, which is associated with the emission rise during this time period. The near-surface concentration of Arctic BC has a decreasing trend of 12 % per decade during 1980–2018, mostly driven by the decreases in contributions from Russian and local Arctic emissions (6 % per decade each). For BC column burden, the decreasing trends as a result of the reductions in emissions from Russia and Europe are offset by the increasing trends caused by emission increases in South and East Asia, resulting in an insignificant change in total BC burden during 1980–2018. All trend values mentioned above are statistically significant at the 95 % confidence level.
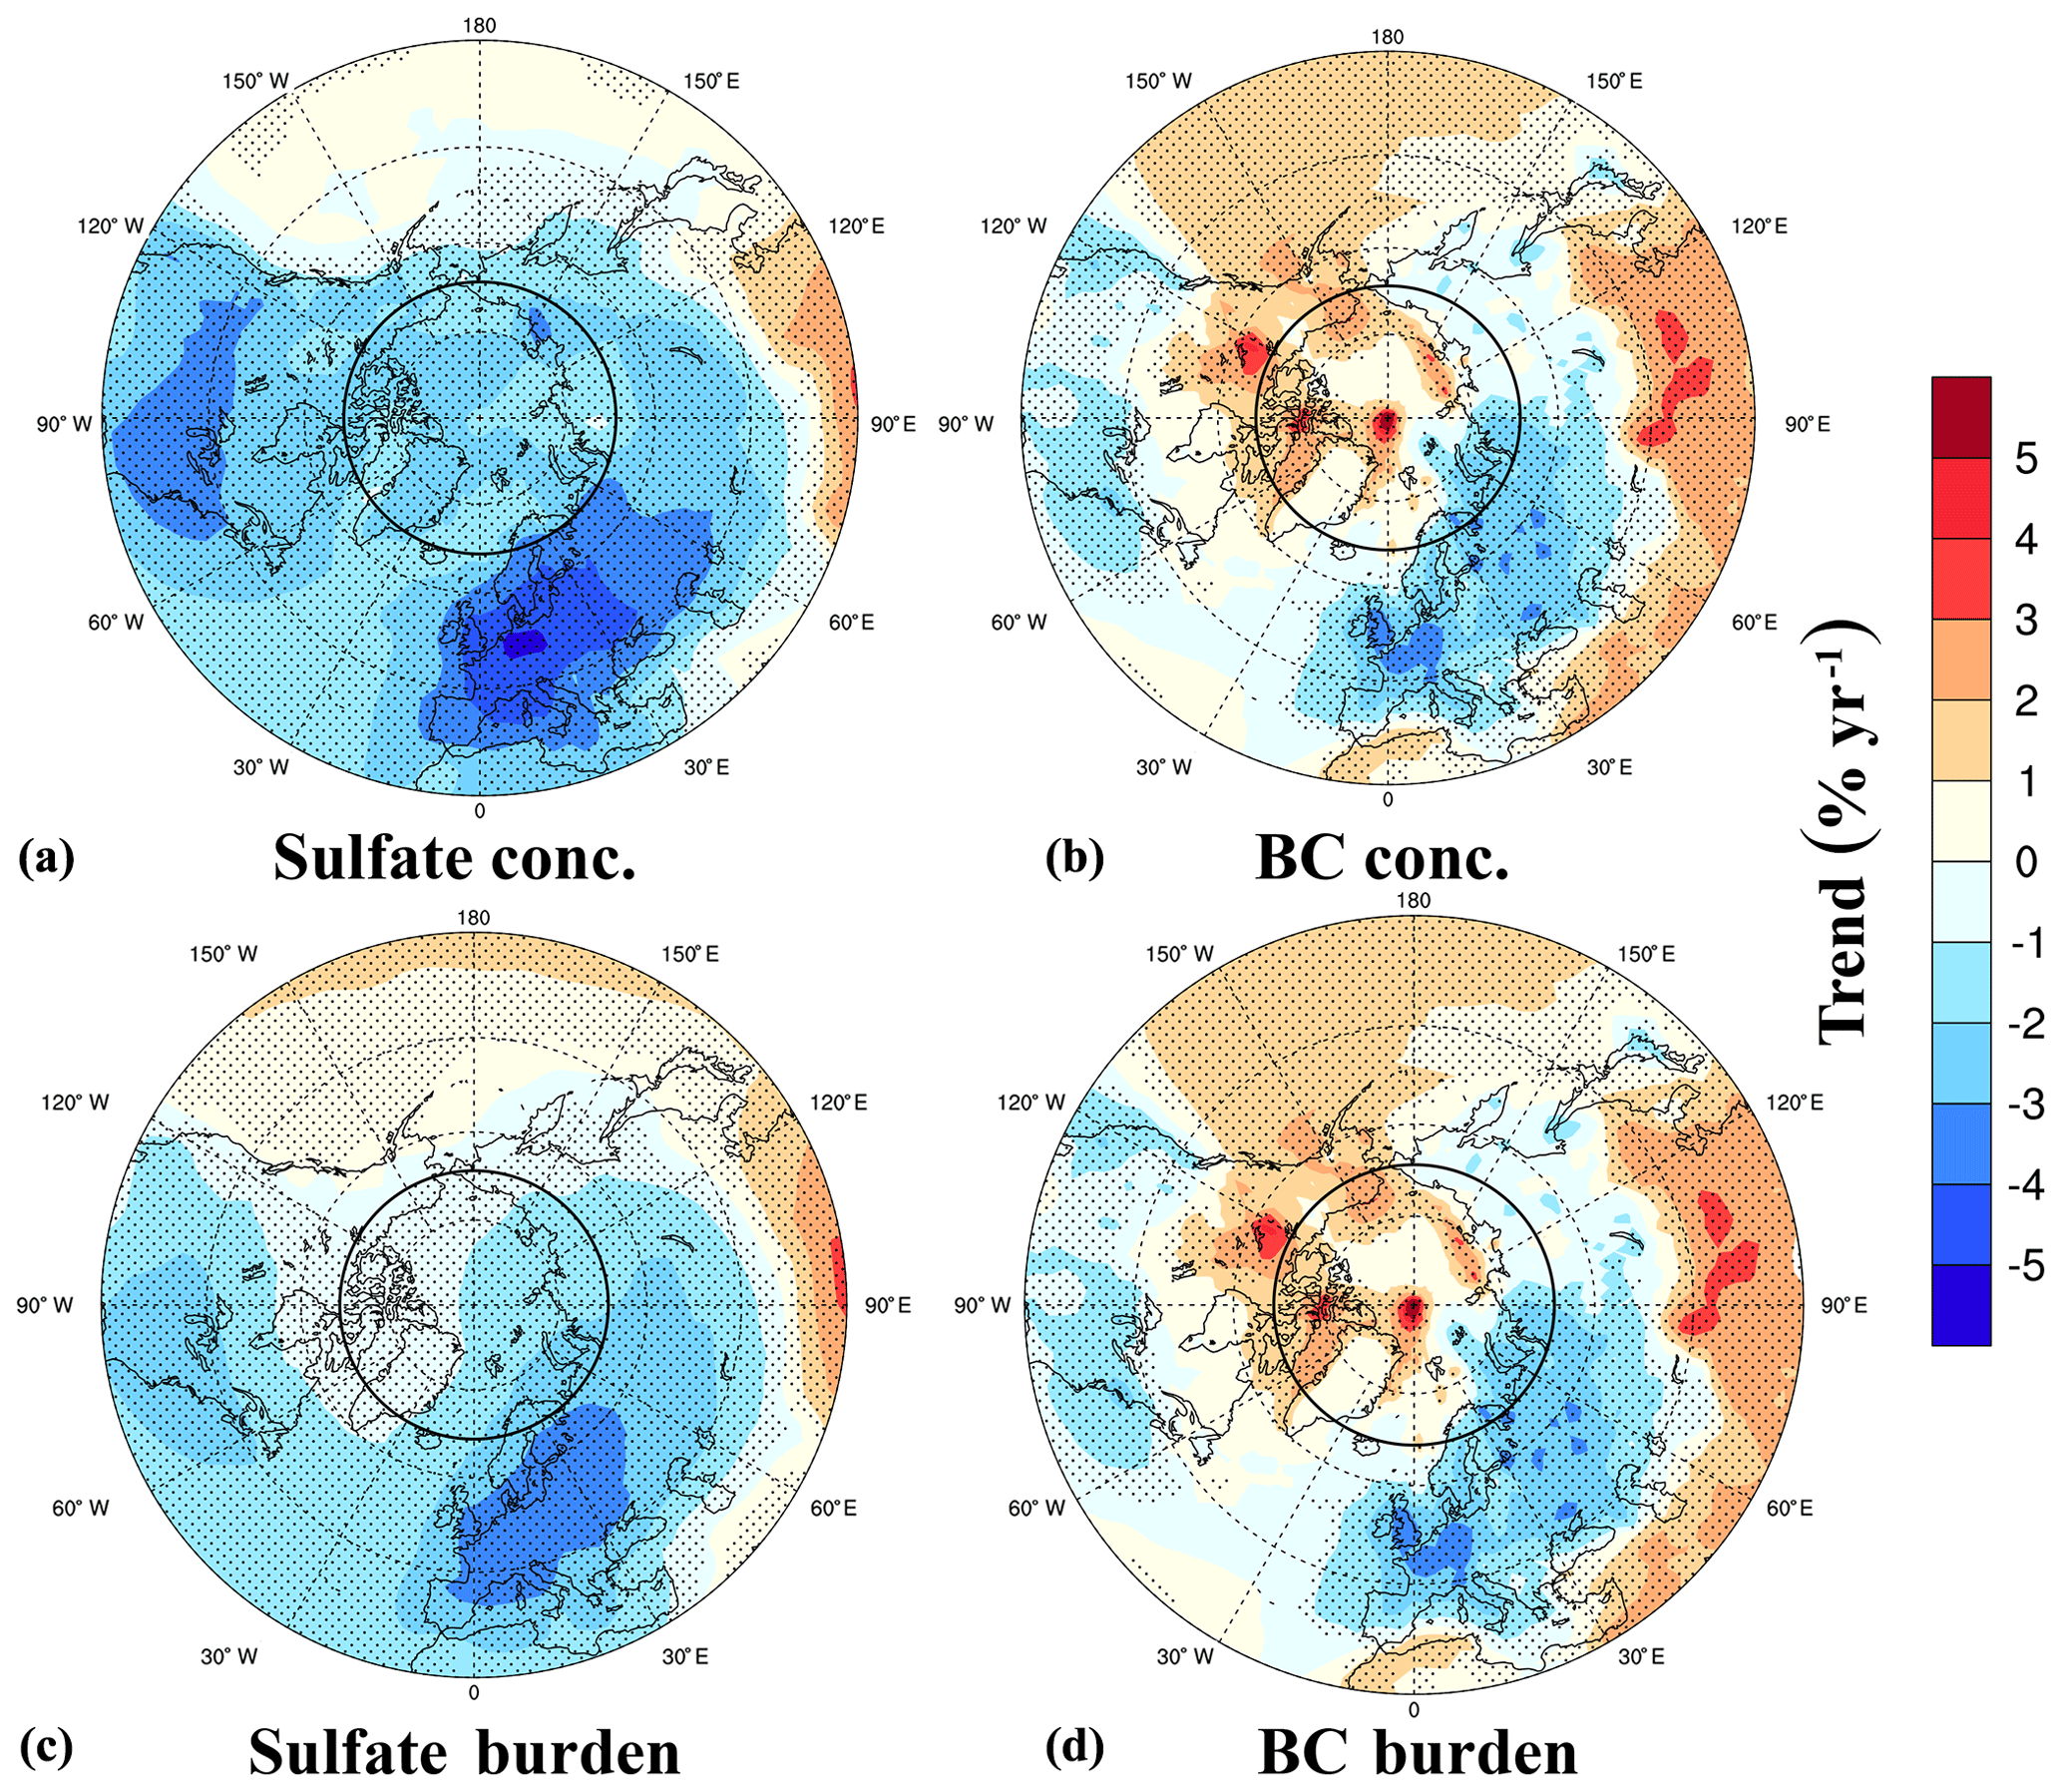
Figure 8Spatial distribution of linear trends in annual mean sulfate (a, c) and BC (b, d) concentrations (% yr−1) near the surface (a, b) and column burden (c, d) relative to the 39-year averages. The dotted areas indicate statistical significance with 95 % confidence based on the F test.
Table 2Trends in annual mean sulfate and BC concentrations ( % per decade) in surface air and in column contributed by 16 anthropogenic source regions during 1980–2018 relative to the 39-year averages of total concentrations. The boldface values are statistically significant at the 95 % confidence level based on the F test.
Both sulfate and BC influence the Arctic climate by perturbing the atmospheric and surface radiation balance. The spatial distribution of the climatological mean TOA radiative forcing due to aerosol–radiation interactions (RFari) of sulfate and BC averaged over 1980–2018 is shown in Fig. 9. The Arctic sulfate exerts a negative RFari primarily by scattering incoming solar radiation back into space with the forcing in the range of −0.4–0 Wm−2. The atmospheric BC can absorb solar radiation in the atmosphere leading to a positive RFari of 0.1–0.4 Wm−2 in the Arctic, which is similar to the values of 0.1–0.6 Wm−2 estimated in previous studies (Koch and Hansen, 2005; Flanner et al., 2009; AMAP, 2011; Bond et al., 2011; Samset et al., 2014; Wang et al., 2014). In the high latitudes and midlatitudes of the Northern Hemisphere, the RFari of sulfate over Europe and Russia is in the range of −1.0–0.4 Wm−2. Sulfate RFari over North America varies from −0.2 to −1.0 Wm−2. The negative RFari of sulfate over East Asia is more than −1.0 Wm−2 mainly due to the high sulfate concentrations. BC over Europe, Russia and Central Asia exerts a positive RFari of 0.4–1 Wm−2. The BC RFari over East Asia reaches a high value over 1.0 Wm−2.

Figure 9Spatial distribution of annual mean radiative forcing due to aerosol–radiation interactions (RFari) of (a) sulfate and (b) BC (W m−2) at the TOA averaged over 1980–2018.
Previous studies have suggested that the Arctic climate responds not only to local Arctic forcings but also to outside forcings due to the meridional energy transport change (Navarro et al., 2016). To estimate the relative roles of regional aerosol trends in affecting the Arctic warming, we looked into the temporal variation of the annual mean radiative forcing of sulfate and BC in different latitudinal bands during 1980–2018 (Fig. 10). Within the Arctic (60–90∘ N), the magnitude of sulfate RFari decreases from −0.21 Wm−2 in 1980–1984 to −0.10 Wm−2 in 2014–2018, indicating a warming effect in the Arctic from the local sulfate change. Over the midlatitudes (28–60∘ N), the sulfate RFari decreases from −0.87 to -0.53 Wm−2 between the first and last 5 years of 1980–2018, while the magnitude of the sulfate RFari in the tropical region (28∘ S–28∘ N) increases from −0.52 to −0.60 Wm−2. The positive BC RFari increases from 0.55 to 0.74 Wm−2 in the midlatitudes and from 0.51 to 0.76 Wm−2 in the tropics, while the BC RFari over the Arctic has no obvious change during this time period.
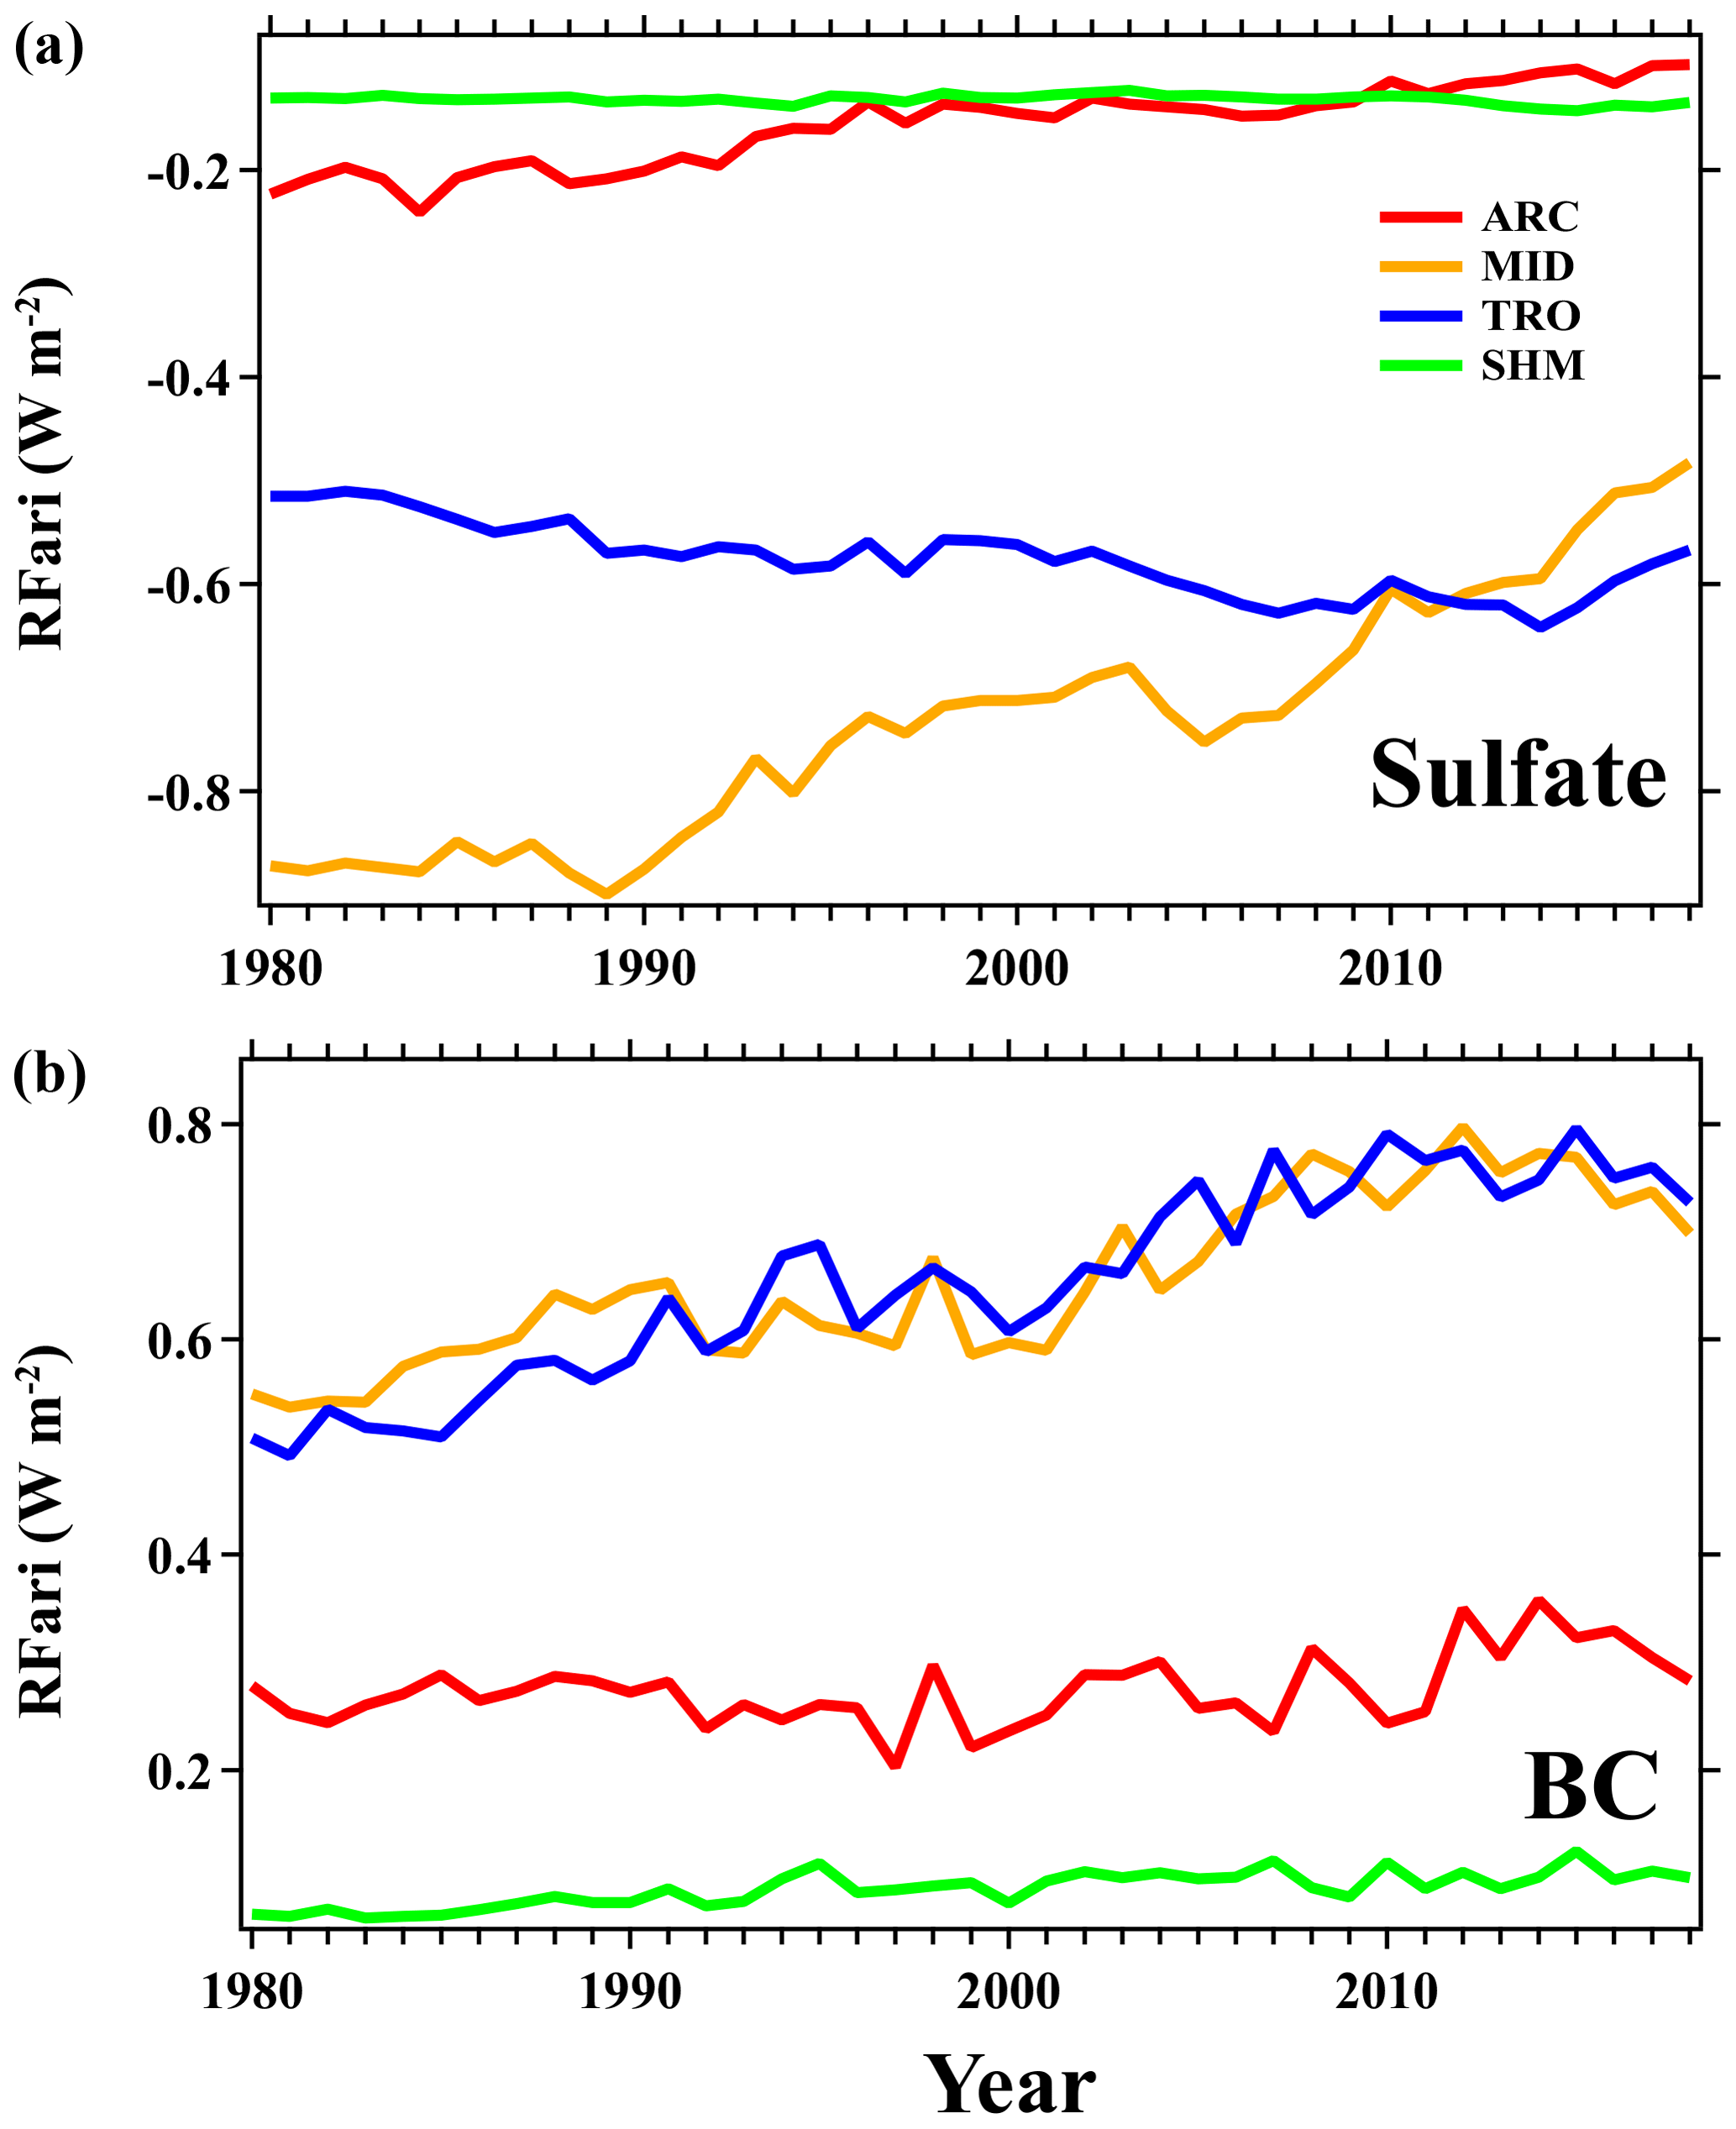
Figure 10Time series (1980–2018) of annual radiative forcing due to aerosol–radiation interactions (RFari; W m−2) of sulfate and BC over the Arctic (ARC; 60–90∘ N), Northern Hemisphere midlatitudes (MID; 28–60∘ N), tropics (TRO; 28∘ S–28∘ N) and Southern Hemisphere (SHM; 90–28∘ S).
A systematic assessment of the impact of aerosols on Arctic warming since the 1980s requires the Arctic temperature responses to changes in radiative forcing of different aerosol species over different regions to be quantified. Here we apply Arctic climate sensitivity factors, defined as the Arctic temperature response per unit radiative forcing, for each short-lived climate forcer over the Arctic, the midlatitudes of the Northern Hemisphere, the tropics and the Southern Hemisphere from Sand et al. (2016) and Shindell and Faluvegi (2009) to calculate the recent Arctic surface temperature change related to the variations in sulfate and BC radiative forcings over the different latitudinal bands during 1980–2018 (Fig. 11 and Table 3). This method has been widely adopted to examine the Arctic temperature response to aerosol forcings (e.g., Breider et al., 2017; Flanner, 2013; Sand et al., 2016; Shindell and Faluvegi, 2009; Yang et al., 2018c).
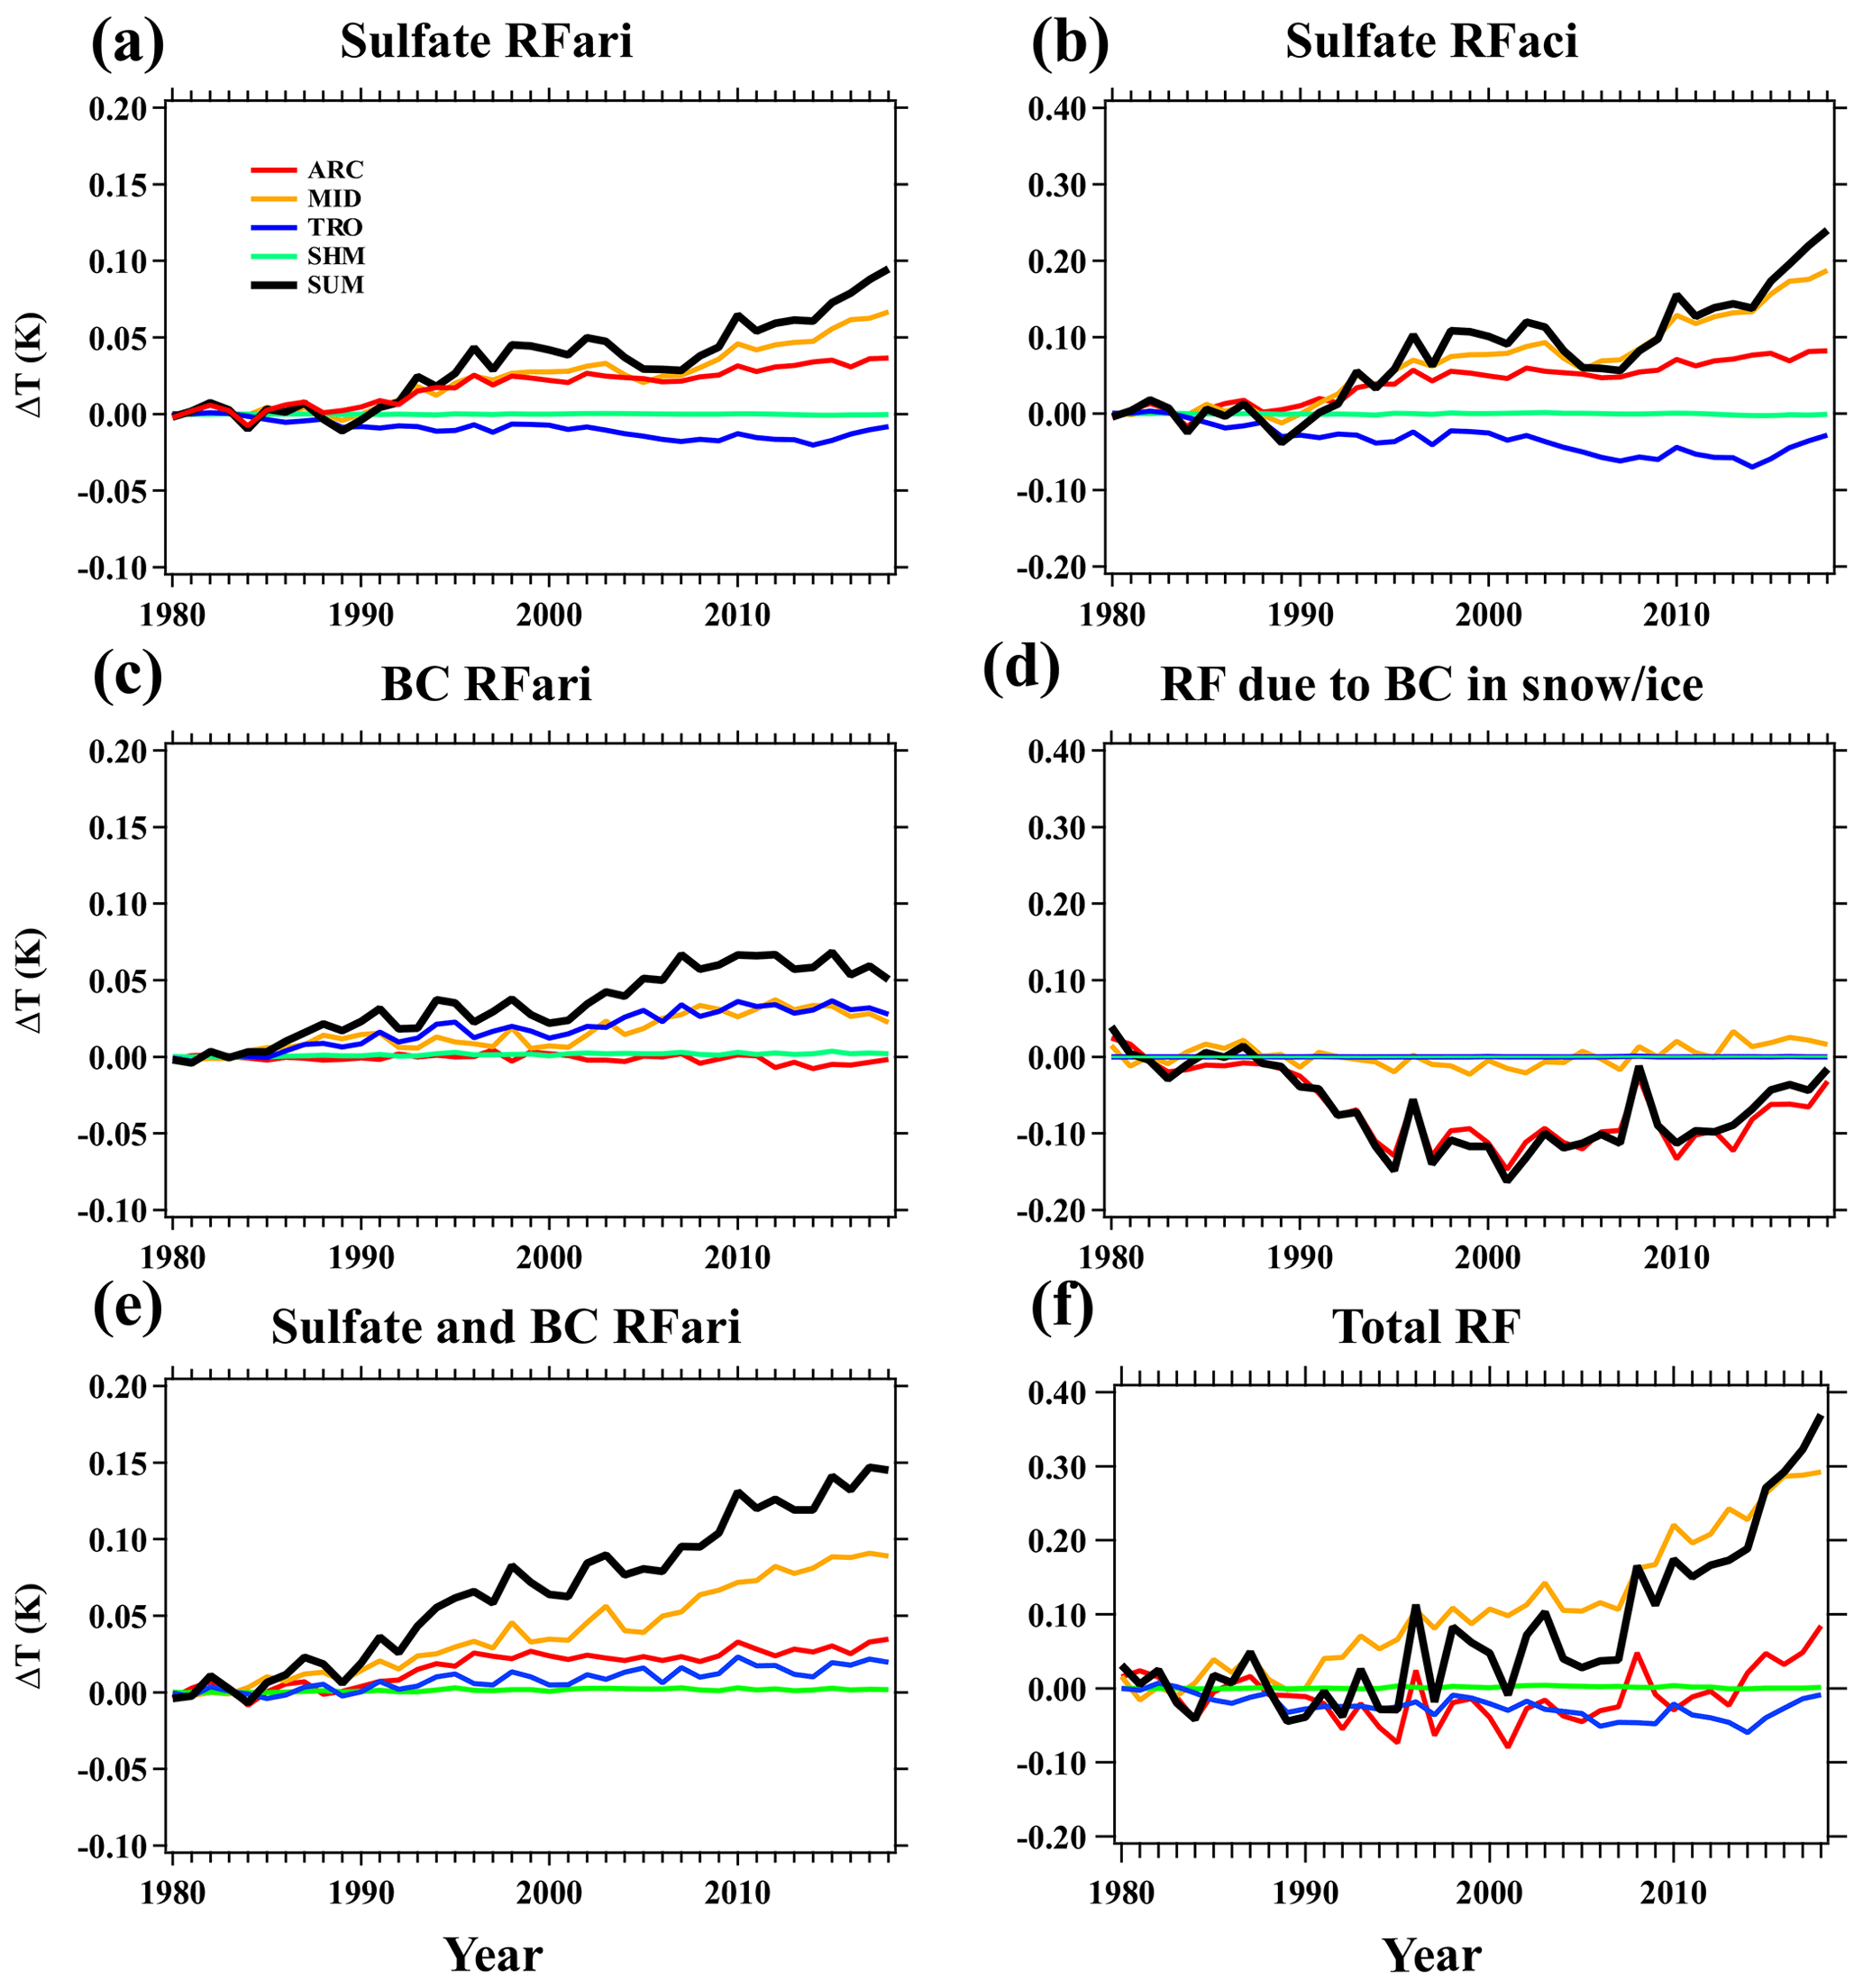
Figure 11Time series (1980–2018) of the estimated response in surface temperatures (K) to the change in radiative forcing due to the aerosol–radiation interactions (RFari) of (a) sulfate, (c) BC, and (e) sum of sulfate and BC RFari; (b) radiative forcing due to aerosol–cloud interactions (RFaci) of sulfate, (d) radiative forcing (RF) due to BC in snow and ice, and (f) the sum of all RF in each latitudinal band and the sum of them (SUM).
Table 3Estimated annual mean of the response in Arctic surface temperatures (K) to the change in TOA radiative forcing due to aerosol–radiation interactions (RFari) of sulfate and BC, aerosol–cloud interactions (RFaci) of sulfate, and radiative forcing (RF) due to BC in snow and ice (W m−2) in each latitude band.
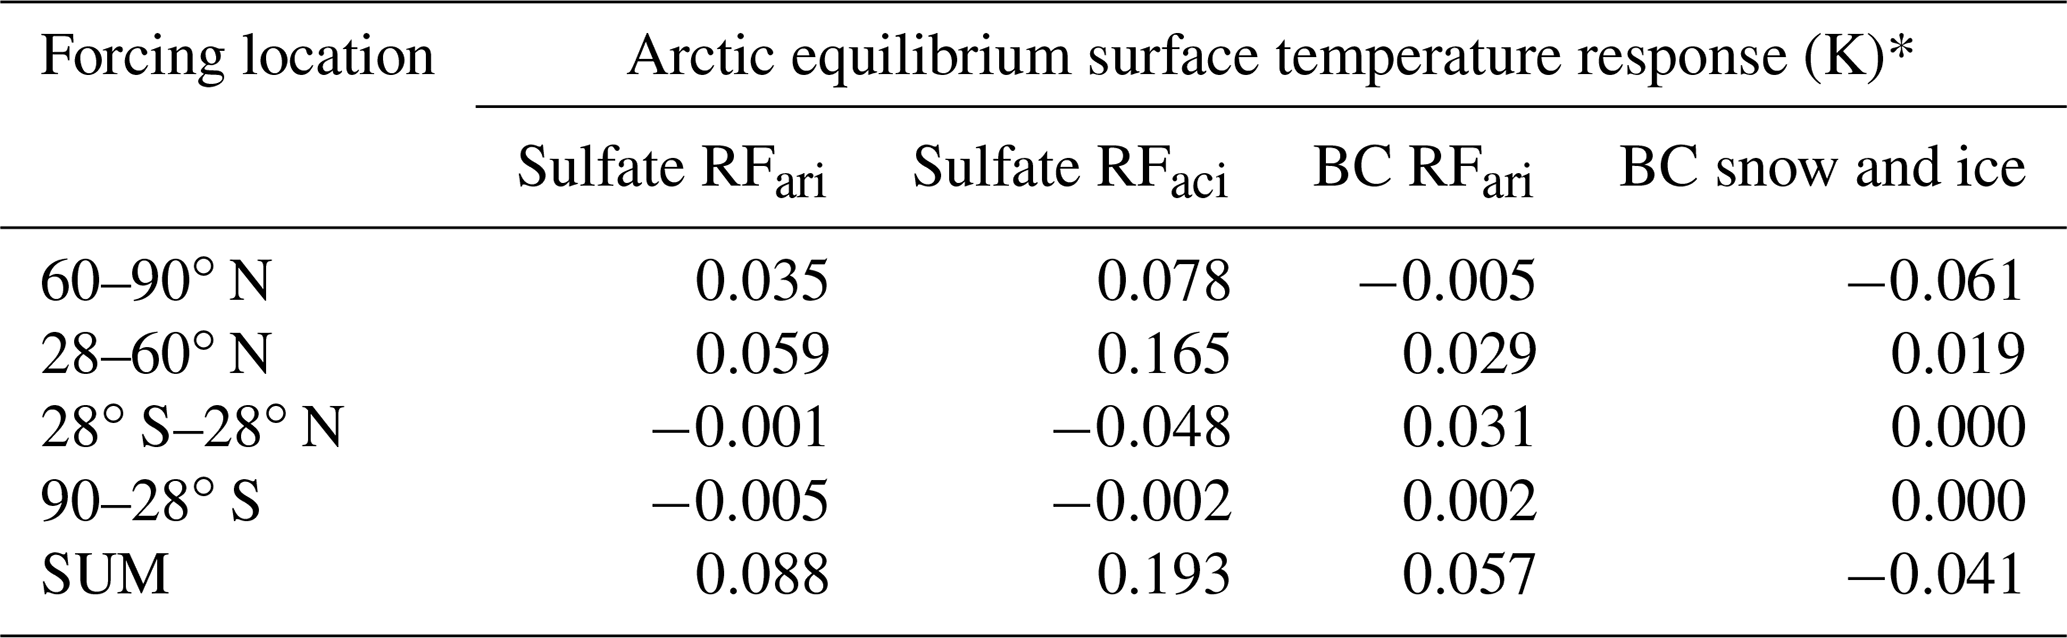
* The λ are 0.31, 0.17, 0.16 and 0.06 for sulfate RFari and RFaci; −0.08, 0.15, 0.31 and 0.06 for BC RFari; 1.06, 0.45, 0.93 and 0.18 for RF due to BC in snow and ice, according to the order given by forcing locations in the table. Sulfate RFaci is not archived in this study and is roughly estimated here by scaling sulfate RFari based on the ratio of sulfate RFaci and RFari over different latitudes from Sand et al. (2016).
It is estimated that, between 1980 and 1984 and 2014 and 2018, changes in total RFari of sulfate and BC produce a surface warming of +0.145 K over the Arctic, with +0.088 K (61 %) contributed by the sulfate forcing change and the remainder explained by the BC forcing change. Sulfate-related Arctic warming is mainly due to the decrease in sulfate at midlatitudes that enhances the temperature gradient between the midlatitudes and Arctic, resulting in a strengthened meridional heat transport and, therefore, the Arctic warming of +0.059 K. The change in the local Arctic RFari of sulfate provides +0.035 K of the surface warming, while the forcing change in the tropics has a negligible influence on the Arctic temperature change. The Arctic temperature responses to increases in BC RFari over the midlatitudes and tropics are +0.029 and +0.031 K, respectively, in relation to the enhanced poleward heat transport from the warming radiative impact in the midlatitudes, while changes in the Arctic BC RFari only exert a weak cooling of −0.005 K. Overall, the RFari change over the midlatitudes provides the strongest warming effect (+0.088 K) to the Arctic compared to other latitudinal bands owing to the aerosol-induced increase in the poleward heat transport.
While the results above focus on the effects of aerosol–radiation interactions, the aerosol–cloud interactions (RFaci) and BC snow–ice albedo effects can also influence Arctic climate. Sulfate RFaci is estimated by scaling sulfate RFari based on the ratio of sulfate RFaci and RFari over different latitudes from Sand et al. (2016). Within the Arctic, the magnitude of negative TOA RFaci of sulfate decreases from −0.48 Wm−2 in 1980–1984 to −0.23 Wm−2 in 2014–2018, indicating a warming effect due to the local sulfate change. Over the midlatitudes, the sulfate RFaci decreases from −2.46 to −1.49 Wm−2 between the first and last 5 years of 1980–2018, while the magnitude of the sulfate RFaci in the tropical region increases from −1.78 to −2.08 Wm−2. The positive RF due to BC in snow and ice decreases from 0.34 Wm−2 in 1980–1984 to 0.29 Wm−2 in 2014–2018 over the Arctic, while that over the midlatitudes increases from 0.19 to 0.23 Wm−2.
Based on the Arctic climate sensitivities, the impacts of changes in radiative forcing due to aerosol–cloud interactions of sulfate are also estimated. The sulfate RFaci provides an Arctic warming of +0.193 K between 1980 and 1984 and 2014 and 2018, with +0.165 K contributed by the RFaci change over the midlatitudes and +0.078 K resulting from the Arctic RFaci change. It should be noted that aerosol–cloud interactions at high-latitude regions are complicated and highly uncertain in climate models. The temperature changes presented here only provide a rough estimate. BC in snow and ice reduces surface albedo and increases snowmelt and ice melt (Flanner et al., 2007; Qian et al., 2015). Due to the decrease in Arctic BC concentration and deposition, BC concentration in the Arctic snow has been decreasing (e.g., Zhang et al., 2019). The weakened BC snow–ice albedo effect leads to an Arctic cooling of −0.061 K, while the midlatitude BC in snow and ice causes an Arctic warming of +0.019 K. The total BC snow–ice albedo effects result in an Arctic surface temperature change of −0.041 K during 1980–2018, partially offsetting the solar absorbing effect of BC in the atmosphere. Combining all the effects, we estimate that between 1980 and 2018, sulfate and BC contribute a total of +0.297 K to the Arctic surface temperature change, approximately 20 % of the observed Arctic warming during this period.
The Arctic has warmed rapidly since the 1980s with the surface air temperature increasing by 1.5 K. Different from the emission perturbation method that was often used in previous studies, in this study, the EAST was implemented in CAM5 to quantify the source attribution of aerosols in the Arctic and the aerosol-related Arctic warming during 1980–2018. The model can reasonably simulate the spatial distribution and temporal variation of the Arctic near-surface sulfate and BC concentrations compared with several site measurements. Considering that the model underestimates the magnitude of sulfate and BC concentrations, the estimated impact on Arctic temperature from sulfate and BC could be even larger if the model were able to accurately reproduce the measurements in the Arctic.
Compared to 1980–1984, the simulated annual average of sulfate and BC concentrations over the Arctic in 2014–2018 had a decrease of 42.8 % and 23.0 %, respectively. The decrease in emissions from Europe and Russia were responsible for 18.6 % and 18.8 % of the near-surface sulfate concentration decrease (out of 42.8 %), and the reduction in local Arctic emissions and emissions from Russia led to a 9.3 % and 14.9 % reduction of the BC concentration (out of 23.0 %), respectively. In 2014–2018, increases in emissions from South and East Asia together contributed to an increase in sulfate and BC concentrations up to 0.1 µg m−3 and 2 ng m−3, respectively, at the upper troposphere compared to the annual mean concentrations during 1980–1984. The contribution of European and Russian emissions to the Arctic sulfate concentration each had a decrease of about 0.1 µg m−3 under 6 km. Below 2 km, the BC concentration contributed by emissions from the Arctic and Russia each had a decrease of up to 2 ng m−3. Simulated sulfate near-surface concentration and column burden had a decreasing trend of 20 % per decade and 13 % per decade, respectively, in the Arctic during 1980–2018, mainly driven by the reductions in emissions from Europe and Russia, both of which led to decreasing trends at a rate of 7 %–10 % per decade. Due to the decreases in contributions from Russia and local Arctic emissions (6 % per decade each), the near-surface concentration of Arctic BC presents a decreasing trend of 12 % per decade during 1980–2018.
Aerosols within and outside the Arctic can influence the Arctic climate by changing the radiative balance. The magnitude of negative TOA RFari of sulfate over the Arctic decreased from −0.21 Wm−2 in 1980–1984 to −0.10 Wm−2 in 2014–2018. Over the midlatitudes, the sulfate RFari magnitude decreased from −0.87 to −0.53 Wm−2, while the sulfate RFari over the tropics increased from −0.52 to −0.60 Wm−2. The positive BC RFari in the midlatitudes and tropics increased from 0.55 and 0.51 to 0.74 and 0.76 Wm−2, respectively, while that over the Arctic had no significant change during this time period. By applying Arctic climate sensitivity factors obtained from the literature to the variations in aerosol radiative forcing, the aerosol-induced Arctic surface temperature change is estimated in this study. During 1980–2018, through aerosol–radiation interactions, sulfate and BC together produced a +0.145 K warming of the Arctic, +0.088 K (61 %) of which was contributed by sulfate. The decrease in sulfate at midlatitudes led to an increase in Arctic temperature of +0.059 K, whereas the local Arctic sulfate provided +0.035 K of the surface warming. The Arctic temperature responses to changes in atmospheric BC over the midlatitudes and tropics are +0.029 K and +0.031 K, respectively, while changes in BC in the Arctic atmosphere only exert a weak cooling of −0.005 K. Through aerosol–cloud interactions, sulfate exerted an Arctic warming of +0.193 K during 1980–2018, with +0.165 K contributed by the forcing change over the midlatitudes and +0.078 K due to the forcing change over the Arctic. Therefore, changes in aerosols over the midlatitudes had the largest impact on Arctic temperature than other regions during 1980–2018 by enhancing the meridional temperature gradient and therefore poleward heat transport, followed by changes in local Arctic aerosol forcings. Due to the decrease in Arctic BC concentration, the weakened BC snow–ice albedo effect led to an Arctic cooling of –0.061 K, partially offset by an Arctic warming of +0.019 K induced by the BC snow–ice albedo effect over the midlatitudes. Combining all aerosol effects, sulfate and BC together contributed to a total of +0.297 K to the Arctic surface temperature change during 1980–2018, explaining approximately 20 % of the observed Arctic warming during this period.
Many studies have examined possible mechanisms that can explain the recent Arctic warming, but the quantitative importance of these mechanisms is still under debate (e.g., Breider et al., 2017; Navarro et al., 2016). Among these mechanisms, some are related to the roles of aerosols in changing the Arctic temperature. Shindell and Faluvegi (2009) found that aerosols may have warmed the Arctic surface due to emission reductions during 1976–2010. Breider et al. (2017), using the GEOS-Chem model, estimated that emission reductions in anthropogenic aerosols during 1980–2010 contributed to a net warming at the Arctic surface by K, which is consistent with our results. However, they did not take into consideration the radiative forcing from aerosol–cloud interactions and deposition of BC to snow and ice surfaces. Navarro et al. (2016) presented simulations with an earth system model and showed that the reduction in European SO2 emissions over 1980–2005 caused an annual average Arctic warming of 0.5 K as a result of the enhanced poleward heat transport, which is larger than our estimates likely due to different emissions and models used here and in Navarro et al. (2016). There are a few sources of uncertainty in the results presented in this study. As discussed above, the model underestimates the near-surface sulfate and BC concentrations over the Arctic probably due to excessive aerosol wet removal during the long-range transport (e.g., Wang et al., 2013), uncertainties in aerosol emissions and biases in observations. Previous studies have reported large discrepancies in aerosol and precursor emissions in China between MEIC (Multi-resolution Emission Inventory for China) and CMIP6 emission inventories (e.g., Paulot et al., 2018). The CMIP6 emissions dataset shows similar decreasing trends in anthropogenic SO2 and BC emissions over China since 2011 as in the MEIC inventory (Fig. S3). However, the decrease in CMIP6 anthropogenic SO2 and BC emissions by 39 % and 0.5 %, respectively, in 2017 compared to 2010 is less than the corresponding magnitude of 62 % and 27 % in MEIC (Zheng et al., 2018). It indicates that the increase in aerosol contribution from East Asia during the recent decade and its impact on Arctic surface temperature could be overestimated in this study. Here we only discussed the effects of sulfate and BC on the Arctic surface temperature without considering other aerosol species due to large uncertainties in the simulation of secondary organic aerosols and the lack of other aerosol treatments (e.g., nitrate) in the current model version. These may lead to biases in the aerosol–climate effects in this study. For a more accurate estimation of aerosol-related Arctic warming, the coupled model configuration with free running simulations should be conducted in the future. The RFari calculation follows Ghan et al. (2012), which falls into the definition of effective RFari (ERFari), while the climate sensitivity factors were calculated based on the stratospherically adjusted radiative forcing. Considering that the assessment for adjusted RFari ( W m−2) is slightly lower than that for ERFari ( W m−2) (Boucher et al., 2013), the temperature response could be relatively smaller than estimated here. The relatively low model resolution may not capture the complexity of the Arctic terrain (Yang et al., 2018c), which also introduces uncertainties into the simulated aerosols in the Arctic. A high-resolution or regionally refined model is more desirable if resources allow it. Given that the assumed injection heights of anthropogenic emissions in models are uncertain, the ability to simulate surface-aerosol concentrations and vertical distribution in models could also be compromised (Yang et al., 2019b). In this study, we did not discuss the effects of meteorological parameters on the long-term aerosol simulation mainly because the decadal aerosol variation is dominated by changes in anthropogenic emissions rather than meteorology (Yang et al., 2016).
The CAM5 model is available at http://www.cesm.ucar.edu/models/cesm1.2/ (CAM5, 2019). Our CAM5-EAST model code and results can be made available through the National Energy Research Scientific Computing Center (NERSC) servers upon request. The observations are derived from the European Monitoring and Evaluation Programme, World Data Centre for Aerosols database (http://ebas.nilu.no, EBAS, 2020), and Breider et al. (2017).
The supplement related to this article is available online at: https://doi.org/10.5194/acp-20-9067-2020-supplement.
YY and HW designed the research. YY performed the model simulations. LR analyzed the data. All the authors discussed the results and wrote the paper.
The authors declare that they have no conflict of interest.
This research was supported by the National Natural Science Foundation of China (grant 41975159), the National Key Research and Development Program of China (grant 2019YFA0606800), Jiangsu Specially Appointed Professor Project, and the U.S. Department of Energy (DOE), Office of Science, Office of Biological and Environmental Research (BER), Earth and Environmental System Modeling (EESM) program as part of the Regional and Global Model Analysis program area. The Pacific Northwest National Laboratory (PNNL) is operated for the DOE by the Battelle Memorial Institute under contract DE-AC05-76RLO1830. The National Energy Research Scientific Computing Center (NERSC) and NUIST Computing Center provided computational support.
This research has been supported by the National Natural Science Foundation of China (grant no. 41975159) and the National Key Research and Development Program of China (grant 2019YFA0606800).
This paper was edited by Toshihiko Takemura and reviewed by three anonymous referees.
Abbatt, J. P. D., Leaitch, W. R., Aliabadi, A. A., Bertram, A. K., Blanchet, J.-P., Boivin-Rioux, A., Bozem, H., Burkart, J., Chang, R. Y. W., Charette, J., Chaubey, J. P., Christensen, R. J., Cirisan, A., Collins, D. B., Croft, B., Dionne, J., Evans, G. J., Fletcher, C. G., Galí, M., Ghahremaninezhad, R., Girard, E., Gong, W., Gosselin, M., Gourdal, M., Hanna, S. J., Hayashida, H., Herber, A. B., Hesaraki, S., Hoor, P., Huang, L., Hussherr, R., Irish, V. E., Keita, S. A., Kodros, J. K., Köllner, F., Kolonjari, F., Kunkel, D., Ladino, L. A., Law, K., Levasseur, M., Libois, Q., Liggio, J., Lizotte, M., Macdonald, K. M., Mahmood, R., Martin, R. V., Mason, R. H., Miller, L. A., Moravek, A., Mortenson, E., Mungall, E. L., Murphy, J. G., Namazi, M., Norman, A.-L., O'Neill, N. T., Pierce, J. R., Russell, L. M., Schneider, J., Schulz, H., Sharma, S., Si, M., Staebler, R. M., Steiner, N. S., Thomas, J. L., von Salzen, K., Wentzell, J. J. B., Willis, M. D., Wentworth, G. R., Xu, J.-W., and Yakobi-Hancock, J. D.: Overview paper: New insights into aerosol and climate in the Arctic, Atmos. Chem. Phys., 19, 2527–2560, https://doi.org/10.5194/acp-19-2527-2019, 2019.
Abdul-Razzak, H. and Ghan, S. J.: A parameterization of aerosol activation 2. Multiple aerosol types, J. Geophys. Res., 105, 6837–6844, https://doi.org/10.1029/1999JD901161, 2000.
AMAP: The Impact of Black Carbon on Arctic Climate, by: Quinn, P. K., Stohl, A., Arneth, A., Berntsen, T., Burkhart, J. F., Christensen, J., Flanner, M., Kupiainen, K., Lihavainen, H., Shepherd, M., Shevchenko, V., Skov, H., and Vestreng, V., AMAP Tech. Rep., 4, 72 pp., Arctic Monitoring and Assessment Programme (AMAP), Oslo, 2011.
Alexeev, V. A., Esau, I., Polyakov, I. V., Byam, S. J., and Sorokina, S.: Vertical structure of recent Arctic warming from observed data and reanalysis products, Clim. Change, 111, 215–239, https://doi.org/10.1007/s10584-011-0192-8, 2012.
Barrie, L. A.: Arctic air pollution – An overview of current knowledge, Atmos. Environ., 20, 643–663, https://doi.org/10.1016/0004-6981(86)90180-0, 1986.
Bond, T. C., Zarzycki, C., Flanner, M. G., and Koch, D. M.: Quantifying immediate radiative forcing by black carbon and organic matter with the Specific Forcing Pulse, Atmos. Chem. Phys., 11, 1505–1525, https://doi.org/10.5194/acp-11-1505-2011, 2011.
Bond, T. C., Doherty, S. J., Fahey, D. W., Forster, P. M., Berntsen, T., DeAngelo, B. J., Flanner, M. G., Ghan, S., Kärcher, B., Koch, D., Kinne, S., Kondo, Y., Quinn, P. K., Sarofim, M. C., Schultz, M. G., Schulz, M., Venkataraman, C., Zhang, H., Zhang, S., Bellouin, N., Guttikunda, S. K., Hopke, P. K., Jacobson, M. Z., Kaiser, J. W., Klimont, Z., Lohmann, U., Schwarz, J. P., Shindell, D., Storelvmo, T., Warren, S. G., and Zender, C. S.:Bounding the role of black carbon in the climate system: A scientific assessment, J. Geophys. Res.-Atmos., 118, 5380–5552, https://doi.org/10.1002/jgrd.50171, 2013.
Boucher, O., Randall, D., Artaxo, P., Bretherton, C., Feingold, G., Forster, P., Kerminen, V.-M., Kondo, Y., Liao, H., Lohmann, U., Rasch, P., Satheesh, S. K., Sherwood, S., Stevens, B., and Zhang, X. Y.: Clouds and Aerosols, in: Climate Change 2013: The Physical Science Basis, Contribution of Working Group I to the Fifth Assessment Report of the Intergovernmental Panel on Climate Change, edited by: Stocker, T. F., Qin, D., Plattner, G.-K., Tignor, M., Allen, S. K., Boschung, J., Nauels, A., Xia, Y., Bex, V., and Midgley, P. M., Cambridge University Press, Cambridge, UK and New York, NY, USA, 571–658, https://doi.org/10.1017/CBO9781107415324.016, 2013.
Bourgeois, Q. and Bey, I.: Pollution transport efficiency toward the Arctic: Sensitivity to aerosol scavenging and source regions, J. Geophys. Res.-Atmos., 116, D08213, https://doi.org/10.1029/2010JD015096, 2011.
Breider, T. J., Mickley, L. J., Jacob, D. J., Wang, Q., Fisher, J. A., Chang, R. Y. W., and Alexander, B.: Annual distributions and sources of Arctic aerosol components, aerosol optical depth, and aerosol absorption, J. Geophys. Res.-Atmos., 119, 4107–4124, https://doi.org/10.1002/2013JD020996, 2014.
Breider, T. J., Mickley, L. J., Jacob, D. J., Ge, C.,Wang, J., Sulprizio Payer, M., Croft, B., Ridley, D. A., McConnell, J. R., Sharma, S., Husain, L., Dutkiewicz, V. A., Eleftheriadis, K., Skov, H., and Hopke, P. K.: Multidecadal trends in aerosol radiative forcing over the Arctic: Contribution of changes in anthropogenic aerosol to Arctic warming since 1980, J. Geophys. Res.-Atmos., 122, 3573–3594, https://doi.org/10.1002/2016JD025321, 2017.
Browse, J., Carslaw, K. S., Arnold, S. R., Pringle, K., and Boucher, O.: The scavenging processes controlling the seasonal cycle in Arctic sulphate and black carbon aerosol, Atmos. Chem. Phys., 12, 6775–6798, https://doi.org/10.5194/acp-12-6775-2012, 2012.
CAM5: available at http://www.cesm.ucar.edu/models/cesm1.2/, last access: 8 December 2019.
EBAS: European Monitoring and Evaluation Programme, World Data Centre for Aerosols database, available at: http://ebas.nilu.no, last access: July 2020.
Eckhardt, S., Quennehen, B., Olivié, D. J. L., Berntsen, T. K., Cherian, R., Christensen, J. H., Collins, W., Crepinsek, S., Daskalakis, N., Flanner, M., Herber, A., Heyes, C., Hodnebrog, Ø., Huang, L., Kanakidou, M., Klimont, Z., Langner, J., Law, K. S., Lund, M. T., Mahmood, R., Massling, A., Myriokefalitakis, S., Nielsen, I. E., Nøjgaard, J. K., Quaas, J., Quinn, P. K., Raut, J.-C., Rumbold, S. T., Schulz, M., Sharma, S., Skeie, R. B., Skov, H., Uttal, T., von Salzen, K., and Stohl, A.: Current model capabilities for simulating black carbon and sulfate concentrations in the Arctic atmosphere: a multi-model evaluation using a comprehensive measurement data set, Atmos. Chem. Phys., 15, 9413–9433, https://doi.org/10.5194/acp-15-9413-2015, 2015.
Fisher, J. A., Jacob, D. J., Purdy, M. T., Kopacz, M., Le Sager, P., Carouge, C., Holmes, C. D., Yantosca, R. M., Batchelor, R. L., Strong, K., Diskin, G. S., Fuelberg, H. E., Holloway, J. S., Hyer, E. J., McMillan, W. W., Warner, J., Streets, D. G., Zhang, Q., Wang, Y., and Wu, S.: Source attribution and interannual variability of Arctic pollution in spring constrained by aircraft (ARCTAS, ARCPAC) and satellite (AIRS) observations of carbon monoxide, Atmos. Chem. Phys., 10, 977–996, https://doi.org/10.5194/acp-10-977-2010, 2010.
Fisher, J. A., Jacob, D. J., Wang, Q., Bahreini, R., Carouge, C. C., Cubison, M. J., Dibb, J. E., Diehl, T., Jimenez, J. L., Leibensperger, E. M., Lu, Z., Meinders, M. B. J., Pye, H.O. T., Quinn, P. K., Sharma, S., Streets, D. G., van Donkelaar, A., and Yantosca, R. M.: Sources, distribution, and acidity of sulfate–ammonium aerosol in the Arctic in winter–spring, Atmos. Environ., 45, 7301–7318, https://doi.org/10.1016/j.atmosenv.2011.08.030, 2011.
Flanner, M. G.: Arctic climate sensitivity to local black carbon, J. Geophys. Res.-Atmos., 118, 1840–1851, https://doi.org/10.1002/jgrd.50176, 2013.
Flanner, M. G., Zender, C. S., Randerson, J. T., and Rasch, P. J.: Present-day climate forcing and response from black carbon in snow, J. Geophys. Res., 112, D11202, https://doi.org/10.1029/2006JD008003, 2007.
Flanner, M. G., Zender, C. S., Hess, P. G., Mahowald, N. M., Painter, T. H., Ramanathan, V., and Rasch, P. J.: Springtime warming and reduced snow cover from carbonaceous particles, Atmos. Chem. Phys., 9, 2481–2497, https://doi.org/10.5194/acp-9-2481-2009, 2009.
Garrett, T. J., Zhao, C., and Novelli, P.: Assessing the relative contributions of transport efficiency and scavenging to seasonal variability in Arctic aerosol, Tellus B, 62, 190–196, https://doi.org/10.1111/j.1600-0889.2010.00453.x, 2010.
Garrett, T. J., Brattström, S., Sharma, S., Worthy, D. E., and Novelli, P.: The role of scavenging in the seasonal transport of black carbon and sulfate to the Arctic, Geophys. Res. Lett., 38, L16805, https://doi.org/10.1029/2011GL048221, 2011.
Gelaro, R., McCarty, W., Suárez, M. J., Todling, R., Molod, A., Takacs, L., Randles, C. A., Darmenov, A., Bosilovich, M. G., Reichle, R., Wargan, K., Coy, L., Cullather, R., Draper, C., Akella, S., Buchard, V., Conaty, A., da Silva, A. M., Gu, W., Kim, G.-K., Koster, R., Lucchesi, R., Merkova, D., Nielsen, J. E., Partyka, G., Pawson, S., Putman, W., Rienecker, M., Schubert, S. D., Sienkiewicz, M., and Zhao, B.: The Modern-Era Retrospective Analysis for Research and 476 Applications, Version 2 (MERRA-2), J. Climate, 30, 5419–5454, https://doi.org/10.1175/JCLI-D-16-0758.1, 2017.
Ghan, S. J., Liu, X., Easter, R. C., Zaveri, R., Rasch, P. J., Yoon, J. H., and Eaton, B.: Toward a minimal representation of aerosols in climate models: Comparative decomposition of aerosol direct, semidirect, and indirect radiative forcing, J. Climate, 25, 6461–6476, https://doi.org/10.1175/JCLI-D-11-00650.1, 2012.
Gong, S. L., Zhao, T. L., Sharma, S., Toom-Sauntry, D., Lavoué, D., Zhang, X. B., Leaitch,W. R., and Barrie, L. A.: Identification of trends and interannual variability of sulfate and black carbon in the Canadian High Arctic: 1981–2007, J. Geophys. Res., 115, D07305, https://doi.org/10.1029/2009JD012943, 2010.
Graversen, R. G., Mauritsen, T., Tjernström, M., Källén, E., and Svensson, G.: Vertical structure of recent Arctic warming, Nature, 451, 53–56, https://doi.org/10.1038/nature06502, 2008.
Heidam, N. Z., Wåhlin, P., and Christensen, J. H.: Tropospheric gases and aerosols in northeast Greenland, J. Atmos. Sci., 56, 261–278, https://doi.org/10.1175/1520-0469(1999)056<0261:TGAAIN>2.0.CO;2, 1999.
Heintzenberg, J. and Larssen, S.: SO2 and SO4 = in the Arctic: Interpretation of observations at three Norwegian Arctic-Subarctic stations, Tellus B, 35B, 255–265, https://doi.org/10.1111/j.1600-0889.1983.tb00028.x, 1983.
Hirdman, D., Burkhart, J. F., Sodemann, H., Eckhardt, S., Jefferson, A., Quinn, P. K., Sharma, S., Ström, J., and Stohl, A.: Long-term trends of black carbon and sulphate aerosol in the Arctic: changes in atmospheric transport and source region emissions, Atmos. Chem. Phys., 10, 9351–9368, https://doi.org/10.5194/acp-10-9351-2010, 2010.
Hoesly, R. M., Smith, S. J., Feng, L., Klimont, Z., Janssens-Maenhout, G., Pitkanen, T., Seibert, J. J., Vu, L., Andres, R. J., Bolt, R. M., Bond, T. C., Dawidowski, L., Kholod, N., Kurokawa, J.-I., Li, M., Liu, L., Lu, Z., Moura, M. C. P., O'Rourke, P. R., and Zhang, Q.: Historical (1750–2014) anthropogenic emissions of reactive gases and aerosols from the Community Emissions Data System (CEDS), Geosci. Model Dev., 11, 369–408, https://doi.org/10.5194/gmd-11-369-2018, 2018.
Hurrell, J. W., Hack, J. J., Shea, D., Caron, J. M., and Rosinski, J.: A New Sea Surface Temperature and Sea Ice Boundary Dataset for the Community Atmosphere Model, J. Climate, 21, 5145–5153, https://doi.org/10.1175/2008JCLI2292.1, 2008.
Hurrell, J. W., Holland, M. M., Gent, P. R., Ghan, S., Kay, J. E., Kushner, P. J., Lamarque, J. F., Large, W. G., Lawrence, D., Lind- say, K., Lipscomb, W. H., Long, M. C., Mahowald, N., Marsh, D. R., Neale, R. B., Rasch, P., Vavrus, S., Vertenstein, M., Bader, D., Collins, W. D., Hack, J. J., Kiehl, J., and Marshall, S.: The Community Earth System Model A Framework for Collaborative Research, B. Am. Meteorol. Soc., 94, 1339–1360, https://doi.org/10.1175/BAMS-D-12-00121.1, 2013.
Koch, D. and Hansen, J.: Distant origins of Arctic black carbon: a Goddard Institute for Space Studies ModelE experiment, J. Geophys. Res., 110, D04204, https://doi.org/10.1029/2004JD005296, 2005.
Koch, D., Schulz, M., Kinne, S., McNaughton, C., Spackman, J. R., Balkanski, Y., Bauer, S., Berntsen, T., Bond, T. C., Boucher, O., Chin, M., Clarke, A., De Luca, N., Dentener, F., Diehl, T., Dubovik, O., Easter, R., Fahey, D. W., Feichter, J., Fillmore, D., Freitag, S., Ghan, S., Ginoux, P., Gong, S., Horowitz, L., Iversen, T., Kirkevåg, A., Klimont, Z., Kondo, Y., Krol, M., Liu, X., Miller, R., Montanaro, V., Moteki, N., Myhre, G., Penner, J. E., Perlwitz, J., Pitari, G., Reddy, S., Sahu, L., Sakamoto, H., Schuster, G., Schwarz, J. P., Seland, Ø., Stier, P., Takegawa, N., Takemura, T., Textor, C., van Aardenne, J. A., and Zhao, Y.: Evaluation of black carbon estimations in global aerosol models, Atmos. Chem. Phys., 9, 9001–9026, https://doi.org/10.5194/acp-9-9001-2009, 2009.
Law, K. S. and Stohl, A.: Arctic air pollution: Origins and impacts, Science, 315, 1537–1540, https://doi.org/10.1126/science, 2007.
Liu, J., Fan, S., Horowitz, L. W., and Levy II, H.: Evaluation of factors controlling long-range transport of black carbon to the Arctic, J. Geophys. Res., 116, D04307, https://doi.org/10.1029/2010JD015145, 2011.
Liu, X., Easter, R. C., Ghan, S. J., Zaveri, R., Rasch, P., Shi, X., Lamarque, J.-F., Gettelman, A., Morrison, H., Vitt, F., Conley, A., Park, S., Neale, R., Hannay, C., Ekman, A. M. L., Hess, P., Mahowald, N., Collins, W., Iacono, M. J., Bretherton, C. S., Flanner, M. G., and Mitchell, D.: Toward a minimal representation of aerosols in climate models: description and evaluation in the Community Atmosphere Model CAM5, Geosci. Model Dev., 5, 709–739, https://doi.org/10.5194/gmd-5-709-2012, 2012.
Lou, S., Yang, Y., Wang, H., Lu, J., Smith, S. J., Liu, F., and Rasch P. J.: Black carbon increases frequency of extreme ENSO events, J. Climate, 32, 8323–8333, https://doi.org/10.1175/JCLI-D-19-0549.1, 2019a.
Lou, S., Yang, Y., Wang, H., Smith, S. J., Qian, Y., and Rasch, P. J., Black carbon amplifies haze over the North China Plain by weakening the East Asian winter monsoon, Geophys. Res. Lett., 46, 452–460, https://doi.org/10.1029/2018GL080941, 2019b.
Maenhaut, W., Cornille, P., Pacyna, J. M., and Vitols, V.: Arctic air chemistry trace element composition and origin of the atmospheric aerosol in the Norwegian Arctic, Atmos. Environ., 23, 2551–2569, https://doi.org/10.1016/0004-6981(89)90266-7, 1989.
McConnell, J. R., Edwards, R., Kok, G. L., Flanner, M. G., Zender, C. S., Saltzman, E. S., Banta, J. R., Pasteris, D. R., Carter, M. M., and Kahl, J. D. W.: 20th-century industrial black carbon emissions altered arctic climate forcing, Science, 317, 1381–1384, https://doi.org/10.1126/science.1144856, 2007.
McFarquhar, G. M. and Wang, H.: Effects of aerosols on trade wind cumuli over the Indian Ocean: Model simulations, Q. J. Roy. Meteor. Soc., 132, 821–843, https://doi.org/10.1256/qj.04.179, 2006.
Navarro, J. C. A., Varma, V., Riipinen, I., Seland, Ø., Kirkevåg, A., Struthers, H., Iversen, T., Hansson, H.-C., and Ekman, A. M. L.: Amplification of Arctic warming by past air pollution reductions in Europe, Nat. Geosci., 9, 277–281, https://doi.org/10.1038/ngeo2673, 2016.
O'Neill, N. T., Baibakov, K., Hesaraki, S., Ivanescu, L., Martin, R. V., Perro, C., Chaubey, J. P., Herber, A., and Duck, T. J.: Temporal and spectral cloud screening of polar winter aerosol optical depth (AOD): impact of homogeneous and inhomogeneous clouds and crystal layers on climatological-scale AODs, Atmos. Chem. Phys., 16, 12753–12765, https://doi.org/10.5194/acp-16-12753-2016, 2016.
Paulot, F., Paynter, D., Ginoux, P., Naik, V., and Horowitz, L. W.: Changes in the aerosol direct radiative forcing from 2001 to 2015: observational constraints and regional mechanisms, Atmos. Chem. Phys., 18, 13265–13281, https://doi.org/10.5194/acp-18-13265-2018, 2018.
Pithan, F. and Mauritsen, T.: Arctic amplification dominated by temperature feedbacks in contemporary climate models, Nat. Geosci., 7, 181–184, https://doi.org/10.1038/ngeo2071, 2014.
Qi, L., Li, Q., Henze, D. K., Tseng, H.-L., and He, C.: Sources of springtime surface black carbon in the Arctic: an adjoint analysis for April 2008, Atmos. Chem. Phys., 17, 9697–9716, https://doi.org/10.5194/acp-17-9697-2017, 2017.
Qian, Y., Wang, H., Zhang, R., Flanner, M. G., and Rasch, P. J.: A sensitivity study on modeling black carbon in snow and its radiative forcing over the Arctic and Northern China, Environ. Res. Lett., 9, 064001, https://doi.org/10.1088/1748-9326/9/6/064001, 2014.
Qian, Y., Yasunari, T. J., Doherty, S. J., Flanner, M. G., Lau, W. K., Ming, J., Wang, H., Wang, M., Warren, S. G., and Zhang, R.: Light-absorbing particles in snow and ice: Measurement and modeling of climatic and hydrological impact, Adv. Atmos. Sci., 32, 64–91, https://doi.org/10.1007/s00376-014-0010-0, 2015.
Quinn, P., Shaw, G., Andrews, E., Dutton, E., Ruoho-Airola, T., and Gong, S.: Arctic haze: current trends and knowledge gaps, Tellus B, 59, 99–114, https://doi.org/10.1111/j.1600-0889.2006.00236.x, 2007.
Quinn, P. K., Bates, T. S., Baum, E., Doubleday, N., Fiore, A. M., Flanner, M., Fridlind, A., Garrett, T. J., Koch, D., Menon, S., Shindell, D., Stohl, A., and Warren, S. G.: Short-lived pollutants in the Arctic: their climate impact and possible mitigation strategies, Atmos. Chem. Phys., 8, 1723–1735, https://doi.org/10.5194/acp-8-1723-2008, 2008.
Quinn, P. K., Bates, T. S., Schulz, K., and Shaw, G. E.: Decadal trends in aerosol chemical composition at Barrow, Alaska: 1976–2008, Atmos. Chem. Phys., 9, 8883–8888, https://doi.org/10.5194/acp-9-8883-2009, 2009.
Raatz, W. E. and Shaw, G. E.: Long-range tropospheric transport of pollution aerosols into the Alaskan Arctic, J. Clim. Appl. Meteor., 23, 1052–1064, https://doi.org/10.1175/1520-0450(1984)023<1052:LRTTOP>2.0.CO;2, 1984.
Rahn, K. A.: Relative importances of North America and Eurasia as sources of Arctic aerosol, Atmos. Environ., 15, 1447–1455, https://doi.org/10.1016/0004-6981(81)90351-6, 1981.
Rahn, K. A., Borys, R. D., and Shaw, G. E.: The Asian source of Arctic haze bands, Nature, 268, 713–715, https://doi.org/10.1038/268713a0, 1977.
Rienecker, M. M., Suarez, M. J., Gelaro, R., Todling, R., Bacmeister, J., Liu, E., and Woollen, J.: MERRA: NASA's modern-era retrospective analysis for research and applications, J. Climate, 24, 3624–3648. https://doi.org/10.1175/JCLI-D-11-00015.1, 2011.
Samset, B. H., Myhre, G., Herber, A., Kondo, Y., Li, S.-M., Moteki, N., Koike, M., Oshima, N., Schwarz, J. P., Balkanski, Y., Bauer, S. E., Bellouin, N., Berntsen, T. K., Bian, H., Chin, M., Diehl, T., Easter, R. C., Ghan, S. J., Iversen, T., Kirkevåg, A., Lamarque, J.-F., Lin, G., Liu, X., Penner, J. E., Schulz, M., Seland, Ø., Skeie, R. B., Stier, P., Takemura, T., Tsigaridis, K., and Zhang, K.: Modelled black carbon radiative forcing and atmospheric lifetime in AeroCom Phase II constrained by aircraft observations, Atmos. Chem. Phys., 14, 12465–12477, https://doi.org/10.5194/acp-14-12465-2014, 2014.
Sand, M., Berntsen, T., Von Salzen, K., Flanner, M., Langner, J., and Victor, D.: Response of Arctic temperature to changes in emissions of short-lived climate forcers, Nat. Clim. Change, 6, 286–289, https://doi.org/10.1038/nclimate2880, 2016.
Screen, J. A. and Simmonds, I.: Increasing fall-winter energy loss from the Arctic Ocean and its role in Arctic temperature amplification, Geophys. Res. Lett., 37, L16707, https://doi.org/10.1029/2010GL044136, 2010a.
Screen, J. A. and Simmonds, I.: The central role of diminishing sea ice in recent Arctic temperature amplification, Nature, 464, 1334–1337, https://doi.org/10.1038/nature09051, 2010b.
Serreze, M. C., Barrett, A. P., Stroeve, J. C., Kindig, D. N., and Holland, M. M.: The emergence of surface-based Arctic amplification, The Cryosphere, 3, 11–19, https://doi.org/10.5194/tc-3-11-2009, 2009.
Sharma, S., Lavoué, D., Cachier, H., Barrie, L. A., and Gong, S. L.: Long-term trends of the black carbon concentrations in the Canadian Arctic, J. Geophys. Res.-Atmos., 109, D15203, https://doi.org/10.1029/2003JD004331, 2004.
Sharma, S., Andrews, E., Barrie, L., Ogren, J., and Lavoué, D.: Variations and sources of the equivalent black carbon in the high Arctic revealed by long-term observations at Alert and Barrow: 1989–2003, J. Geophys. Res., 111, D14208, https://doi.org/10.1029/2005JD006581, 2006.
Sharma, S., Ishizawa, M., Chan, D., Lavoué, D., Andrews, E., Eleftheriadis, K., and Maksyutov, S.: 16-year simulation of Arctic black carbon: Transport, source contribution, and sensitivity analysis on deposition, J. Geophys. Res.-Atmos., 118, 943–964, https://doi.org/10.1029/2012JD017774, 2013.
Sharma, S., Leaitch, W. R., Huang, L., Veber, D., Kolonjari, F., Zhang, W., Hanna, S. J., Bertram, A. K., and Ogren, J. A.: An evaluation of three methods for measuring black carbon in Alert, Canada, Atmos. Chem. Phys., 17, 15225–15243, https://doi.org/10.5194/acp-17-15225-2017, 2017.
Shindell, D. and Faluvegi, G.: Climate response to regional radiative forcing during the twentieth century, Nat. Geosci., 2, 294–300, https://doi.org/10.1038/ngeo473, 2009.
Shindell, D. T., Chin, M., Dentener, F., Doherty, R. M., Faluvegi, G., Fiore, A. M., Hess, P., Koch, D. M., MacKenzie, I. A., Sanderson, M. G., Schultz, M. G., Schulz, M., Stevenson, D. S., Teich, H., Textor, C., Wild, O., Bergmann, D. J., Bey, I., Bian, H., Cuvelier, C., Duncan, B. N., Folberth, G., Horowitz, L. W., Jonson, J., Kaminski, J. W., Marmer, E., Park, R., Pringle, K. J., Schroeder, S., Szopa, S., Takemura, T., Zeng, G., Keating, T. J., and Zuber, A.: A multi-model assessment of pollution transport to the Arctic, Atmos. Chem. Phys., 8, 5353–5372, https://doi.org/10.5194/acp-8-5353-2008, 2008.
Sinha, P. R., Kondo, Y., Koike, M., Ogren, J. A., Jefferson, A., Barrett, T. E., Sheesley, R. J., Ohata, S., Moteki, N., Coe, H., Liu, D., Irwin, M., Tunved, P., Quinn, P. K., and Zhao, Y.: Evaluation of ground-based black carbon measurements by filter-based photometers at two Arctic sites, J. Geophys. Res.-Atmos., 122, 3544–3572, https://doi.org/10.1002/2016JD025843, 2017.
Sirois, A. and Barrie, L. A.: Arctic lower tropospheric aerosol trends and composition at Alert, Canada: 1980–1995, J. Geophys. Res.-Atmos., 104, 11599–11618, https://doi.org/10.1029/1999JD900077, 1999.
Stohl, A.: Characteristics of atmospheric transport into the Arctic troposphere, J. Geophys. Res., 111, D11306, https://doi.org/10.1029/2005JD006888, 2006.
Trenberth, K., Jones, P., Ambenje, P., Bojariu, R., Easterling, D., Klein Tank, A., Parker, D., Rahimzadeh, F., Renwick, J., and Rusticucci, M.: Observations: surface and atmospheric climate change. chap. 3 of Climate Change: The Physical Science Basis, in Contribution of Working Group I to the Fourth Assessment Report of the Intergovernmental Panel on Climate Change, edited by: Solomon, S., Qin, D., Manning, M., Chen, Z., Marquis, M., Averyt, K. B., Tignor, M., and Miller, H. L., 235–336, Cambridge Univ. Press, Cambridge, UK, New York, 2007.
van Marle, M. J. E., Kloster, S., Magi, B. I., Marlon, J. R., Daniau, A.-L., Field, R. D., Arneth, A., Forrest, M., Hantson, S., Kehrwald, N. M., Knorr, W., Lasslop, G., Li, F., Mangeon, S., Yue, C., Kaiser, J. W., and van der Werf, G. R.: Historic global biomass burning emissions for CMIP6 (BB4CMIP) based on merging satellite observations with proxies and fire models (1750–2015), Geosci. Model Dev., 10, 3329–3357, https://doi.org/10.5194/gmd-10-3329-2017, 2017.
Wang, H., Easter, R. C., Rasch, P. J., Wang, M., Liu, X., Ghan, S. J., Qian, Y., Yoon, J.-H., Ma, P.-L., and Vinoj, V.: Sensitivity of remote aerosol distributions to representation of cloud–aerosol interactions in a global climate model, Geosci. Model Dev., 6, 765–782, https://doi.org/10.5194/gmd-6-765-2013, 2013.
Wang, H., Rasch, P. J., Easter, R. C., Singh, B., Zhang, R., Ma, P. L., Qian, Y., Ghan, S. J., and Beagley, N.: Using an explicit emission tagging method in global modeling of source-receptor relationships for black carbon in the Arctic: Variations, sources, and transport pathways, J. Geophys. Res., 119, 12888–12909, https://doi.org/10.1002/2014JD022297, 2014.
Wang, Q., Jacob, D. J., Fisher, J. A., Mao, J., Leibensperger, E. M., Carouge, C. C., Le Sager, P., Kondo, Y., Jimenez, J. L., Cubison, M. J., and Doherty, S. J.: Sources of carbonaceous aerosols and deposited black carbon in the Arctic in winter-spring: implications for radiative forcing, Atmos. Chem. Phys., 11, 12453–12473, https://doi.org/10.5194/acp-11-12453-2011, 2011.
Yang, Y., Liao, H., and Lou, S.: Increase in winter haze over eastern China in recent decades: Roles of variations in meteorological parameters and anthropogenic emissions, J. Geophys. Res., 121, 13050–13065, https://doi.org/10.1002/2016JD025136, 2016.
Yang, Y., Wang, H., Smith, S. J., Easter, R., Ma, P.-L., Qian, Y., Yu, H., Li, C., and Rasch, P. J.: Global source attribution of sulfate concentration and direct and indirect radiative forcing, Atmos. Chem. Phys., 17, 8903–8922, https://doi.org/10.5194/acp-17-8903-2017, 2017a.
Yang, Y., Wang, H., Smith, S. J., Ma, P.-L., and Rasch, P. J.: Source attribution of black carbon and its direct radiative forcing in China, Atmos. Chem. Phys., 17, 4319–4336, https://doi.org/10.5194/acp-17-4319-2017, 2017b.
Yang, Y., Wang, H., Smith, S. J., Easter, R. C., and Rasch, P. J.: Sulfate aerosol in the Arctic: Source attribution and radiative forcing, J. Geophys. Res., 123, 1899–1918, https://doi.org/10.1002/2017JD027298, 2018a.
Yang, Y., Wang, H., Smith, S. J., Zhang, R., Lou, S., Qian, Y., Ma, P.-L., and Rasch, P. J.: Recent intensification of winter haze in China linked to foreign emissions and meteorology, Sci. Rep., 8, 2107, https://doi.org/10.1038/s41598-018-20437-7, 2018b.
Yang, Y., Wang, H., Smith, S. J., Zhang, R., Lou, S., Yu, H., Li, C., and Rasch, P. J.: Source apportionments of aerosols and their direct radiative forcing and long-term trends over continental United States, Earth's Future, 6, 793–808, https://doi.org/10.1029/2018EF000859, 2018c.
Yang, Y., Smith, S. J., Wang, H., Lou, S., and Rasch, P. J.: Impact of anthropogenic emission injection height uncertainty on global sulfur dioxide and aerosol distribution, J. Geophys. Res., 124, 4812–4826, https://doi.org/10.1029/2018JD030001, 2019a.
Yang, Y., Smith, S. J., Wang, H., Mills, C. M., and Rasch, P. J.: Variability, timescales, and nonlinearity in climate responses to black carbon emissions, Atmos. Chem. Phys., 19, 2405–2420, https://doi.org/10.5194/acp-19-2405-2019, 2019b.
Zamora, L. M., Kahn, R. A., Eckhardt, S., McComiskey, A., Sawamura, P., Moore, R., and Stohl, A.: Aerosol indirect effects on the nighttime Arctic Ocean surface from thin, predominantly liquid clouds, Atmos. Chem. Phys., 17, 7311–7332, https://doi.org/10.5194/acp-17-7311-2017, 2017.
Zhang, R., Wang, H., Fu, Q., Pendergrass, A. G., Wang, M., Yang, Y., Ma, P.-L., and Rasch, P. J.: Local radiative feedbacks over the Arctic based on observed short-term climate variations, Geophys. Res. Lett., 45, 5761–5770, https://doi.org/10.1029/2018GL077852, 2018.
Zhang, R., Wang, H., Fu, Q., Rasch, P. J., and Wang, X.: Unraveling driving forces explaining significant reduction in satellite-inferred Arctic surface albedo since the 1980s, P. Natl. Acad. Sci. USA, 116, 23947–23953, https://doi.org/10.1073/pnas.1915258116, 2019.
Zhao, C. and Garrett, T. J.: Effects of Arctic haze on surface cloud radiative forcing, Geophys. Res. Lett., 42, 557–564, https://doi.org/10.1002/2014GL062015, 2015.
Zheng, B., Tong, D., Li, M., Liu, F., Hong, C., Geng, G., Li, H., Li, X., Peng, L., Qi, J., Yan, L., Zhang, Y., Zhao, H., Zheng, Y., He, K., and Zhang, Q.: Trends in China's anthropogenic emissions since 2010 as the consequence of clean air actions, Atmos. Chem. Phys., 18, 14095–14111, https://doi.org/10.5194/acp-18-14095-2018, 2018.