the Creative Commons Attribution 4.0 License.
the Creative Commons Attribution 4.0 License.
 | 24 Jul 2020
The nitrogen budget of laboratory-simulated western US wildfires during the FIREX 2016 Fire Lab study
James M. Roberts
Chelsea E. Stockwell
Robert J. Yokelson
Joost de Gouw
Yong Liu
Vanessa Selimovic
Abigail R. Koss
Kanako Sekimoto
Matthew M. Coggon
Kyle J. Zarzana
Steven S. Brown
Cristina Santin
Stefan H. Doerr
Carsten Warneke
Reactive nitrogen (Nr, defined as all nitrogen-containing compounds except for N2 and N2O) is one of the most important classes of compounds emitted from wildfire, as Nr impacts both atmospheric oxidation processes and particle formation chemistry. In addition, several Nr compounds can contribute to health impacts from wildfires. Understanding the impacts of wildfire on the atmosphere requires a thorough description of Nr emissions. Total reactive nitrogen was measured by catalytic conversion to NO and detection by NO–O3 chemiluminescence together with individual Nr species during a series of laboratory fires of fuels characteristic of western US wildfires, conducted as part of the FIREX Fire Lab 2016 study. Data from 75 stack fires were analyzed to examine the systematics of nitrogen emissions. The measured Nr ∕ total-carbon ratios averaged 0.37 % for fuels characteristic of western North America, and these gas-phase emissions were compared with fuel and residue N∕C ratios and mass to estimate that a mean (±SD) of 0.68 (±0.14) of fuel nitrogen was emitted as N2 and N2O. The Nr detected as speciated individual compounds included the following: nitric oxide (NO), nitrogen dioxide (NO2), nitrous acid (HONO), isocyanic acid (HNCO), hydrogen cyanide (HCN), ammonia (NH3), and 44 nitrogen-containing volatile organic compounds (NVOCs). The sum of these measured individual Nr compounds averaged 84.8 (±9.8) % relative to the total Nr, and much of the 15.2 % “unaccounted” Nr is expected to be particle-bound species, not included in this analysis.
A number of key species, e.g., HNCO, HCN, and HONO, were confirmed not to correlate with only flaming or with only smoldering combustion when using modified combustion efficiency, , as a rough indicator. However, the systematic variations in the abundance of these species relative to other nitrogen-containing species were successfully modeled using positive matrix factorization (PMF). Three distinct factors were found for the emissions from combined coniferous fuels: a combustion factor (Comb-N) (800–1200 ∘C) with emissions of the inorganic compounds NO, NO2, and HONO, and a minor contribution from organic nitro compounds (R-NO2); a high-temperature pyrolysis factor (HT-N) (500–800 ∘C) with emissions of HNCO, HCN, and nitriles; and a low-temperature pyrolysis factor (LT-N) (<500 ∘C) with mostly ammonia and NVOCs. The temperature ranges specified are based on known combustion and pyrolysis chemistry considerations. The mix of emissions in the PMF factors from chaparral fuels (manzanita and chamise) had a slightly different composition: the Comb-N factor was also mostly NO, with small amounts of HNCO, HONO, and NH3; the HT-N factor was dominated by NO2 and had HONO, HCN, and HNCO; and the LT-N factor was mostly NH3 with a slight amount of NO contributing. In both cases, the Comb-N factor correlated best with CO2 emission, while the HT-N factors from coniferous fuels correlated closely with the high-temperature VOC factors recently reported by Sekimoto et al. (2018), and the LT-N had some correspondence to the LT-VOC factors. As a consequence, CO2 is recommended as a marker for combustion Nr emissions, HCN is recommended as a marker for HT-N emissions, and the family NH3 ∕ particle ammonium is recommended as a marker for LT-N emissions.
- Article
(5755 KB) - Full-text XML
-
Supplement
(2694 KB) - BibTeX
- EndNote


Wildfires have severe impacts on the chemistry of the atmosphere from local to global scales (Crutzen and Andreae, 1990). A warmer, drier climate in western North America, coupled with policies that have allowed buildup of fuels in forest ecosystems has led to increases in frequency and severity of wildfires in this region (Abatzoglou and Williams, 2016; Westerling et al., 2006). The new strategy for management of wildfire in the US is to allow fire where possible and to fight fire where needed (D. C. Lee et al., 2014). The science behind making these decisions and understanding their consequences involves, in part, a better understanding of the emissions from wildfires. The NOAA FIREX (Fire Influence on Regional and Global Environments Experiment) Fire Lab experiment was conducted in the fall of 2016, at the US Forest Service Fire Sciences Laboratory in Missoula, Montana, to acquire detailed measurements of particle and gas-phase emissions from fires involving fuels characteristic of the western US (NOAA, 2020a). Several aspects of these measurements dealing with VOC species and individual reactive nitrogen species (Nr, defined as all nitrogen compounds except for N2 and N2O) have already been published (Koss et al., 2018; Manfred et al., 2018; Sekimoto et al., 2018; Selimovic et al., 2018; Zarzana et al., 2018), including emissions factors for many of the Nr species (Koss et al., 2018).
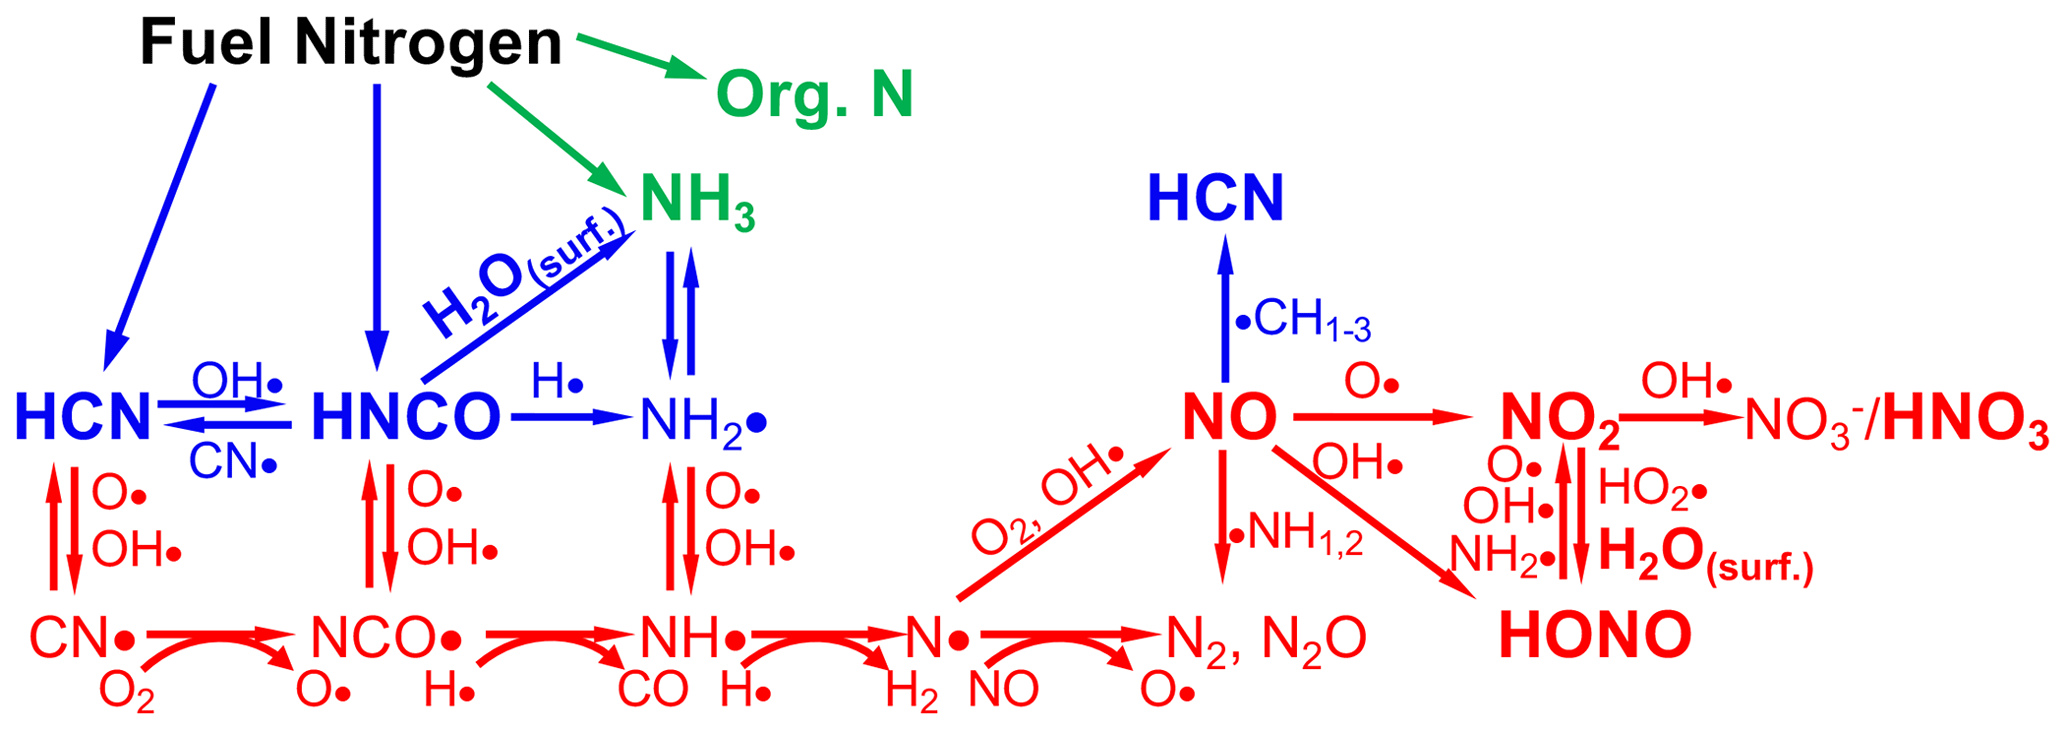
Figure 1Schematic of the combustion chemistry of the small molecules that are emitted from BB and represent sources and sinks of reactive nitrogen (Nr), adapted from Glarborg et al. (2018), Lobert and Warnatz (1993), Lucassen et al. (2012), and Manion et al. (2015). H2O(surf) denotes the combination of H2O and a surface to facilitate the reaction. Red color indicates the highest temperature (combustion) processes; blue indicates intermediate temperature processes, and green indicates the lowest temperature processes. The species that are measured in this work are shown in bold and slightly larger text.
The Nr compounds emitted by natural-convection biomass burning (BB) arise solely from the N in the fuels, since the combustion temperatures are not high enough (<1200 ∘C) to produce oxides of nitrogen (NOx) from N2 and O2 (the so-called Zeldovich or thermal nitrogen cycle) (Lobert and Warnatz, 1993; Taylor et al., 2004; Wotton et al., 2012). The fuel nitrogen cycles that pertain to BB flaming combustion are shown schematically in Fig. 1 (Glarborg et al., 2018; Lobert and Warnatz, 1993; Lucassen et al., 2012; Manion et al., 2015). Note that the equations shown in Fig. 1 are meant to indicate the general flow of the chemistry and do not always convey the mechanistic subtleties of the reactions, which are fully covered in specialized references (Glarborg et al., 2018; Manion et al., 2015). Nr compounds are emitted as small molecules, hydrogen cyanide (HCN), isocyanic acid (HNCO), and ammonia (NH3) resulting from pyrolysis of the fuel, with minor contributions from larger N-containing organic species, especially at lower temperatures. Flame chemistry converts those species to N2, N2O, nitric oxide (NO), nitrogen dioxide (NO2), and nitrous acid (HONO) as a result of radical chemistry. It has been recognized for some time that a significant amount of denitrification (conversion of Nr compounds to N2) occurs due to reactions of NO with NHi (where i=1, 2, or 3) or N atoms, as confirmed experimentally (Kuhlbusch et al., 1991). While N atoms are also intermediates in the thermal NOx cycle, and the reaction figures in to both the fuel and thermal NOx cycles, the second reaction of the thermal NOx cycle, , is too slow at BB flame temperatures to result in NOx production (Manion et al., 2015). In addition to the small molecules shown in Fig. 1, numerous Nr compounds are emitted in roughly the following categories: amides, amines, heterocyclic compounds, nitriles, isocyanates, and nitro compounds (Andreae, 2019; Andreae and Merlet, 2001; Koss et al., 2018; Lobert et al., 1991, 1990; Lobert and Warnatz, 1993; Stockwell et al., 2015). These compounds are produced at much lower abundance from fuel pyrolysis and partial reactions with the radical species in Fig. 1.
The emissions of N compounds from BB and wildfires in general have been the subject of considerable research. Early studies by Lobert et al. (1990, 1991) and Lobert and Warnatz (1993) measured a wide range of Nr compounds in laboratory fires and suggested that considerable denitrification (conversion of fuel nitrogen to N2) was taking place, a process later confirmed in experiments described by Kuhlbusch et al. (1991). Subsequent work on laboratory fires has better-defined particle-phase nitrogen emissions (McMeeking et al., 2009) and led to the recognition of the importance of several inorganic Nr species, such as HONO and HNCO (Burling et al., 2010; Roberts et al., 2011; Veres et al., 2010), and the presence of a wider variety of organic Nr species (Gilman et al., 2015; Stockwell et al., 2015; Warneke et al., 2011). A number of studies have sought to summarize both real-world and laboratory emissions of Nr compounds (Akagi et al., 2011; Andreae, 2019; Andreae and Merlet, 2001; Coggon et al., 2016; Yokelson et al., 2013b, 2009). The known N compounds range in oxidation state from NH3 to HNO3 and include N2 and N2O. Among the more prominent and important Nr species are the following: NOx (NO and NO2), which is a key player in the atmospheric oxidant cycle; NH3, which has a major role in particle formation; HONO, which can be an important radical source; HCN and acetonitrile (CH3CN), which are toxic at high concentrations and represent valuable tracers for following fire transport; and isocyanates, HNCO and methyl isocyanate (CH3NCO), which have unique health impacts (Roberts et al., 2011). In addition, nitro (R-NO2) or nitrogen heterocyclic compounds may contribute to so-called brown carbon, aerosol organic compounds exhibiting optical absorption in the near-UV or blue wavelength regions. Wildfire N emissions also have very minor contributions from gas-phase nitric acid (HNO3). Nitric acid is either not efficiently produced by BB or readily incorporated into aerosol if it is produced in fresh wildfire plumes, as is clear from the absence of HNO3 enhancements in several studies of BB plumes (Liu et al., 2016; Yokelson et al., 2009; Alvarado et al., 2010); however nitrate () has been shown to contribute to aerosol mass particularly for inefficient combustion (May et al., 2014). Flame chemistry is inefficient in forming N2O, relative to the pathways that form N2 (Andreae, 2019; Andreae and Merlet, 2001; Griffith et al., 1991; Hao et al., 1991). The modeling of the emissions of these N compounds on a large scale could benefit from a better understanding of the total budget of these species as a function of fuel nitrogen content and the dependence of the individual species on fuel type and combustion conditions.
The construction of Nr budgets in this work is made possible by the inclusion of a total reactive nitrogen measurement (termed Nr herein), a method by which all nitrogen compounds besides N2 and N2O are converted to NO and detected by NO–O3 chemiluminescence. This technology has been developed by a number of groups, typically using precious metal or NiCr catalysts that have been shown to convert all Nr compounds to NO (and to some extent NO2) at high temperatures (750–825 ∘C) (Hardy and Knarr, 1982; Kashihira et al., 1982; Marx et al., 2012; Roberts et al., 1988). There are also commercial instruments that incorporate this technology (see for example Thermo Scientific Model 17i). This technique has been applied to gas-phase atmospheric measurements, principally to measure NH3 by difference techniques (Saylor et al., 2010; Schwab et al., 2007), and has also been used to observe wildfire plumes that have impacted ambient air measurements (Benedict et al., 2017; Prenni et al., 2014). We have recently developed a platinum/molybdenum oxide Nr catalyst system and confirmed that it quantitatively converts Nr compounds including all particle-bound nitrogen compounds (Stockwell et al., 2018). To our knowledge this technique has not been applied directly to BB emissions before.
This paper describes the total reactive nitrogen and individual Nr compound measurements made during the Fire Lab 2016 experiment, with the intent of providing information that can be used for analysis and modeling of the impact of wildfire emissions on the atmosphere. The total Nr measurements are combined with CO2, CO, and VOC measurements and fuel, residue, and ash C and N content to estimate the amount of N lost to N2 and N2O. In addition systematics of the ratio Nr ∕ total carbon are examined for simplifying relationships. Fire-integrated Nr is then compared to fire-integrated measurements of individual compounds to determine the fraction of unaccounted-for Nr. The systematic behavior of individual Nr species and their fractional contribution to Nr are examined with respect to fuel type, N content, and combustion processes. A positive matrix factorization (PMF) technique is used to examine commonalities between fires of different fuels under different conditions and compared to the PMF analysis of the VOC emissions published by Sekimoto et al. (2018). The results are used to arrive at suggested guidelines that can be used estimate Nr emissions profiles for fires representative of western North America.
Table 1Nitrogen compounds observed in the FIREX Fire Lab 2016 Study.
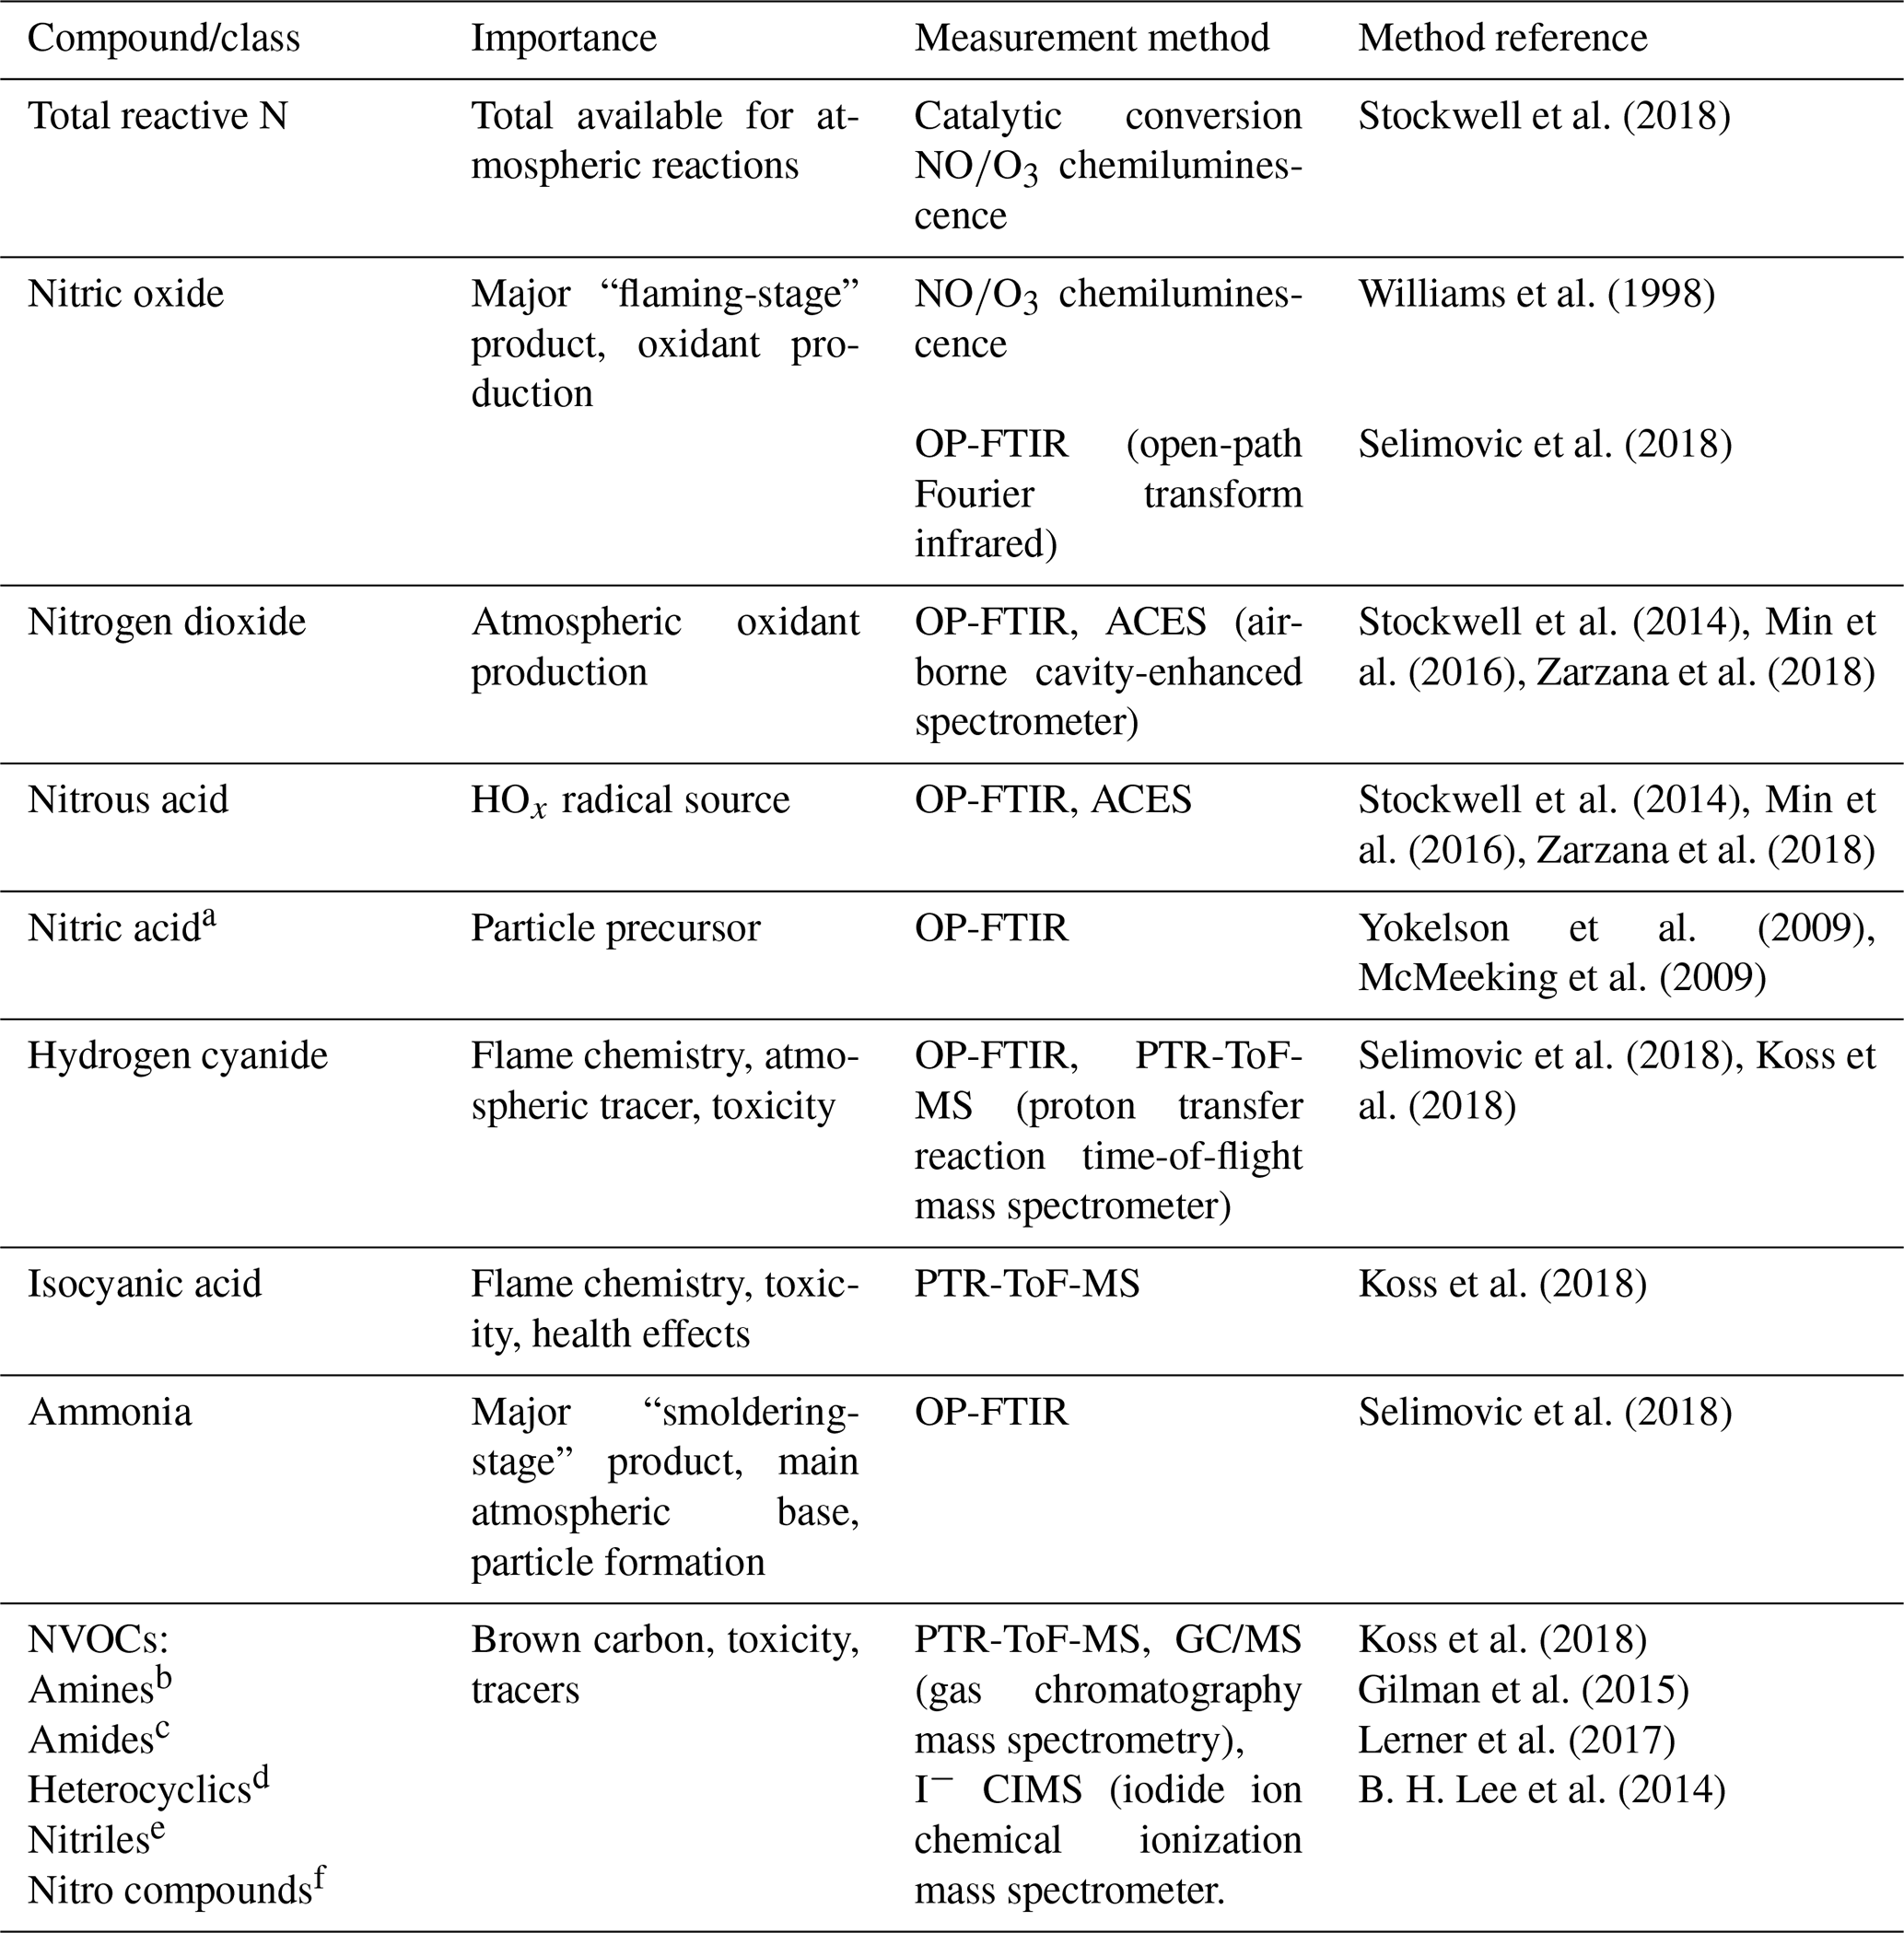
a The OP-FTIR has a 10 ppbv detection for gas-phase HNO3, but
HNO3 was not observed above detection limit.
b Ethylamine, methanimine, propeneamine, sulfinylmethanamine,
trimethylamine, buteneamines.
c Formamide, acetamide, methylmaleimide.
d C2-pyrroles, dihydropyridine, ethynylpyrrole, methylpyridine,
methylpyrrole, pyridinealdehyde, 4-pyrindinol, vinylpyridine.
e Acetonitrile, acrylonitrile, benzonitrile, butanenitrile, butynenitrile,
benzoacetonitrile, C7 acrylonitrile, C8-nitriles, heptylnitrile,
furancarbonitrile, methylbenzoacetonitrile, pentylnitriles, propanenitrile,
propynenitrile, butenenitrile, methylisocyanate.
f Butenenitrates, nitrobenzene, nitroethane, nitroethene, nitrofuran,
nitromethane, nitropropanes, nitrotoluene.
The Fire Lab 2016 study involved laboratory burns of fuels mostly characteristic of western North American wildfires such as coniferous fuels and chaparral fuels (important in central to southern California and the southwestern US). We also measured some that have global significance such as Indonesian peat and yak dung (important in areas above timberline or where wood is scarce, such as India, Nepal, and Tibet). The procedures and associated details of the study have been described previously by Selimovic et al. (2018) and will be only briefly summarized here. The detailed data on fuel types, amounts, and composition can be found in Table S1 in the Supplement and in the Supplement of Selimovic et al. (2018). The laboratory burns involved fuel samples, ranging in mass from 0.26 to 6.02 kg spread out on a fuel bed roughly 1 m×1 m square. Fires were started without the addition of any contaminants, using an electric igniter (a series of NiCr heating elements that were flash-heated electrically), and typically lasted from approximately 5 to 30 min. Seventy-five fires were conducted in the “stack” burn configuration where the smoke was directed up the central stack of the facility where it could be sampled simultaneously by all the instruments that measured gas-phase species and some of the particle-phase measurements. The sampling platform was about 15 m above the fire, and the sampling took place in well-mixed smoke approximately 5 s after emission (Christian et al., 2003). Thirty-one additional fires were conducted as “room” burns on most of the same fuels, when the stack was closed and the room was allowed to fill with smoke, permitting sampling to be done over the course of several hours. The following analyses will focus on the stack burns, as those measurements had little or no interferences from surfaces, where room burns are known to be compromised by the loss of materials, such as NH3, to the room walls at long sample times (Stockwell et al., 2014). Ash analyses were performed only on the residues from the room burns, and those values will be used for the N and C budget calculations, with the assumption that stack and room burns left similar ash, considering the combustion conditions were the same for each type of fire. Table 1 lists the compounds and associated techniques used to measure them during the Fire Lab 2016 study and describes the grouping of NVOCs measured by a proton transfer reaction time of flight mass spectrometer (PTR-ToF-MS) into common categories, e.g., amines, nitriles, etc. We specifically note that the OP-FTIR is capable of measuring gas-phase HNO3 with comparatively good sensitivity (10 ppbv detection limit in fires where Nr can be 5 ppmv or more), but HNO3 was not observed above detection limit in any of the fires.
2.1 Nr and NO measurements by chemiluminescence
Total reactive N (Nr) was measured by catalytic conversion to NO, followed by O3 chemiluminescence using an instrument described previously (Williams et al., 1998). Nr and NO were sampled from inlets inserted adjacent to the inlet-less open-path Fourier transform infrared spectrometer (OP-FTIR) instrument path during the stack burns (Selimovic et al., 2018) and from a platform approximately 4 m off the floor in the middle of the room during the room burns. The catalyst used for the Nr channel, described in detail by Stockwell et al. (2018), consisted of a 11 mm i.d. quartz tube, packed with 36 platinum screens, heated to 750 ∘C. This tube was wrapped with high-temperature heating tape and insulated inside a 7 cm o.d. stainless steel tube that was fitted to a bulkhead placed through the wall of the stack. The Nr channel was diluted by a factor of 5:1 (±3 %) using a flow of zero air added immediately downstream of the Pt catalyst assembly. NO was sampled through a 6.3 mm o.d. stainless steel inlet tube, which was placed through the bulkhead directly into the free air stream of the stack and connected to a 50 mm Teflon filter holder immediately outside the stack. The transfer lines for the Nr and NO measurements consisted of 6.35 mm o.d., 1 mm wall thickness PFA tubing of approximately 20 m in length. Nr and NO data were acquired at 1 s frequency, but the flow rate through each inlet was 1 SL min−1, resulting in residence time in each inlet of 14 s. This time delay was corrected in the data analysis. Any chemical effects of the inlet on the sampled air stream were negligible since the analytes consisted of only NO and NO2, and those are known to be transmitted by PFA Teflon tubing with essentially no surface effects. However, there were possible effects of the inlets on the temporal features of the measurement through diffusion or turbulent mixing. Those effects were examined through comparison of the temporal variations in the NO signal with the NO measured by the OP-FTIR and comparison of the Nr signal under smoldering conditions with the NH3 measured by the OP-FTIR. Both of these comparisons showed that the NO and Nr inlets had effective time constants of 4 s, somewhat slower than the diffusive relaxation time assuming solely laminar flow. Examples of the estimate of diffusion and dispersion on NO and Nr signals and the estimate of the effective time constant of these measurements are presented in the Supplement.
The inlet streams were sampled by the NO instrument either directly (NO channel) or after passing through a second catalyst of molybdenum oxide (MoOx) to convert remaining NO2 to NO. The MoOx catalyst consisted of a molybdenum tube at 350 ∘C to which a small flow of H2 (0.8 % v∕v) was added to control the redox state of the surface. Both channels of the instrument were “detuned” to keep raw photon count rates below 4 MHz, by turning down the O3 flows and photo-multiplier tube (PMT) voltages. Calibrations were performed with both a NO standard in N2 (Scott-Marrin) and 10.1 ppmv standard of HCN in nitrogen (Gasco). The Pt catalyst was dismounted from the stack (or room) every few days and checked for conversion efficiency by the addition of the HCN standard to the inlet. Conversion efficiencies were found to be consistently high (>98 %) throughout the entire sampling period (5 October–12 November 2016). There were slight background signals (a few tens of ppbv) for both NO and Nr in both the stack and room air prior to and after the burns, and those were subtracted from the fires' signals prior to reporting the data. The overall uncertainties in the NO and Nr data were ±10 % for each measurement.
2.2 Other measurements
Measurements of individual species during the 2016 Fire Lab study have been presented in several previous publications. The OP-FTIR measurements were discussed by Selimovic et al. (2018), and the PTR-ToF measurements were discussed by Koss et al. (2018). In addition, some of the calibration methods and GC separation and identifications rely on additional analytical work presented by Sekimoto et al. (2017) and Gilman et al. (2015). We measured the mass and elemental content of the initial fuel and the mass of unburned fuel for all the fires, and we measured the mass and the elemental content of the ash during 21 room burns, which covered all the fuel types discussed.
2.3 PMF analysis
Trace gas measurements from multiple instruments involved in the Fire Lab study were combined and analyzed using positive matrix factorization (PMF). PMF is a numerical method that was used in this case to partition the compounds involved in a time-varying mixture of chemicals into a few groups, or “factors”, where a compound can appear in more than one factor. A factor represents a consistent profile of compounds that is representative of one of the sources contributing to the total signal. The sum of all the factors then ideally describes the total composition of the measurements, which in this case is the emissions of Nr compounds. By its nature, PMF assumes that the total signal is a linear combination of individual sources that have a consistent composition, the relative contribution of which is represented by the amount of each compound or category found in each factor (Paatero and Tapper, 1994; Ulbrich et al., 2009). We hypothesize that species with dominant fractions in the same factor are related to each other via the same formation processes. With knowledge of factor composition and the amount of each factor at any given time, the original emissions measurements can be reconstructed, and this approach provides an alternate source of profiles for fire emissions. PMF has also been used by a number of groups to explore how much various source profiles contribute to complex ambient measurements (see for example Ulbrich et al., 2009) and was recently used to analyze PTR-ToF-MS measurements from the Fire Lab (Sekimoto et al., 2018). Here, PMF was accomplished using the PMF Evaluation Tool v. 2.08A (Ulbrich et al., 2009).
Table 2Compounds and compound classes used in the PMF analyses and their corresponding errors.
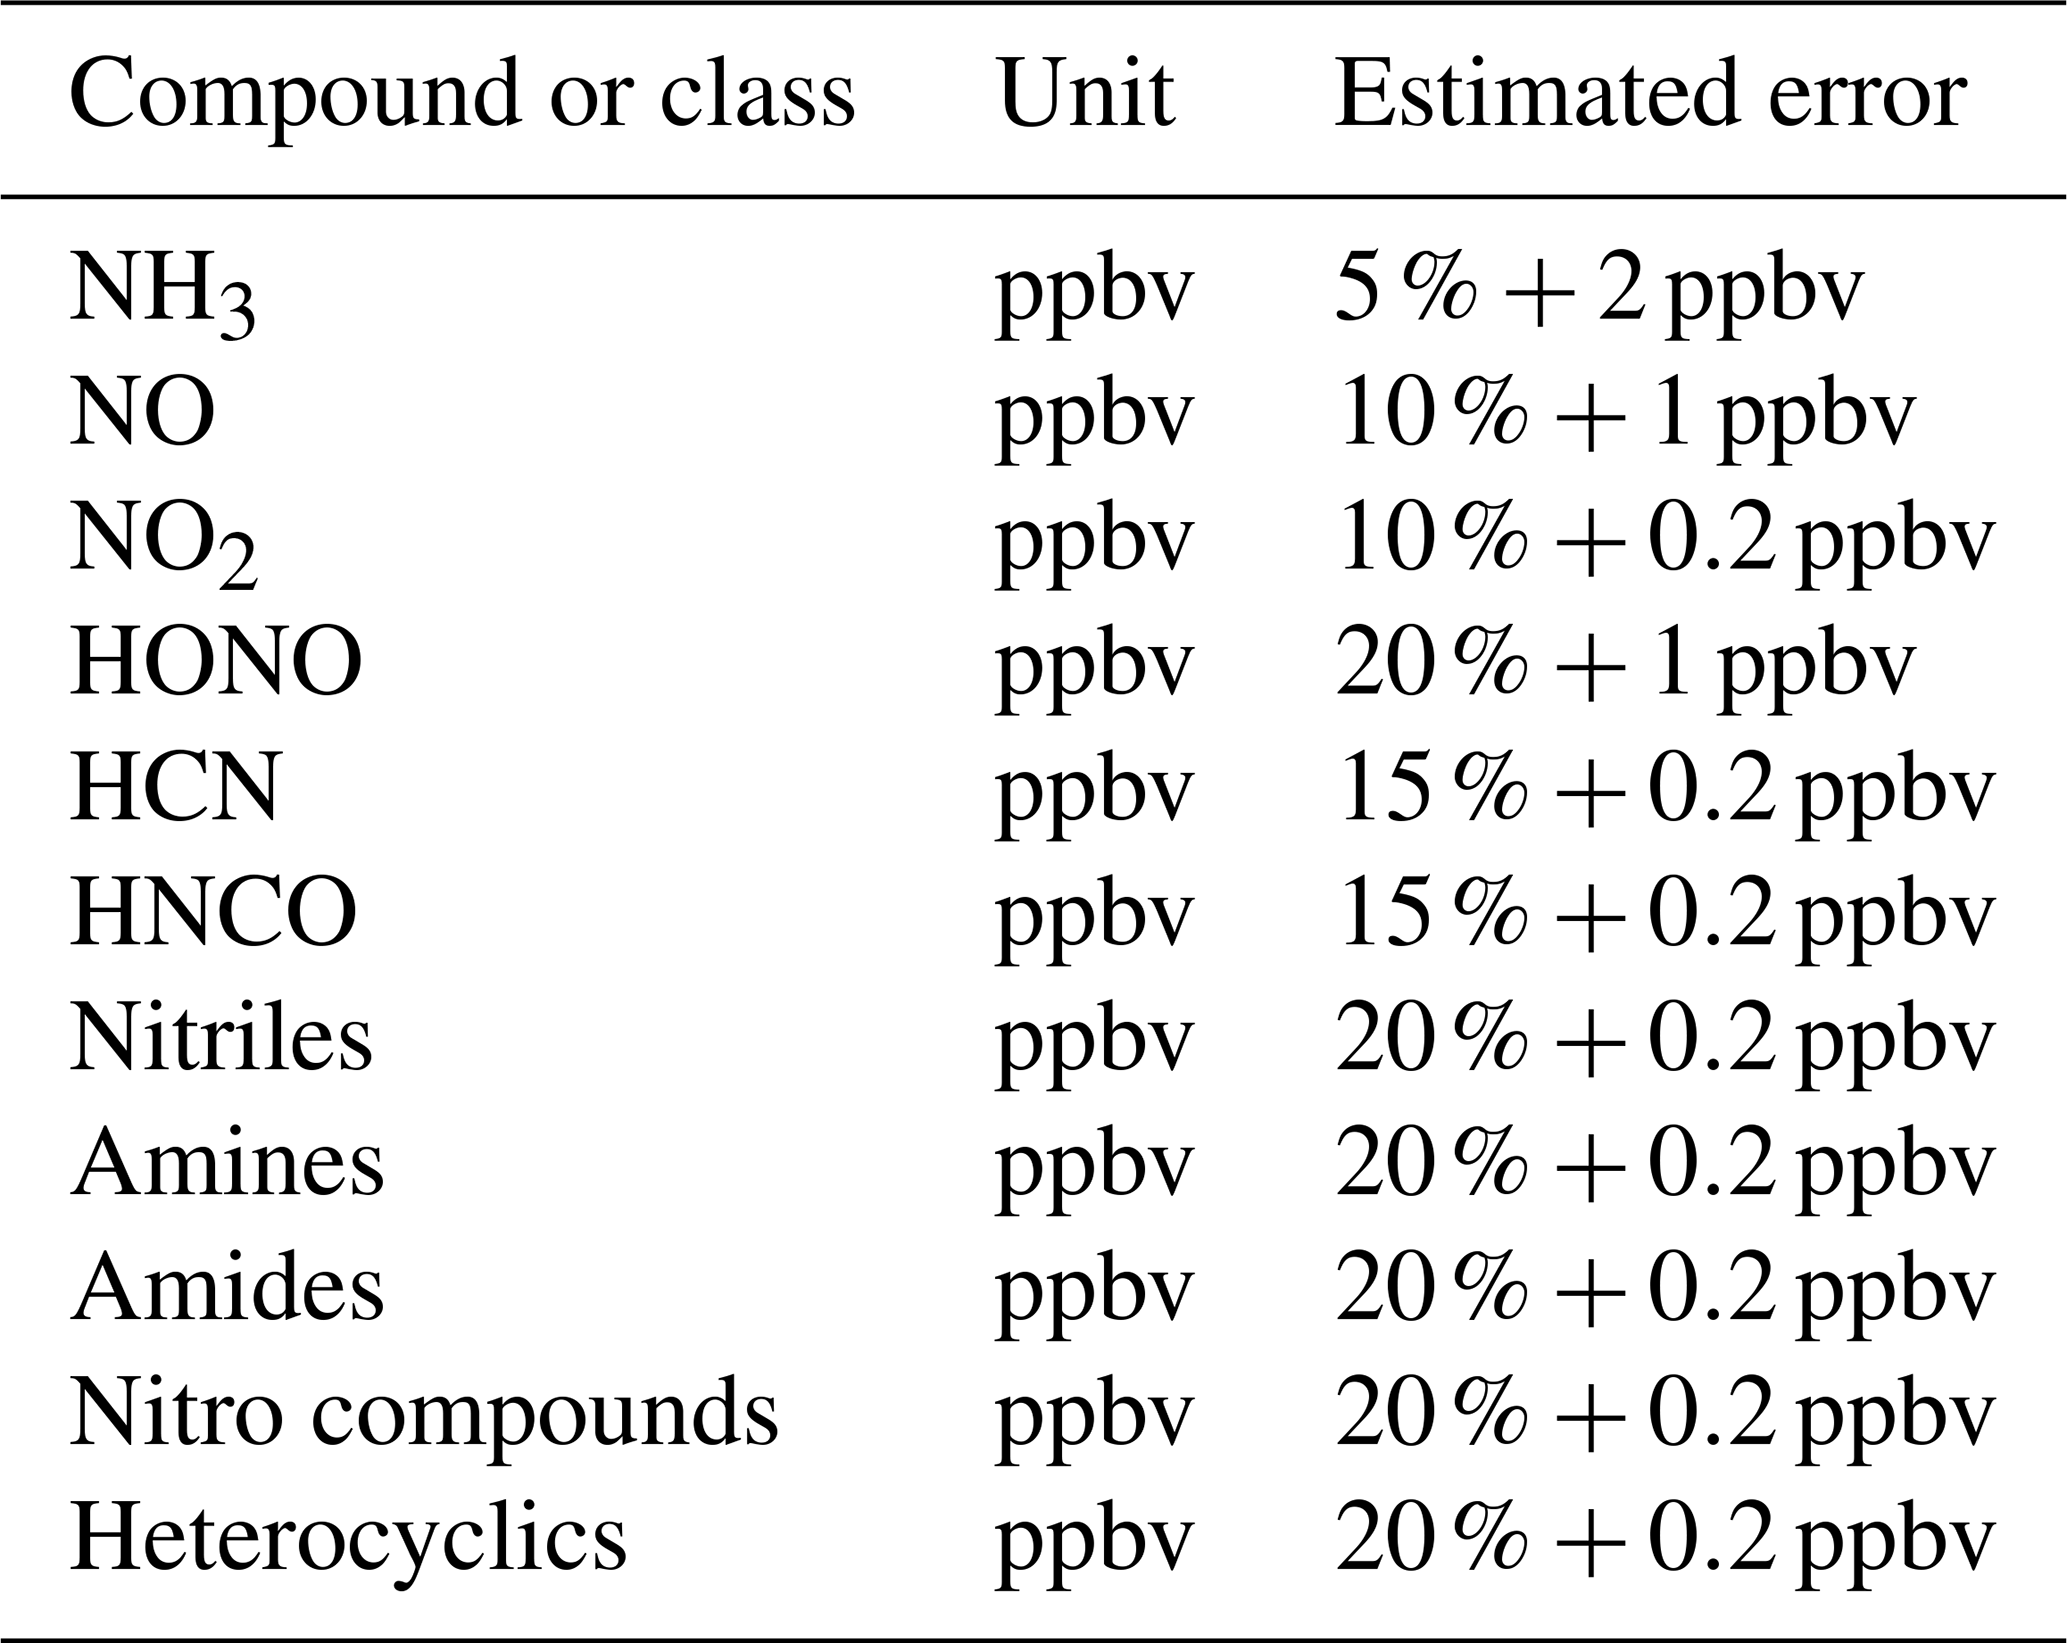
The application of PMF to this data set is different than the instances where it is applied to data from a single instrument in which compound abundances are inherently scaled properly and error estimates are well defined and self-consistent. For example, when applied to mass spectral data from a single instrument, errors can be expected to scale as the square root of ion counts based on fundamental counting statistics (Sekimoto et al., 2018). In this work we are including nitrogen measurements from several instruments, and thus we chose to use mixing ratios as the unit of comparison. The error estimates required by the PMF analysis were taken from the reported combined uncertainties: the sum of the detection limit plus the estimated random error of the measured value. For example, the uncertainty in a NO mixing ratio of 500 ppbv was ±51 ppbv. The variables that were used in this PMF analysis and their units and corresponding errors are listed in Table 2. Where compound categories are specified (e.g., nitriles), the values were the sum of the measured compounds in that category as listed in the footnotes of Table 1. The data were further adjusted by subtracting the ambient air background before and after the fires, which was a relatively minor adjustment for most compounds and categories. Any negative numbers that resulted were very small compared to the fire emissions and were set to zero. In addition to the PMF analysis for the species listed in Table 2, several exploratory runs were tried with CO2, CO added (in units of ppmv), and total Nr (in units of ppbv) added to the list in Table 2. No significant differences were observed in the results for individual Nr compounds and classes, so CO2, CO, and total Nr were not included in this analysis.
We applied PMF to single-fire data as well as extended time series that included all fires of a particular fuel type, in line with the approach laid out by Sekimoto et al. (2018). By consolidating fuels from a particular vegetation type, the fire-to-fire variability largely driven by differences in the fuel (e.g., moisture content, structure, quantity) is constrained and the most representative fire conditions are captured. Two fuel groups were analyzed in this way: the western US coniferous ecosystem fuels, which included ponderosa pine, lodgepole pine, Douglas fir, Engelmann spruce, and subalpine fir, and the southwestern US chaparral ecosystem, which was represented by chamise and manzanita. The consolidated time series for the coniferous ecosystems included realistic mixtures, canopy only, and litter only, while duff and rotten logs were analyzed separately and not included in the time series.
The measurements of total Nr can be combined with N and C measurements of fuel and ash to estimate N lost to N2 and N2O. The total Nr emitted from laboratory fires combined with individual N compound measurements allow us to construct a budget for Nr species that define what the dominant forms of N are and how those emissions depend on other fire parameters or different temperature combustion processes. The systematics of N emissions found by PMF are compared to other fire indicators, and PMF analyses previously conducted on VOCs allow the formulation of simplifying relationships that can be used in atmospheric models of wildfires.
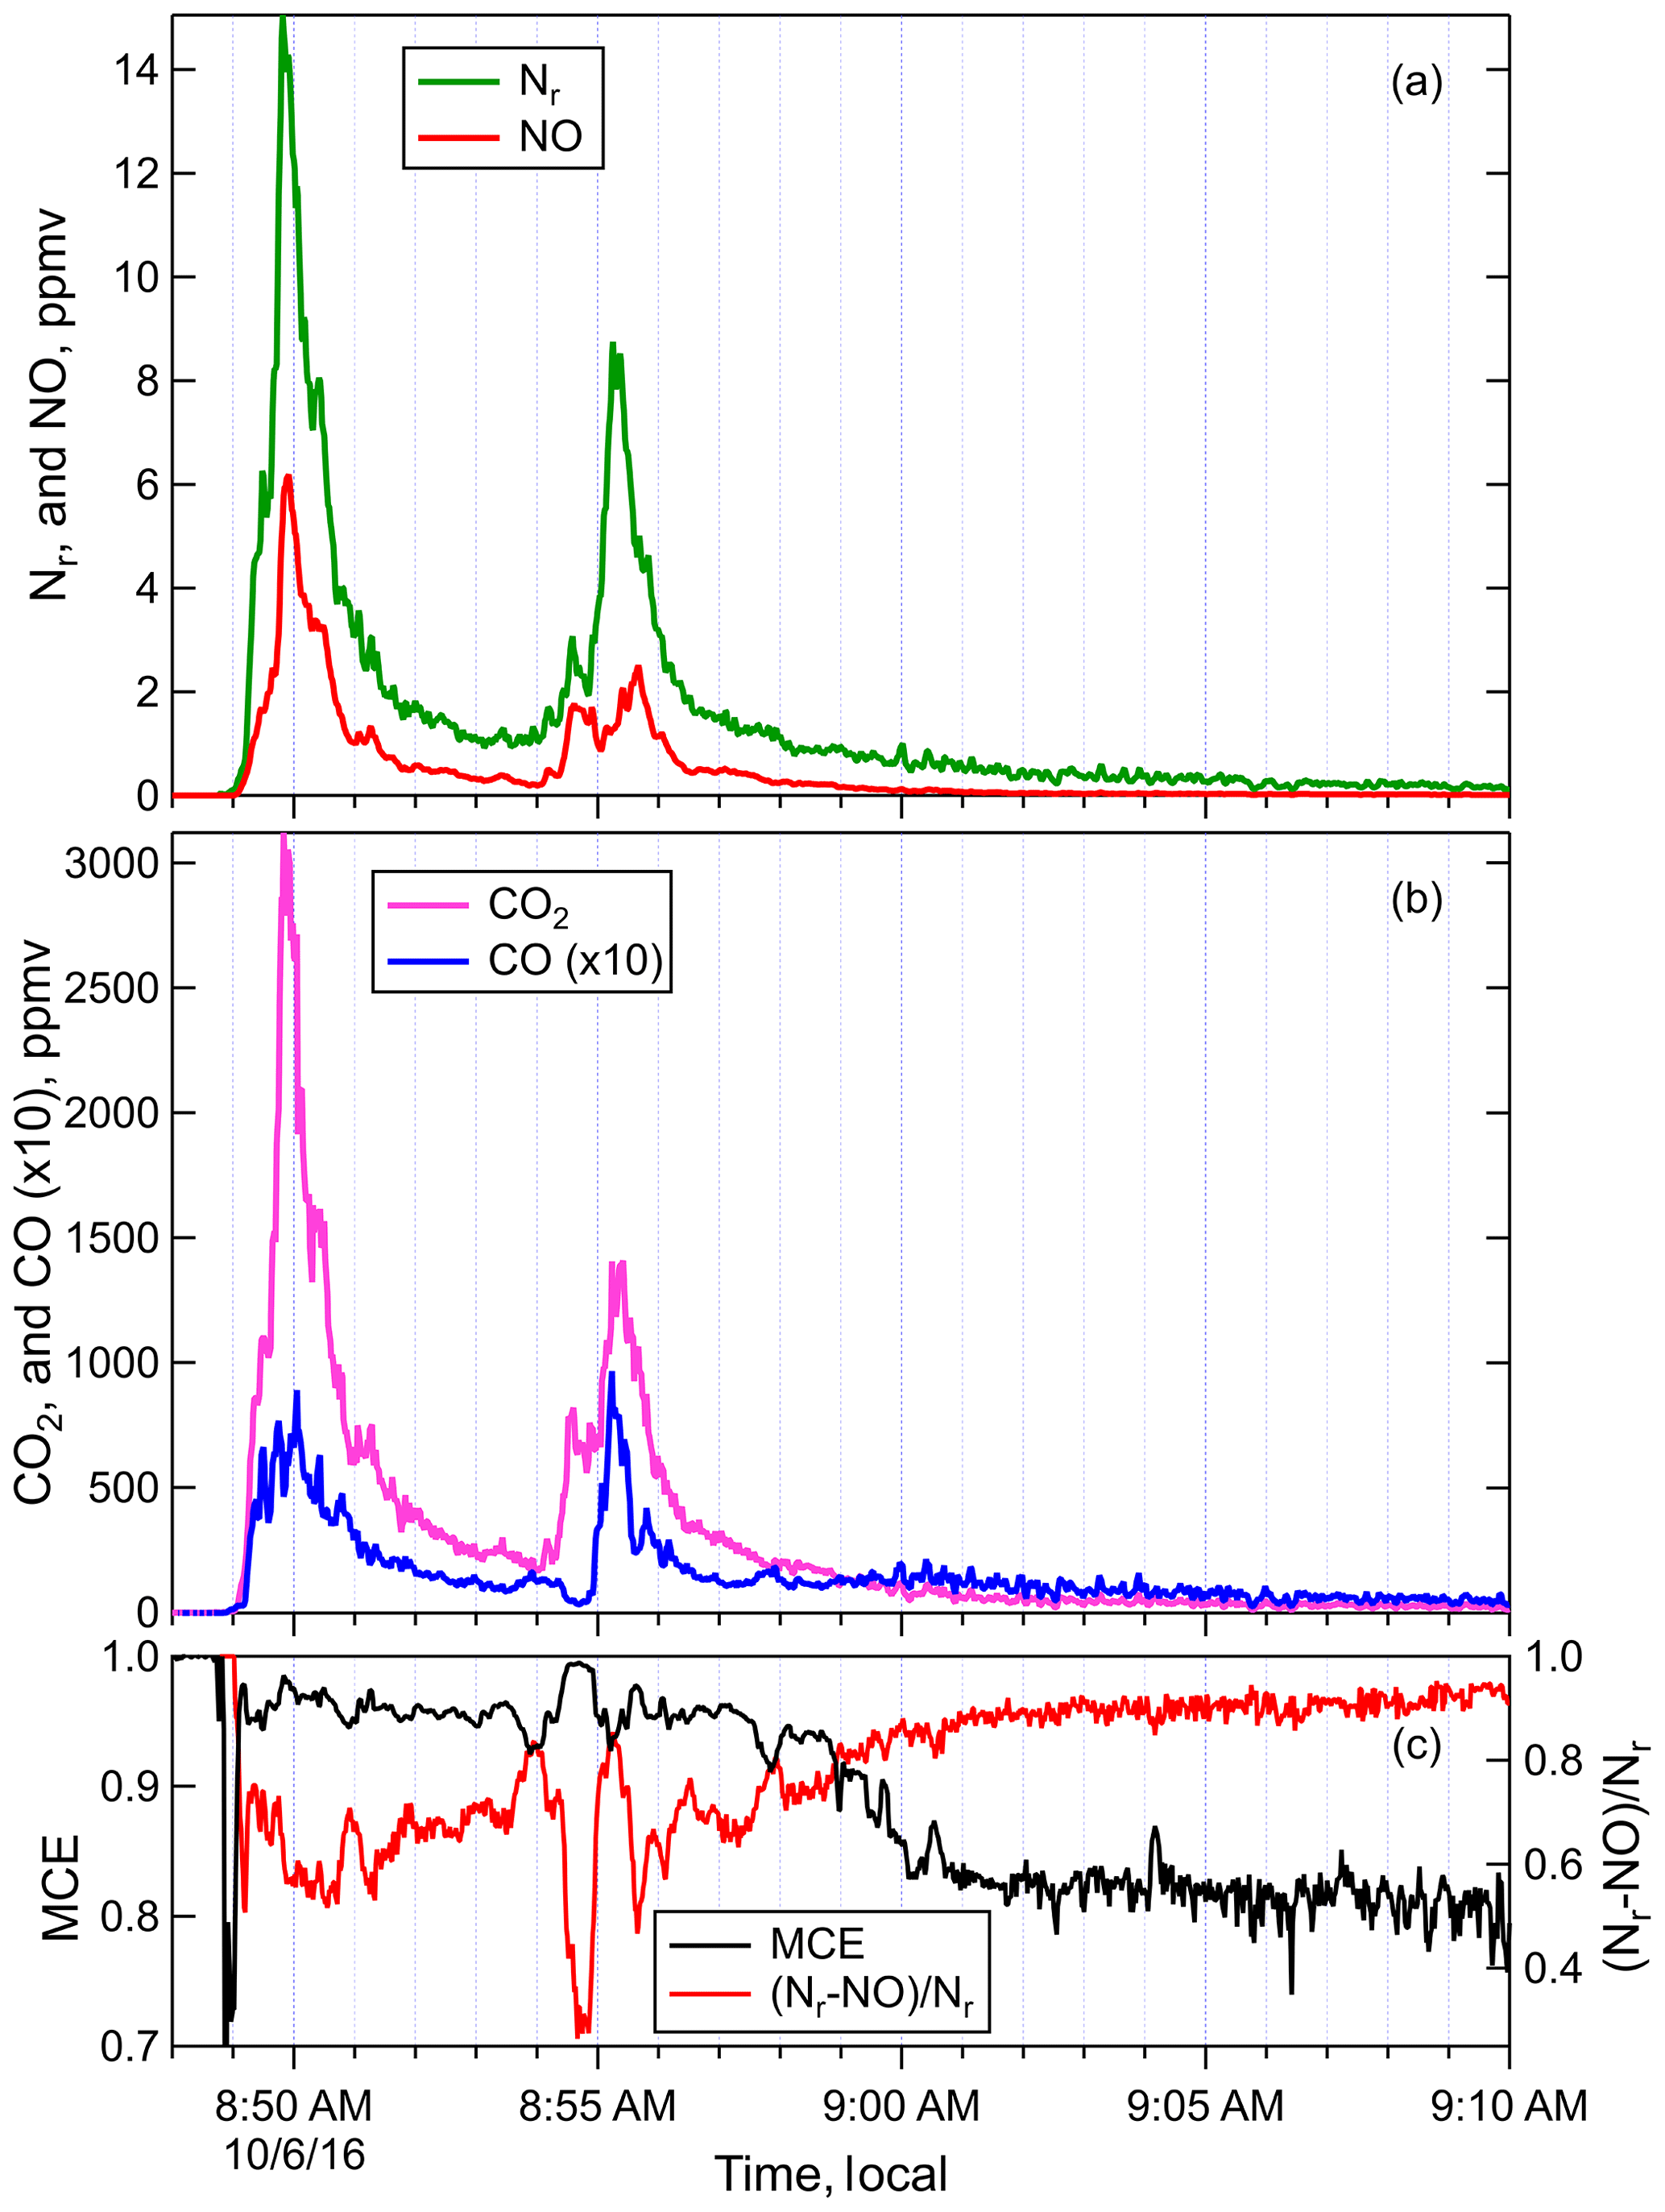
Figure 2Timelines of the (a) Nr and NO, (b) ΔCO2 andΔCO, and (c) MCE and (Nr−NO) ∕ Nr measured during Fire 004, a ponderosa pine realistic mix sample. Note that ΔCO is plotted at ×10 the measured abundance for clarity.
3.1 Comparison of Nr and total carbon in fire emissions
The total Nr and total carbon emissions were measured for 75 stack fires in order to place the N emissions in the context of total carbon, which has been widely estimated for wildfires. Example time series of NO, Nr, ΔCO, and ΔCO2 (CO and CO2 corrected for their backgrounds) are shown in Fig. 2, for a fire burning a sample of ponderosa pine realistic mix (Fire 004). In addition to the chemical species, the modified combustion efficiency (MCE) was also plotted. MCE is defined as
where ΔCO2 and ΔCO are the CO2 and CO levels above the ambient. MCE has traditionally been used to indicate the relative amount of flaming and smoldering combustion in a fire. The time series for Fire 004 (Fig. 2) shows a short initial smoldering/distillation phase (MCE 0.7 to 0.8) as heat pyrolyzes the fresh fuel and releases VOCs from existing pools in the fuel, followed after ignition by a relatively efficient mix of flaming and smoldering combustion (MCE 0.95 to 0.98) and then finally a subsequent period of essentially pure smoldering (MCE ∼0.80). The Nr and NO timelines had many features in common because NO is often the most abundant Nr compound (see below). As a result, it is useful to compare the quantities Nr−NO and (Nr−NO) ∕ Nr to the other measures of chemical species or combustion efficiency. As expected, (Nr−NO) ∕ Nr, in Fig. 2c is anticorrelated with MCE since Nr is primarily NO at high MCE. In addition to the anticorrelation, this non-NO fraction, like its approximate carbon analog CO∕CO2, has a wider dynamic range than MCE and will often suffer less from background variability than carbon-based indices (Yokelson et al., 2013a).
The concentration profiles of the background-corrected measurements of Nr, CO2, CO, and all the carbon-containing species measured by the FTIR (Selimovic et al., 2018) during the stack burns were integrated over the entire time of the burn to obtain total carbon, termed TC here, and total Nr. The additional carbon species included methane and a number of other gas phase VOCs as well as organic- and black-carbon aerosol. Altogether these carbon species should account for ≥98 % of emitted carbon (McMeeking et al., 2009). Total Nr is plotted in Fig. 3, versus TC (Fig. 3a) and versus nitrogen burned, which is calculated from the %N in the fuel times the mass of fuel consumed (Fig. 3b). The points in Fig. 3 are colored by the fuel N∕C mole % obtained from the elemental analysis of each fuel. The relationship between Nr and TC in Fig. 3a clusters around the 0.37 % line, and those points are from fuels most characteristic of the North American biomes impacted by wildfire. There are clear outliers in the correlation of Nr and TC; for example, yak dung and two samples of duff (Engelmann spruce and subalpine fir) were high due to the fact that they either have high fuel N∕C ratios (dung; see Table S1 in the Supplement) or burned with minimal flaming (whole-fire MCEs 0.86–0.89, duff and dung), hence experienced less denitrification. The fuels that were low in Nr∕TC in Fig. 3a, ponderosa pine rotten log, subalpine fir, and excelsior, had low fuel N∕C, so when plotted versus nitrogen burned in Fig. 3b, they cluster with the main group of characteristic fuels, i.e., they are no longer “outliers” in the distribution.
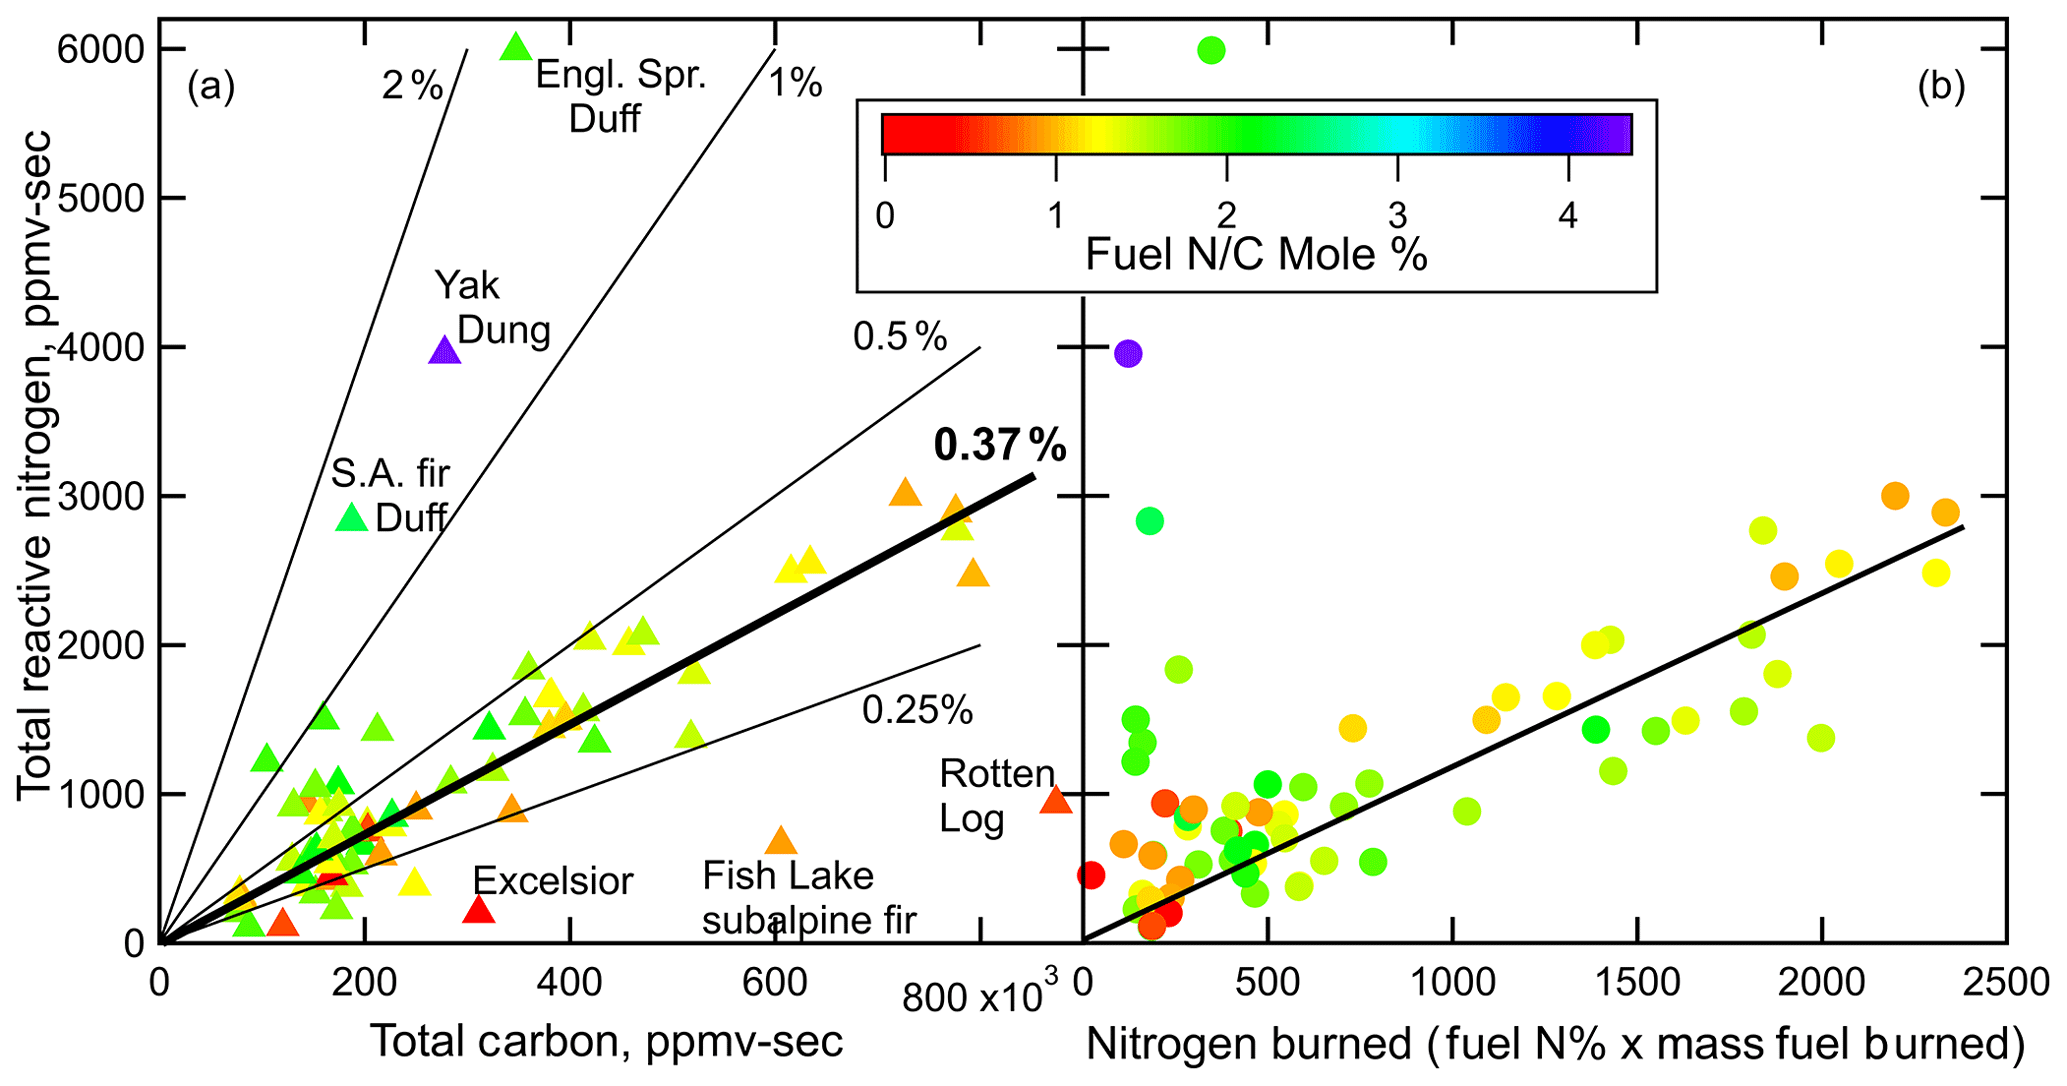
Figure 3Integrated Nr versus (a) integrated total carbon and versus (b) nitrogen burned, based on fuel nitrogen content and mass of fuel burned. The points are colored by fuel nitrogen to carbon ratio. Note that the x and y scales in panel (a) are different by more than a factor of 100.
3.2 Estimates of denitrification
The removal of N to forms that are inactive in the troposphere, N2 and N2O, has importance in the biogeochemistry of forest ecosystems and also determines how much N takes part in wildfire plume chemistry. The points in Fig. 3a are all lower than the corresponding fuel N∕C mole ratio, due to the denitrification chemistry, shown in Fig. 1 and verified in lab studies described by Kuhlbusch et al. (1991), and the production of N2O, which is also not measured by the Nr technique. The sum of N2 and N2O produced in the fires can be estimated from the difference between the fuel N∕C and the Nr∕total C emitted and the data on C and N content remaining in the ash. The mass balance equations used for these calculations are detailed in the Supplement.

Figure 4The histogram of the fraction of N loss to N2 and N2O estimated from the mass balance analysis described in the Supplement (52 burns).
The distribution of the N lost to N2 and N2O is shown in Fig. 4. Chemical analyses were not done for all fuels during the stack burns, and the analysis above assumes that the ash residues and ash ∕ burned fuel ratios from the stack burns were well represented by those for the same fuels used in the room burns, for which mass yields and chemical analyses were done. Data are missing for fuels that did not have a corresponding residue analysis. The median fraction of N lost to N2 and N2O for ash-corrected fires was 0.70, and the mean (± standard deviation) was 0.68 (±0.14). This fuel-based estimate is uncertain by approximately 25 % because of the above assumptions concerning the applicability of the residue analyses from the room burns and because fuel moisture corrections were assumed to apply to all of the materials burned, foliage vs. woody biomass (see the Supplement for details). The emission of N2O relative to N2 is approximately 10 % or less for a wide range of fuels (Andreae, 2019). Assuming the N remainder in our work is at least 90 % N2 gives values that are somewhat higher than the N2 values reported by Kuhlbusch et al. (1991) where N2 accounted for 36 % of fuel N burned in flaming-stage fires. A closer inspection of Kuhlbusch et al. (1991) showed a range of N2 yields of 40 %–54 % at highest MCEs of 0.94–0.97. Possible reasons for these differences are that the Kuhlbusch et al. (1991) fires were limited to grasses, hay, and pine needles, and the fires were confined to a closed container and so may not have experienced the convection and turbulence of typical biomass fires. In addition, the fires analyzed in our work were somewhat weighted towards the full canopy and higher temperature burning fuels, since ash analyses were not done for peat, dung, and many of the “litter” samples, all of which tend to burn less efficiently. Goode et al. (1999) estimated an N2 emission of 45±5 % for MCE values of 0.95 in grass and surface fuels. The range of values determined in our work overlap with these literature values but are on average higher. It should be noted that such loss of reactive nitrogen can have implications for ecosystem N budgets, as discussed by Kuhlbusch et al. (1991).
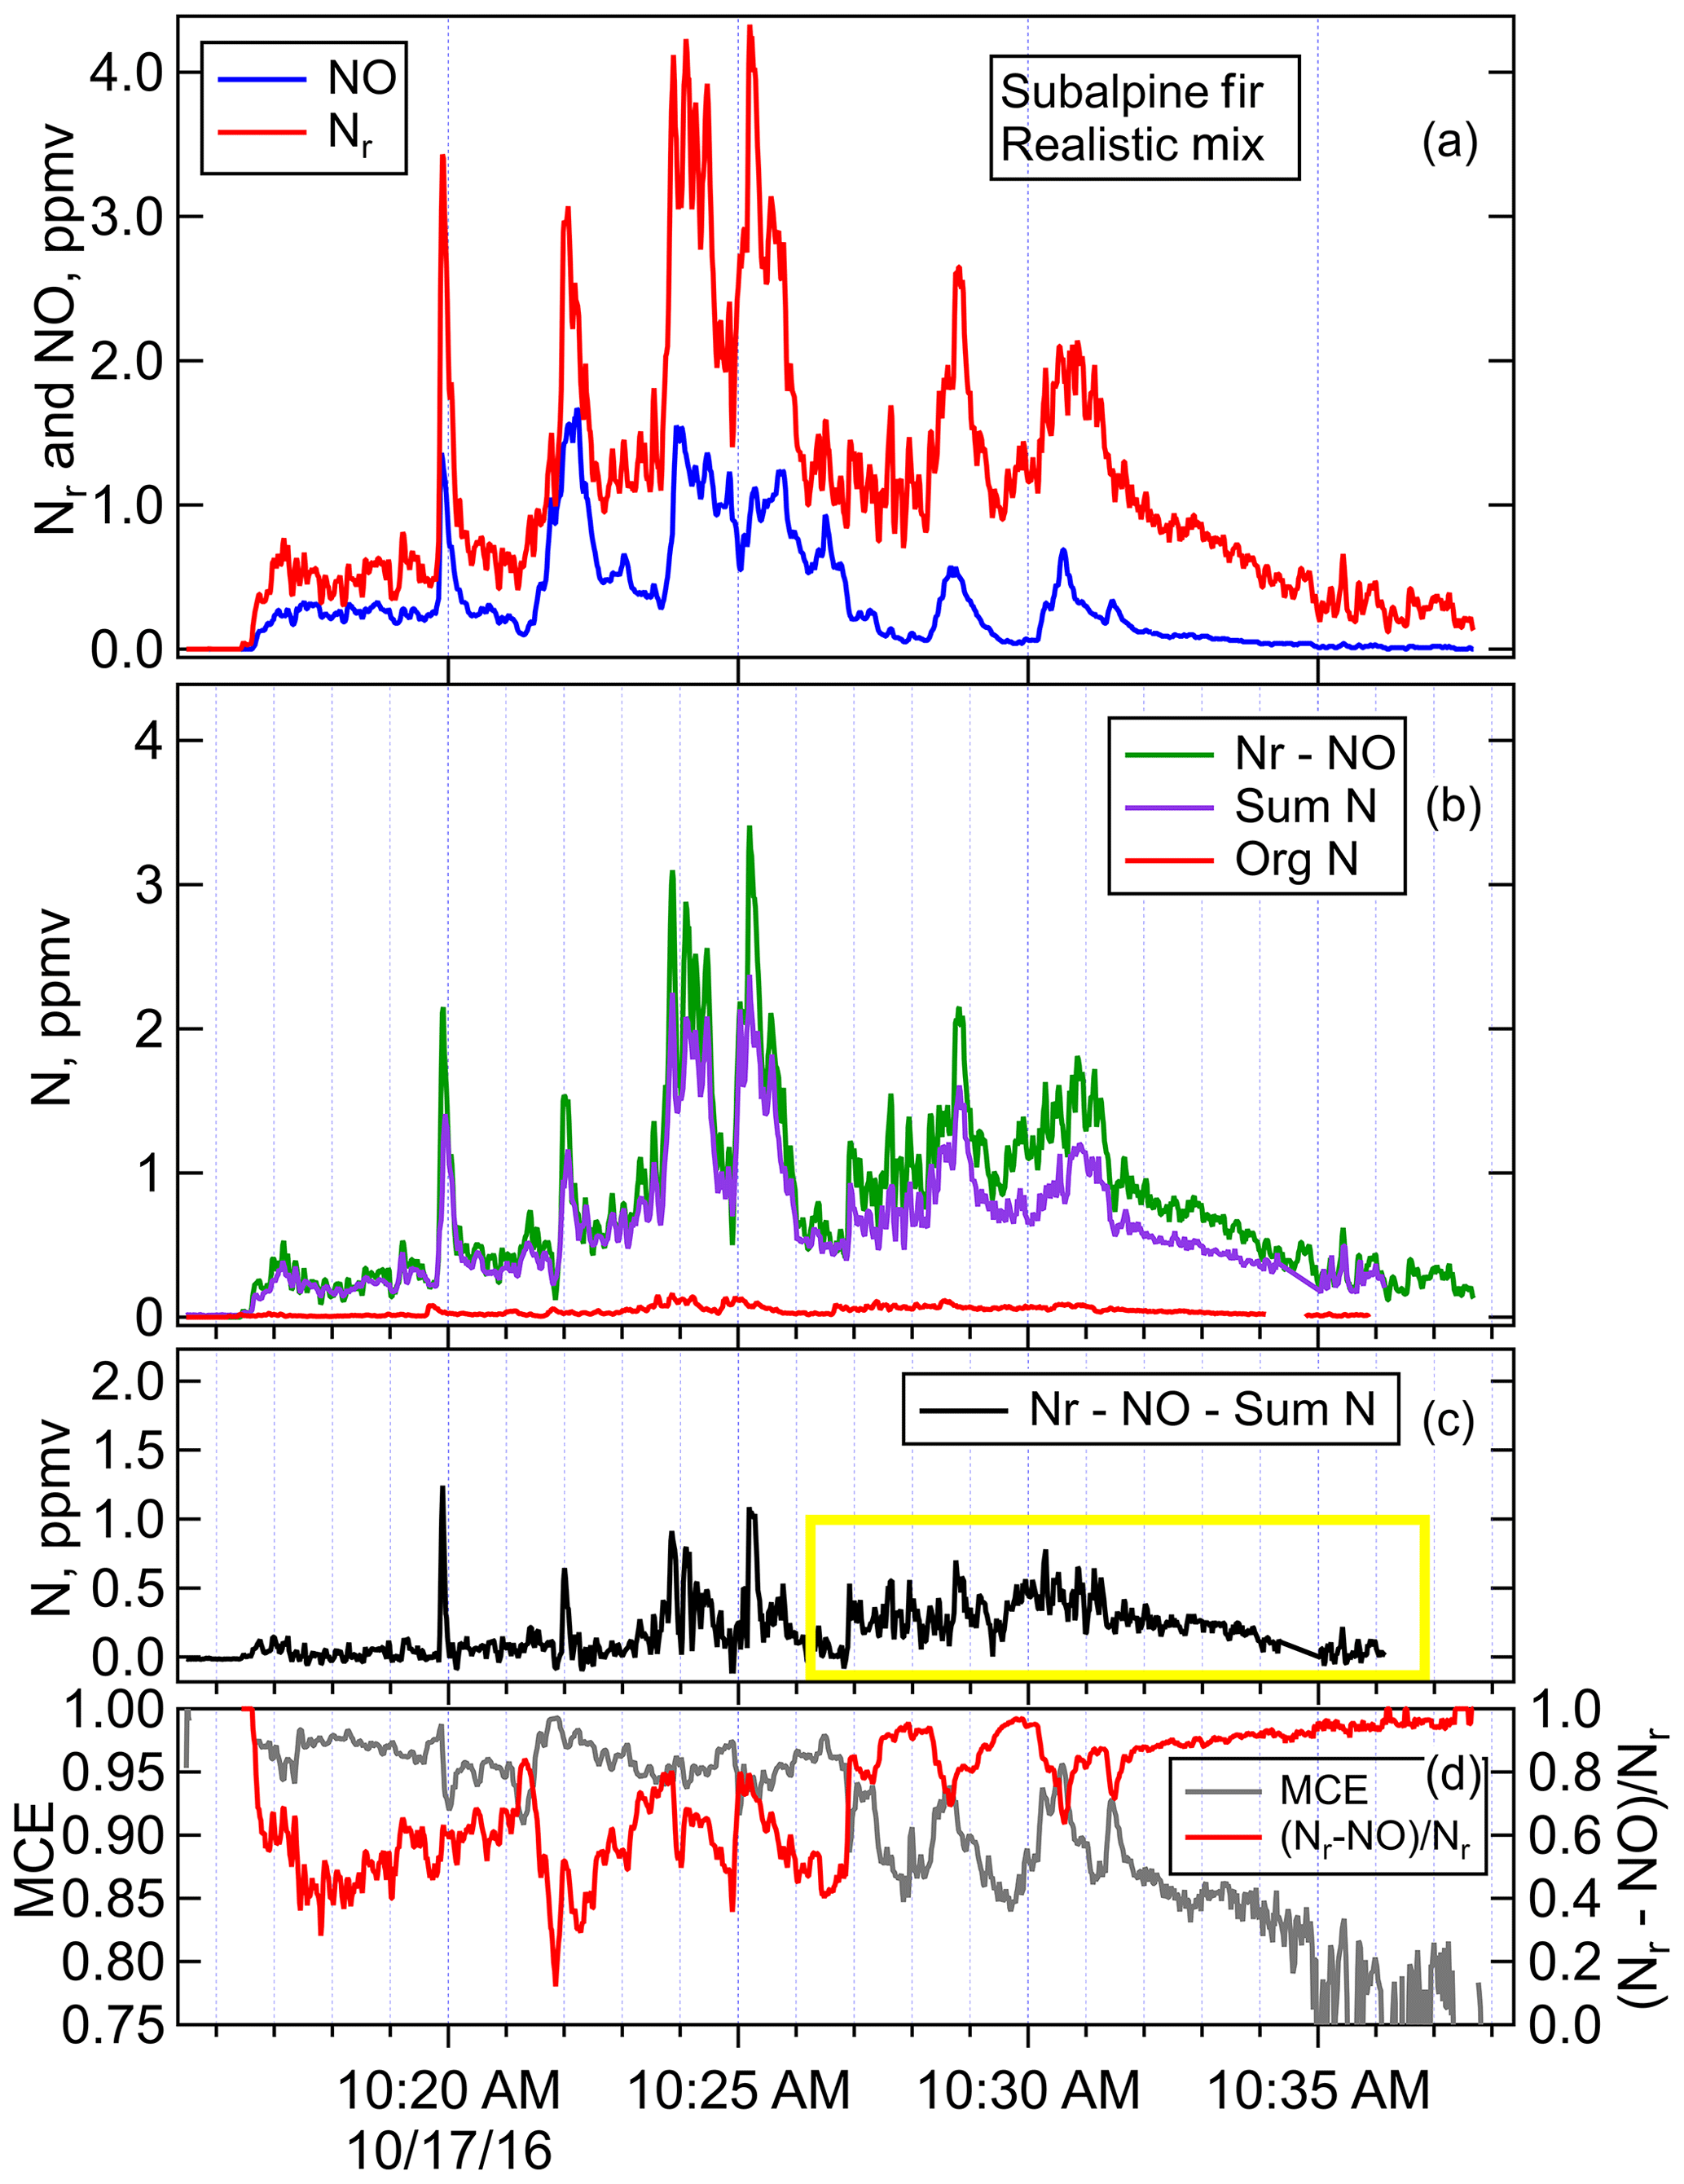
Figure 5Timelines of (a) Nr and NO, (b) Nr minus NO and the sum of all measures N species except for NO, (c) residual of Nr minus all measured N species (Nr−NO−Sum N), (d) and MCE and (Nr−NO) ∕ Nr for Fire 047, subalpine fir realistic mix. The yellow box highlights the area of higher residual Nr that corresponds to more smoldering emissions.
3.3 The budget of Nr and individual N-containing species
The composition of the N that does not get converted to N2 or N2O is of intense importance in determining atmospheric impacts of fires, since those compounds are involved in oxidation capacity (NOx), radical production (HONO), and particle formation (NH3). Emission factors (EF, defined as mass of compound emitted per mass of fuel burn) for all the individual Nr compounds identified in our work have been compiled and reported in previous publications (Koss et al., 2018; Selimovic et al., 2018), so this paper will focus on the Nr budget. The balance of Nr budget for Fire 047, subalpine fir realistic mix, is shown in Fig. 5, in which the timelines of Nr, NO, Nr−NO, sumN, and NVOC are plotted along with MCE and (Nr−NO) ∕ Nr. The quantity sumN is the sum of all other non-NO compounds, and NVOC is the subset of sumN that are organic nitrogen compounds measured by the PTR-ToF, as listed in Table 1. This fire had a mixture of flaming and smoldering combustion throughout the fire as indicated by MCE and nitrogen profiles (Fig. 5d). The comparison of Nr−NO with the sumN in Fig. 5b shows that much of the N is accounted for. The major contributors to sumN for this fire were HNCO, HCN, HONO, NO2, and NH3, while NVOC was a very small contributor to sumN (Fig. 5b). Note that while HNO3 is measurable by FTIR with good sensitivity, no HNO3 signals were observed above detection limit, which was 10 ppbv. Fig. 5c shows the residual left after NO and sumN are subtracted from Nr, corresponding to an integrated amount of 15.6±8 % of Nr. This residual is reasonable, considering typical published particle Nr measurements (Akagi et al., 2012, 2011; Liu et al., 2017; May et al., 2014), and consistent with there being some particle Nr from flaming, which is most likely organic nitrates or nitro-organics, and particle ammonium from smoldering with potassium or ammonium nitrate, potentially accounting for substantial Nr.
Several fuels had much lower NO emissions and higher unaccounted-for Nr. Yak dung was one such fuel, the emissions of which stand in contrast to the fire shown above. The nitrogen emissions from Fire 050, yak dung, are shown in Fig. S2 in the Supplement. This fuel produced mostly smoldering emissions as exemplified by the low NO levels relative to Nr (panel a) and the low MCEs observed (panel d). The sum of Nr species was somewhat correlated with the quantity Nr−NO but was substantially lower, and the residual Nr unaccounted for by the gas-phase measurements was 33.9±16 % of Nr (panel c). The majority of sumN was represented by HCN and NH3, with acetonitrile (CH3CN) higher than any of the other inorganics, HNCO, NO2, or HONO. The NVOCs were also a larger fraction of Nr−NO than in the case of Fire 047 shown above, a feature that implies that more semivolatile organic compounds (SVOCs) survive these types of fires and could make a proportionally higher contribution to the Nr budget in this fire relative to Fire 047. Fire Lab results of particle organic carbon measurements (Jen et al., 2019) and field measurements in environments with a lot of dung burning (Jayarathne et al., 2018; Stockwell et al., 2016a) are consistent with a higher EF for particle organic carbon and by extension particle NVOC compounds. The quantity (Nr−NO) ∕ Nr was relatively high and had less dynamic range than for fires with more flaming combustion like Fire 047.
Table 3Summary of Xi∕Nr measurements for all stack burnsa.
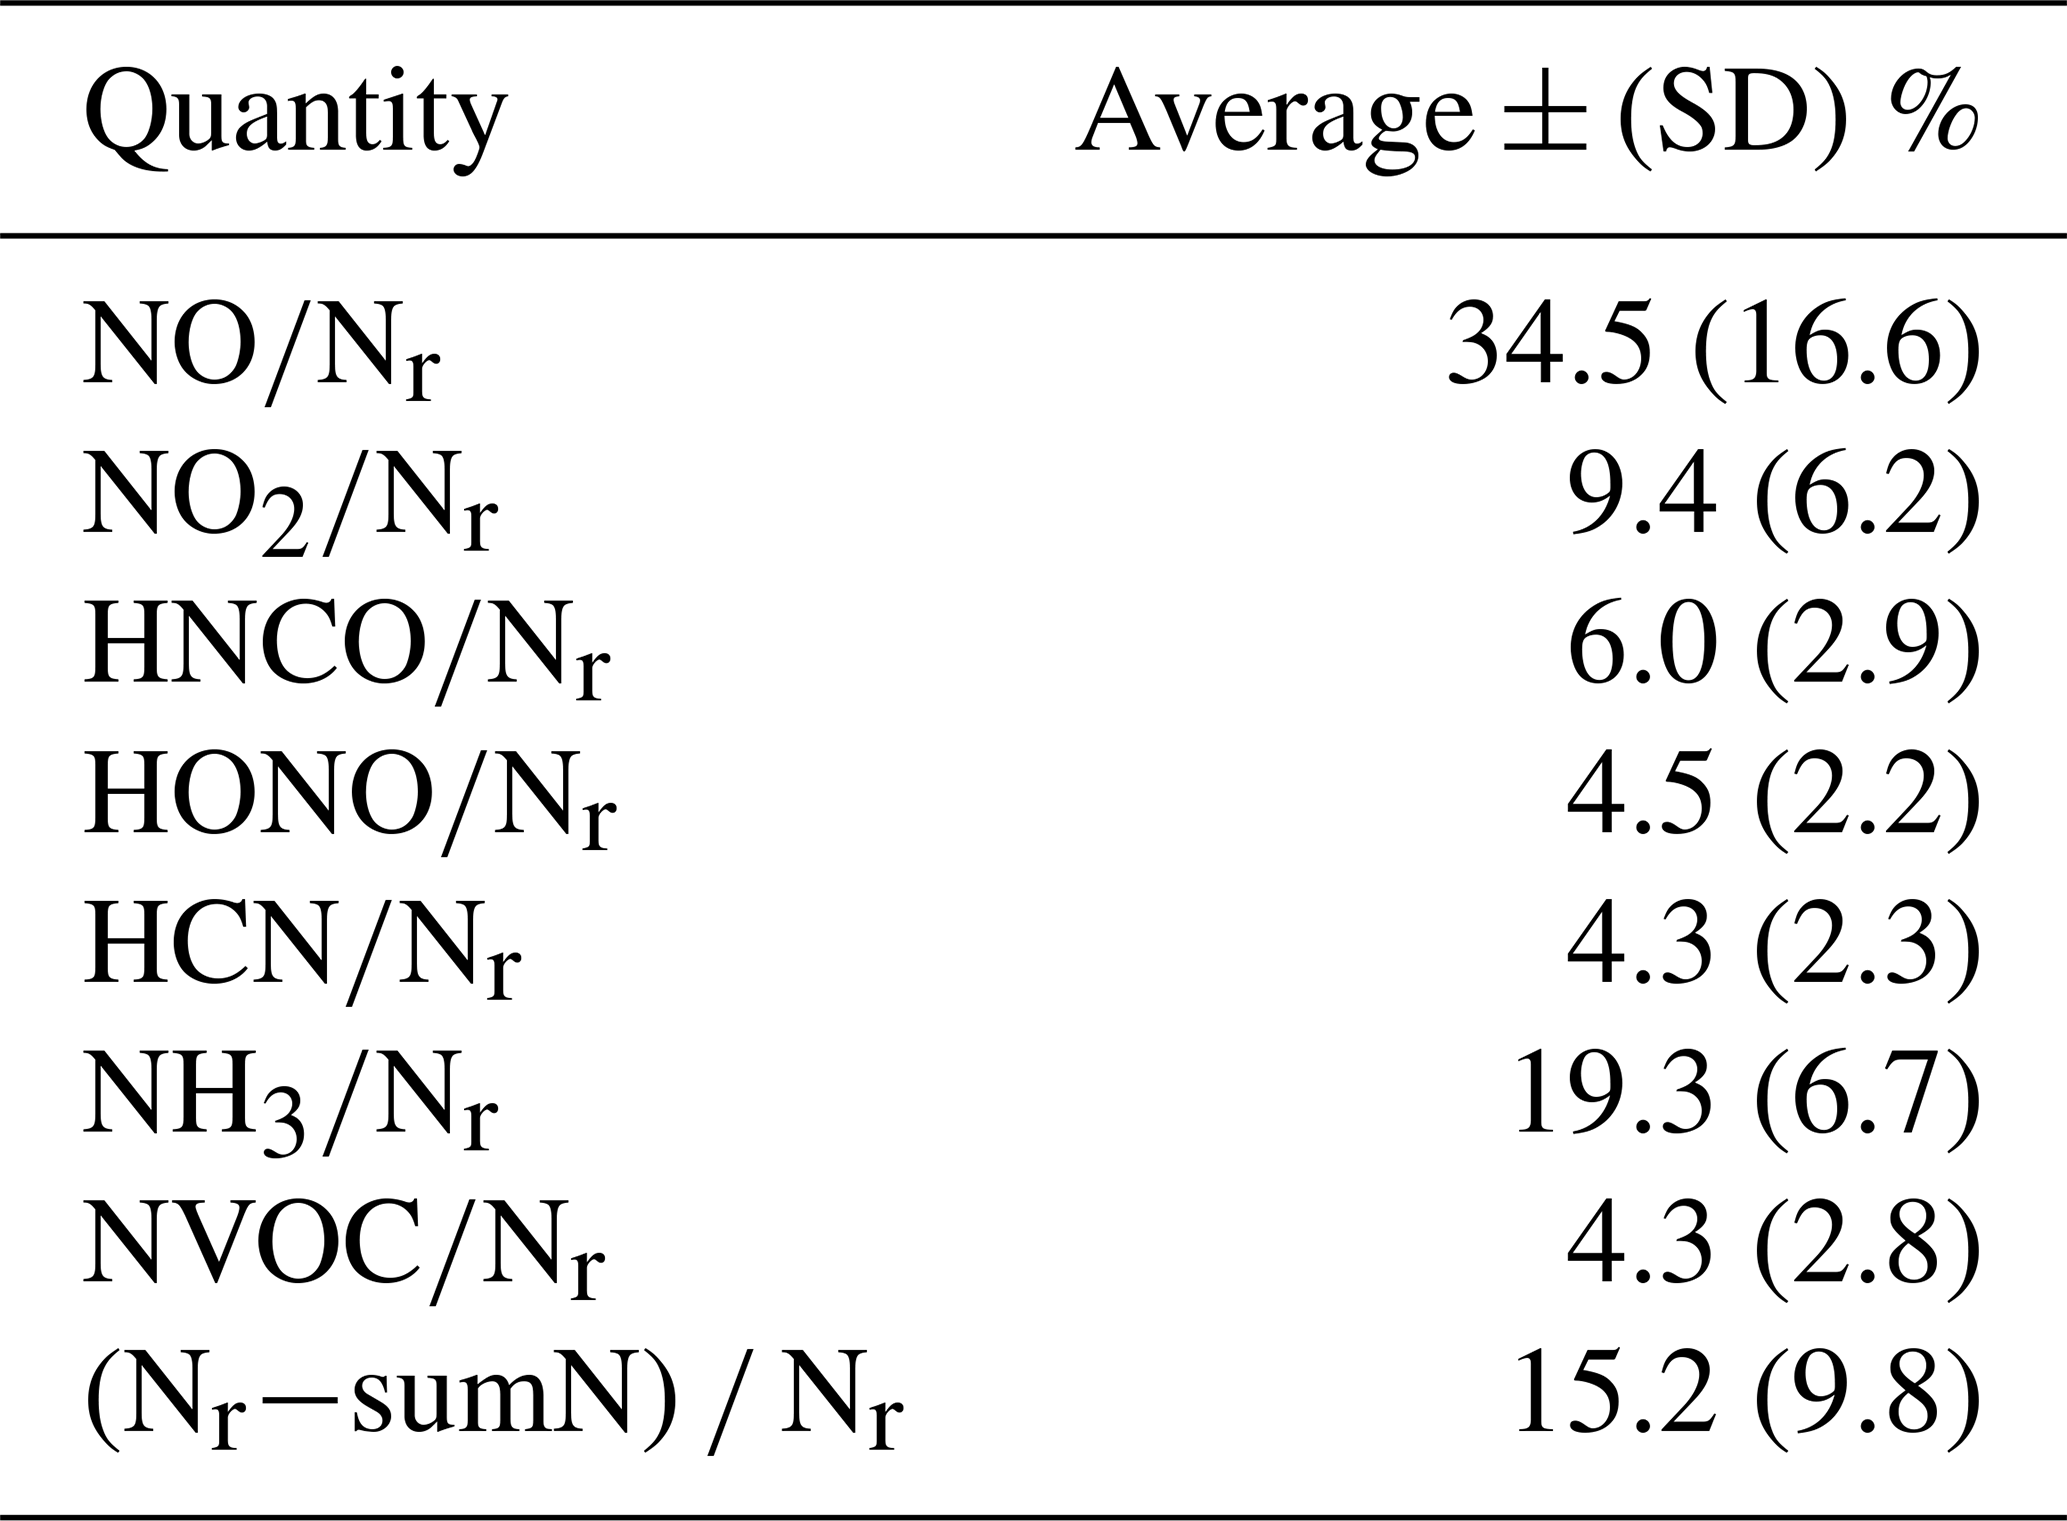
a Not every measurement was available for every fire; consequently the values do not add up to exactly 100 %.

Figure 6A histogram of the residual N for all the stack fires during the 2016 Fire Lab study for which there are FTIR, ACES, and PTR-ToF measurements (n=43). The median is 0.143, and the mean (± SD) was 0.15 (±0.10).
An overall budget of Nr can be constructed for all of the stack fires through integrating the time profile of all the compounds and compound classes. The fire-integrated measurements of inorganic and NVOC species are listed in the Supplement as ratios to Nr for each stack fire (Table S1). The summary of all the fire integrated Xi∕Nr fractions (where Xi is the Nr species or quantity) is given in Table 3 for all the fires for which we have a complete set of measurements (43 fires). In general, NO was the major species, followed by NH3, and the other inorganic Nr species, NO2, HNCO, HONO, and HCN had individual contributions of 4.3 % to 9.4 %. NVOC species were less than 5 % of Nr on average. The unaccounted-for Nr, defined as had a median value of 14.3 % and a mean (± SD) of 15 (±10) %. Overall, 85 % of Nr was accounted for by the gas-phase measurements. The distribution of whole-fire Nr residuals is plotted as a histogram in Fig. 6. We expect the residual Nr was composed of either semi- or low-volatility compounds or particle-bound Nr compounds, which we know are converted efficiently by the Nr catalyst (Stockwell et al., 2018) but not detected by the instruments included in this analysis. Along these lines, there is some indication that the residual has a systematic variation with whole-fire MCE, with higher residuals (up to 30 %) observed at lower MCEs and higher (Nr−NO) ∕ Nr (see Fig. S3a, b), which would be consistent with higher EF for SVOC at low MCE (Jen et al., 2019) and particle Nr having a higher contribution from (May et al., 2014) and, perhaps, particle ammonium or reduced-Nr compounds. In general, there is more particulate organic material emitted from fires at low MCE (Jen et al., 2019), so we would expect more particle N at low MCE to go along with that.
3.4 Systematic dependences of Nr composition on combustion processes
The features noted in fires shown above, as well as the anticorrelation of MCE and (Nr−NO) ∕ Nr lead to the question of whether there are systematic dependences in Nr-compound composition on fire stage that can be used to formally classify and/or potentially predict the relative emissions of Nr compounds. MCE has been used as a rough indicator of the relative amounts of flaming and smoldering combustion in a fire, with high MCE (∼99 %) being “pure” flaming, low MCE (∼80 %) being “pure smoldering,” and an MCE of ∼0.9 being roughly equal amounts of both (Sect. 2.1.1 in Akagi et al., 2011). It should be understood that “smoldering” in this framework is a lumped term that includes all non-flame processes such as pyrolysis, glowing, and distillation, which are the processes that produce gaseous fuel to support flaming (Yokelson et al., 1996). In addition, pure flaming is essentially the efficient oxidation of smoldering products before they enter the atmosphere. However, for MCE to predict flaming and smoldering Nr species well, the variable fuel N must be considered. For instance, NOx is clearly produced by flaming based on its temporal profile, but fire-integrated EF may not correlate with MCE due to variable fuel N. In these cases, EF ∕ fuel N or ΔNH3∕ΔNOx may still correlate (or anticorrelate) well with MCE (e.g., Fig. 4 in Burling et al., 2010, or Yokelson et al., 1996). Finally, the flame chemistry involving NH3, HNCO, and HCN both produces and destroys NO in a fashion that does not conserve Nr. This chemistry is explored in Fig. 7, in which NOx, NH3, HNCO, HCN, HONO, and CH3CN ratios to Nr are plotted vs. real-time MCE for Fire 047 as a typical example for fires that have a substantial range of MCEs (e.g., from 0.8 to above 0.98). The relationship between NH3∕Nr and MCE confirms that NH3 is primarily a smoldering emission, and NOx∕Nr increases with increasing MCE in a nonlinear fashion that confirms it is primarily a flaming compound. Such a nonlinear dependence has also been seen for other flaming-related quantities such as elemental carbon/TC or EFHCl (Christian et al., 2003; Stockwell et al., 2014). Most importantly, the variations in HNCO∕Nr, HCN∕Nr, HONO∕Nr, and CH3CN∕Nr versus MCE do not arise dominantly from either regime, as these are species that are likely produced by multiple pathways (e.g., “incomplete flaming”, pyrolysis, or possibly glowing). By incomplete flame chemistry we mean the production of incompletely oxidized products in flames such as the complex system of reactions shown in Fig. 1. These reactions involving HNCO, HCN, and NH3 both produce and destroy NO, while HONO is produced from reactions of NO and NO2 that are faster at slightly lower temperatures, for example the three-body association reaction of NO with OH radical (Manion et al., 2015). Variable turbulence in the turbulent diffusion flames that are characteristic of open BB likely contributes to varying temperatures and, therefore, varying amounts of incomplete oxidation of the fuel N (Shaddix et al., 1994).
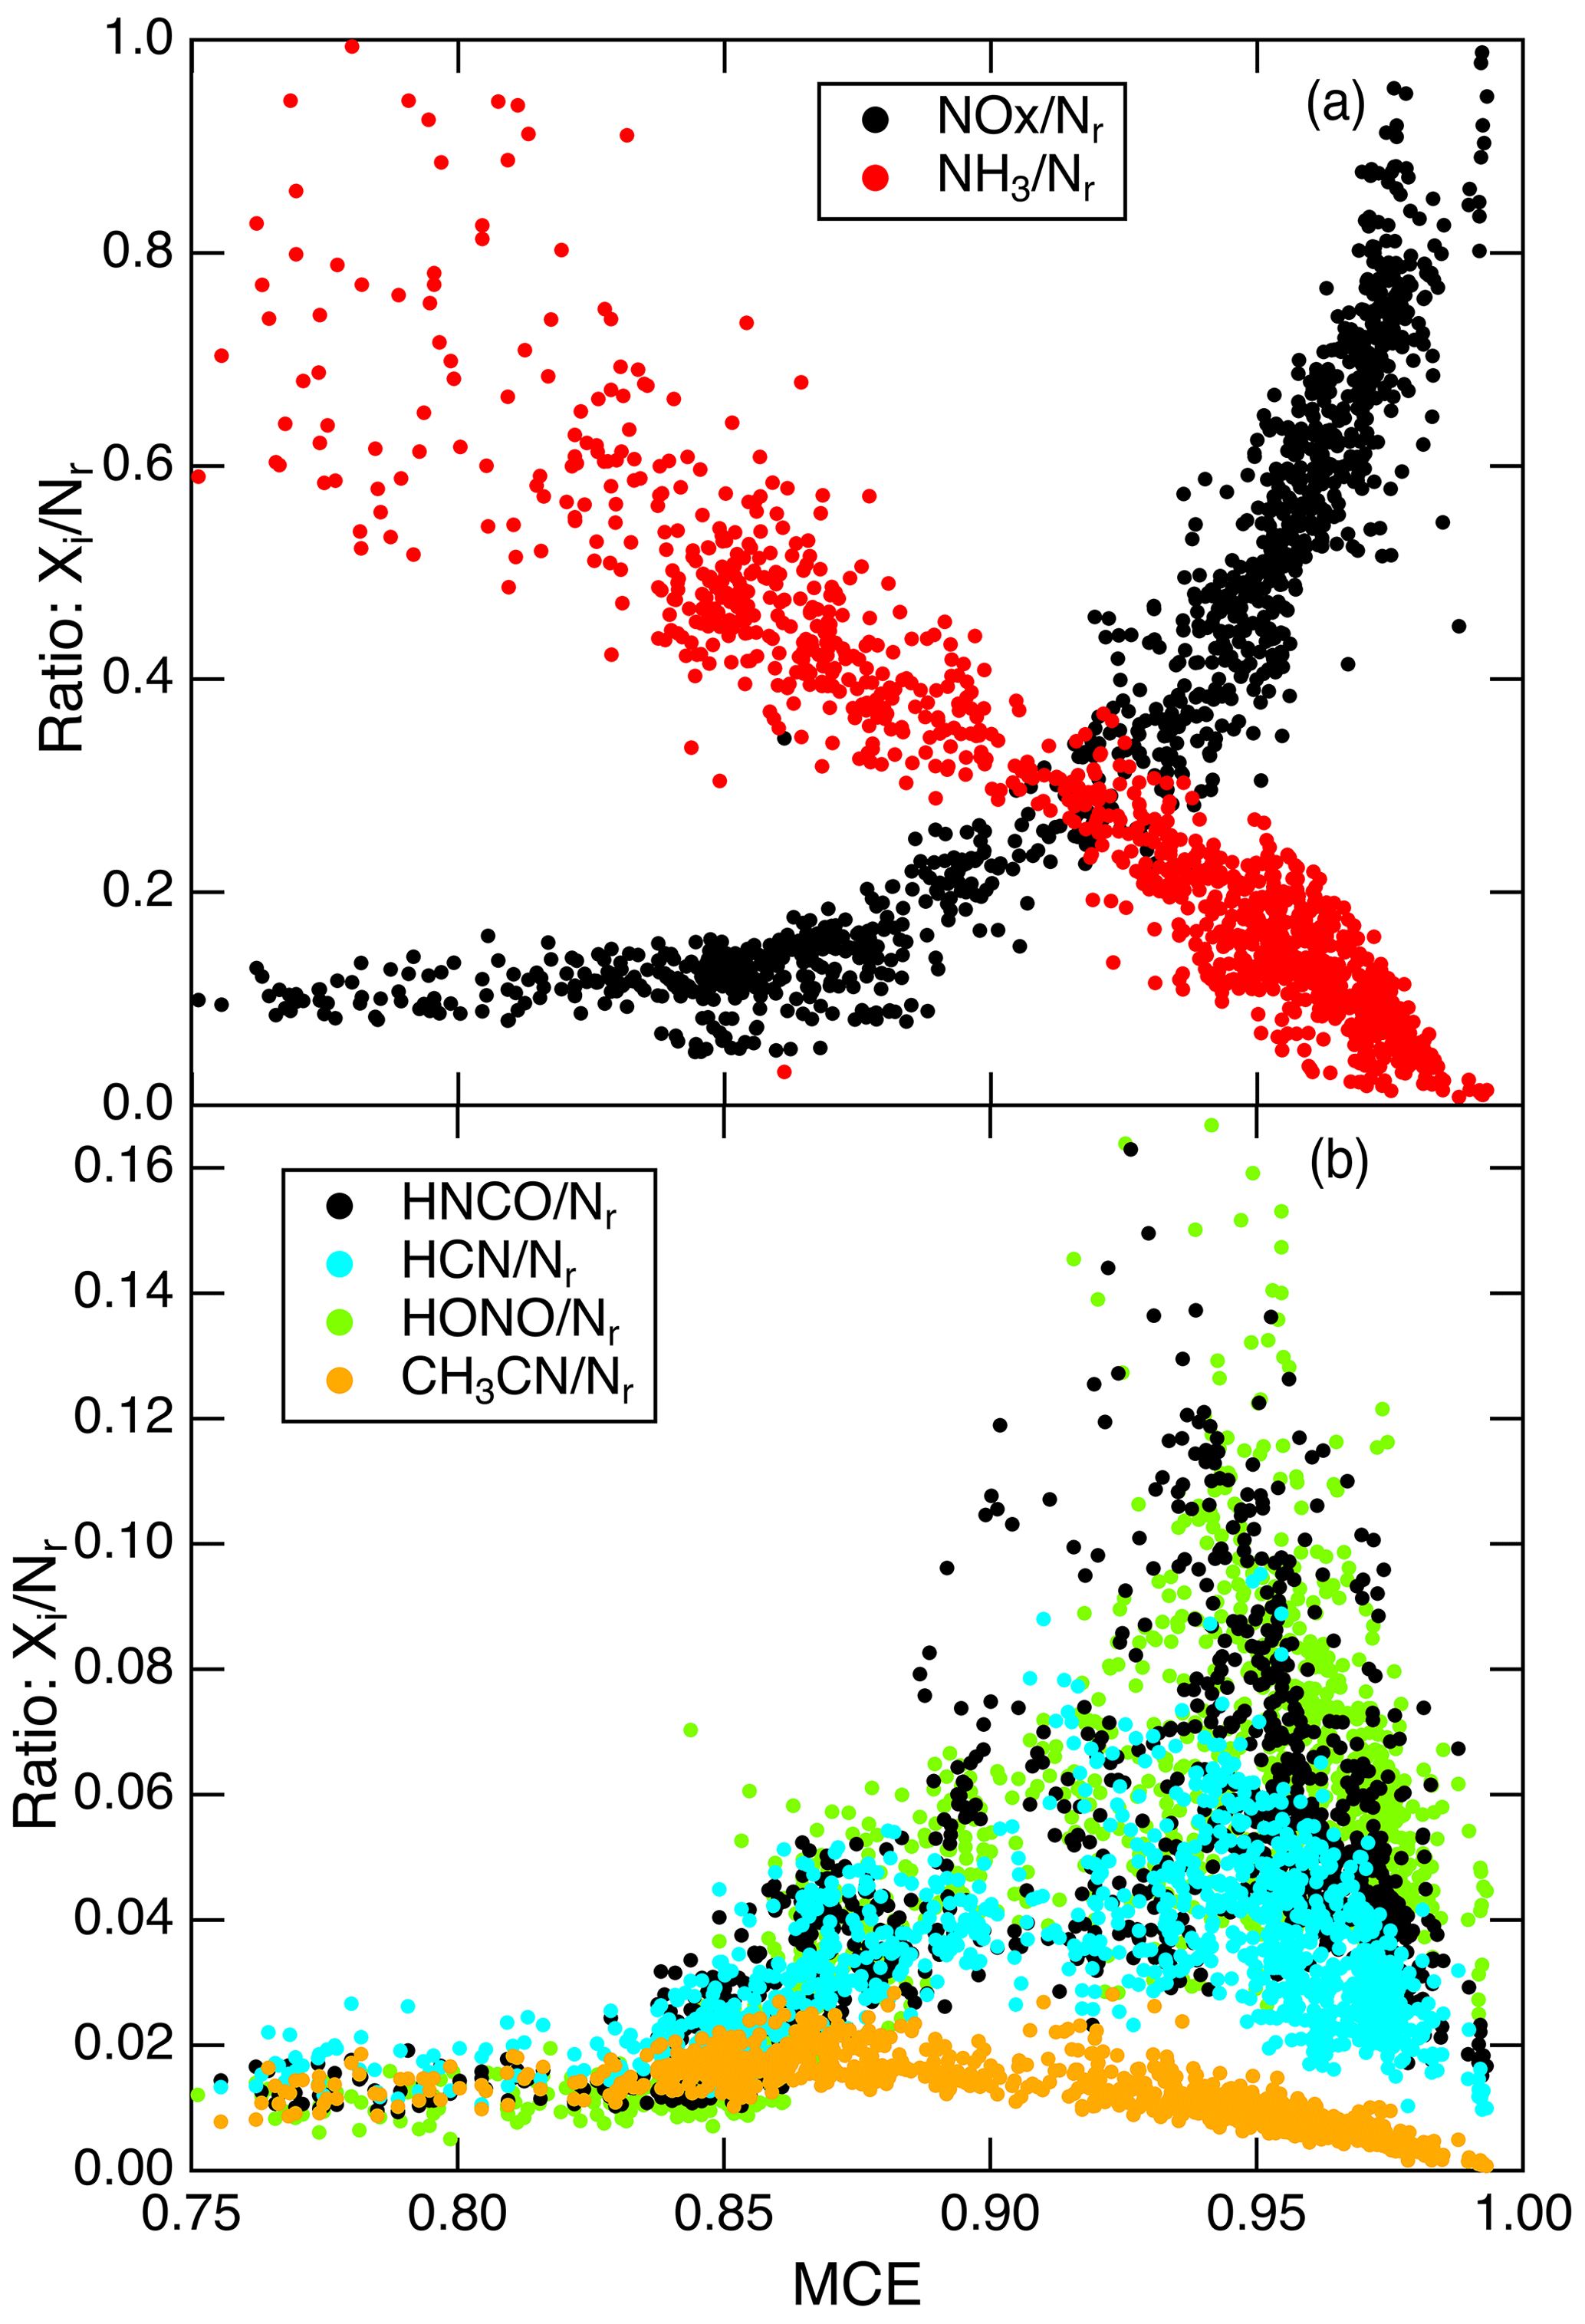
Figure 7(a) The relationships between NOx∕Nr and NH3∕Nr vs. MCE and (b) the HNCO∕Nr, HCN∕Nr, HONO∕Nr, and CH3CN∕Nr vs. MCE for Fire 047.
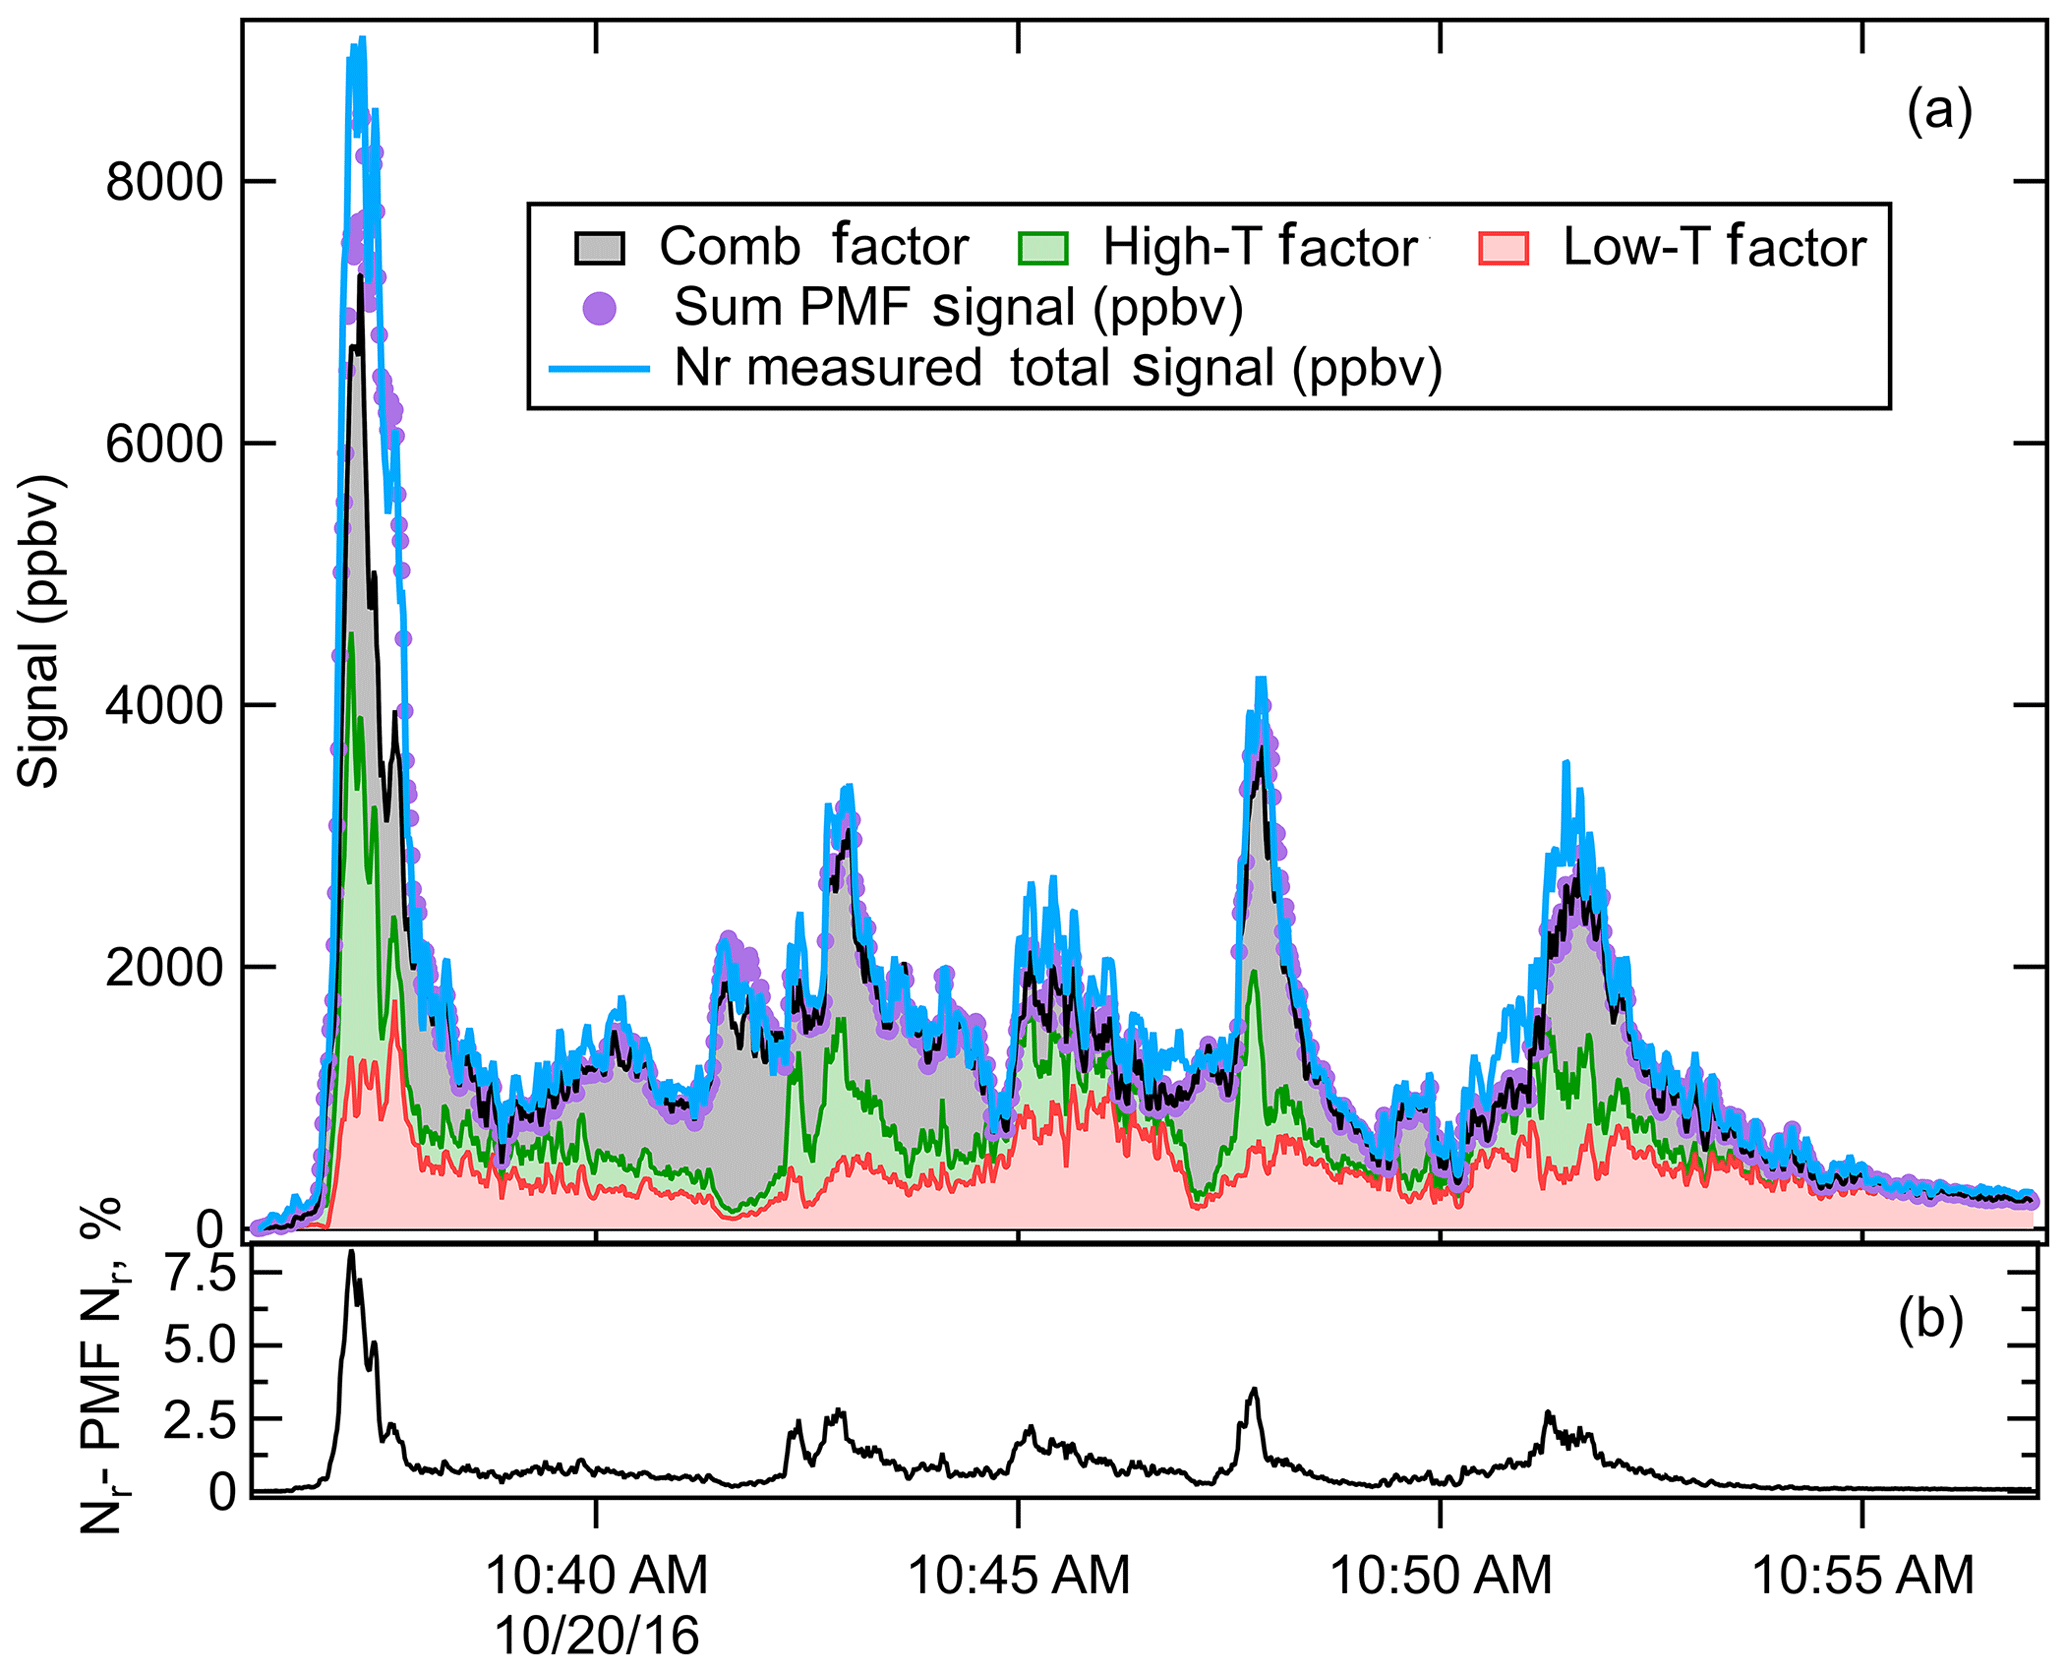
Figure 8(a) The measured Nr signal for Fire 063 (lodgepole pine) (blue line), the sum of the signal reconstructed by the PMF (purple points), and the three PMF factors – combustion (grey), high temperature (green), and low temperature (red) – plotted in a stacked fashion (i.e., added on top of one another). (b) The “residual” of the PMF fit consisting of the measured Nr signal minus the Nr signal reconstructed by the PMF, as a percentage of the Nr signal.
3.5 The PMF analysis of coniferous fuels
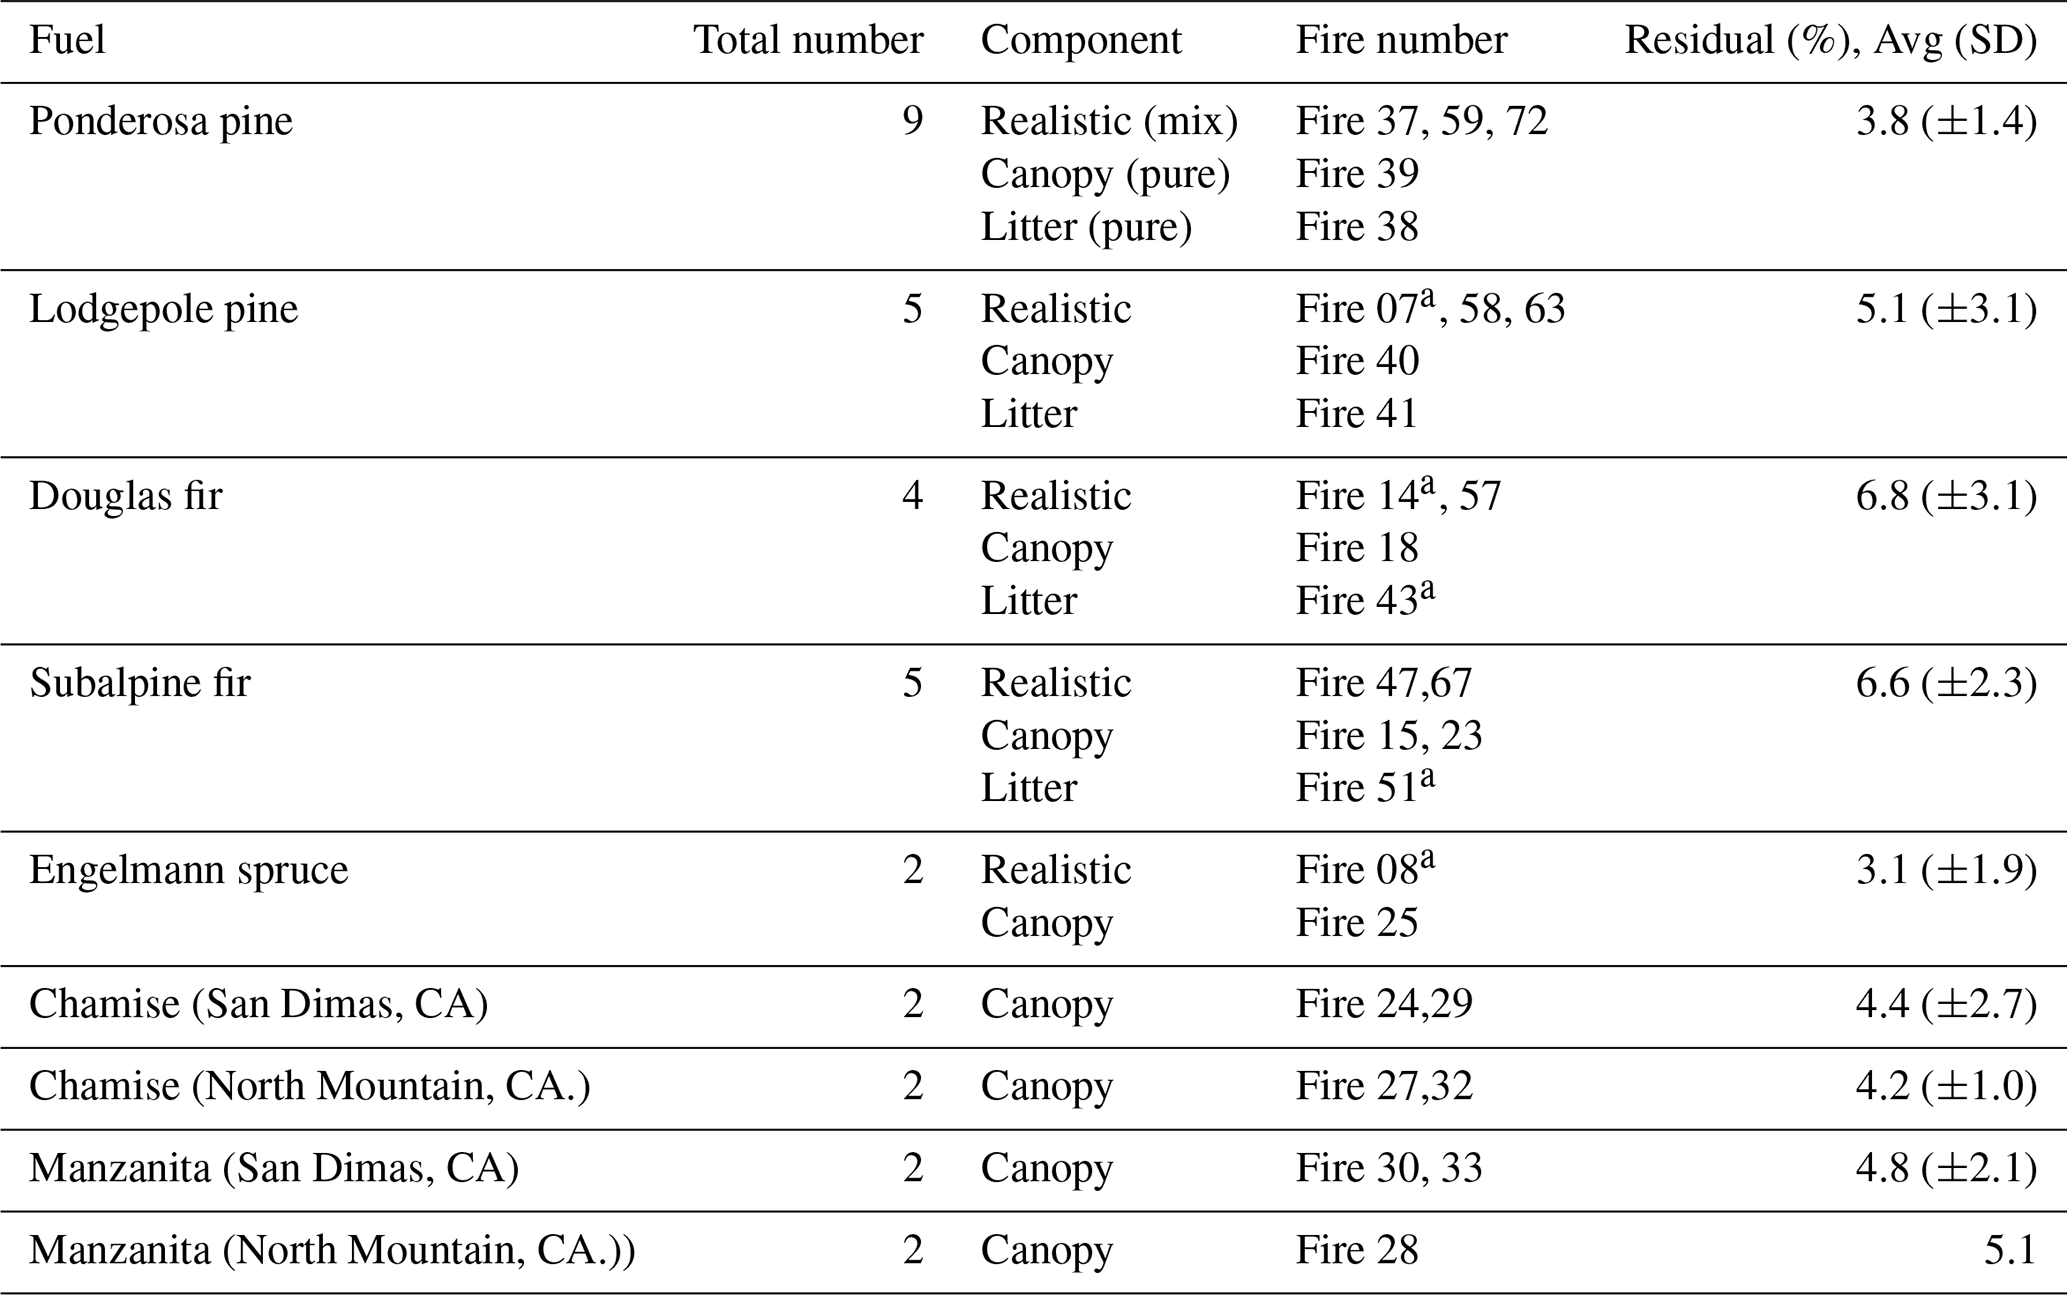
The complexity of the dependence of Nr speciation on combustion chemistry suggests that MCE is an insufficient model to use for applying lab results to real-world fire emissions (Stockwell et al., 2016a; Yokelson et al., 2013b). Accordingly, we employed the positive matrix factorization (PMF) method (see Methodology section) that has been used by a number of groups to probe the sources contributing to complex mixtures (see for example Ulbrich et al., 2009; Sekimoto et al., 2018). Our PMF results showed several general features, irrespective of the inclusion or exclusion of CO2, CO, and Nr. The emissions were best fit by three factors (with approximate descriptive names justified below and prime species): (1) a combustion (flaming) factor (abbreviated Comb-N), (2) a high-temperature pyrolysis factor (HT-N), and (3) a low-temperature pyrolysis factor (LT-N). We use these terms in part to harmonize our discussion with the VOC results discussed by Sekimoto et al. (2018). An example time series for the PMF analysis of a coniferous fuel with just the Nr species included is shown in Fig. 8 for a realistic mix of lodgepole pine (Fire 063). In this case, several different Fpeak values were tried (−1, 0, +1) and runs with 100 different seeds (initial factor profiles) were performed. The results of those analyses (Fig. S4) show that a three-factor PMF result is robust. A PMF analysis was performed on the consolidated time series of all coniferous fuels fit using just the Nr species, as shown in Fig. S5. In this case Fpeak=0 was used, and the Q∕Qexpected showed an inflection for the three-factor solution at a value of 5.3. The three factors successfully describe the majority of the Nr emissions where the difference between the measured and calculated mass is on average 5.1 % for coniferous fuels and 4.6 % for chaparrals as indicated in Table 4.
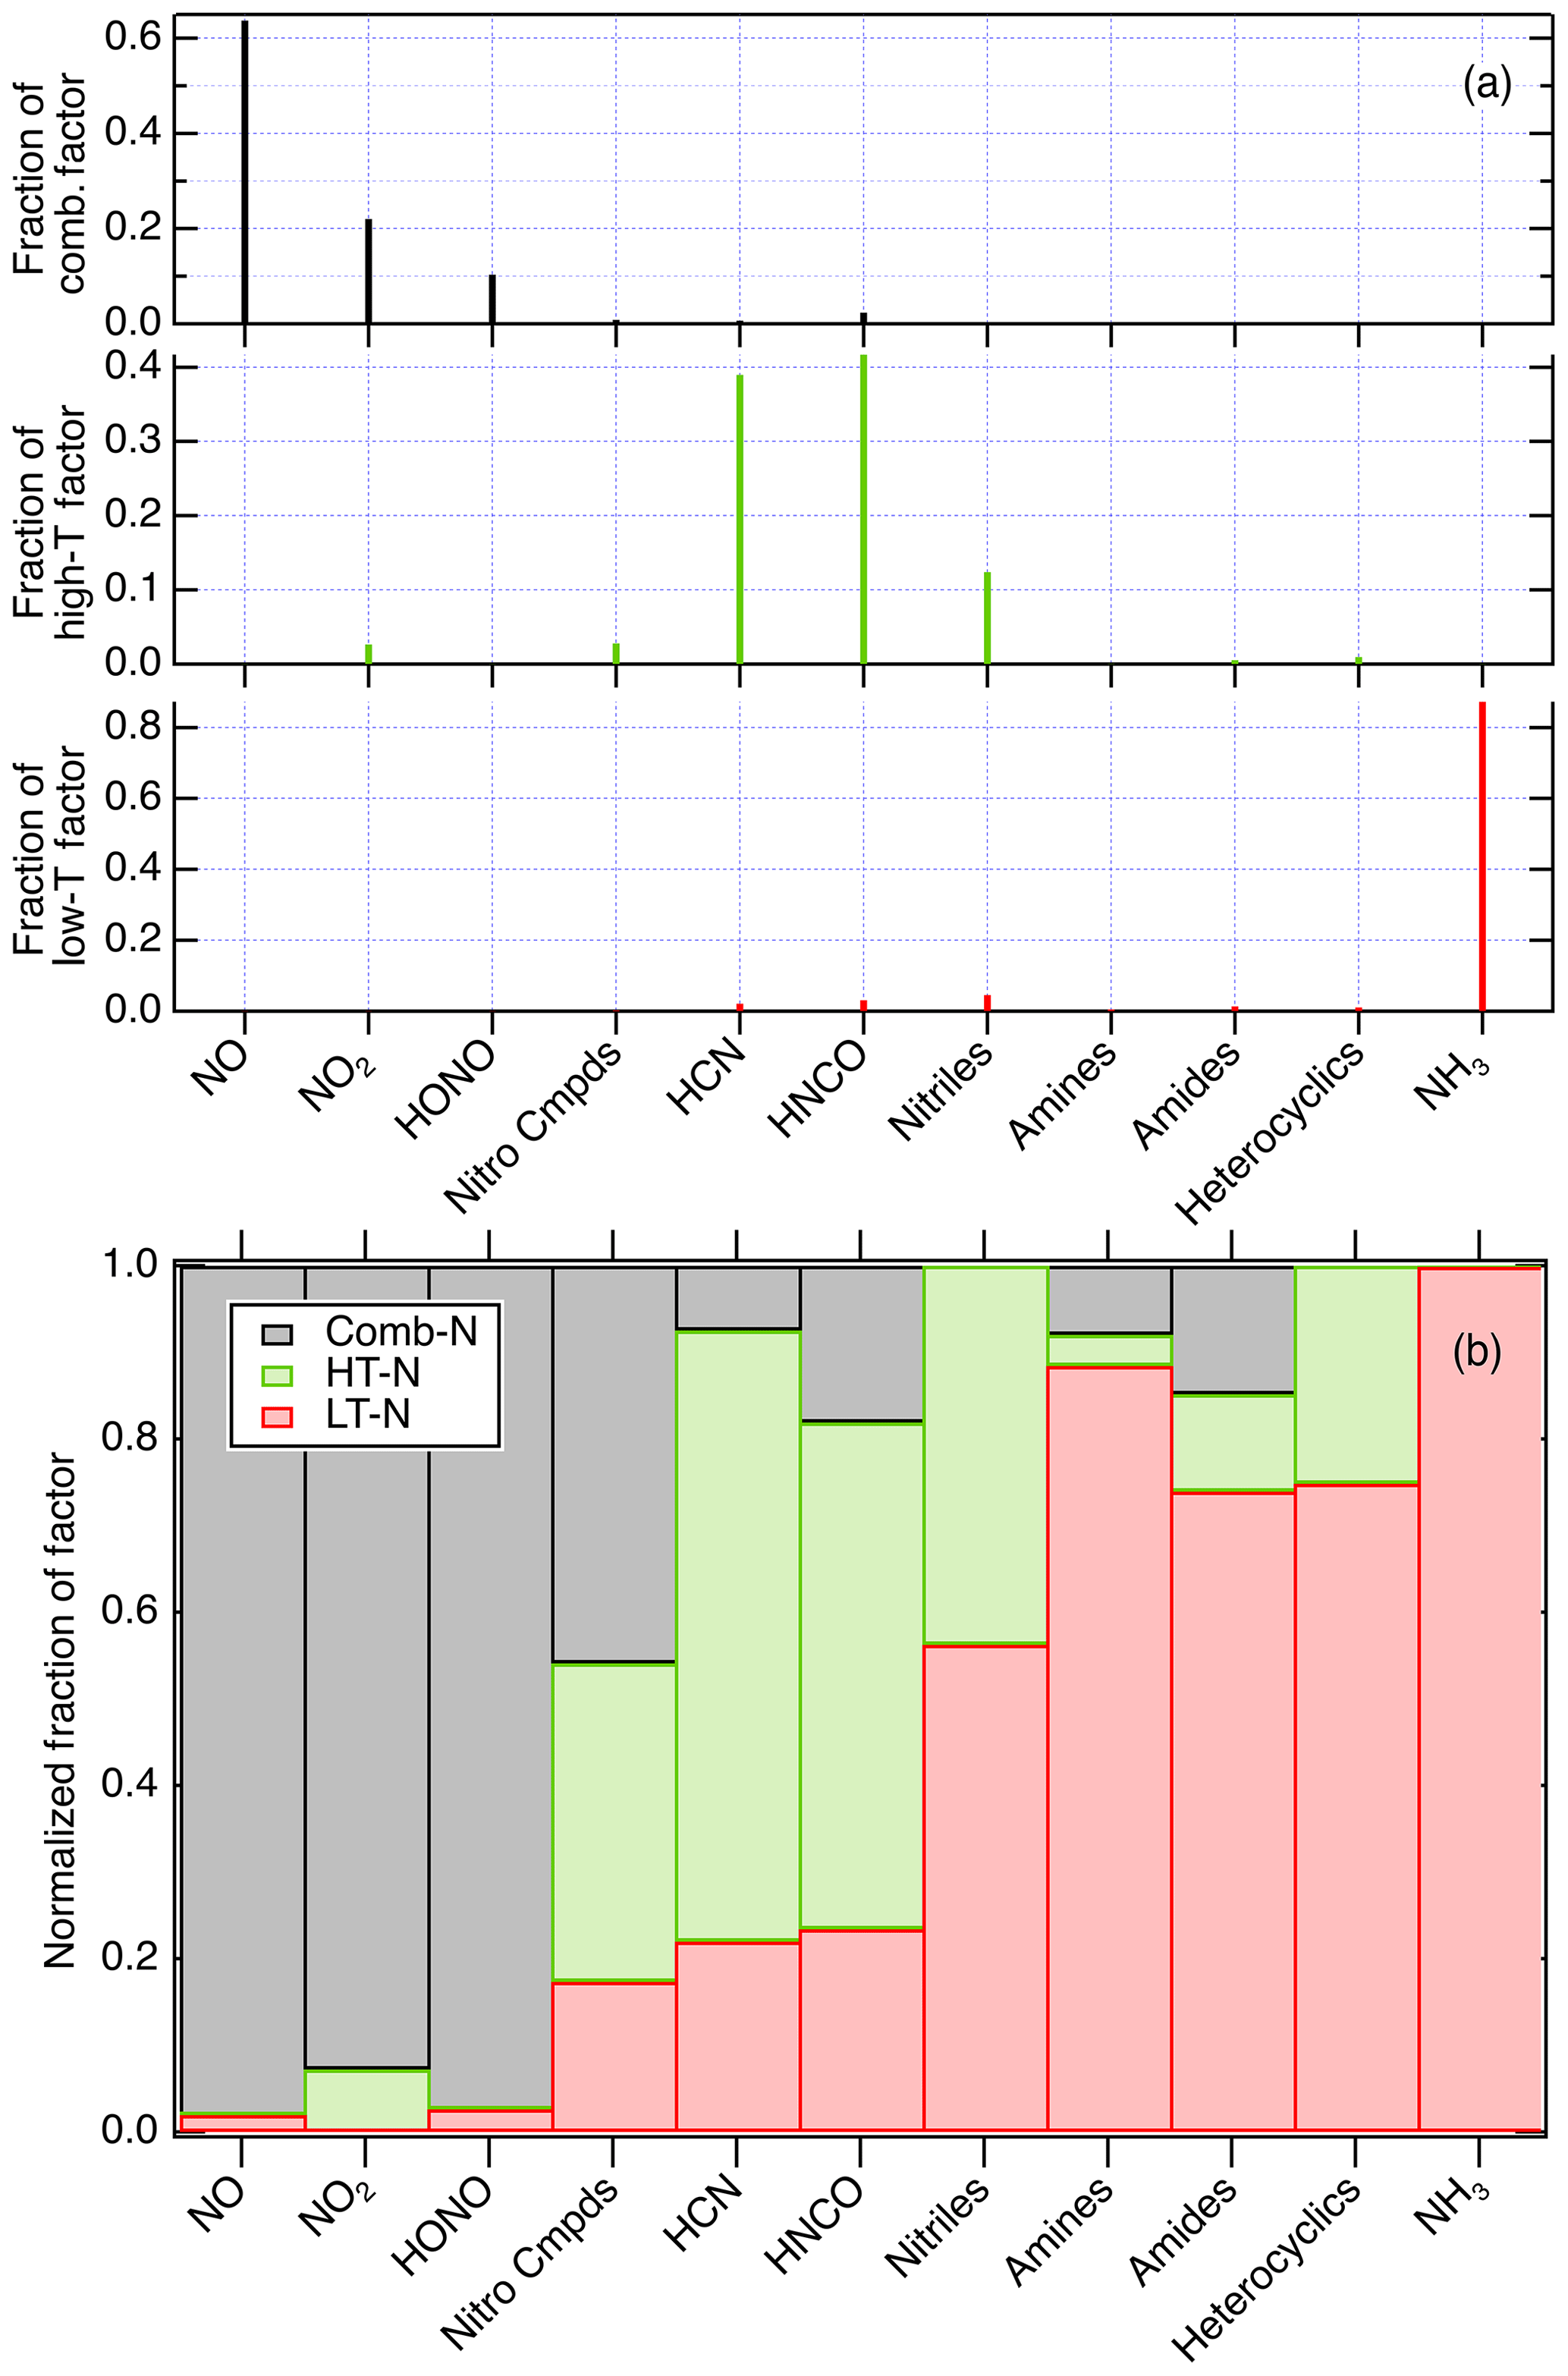
Figure 9(a) The contributions of nitrogen species to the factors that simulate the emissions from coniferous fuels shown in Fig. S2 and (b) the fraction of each compound or class found in each factor.
Table 4Residuals of the PMF analyses by fuel, as percent of total signal.
Several metrics of the PMF analysis quantify how the compounds or compound classes contribute to each factor. The “loadings” of the three different factors, i.e., the contribution of compounds to each factor, for coniferous fuels are shown in Fig. 9a, and the distribution of a given compound or compound class amongst the three factors is shown in Fig. 9b as normalized fraction. Normalized fraction is equal to the PMF-determined contribution of a compound to a factor, divided by the sum of the contribution of the compound to all three factors. The Comb-N factor contained NO, NO2, and HONO; the HT-N factor had mostly HCN, HNCO, and nitriles, with contributions from NO2 and nitro compounds; and the LT-N factor contained NH3, amines, amides, and heterocyclics. Within the Comb-N factor there is some evidence that the relative amounts of HONO and NOx depend on fuel moisture. For example, the ratio HONO∕NOx for whole fires shows some correlation with needle moisture in coniferous fires that were canopy fuels (foliage and small woody biomass), as shown in Fig. S6. This may be due to flame processes that interconvert NOx and HONO in the presence of water vapor or OH (see Fig. 1).
Literature values from studies where flame temperature was measured are typically in the range of 1100–1200 ∘C (Taylor et al., 2004; Wotton et al., 2012), so we would assume that would constitute the upper range of our Comb-N factor. The radical chemistry involving HCN, HNCO, and NH3 starts to shut down below about 800–900 ∘C, according to the modeling of Glarborg et al. (2018), so we set 800 ∘C as a lower limit for the Comb-N factor. The HT-N factor species are known to be produced by the intense pyrolysis of fuel Nr compounds (Hansson et al., 2004; Liu et al., 2018; Ren et al., 2010), which for these compounds becomes important at temperatures around 500–600 ∘C. Accordingly, we estimate the temperature range for the HT-N factor at 500–800 ∘C. The remaining LT-N factor results from mild pyrolysis and pertains to fire conditions of roughly 500 ∘C and below, and it was dominated by NH3, amines, amides, and some of the more complex organics (Koss et al., 2018). The names and temperature ranges are approximate and likely include processes that occur inside flames as part of the flame proper, as turbulent diffusive flames are highly variable in space and time.

Figure 10Comparisons of the N-PMF combustion factor (Comb-N) with (a) CO2 and MCE for Fire 037 (ponderosa pine). Panel (b) shows the scatter plot of the Comb-N factor versus CO2, and panel (c) shows the scatter plot of Comb-N factor versus MCE.
3.6 The comparison of N-PMF factors to other fire parameters and VOC emission factors
It is useful to explore the correlation of N-PMF factors with other fire indicators to determine relationships for parameterizing Nr emissions together with carbon and VOC emissions, in order to simplify how emissions might be parameterized in models. The Comb-N factor for coniferous fuels, which consisted of NOx and HONO, would be expected to correlate with CO2 but not as well with MCE since the latter includes an indicator of incomplete combustion. The time series of Comb-N along with CO2 and with MCE for Fire 037 (ponderosa pine) are plotted in Fig. 10. As expected they show an excellent correlation of Comb-N with CO2 (R2=0.942), since all the species are flaming compounds, but nonlinear correlation of Comb-N with MCE (R2=0.363), since the latter factors in a smoldering compound (CO), similar to the NOx∕Nr vs. MCE plot for Fire 047 in Fig. 7. The excellent correlation of Comb-N with CO2 is a broadly applicable result; the R2 parameters for all the fires shown in Fig. S5 had an average of 0.898 and ranged from 0.806 to 0.966. As a consequence, we can conclude that CO2 would be the best tracer for Comb-N in many western US ecosystems where conifers predominate, provided ambient CO2 backgrounds can be properly accounted for as described by Yokelson et al. (2013a).
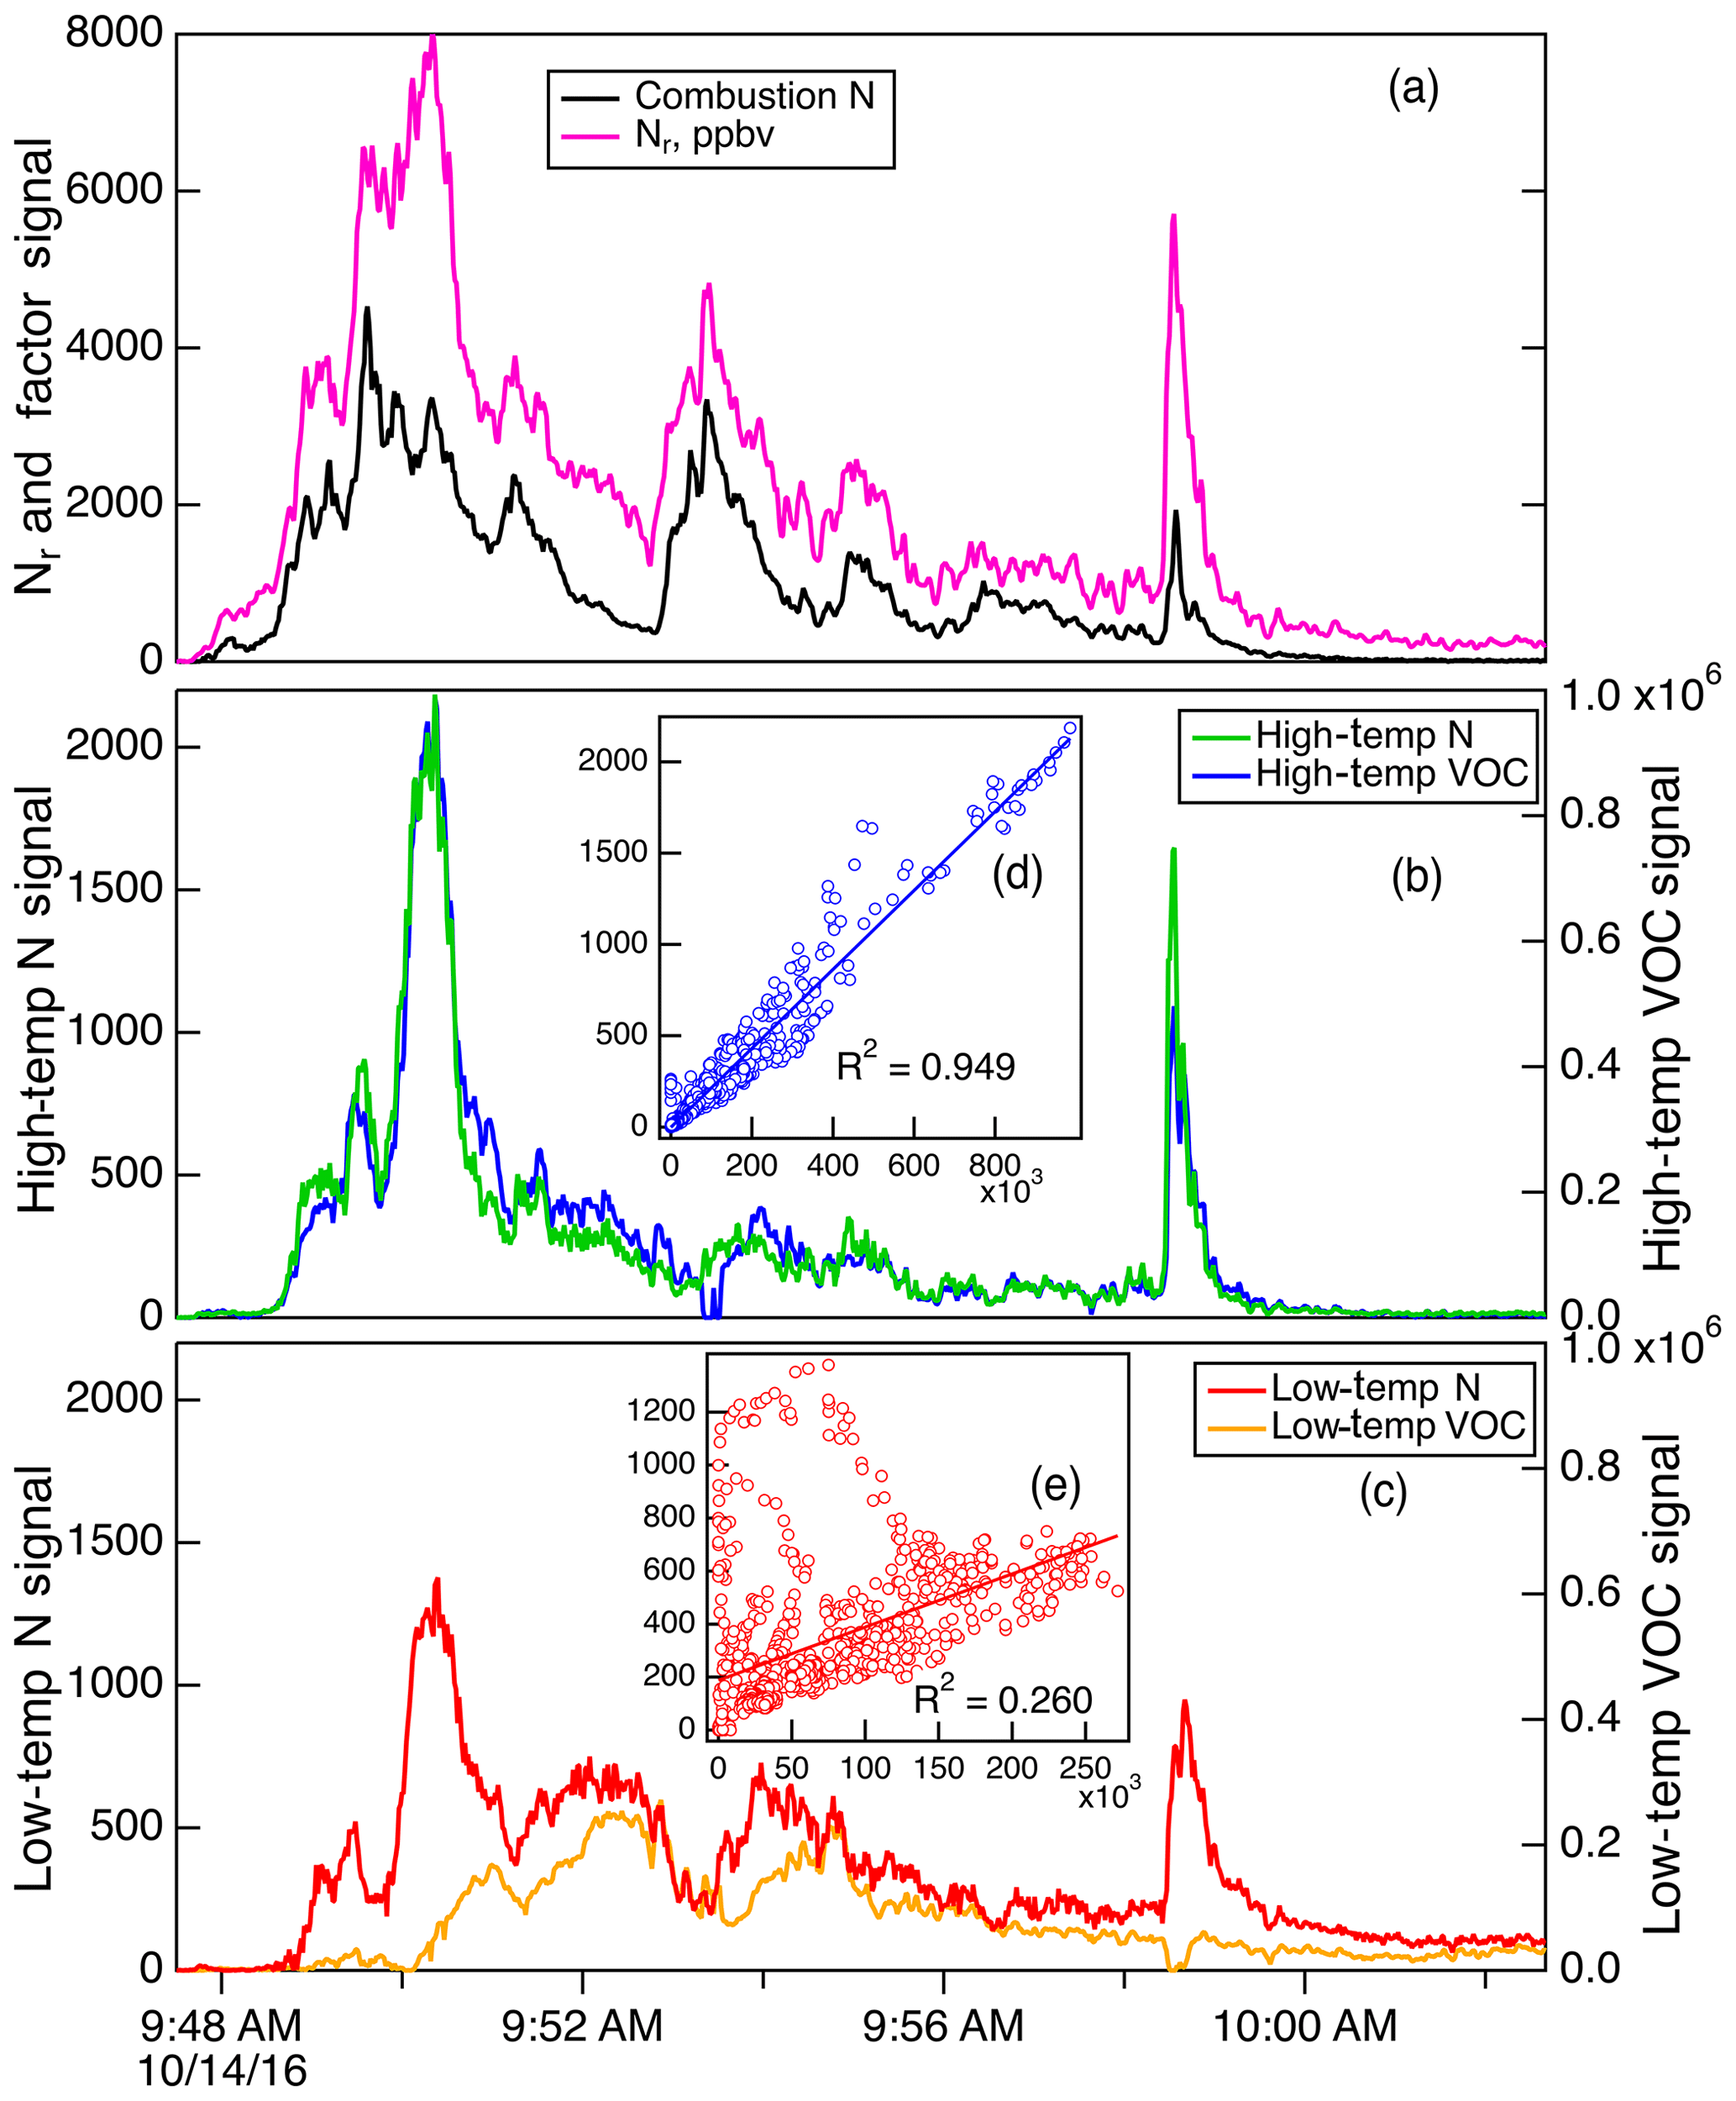
Figure 11Details of the PMF factors for Fire 037 (ponderosa pine). Panel (a) shows the total Nr signal (magenta) and the Comb-N factor (black); panel (b) shows the HT-N factor (green) and HT- VOC factor (blue), and panel (c) shows the LT-N factor (red) and LT-VOC factor (orange). The insets (d) and (e) show the correlation of the two HT factors and the correlation between the two LT factors, respectively.
Our Comb-N factor did not correspond to the high-temperature VOC factor (HT-VOC) found by Sekimoto et al. (2018) in their pyrolysis study, because our broader study includes flaming combustion, which produces NOx and HONO, and almost none of the compounds classified as VOCs survive flaming conditions. However, the HT-N and HT-VOC factors are both linked to pyrolysis and were well correlated for many fires. An example of this is shown in Fig. 11 for Fire 037, a sample that was broadly representative of ponderosa pine (i.e., canopy and litter). This result can be rationalized by the fact that while HT-VOC factors have large contributions from many more compounds than the N compounds measured here, they also have large contributions (>85 %) from HCN, HNCO, and HONO (in other words > 85 % of HCN, HNCO, and HONO are found in the HT-VOC factor). Since the HT-N factors are also heavily weighted by HCN and HNCO, it is reassuring that both of these PMF analyses have independently identified these species as important contributors to the HT fire regime. The R2 correlation coefficients between the HT-N and HT-VOC factors for the coniferous fires shown in Fig. S5 averaged 0.866 and ranged from 0.419 to 0.959. As a consequence of this correlation, we can conclude that HCN is the best marker for the HT-N and HT-VOC factors in most western US wildfires, since HCN is essentially inert on the timescales of fire plumes (Li et al., 2000). It should be noted that other nitriles, particularly acetonitrile, also show up in the HT-N factor, and acetonitrile has also been used as a tracer of biomass combustion. However, it has been shown that this acetonitrile signal can be obscured in urban or industrial areas by solvent usage or can be quite small in woodstove emissions due to low N in the fuel (Coggon et al., 2016).
The correlations of LT-N and LT-VOC factors were not particularly high for most of the coniferous fires shown in Fig. S5. The average R2 was 0.427 with a range of between 0.072 and 0.827. The reasons for this lack of correlation are not clear, as NH3, amines, and amides appear predominantly in both LT factors, and the absolute concentrations of NH3 are usually quite high in these fires relative to VOCs (Sekimoto et al., 2018). However, the LT-VOC factor includes many more compounds with a variety of functional groups not found in the LT-N factor, so it appears that the VOC and N compounds have sufficiently different pyrolysis chemistry that the LT factors do not show much correlation. We conclude that NH3 (and particle ) will be the best marker for the LT-N factor in western US coniferous wildfires, but the LT-VOC chemistry might not be captured reliably by this marker.
3.7 PMF analysis of chaparral fuels
Chaparral is an important ecosystem of concern in wildfires that occur in central and southern California and other areas of the southwestern US. The emissions from burning chaparral fuels (manzanita and chamise) collected at two sites in California were also analyzed as a group and yielded three separate factors in a fashion similar to the coniferous fuels (see Fig. S7 for the PMF timeline). As with the coniferous fuels, there was essentially no change in the three-factor solution with Fpeak, so Fpeak=0 was used, and the Q∕Qexp was 3.8. The chaparral factors had slightly different composition (Fig. S8); the combustion factor was mostly NO, with small amounts of HNCO, HONO, and NH3; the high-temperature factor was dominated by NO2 and included HONO, HCN, and HNCO; and the low-temperature factor was mostly NH3 with a slight amount of NO contributing. The NVOC species were found in both the medium- and low-temperature factors.
There was less similarity between the Comb-N factor and CO2 emissions for chaparral fuels compared to those found for coniferous fuels, with an average correlation coefficient (R2) of 0.689, with a range from 0.244 and 0.950. As a result, there may not be a simple conserved tracer for the combustion factor of these fuel types; however total odd nitrogen (NOy) which is NOx and all the compounds that are produced from NOx in the troposphere, may be useful as it is a reasonably conserved tracer in the absence of wet or dry deposition of particles. Correlation coefficients between the HT-N and HT-VOC factors were on average R2=0.551, with a range 0.047–0.911. The correlations between LT-N and LT-VOC factors were in the same range for chaparral fuels as for coniferous, with average R2=0.447, range 0.028–0.827.
There were some fuels that do not sustain flaming combustion well, specifically duff, Yak dung, and Indonesian peat. These fires exhibited little or no NO emission commensurate with minimal flaming combustion. Instead the emissions were mostly the pyrolysis products NH3, (0.22–0.53 Nr fraction), and HCN (up to 0.32 Nr fraction for peat). It was also apparent that these fires also had unaccounted-for Nr, close to or just over 0.30 (Table S1). The distribution of Nr compounds in the one peat fire that we measured (Fire 055) is in line with those reported for fires measured in situ, which showed relatively high EFs for HCN and NH3 (Stockwell et al., 2016b, 2015).
3.8 Application to real-world fires
The application of our Nr emissions results to real-world fires will depend somewhat on the nature of the information available on a particular fire or fire complex. As a good starting point, or in the absence of detailed N and C analyses of fuels, a Nr∕C ratio of 0.37 % appears to capture most of the fires studied in this work. The Nr could be apportioned according to the results summarized in Table 3. Adjustments to those fractions can be made by scaling slightly by average MCE, with the knowledge that intermediate species (HT-N pyrolysis species) such as HCN and HNCO do not scale in the simple manner that NH3 and NOx do. If measurements of marker compounds are available then CO2, HCN, and the sum can be used for the combustion, high-temperature pyrolysis, and low-temperature pyrolysis factors, respectively.
Seventy-five stack fire experiments were conducted during the FIREX Fire Lab experiments in Fall 2016. A range of fuels characteristic of the western US was burned under conditions and in mixtures meant to represent authentic wildfire conditions, as closely as is possible in the laboratory. Total reactive nitrogen (Nr: all N-containing compounds except N2 and N2O) was measured along with a suite of N-containing compounds in order to obtain a budget for Nr emissions and to examine relationships between fuels, combustion conditions, and emissions chemistry.
Natural convection wildfires do not burn hot enough to produce NOx from N2 and O2, so all Nr emissions come from the fuel N. Almost all of the fires representative of North American ecosystems had emissions that clustered around a Nr∕C ratio of 0.37 %, which can serve as a starting point for scaling emissions from these ecosystems. Comparing total Nr and total carbon emissions with the N∕C ratios of both the original fuel and remaining ash allowed us to estimate that an average of 68 % (±14 %) of the fuel nitrogen ends up as N2 and N2O. This loss of nitrogen can be used to estimate how much fuel nitrogen ends up as Nr. Of the remaining N emitted as Nr, approximately 85 % (±10 %) was accounted for by individually measured gas-phase species, while the rest was most likely particle-bound and , with a smaller contribution from low-volatility species or other species such as cyanogen (Lobert and Warnatz, 1993), that were not quantified by the instruments for individual measurements we used in this study. The speciation and modeling of Nr we present promotes accurate modeling of fire plume chemistry since the photochemistry of many fire plumes is NOx-limited, and NH3 is an important contributor to particle chemistry.
The individual Nr species composition normalized to total Nr, to account for fuel N variability, correlated monotonically with flaming versus vs. smoldering combustion as indicated by modified combustion efficiency (MCE) for some species (e.g., NH3, NOx). Other species, such as HCN and HNCO, peaked at intermediate MCE values. Positive matrix factorization (PMF) showed that all the measured Nr emissions from the main two categories of fuels, conifers, and chaparral, grouped into three mixtures (factors), roughly attributed to temperature: combustion (NOx, HONO), high temperature (HNCO, HCN, nitriles), and low-temperature (NH3, amines, amides). Chemical kinetic and pyrolysis considerations set the temperature ranges for these regimes at approximately 800–1200, 500–800, and <500 ∘C, respectively.
This paper connects mechanistic aspects of N combustion chemistry to the budget of Nr emissions from biomass burning. The emission composition measurements detailed here give useful information concerning what the initial conditions will be in actual fire plumes. These results suggest that for coniferous fuels characteristic of the western US, CO2 is the best marker for flaming combustion, HCN is the best marker for high-temperature pyrolysis processes, and is the best marker for low-temperature pyrolysis processes. The HT-N and HT-VOC pyrolysis factors showed a high degree of correlation especially for coniferous fuels, which can simplify how these different classes of emissions can be estimated. Results from less comprehensive field experiments can be combined with this emissions information to improve the representation of Nr chemistry in the modeling frameworks needed to predict fire plume chemistry and impacts.
The FIREX Fire Lab 2016 data are available at https://esrl.noaa.gov/csd/groups/csd7/measurements/2016firex/FireLab/DataDownload/ (NOAA, 2020b). The descriptions of the measurements can be found at https://esrl.noaa.gov/csd/groups/csd7/measurements/2016firex/FireLab/dataidtable.html (last access: 1 June 2020). The complete ash analyses are available on request.
The supplement related to this article is available online at: https://doi.org/10.5194/acp-20-8807-2020-supplement.
JMR, RJY, CW, and JdG designed the research. The measurements were conducted by JMR, CES, CW, RJY, JdG, YL, VS, ARK, KS, MMC, BY, KJZ, SSB, CS, and SHD. All authors contributed to the discussion and interpretation of the results and writing the paper.
Joost de Gouw worked as a consultant for Aerodyne Research during part of the preparation phase of this paper.
Any mention of brand names or manufacturers is for information purposes only and does not constitute an endorsement.
Abigail R. Koss acknowledges funding from the NSF Graduate Fellowship Program. Kanako Sekimoto acknowledges funding from the Postdoctoral Fellowships for Research Abroad from Japan Society for the Promotion of Science (JSPS) and a Grant-in-Aid for Young Scientists (B) (15K16117) from the Ministry of Education, Culture, Sports, Science and Technology of Japan. Robert J. Yokelson and Vanessa Selimovic were supported by NOAA-CPO grant no. NA16OAR4310100. Joost de Gouw was supported by the NSF AGS grant no. 1748266 under a subcontract to the University of Montana during the analysis phase of this work. We thank the USFS Missoula Fire Sciences Laboratory for their help in conducting these experiments, especially Shawn Urbanski and Thomas Dzomba. This work was also supported by NOAA's Climate Research and Health of the Atmosphere initiatives.
This research has been supported by the Japanese Society for the promotion of Science (grant no. 15K16117), the NOAA Climate Program Office (grant no. NA16OAR4310100), and the National Science Foundation (grant no. NSF AGS1748266).
This paper was edited by Andreas Hofzumahaus and reviewed by two anonymous referees.
Abatzoglou, J. T. and Williams, A. P.: Impact of anthropogenic climate change on wildfire across western US forests, P. Natl. Acad. Sci. USA, 113, 11770–11775, 2016.
Akagi, S. K., Yokelson, R. J., Wiedinmyer, C., Alvarado, M. J., Reid, J. S., Karl, T., Crounse, J. D., and Wennberg, P. O.: Emission factors for open and domestic biomass burning for use in atmospheric models, Atmos. Chem. Phys., 11, 4039–4072, https://doi.org/10.5194/acp-11-4039-2011, 2011.
Akagi, S. K., Craven, J. S., Taylor, J. W., McMeeking, G. R., Yokelson, R. J., Burling, I. R., Urbanski, S. P., Wold, C. E., Seinfeld, J. H., Coe, H., Alvarado, M. J., and Weise, D. R.: Evolution of trace gases and particles emitted by a chaparral fire in California, Atmos. Chem. Phys., 12, 1397–1421, https://doi.org/10.5194/acp-12-1397-2012, 2012.
Alvarado, M. J., Logan, J. A., Mao, J., Apel, E., Riemer, D., Blake, D., Cohen, R. C., Min, K.-E., Perring, A. E., Browne, E. C., Wooldridge, P. J., Diskin, G. S., Sachse, G. W., Fuelberg, H., Sessions, W. R., Harrigan, D. L., Huey, G., Liao, J., Case-Hanks, A., Jimenez, J. L., Cubison, M. J., Vay, S. A., Weinheimer, A. J., Knapp, D. J., Montzka, D. D., Flocke, F. M., Pollack, I. B., Wennberg, P. O., Kurten, A., Crounse, J., Clair, J. M. St., Wisthaler, A., Mikoviny, T., Yantosca, R. M., Carouge, C. C., and Le Sager, P.: Nitrogen oxides and PAN in plumes from boreal fires during ARCTAS-B and their impact on ozone: an integrated analysis of aircraft and satellite observations, Atmos. Chem. Phys., 10, 9739–9760, https://doi.org/10.5194/acp-10-9739-2010, 2010.
Andreae, M. O.: Emission of trace gases and aerosols from biomass burning – an updated assessment, Atmos. Chem. Phys., 19, 8523–8546, https://doi.org/10.5194/acp-19-8523-2019, 2019.
Andreae, M. O. and Merlet, P.: Emission of trace gases and aerosols from biomass burning, Global Biogeochem. Cycles, 15, 955–966, 2001.
Benedict, K. B., Prenni, A. J., Carrico, C. M., Sullivan, A. P., Schichtel, B. A., and Collett Jr., J. L.: Enhanced concentrations of reactive nitrogen species in wildfire smoke, Atmos Environ., 148, 8–15, 2017.
Burling, I. R., Yokelson, R. J., Griffith, D. W. T., Johnson, T. J., Veres, P., Roberts, J. M., Warneke, C., Urbanski, S. P., Reardon, J., Weise, D. R., Hao, W. M., and de Gouw, J.: Laboratory measurements of trace gas emissions from biomass burning of fuel types from the southeastern and southwestern United States, Atmos. Chem. Phys., 10, 11115–11130, https://doi.org/10.5194/acp-10-11115-2010, 2010.
Christian, T. J., Kleiss, B., Yokelson, R. J., Holzinger, R., Crutzen, P. J., W. M., H., Saharjo, B. H., and Ward, D. E.: Comprehensive laboratory measurements of biomass-burning emissions: 1. Emissions from Indonesian, African, and other fuels, J. Geophys. Res., 108, 4719, https://doi.org/10.1029/2003JD003704, 2003.
Coggon, M., Veres, P. R., Yuan, B., Koss, A. R., Warneke, C., Gilman, J. B., Lerner, B., Peischl, J., Aikin, K., Stockwell, C. E., Hatch, L. E., Ryerson, T. B., Roberts, J. M., Yokelson, R. J., and de Gouw, J.: Emissions of nitrogen-containing organic compounds from the burning of herbaceous and arboraceous biomass: fuel composition dependence and the variability of commonly used nitrile tracers, Geophys. Res. Lett., 43, 9903–9912, 2016.
Crutzen, P. J. and Andreae, M. O.: Biomass burning in the tropics: Impact on atmospheric chemistry and biogeochemical cycles, Science, 250, 1669–1678, 1990.
Gilman, J. B., Lerner, B. M., Kuster, W. C., Goldan, P. D., Warneke, C., Veres, P. R., Roberts, J. M., de Gouw, J. A., Burling, I. R., and Yokelson, R. J.: Biomass burning emissions and potential air quality impacts of volatile organic compounds and other trace gases from fuels common in the US, Atmos. Chem. Phys., 15, 13915–13938, https://doi.org/10.5194/acp-15-13915-2015, 2015.
Goode, J. G., Yokelson, R. J., Susott, R. A., and Ward, D. E.: Trace gas emissions from laboratory biomass fires measured by open-path Fourier transform infrared spectroscopy: Fires in grass and surface fuels J. Geophys. Res., 104, 21237–21245, 1999.
Glarborg, P., Miller, J. A., Ruscic, B., and Klippenstein, S. J.: Modeling nitrogen chemistry in combustion, Prog. Energy Comb. Sci., 67, 31–68, 2018.
Griffith, D. W. T., Mankin, W. G., Coffey, M. T., Ward, R. E., and Riebau, A.: FTIR remote sensing of biomass burning emissions of CO2, CO, CH4, CH2O, NO, NO2, NH3, and N2O, in: Global Biomass Burning: Atmospheric, Climatic, and Biospheric Implications, edited by: Levine, J. S., The MIT Press, Cambridge, MA, 1991.
Hansson, K.-M., Samuelsson, J., Tullin, C., and Amand, L.-E.: Formation of HNCO, HCN, and NH3 from the pyrolysis of bark and nitrogen-containing model compounds, Combust. Flame, 137, 265–277, 2004.
Hao, W. M., Scharffe, D. H., Lobert, J. M., and Crutzen, P. J.: Emissions of N2O from the burning of biomass in an experimental system, Geophys. Res. Lett., 18, 999–1002, 1991.
Hardy, J. E. and Knarr, J. J.: Technique for measuring the total concentration of gaseous fixed nirogen species, J. Air Pollut. Contr. Assoc., 32, 376–379, 1982.
Jayarathne, T., Stockwell, C. E., Bhave, P. V., Praveen, P. S., Rathnayake, C. M., Islam, Md. R., Panday, A. K., Adhikari, S., Maharjan, R., Goetz, J. D., DeCarlo, P. F., Saikawa, E., Yokelson, R. J., and Stone, E. A.: Nepal Ambient Monitoring and Source Testing Experiment (NAMaSTE): emissions of particulate matter from wood- and dung-fueled cooking fires, garbage and crop residue burning, brick kilns, and other sources, Atmos. Chem. Phys., 18, 2259–2286, https://doi.org/10.5194/acp-18-2259-2018, 2018.
Jen, C. N., Hatch, L. E., Selimovic, V., Yokelson, R. J., Weber, R., Fernandez, A. E., Kreisberg, N. M., Barsanti, K. C., and Goldstein, A. H.: Speciated and total emission factors of particulate organics from burning western US wildland fuels and their dependence on combustion efficiency, Atmos. Chem. Phys., 19, 1013–1026, https://doi.org/10.5194/acp-19-1013-2019, 2019.
Kashihira, N., Makino, K., Kirita, K., and Watanabe, Y.: Chemiluminescent nitrogen detector-gas chromatotography and its application to measurement of atmospheric ammonia and amines, J. Chromatogr., 239, 617–624, 1982.
Koss, A. R., Sekimoto, K., Gilman, J. B., Selimovic, V., Coggon, M. M., Zarzana, K. J., Yuan, B., Lerner, B. M., Brown, S. S., Jimenez, J. L., Krechmer, J., Roberts, J. M., Warneke, C., Yokelson, R. J., and de Gouw, J.: Non-methane organic gas emissions from biomass burning: identification, quantification, and emission factors from PTR-ToF during the FIREX 2016 laboratory experiment, Atmos. Chem. Phys., 18, 3299–3319, https://doi.org/10.5194/acp-18-3299-2018, 2018.
Kuhlbusch, T. A., Lobert, J. M., Crutzen, P. J., and Warneck, P.: Molecular nitrogen emissions from denitrifcation during biomass burning, Nature, 351, 135–137, 1991.
Lee, B. H., Lopez-Hilfiker, F. D., Mohr, C., Kurten, T., Worsnop, D. R., and Thornton, J. A.: An iodide-adduct high-resolution time-of-flight chemical-ionization mass spectrometer: application to atmospheric inorganic and organic compounds, Environ. Sci. Technol., 48, 6309–6317, 2014.
Lee, D. C., Quigley, T. M., Norman, S., Christie, W., Fox, J., Rogers, K., and Hutchins, M.: National Cohesive Wildland Fire Management Strategy, US Department of the Interior, Washington, D.C., 2014.
Lerner, B. M., Gilman, J. B., Aikin, K. C., Atlas, E. L., Goldan, P. D., Graus, M., Hendershot, R., Isaacman-VanWertz, G. A., Koss, A., Kuster, W. C., Lueb, R. A., McLaughlin, R. J., Peischl, J., Sueper, D., Ryerson, T. B., Tokarek, T. W., Warneke, C., Yuan, B., and de Gouw, J. A.: An improved, automated whole air sampler and gas chromatography mass spectrometry analysis system for volatile organic compounds in the atmosphere, Atmos. Meas. Tech., 10, 291–313, https://doi.org/10.5194/amt-10-291-2017, 2017.
Li, Q., Jacob, D. J., Bey, I., Yantosca, R. M., Zhao, Y., Kondo, Y., and Notholt, J.: Atmospheric hydrogen cyanide (HCN): Biomass burning sources, ocean sink?, Geophys. Res. Lett., 27, 357–360, 2000.
Liu, X., Zhang, Y., Huey, L. G., Yokelson, R. J., Wang, Y., Jimenez, J. L., Campuzano-Jost, P., Beyersdorf, A. J., Blake, D. R., Choi, Y., St. Clair, J. M., Crounse, J. D., Day, D. A., Diskin, G. S., Fried, A., Hall, S. R., Hanisco, T. F., King, L. E., Meinardi, S., Mikoviny, T., Palm, B. B., Peischl, J., Perring, A. E., Pollack, I. B., Ryerson, T. B., Sachse, G. W., Schwarz, J. P., Simpson, I. J., Tanner, D. J., Thornhill, K. L., Ullman, K., Weber, R. J., Wennberg, P. O., Wisthaler, A., Wolfe, G. M., and Ziemba, L. D.: Agricultural fires in the southeastern US during SEAC4RS: Emissions of trace gases and particles and evolution of ozone, reactive nitrogen, and organic aerosol, J. Geophys. Res., 121, 7383–7414, 2016.
Liu, X., Huey, L. G., Yokelson, R. J., Selimovic,V., Simpson, I. J., Muller, M., Jimenez, J. L., Campuzano-Jost, P., Beyersdorf, A. J., Blake, D. R., Butterfield, Z., Choi, Y., Crounse, J. D., Day, D. A., Diskin, G. S., Dubey, M. K., Fortner, E., Hanisco, T. F., Hu, W., King, L. E., Kleinman, L., Meinardi, S., Mikoviny, T., Onasch, T. B., Palm, B. B., Peischl, J., Pollack, I. B., Ryerson, T. B., Sachse, G. W., Sedlacek, A. J., Shilling, J. E., Springston, S. R., St. Clair, J. M., Tanner, D. J., Teng, A. P., Wennberg, P. O., Wisthaler, A., and Wolfe, G. M.: Airborne measurements of western US wildfire emissions: Comparison with presscribed burning and air quality implications, J. Geophys. Res., 122, 6108–6129, 2017.
Liu, X., Luo, Z., Yu, C., Jin, B., and Tu, H.: Release mechanism of fuel-N into NOx and N2O precursors during pyrolysis of rice straw, Energies, 11, 520, https://doi.org/10.3390/en11030520, 2018.
Lobert, J. M. and Warnatz, J.: Emissions from the combustion process in vegetation, in: Fire in the Environment: The Ecological, Atmospheric and Climatic Importance of Vegetation Fires, edited by: Crutzen, P. J. and Goldhammer, J. G., John Wiley and Sons, New York, NY, 1993.
Lobert, J. M., Scharffe, D. H., Hao, W. M., and Crutzen, P. J.: Importance of biomass burning in the atmospheric budgets of nitrogen-containing gases, Nature, 346, 552–554, 1990.
Lobert, J. M., Scharffe, D. H., Hao, W.-M., Kuhlbusch, T. A., Seuwen, R., Warneck, P., and Crutzen, P. J.: Experimental evaluation of biomass burning emissions: Nitrogen and carbon containing compounds, in: Global Biomass Burning: Atmospheric, Climatic, and Biospheric Implications, edited by: Levine, J. S., The MIT Press, Cambridge, MA, 1991.
Lucassen, A., Zhang, K., Warkentin, J., Mashammer, K., Glarborg, P., Marshall, P., and Kohse-Hoinghaus, K.: Fuel-nitrogen conversion in the combustion of small amines using dimethylamine and ethylamine as biomass-related model fuels, Combust. Flame, 159, 2254–2279, 2012.
Manfred, K. M., Washenfelder, R. A., Wagner, N. L., Adler, G., Erdesz, F., Womack, C. C., Lamb, K. D., Schwarz, J. P., Franchin, A., Selimovic, V., Yokelson, R. J., and Murphy, D. M.: Investigating biomass burning aerosol morphology using a laser imaging nephelometer, Atmos. Chem. Phys., 18, 1879–1894, https://doi.org/10.5194/acp-18-1879-2018, 2018.
Manion, J. A., Huie, R. E., Levin, R. D., Burgess Jr., D. R., Orkin, V. L., Tsang, W., McGivern, W. S., Hudgens, J. W., Knyazev, V. D., Atkinson, D. B., Cahi, E., Tereza, A. M., Lin, C.-Y., Allison, T. C., Mallard, W. G., Westley, F., Herron, J. T., Hampson, R. F., and Frizzell, D. H.: NIST Chemical Kinetics Database, NIST Standard Reference Database 17, Version 7.0 (Web Version), Release 1.6.8, available at: http://kinetics.nist.gov/ (last access: 1 June 2020), 2015.
Marx, O., Brümmer, C., Ammann, C., Wolff, V., and Freibauer, A.: TRANC – a novel fast-response converter to measure total reactive atmospheric nitrogen, Atmos. Meas. Tech., 5, 1045–1057, https://doi.org/10.5194/amt-5-1045-2012, 2012.
May, A. A., McMeeking, G. R., Lee, T., Taylor, J. W., Craven, J. S., Burling, I. R., Sullivan, A. P., Akagi, S. K., Collett Jr., J. L. J., Flynn, M., Coe, H., Urbanski, S. P., Seinfeld, J. H., Yokelson, R. J., and Kreidenweis, S. M.: Aerosol emissions from prescribed fires in the United States: A synthesis of laboratory and aircraft measurements, J. Geophys. Res., 119, 11826–11849, 2014.
McMeeking, G. R., Kreidenweis, S. M., Baker, S., Carrico, C. M., Chow, J. C., Collett Jr., J. L., Hao, W. M., Holden, A. S., Kirchstetter, T. W., Malm, W. C., Moosmuller, H., Sullivan, A. P., and Wold, C. E.: Emissions of trace gases and aerosols during the open combustion of biomass in the laboratory, J. Geophys. Res., 114, D19210, https://doi.org/10.1029/2009JD011836, 2009.
Min, K.-E., Washenfelder, R. A., Dubé, W. P., Langford, A. O., Edwards, P. M., Zarzana, K. J., Stutz, J., Lu, K., Rohrer, F., Zhang, Y., and Brown, S. S.: A broadband cavity enhanced absorption spectrometer for aircraft measurements of glyoxal, methylglyoxal, nitrous acid, nitrogen dioxide, and water vapor, Atmos. Meas. Tech., 9, 423–440, https://doi.org/10.5194/amt-9-423-2016, 2016.
NOAA: Fire Lab 2016, available at: https://www.esrl.noaa.gov/csl/projects/firex/firelab/, last access: 20 July 2020a.
NOAA: FIREX Fire Lab 2016 data, available at: https://esrl.noaa.gov/csd/groups/csd7/measurements/2016firex/FireLab/DataDownload/, last access: 21 July 2020b.
Paatero, P. and Tapper, U.: Positive matrix factorization: A non-negative factor model with optimal utilization of error estimates of data values, Environmetrics, 5, 111–126, 1994.
Prenni, A. J., Levin, E. J. T., Benedict, K. B., Sullivan, A. P., Schurman, M. I., Gebhart, K. A., Day, D. E., Carrico, C. M., Malm, W. C., Schichtel, B. A., Collett Jr., J. L., and Kreidenweis, S. M.: Gas-phase reactive nitrogen near Grand Teton National Park: Impacts of transport, anthropogenic emissions, and biomass burning, Atmos. Environ., 89, 749–756, 2014.
Ren, Q. Q., Zhao, C. S., Wu, X. X., Liang, C., Chen, X. P., Shen, J. Z., and Wang, Z.: Formation of NOx precursors during wheat straw pyrolysis and gasification with O2 and CO2, Fuel, 89, 1064–1069, 2010.
Roberts, J. M., Langford, A. O., Goldan, P. D., and Fehsenfeld, F. C.: Ammonia measurements at Niwot Ridge, Colorado, and Point Arena, California, using the tungsten oxide denuder tube technique, J. Atmos. Chem., 7, 137–152, 1988.
Roberts, J. M., Veres, P. R., Cochran, A. K., Warneke, C., Burling, I. R., Yokelson, R. J., Lerner, B. M., Gilman, J. B., Kuster, W. C., Fall, R., and de Gouw, J.: Isocyanic acid in the atmosphere and its possible link to smoke-related health effects, P. Natl. Acad. Sci. USA, 108, 8966–8971, 2011.
Saylor, R. D., Edgerton, E. S., Hartsell, B. E., Baumann, K., and Hansen, D. A.: Continuous gaseous and total ammonia measurements from the southeastern aerosol research and characterization (SEARCH) study, Atmos. Environ., 44, 4994–5004, 2010.
Schwab, J. J., Li, Y., Bae, M.-S., Demerjian, K. L., Hou, J., Zhou, X., Jensen, B., and Pryor, S.: A laboratory intercomparision of real-time gaseous ammonia measurement methods, Environ. Sci. Technol., 41, 8412–8419, 2007.
Sekimoto, K., Li, S.-M., Yuan, B., Koss, A. R., Coggon, M. M., Warneke, C., and de Gouw, J.: Calculation of the sensitivity of proton-transfer-reaction mass spectrometry (PTR-MS) for organic trace gases using molecular properties, Int. J. Mass Spectrom., 421, 71–94, 2017.
Sekimoto, K., Koss, A. R., Gilman, J. B., Selimovic, V., Coggon, M. M., Zarzana, K. J., Yuan, B., Lerner, B. M., Brown, S. S., Warneke, C., Yokelson, R. J., Roberts, J. M., and de Gouw, J.: High- and low-temperature pyrolysis profiles describe volatile organic compound emissions from western US wildfire fuels, Atmos. Chem. Phys., 18, 9263–9281, https://doi.org/10.5194/acp-18-9263-2018, 2018.
Selimovic, V., Yokelson, R. J., Warneke, C., Roberts, J. M., de Gouw, J., Reardon, J., and Griffith, D. W. T.: Aerosol optical properties and trace gas emissions by PAX and OP-FTIR for laboratory-simulated western US wildfires during FIREX, Atmos. Chem. Phys., 18, 2929–2948, https://doi.org/10.5194/acp-18-2929-2018, 2018.
Shaddix, C. R., Harrington, J. E., and Smyth, K. C.: Quantitative measurements of enhanced soot production in a flickering methane/air diffusion flame, Combust. Flame, 99, 723–732, 1994.
Stockwell, C. E., Yokelson, R. J., Kreidenweis, S. M., Robinson, A. L., DeMott, P. J., Sullivan, R. C., Reardon, J., Ryan, K. C., Griffith, D. W. T., and Stevens, L.: Trace gas emissions from combustion of peat, crop residue, domestic biofuels, grasses, and other fuels: configuration and Fourier transform infrared (FTIR) component of the fourth Fire Lab at Missoula Experiment (FLAME-4), Atmos. Chem. Phys., 14, 9727–9754, https://doi.org/10.5194/acp-14-9727-2014, 2014.
Stockwell, C. E., Veres, P. R., Williams, J., and Yokelson, R. J.: Characterization of biomass burning emissions from cooking fires, peat, crop residue, and other fuels with high-resolution proton-transfer-reaction time-of-flight mass spectrometry, Atmos. Chem. Phys., 15, 845–865, https://doi.org/10.5194/acp-15-845-2015, 2015.
Stockwell, C. E., Christian, T. J., Goetz, J. D., Jayarathne, T., Bhave, P. V., Praveen, P. S., Adhikari, S., Maharjan, R., DeCarlo, P. F., Stone, E. A., Saikawa, E., Blake, D. R., Simpson, I. J., Yokelson, R. J., and Panday, A. K.: Nepal Ambient Monitoring and Source Testing Experiment (NAMaSTE): emissions of trace gases and light-absorbing carbon from wood and dung cooking fires, garbage and crop residue burning, brick kilns, and other sources, Atmos. Chem. Phys., 16, 11043–11081, https://doi.org/10.5194/acp-16-11043-2016, 2016a.
Stockwell, C. E., Jayarathne, T., Cochrane, M. A., Ryan, K. C., Putra, E. I., Saharjo, B. H., Nurhayati, A. D., Albar, I., Blake, D. R., Simpson, I. J., Stone, E. A., and Yokelson, R. J.: Field measurements of trace gases and aerosols emitted by peat fires in Central Kalimantan, Indonesia, during the 2015 El Niño, Atmos. Chem. Phys., 16, 11711–11732, https://doi.org/10.5194/acp-16-11711-2016, 2016b.
Stockwell, C. E., Kupc, A., Witkowski, B., Talukdar, R. K., Liu, Y., Selimovic, V., Zarzana, K. J., Sekimoto, K., Warneke, C., Washenfelder, R. A., Yokelson, R. J., Middlebrook, A. M., and Roberts, J. M.: Characterization of a catalyst-based conversion technique to measure total particulate nitrogen and organic carbon and comparison to a particle mass measurement instrument, Atmos. Meas. Tech., 11, 2749–2768, https://doi.org/10.5194/amt-11-2749-2018, 2018.
Taylor, S. W., Wotton, B. M., Alexander, M. E., and Dalrymple, G. N.: Variation in wind and crown fire behaviour in a northern jack pine–black spruceforest, Can. J. Forest Res., 34, 1561–1576, 2004.
Ulbrich, I. M., Canagaratna, M. R., Zhang, Q., Worsnop, D. R., and Jimenez, J. L.: Interpretation of organic components from Positive Matrix Factorization of aerosol mass spectrometric data, Atmos. Chem. Phys., 9, 2891–2918, https://doi.org/10.5194/acp-9-2891-2009, 2009.
Veres, P. R., Roberts, J. M., Burling, I. R., Warneke, C., de Gouw, J., and Yokelson, R. J.: Measurements of gas-phase inorganic and organic acids from biomass fires by negative-ion proton-transfer chemical-ionization mass spectrometry (NI-PT-CIMS), J. Geophys. Res.-Atmos., 115, D23302, https://doi.org/10.1029/2010JD014033, 2010.
Warneke, C., Roberts, J. M., Veres, P., Gilman, J. B., Kuster, W. C., Burling, I. R., Yokelson, R. J., and de Gouw, J. A.: VOC identification and inter-comparison from laboratory biomass burning using PTR-MS and PIT-MS, Int. J. Mass Spectrom., 303, 6–14, 2011.
Westerling, A. L., Hidalgo, H. G., Cayan, D. R., and Swetnam, T. W.: Warming and earlier spring increase western us forest wildfire activity, Science, 313, 940–943, 2006.
Williams, E. J., Baumann, K., Roberts, J. M., Bertman, S. B., Norton, R. B., Fehsenfeld, F. C., Springston, S. R., Nunnermacker, L. J., Newman, L., Olszyna, K., Meagher, J., Hartsell, B., Edgerton, E., Pearson, J. R., and Rodgers, M. O.: Intercomparison of ground-based NOy measurement techniques, J. Geophys. Res.-Atmos., 103, 22261–22280, https://doi.org/10.1029/98JD00074, 1998.
Wotton, B. M., Gould, J. S., McCaw, W. L., Cheney, N. P., and Taylor, S. W.: Flame temperature and residence time of fires in dry eucalypt forest, Int. J. Wildland Fire, 21, 270–281, 2012.
Yokelson, R. J., Griffith, D. W. T., and Ward, D. E.: Open-path Fourier transform infrared studies of large-scale laboratory biomass fires, J. Geophys. Res.-Atmos., 101, 21067–21080, 1996.
Yokelson, R. J., Crounse, J. D., DeCarlo, P. F., Karl, T., Urbanski, S., Atlas, E., Campos, T., Shinozuka, Y., Kapustin, V., Clarke, A. D., Weinheimer, A., Knapp, D. J., Montzka, D. D., Holloway, J., Weibring, P., Flocke, F., Zheng, W., Toohey, D., Wennberg, P. O., Wiedinmyer, C., Mauldin, L., Fried, A., Richter, D., Walega, J., Jimenez, J. L., Adachi, K., Buseck, P. R., Hall, S. R., and Shetter, R.: Emissions from biomass burning in the Yucatan, Atmos. Chem. Phys., 9, 5785–5812, https://doi.org/10.5194/acp-9-5785-2009, 2009.
Yokelson, R. J., Andreae, M. O., and Akagi, S. K.: Pitfalls with the use of enhancement ratios or normalized excess mixing ratios measured in plumes to characterize pollution sources and aging, Atmos. Meas. Tech., 6, 2155–2158, https://doi.org/10.5194/amt-6-2155-2013, 2013a.
Yokelson, R. J., Burling, I. R., Gilman, J. B., Warneke, C., Stockwell, C. E., de Gouw, J., Akagi, S. K., Urbanski, S. P., Veres, P., Roberts, J. M., Kuster, W. C., Reardon, J., Griffith, D. W. T., Johnson, T. J., Hosseini, S., Miller, J. W., Cocker III, D. R., Jung, H., and Weise, D. R.: Coupling field and laboratory measurements to estimate the emission factors of identified and unidentified trace gases for prescribed fires, Atmos. Chem. Phys., 13, 89–116, https://doi.org/10.5194/acp-13-89-2013, 2013b.
Zarzana, K. J., Selimovic, V., Koss, A. R., Sekimoto, K., Coggon, M. M., Yuan, B., Dubé, W. P., Yokelson, R. J., Warneke, C., de Gouw, J. A., Roberts, J. M., and Brown, S. S.: Primary emissions of glyoxal and methylglyoxal from laboratory measurements of open biomass burning, Atmos. Chem. Phys., 18, 15451–15470, https://doi.org/10.5194/acp-18-15451-2018, 2018.