the Creative Commons Attribution 4.0 License.
the Creative Commons Attribution 4.0 License.
 | 23 Jul 2020
Why is the Indo-Gangetic Plain the region with the largest NH3 column in the globe during pre-monsoon and monsoon seasons?
Tiantian Wang
Yu Song
Zhenying Xu
Mingxu Liu
Tingting Xu
Wenling Liao
Lifei Yin
Xuhui Cai
Ling Kang
Hongsheng Zhang
Satellite observations show a global maximum in ammonia (NH3) over the Indo-Gangetic Plain (IGP), with a peak from June to August. However, it has never been explained explicitly. In this study, we investigated the causes of high NH3 loading over the IGP during the pre-monsoon and monsoon seasons using WRF-Chem (Weather Research and Forecasting model coupled to chemistry). The IGP has relatively high NH3 emission fluxes (0.4 t km−2 month−1) due to intensive agricultural activities and high air temperature from June to August. Additionally, low sulfur dioxide (SO2) and nitrogen oxides (NOx) emissions and high air temperature limit the gas-to-particle conversion of NH3, particularly for ammonium nitrate formation. Moreover, the barrier effects of the Himalayas in combination with the surface convergence weaken the horizontal diffusion of NH3. The high NH3 loading over the IGP mainly results from the low gas-to-particle partitioning of NH3 caused by low SO2 and NOx emissions. It contrasts to those in the North China Plain, where high SO2 and NOx emissions promote the conversion of gaseous NH3 into particulate ammonium.
- Article
(7759 KB) -
Supplement
(4323 KB) - BibTeX
- EndNote


Ammonia (NH3) has multiple environmental implications. As the only alkaline gas in the atmosphere, it reacts with sulfuric acid (H2SO4) or nitric acid (HNO3) to produce ammonium () containing aerosols (Seinfeld and Pandis, 2006), which can affect the Earth's radiative balance (Abbatt et al., 2006; Adams et al., 2001) and endanger public health (Pope et al., 2002; Stokstad, 2014). In addition, NH3 is the main form of reactive nitrogen in the environment (Reis et al., 2009), and the deposition of ammonia and ammonium can cause acidification of terrestrial ecosystems and eutrophication of water bodies (Paerl et al., 2014).
Satellite observations (Van Damme et al., 2018; Warner et al., 2016) and ground-based measurements (Carmichael et al., 2003) have revealed that the Indo-Gangetic Plain (IGP) has the global maximum NH3 loading, particularly from June to August. Previous studies have suggested that the high NH3 loading over the IGP is caused by high NH3 emissions from intensive agricultural activities (Clarisse et al., 2009; Van Damme et al., 2015b). Interestingly, satellite measurements show that the total columns of NH3 over the IGP are much higher than those over the North China Plain (NCP), which has higher NH3 emissions fluxes (http://www.meicmodel.org/dataset-mix, last access: 10 May 2019). Therefore, emissions alone might not be enough to explain the high NH3 loading over the IGP.
Apart from dry deposition and wet removal by precipitation, another main sink for NH3 is scavenging by acidic species to form particulate . H2SO4 and HNO3 resulting from the oxidation of sulfur dioxide (SO2) and nitrogen oxides (NOx) are major acidic species in the atmosphere. Previous studies have confirmed that reduced SO2 and NOx emissions are key factors driving the increase in NH3 concentration (Liu et al., 2018; Yu et al., 2018; Warner et al., 2017). In addition, meteorological conditions (including wind speed, precipitation, relative humidity, and air temperature) also influence NH3 loading through various chemical and physical processes. These factors may be causing the high NH3 loading over the IGP, but these assumptions have not been verified in a modeling study.
In this study, we use a regional air quality model to investigate the causes of high NH3 loading over the IGP during the pre-monsoon and monsoon seasons. This is the first study to analyze the causes of high NH3 loading over the IGP. The remainder of this paper is organized as follows. The air quality model and observational data are described in Sect. 2. Section 3 analyzes the influences of several factors (including emissions, chemical conversion, and meteorological conditions) on NH3 loading. Among them, SO2 and NOx emissions over the IGP are compared to those over the NCP to clearly illustrate their impacts on NH3 loading. Section 4 provides concluding remarks.
2.1 WRF-Chem model and emissions inventory
WRF-Chem (Fast et al., 2006; Grell et al., 2005) version 3.6.1 was applied to investigate the cause of the high NH3 loading over the IGP during the pre-monsoon and monsoon seasons. The simulation was performed on a domain with 30 km horizontal resolution covering the northern part of India and parts of Pakistan, Nepal, China, and Bangladesh with 120×90 grid cells. There were 23 vertical levels from the surface to the top pressure of 50 hPa. The simulations were conducted from 25 May to 31 August 2010 and the first 7 d (25–31 May) were treated as the spin-up period. June was considered the pre-monsoon season. July to August was considered the monsoon season. The initial meteorological and boundary conditions were obtained from the National Centers for Environmental Prediction Final Analysis with a 6 h temporal resolution. The CBM-Z (Carbon Bond Mechanism version Z) chemical mechanism (Zaveri and Peters, 1999) and MOSAIC (Model for Simulating Aerosol Interactions and Chemistry) aerosol module (Zaveri et al., 2008) were used for modeling gas-phase photochemistry and aerosol processes (including nucleation, coagulation, condensation and thermodynamic equilibrium), respectively. Dry deposition for trace gases and aerosols was treated following the methods of Wesely (1989) and Binkowski and Shankar (1995), respectively. Wet deposition in the model includes both in-cloud and below-cloud scavenging. The below-cloud scavenging of aerosols and trace gases was calculated based on the methods of Easter et al. (2004). More model configurations are described in Table S1 in the Supplement.
Anthropogenic emissions were obtained from the MIX inventory (Li et al., 2017), an Asian anthropogenic emissions inventory that harmonizes several local inventories using a mosaic approach. MIX uses the Regional Emissions Inventory in Asia (REAS2, version 2) (Kurokawa et al., 2013) for NH3 emissions in India.
2.2 Observational data set
Atmospheric total columns of NH3 were derived from measurements of an Infrared Atmospheric Sounding Interferometer (IASI) onboard MetOp-A (https://iasi.aeris-data.fr/NH3/, last access: 21 Apr 2019). Metop-A was launched in 2006 in a Sun-synchronous orbit with mean local solar overpass times of 09:30 and 21:30. Only the daytime measurements have been used here, because the nighttime measurements had larger relative errors caused by the generally lower thermal contrast for the nighttime overpass (Van Damme et al., 2014). It has been found that the IASI samples at the overpass time could represent the entire day, and IASI NH3 observations are in fair agreement with the available ground-based and airborne data sets around the world (Dammers et al., 2016; Van Damme et al., 2015a). However, due to the lack of publicly available ammonia observation data sets in the IGP, previous studies have not evaluated IASI NH3 in the IGP. This work used the ANNI-NH3-v2.2R-I retrieval product, which relied on ERA-Interim reanalysis for its meteorological inputs (Van Damme et al., 2017). The mean NH3 column concentrations over East Asia on a grid from June to August 2010 have been determined based on the relative error weighting mean method (Van Damme et al., 2014). SO2 columns from June to August 2010 were derived from the Level-3 Aura/OMI Global SO2 Data Products (OMSO2e) (Krotkov et al., 2015). Tropospheric NO2 columns from the Ozone Monitoring Instrument (OMI) aboard the NASA Aura satellite were used from June to August 2010 (http://www.temis.nl/airpollution/no2col/no2regioomimonth_qa.php, last access: 15 May 2019).
Meteorological data at 38 sites over northern India obtained from the National Climate Data Center (https://gis.ncdc.noaa.gov/maps/ncei/cdo/hourly, last access: 26 May 2019) were used to evaluate the accuracy of meteorological simulations. The evaluated variables included hourly wind speed at 10 m (WS10), wind direction at 10 m (WD10), relative humidity at 2 m (RH2), and temperature at 2 m (T2). The statistical parameters included the mean bias (MB), normalized mean bias (NMB), root mean square error (RMSE), and correlation coefficient (R). In addition, air temperatures at 21 sites over the NCP obtained from the National Climate Data Center were also used in this work.
2.3 ISORROPIA-II thermodynamic model
The thermodynamic equilibrium model, ISORROPIA-II (Fountoukis and Nenes, 2007), treating the thermodynamics of the –––K+–Ca2+–Mg2+–Na+–Cl−–H2O aerosol system, was used to investigate the influence of air temperature on the NH3 total columns. In this study, ISORROPIA-II was run in the “forward mode” and assuming particles are “metastable” with no solid precipitates. The chemical and meteorological data from WRF-Chem, including water-soluble ions (, , , Cl−, Na+) in PM2.5, gaseous precursors (NH3, HNO3, HCl), temperature (T), and relative humidity (RH), are used as the inputs of ISORROPIA-II. Using ISORROPIA-II, we simulated 20 scenarios. In these cases, the air temperature of each layer increased or decreased by 10 ∘C synchronously, with the interval of 1 ∘C. Meanwhile, the other input parameters remained the same. Then, we calculated the columnar ε() (partitioning ratios of to total ammonia (TA, TA = NH3 + )) in each case. The columnar ε() is the sum of the ε() of each vertical level, but each weighted by the thickness of the layer and mass concentration of TA. Sensitivity tests were firstly conducted based on the average of the entire IGP from June to August. Then, the IGP was divided equally from northwest to southeast into three regions (namely western IGP, central IGP, and eastern IGP), and the study period was divided into the pre-monsoon season (June) and the monsoon season (July to August). Sensitivity tests were conducted for the three regions under the two seasons.
3.1 High NH3 emissions
The IGP is a vast stretch of fertile alluvial plain spanning the banks of the Indus and Ganges rivers and their tributaries. The main part of the IGP is located in India. The estimated NH3 emissions in India in 2010 were 9.9 Tg, which is comparable to that in China (9.8 Tg) and accounts for about 34 % of total NH3 emissions in Asia (Li et al., 2017). Agriculture is the largest NH3 emitter in India, accounting for about 76 % of the total NH3 emissions (Li et al., 2017). Agricultural NH3 emissions mainly originate from animal husbandry and fertilizer application (Bouwman et al., 1997; Streets et al., 2003). India is the second largest N-fertilizer consumer (after China) and consumes 16.5 Tg of N fertilizer (16 % of the world's total) (FAOSTAT, 2010). In addition, there are an estimated 302 million cattle and buffalo in India (19 % of the world's total), which is more than any other country (FAOSTAT, 2010). It is estimated that cattle and buffalo account for about 80 % of NH3 emissions among livestock in India (Aneja et al., 2012).
NH3 emissions over the IGP were 4.3 Tg in 2010 (estimated using the MIX database), which was mainly attributed to intensive agricultural practices. The IGP is known as the food bowl of India, spread across the states of Punjab, Haryana, Uttar Pradesh, Bihar, and West Bengal (blue quadrangle in Fig. 1). The total number of cattle and buffalo in the five states was estimated to be 103 million (34 % of the national total) in 2012 (GoI, 2012b). The total amount of N fertilizer applied in the five states was estimated to be 6.9 Tg (42 % of the national total) in 2010 (GoI, 2012a). NH3 emissions over the IGP from June to August are very high, with a regional mean NH3 emissions flux of 0.4 t km−2 per month (estimated using the MIX database for 2010). This is consistent with satellite observations, which also show a peak of NH3 columns over the IGP from June to August (Van Damme et al., 2015b). The peak of NH3 emissions over the IGP might be the joint result of intensive N-fertilizer applications and high temperature. The IGP has two cropping cycles including summer and winter (GoI, 2012a). June to August is one of the two main sowing periods in the IGP, with a large amount of N fertilizer applied to the cropland as the base fertilizer. The monthly map of N-fertilizer application amounts from Nishina et al. (2017) shows that there are two peaks in N-fertilizer application amounts over the IGP, with one in May–August and the other in November–December, which is consistent with the two cropping cycles in the IGP. In addition, the air temperature is very high over the IGP, with an observed regional mean value of 30.9 ∘C from June to August 2010. Ammonia emissions increase exponentially with temperature (Riddick et al., 2016). The high application rate of N fertilizer and high air temperature could cause high NH3 emissions, resulting in the high NH3 columns.
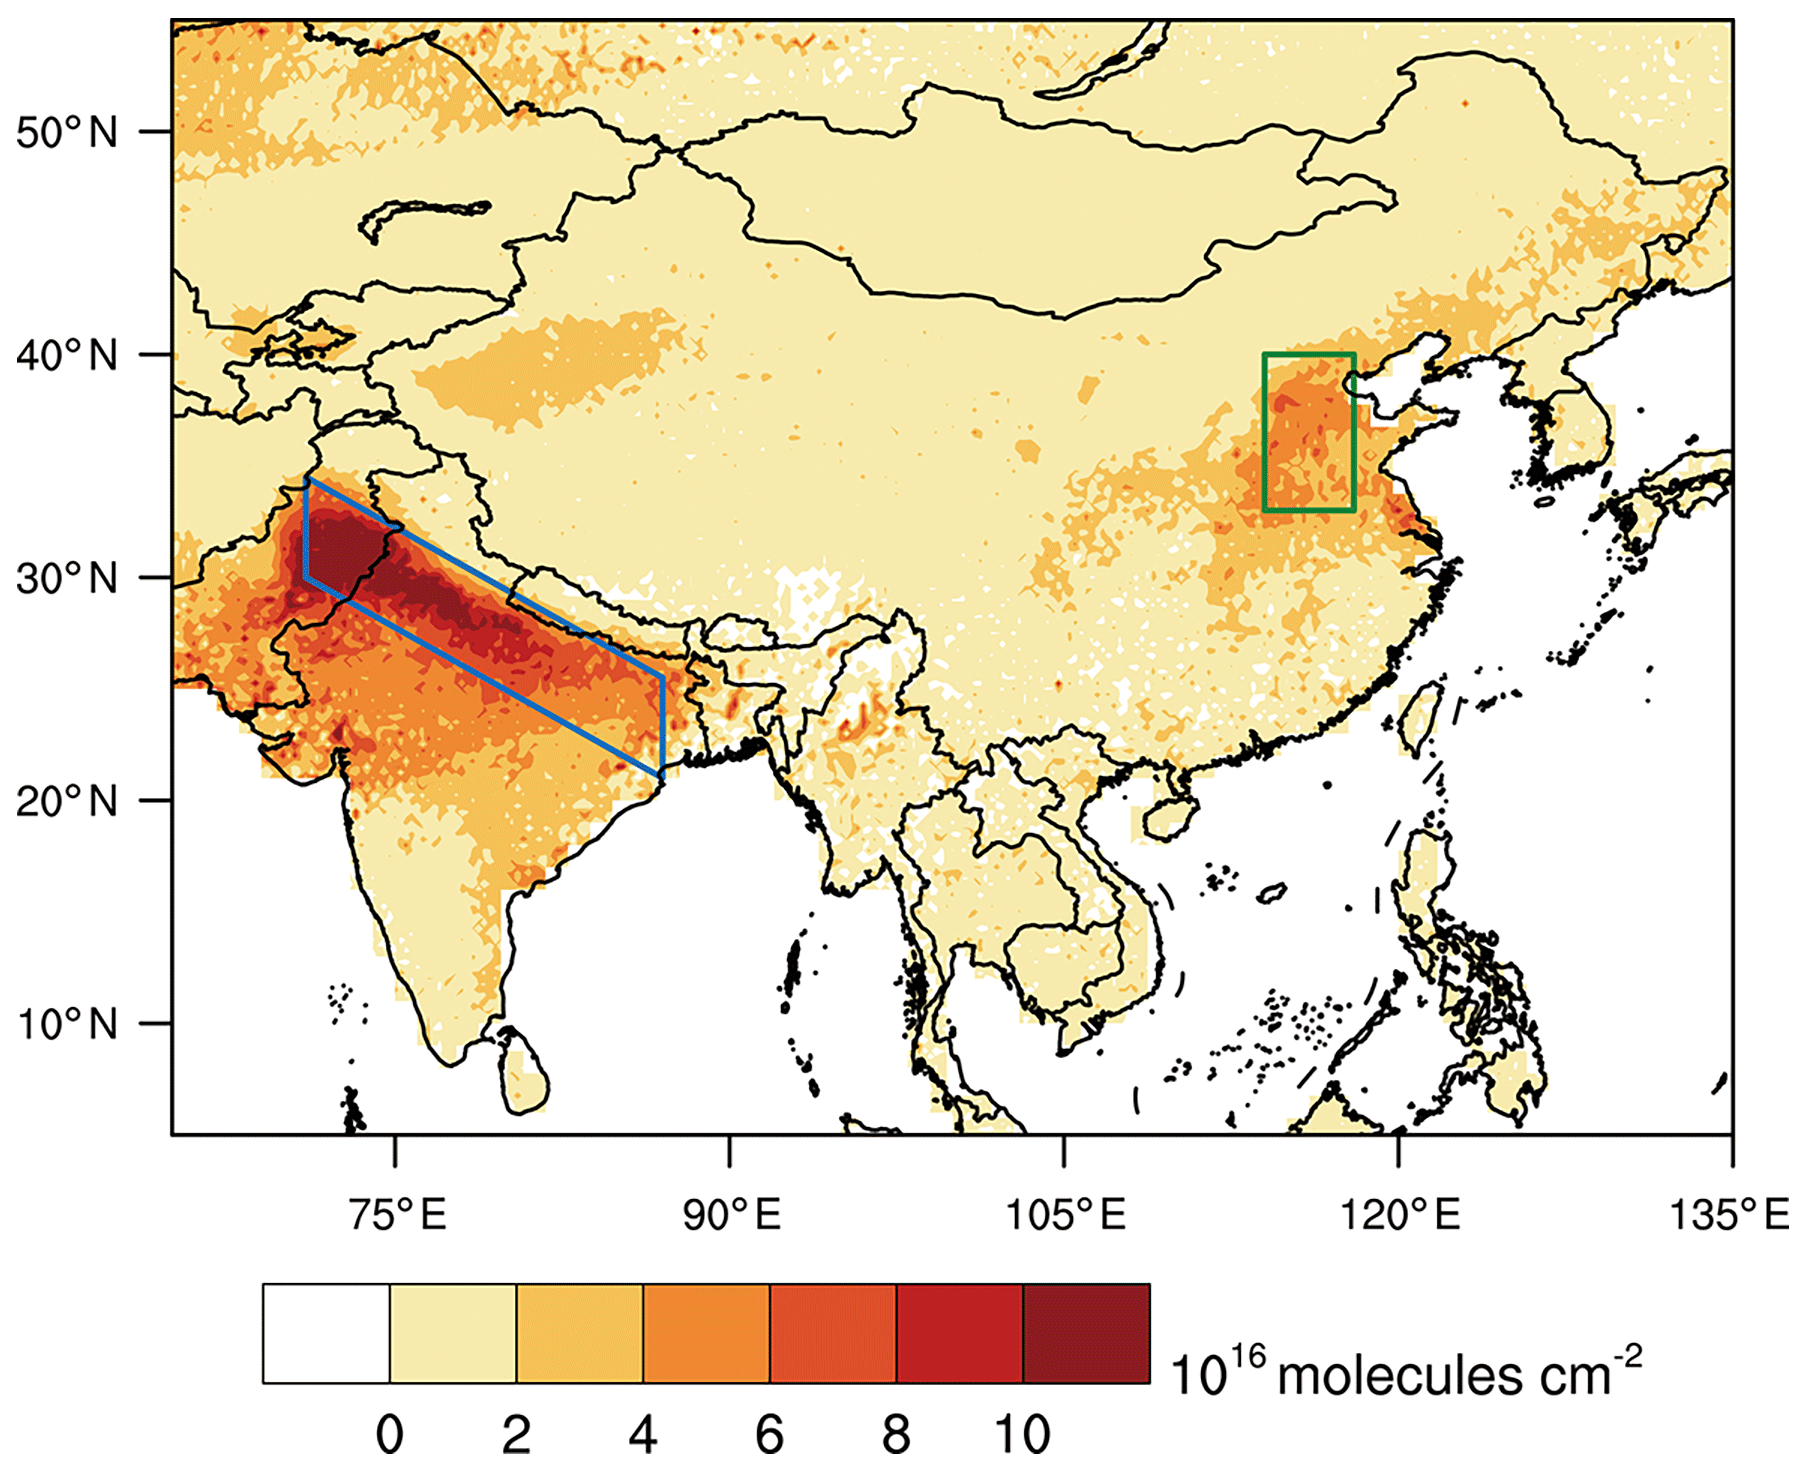
Figure 1The spatial distribution of NH3 total columns over East Asia from June to August 2010 retrieved from IASI measurements. The blue quadrangle represents the Indo-Gangetic Plain (IGP), and the green quadrangle represents the North China Plain (NCP).
The spatial distribution of mean NH3 total columns over East Asia from June to August 2010 is shown in Fig. 1. The NH3 columns over the IGP (7.6×10¹⁶ molec. cm−2) were about twice as large as what was observed over the NCP (4.1×10¹⁶ molec. cm−2). The NCP is also a large agricultural region (Huang et al., 2012). The regional mean NH3 emissions flux over the NCP was 0.7 t km−2 per month from June to August 2010 (estimated using the MIX database), which was about 1.8 times that of the IGP. The IGP has much higher NH3 total columns (Fig. 1) compared to the NCP, but lower NH3 emissions fluxes (Fig. S1a in the Supplement). Therefore, other factors might lead to the high NH3 loading over the IGP besides high NH3 emissions.
3.2 Low gas-to-particle conversion of NH3
The emissions fluxes of SO2 and NOx (both are 0.3 t km−2 month−1) over the IGP are only about one-fourth of that over the NCP (1.1 and 1.3 t km−2 month−1) (Table 1 and Fig. S1). Besides, the satellite-derived SO2 and NO2 columns over the IGP (0.5 and 2.3×10¹⁵ molec. cm−2) are also much lower than that over the NCP (10.4 and 8.3×10¹⁵ molec. cm−2) (Fig. S2). The relatively low SO2 and NOx emissions could be an important factor causing the high NH3 columns over the IGP. In this study, we used the molar ratio (Remis) of NH3 emissions fluxes (EA) to the sum of twice the SO2 emissions fluxes (ES) and NOx emissions fluxes (EN) to roughly represent the excess of NH3 in the atmosphere, given by Eq. (1):
The calculated Remis in the IGP was 1.35, which was about 2.6 times as large as that in the NCP (0.51). We performed simulations for a base case and an “increased SO2∕NOx emissions” case to investigate the impact of SO2 and NOx emissions on NH3 loading. In the increased SO2∕NOx emissions case, the emissions of SO2 and NOx increased 2.6 times to make Remis of the IGP equal to that of the NCP.
Table 1Regional mean NH3 total columns and emissions fluxes of NH3, SO2, and NOx of the IGP and the NCP from June to August 2010.
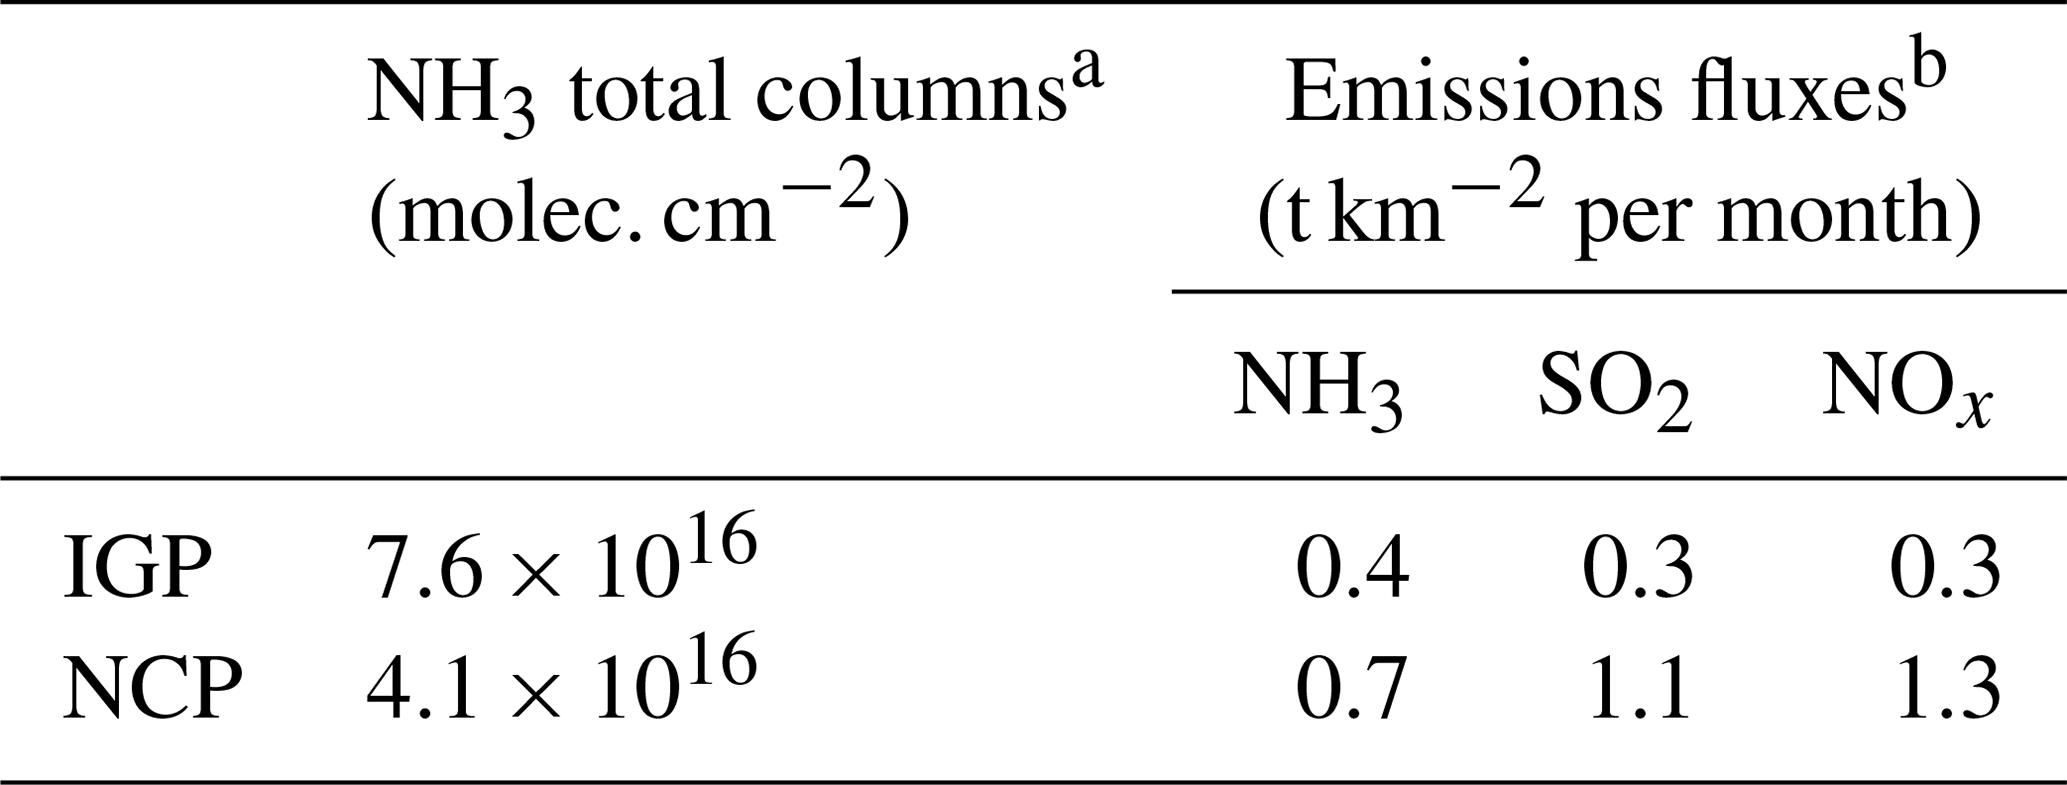
a NH3 total columns were derived from IASI measurements. b Emissions fluxes were estimated using the MIX database.
The simulated NH3 columns in the base case are shown in Fig. 2a. It is noted that the IASI NH3 columns cannot be quantitatively compared to modeled NH3 columns as the IASI NH3 products do not provide information on the vertical sensitivity (averaging kernels) to properly weight the model values. Nonetheless, the simulated regional mean NH3 total column over the IGP from the base case of 8.8×10¹⁶ molec. cm−2 is close to the satellite-derived value (7.6×10¹⁶ molec. cm−2), indicating that the model could generally capture the magnitude of the NH3 columns. Additionally, a broadly similar pattern was found in the NH3 columns in the base run to the satellite observations, both of which showed that NH3 columns decrease along the IGP from northwest to southeast, with the highest values in the northwestern IGP (Figs. 1 and 2a). The statistical performances of the meteorological predictions at 38 sites over northern India are presented in Table S2. The predicted T2 matched well with the observations, with a correlation coefficient of 0.8 and an NMB of 4.2 %. The predicted RH2 was slightly underestimated, with an NMB of −13.4 % and a correlation coefficient of 0.8. The predicted WS10 agreed reasonably well with the observations, with an NMB of −5.3 %. In addition, the simulated WD10 matched well with the observations, and both the predicted and observed dominant wind direction was SSE. The good agreement between the simulation and the observations confirms the reliability of the meteorological prediction over the simulation domain.

Figure 2Spatial distributions of WRF-Chem-predicted total columns of NH3 and surface ε() from June to August 2010. (a) and (b) are total columns of NH3 in the base case and the increased SO2/NOx emissions case, respectively. (c) and (d) are surface ε() in the base case and the increased SO2∕NOx emissions case, respectively.
The spatial distribution of the NH3 total column in the increased emissions case is shown in Fig. 2b. The NH3 total columns significantly decreased over the entire IGP, with a regional mean value of 2.5×10¹⁶ molec. cm−2 (a 72.2 % decrease compared to the base case). The surface ε() in the base case and the increased SO2∕NOx emissions case are shown in Fig. 2 (panels c and d, respectively). The surface ε() in the base case was low, with a regional mean value of 0.3 over the IGP. The simulated ε() in the 2010 monsoon in Delhi was 0.38, which is close to the observed ε() (0.39 in the 2011 monsoon season in Delhi) (Singh and Kulshrestha, 2012). In the increased SO2∕NOx emissions case, the regional mean surface ε() increased to 0.6 over the IGP. Significant increases in surface and concentrations were also found (Fig. S3). The regional mean surface and concentrations increased from 9.7 to 24.9 and from 7.2 to 20.0 µg m−3, respectively. Additionally, the regional mean columnar ε() over the IGP is 0.56 in the base case and increases to 0.87 in the increased SO2∕NOx emissions case. This suggests that the increased SO2 and NOx emissions enhanced the formation of acidic species and promoted the conversion of NH3 into . The effectively reduced NH3 total columns in the increased SO2∕NOx emissions case indicate that low SO2 and NOx emissions could be the major cause of the high NH3 loading over the IGP.
Besides the amount of acidic species, air temperature is also an important factor affecting the thermodynamic equilibrium of NH3 between the gas phase and the particle phase. Higher air temperature limits the gas-to-particle conversion of NH3 and enhances volatilization of NH4NO3 (Seinfeld and Pandis, 2006). The observed regional mean air temperature over the IGP from June to August 2010 was 30.9 ∘C, about 4.9 ∘C higher than the NCP (26.0 ∘C). As shown in Fig. 3a, the columnar ε() increases as temperature decreases. A 10 ∘C decrease in temperature results in a 0.07 increase in ε() and a consequent 17 % decrease in NH3 total columns. Additionally, a 10 ∘C increase in temperature results in a 0.08 decrease in ε() and a consequent 20 % increase in NH3 total columns. If the temperature over the IGP drops to the temperature typical of the NCP (a 4.9 ∘C decrease), the NH3 total columns over the IGP will only decrease by 10 %. In contrast, if the SO2∕NOx emissions over the IGP increase to make the Remis of the IGP equal to that of the NCP, the NH3 column over the IGP will decrease by 72.2 %. Therefore, the low SO2∕NOx emissions have a greater effect on causing high NH3 columns over the IGP than the high air temperature. As shown in Fig. 3c, the sensitivity of NH3 to temperature varies in different seasons and regions. Temporally, the sensitivity of NH3 to temperature during the monsoon season is generally higher than that during the pre-monsoon season. Spatially, the sensitivity of NH3 to temperature is highest over the eastern IGP, followed by the central IGP and the western IGP. The difference in the sensitivity of the NH3 to temperature may be caused by the difference of the initial ε() and temperature.
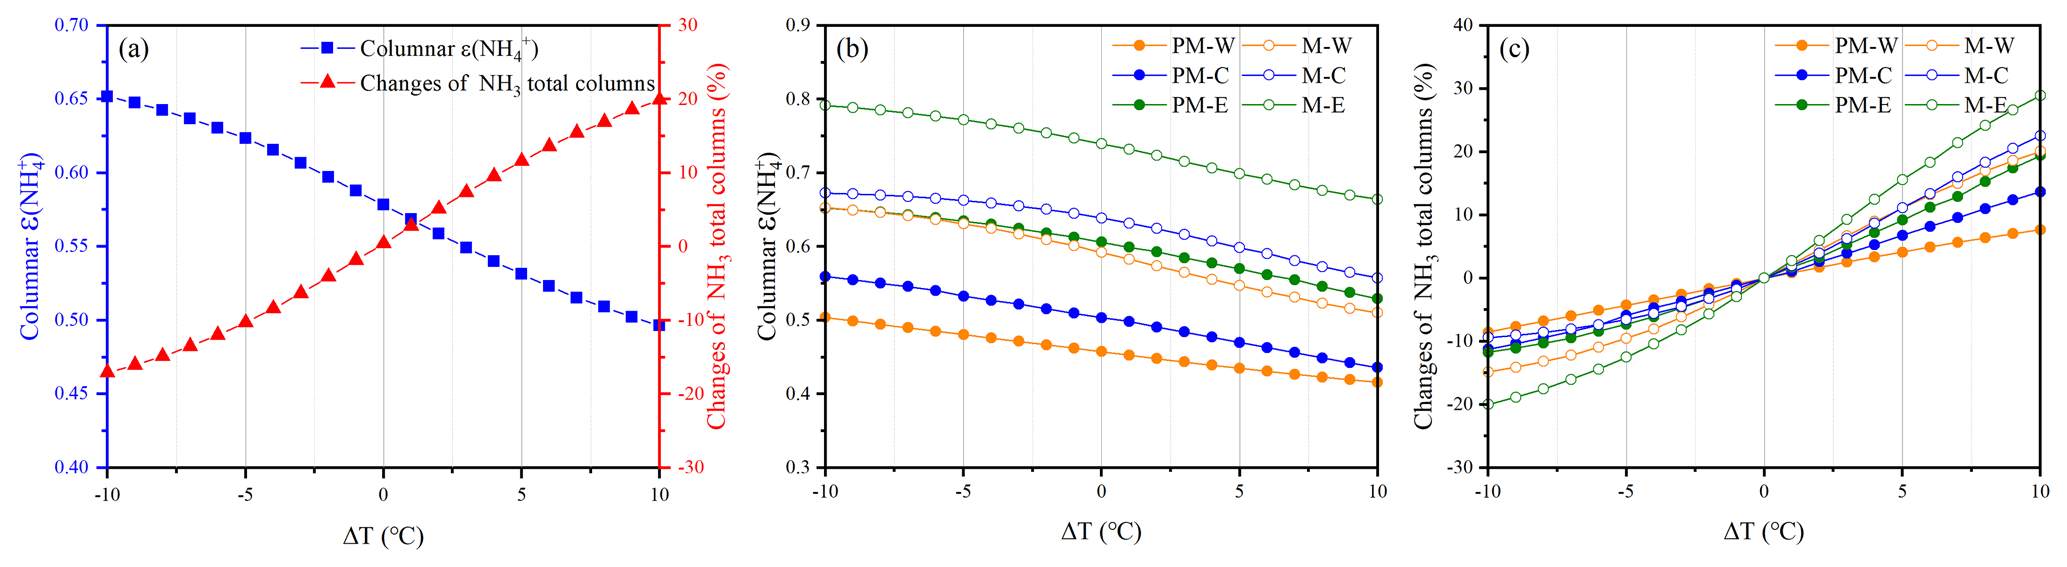
Figure 3Columnar ε() and changes in NH3 total columns with the changes in temperatures predicted by ISORROPIA-II. (a) Mean columnar ε() and changes in NH3 total columns over the IGP from June to August 2010. (b) Columnar ε() and (c) changes in NH3 total columns over the western IGP during pre-monsoon (PM-W), the central IGP during pre-monsoon (PM-C), the eastern IGP during pre-monsoon (PM-E), the western IGP during monsoon (M-W), the central IGP during monsoon (M-C), and the eastern IGP during monsoon (M-E).
3.3 Weak horizontal diffusion of NH3
The IGP is surrounded by a unique topography, with the Himalayan range to the north and the Sulaiman range to the west. Weather on the Indian subcontinent is controlled by the low-level Indian monsoon regime from June through September (Lawrence and Lelieveld, 2010). Figure 4a shows the spatial distributions of surface wind flow and wind speed from June to August 2010. The dominant wind direction is southwest over the Indian peninsula and southeast over the IGP. Air mainly flows from the western coast of India and the southern coast of Bengal. Surface wind speed is high on the western coast of India (>5 m s−1) and on the southern coast of Bengal (>4 m s−1) but decreases from the coast inland. Mountains serve as barriers to the airflow on the surface of the Earth (Barry, 2008). Chow et al. (2013) reported that when stably stratified airflow encounters an extra-tropical mountain barrier, it is forced to rise and cool adiabatically. Consequently, higher pressure along the slope could be created, which could decelerate and block the flow. After a while, geostrophic adjustment occurs. As a result, the airflow turns left (right) in the Northern (Southern) Hemisphere, and a barrier jet blowing parallel to the barrier is formed. As shown in Fig. 4a, the southerly airflow from the Bay of Bengal turns left when approaching the Himalayas, and then an easterly barrier jet parallel to the Himalayas is formed. The southwesterly airflow from the western coast of India also turns left when approaching the Himalayas. Similarly, wind flow at 850 hPa (Fig. 4b) also shows left-turning airflow near the Himalayas. The left-turning airflow indicates that the barrier effect of the Himalayas limits the northward movement of polluted air. Both satellite observations and the model simulation show that the high NH3 columns over the IGP are effectively cut off by mountains to the north (Figs. 2a and S4).
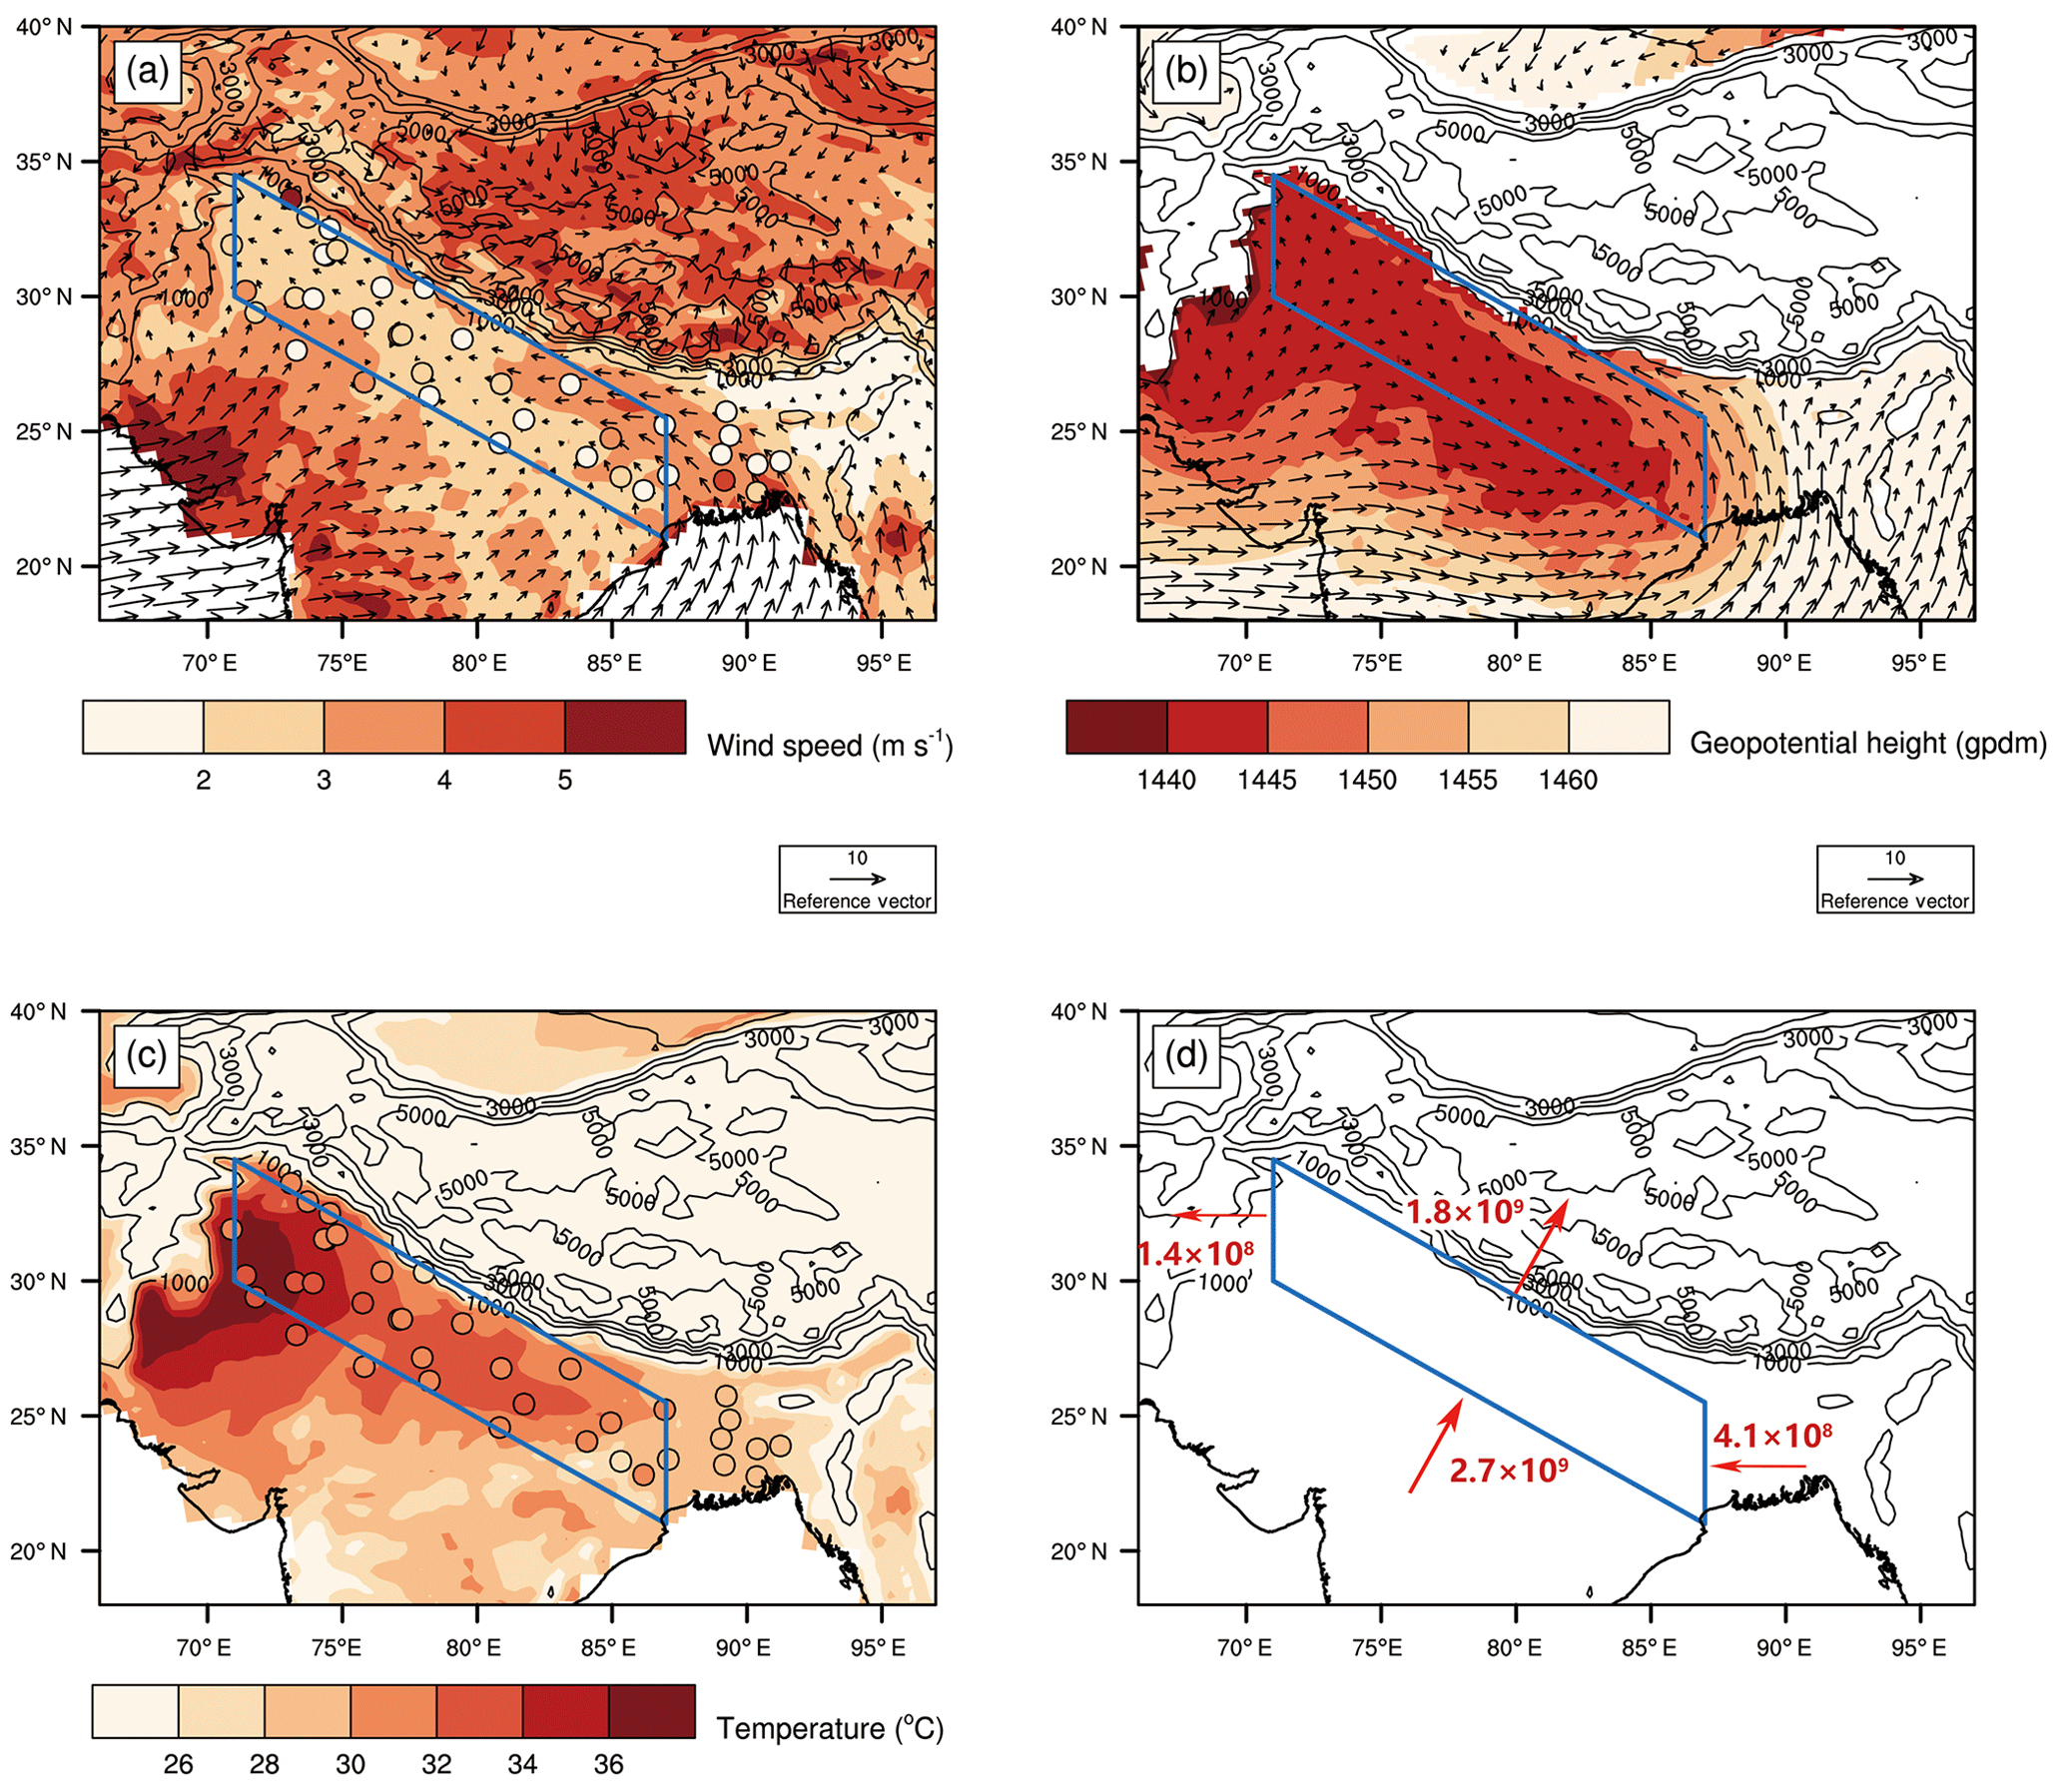
Figure 4Spatial distributions of WRF-Chem-predicted meteorological variables from June to August 2010. (a) Wind flow and wind speed at 10 m. (b) Wind flow and geopotential height at 850 hPa. (c) Air temperature at 2 m. (d) Ventilation rate (m3 s−1) of the four edges of the IGP. Circles in (a) and (c) show the observed wind speed at 10 m and air temperature at 2 m, respectively.
As shown in Fig. 4b, an area of low geopotential height extends from Pakistan to east India following the IGP. This elongated region of low pressure is known as the monsoon trough (Bohlinger et al., 2017). It causes wind to converge over this region. The convergence of horizontal wind can be observed from wind flow at both the surface and at 850 hPa. The prevailing wind directions south and east of the IGP are southwest and southeast, respectively. As a result of convergence of horizontal winds, an area of low wind speed forms and covers most of the IGP. The regional mean surface wind speed over the IGP is <3 m s−1. The weak wind speed in association with the convergence weakens the horizontal advection of NH3 and results in the accumulation of NH3 over the IGP.
The ventilation rate (Vr) of the four edges of the IGP was used to illustrate the accumulation of an air mass over the IGP (Fig. 4d). The Vr of one edge is defined as the product of the sectional area to the transport wind, given by Eq. (2):
The sectional area A can be expressed as A = Z L, where Z is the mean planetary boundary layer (PBL) height along the edge and L is the length of the edge. The transport wind UT is given by . m and n are the number of locations along the edge and vertical levels within the PBL where the winds are measured or predicted. Uij is the wind speed perpendicular to the cross section at each height and location along the edge. The ventilation rates of the four edges of the IGP were calculated using the WRF-Chem simulation results. The total Vr of the inflow from the southern and eastern edges (3.1×10⁹ m3 s−1) was 64 % higher than the total Vr of the outflow from the western and northern edges (1.9×10⁹ m3 s−1). The strong inflow and weak outflow indicate accumulation of the air mass over the IGP. Therefore, outward transport of NH3 from the IGP through horizontal advection could be weak.
Interestingly, both relative humidity and precipitation are high over the IGP (Fig. S5), with regional mean values of 63 % and 660 mm from June to August 2010. The high relative humidity and precipitation suggest strong gas-to-particle conversion and wet scavenging of NH3 (Seinfeld and Pandis, 2006). The observed high NH3 loading under such a wet condition further indicates the effectiveness of other factors leading to high NH3 loading. The simulated surface ε() over the western, central, and eastern parts of the IGP were 0.11, 0.13, and 0.24 during the pre-monsoon and 0.26, 0.26, and 0.37 during the monsoon. It is not difficult to find that the surface ε() during the monsoon season is significantly higher than that during the pre-monsoon season, and the surface ε() generally increases from northwest to southeast along the IGP. Besides, the columnar ε() shows similar spatiotemporal variations to the surface ε() (Fig. 3b). The spatiotemporal variations of ε() are consistent with the spatiotemporal variations of RH (Fig. S5a), indicating that RH is an important factor affecting the NH3 partitioning. The meteorological conditions in the northwestern IGP are characterized by higher air temperature, lower humidity, and lower rainfall compared to the southeastern IGP (Figs. 4c and S5), all of which are conducive to the increase in NH3. Consistently, NH3 total columns decrease from northwest to southeast along the IGP, as revealed by both the satellite measurements and model simulations (Figs. 1 and 2a). However, emission fluxes of NH3 over the northwestern IGP are also obviously higher than the southeastern IGP (Fig. S1). To exclude the impact of emissions on the spatial distributions of NH3, simulations for a “homogeneous emissions” case were performed by using WRF-Chem, where emissions of all primary pollutants over the IGP were set to their regional mean values. As shown in Fig. 5, NH3 total columns in the homogeneous emissions case still appear to decrease from northwest to southeast along the IGP. This indicates that the meteorological factors (atmospheric diffusion, temperature, relative humidity, and precipitation) are more important causes of the higher NH3 loadings over the northwestern IGP than the southeastern IGP.
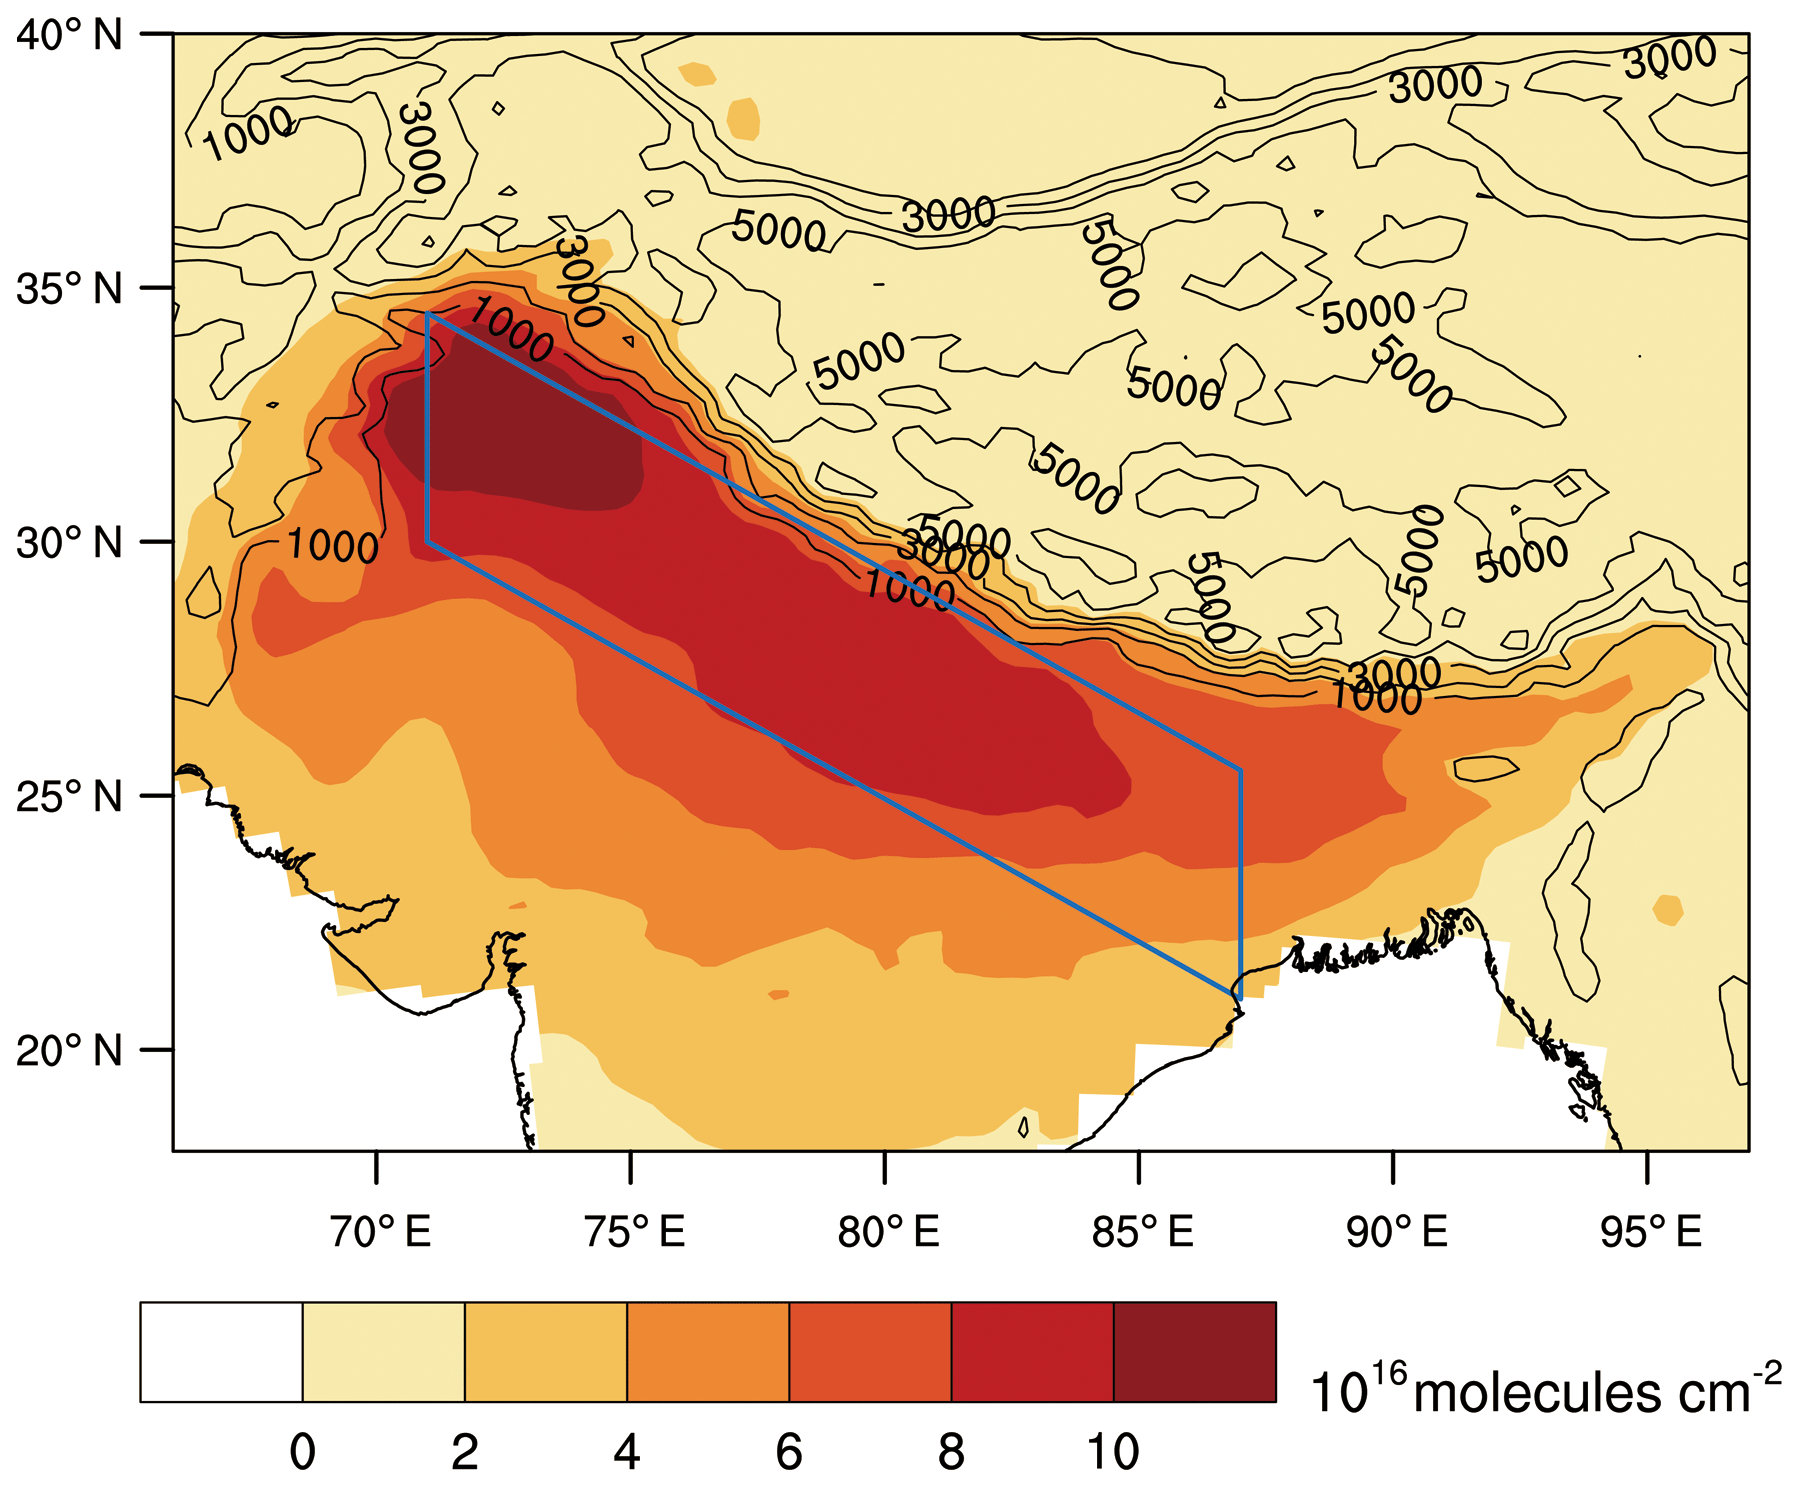
Figure 5Spatial distributions of WRF-Chem-predicted total columns of NH3 from June to August 2010 in the homogeneous emissions case.
Satellite observations have revealed that the IGP has the global maximum NH3 loading with a peak from June to August. Our study reveals that the high NH3 loading over the IGP appears to be the joint result of high NH3 emissions, weak chemical loss, and weak horizontal diffusion. Intensive agricultural activities in combination with high temperature resulted in relatively high NH3 emissions over the IGP, with a regional mean NH3 emissions flux of 0.4 t km−2 per month. The low SO2 and NOx emissions and high temperature limited the conversion of NH3 to , which is a key reason for the high NH3 loading over the IGP. In addition, orographic and meteorological conditions also play important roles in NH3 accumulation over the IGP. The barrier effects of the Himalayas limit the northward movement of monsoon air. The low wind speed (<3 m s−1) in association with the surface convergence over the IGP weakens horizontal diffusion, which is conducive to the accumulation of NH3 over the IGP.
The gas–particle partitioning plays an important role in influencing NH3 columns. The deviation of the simulated sulfate and nitrate will cause a deviation in the simulated NH3 by affecting NH3 gas–particle partitioning. Thus, in addition to the NH3 and , the simulated concentrations of sulfate and nitrate also need to be constrained using field observations in the future. Besides, organic species are not considered in the thermodynamic calculations in this study, because the impact of organic species on aerosol thermodynamics is still rather poorly understood (Zaveri et al., 2008; Fountoukis and Nenes, 2007). Pye et al. (2018) found that the AIOMFAC (Aerosol Inorganic–Organic Mixtures Functional groups Activity Coefficients) based equilibrium model considering inorganic–organic interactions was consistent with ISORROPIA in terms of NH3 gas–particle partitioning. Metzger et al. (2006) found that the ε() calculated by ISORROPIA was about 15 % lower than that calculated by EQSAM2 (Equilibrium Simplified Aerosol Model) considering organic acids. Thus, the influence of organic species on the NH3 gas–particle partitioning might be limited and will not have a significant impact on the results of this study. However, these two studies were conducted in the United States. The effects of organic species on aerosol thermodynamics in the IGP need further research in the future. Additionally, dry and wet deposition also has an important influence on NH3 columns. Field observations of the dry and wet deposition of NH3 and in the IGP are needed to constrain model simulations in the future.
The IASI data used in this study were provided by the AERIS data infrastructure (https://iasi.aeris-data.fr/NH3/, last access: 21 April 2019; Whitburn et al., 2017). The meteorological data used in this study were obtained from the National Climate Data Center integrated surface database (https://gis.ncdc.noaa.gov/maps/ncei/cdo/hourly, last access: 26 May 2019; NCEI, 2019). The anthropogenic emissions are available from the MIX inventory (http://www.meicmodel.org/dataset-mix, last access: 10 May 2019; Li et al., 2017). The SO2 columns were provided by the NASA Goddard Earth Sciences Data and Information Services Center (https://disc.gsfc.nasa.gov/datasets/OMSO2e_003/summary, last access: 15 May 2019; Krotkov et al., 2015). The NO2 columns are available from the Tropospheric Emission Monitoring Internet Service (http://www.temis.nl/airpollution/no2col/no2regioomimonth_qa.php, last access: 15 May 2019; Boersma et al., 2011).
The supplement related to this article is available online at: https://doi.org/10.5194/acp-20-8727-2020-supplement.
YS initiated the investigation. TW performed the modeling analyses. TW, YS, ZX, and TZ wrote and edited the manuscript. ML, TX, WL, LY, XC, HZ, and LK contributed to discussions of the results and the manuscript.
The authors declare that they have no conflict of interest.
This work was supported by the National Natural Science Foundation of China (NSFC) (91644212, 41675142, and 91837209) and the National Key R&D Program of China (2016YFC0201505).
This research has been supported by the National Natural Science Foundation of China (grant nos. 91644212, 41675142, and 91837209) and the National Key R&D Program of China (grant no. 2016YFC0201505).
This paper was edited by Barbara Ervens and reviewed by two anonymous referees.
Abbatt, J. P. D., Benz, S., Cziczo, D. J., Kanji, Z., Lohmann, U., and Mohler, O.: Solid ammonium sulfate aerosols as ice nuclei: A pathway for cirrus cloud formation, Science, 313, 1770–1773, https://doi.org/10.1126/science.1129726, 2006.
Adams, P. J., Seinfeld, J. H., Koch, D., Mickley, L., and Jacob, D.: General circulation model assessment of direct radiative forcing by the sulfate-nitrate-ammonium-water inorganic aerosol system, J. Geophys. Res.-Atmos., 106, 1097–1111, https://doi.org/10.1029/2000jd900512, 2001.
Aneja, V. P., Schlesinger, W. H., Erisman, J. W., Behera, S. N., Sharma, M., and Battye, W.: Reactive nitrogen emissions from crop and livestock farming in India, Atmos. Environ., 47, 92–103, https://doi.org/10.1016/j.atmosenv.2011.11.026, 2012.
Barry, R. G.: Mountain Weather and Climate, Third Edition, Cambridge University Press, Cambridge, 2008.
Binkowski, F. S. and Shankar, U.: The Regional Particulate Matter Model .1. Model description and preliminary results, J. Geophys. Res.-Atmos., 100, 26191–26209, https://doi.org/10.1029/95jd02093, 1995.
Boersma, K. F., Eskes, H. J., Dirksen, R. J., van der A, R. J., Veefkind, J. P., Stammes, P., Huijnen, V., Kleipool, Q. L., Sneep, M., Claas, J., Leitão, J., Richter, A., Zhou, Y., and Brunner, D.: An improved tropospheric NO2 column retrieval algorithm for the Ozone Monitoring Instrument, Atmos. Meas. Tech., 4, 1905–1928, https://doi.org/10.5194/amt-4-1905-2011, 2011.
Bohlinger, P., Sorteberg, A., and Sodemann, H.: Synoptic Conditions and Moisture Sources Actuating Extreme Precipitation in Nepal, J. Geophys. Res.-Atmos., 122, 12653–12671, https://doi.org/10.1002/2017jd027543, 2017.
Bouwman, A. F., Lee, D. S., Asman, W. A. H., Dentener, F. J., VanderHoek, K. W., and Olivier, J. G. J.: A global high-resolution emission inventory for ammonia, Global. Biogeochem. Cy., 11, 561–587, https://doi.org/10.1029/97gb02266, 1997.
Carmichael, G. R., Ferm, M., Thongboonchoo, N., Woo, J. H., Chan, L. Y., Murano, K., Viet, P. H., Mossberg, C., Bala, R., Boonjawat, J., Upatum, P., Mohan, M., Adhikary, S. P., Shrestha, A. B., Pienaar, J. J., Brunke, E. B., Chen, T., Jie, T., Guoan, D., Peng, L. C., Dhiharto, S., Harjanto, H., Jose, A. M., Kimani, W., Kirouane, A., Lacaux, J. P., Richard, S., Barturen, O., Cerda, J. C., Athayde, A., Tavares, T., Cotrina, J. S., and Bilici, E.: Measurements of sulfur dioxide, ozone and ammonia concentrations in Asia, Africa, and South America using passive samplers, Atmos. Environ., 37, 1293–1308, https://doi.org/10.1016/S1352-2310(02)01009-9, 2003.
Chow, F. K., Wekker, S. F. J. D., and Snyder, B. J.: Mountain Weather Research and Forecasting Recent Progress and Current Challenges, Springer, Dordrecht, 2013.
Clarisse, L., Clerbaux, C., Dentener, F., Hurtmans, D., and Coheur, P. F.: Global ammonia distribution derived from infrared satellite observations, Nat. Geosci., 2, 479–483, https://doi.org/10.1038/ngeo551, 2009.
Dammers, E., Palm, M., Van Damme, M., Vigouroux, C., Smale, D., Conway, S., Toon, G. C., Jones, N., Nussbaumer, E., Warneke, T., Petri, C., Clarisse, L., Clerbaux, C., Hermans, C., Lutsch, E., Strong, K., Hannigan, J. W., Nakajima, H., Morino, I., Herrera, B., Stremme, W., Grutter, M., Schaap, M., Wichink Kruit, R. J., Notholt, J., Coheur, P.-F., and Erisman, J. W.: An evaluation of IASI-NH3 with ground-based Fourier transform infrared spectroscopy measurements, Atmos. Chem. Phys., 16, 10351–10368, https://doi.org/10.5194/acp-16-10351-2016, 2016.
Easter, R. C., Ghan, S. J., Zhang, Y., Saylor, R. D., Chapman, E. G., Laulainen, N. S., Abdul-Razzak, H., Leung, L. R., Bian, X. D., and Zaveri, R. A.: MIRAGE: Model description and evaluation of aerosols and trace gases, J. Geophys. Res.-Atmos., 109, D20210, https://doi.org/10.1029/2004jd004571, 2004.
FAOSTAT: Statistical Database of Food and Agriculture Organization of the United Nations, The Food and Agriculture Organization of the United Nations, 2010.
Fast, J. D., Gustafson, W. I., Easter, R. C., Zaveri, R. A., Barnard, J. C., Chapman, E. G., Grell, G. A., and Peckham, S. E.: Evolution of ozone, particulates, and aerosol direct radiative forcing in the vicinity of Houston using a fully coupled meteorology-chemistry-aerosol model, J. Geophys. Res.-Atmos., 111, D21305, https://doi.org/10.1029/2005jd006721, 2006.
Fountoukis, C. and Nenes, A.: ISORROPIA II: a computationally efficient thermodynamic equilibrium model for K+-Ca2+-Mg2+--Na+ ---Cl−-H2O aerosols, Atmos. Chem. Phys., 7, 4639–4659, https://doi.org/10.5194/acp-7-4639-2007, 2007.
GoI: Agricultural Statistics At a Glance 2012, Ministry of Agriculture, Government of India, New Delhi, India, 2012a.
GoI: 19th Livestock Census 2012, Ministry of Agriculture, Government of India, New Delhi, India, 2012b.
Grell, G. A., Peckham, S. E., Schmitz, R., McKeen, S. A., Frost, G., Skamarock, W. C., and Eder, B.: Fully coupled “online” chemistry within the WRF model, Atmos. Environ., 39, 6957–6975, https://doi.org/10.1016/j.atmosenv.2005.04.027, 2005.
NCEI: Observational data map of hourly weather station networks from around the world, NCEI GIS Agile Team, available at: https://gis.ncdc.noaa.gov/maps/ncei/cdo/hourly, last access: 26 May 2019.
Huang, X., Song, Y., Li, M. M., Li, J. F., Huo, Q., Cai, X. H., Zhu, T., Hu, M., and Zhang, H. S.: A high-resolution ammonia emission inventory in China, Global. Biogeochem. Cy., 26, GB1030, https://doi.org/10.1029/2011gb004161, 2012.
Krotkov, N. A., Li, C., and Leonard, P.: OMI/Aura Sulfur Dioxide (SO2) Total Column L3 1 day Best Pixel in 0.25 degree x 0.25 degree V3, Goddard Earth Sciences Data and Information Services Center (GES DISC), https://doi.org/10.5067/Aura/OMI/DATA3008, 2015.
Kurokawa, J., Ohara, T., Morikawa, T., Hanayama, S., Janssens-Maenhout, G., Fukui, T., Kawashima, K., and Akimoto, H.: Emissions of air pollutants and greenhouse gases over Asian regions during 2000–2008: Regional Emission inventory in ASia (REAS) version 2, Atmos. Chem. Phys., 13, 11019–11058, https://doi.org/10.5194/acp-13-11019-2013, 2013.
Lawrence, M. G. and Lelieveld, J.: Atmospheric pollutant outflow from southern Asia: a review, Atmos. Chem. Phys., 10, 11017–11096, https://doi.org/10.5194/acp-10-11017-2010, 2010.
Li, M., Zhang, Q., Kurokawa, J.-I., Woo, J.-H., He, K., Lu, Z., Ohara, T., Song, Y., Streets, D. G., Carmichael, G. R., Cheng, Y., Hong, C., Huo, H., Jiang, X., Kang, S., Liu, F., Su, H., and Zheng, B.: MIX: a mosaic Asian anthropogenic emission inventory under the international collaboration framework of the MICS-Asia and HTAP, Atmos. Chem. Phys., 17, 935–963, https://doi.org/10.5194/acp-17-935-2017, 2017.
Liu, M., Huang, X., Song, Y., Xu, T., Wang, S., Wu, Z., Hu, M., Zhang, L., Zhang, Q., Pan, Y., Liu, X., and Zhu, T.: Rapid SO2 emission reductions significantly increase tropospheric ammonia concentrations over the North China Plain, Atmos. Chem. Phys., 18, 17933–17943, https://doi.org/10.5194/acp-18-17933-2018, 2018.
Metzger, S., Mihalopoulos, N., and Lelieveld, J.: Importance of mineral cations and organics in gas-aerosol partitioning of reactive nitrogen compounds: case study based on MINOS results, Atmos. Chem. Phys., 6, 2549–2567, https://doi.org/10.5194/acp-6-2549-2006, 2006.
Nishina, K., Ito, A., Hanasaki, N., and Hayashi, S.: Reconstruction of spatially detailed global map of and application in synthetic nitrogen fertilizer, Earth Syst. Sci. Data, 9, 149–162, https://doi.org/10.5194/essd-9-149-2017, 2017.
Paerl, H. W., Gardner, W. S., McCarthy, M. J., Peierls, B. L., and Wilhelm, S. W.: Algal blooms: Noteworthy nitrogen, Science, 346, 175–175, https://doi.org/10.1126/science.346.6206.175-a, 2014.
Pope, C. A., Burnett, R. T., Thun, M. J., Calle, E. E., Krewski, D., Ito, K., and Thurston, G. D.: Lung cancer, cardiopulmonary mortality, and long-term exposure to fine particulate air pollution, Jama-J. Am. Med. Assoc., 287, 1132–1141, https://doi.org/10.1001/jama.287.9.1132, 2002.
Pye, H. O. T., Zuend, A., Fry, J. L., Isaacman-VanWertz, G., Capps, S. L., Appel, K. W., Foroutan, H., Xu, L., Ng, N. L., and Goldstein, A. H.: Coupling of organic and inorganic aerosol systems and the effect on gas-particle partitioning in the southeastern US, Atmos. Chem. Phys., 18, 357–370, https://doi.org/10.5194/acp-18-357-2018, 2018.
Reis, S., Pinder, R. W., Zhang, M., Lijie, G., and Sutton, M. A.: Reactive nitrogen in atmospheric emission inventories, Atmos. Chem. Phys., 9, 7657–7677, https://doi.org/10.5194/acp-9-7657-2009, 2009.
Riddick, S., Ward, D., Hess, P., Mahowald, N., Massad, R., and Holland, E.: Estimate of changes in agricultural terrestrial nitrogen pathways and ammonia emissions from 1850 to present in the Community Earth System Model, Biogeosciences, 13, 3397–3426, https://doi.org/10.5194/bg-13-3397-2016, 2016.
Seinfeld, J. H. and Pandis, S. N.: Atmospheric Chemistry and Physics: From Air Pollution to Climate Change, John Wiley, New York, 2006.
Singh, S. and Kulshrestha, U. C.: Abundance and distribution of gaseous ammonia and particulate ammonium at Delhi, India, Biogeosciences, 9, 5023–5029, https://doi.org/10.5194/bg-9-5023-2012, 2012.
Stokstad, E.: AIR POLLUTION Ammonia Pollution From Farming May Exact Hefty Health Costs, Science, 343, 238–238, https://doi.org/10.1126/science.343.6168.238, 2014.
Streets, D. G., Bond, T. C., Carmichael, G. R., Fernandes, S. D., Fu, Q., He, D., Klimont, Z., Nelson, S. M., Tsai, N. Y., Wang, M. Q., Woo, J. H., and Yarber, K. F.: An inventory of gaseous and primary aerosol emissions in Asia in the year 2000, J. Geophys. Res.-Atmos., 108, 8809, https://doi.org/10.1029/2002jd003093, 2003.
Van Damme, M., Clarisse, L., Heald, C. L., Hurtmans, D., Ngadi, Y., Clerbaux, C., Dolman, A. J., Erisman, J. W., and Coheur, P. F.: Global distributions, time series and error characterization of atmospheric ammonia (NH3) from IASI satellite observations, Atmos. Chem. Phys., 14, 2905–2922, https://doi.org/10.5194/acp-14-2905-2014, 2014.
Van Damme, M., Clarisse, L., Dammers, E., Liu, X., Nowak, J. B., Clerbaux, C., Flechard, C. R., Galy-Lacaux, C., Xu, W., Neuman, J. A., Tang, Y. S., Sutton, M. A., Erisman, J. W., and Coheur, P. F.: Towards validation of ammonia (NH3) measurements from the IASI satellite, Atmos. Meas. Tech., 8, 1575–1591, https://doi.org/10.5194/amt-8-1575-2015, 2015a.
Van Damme, M., Erisman, J. W., Clarisse, L., Dammers, E., Whitburn, S., Clerbaux, C., Dolman, A. J., and Coheur, P. F.: Worldwide spatiotemporal atmospheric ammonia (NH3) columns variability revealed by satellite, Geophys. Res. Lett., 42, 8660–8668, https://doi.org/10.1002/2015gl065496, 2015b.
Van Damme, M., Whitburn, S., Clarisse, L., Clerbaux, C., Hurtmans, D., and Coheur, P.-F.: Version 2 of the IASI NH3 neural network retrieval algorithm: near-real-time and reanalysed datasets, Atmos. Meas. Tech., 10, 4905–4914, https://doi.org/10.5194/amt-10-4905-2017, 2017.
Van Damme, M., Clarisse, L., Whitburn, S., Hadji-Lazaro, J., Hurtmans, D., Clerbaux, C., and Coheur, P. F.: Industrial and agricultural ammonia point sources exposed, Nature, 564, 99–103, https://doi.org/10.1038/s41586-018-0747-1, 2018.
Warner, J. X., Wei, Z., Strow, L. L., Dickerson, R. R., and Nowak, J. B.: The global tropospheric ammonia distribution as seen in the 13-year AIRS measurement record, Atmos. Chem. Phys., 16, 5467–5479, https://doi.org/10.5194/acp-16-5467-2016, 2016.
Warner, J. X., Dickerson, R. R., Wei, Z., Strow, L. L., Wang, Y., and Liang, Q.: Increased atmospheric ammonia over the world's major agricultural areas detected from space, Geophys. Res. Lett., 44, 2875–2884, https://doi.org/10.1002/2016gl072305, 2017.
Wesely, M. L.: Parameterization of Surface Resistances to Gaseous Dry Deposition in Regional-Scale Numerical-Models, Atmos. Environ., 23, 1293–1304, https://doi.org/10.1016/0004-6981(89)90153-4, 1989.
Whitburn, S., Clarisse, L., Van Damme, M., and Coheur, P.-F.: Ammonia total columns retrieved from IASI measurements, Greenbelt, Universite Libre de Bruxelles (ULB)/Laboratoire atmosphères, milieux et observations spatiales (LATMOS), available at: https://iasi.aerisdata.fr/nh3/ (last access: 21 April 2019), 2017.
Yu, F. Q., Nair, A. A., and Luo, G.: Long-Term Trend of Gaseous Ammonia Over the United States: Modeling and Comparison With Observations, J. Geophys. Res.-Atmos., 123, 8315–8325, https://doi.org/10.1029/2018jd028412, 2018.
Zaveri, R. A. and Peters, L. K.: A new lumped structure photochemical mechanism for large-scale applications, J. Geophys. Res.-Atmos., 104, 30387–30415, https://doi.org/10.1029/1999jd900876, 1999.
Zaveri, R. A., Easter, R. C., Fast, J. D., and Peters, L. K.: Model for Simulating Aerosol Interactions and Chemistry (MOSAIC), J. Geophys. Res., 113, D13204, https://doi.org/10.1029/2007jd008782, 2008.