the Creative Commons Attribution 4.0 License.
the Creative Commons Attribution 4.0 License.
 | 23 Jan 2020
Distinct diurnal variation in organic aerosol hygroscopicity and its relationship with oxygenated organic aerosol
Yao He
Wanyun Xu
Pusheng Zhao
Yafang Cheng
Gang Zhao
Jiangchuan Tao
Nan Ma
Yanyan Zhang
Jiayin Sun
Peng Cheng
Wenda Yang
Shaobin Zhang
Chunsheng Zhao
The hygroscopicity of organic aerosol (OA) is important for investigation of its climatic and environmental impacts. However, the hygroscopicity parameter κOA remains poorly characterized, especially in the relatively polluted environment on the North China Plain (NCP). Here we conducted simultaneous wintertime measurements of bulk aerosol chemical compositions of PM2.5 and PM1 and bulk aerosol hygroscopicity of PM10 and PM1 on the NCP using a capture-vaporizer time-of-flight aerosol chemical speciation monitor (CV-ToF-ACSM) and a humidified nephelometer system which measures the aerosol light-scattering enhancement factor f(RH). A method for calculating κOA based on f(RH) and bulk aerosol chemical-composition measurements was developed. We found that κOA varied in a wide range with significant diurnal variations. The derived κOA ranged from almost 0.0 to 0.25, with an average (±1σ) of 0.08 (±0.06) for the entire study. The derived κOA was highly correlated with f44 (fraction of m∕z 44 in OA measured by CV-ToF-ACSM), an indicator of the oxidation degree of OA (R=0.79), and the relationship can be parameterized as (, based on the relationship between the f44 and O∕C ratio for CV-ToF-ACSM). On average, κOA reached the minimum (0.02) in the morning near 07:30 local time (LT) and then increased rapidly, reaching the peak value of 0.16 near 14:30 LT. The diurnal variations in κOA were highly and positively correlated with those of mass fractions of oxygenated OA (R=0.95), indicating that photochemical processing played a dominant role in the increase in κOA in winter on the NCP. Results in this study demonstrate the potential wide applications of a humidified nephelometer system together with aerosol composition measurements for investigating the hygroscopicity of OA in various environments and highlight that the parameterization of κOA as a function of OA aging processes needs to be considered in chemical transport models for better evaluating the impacts of OA on cloud formation, atmospheric chemistry, and radiative forcing.
- Article
(7556 KB) - Full-text XML
-
Supplement
(957 KB) - BibTeX
- EndNote


Aerosol hygroscopic growth plays significant roles in different atmospheric processes, including atmospheric radiation transfer, cloud formation, visibility degradation, atmospheric multiphase chemistry, and even air-pollution-related health effects, and is therefore crucial for studies on aerosol climatic and environmental impacts. Organic materials in ambient aerosol particles, usually referred to organic aerosol (OA), contribute substantially to ambient aerosol mass and often contribute to more than half of submicron aerosol particle mass under the dry state (Jimenez et al., 2009). The hygroscopicity parameter κ (Petters and Kreidenweis, 2007) of organic aerosol (κOA) is a key parameter for investigating the roles of organic aerosol in radiative forcing, cloud formation, and atmospheric chemistry. Liu and Wang (2010) demonstrated that 50 % increases in κ of secondary organic aerosol (0.14±0.07) can result in up to 40 % increases in predicted cloud condensation nuclei (CCN) concentration. Rastak et al. (2017) reported that global average aerosol radiative forcing would decrease about 1 W m−2 should κOA increase from 0.05 to 0.15, which is of the same order of the overall climate forcing of anthropogenic aerosol particles during the industrialization period. Li et al. (2019) reported that organic aerosol liquid water contributed 18 %–32 % to total particle liquid water content in Beijing. Despite its importance, κOA has not yet been characterized well due to the extremely complex chemical compositions of organic aerosol. Therefore, it is important to conduct more research on the spatiotemporal variation in κOA and its relationship with aerosol chemical compositions to reach a better characterization and come up with more appropriate parameterization schemes in chemical, meteorological, and climate models.
The large variety in OA chemical constituents makes it difficult to directly link κOA to specific organic aerosol compositions. The OA chemical composition is tightly connected to its volatile organic precursors, which are also rich in variety and come from different natural and anthropogenic sources. OA with different oxidation levels also behaves differently with respect to hygroscopic growth. Thus, studies on κOA at different locations and seasons have reported distinct characteristics. Many studies have investigated the influence of the OA oxidation level (represented by the O:C ratio or fraction of m∕z 44 in OA, f44, which is determined from aerosol mass spectrometer measurements) on its hygroscopicity (Chang et al., 2010; Lambe et al., 2011; Duplissy et al., 2011; Mei et al., 2013b; Wu et al., 2013; Hong et al., 2015; Chen et al., 2017; Massoli et al., 2010) and found that the average κOA generally increases as a function of the organic aerosol oxidation level. However, the statistical empirical relationship between κOA and O:C ratio or f44 differs much among different studies. Several studies have also analyzed the diurnal variation characteristics of κOA at different locations and seasons (Cerully et al., 2015; Bougiatioti et al., 2016; Deng et al., 2018, 2019; Thalman et al., 2017), with some exhibiting distinct diurnal variations (Deng et al., 2018, 2019; Bougiatioti et al., 2016) and others not exhibiting variations (Cerully et al., 2015). Despite this, the studies on κOA in the relatively polluted North China Plain (NCP) region are very limited (Wu et al., 2016). The diurnal characteristics of κOA on the NCP have not been reported so far. Therefore, more investigation into the diurnal variation in κOA and its relationship with the OA oxidation level is required to better understand its characteristics in the NCP.
The humidity tandem differential mobility analyzer (HTDMA), or CCN counter, has been widely used for aerosol hygroscopicity measurements. Both the HTDMA and size-resolved CCN measurements can only be used to derive a κ within a certain size range (HTDMA: usually with a diameter below 300 nm and with a reported highest diameter of 360 nm – Deng et al., 2019; CCN: with a diameter of up to ∼200 nm – Zhang et al., 2014; Rose et al., 2010). The aerosol particles contributing most to aerosol optical properties (Bergin et al., 2001; Quinn et al., 2002; Cheng et al., 2008; Ma et al., 2011; Kuang et al., 2018) and aerosol liquid water content (Bian et al., 2014) in continental regions are usually in the diameter range of 200 nm to 1 µm, which the HTDMA and CCN hygroscopicity measurements cannot represent. Results from several studies have reported that κOA usually differentiates among particle sizes (Frosch et al., 2011; Kawana et al., 2016; Deng et al., 2019). For example, Deng et al. (2019) found that κOA increases with the increases in the particle dry diameter. These results further highlight a need for characterization of κOA of larger particles.
The humidified nephelometer system which measures aerosol light-scattering enhancement factors is also widely used in aerosol hygroscopicity research (Titos et al., 2016). The hygroscopicity parameter κ retrieved from the measured light-scattering enhancement factor is usually referred to as κf(RH) (Chen et al., 2014; Kuang et al., 2017), which represents the overall hygroscopicity of aerosol particles, with their diameters ranging from 200 to 800 nm for continental aerosol (see discussions in Sect. 3.3 for physical understanding of κf(RH)). Using the retrieved κf(RH) together with bulk aerosol chemical compositions of PM1 (particulate matter with an aerodynamic diameter of less than 1 µm, corresponding to a mobility diameter of approximately 760 nm assuming spherical particles and a particle density of 1.7 g cm−3), κOA can be derived, representing the hygroscopicity of organic aerosol particles in the diameter range of 200 to about 800 nm. In this study, the light-scattering enhancement factors of both PM10 (particulate matter with an aerodynamic diameter less than 10 µm) and PM1 particles were measured at a rural site on the NCP in winter 2018, together with aerosol chemical compositions by a capture-vaporizer time-of-flight aerosol chemical speciation monitor (CV-ToF-ACSM). By integrating these two different measurements, κOA is derived, and the relationship between the κOA and OA oxidation degree, as well as the diurnal variation in κOA, is elucidated.
From 11 November to 24 December 2018, continuous measurements of physical, optical, and chemical properties of ambient aerosol particles as well as meteorological parameters such as temperature, wind speed and direction, and relative humidity were made at the Gucheng site in Dingxing County, Hebei province, China. The sampling site, an Ecological and Agricultural Meteorological Test Station (39∘09′ N, 115∘44′ E) of the Chinese Academy of Meteorological Sciences, is located between Beijing (∼100 km) and Baoding (∼40 km), two large cities on the North China Plain, and is surrounded by farmland and small residential towns.
2.1 Inlet system and instruments
During this field campaign, all instruments were housed in an air-conditioned container, with the temperature held almost constant near 24∘. The schematic diagram of the inlet systems for the aerosol sampling instruments is displayed in Fig. 1. Three inlet impactors are used for aerosol sampling, two PM10 inlets and one PM1 inlet, respectively sampling ambient aerosol particles with an aerodynamic diameter less than 10 and 1 µm. Nafion driers with lengths of 1.2 m were placed downstream of each PM impactor inlet, which can drop the RH of sampled air below 15 %; thus, sampled aerosol particles can be treated as being in the dry state. Additionally, downstream of every PM impactor inlet, an MFC (mass flow controller) and a pump were added for automatic flow compensation to ensure that each impactor reaches its required flow rate of 16.7 L min−1 and guarantee the right cut diameters.
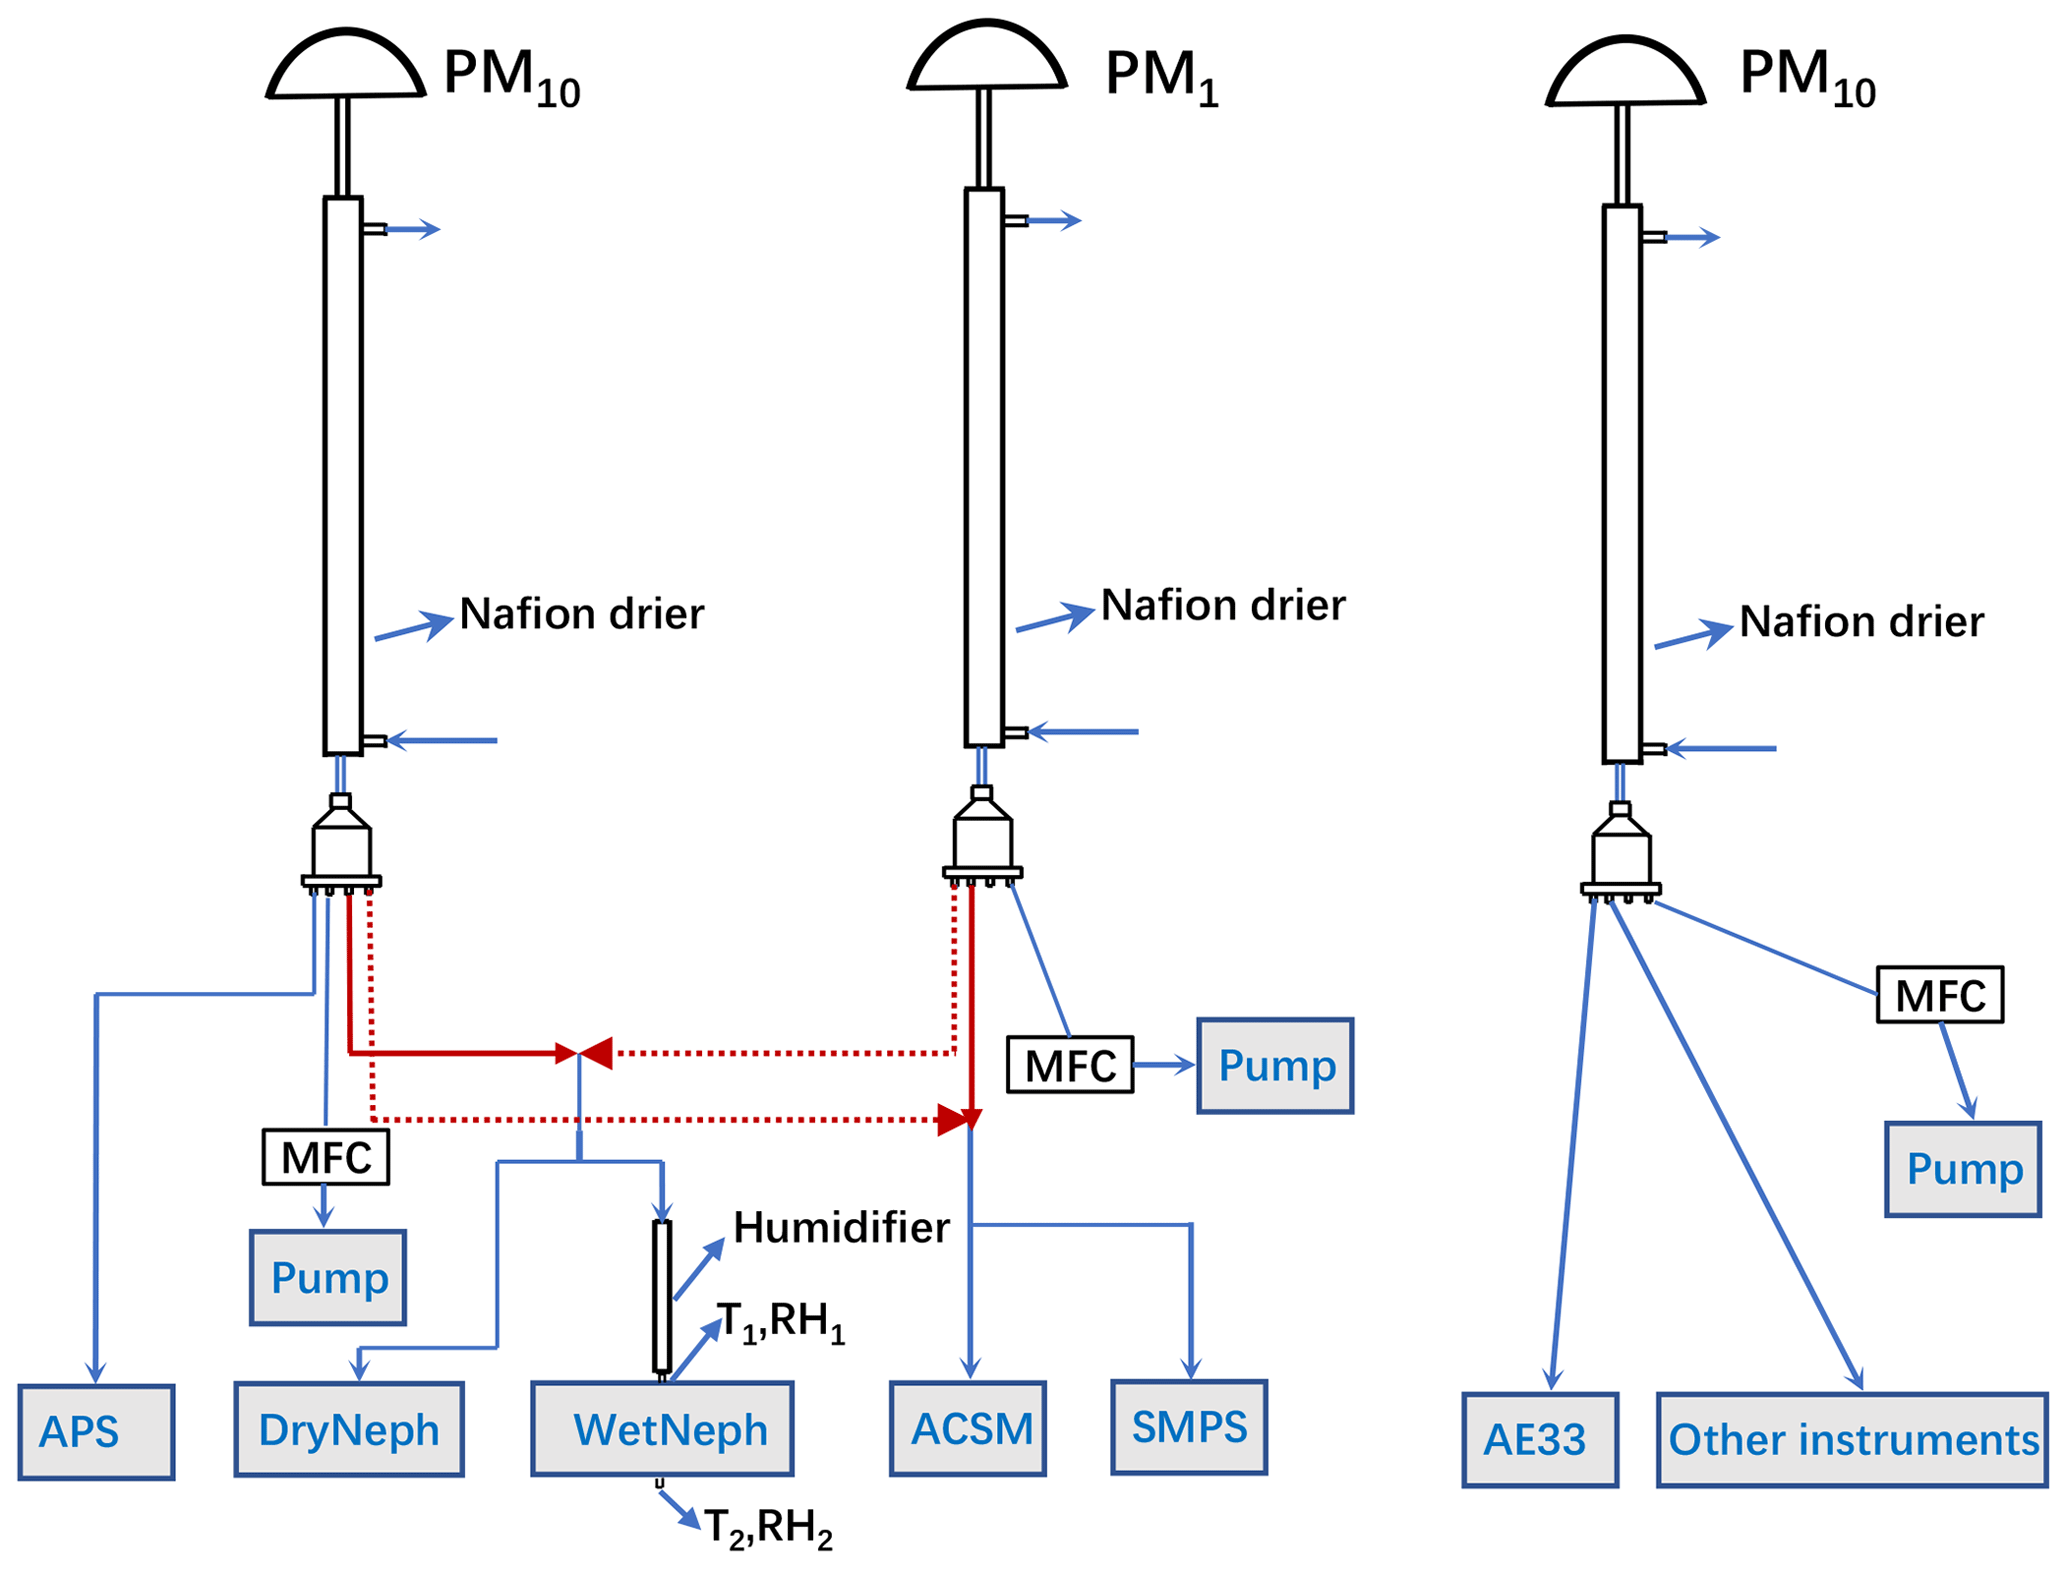
Aerosol sampling instruments can be categorized into four groups according to their inlet routes. The first group (group 1) downstream of the first PM10 inlet is comprised of only one instrument, the Aerodynamic Particle Sizer (APS, TSI Inc., Model 3321), measuring the size distribution of ambient aerosol particles with an aerodynamic diameter ranging from 700 nm to 20 µm at a temporal resolution of 20 s. The second group (group 2) includes a humidified nephelometer system (consisting of two nephelometers and a humidifier) that measures aerosol optical properties (scattering and backscattering coefficients at three wavelengths: 450, 525, and 635 nm) of ambient aerosol particles in the dry state (DryNeph) and under 85 % RH condition (WetNeph). The third group (group 3) includes two instruments, an ACSM and a scanning mobility particle sizer (SMPS; TSI model 3080). The CV-ToF-ACSM measures non-refractory particulate matter (NR-PM) species including organics, , , , and Cl−, with an air flow of 0.1 L min−1 and a time resolution of 2 min. Since the CV-ToF-ACSM instrument comes with a PM2.5 impactor, when the impactor of upstream is PM10, chemical compositions of PM2.5 rather than of PM10 were measured.
The SMPS measures particle mobility diameter size distributions with a diameter range of 12 to 760 nm. The inlets of group 2 and group 3 switch every 15 min, as denoted by the dashed and solid red lines in Fig. 1, enabling the instruments of these two groups to alternately measure the chemical and optical properties of PM10 and PM1. The fourth group (group 4) includes an AE33 aethalometer (Drinovec et al., 2015) and other aerosol instruments. Due to technical issues with the humidifier, the humified nephelometer system started to operate continuously on the 30 November.
2.2 The humidified nephelometer system
The humidified nephelometer system we built was set up to measure dry-state aerosol optical properties at a fixed RH of 85 %. The RH of the air sample is increased by a humidifier that consists of two layers. The inner layer is a Gore-Tex tube layer passing through sampled air, while the outer layer is a stainless-steel tube with circulating liquid water. The water vapor penetrates through the Gore-Tex tube and humidifies the sample air, while liquid water is kept from the inner layer by the Gore-Tex material. Upon the switch of inlets between group 2 and group 3, delays in valve switching caused instantaneous low pressure in the sample air, which broke the humidifier with the Gore-Tex tube after 4 d of continuous operation (3 December) and flooded the WetNeph. The WetNeph was fixed and recalibrated, and a commercial Nafion drier (60 cm long; Perma Pure company) replaced the Gore-Tex tube, which works the same way but is more resistant to low pressure. The temperature of the circulating water layer is controlled by a water bath and specified by an algorithm that adjusts the water temperature to maintain a relatively constant RH in the sensing volume of the WetNeph. To monitor the RH in the sensing volume of the WetNeph, two temperature and RH sensors (Vaisala HMP110, with accuracies of ±0.2∘ and ±1.7 % for RH between 0 % to 90 %, respectively, and ±2.5 % for RH between 90 % to 100 %) were placed at the inlet and outlet of the WetNeph. Defining measured RHs and temperatures at the inlet and outlet of the WetNeph as RH1/T1 and RH2/T2, the according dew point temperatures Td1 and Td2 can be calculated, and the average value was treated as the dew point of the sample air in the sensing volume of WetNeph. The sample RH is calculated using and the sample temperature measured by a sensor inside the sample cavity of the nephelometer.
2.3 ACSM measurements and data analysis
The mass concentration and chemical composition of NR-PM species were measured with the Aerodyne ToF-ACSM, which is equipped with a PM2.5 aerodynamic lens (Williams et al., 2010) and a capture vaporizer (CV; Xu et al., 2017; Hu et al., 2017) to extend the measured particle size to 2.5 µm. Detailed instrument descriptions were given in Fröhlich et al. (2013) and Xu et al. (2017). The CV-ToF-ACSM data were analyzed with the standard data analysis software (Tofware v2.5.13; https://sites.google.com/site/ariacsm/, last access: 21 January 2020) within Igor Pro (v6.37; WaveMetrics, Inc., Oregon, USA). The CV was designed with an enclosed cavity to increase particle collection efficiency (CE) at the detector (Xu et al., 2017). Field measurements indicate that the CE of CV was fairly robust and was roughly equivalent to 1. Therefore, a CE of 1 was applied to all measured species in this study (Hu et al., 2017, 2018b). Relative ionization efficiencies (RIEs) of 3.06 and 1.09 were used for ammonium and sulfate quantification, respectively, and the default values of 1.1 and 1.4 were used for nitrate and organic aerosol (OA), respectively. Compared with the AMS with a standard vaporizer, the CV-ToF-ACSM reports higher fragments at smaller m∕z values due to additional thermal decomposition associated with increased residence time and hot surface collisions (Hu et al., 2018a). As a result, f44 values from CV-ToF-ACSM measurements are often much higher than those previously reported from AMS, yet they are well correlated (Hu et al., 2018a).
The organic mass spectra from m∕z 12 to 214 were analyzed by positive matrix factorization (PMF; Paatero and Tapper, 1994) with an Igor Pro-based PMF evaluation tool (v3.04; Ulbrich et al., 2009). The ion fragments m∕z of 38, 49, 63, and 66 were removed from both PM1 and PM2.5 PMF inputs, considering their small contributions to the total organic signals yet high signal-to-noise ratios. The PMF results were then evaluated following the procedures detailed in Zhang et al. (2011). After carefully evaluating the mass spectral profiles, diurnal patterns, and temporal variations in the OA factors and comparing them with other collocated measurements, a five-factor solution was selected for both PM1 and PM2.5. The five factors include four primary factors, i.e., hydrocarbon-like OA (HOA), cooking OA (COA), biomass burning OA (BBOA), coal combustion OA (CCOA), and a secondary factor, oxygenated OA (OOA). More detailed descriptions on the PMF results will be given elsewhere.
2.4 Data reprocessing
The size distributions measured by APS were converted to mobility-equivalent size distributions using spherical shape assumptions and an effective particle density of 1.7 g cm−3. Note that the designations of PM10 and PM1 are with respect to aerosol aerodynamic diameters, while the corresponding mobility-equivalent cut diameters of the two impactors are approximately 7669 and 767 nm, respectively. For simplicity and consistency, we will continue to refer to them as the PM10 and PM1 based on their aerodynamic diameter. For the case of PM1 measurements, the mobility-equivalent cut diameter is quite near the upper range of the SMPS size range. Considering that the cut diameter of the impactor corresponds to the diameter of aerosol particles in the ambient state (aerosol hygroscopic growth effect needs to be taken into account) and the SMPS measures the size distributions of aerosol particles in the dry state, the SMPS measurements should be able to cover the full size range of PM1. When the SMPS was sampling aerosol particles of PM10, the size distributions measured by SMPS and APS were merged together and truncated to an upper limit of 7669 nm to provide a full range of particle number size distributions (PNSDs). In addition, the AE33 measures the aerosol absorption coefficient at several wavelengths; the mass concentrations of black carbon (BC) were converted from measured aerosol absorption coefficients at 880 nm with a mass absorption coefficient of 7.77 m2 g−1 (Drinovec et al., 2015).
Since group 2 and 3 switched between PM1 and PM10 inlets every 15 min, all measurements were averaged over each 15 min observation episode, resulting in valid time resolutions of 15 min for APS and BC PM10 measurements and of 30 min for SMPS, CV-ToF-ACSM, and the humidified nephelometer system PM1 and PM10 measurements, respectively. This resulted in a 15 min time lag between the averaged datasets of group 2 and group 3. To match the time of all the measurement data, the measurements of SMPS, ACSM, and the humidified nephelometer system were linearly interpolated to the 15 min time resolution of the APS data.
3.1 Calculations of hygroscopicity parameters κsca and κ from measurements of the humidified nephelometer system
The humidified nephelometer system measures aerosol light-scattering coefficients and backscattering coefficients at three wavelengths under the dry state and 85 % RH condition, providing measurements of the light-scattering enhancement factor f(RH, λ), which is defined as , with λ being the light wavelength. In this study, we only calculate f(RH, 525 nm) and refer to it hereinafter as f(RH) for simplicity. Brock et al. (2016) proposed a single parameter formula to describe f(RH, λ) as a function of RH. Kuang et al. (2017) further developed this parameterization scheme to better describe measured f(RH) by including the reference RH (RH0) in the dry nephelometer as shown in Eq. (1), using which the optical hygroscopicity parameter κsca can be derived from f(RH)measured:
An overall hygroscopicity parameter κ, referred to as κf(RH), can be retrieved from the measured f(RH) with the addition of a simultaneously measured PNSD and BC mass concentration (Chen et al., 2014; Kuang et al., 2017). The idea is to conduct an iterative calculation using the Mie theory and the κ-Köhler theory together to find a κf(RH) that closes the gap between the simulated and the measured f(RH). Details on the calculations of κf(RH) can be found in Kuang et al. (2017).
3.2 Calculations of κchem from aerosol chemical-composition measurements
For the calculation of aerosol hygroscopicity parameter κ based on measured chemical-composition data (κchem), detailed information on the chemical species is needed. The CV-ToF-ACSM can only provide bulk mass concentrations of , , , and Cl− ions and organic components. For the inorganic ions, a simplified ion pairing scheme (as listed in Table 1) was used to convert ion mass concentrations to mass concentrations of corresponding inorganic salts (Gysel et al., 2007; Wu et al., 2016).
Table 1Densities (ρ) and hygroscopicity parameters (κ) of inorganic salts used in this study.

Mass concentrations of , , , and Cl− are thus specified as ammonium sulfate (AS), ammonium nitrate (AN), ammonium chloride (AC), and ammonium bisulfate (ABS), with the κ values of these salts specified according to Wu et al. (2016) and Liu et al. (2014; Table 1). For a given internal mixture of different aerosol chemical species, a simple mixing rule called Zdanovskii–Stokes–Robinson (ZSR) can be used for predicting the overall κchem on the basis of volume fractions of different chemical species (εi; Petters and Kreidenweis, 2007):
where κi and εi represent the hygroscopicity parameter κ and volume fraction of chemical component i in the mixture. Based on Eq. (2), κchem can be calculated as follows:
where κOA and εOA represent the κ and volume fraction of total organics. Since black carbon is hydrophobic, κBC is assumed to be zero. With known κchem, κOA can be calculated using the following formula:
The volume concentration of organics was calculated by assuming that the density of POA is 1 g cm−3 and density of OOA is 1.4 g cm−3 (Wu et al., 2016). For the calculation of the total volume concentration (Vtot), we have three approaches. The first approach is to sum up the volume concentrations of all chemical species (AS, AN, ABS, AC, BC, and organics), where the volume concentration of BC was calculated by assuming a density of 1.7 g cm−3 (Wu et al., 2016). We refer to the calculated total volume concentration of aerosol particles as Vtot, Chem. The second approach is to integrate Vtot from the measured PNSD using the equation , where r is the particle radius and n(r) is the measured particle number concentrations. The third approach is to use the trained machine-learning estimator to estimate the Vtot based on measurements of the dry nephelometer (Vtot, Neph), as was introduced in Kuang et al. (2018). Vtot values of PM1 calculated using these three methods were compared to each other and shown in Fig. S2 in the Supplement. Vtot, Chem correlates well with Vtot, PNSD, but it is on average 30 % lower than that of Vtot, PNSD. Chemical components within aerosol particles such as dust, sea salt, and metal ions cannot be detected by CV-ToF-ACSM. Since the Gucheng site is far from the ocean, sea salt should have negligible impacts on the total mass of PM1. However, mineral dust can extend into the submicron range (Shao et al., 2007), which might be the cause for the low Vtot, Chem calculated using CV-ToF-ACSM and BC data. Vtot, Neph also correlates well with Vtot, PNSD but is on average 16 % lower than that of Vtot, PNSD. Closure studies between modeled and measured σsp and σbsp at 525 nm for PM1 and PM10 aerosol particles all showed good agreement between theoretical modeling results and measurements (Fig. S1), with most points falling within the 20 % relative deviation lines. However, modeled σsp values for both PM1 and PM10 were obviously higher than measured σsp, with an average relative difference of 22 % and 13 % between them for PM10 and PM1, respectively. The result for PM1 explains why Vtot, Neph was lower than Vtot, PNSD. Two reasons might have contributed to this discrepancy. (1) Both PNSD and aerosol optical property measurements carry non-negligible uncertainties, with the SMPS bearing measurement uncertainty of 30 % for particles larger than 200 nm, which contribute most to Vtot (Wiedensohler et al., 2012), and the nephelometer measured σsp having an uncertainty of 9 % (Sherman et al., 2015; Titos et al., 2016). (2) The sampling tube length, valves, tube angles, and flow rates are different for the dry nephelometer and SMPS (e.g., much shorter tube and smaller flow rate for SMPS than those for the dry nephelometer), leading to different wall loss and loss in semi-volatile aerosol components. ACSM and the dry nephelometer had a similar tube length, and nephelometer measurements bear less uncertainty than SMPS. Thus, Vtot, Neph was chosen as Vtot in the calculations of Eq. (4). Based on the calculated Vtot, the material unidentified by CV-ToF-ACSM accounts for 19 % of Vtot on average, which could not be neglected in the κOA calculation. Thus, Eq. (4) was modified as follows:
where κX and εX are the hygroscopicity parameter κ and volume fraction of the unidentified material. Previous studies using Vtot, Chem as the total volume concentration of aerosol particles have avoided the discussion about influences of unidentified material by the CV-ToF-ACSM or other aerosol mass spectrometer instruments. The hygroscopicity of these unidentified materials, which might be dust or other components in continental regions, was not discussed before. Dust is nearly hydrophobic, with mineral dust showing κ values in range of 0.01 to 0.08 (Koehler et al., 2009). In this paper, we arbitrarily specified κX to be 0.05.
3.3 Can κf(RH) represent κchem?
According to Eq. (5), the measured bulk κchem values are needed to derive κOA. When bulk aerosol chemical compositions and aerosol hygroscopicity κf(RH) measurements are available, one might naturally jump to the conclusion of treating κf(RH) as κchem to derive κOA because both κf(RH) and κchem are from bulk aerosol measurements. However, the relationship between κchem, κf(RH) and the size-resolved κ distribution needs to be clarified in order to answer the question of whether κf(RH) can accurately represent κchem. The physical meanings of different κ representations used in the following discussions are listed in Table 2.

Using Vi to represent volume concentrations of chemical species i and Vi(Dp) to represent volume concentrations of species i with a diameter of Dp, κchem can be derived as follows based on Eq. (2):
By swapping the order of summation and integration, Eq. (6) can be written as
Considering that , Eq. (7) can be rewritten as
The result of Eq. (8) indicates that κchem calculated using Eq. (3) represents the overall hygroscopicity of aerosol particles with volume contribution as the weighting function of .
As for κf(RH), a detailed analysis is performed here to facilitate its physical understanding. The differential form of σsp of aerosol particles in the dry state can be expressed as follows:
Based on the definition of f(RH), the σsp of aerosol particles under different RH conditions can be written as
Therefore, the differential form of observed overall f(RH) can be formulated as
Based on this formula, the sensitivity of f(RH) on the hygroscopicity of aerosol particles with the diameter Dp can be derived as
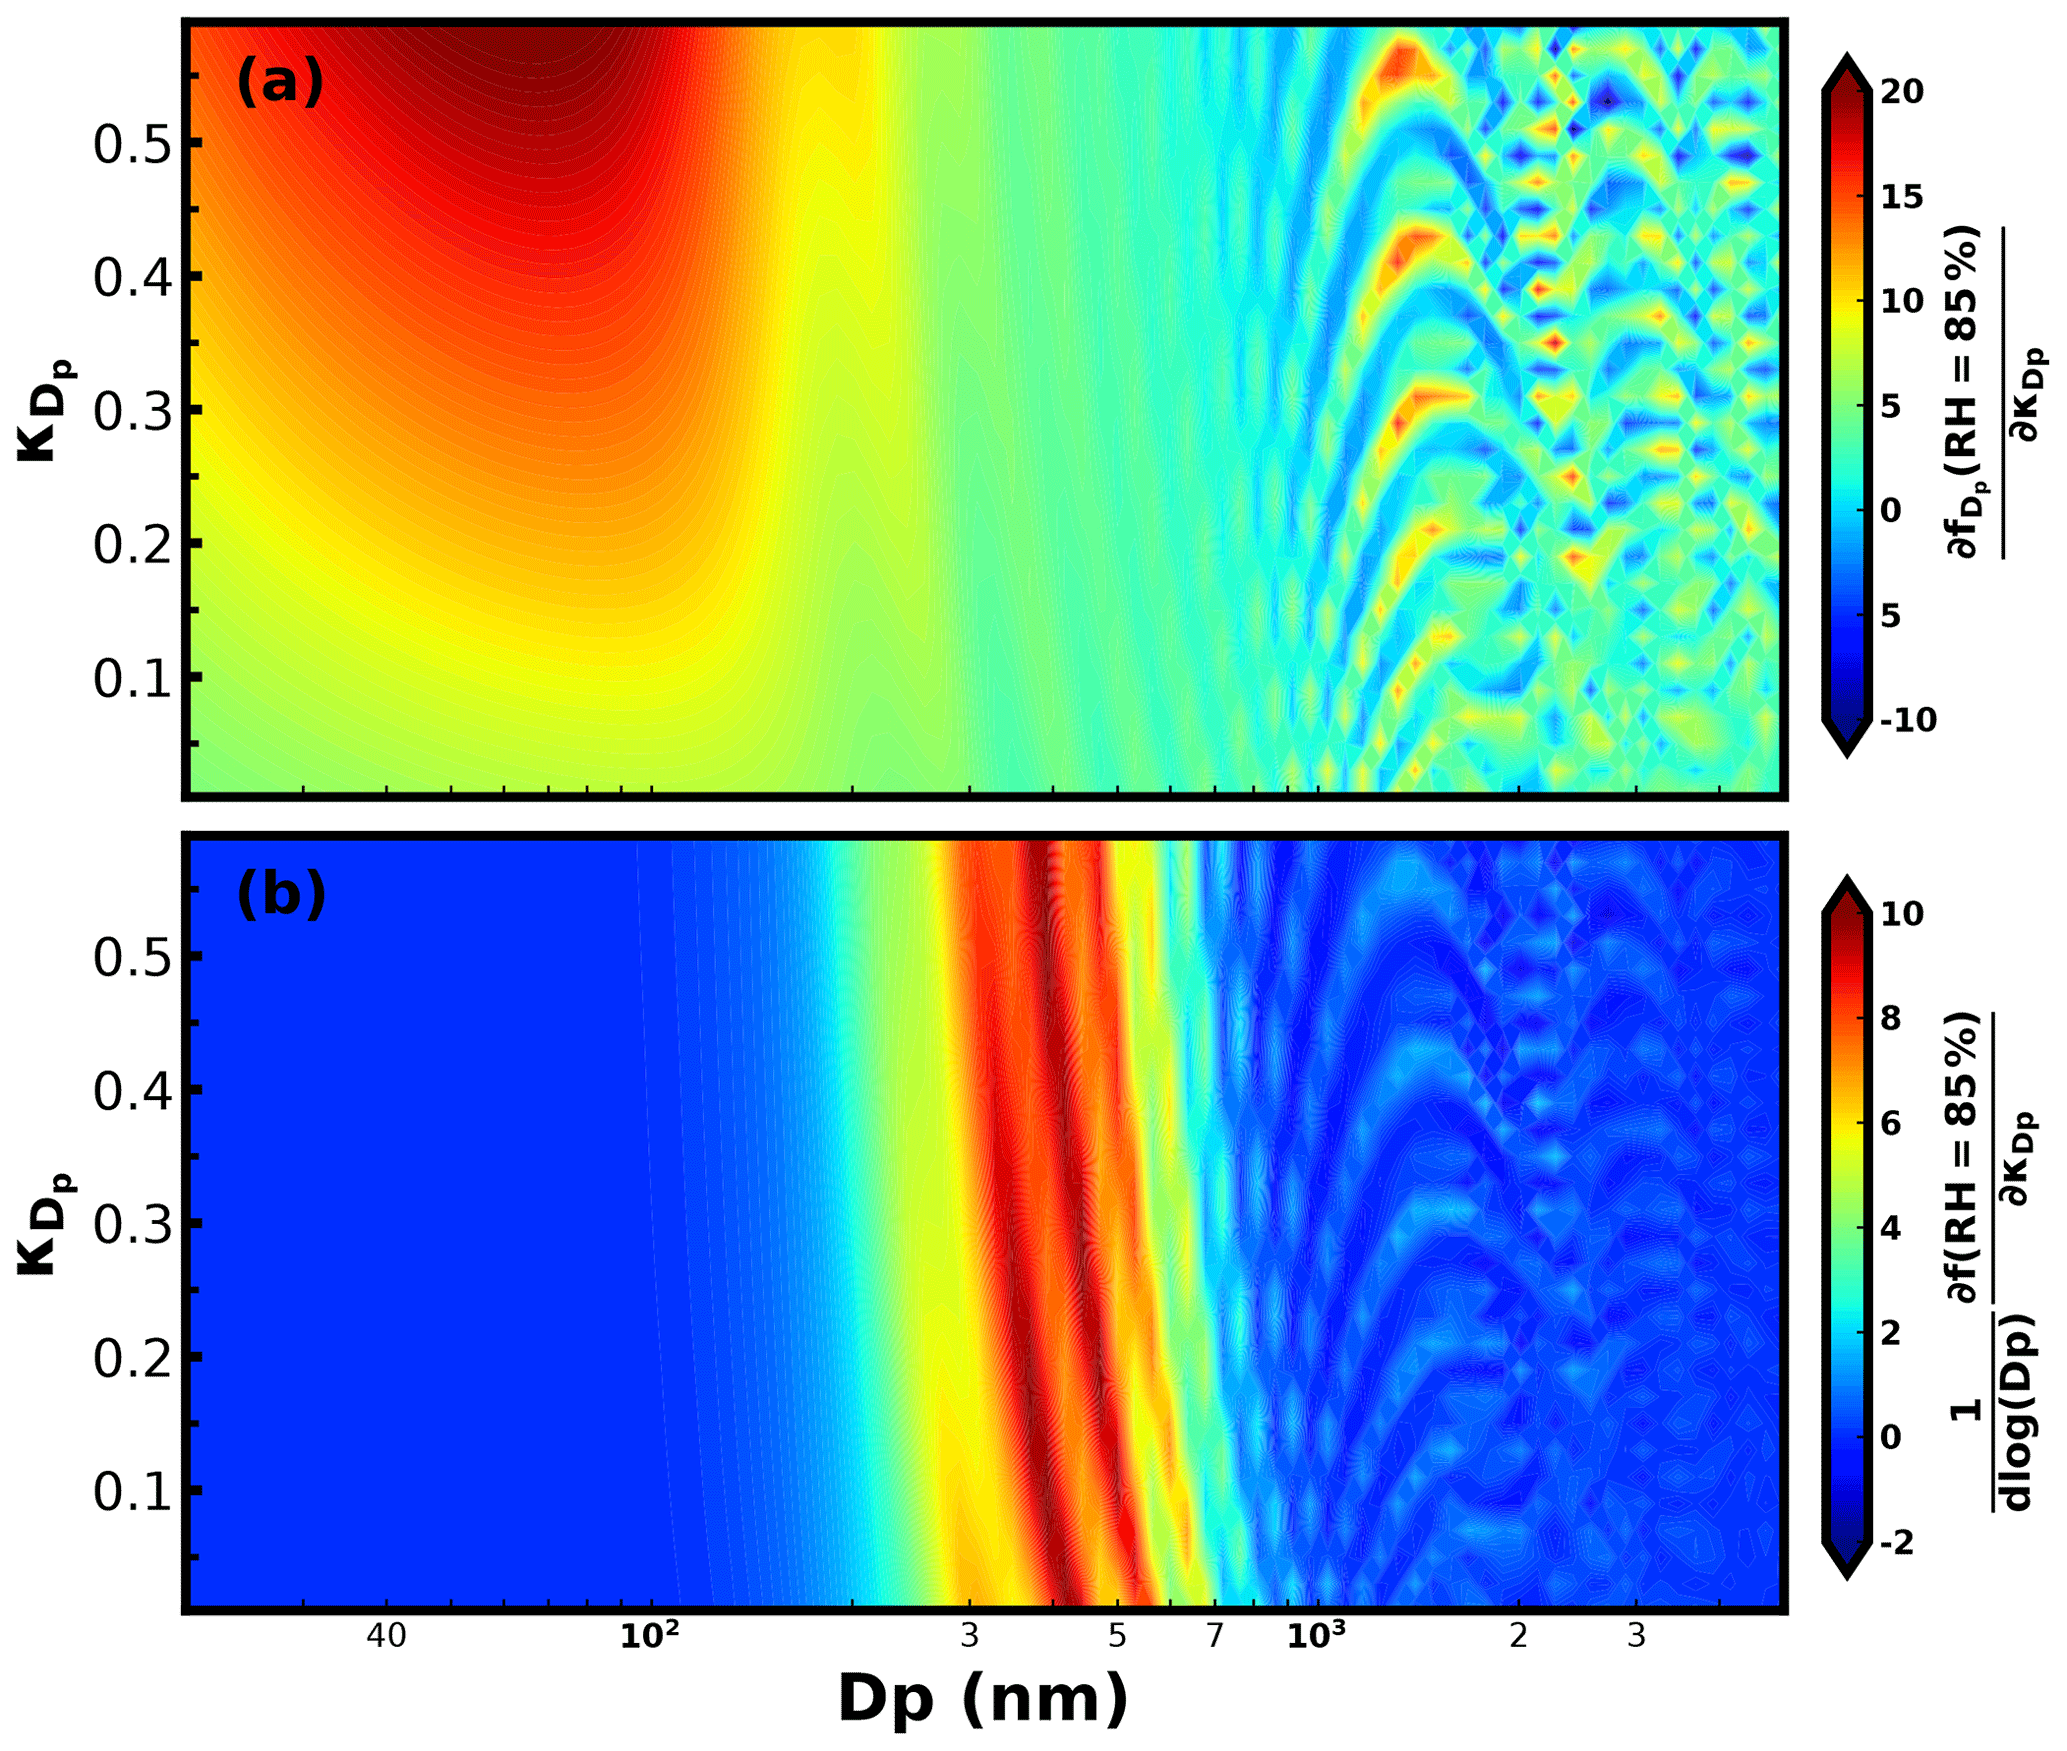
The sensitivity of f(RH) to is determined together by the two terms in Eq. (12): (1) , which represents the contribution of σsp of aerosol particles in the dry state with the diameter Dp to total σsp, and (2) , which represents the sensitivity of to . Based on the Mie theory and the κ-Köhler theory, we simulated the second term under the 85 % RH condition for varying Dp and values (Fig. 2a). In the diameter range below 200 nm, is very high, displaying a maximum near 60 nm. In this diameter range, a larger generally corresponds to a higher . For nm, higher and lower values appear alternatively, with all values staying positive. For Dp>800 nm, maxima and minima regions appear alternatively, and might decrease with increasing . This is because, at this diameter range, the aerosol scattering efficiency has a non-monotonic response to the particle diameter increase (see Fig. 2a of Kuang et al., 2018).
The first term of Eq. (9), representing size-resolved σsp contributions of particles with the diameter in the dry state, mainly depends on the PNSD. The average PNSD of PM10 was applied in the simulation of the first term using Mie theory (Fig. S3). Combining results of the first term and second term, the sensitivity of f(RH) to was obtained and depicted in Fig. 2b. Results reveal that f(RH) is quite sensitive to the of particles within the 200 to 800 nm diameter range but almost insensitive to of particles with diameters below 200 nm and above 800 nm (corresponding aerodynamic diameter of about 1 µm). For particles smaller than 200 nm, the first term was quite small, especially for particles smaller than 100 nm (Fig. S3), while for particles larger than 800 nm, in addition to a small first term, the second term fluctuated between negative and positive values, which is why f(RH) was not sensitive to the overall hygroscopicity of these larger aerosol particles. These results suggest that although κf(RH) was derived from f(RH) measurements of PM10, it mainly represents the overall hygroscopicity of aerosol particles with dry diameters between 200 and 800 nm for continental aerosol. This result indicates that κf(RH) values derived from f(RH) measurements of PM10 and PM1 should differ little from each other for measurements conducted in continental regions.
However, the quantitative relationship between the κf(RH) and size-resolved is still not clear. Based on Eq. (11), can be expressed as
where g is the growth factor of aerosol particles which is a function of and RH (Brock et al., 2016), i.e., , dN is differential form of aerosol number concentration, and Qsca is the scattering efficiency as a function of Dp and g. The results of Kuang et al. (2018) indicate that, under the dry state, Qsca can be expressed as , with k varying as a function of Dp. Here, we follow this idea and express the Qsca under the humidified condition as , where C is a function of Dp, , and RH. Replacing g and Qsca in Eq. (13), we yield
which we can substitute into Eq. (8) to obtain a new expression for f(RH):
If we define , and considering that , Eq. (14) can be written as
The κf(RH) is a uniform κ for aerosol particle sizes that can yield a simulated f(RH) equal to the measured one. Thus, f(RH) can also be expressed as
Combining Eqs. (16) and (17), the relationship between κf(RH) and size-resolved can be derived as
Xc values under 85 % RH for different Dp and values are simulated and shown in Fig. 3; based on this result of Xc the second term of Eq. (18) (which depends on the PNSD and size-resolved could be calculated using the average PNSD during this field campaign and two assumed extreme cases of size-resolved (solid and dashed black lines in Fig. 3). For PM1, the second term corresponding to the two size-resolved cases was −0.007 and 0.008, respectively. Corresponding values simulated for PM10 were −0.005 and 0.004, respectively. To further investigate the possible contribution range of the second term to κf(RH), size-resolved values derived by Liu et al. (2014) based on size-resolved chemical-composition measurements in ambient atmosphere in the NCP region (Fig. S4) were used with the average PNSD during this campaign to calculate values of the second term. Calculated values of second term ranged from −0.005 to 0.009, with its contribution to κf(RH) ranging from −1.5 % to 2 % (0.3 % on average). These results indicate that the second term was negligible in most cases, and Eq. (18) could be approximated as
Xc values shown in Fig. 3 indicate that for aerosol particles in the diameter range of 200 to 800 nm (which contribute most to σsp and are the part of the aerosol population that κf(RH) is most sensitive to) and for the observed range of continental aerosol (usually less than 0.5), Xc mainly ranged from 0.7 to 1. Considering this, we might approximately assume Xc in Eq. (18) to be a constant value. Then, Eq. (19) can be further simplified to
This result suggests that κf(RH) can be approximately understood as the overall hygroscopicity of aerosol particles with the σsp contribution as the weighting function of .
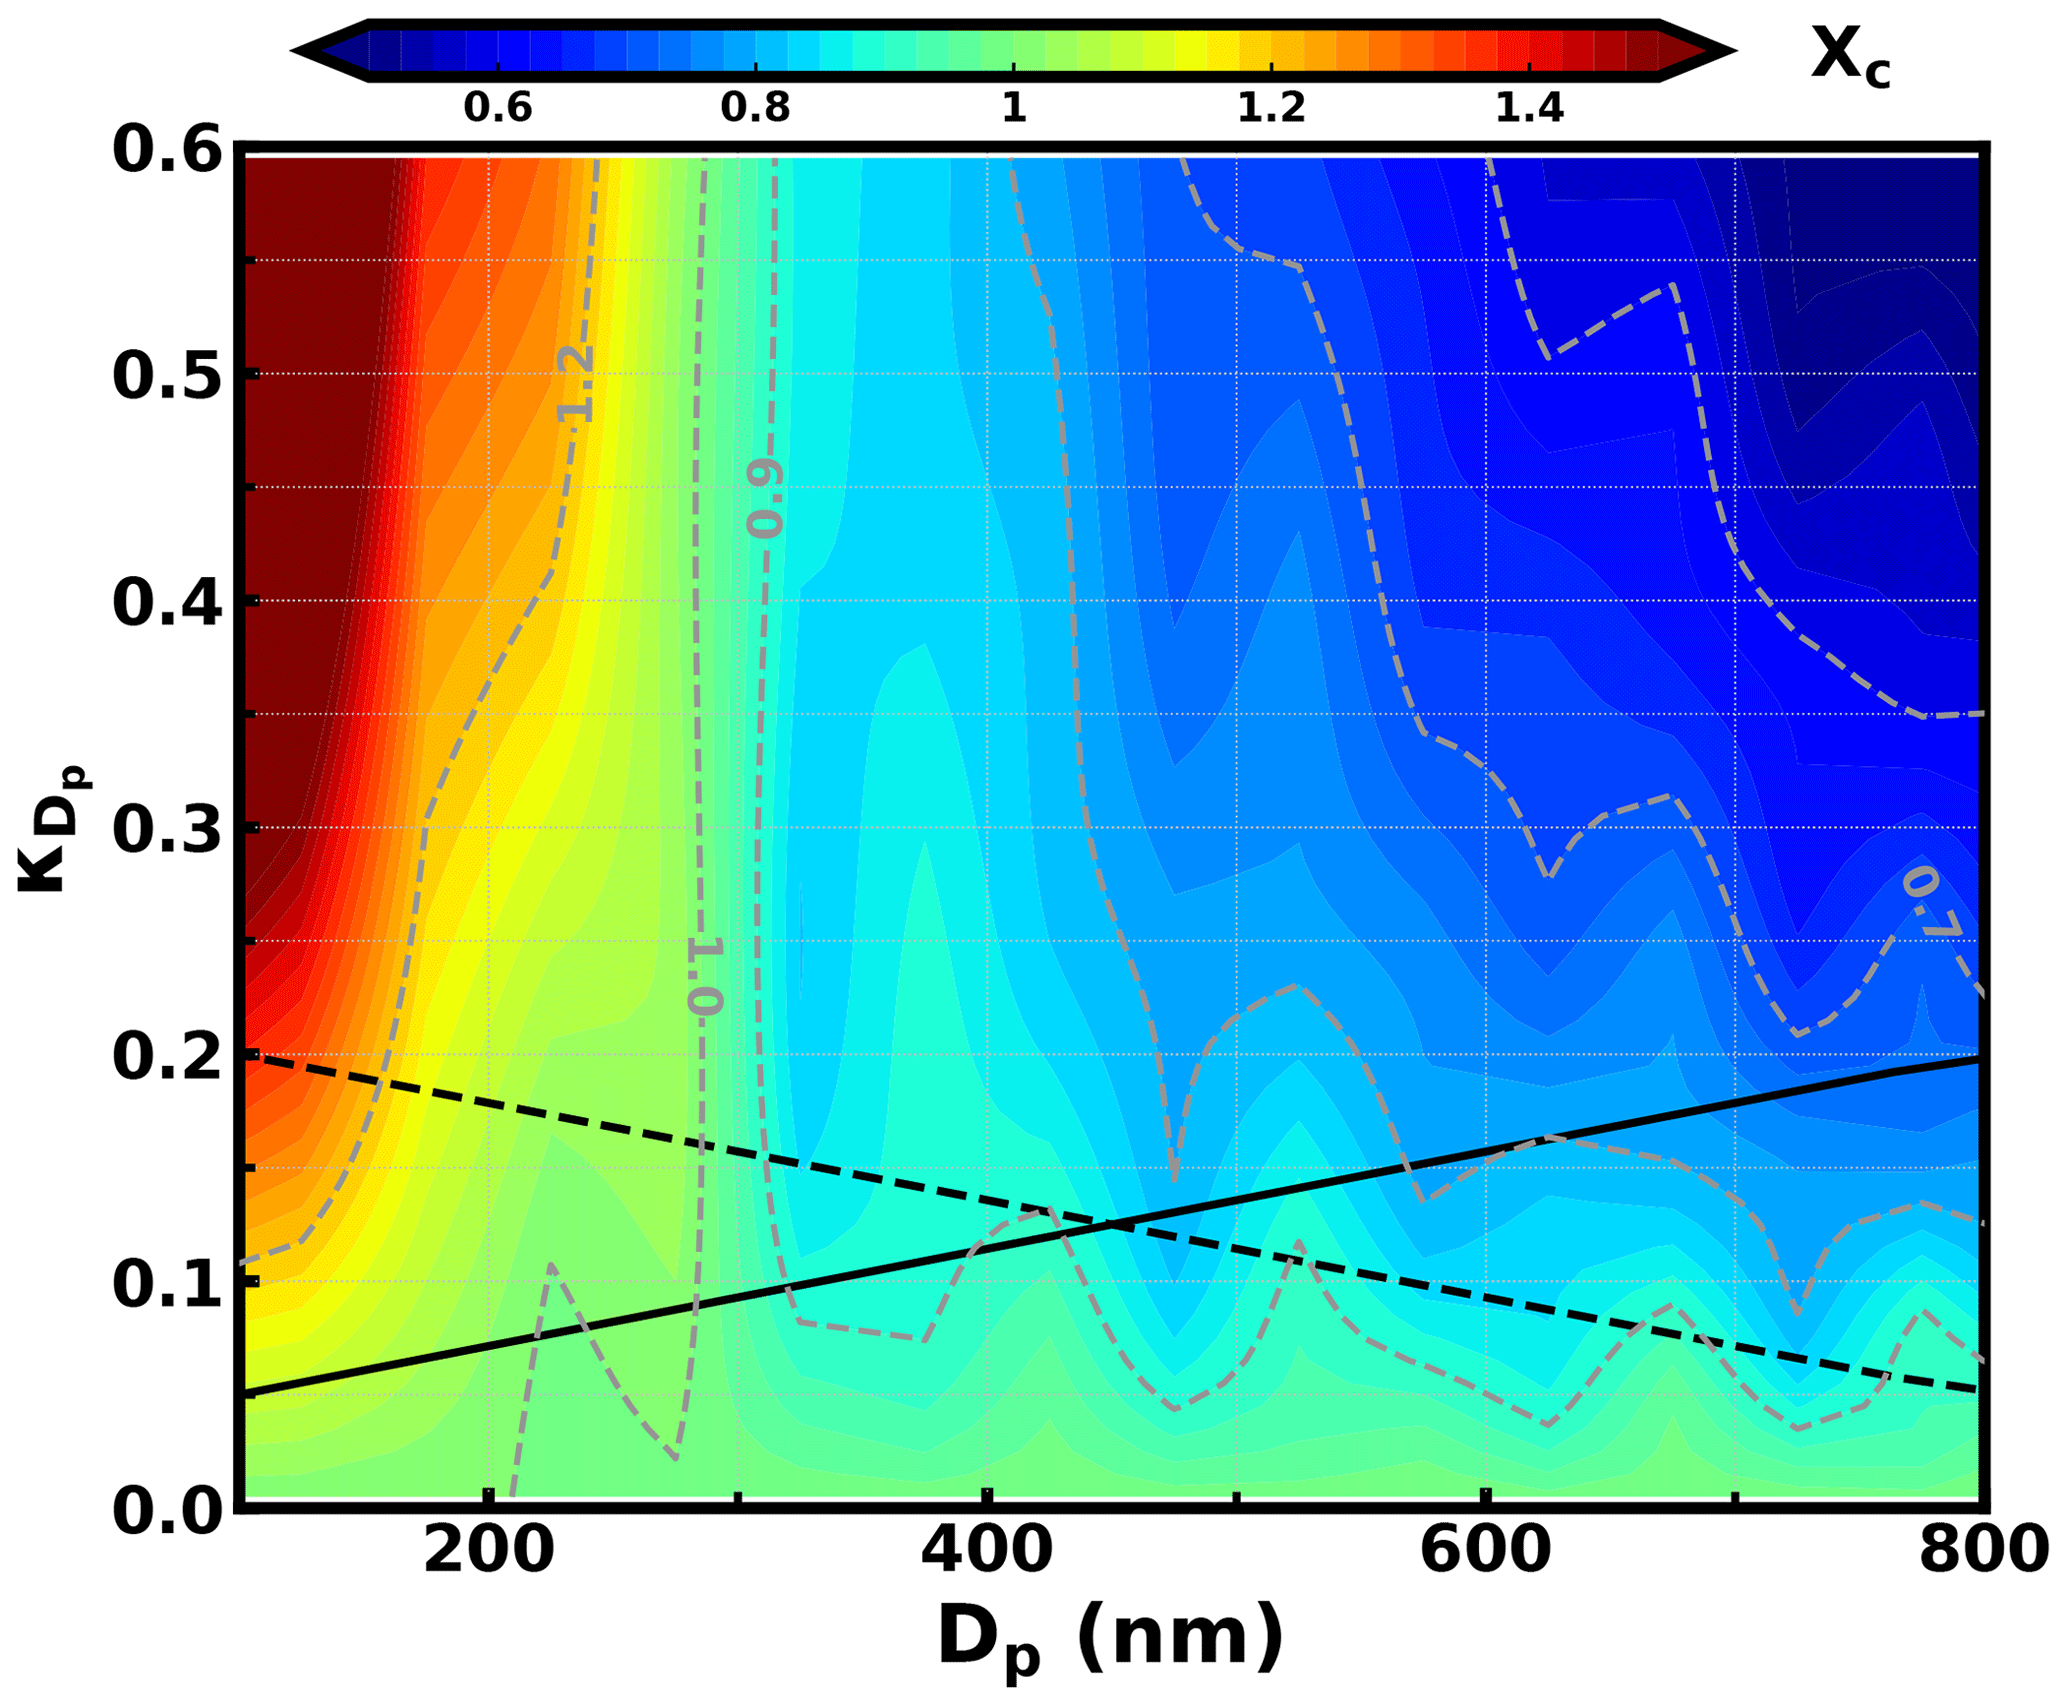
Figure 3Simulated values of Xc under 85 % RH for different Dp and values. Black solid and dashed lines are two assumed size-resolved distributions.
Based on results of Eqs. (8) and (20), both κf(RH) and κchem represent the overall hygroscopicity of bulk aerosol particles; however, their weighting functions of are different. Within a certain Dp range, aerosol σsp is approximately proportional to aerosol volume (Kuang et al., 2018), resulting in little difference between κf(RH) and κchem. In this study, bulk κf(RH) was measured for both PM1 and PM10. How much does κchem differ from κf(RH) for PM1 and PM10 samples? Both PNSD and size-resolved distributions contribute to the difference between κchem and κf(RH). To study their influences in a simple and apparent way, κchem and κf(RH) were simulated based on the two extreme cases of size-resolved distributions in Fig. 3 and five average PNSDs corresponding to five ranges of the aerosol Ångström exponent (0.9–1.1, 1.1–1.3, 1.3–1.5, 1.5–1.7, and 1.7–1.9) during this field campaign. In the instance of PM1, as can be seen in Fig. 4a, assuming a increasing as a function of Dp resulted in κchem<κf(RH) (squares in Fig. 4a), especially for PNSDs corresponding to larger Ångström exponents. This is because the volume contributions of small particles (e.g., particles with Dp between 100 to 300 nm) to Vtot are larger than their light-scattering coefficient contributions to σsp (as shown in Fig. S6); thus the hygroscopicity of small particles had larger impacts on κchem than κf(RH). Higher Ångström exponents generally correspond to a shift in PNSD towards smaller Dp, which exacerbates the contribution of small particles, further increasing the difference between κchem and κf(RH). For the case with decreasing as a function of Dp (circle markers in Fig. 4a), the opposite applies, resulting in κchem>κf(RH). In general, for these two extreme cases of size-resolved distributions, the absolute value of the relative difference between κchem and κf(RH) ranged from 2.8 % to 7.5 %, with an average of 4.8 %. This result indicates that for PM1, κchem might differ little from κf(RH), since usually varies less with Dp in ambient atmosphere than in the two assumed cases (Liu et al., 2014). The average size-resolved distribution from the Haze in China campaign (Liu et al., 2014) indicates that varies significantly for Dp<250 nm, while it varies less within the diameter range of 250 nm to 1 µm. To further study the variation range of the relative difference between κchem and κf(RH) under ambient conditions, the size-resolved distributions derived from measured size-resolved chemical compositions in the NCP region (Liu et al., 2014; shown in Fig. S5) were used in simulations, and results are shown in Fig. 4b. The absolute value of the relative difference between κchem and κf(RH) ranged from 0.04 % to 8 %, with an average and standard deviation of 2.8±2 %, which further confirms that for PM1, κf(RH) can accurately represent κchem in most cases.
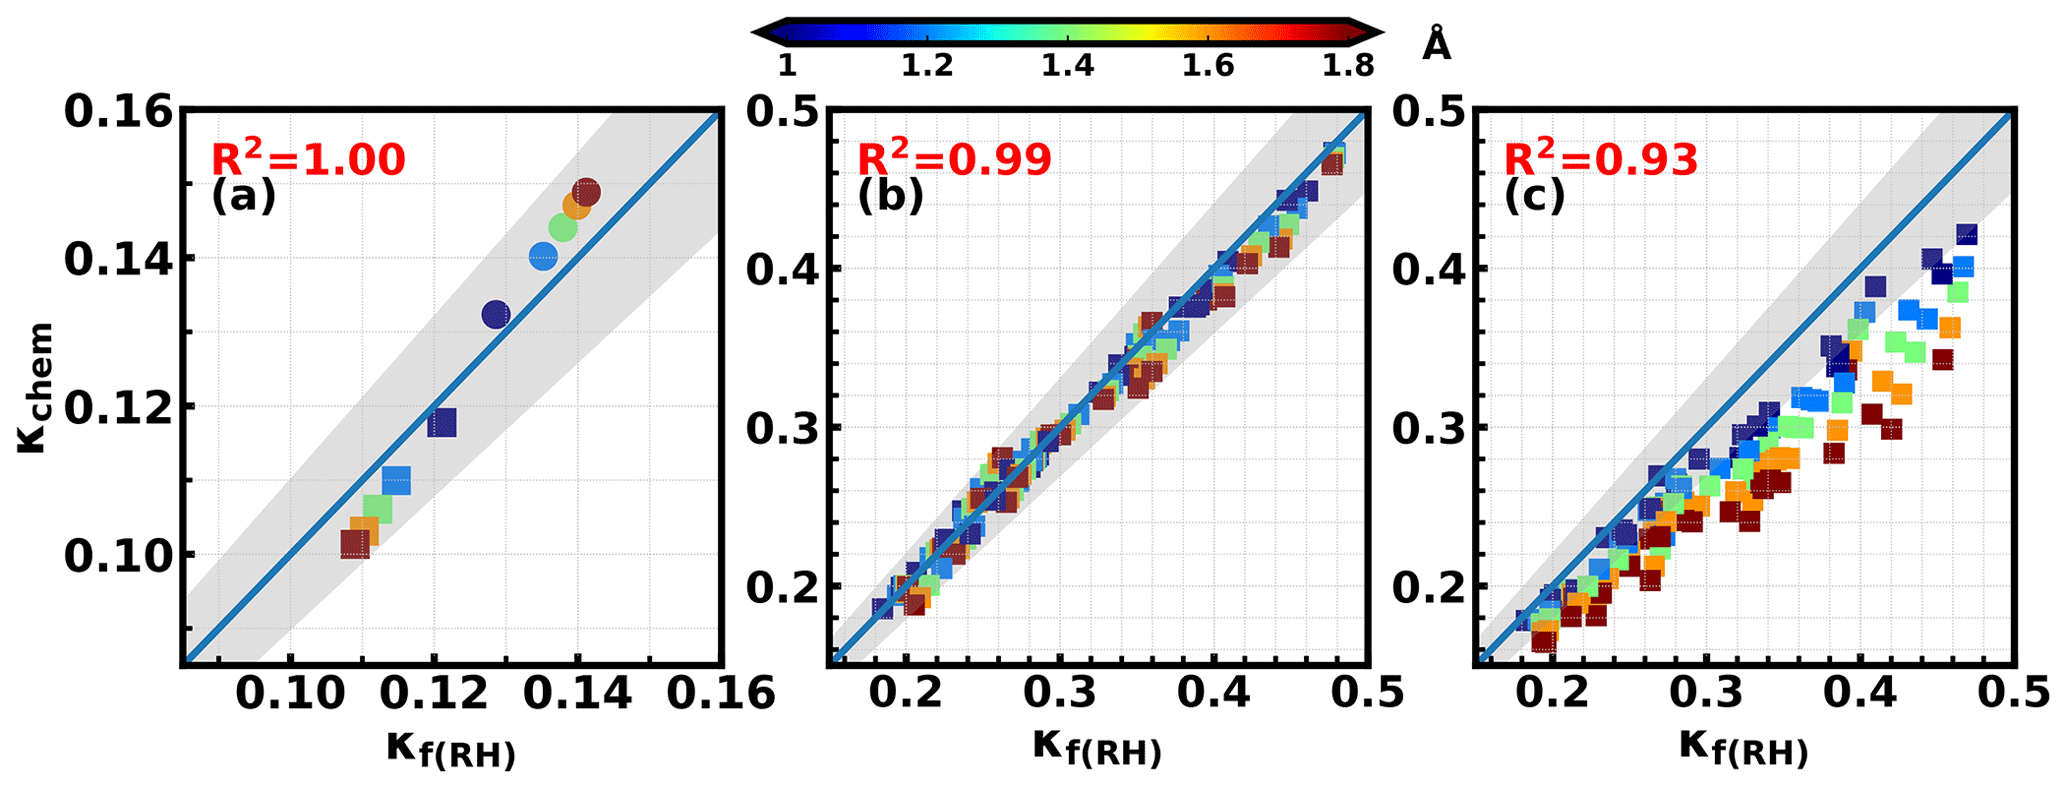
Figure 4κchem versus κf(RH); colors represent average Ångström exponent (Å) values of corresponding PNSD (a) corresponding to size-resolved distributions shown in Fig. 3 (squares correspond to the solid line in Fig. 3, and circles correspond to the dashed line in Fig. 3). (b) and (c) correspond to size-resolved distributions shown in Fig. S4 for PM1 and PM10, respectively. Gray areas represent the absolute relative differences between κchem and κf(RH) less than 10 %.
For PM10, values of κchem and κf(RH) using size distributions derived from ambient measurements (Fig. S5, similar to Fig. 4b) were simulated and displayed in Fig. 4c. The simulated absolute values of the relative difference between κchem and κf(RH) ranged from 0.2 % to 41 %, with an average and standard deviation of 16±8 % and with all κchem values lower than κf(RH). This is because, for PM10, supermicron particles, typically with low hygroscopicity (Fig. S5), contribute much more to Vtot than to σsp (as shown in Fig. S7). These results indicate that, for PM10, κf(RH) cannot accurately represent κchem.
Above analysis results indicate that κf(RH) retrieved from light-scattering measurements of PM1 represent the κchem of PM1 accurately and can be used in Eq. (5) as measured κchem for deriving κOA.
4.1 Overview of the campaign data
The time series of ambient RH, chemical compositions of PM2.5 and PM1, σsp at 525 nm of PM10 and PM1 in the dry state, and calculated κsca and κf(RH) values of PM10 and PM1 are shown in Fig. 5. Overall, the mass concentrations of NR-PM1 and NR-PM2.5 ranged from 1 to 221 µg m−3 and from 1.8 to 326 µg m−3, with average concentrations of 63 and 93 µg m−3, respectively. Measured σsp at 525 nm of PM1 and PM10 ranged from 11 to 1875 Mm−1 and from 18 to 2732 Mm−1, with average values of 550 and 814 Mm−1, respectively. These results demonstrate that this campaign was carried out at a site that is overall highly polluted, where quite clean conditions as well as extremely polluted conditions were experienced during the measurement period. The mass contributions of ammonium, nitrate, sulfate, and organics to NR-PM2.5 and NR-PM1 are listed in Table 3, with organics being the major fraction of NR-PM1 and NR-PM2.5.
Table 3Average (range) mass contribution of ammonium, nitrate, sulfate, and organics to NR-PM2.5 and NR-PM1 during different periods.
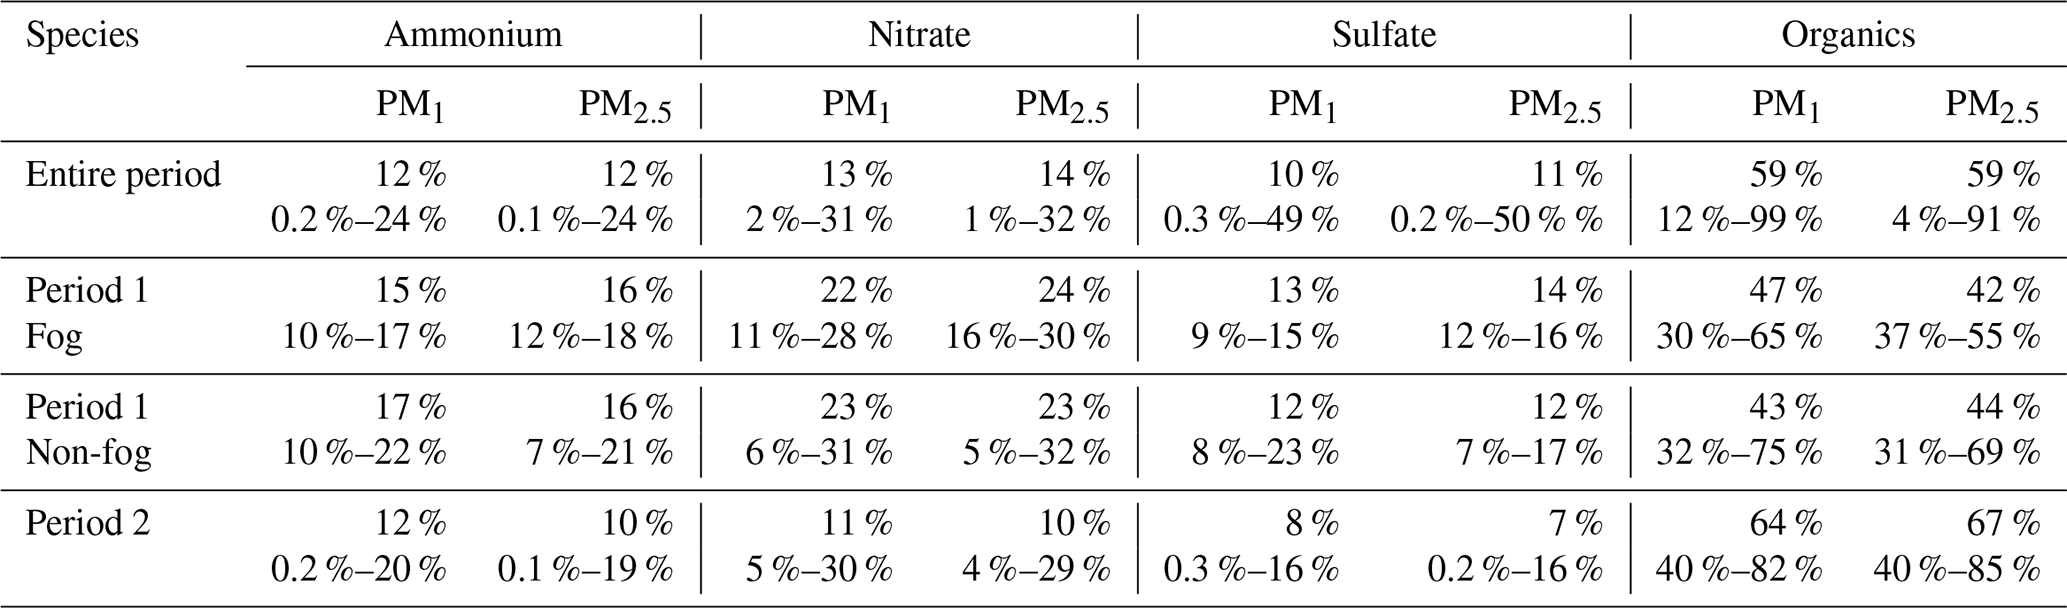
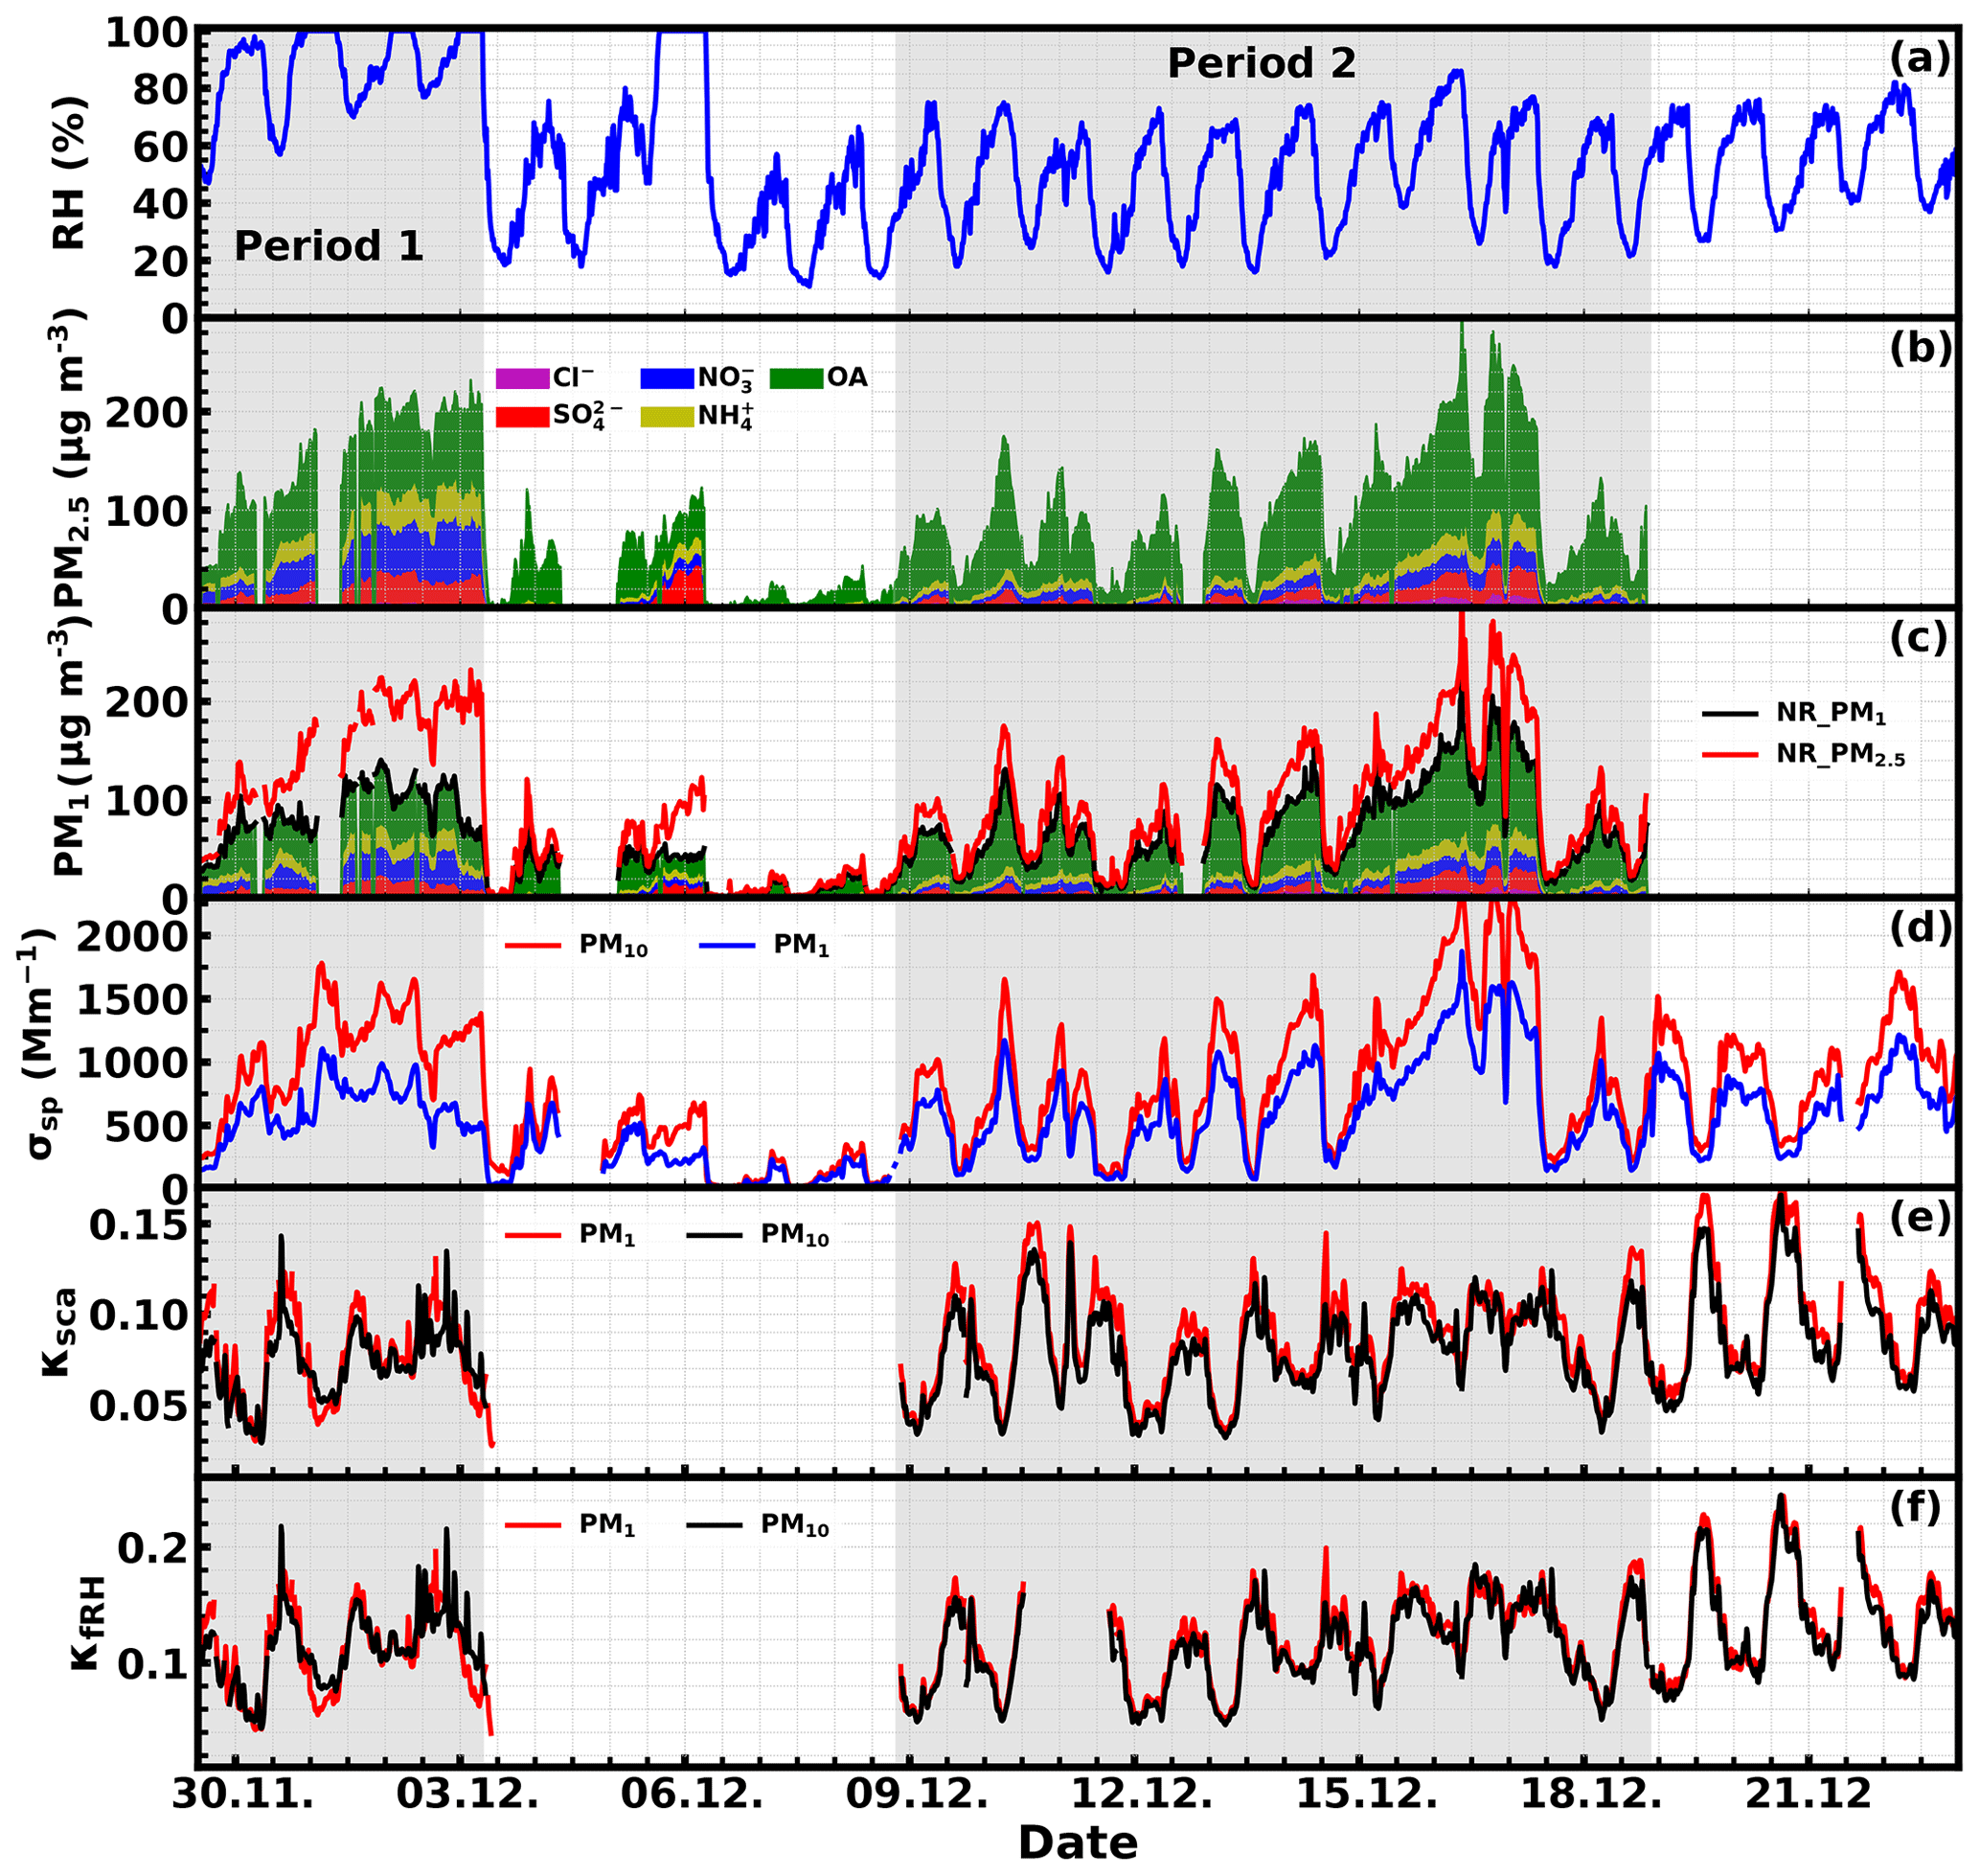
Figure 5Time series of ambient RH (a), chemical compositions of PM2.5 (b) and PM1 (c), σsp at 525 nm of PM10 and PM1 (d), and calculated κsca (e) and κf(RH) (f) values of PM10 and PM1.
During Period 1 shown in Fig. 5, nitrate contributed most to inorganics, while inorganics contribute most to mass concentrations of NR-PM2.5 and NR-PM1. During Period 2, shown in Fig. 5, the ambient RH is relatively lower than that of the first period, ranging from 16 % to 86 % with an average of 49 %. During this period, organics contributed most to mass concentrations of NR-PM2.5 and NR-PM1, with the NR mass concentrations of PM2.5 and σsp at 525 nm of PM10 being only 33 % and 40 % higher than those of PM1.
The time series of calculated κsca and κf(RH) are shown in Fig. 5e–f. The κsca of PM1 and PM10 ranged from 0.01 to 0.2 and from 0.02 to 0.17, with corresponding averages of 0.09 and 0.08, respectively. The κf(RH) was not available from 12:00 on 10 December to 12:00 LT on 11 December due to the absence of PNSD measurements. The κf(RH) of PM1 and PM10 ranged from 0.02 to 0.27 and from 0.03 to 0.26, with corresponding averages of 0.12 and 0.12, respectively. These results indicate that the hygroscopicity during this campaign was generally low, which could be associated with the high mass contributions of organics. The range as well as the average level of κf(RH) is quite consistent with the results obtained at the same site in winter 2016, suggesting the prevalent low aerosol hygroscopicity conditions in winter at this site. Additionally, it can be noted that, except for fog events, κsca and κf(RH) values of PM1 are generally higher than those of PM10, yet the differences are small (10 % and 3.5 % for κsca and κf(RH), respectively). Although particles with diameters above 800 nm have an almost negligible impact on retrieved κf(RH) (refer to discussions in Sect. 3.3), it can still cause a small difference between κf(RH) of PM10 and PM1. Results of previous studies indicate that the overall hygroscopicity of aerosol particles larger than 800 nm is usually low and is typically lower than the overall hygroscopicity of accumulation-mode particles (Liu et al., 2014), which may explain why κf(RH) values of PM1 are generally higher than those of PM10 during non-fog periods (periods with RH < 100 %).
During fog periods, a large number of submicron particles in the dry state will be activated into fog droplets, which are supermicron particles in the ambient state (see PNSD examples in Fig. S4a), exerting substantial impacts on f(RH) measurements of PM10, which are not detectable in the PM1 measurements. Since for a certain particle diameter and fog supersaturation, particles with higher hygroscopicity are more readily activated, the observed PM10 κf(RH) increased during fog events and often exceeded those of PM1 in contrast to non-fog periods (Fig. 5f).
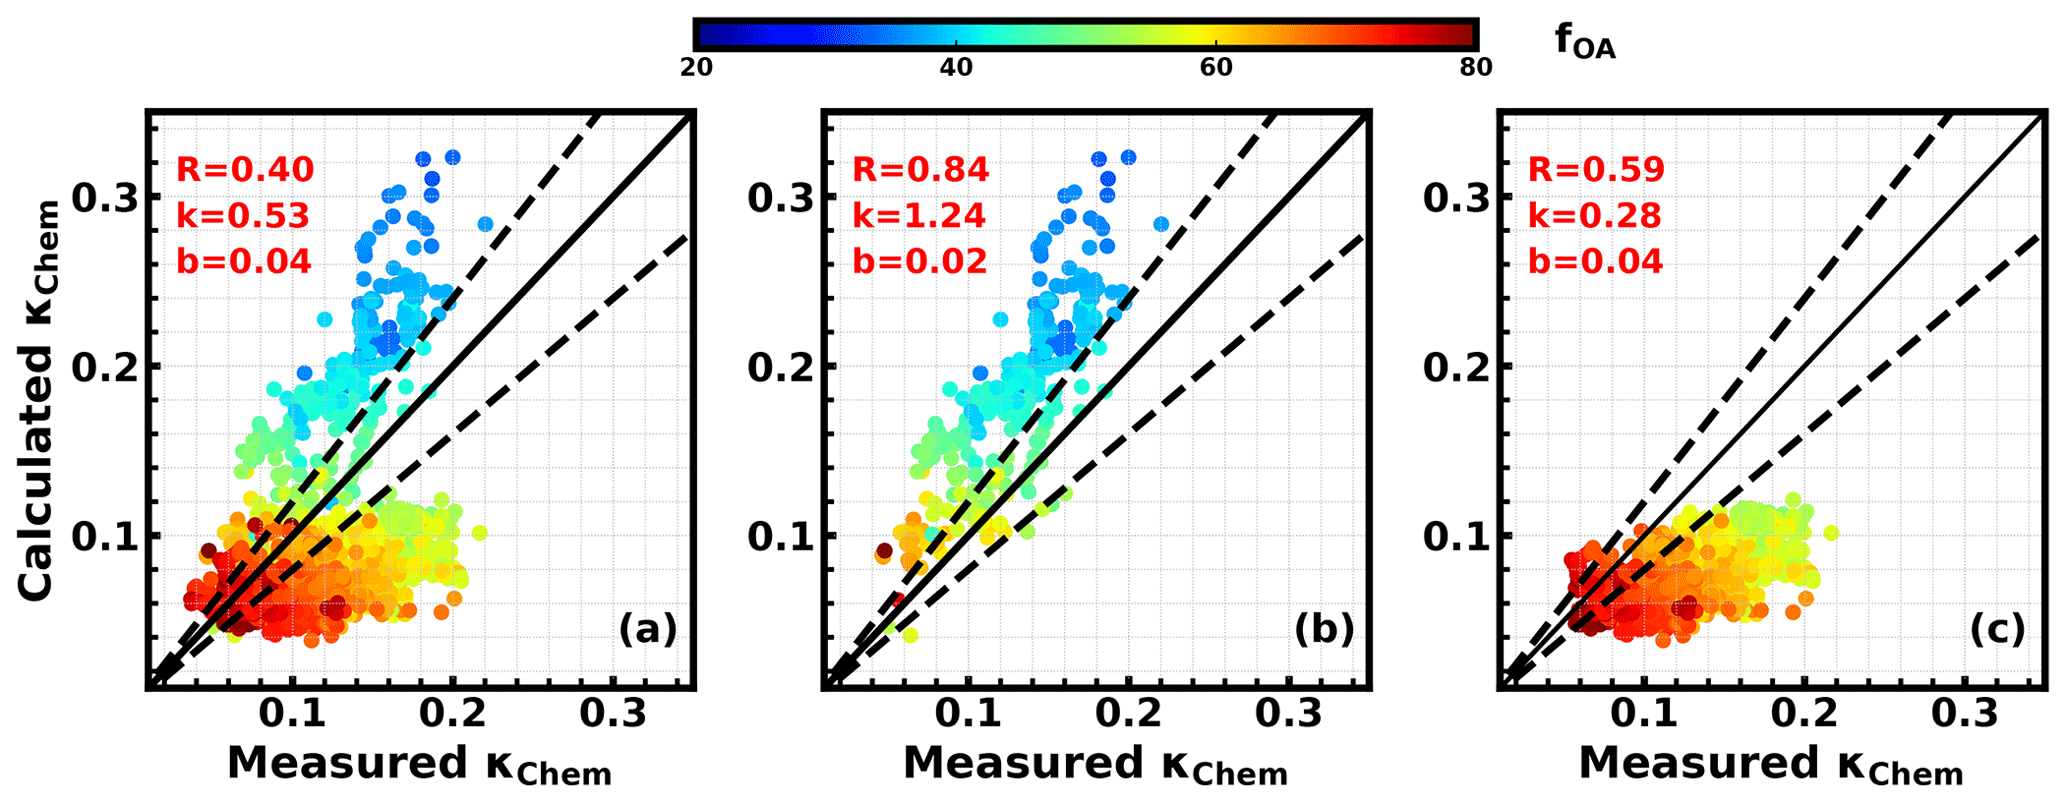
Figure 6Comparison between measured and calculated κchem by assuming a κOA of 0.06. (a) The whole period. (b) Only Period 1. (c) Only Period 2. Colors represents the mass fractions of organic aerosol in NR-PM1 (fOA), and the color bar is shown on the top.
4.2 κOA derivations and its relationship with organic aerosol oxidation state
The results in Sect. 3.3 demonstrate that the κf(RH) of PM1 accurately represents the κchem in most cases; thus a closure study between calculated κchem values of PM1 based on measured chemical compositions and measured κchem values (represented by PM1 κf(RH)) can be conducted using Eq. (3) if κOA is known. A κOA of 0.06 was used in this closure test, which was calculated by Wu et al. (2016) based on aerosol chemical composition and aerosol hygroscopicity measurements. As shown in Fig. 6a, the comparison between measured and calculated κchem has not achieved very good agreements. We notice that the calculated κchem was overestimated when the mass fraction of organic aerosol (fOA) was lower than 45 %, while it was underestimated when fOA was higher than 45 %. As described in Sect. 4.1, these two situations roughly correspond to Period 1 and 2, respectively. Separating the data points shown in Fig. 6a into Period 1 (Fig. 7b) and 2 (Fig. 7c), it can be seen that all low fOA data points are found in Period 1, with most of the data points showing a fOA of less than 50 %. Although the calculated κchem values during this period were on average 25 % higher than the measured κchem values, they were highly correlated (R=0.84). A similar case was also found in Wu et al. (2013), and they concluded that the loss of semi-volatile ammonium nitrate in the HTDMA might be the reason. The relationship between nitrate concentration and the difference between calculated and measured κchem were investigated, which confirmed the influence of nitrate on this discrepancy (Fig. S7) and the overestimation of calculated κchem due to the volatile loss of ammonium nitrate. Since the tube length (from the splitter to inlet of instrument) of the wet nephelometer was about 1 m longer than that of the CV-ToF-ACSM, there was probably more loss in ammonium nitrate in the wet nephelometer.
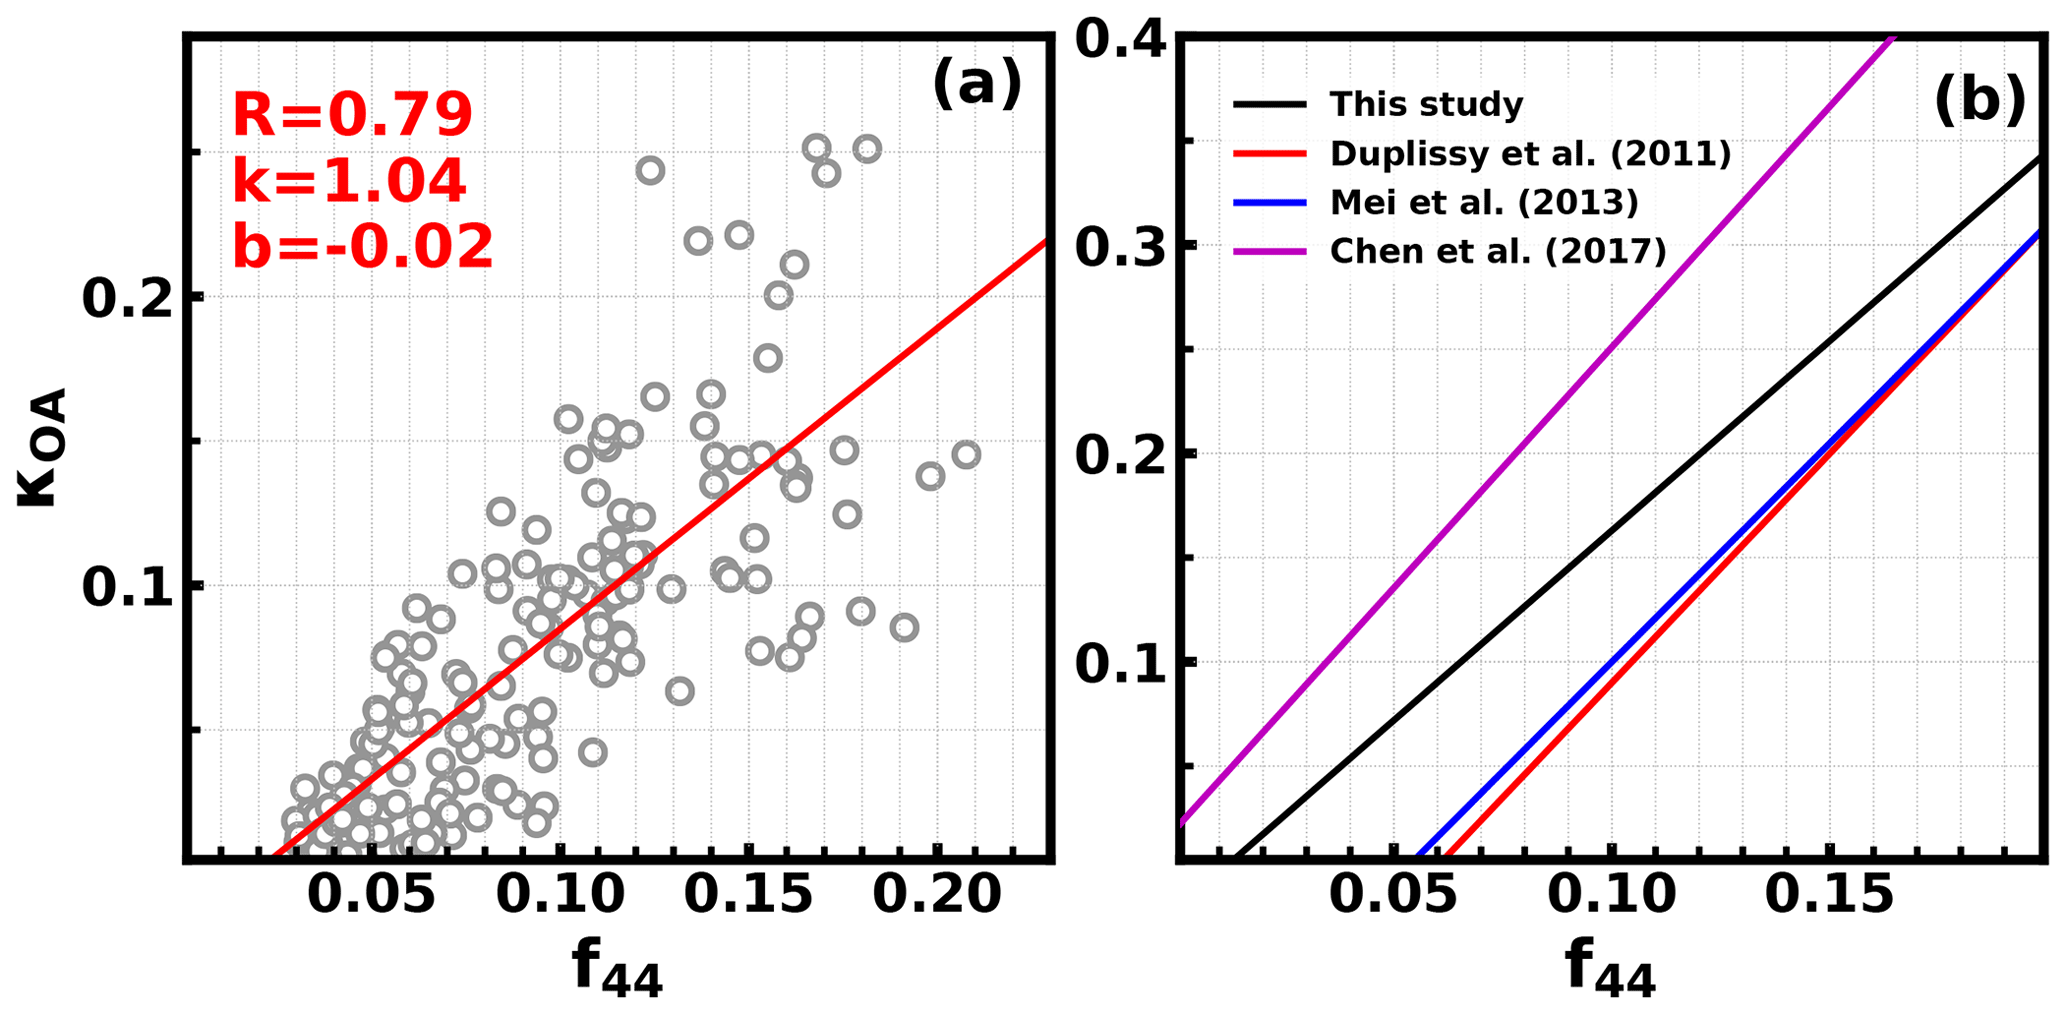
Figure 7(a) The relationship between derived κOA and f44. (b) Comparison with previous studies.
During Period 2, the average mass fraction of nitrate was low (11 %), and the loss of ammonium nitrate had a minor influence on κchem estimations (Fig. S7). However, when organic aerosol was dominant during Period 2, the calculated κchem was underestimated in most cases (Fig. 6c). Previous studies have shown a larger κOA for OA with a higher oxidation level (Chang et al., 2010; Duplissy et al., 2011; Wu et al., 2013), which might have contributed to the underestimation in κchem. This gave us the hint that Period 2 might provide us a good opportunity to study κOA. Following the method in Sect. 3.2, κOA was derived using Eq. (5), resulting in a κOA ranging from 0.0 to 0.25, with an average of 0.08±0.06. This indicates that using a constant κOA value in the calculation of κchem would result in a large bias. To further investigate the impact of OA oxidation level on κOA, we compared the derived κOA against f44, which is often used to represent the oxidation level of OA. Results show a clear positive correlation (R=0.79) and a statistical relationship of (Fig. 7a), indicating that the degree of the oxidation level is a crucial parameter determining the OA hygroscopicity. Based on the relationship between f44 and the O∕C ratio for CV-ACSM (Hu et al., 2018b), , the relationship between κOA and O:C can be expressed as . The derived empirical relationship between κOA and f44 was compared to results in previous studies (Fig. 7b). As mentioned in Sect. 2.3, the f44 from CV-ToF-ACSM measurements is much higher than that previously reported from AMS, but they are well correlated, and the ratio between the f44 of CV-ToF-ACSM and previous AMS instruments for ambient aerosol ranges from 1.5 to 2, with an average of 1.75. Therefore, to be consistent with the f44 in previous studies, the empirical relationship in Fig. 7b is changed to . The κOA values are lower than those from the scheme of Chen et al. (2017) but higher than those in Duplissy et al. (2011) and Mei et al. (2013a). In general, results of most published studies about κOA demonstrate that hygroscopicity of organic aerosol generally increases as the oxidation level of organic aerosol increases; however, the empirical mathematical relationship differs much among different studies (Hong et al., 2018). These results highlight that more studies are required to study the influence of the OA oxidation level on κOA and to derive a more universal parameterization scheme that can be used in chemical transport models.
4.3 Distinct diurnal variations in κOA and its relationship with OOA
The time series of derived κOA are depicted in Fig. 8a, which showed large fluctuations in a day. The average κOA (Fig. 8b) displays a distinct diurnal variation, with κOA reaching its minimum (0.02) in the morning (near 07:30 LT) and increasing quickly to a maximum (0.16) near 14:30 LT. As a consequence, the water uptake abilities of organic aerosol particles changed from nearly hydrophobic to moderately hygroscopic within 7 h during the day. Previous results from observations in Japan also revealed significant κOA diurnal variations, though with daily minima in the afternoon hours due to the increase in less oxygenated OA mass fractions (Deng et al., 2018, 2019). Such large variability and significant diurnal variations in κOA were observed for the first time on the NCP. We found that the diurnal profile of the mass fraction OOA in OA (fOOA) was remarkably similar to that of κOA (R=0.8; Fig. 8a and c), suggesting that OOA is very likely the determining factor of κOA in winter on the NCP.

Figure 8(a) Time series of derived κOA and OOA mass fraction in NR-PM1 (fOOA) on the right y axis. (b) Average diurnal profile of κOA. (c) Scatter points of κOA versus fOOA (%), and red line is the fitting line with linear regression.
The correlation coefficient between the average diurnal profiles of κOA and fOOA was 0.95, which suggests that the variations in fOOA were driving the significant diurnal variations in κOA. The average diurnal variations in mass concentrations of identified OOA, HOA, COA, CCOA, BBOA, and their mass fractions in total organic mass are shown in Fig. 9a and b, respectively. The mass concentrations of HOA, CCOA, and BBOA decreased rapidly from the morning to 15:00 LT due to the rising boundary layer height and also to the decreased primary source emissions. The mass concentrations of COA increased a little in the morning and then decreased quickly after 09:30 LT. This transitory increase in COA in the morning might be associated with cooking for breakfast. However, the OOA mass increased rapidly from about 07:30 to 10:30 LT despite the boundary layer development during period of time and then remained almost constant thereafter. The rapid decreases in primary organic aerosol components and the increases in OOA concentration together resulted in a dramatic increase in fOOA, from ∼10 % at 09:00 LT to ∼45 % at 13:30 LT in the afternoon, which also corresponds to the similar increase in κOA. After 14:30 LT, the OOA mass concentration remained relatively unchanged; however, of the large increases in primary organic aerosol components, it also led to considerable decreases in fOOA and κOA.

Figure 9(a) Average diurnal profiles of mass concentrations of OOA, HOA, COA, CCOA, and BBOA. (b) Average diurnal variations in mass fractions of OOA, HOA, COA, CCOA, and BBOA.
A field campaign was conducted at a rural site on the North China Plain in winter 2018. The major instruments deployed were a humidified nephelometer system and a CV-ToF-ACSM for the measurements of the bulk aerosol hygroscopicity of PM10 and PM1 and bulk aerosol chemical compositions of PM2.5 and PM1. The measured σsp at 525 nm of PM1 and PM10 in the dry state ranged from 11 to 1875 Mm−1 and from 18 to 2732 Mm−1, with average values of 550 and 814 Mm−1, respectively, suggesting a relatively polluted environment during this study. Retrieved κf(RH) of PM10 and PM1 ranged from 0.02 to 0.27 and from 0.03 to 0.26, with averages of 0.12 and 0.12, respectively. The difference of κf(RH) between PM10 and PM1 was found to be relatively small (3.5 % on average), which was consistent with the physical and mathematical interpretation of κf(RH).
A method for estimating κOA (organic aerosol hygroscopicity) based on f(RH) and bulk aerosol chemical-composition measurements is developed. The key part of this method is that the size cut of bulk aerosol chemical-composition measurements should be PM1 no matter whether the bulk κf(RH) is retrieved from light-scattering enhancement measurements of PM1 or PM10. The derived κOA ranged from 0.0 to 0.25, with an average of 0.08, highlighting that κOA displayed a large variability on the NCP. Therefore, using a constant κOA could introduce a considerable uncertainty in evaluating the climatic and environmental effects of organic aerosol. The variation in κOA was highly and positively correlated with the oxidation degree of OA, and κOA showed a distinct diurnal variation, with the minimum in the morning (0.02) and maximum in the afternoon (0.16). These results indicated the rapid changes in hygroscopic properties of OA in a day by evolving from nearly hydrophobic to moderately hygroscopic within 7 h. The distinct diurnal variations in κOA were strongly associated with the changes in fOOA, suggesting that the rapid formation of OOA together with the decreases in primary organic aerosol during daytime together resulted in and the changes in κOA.
The large variability and distinct diurnal variations in κOA found in this study highlight an urgent need for more studies on the spatial and temporal variations in κOA in the NCP region and also a better parameterization of κOA in chemical transport models to evaluate the impacts of OA on radiative forcing and CCN.
The data used in this study are listed in the references and a repository at https://pan.baidu.com/s/16dOPuTQ568z5JRGF0jGLHQ (last access: 21 January 2020; both python and MATLAB format) and are also available from the corresponding author upon request (kuangye@jnu.edu.cn and sunyele@mail.iap.ac.cn).
The supplement related to this article is available online at: https://doi.org/10.5194/acp-20-865-2020-supplement.
YK conceived and organized this paper. YC, HS, NM, YK, and JT planned this campaign. YK, YS, and NM designed the experiments. YK and YH conducted the ACSM and aerosol light-scattering enhancement factor measurements. YZ and SZ conducted the particle number size distribution measurements. JS and WY conducted the black carbon measurements. YH performed the ACSM PMF analysis. WX, YH, YS, CZ, PZ, and YC helped the data analysis, and WX helped much with the language editing. YK, YH, and YS prepared the paper, with contributions from all co-authors.
The authors declare that they have no conflict of interest.
We thank the technician LinHong Xie for help assembling the inlet system and maintaining the humidified nephelometer system. We also thank the scientists and technicians from the Max Planck Institute for Chemistry, Mainz, for supporting this field campaign.
This research has been supported by the National Key Research and Development Program of China (grant no. 2017YFC0210104), the National Natural Science Foundation of China (grant no. 91644218), and the National Research Program for Key Issues in Air Pollution Control (grant no. DQGG0103). This work is supported by the National Natural Science Foundation of China (grant no. 41805109) and the Guangdong Innovative and Entrepreneurial Research Team Program (research team on atmospheric environmental roles and effects of carbonaceous species: 2016ZT06N263).
This paper was edited by James Allan and reviewed by two anonymous referees.
Bergin, M. H., Cass, G. R., Xu, J., Fang, C., Zeng, L. M., Yu, T., Salmon, L. G., Kiang, C. S., Tang, X. Y., Zhang, Y. H., and Chameides, W. L.: Aerosol radiative, physical, and chemical properties in Beijing during June 1999, J. Geophys. Res.-Atmos., 106, 17969–17980, https://doi.org/10.1029/2001jd900073, 2001.
Bian, Y. X., Zhao, C. S., Ma, N., Chen, J., and Xu, W. Y.: A study of aerosol liquid water content based on hygroscopicity measurements at high relative humidity in the North China Plain, Atmos. Chem. Phys., 14, 6417–6426, https://doi.org/10.5194/acp-14-6417-2014, 2014.
Bougiatioti, A., Bezantakos, S., Stavroulas, I., Kalivitis, N., Kokkalis, P., Biskos, G., Mihalopoulos, N., Papayannis, A., and Nenes, A.: Biomass-burning impact on CCN number, hygroscopicity and cloud formation during summertime in the eastern Mediterranean, Atmos. Chem. Phys., 16, 7389–7409, https://doi.org/10.5194/acp-16-7389-2016, 2016.
Brock, C. A., Wagner, N. L., Anderson, B. E., Attwood, A. R., Beyersdorf, A., Campuzano-Jost, P., Carlton, A. G., Day, D. A., Diskin, G. S., Gordon, T. D., Jimenez, J. L., Lack, D. A., Liao, J., Markovic, M. Z., Middlebrook, A. M., Ng, N. L., Perring, A. E., Richardson, M. S., Schwarz, J. P., Washenfelder, R. A., Welti, A., Xu, L., Ziemba, L. D., and Murphy, D. M.: Aerosol optical properties in the southeastern United States in summer – Part 1: Hygroscopic growth, Atmos. Chem. Phys., 16, 4987–5007, https://doi.org/10.5194/acp-16-4987-2016, 2016.
Cerully, K. M., Bougiatioti, A., Hite Jr., J. R., Guo, H., Xu, L., Ng, N. L., Weber, R., and Nenes, A.: On the link between hygroscopicity, volatility, and oxidation state of ambient and water-soluble aerosols in the southeastern United States, Atmos. Chem. Phys., 15, 8679–8694, https://doi.org/10.5194/acp-15-8679-2015, 2015.
Chang, R. Y.-W., Slowik, J. G., Shantz, N. C., Vlasenko, A., Liggio, J., Sjostedt, S. J., Leaitch, W. R., and Abbatt, J. P. D.: The hygroscopicity parameter (κ) of ambient organic aerosol at a field site subject to biogenic and anthropogenic influences: relationship to degree of aerosol oxidation, Atmos. Chem. Phys., 10, 5047–5064, https://doi.org/10.5194/acp-10-5047-2010, 2010.
Chen, J., Zhao, C. S., Ma, N., and Yan, P.: Aerosol hygroscopicity parameter derived from the light scattering enhancement factor measurements in the North China Plain, Atmos. Chem. Phys., 14, 8105–8118, https://doi.org/10.5194/acp-14-8105-2014, 2014.
Chen, J., Budisulistiorini, S. H., Itoh, M., Lee, W.-C., Miyakawa, T., Komazaki, Y., Yang, L. D. Q., and Kuwata, M.: Water uptake by fresh Indonesian peat burning particles is limited by water-soluble organic matter, Atmos. Chem. Phys., 17, 11591–11604, https://doi.org/10.5194/acp-17-11591-2017, 2017.
Cheng, Y. F., Wiedensohler, A., Eichler, H., Su, H., Gnauk, T., Brueggemann, E., Herrmann, H., Heintzenberg, J., Slanina, J., Tuch, T., Hu, M., and Zhang, Y. H.: Aerosol optical properties and related chemical apportionment at Xinken in Pearl River Delta of China, Atmos. Environ., 42, 6351–6372, https://doi.org/10.1016/j.atmosenv.2008.02.034, 2008.
Deng, Y., Kagami, S., Ogawa, S., Kawana, K., Nakayama, T., Kubodera, R., Adachi, K., Hussein, T., Miyazaki, Y., and Mochida, M.: Hygroscopicity of Organic Aerosols and Their Contributions to CCN Concentrations Over a Midlatitude Forest in Japan, J. Geophys. Res.-Atmos., 123, 9703–9723, https://doi.org/10.1029/2017jd027292, 2018.
Deng, Y., Yai, H., Fujinari, H., Kawana, K., Nakayama, T., and Mochida, M.: Diurnal variation and size dependence of the hygroscopicity of organic aerosol at a forest site in Wakayama, Japan: their relationship to CCN concentrations, Atmos. Chem. Phys., 19, 5889–5903, https://doi.org/10.5194/acp-19-5889-2019, 2019.
Drinovec, L., Močnik, G., Zotter, P., Prévôt, A. S. H., Ruckstuhl, C., Coz, E., Rupakheti, M., Sciare, J., Müller, T., Wiedensohler, A., and Hansen, A. D. A.: The “dual-spot” Aethalometer: an improved measurement of aerosol black carbon with real-time loading compensation, Atmos. Meas. Tech., 8, 1965–1979, https://doi.org/10.5194/amt-8-1965-2015, 2015.
Duplissy, J., DeCarlo, P. F., Dommen, J., Alfarra, M. R., Metzger, A., Barmpadimos, I., Prevot, A. S. H., Weingartner, E., Tritscher, T., Gysel, M., Aiken, A. C., Jimenez, J. L., Canagaratna, M. R., Worsnop, D. R., Collins, D. R., Tomlinson, J., and Baltensperger, U.: Relating hygroscopicity and composition of organic aerosol particulate matter, Atmos. Chem. Phys., 11, 1155–1165, https://doi.org/10.5194/acp-11-1155-2011, 2011.
Fröhlich, R., Cubison, M. J., Slowik, J. G., Bukowiecki, N., Prévôt, A. S. H., Baltensperger, U., Schneider, J., Kimmel, J. R., Gonin, M., Rohner, U., Worsnop, D. R., and Jayne, J. T.: The ToF-ACSM: a portable aerosol chemical speciation monitor with TOFMS detection, Atmos. Meas. Tech., 6, 3225–3241, https://doi.org/10.5194/amt-6-3225-2013, 2013.
Frosch, M., Bilde, M., DeCarlo, P. F., Jurányi, Z., Tritscher, T., Dommen, J., Donahue, N. M., Gysel, M., Weingartner, E., and Baltensperger, U.: Relating cloud condensation nuclei activity and oxidation level of á-pinene secondary organic aerosols, J. Geophys. Res.-Atmos., 116, D22212, https://doi.org/10.1029/2011jd016401, 2011.
Gysel, M., Crosier, J., Topping, D. O., Whitehead, J. D., Bower, K. N., Cubison, M. J., Williams, P. I., Flynn, M. J., McFiggans, G. B., and Coe, H.: Closure study between chemical composition and hygroscopic growth of aerosol particles during TORCH2, Atmos. Chem. Phys., 7, 6131–6144, https://doi.org/10.5194/acp-7-6131-2007, 2007.
Hong, J., Kim, J., Nieminen, T., Duplissy, J., Ehn, M., Äijälä, M., Hao, L. Q., Nie, W., Sarnela, N., Prisle, N. L., Kulmala, M., Virtanen, A., Petäjä, T., and Kerminen, V.-M.: Relating the hygroscopic properties of submicron aerosol to both gas- and particle-phase chemical composition in a boreal forest environment, Atmos. Chem. Phys., 15, 11999–12009, https://doi.org/10.5194/acp-15-11999-2015, 2015.
Hong, J., Xu, H., Tan, H., Yin, C., Hao, L., Li, F., Cai, M., Deng, X., Wang, N., Su, H., Cheng, Y., Wang, L., Petäjä, T., and Kerminen, V.-M.: Mixing state and particle hygroscopicity of organic-dominated aerosols over the Pearl River Delta region in China, Atmos. Chem. Phys., 18, 14079–14094, https://doi.org/10.5194/acp-18-14079-2018, 2018.
Hu, W., Campuzano-Jost, P., Day, D. A., Croteau, P., Canagaratna, M. R., Jayne, J. T., Worsnop, D. R., and Jimenez, J. L.: Evaluation of the new capture vapourizer for aerosol mass spectrometers (AMS) through laboratory studies of inorganic species, Atmos. Meas. Tech., 10, 2897–2921, https://doi.org/10.5194/amt-10-2897-2017, 2017.
Hu, W., Day, D. A., Campuzano-Jost, P., Nault, B. A., Park, T., Lee, T., Croteau, P., Canagaratna, M. R., Jayne, J. T., Worsnop, D. R., and Jimenez, J. L.: Evaluation of the new capture vaporizer for aerosol mass spectrometers: Characterization of organic aerosol mass spectra, Aerosol Sci. Technol., 52, 725–739, https://doi.org/10.1080/02786826.2018.1454584, 2018a.
Hu, W., Day, D. A., Campuzano-Jost, P., Nault, B. A., Park, T., Lee, T., Croteau, P., Canagaratna, M. R., Jayne, J. T., Worsnop, D. R., and Jimenez, J. L.: Evaluation of the New Capture Vaporizer for Aerosol Mass Spectrometers (AMS): Elemental Composition and Source Apportionment of Organic Aerosols (OA), ACS Earth and Space Chemistry, 2, 410–421, https://doi.org/10.1021/acsearthspacechem.8b00002, 2018b.
Jimenez, J. L., Canagaratna, M. R., Donahue, N. M., Prevot, A. S. H., Zhang, Q., Kroll, J. H., DeCarlo, P. F., Allan, J. D., Coe, H., Ng, N. L., Aiken, A. C., Docherty, K. S., Ulbrich, I. M., Grieshop, A. P., Robinson, A. L., Duplissy, J., Smith, J. D., Wilson, K. R., Lanz, V. A., Hueglin, C., Sun, Y. L., Tian, J., Laaksonen, A., Raatikainen, T., Rautiainen, J., Vaattovaara, P., Ehn, M., Kulmala, M., Tomlinson, J. M., Collins, D. R., Cubison, M. J., Dunlea, J., Huffman, J. A., Onasch, T. B., Alfarra, M. R., Williams, P. I., Bower, K., Kondo, Y., Schneider, J., Drewnick, F., Borrmann, S., Weimer, S., Demerjian, K., Salcedo, D., Cottrell, L., Griffin, R., Takami, A., Miyoshi, T., Hatakeyama, S., Shimono, A., Sun, J. Y., Zhang, Y. M., Dzepina, K., Kimmel, J. R., Sueper, D., Jayne, J. T., Herndon, S. C., Trimborn, A. M., Williams, L. R., Wood, E. C., Middlebrook, A. M., Kolb, C. E., Baltensperger, U., and Worsnop, D. R.: Evolution of Organic Aerosols in the Atmosphere, Science, 326, 1525–1529, https://doi.org/10.1126/science.1180353, 2009.
Kawana, K., Nakayama, T., and Mochida, M.: Hygroscopicity and CCN activity of atmospheric aerosol particles and their relation to organics: Characteristics of urban aerosols in Nagoya, Japan, J. Geophys. Res.-Atmos., 121, 4100–4121, https://doi.org/10.1002/2015JD023213, 2016.
Koehler, K. A., Kreidenweis, S. M., DeMott, P. J., Petters, M. D., Prenni, A. J., and Carrico, C. M.: Hygroscopicity and cloud droplet activation of mineral dust aerosol, Geophys. Res. Lett., 36, L08805, https://doi.org/10.1029/2009GL037348, 2009.
Kuang, Y., Zhao, C., Tao, J., Bian, Y., Ma, N., and Zhao, G.: A novel method for deriving the aerosol hygroscopicity parameter based only on measurements from a humidified nephelometer system, Atmos. Chem. Phys., 17, 6651–6662, https://doi.org/10.5194/acp-17-6651-2017, 2017.
Kuang, Y., Zhao, C. S., Zhao, G., Tao, J. C., Xu, W., Ma, N., and Bian, Y. X.: A novel method for calculating ambient aerosol liquid water content based on measurements of a humidified nephelometer system, Atmos. Meas. Tech., 11, 2967–2982, https://doi.org/10.5194/amt-11-2967-2018, 2018.
Lambe, A. T., Onasch, T. B., Massoli, P., Croasdale, D. R., Wright, J. P., Ahern, A. T., Williams, L. R., Worsnop, D. R., Brune, W. H., and Davidovits, P.: Laboratory studies of the chemical composition and cloud condensation nuclei (CCN) activity of secondary organic aerosol (SOA) and oxidized primary organic aerosol (OPOA), Atmos. Chem. Phys., 11, 8913–8928, https://doi.org/10.5194/acp-11-8913-2011, 2011.
Li, X., Song, S., Zhou, W., Hao, J., Worsnop, D. R., and Jiang, J.: Interactions between aerosol organic components and liquid water content during haze episodes in Beijing, Atmos. Chem. Phys., 19, 12163–12174, https://doi.org/10.5194/acp-19-12163-2019, 2019.
Liu, H. J., Zhao, C. S., Nekat, B., Ma, N., Wiedensohler, A., van Pinxteren, D., Spindler, G., Müller, K., and Herrmann, H.: Aerosol hygroscopicity derived from size-segregated chemical composition and its parameterization in the North China Plain, Atmos. Chem. Phys., 14, 2525–2539, https://doi.org/10.5194/acp-14-2525-2014, 2014.
Liu, X. and Wang, J.: How important is organic aerosol hygroscopicity to aerosol indirect forcing?, Environ. Res. Lett., 5, 044010, https://doi.org/10.1088/1748-9326/5/4/044010, 2010.
Ma, N., Zhao, C. S., Nowak, A., Müller, T., Pfeifer, S., Cheng, Y. F., Deng, Z. Z., Liu, P. F., Xu, W. Y., Ran, L., Yan, P., Göbel, T., Hallbauer, E., Mildenberger, K., Henning, S., Yu, J., Chen, L. L., Zhou, X. J., Stratmann, F., and Wiedensohler, A.: Aerosol optical properties in the North China Plain during HaChi campaign: an in-situ optical closure study, Atmos. Chem. Phys., 11, 5959–5973, https://doi.org/10.5194/acp-11-5959-2011, 2011.
Massoli, P., Lambe, A. T., Ahern, A. T., Williams, L. R., Ehn, M., Mikkilä, J., Canagaratna, M. R., Brune, W. H., Onasch, T. B., Jayne, J. T., Petäjä, T., Kulmala, M., Laaksonen, A., Kolb, C. E., Davidovits, P., and Worsnop, D. R.: Relationship between aerosol oxidation level and hygroscopic properties of laboratory generated secondary organic aerosol (SOA) particles, Geophys. Res. Lett., 37, L24801, https://doi.org/10.1029/2010gl045258, 2010.
Mei, F., Hayes, P. L., Ortega, A., Taylor, J. W., Allan, J. D., Gilman, J., Kuster, W., de Gouw, J., Jimenez, J. L., and Wang, J.: Droplet activation properties of organic aerosols observed at an urban site during CalNex-LA, J. Geophys. Res.-Atmos., 118, 2903–2917, https://doi.org/10.1002/jgrd.50285, 2013a.
Mei, F., Setyan, A., Zhang, Q., and Wang, J.: CCN activity of organic aerosols observed downwind of urban emissions during CARES, Atmos. Chem. Phys., 13, 12155–12169, https://doi.org/10.5194/acp-13-12155-2013, 2013b.
Paatero, P. and Tapper, U.: Positive matrix factorization: A non-negative factor model with optimal utilization of error estimates of data values, Environmetrics, 5, 111–126, https://doi.org/10.1002/env.3170050203, 1994.
Petters, M. D. and Kreidenweis, S. M.: A single parameter representation of hygroscopic growth and cloud condensation nucleus activity, Atmos. Chem. Phys., 7, 1961–1971, https://doi.org/10.5194/acp-7-1961-2007, 2007.
Quinn, P. K., Coffman, D. J., Bates, T. S., Miller, T. L., Johnson, J. E., Welton, E. J., Neusüss, C., Miller, M., and Sheridan, P. J.: Aerosol optical properties during INDOEX 1999: Means, variability, and controlling factors, J. Geophys. Res.-Atmos., 107, 19–25, https://doi.org/10.1029/2000jd000037, 2002.
Rastak, N., Pajunoja, A., Acosta Navarro, J. C., Ma, J., Song, M., Partridge, D. G., Kirkevåg, A., Leong, Y., Hu, W. W., Taylor, N. F., Lambe, A., Cerully, K., Bougiatioti, A., Liu, P., Krejci, R., Petäjä, T., Percival, C., Davidovits, P., Worsnop, D. R., Ekman, A. M. L., Nenes, A., Martin, S., Jimenez, J. L., Collins, D. R., Topping, D. O., Bertram, A. K., Zuend, A., Virtanen, A., and Riipinen, I.: Microphysical explanation of the RH-dependent water affinity of biogenic organic aerosol and its importance for climate, Geophys. Res. Lett., 44, 5167–5177, https://doi.org/10.1002/2017gl073056, 2017.
Rose, D., Nowak, A., Achtert, P., Wiedensohler, A., Hu, M., Shao, M., Zhang, Y., Andreae, M. O., and Pöschl, U.: Cloud condensation nuclei in polluted air and biomass burning smoke near the mega-city Guangzhou, China – Part 1: Size-resolved measurements and implications for the modeling of aerosol particle hygroscopicity and CCN activity, Atmos. Chem. Phys., 10, 3365–3383, https://doi.org/10.5194/acp-10-3365-2010, 2010.
Shao, L., Li, W., Yang, S., Shi, Z., and Lü, S.: Mineralogical characteristics of airborne particles collected in Beijing during a severe Asian dust storm period in spring 2002, Sci. China Ser. D, 50, 953–959, 2007.
Sherman, J. P., Sheridan, P. J., Ogren, J. A., Andrews, E., Hageman, D., Schmeisser, L., Jefferson, A., and Sharma, S.: A multi-year study of lower tropospheric aerosol variability and systematic relationships from four North American regions, Atmos. Chem. Phys., 15, 12487–12517, https://doi.org/10.5194/acp-15-12487-2015, 2015.
Thalman, R., de Sá, S. S., Palm, B. B., Barbosa, H. M. J., Pöhlker, M. L., Alexander, M. L., Brito, J., Carbone, S., Castillo, P., Day, D. A., Kuang, C., Manzi, A., Ng, N. L., Sedlacek III, A. J., Souza, R., Springston, S., Watson, T., Pöhlker, C., Pöschl, U., Andreae, M. O., Artaxo, P., Jimenez, J. L., Martin, S. T., and Wang, J.: CCN activity and organic hygroscopicity of aerosols downwind of an urban region in central Amazonia: seasonal and diel variations and impact of anthropogenic emissions, Atmos. Chem. Phys., 17, 11779–11801, https://doi.org/10.5194/acp-17-11779-2017, 2017.
Titos, G., Cazorla, A., Zieger, P., Andrews, E., Lyamani, H., Granados-Muñoz, M. J., Olmo, F. J., and Alados-Arboledas, L.: Effect of hygroscopic growth on the aerosol light-scattering coefficient: A review of measurements, techniques and error sources, Atmos. Environ., 141, 494–507, https://doi.org/10.1016/j.atmosenv.2016.07.021, 2016.
Ulbrich, I. M., Canagaratna, M. R., Zhang, Q., Worsnop, D. R., and Jimenez, J. L.: Interpretation of organic components from Positive Matrix Factorization of aerosol mass spectrometric data, Atmos. Chem. Phys., 9, 2891–2918, https://doi.org/10.5194/acp-9-2891-2009, 2009.
Wiedensohler, A., Birmili, W., Nowak, A., Sonntag, A., Weinhold, K., Merkel, M., Wehner, B., Tuch, T., Pfeifer, S., Fiebig, M., Fjäraa, A. M., Asmi, E., Sellegri, K., Depuy, R., Venzac, H., Villani, P., Laj, P., Aalto, P., Ogren, J. A., Swietlicki, E., Williams, P., Roldin, P., Quincey, P., Hüglin, C., Fierz-Schmidhauser, R., Gysel, M., Weingartner, E., Riccobono, F., Santos, S., Grüning, C., Faloon, K., Beddows, D., Harrison, R., Monahan, C., Jennings, S. G., O'Dowd, C. D., Marinoni, A., Horn, H.-G., Keck, L., Jiang, J., Scheckman, J., McMurry, P. H., Deng, Z., Zhao, C. S., Moerman, M., Henzing, B., de Leeuw, G., Löschau, G., and Bastian, S.: Mobility particle size spectrometers: harmonization of technical standards and data structure to facilitate high quality long-term observations of atmospheric particle number size distributions, Atmos. Meas. Tech., 5, 657–685, https://doi.org/10.5194/amt-5-657-2012, 2012.
Williams, B. J., Goldstein, A. H., Kreisberg, N. M., Hering, S. V., Worsnop, D. R., Ulbrich, I. M., Docherty, K. S., and Jimenez, J. L.: Major components of atmospheric organic aerosol in southern California as determined by hourly measurements of source marker compounds, Atmos. Chem. Phys., 10, 11577–11603, https://doi.org/10.5194/acp-10-11577-2010, 2010.
Wu, Z. J., Poulain, L., Henning, S., Dieckmann, K., Birmili, W., Merkel, M., van Pinxteren, D., Spindler, G., Müller, K., Stratmann, F., Herrmann, H., and Wiedensohler, A.: Relating particle hygroscopicity and CCN activity to chemical composition during the HCCT-2010 field campaign, Atmos. Chem. Phys., 13, 7983–7996, https://doi.org/10.5194/acp-13-7983-2013, 2013.
Wu, Z. J., Zheng, J., Shang, D. J., Du, Z. F., Wu, Y. S., Zeng, L. M., Wiedensohler, A., and Hu, M.: Particle hygroscopicity and its link to chemical composition in the urban atmosphere of Beijing, China, during summertime, Atmos. Chem. Phys., 16, 1123–1138, https://doi.org/10.5194/acp-16-1123-2016, 2016.
Xu, W., Croteau, P., Williams, L., Canagaratna, M., Onasch, T., Cross, E., Zhang, X., Robinson, W., Worsnop, D., and Jayne, J.: Laboratory characterization of an aerosol chemical speciation monitor with PM2.5 measurement capability, Aerosol Sci. Tech., 51, 69–83, https://doi.org/10.1080/02786826.2016.1241859, 2017.
Zhang, F., Li, Y., Li, Z., Sun, L., Li, R., Zhao, C., Wang, P., Sun, Y., Liu, X., Li, J., Li, P., Ren, G., and Fan, T.: Aerosol hygroscopicity and cloud condensation nuclei activity during the AC3Exp campaign: implications for cloud condensation nuclei parameterization, Atmos. Chem. Phys., 14, 13423–13437, https://doi.org/10.5194/acp-14-13423-2014, 2014.
Zhang, Q., Jimenez, J. L., Canagaratna, M. R., Ulbrich, I. M., Ng, N. L., Worsnop, D. R., and Sun, Y.: Understanding atmospheric organic aerosols via factor analysis of aerosol mass spectrometry: a review, Anal. Bioanal. Chem., 401, 3045–3067, https://doi.org/10.1007/s00216-011-5355-y, 2011.