the Creative Commons Attribution 4.0 License.
the Creative Commons Attribution 4.0 License.
 | 22 Jul 2020
Airborne in situ measurements of aerosol size distributions and black carbon across the Indo-Gangetic Plain during SWAAMI–RAWEX
Mukunda Madhab Gogoi
Venugopalan Nair Jayachandran
Aditya Vaishya
Surendran Nair Suresh Babu
Sreedharan Krishnakumari Satheesh
Krishnaswamy Krishna Moorthy
During the combined South-West Asian Aerosol–Monsoon Interactions and Regional Aerosol Warming Experiment (SWAAMI–RAWEX), collocated airborne measurements of aerosol number–size distributions in the size (diameter) regime 0.5 to 20 µm and black carbon (BC) mass concentrations were made across the Indo-Gangetic Plain (IGP), for the first time, from three distinct locations, just prior to the onset of the Indian summer monsoon. These measurements provided an east–west transect of region-specific properties of aerosols as the environment transformed from mostly arid conditions of the western IGP (represented by Jodhpur, JDR) having dominance of natural aerosols to the central IGP (represented by Varanasi, VNS) having very high anthropogenic emissions, to the eastern IGP (represented by the coastal station Bhubaneswar, BBR) characterized by a mixture of the IGP outflow and marine aerosols. Despite these, the aerosol size distribution revealed an increase in coarse mode concentration and coarse mode mass fraction (fractional contribution to the total aerosol mass) with the increase in altitude across the entire IGP, especially above the well-mixed region. Consequently, both the mode radii and geometric mean radii of the size distributions showed an increase with altitude. However, near the surface and within the atmospheric boundary layer (ABL), the features were specific to the different subregions, with the highest coarse mode mass fraction (FMC∼72 %) in the western IGP and highest accumulation fraction in the central IGP with the eastern IGP in between. The elevated coarse mode fraction is attributed to mineral dust load arising from local production as well as due to advection from the west. This was further corroborated by data from the Cloud-Aerosol Transport System (CATS) on board the International Space Station (ISS), which also revealed that the vertical extent of dust aerosols reached as high as 5 km during this period. Mass concentrations of BC were moderate (∼1 µg m−3) with very little altitude variation up to 3.5 km, except over VNS where very high concentrations were seen near the surface and within the ABL. The BC-induced atmospheric heating rate was highest near the surface at VNS (∼0.81 K d−1), while showing an increasing pattern with altitude at BBR (∼0.35 K d−1 at the ceiling altitude).
- Article
(10291 KB) -
Supplement
(637 KB) - BibTeX
- EndNote


The Indo-Gangetic Plain (IGP) remains one of the global hot spots of aerosols. The prevailing high aerosol loading and the relative abundance of its constituents (being a mixture of natural and anthropogenic species) are known to show significant seasonality (Gautam et al., 2011; Praveen et al., 2012; Moorthy et al., 2016; Vaishya et al., 2018; Rana et al., 2019; Brooks et al., 2019). This arises due to combined effects of the dense population and the associated anthropogenic and industrial activities, as well as the loose alluvial soil of this region having vast semiarid and arid characteristics to the west. A dense network of thermal power plants, several of them being coal fired, is among the prominent sources of anthropogenic emissions over the region. This is abetted by the synoptic meteorology with its strong seasonality (Gautam et al., 2010; Nath et al., 2018; Singh et al., 2019) and the orography that slopes down from the west to east bound on the north and south respectively by the Himalayas and the Aravalli ranges and Bihar Plateau forming a confined channel (Moorthy et al., 2007; Gogoi et al., 2017). For accurate quantification of the radiative implications of this complex aerosol system, several concerted studies have been made using ground-based (Giles et al., 2012; Bansal et al., 2019) and space-borne measurements (Srivastava, 2016; Mhawish et al., 2017; Kumar et al., 2018) as well as numerical modeling (Govardhan et al., 2019). However, most of these studies have uncertainties arising out of the ill-represented altitude variation in aerosol properties due to sparse measurements. Height-resolved in situ measurements of aerosol properties are indispensable not only in this regard but also for understanding aerosol–cloud interactions.
In recent years, a few campaign-mode airborne measurements have been made over this region to estimate the altitude-resolved properties of aerosols that are important in aerosol–radiation interactions (Padmakumari et al., 2013; Babu et al., 2016; Nair et al., 2016; Vaishya et al., 2018; Gogoi et al., 2019). These include the measurements of aerosol scattering and absorption coefficients conducted as part of the Regional Aerosol Warming Experiment (RAWEX; Babu et al., 2016) to delineate the spatiotemporal variability in the altitude distribution of aerosol single-scattering albedo (SSA) across the IGP during winter and pre-monsoon seasons and aerosol and cloud parameter measurements conducted as part of the Cloud Aerosol Interaction and Precipitation Enhancement Experiment (CAIPEEX; Kulkarni et al., 2012). Some studies have reported significant contribution of dust and black carbon (BC) to the elevated aerosol load (Praveen et al., 2012; Kedia et al., 2014; Pandey et al., 2017; Li et al., 2016) and their potential role to act as ice nuclei (IN; Padmakumari et al., 2013). However, despite its importance in radiative interactions and cloud condensation nuclei (CCN) activation, the altitude-resolved measurements of aerosol size distribution are extremely sparse, or nonexistent, especially just prior to the onset of the Indian summer monsoon, when the sources of aerosols, their mixing and transport pathways are all complex. The information on aerosol size distribution is important for accurately describing the phase function, which describes the angular variation in the scattered intensity. The knowledge of its vertical variation would thus improve the accuracy of aerosol radiative forcing estimation and hence heating rates. Such information is virtually nonexistent over this region. Further, the knowledge of the variation in size distribution with altitude would be useful in better understanding the aerosol–cloud interactions and CCN characteristics during the evolving and active phases of the Indian monsoon. This was part of the important information sought under SWAAMI–RAWEX (https://gtr.ukri.org/projects?ref=NE/L013886/1, last access: 9 July 2020 and http://spl.gov.in/SPL/index.php/arfs-research/field-campaigns/asfasf, last access: 9 July 2020) – a joint India–UK field experiment involving airborne measurements using Indian and UK aircrafts during different phases of the Indian monsoon, starting from just prior to the onset of monsoon (i.e., in the beginning of June).
During this campaign, vertical profiles of various aerosol parameters have been measured using an instrumented aircraft from three base stations – representing the western, central and eastern end of the IGP – from 1 to 20 June 2016. Some important results on the optical and CCN characteristics are already reported (Vaishya et al., 2018; Jayachandran et al., 2020). In the present study, we have examined the vertical profiles of aerosol number–size distributions in the size (diameter) regime 0.5 to 20 µm and black carbon (BC) mass concentrations. The results are presented and discussed in light of other supporting information.
2.1 Study region and flight details
The base stations (Fig. 1), from where the aircraft operations were carried out, represented distinct regions of the IGP. Jodhpur (JDR; 26.25∘ N, 73.04∘ E) in the western IGP is an arid/semiarid region with low urban activities, lying downwind of the Great Indian Desert to its west (JDR has a population density of 161 km−2). Varanasi (VNS; 25.44∘ N, 82.85∘ E) in the central IGP is located downwind of Jodhpur, characterized by extensive anthropogenic activities (automobiles, small and large-scale industries and thermal power plants, and widespread agricultural activities) by its dense population (density 2399 km−2). Bhubaneswar (BBR; 20.25∘ N, 85.81∘ E) is an urban location in the eastern IGP (population density of 2131 km−2) and experiences the influence of the marine aerosol component from the Bay of Bengal (∼50 km away from the base station) in addition to the influence of IGP outflow and local aerosol sources from nearby thermal (coal-based) power plants, mining and fertilizer-based industries, etc. (Panda and Das, 2016). The northwestern part of India has an undulating topography, due to which monsoon currents lose moisture while crossing the western mountain ranges (Aravalli) and resulting in dry arid regions (Moorthy et al., 2007). Strong dust-raising winds are a common feature of the IGP in general and its western parts in particular from April to July (Banerjee et al., 2019). In the central IGP, VNS and its environs hold largely even topography, where the Ganges is the principal river. In the eastern IGP, BBR is topographically made up of western uplands and eastern lowlands, with hillocks in the western and northern parts. These base stations thus provided a west–east cross section of the highly aerosol-laden IGP, where the aerosol characteristics are known to change longitudinally. The spatial map of aerosol optical depth (AOD) at 550 nm (Fig. 1) clearly shows the existence of higher aerosol loading (AOD >0.5) over the observational site during the study period.
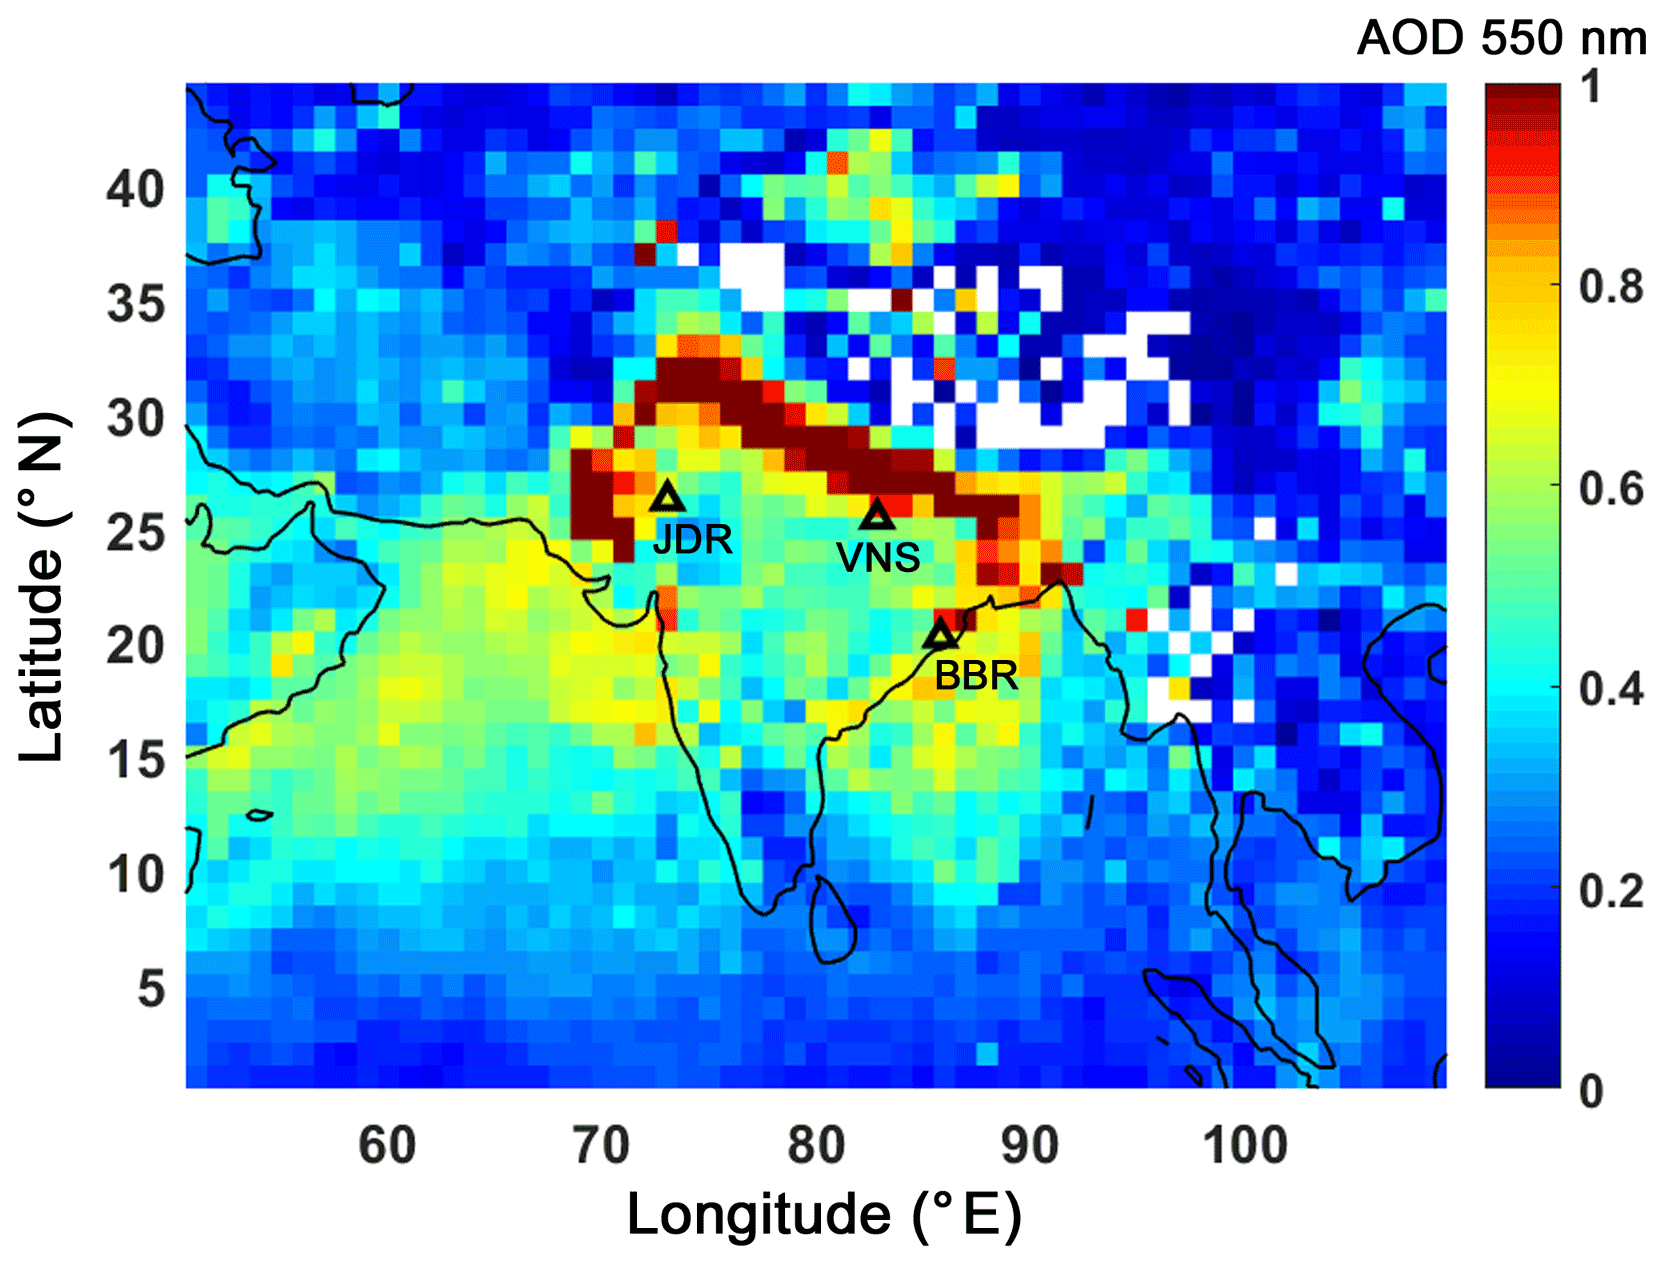
Figure 1Three distinct base stations: (i) Jodhpur (JDR; 26.25∘ N, 73.04∘ E) in the western IGP, (ii) Varanasi (VNS; 25.44∘ N, 82.85∘ E) in the central IGP and (iii) Bhubaneswar (BBR; 20.25∘ N, 85.81∘ E) in the eastern coastal IGP, from where the aircraft measurements were conducted. The spatial map of AOD at 550 nm obtained from the MODIS sensor (MOD08_D3_6.1, Dark Target and Deep Blue combined mean) on board the Terra satellite during the study period (1–20 June 2016) is shown in the background.

Figure 2(a) The onset (actual) of the SW monsoon at different parts of India, shown by the yellow and pink (solid) lines. The horizontal and vertical flight paths during each of the flights at (b) Bhubaneswar (BBR), (c) Varanasi (VNS) and (d) Jodhpur (JDR).
Figure 2a shows the actual dates of onset of the monsoon at different parts of India in 2016. As can be seen from the figure, despite a delayed onset at the southern tip of India, the monsoon advanced fast into the central/northern parts of India. Yet, all the flights from the respective base stations were completed ahead of the start of the monsoon to that station. At the eastern IGP, the aircraft flights were made from BBR before the onset of monsoon over India; at VNS, the flights were conducted while monsoon advanced only to the central peninsula. The final set of flights was conducted at JDR when the monsoon covered most of the central and eastern part of India, but had yet to progress towards the northwestern parts.
From each of the base stations, four to five flights were carried out on successive days in different horizontal directions about the station, as shown by the ground projections (horizontal lines in Fig. 2a), with a view to obtain an average subregional representation in the shortest time possible. During each of the flights, measurements were made at six discrete levels following a staircase configuration as shown in Fig. 2 (for BBR, VNS and JDR, respectively). Accordingly, the aircraft initially climbed to the base/ceiling altitude, stabilized and made a horizontal flight along the projected track for about 30 min before climbing up (descending down) to the next higher (lower) levels and stabilizing. This procedure was repeated for all levels (∼0.5, 1, 1.5, 2, 2.5 and 3 km a.g.l.). The ceiling altitude was restricted to 3.5 km based on the unpressurized mode of operation of the aircraft. All the flights were carried out around midday since thorough vertical mixing is established by the daytime convective boundary layer eddies.
2.2 Onboard instrumentation
The measurements were carried out aboard the instrumented aircraft (Beechcraft 200) fitted with an iso-kinetic inlet, mounted (front facing) at the bottom of the fuselage for aspirating ambient aerosols as detailed in earlier papers (Babu et al., 2016; Vaishya et al., 2018; Gogoi et al., 2019). A constant volumetric flow of 70 L min−1 was maintained using an external pump connected to the main inlet assembly, which provided iso-kinetic flow for the average speed of 300 km h−1 maintained by the aircraft during the entire campaign. The efficiency of this inlet system has already been proven in several previous campaigns (Babu et al., 2016; Nair et al., 2016; Gogoi et al., 2019).
2.2.1 Measurement of aerosol size distribution
A factory-calibrated, aerodynamic particle sizer (APS) spectrometer (TSI, model 3321) is used for the measurement of aerosol size distribution. It measures size-resolved number concentration of the ambient aerosols in the size range from 0.5 to 20 µm, over 52 channels spaced equally in logarithmic size bins, at a sampling frequency of 1 min. Aerosol particles in this size range are most important in influencing the optical (scattering and extinction) and CCN and IN characteristics.
The APS measures the concentration of particles in terms of their aerodynamic diameters by comparing the velocity of a particle (controlled by an accelerating flow field) to that of a unit density sphere having the same velocity. Particle velocity is estimated from the measurement of time of flight (Mitchell and Nagel, 1999). In the present study a sheath flow at 4 L min−1 (liters per minute) was maintained against the sample flow of 1 L min−1. The instrument automatically adjusts the flow rates with changes in ambient pressure to maintain the specified flow rates. Occasionally, when the aircraft passed through clouds, the aerosol number concentration shot up from the otherwise stable values. Such outliers are removed following 2σ criteria, wherein data points at a particular level lying outside 2σ values of the level average were removed. Such screened-out points were <3 % of the total. The consistency in the flow was periodically checked each time, before start of measurements from the new base station. Similarly, the optical components and tubing of the system were cleaned immediately after moving to a new base station.
The TSI APS (3321) is suitable for operating at 10 % to 90 % RH (non-condensing) and 10–40 ∘C ambient temperature. For BBR, it is likely that aerosols grew under high-RH conditions but might have also shrunk due to higher instrument temperature compared to ambient conditions. However, more controlled laboratory experiments are required to ascertain the response of the APS to hygroscopic growth of particles.
2.2.2 Measurement of black carbon aerosols
Mass concentration of ambient BC aerosols was estimated using a seven-channel aethalometer (model AE33, Magee Scientific, USA), which measures the attenuation of light that passes through the aerosol-laden filter at wavelengths of 370, 470, 520, 590, 660, 880 and 950 nm. The loading (or shadowing) effect arising out of the successive deposition of aerosols in the filter media is automatically compensated for in real time in the new-generation Aethalometer, while the multiple scattering effects were minimized by using advanced filter tape material (Drinovec et al.,2015). In the present study, BC mass concentrations were obtained at 1 min intervals by operating the Aethalometer at 50 % of the maximum attenuation and a standard mass flow rate of 2 L min−1 under standard temperature (TO, 293 K) and pressure (PO, 1013 hPa). As the unpressurized aircraft climbed higher, the instrument experienced ambient pressure (P) and temperature (T). In order to maintain the set mass flow, the pumping speed of the instrument was automatically increased (through an internal program) to aspire more volume of air. However, the volume of air aspirated at ambient pressure and temperature must be corrected to standard atmospheric conditions for the actual estimate of BC (Moorthy et al., 2004). Thus, the actual volume of air aspirated by the Aethalometer at different atmospheric levels is
Thus, true BC mass concentration (MBC) is
Here, is the instrument-measured raw mass concentration of BC at ambient pressure and temperature. Details of the aethalometer principle, operation, uncertainty involved and error budget are reported in earlier literature (Weingartner et al., 2003; Arnott et al., 2005; Gogoi et al., 2017). In general, the instrumental uncertainty ranges from 50 % at 0.05 µg m−3 to 6 % at 1 µg m−3 (Corrigan et al., 2006), and the uncertainty in the estimation of absorption coefficients is around 10 % (Vaishya et al., 2018).
2.3 General synoptic meteorology during the campaign
The meteorological conditions across the IGP during the campaign period were generally hot (surface temperature, ∘C at JDR, 39±1.9 ∘C at VNS and 32.8±3.6 ∘C at BBR at the time of flight takeoff), with low to moderate relative humidity (RH) at JDR (RH ∼40 %) and VNS (RH ∼60 %). The value of RH at BBR was relatively higher (as high as 80 %) associated with its coastal proximity, in addition to the influence of mild pre-monsoon rainfall during the first (1 June 2016; light rain during noon), third (3 June 2016; heavy rain ∼60 mm in the night) and fourth (4 June 2016; light rain in the morning and during noon) days of observations. The records of T and RH were obtained from the sensors on board the aircraft, while the rainfall data were obtained from the airport meteorological department at BBR.
2.4 Supporting data
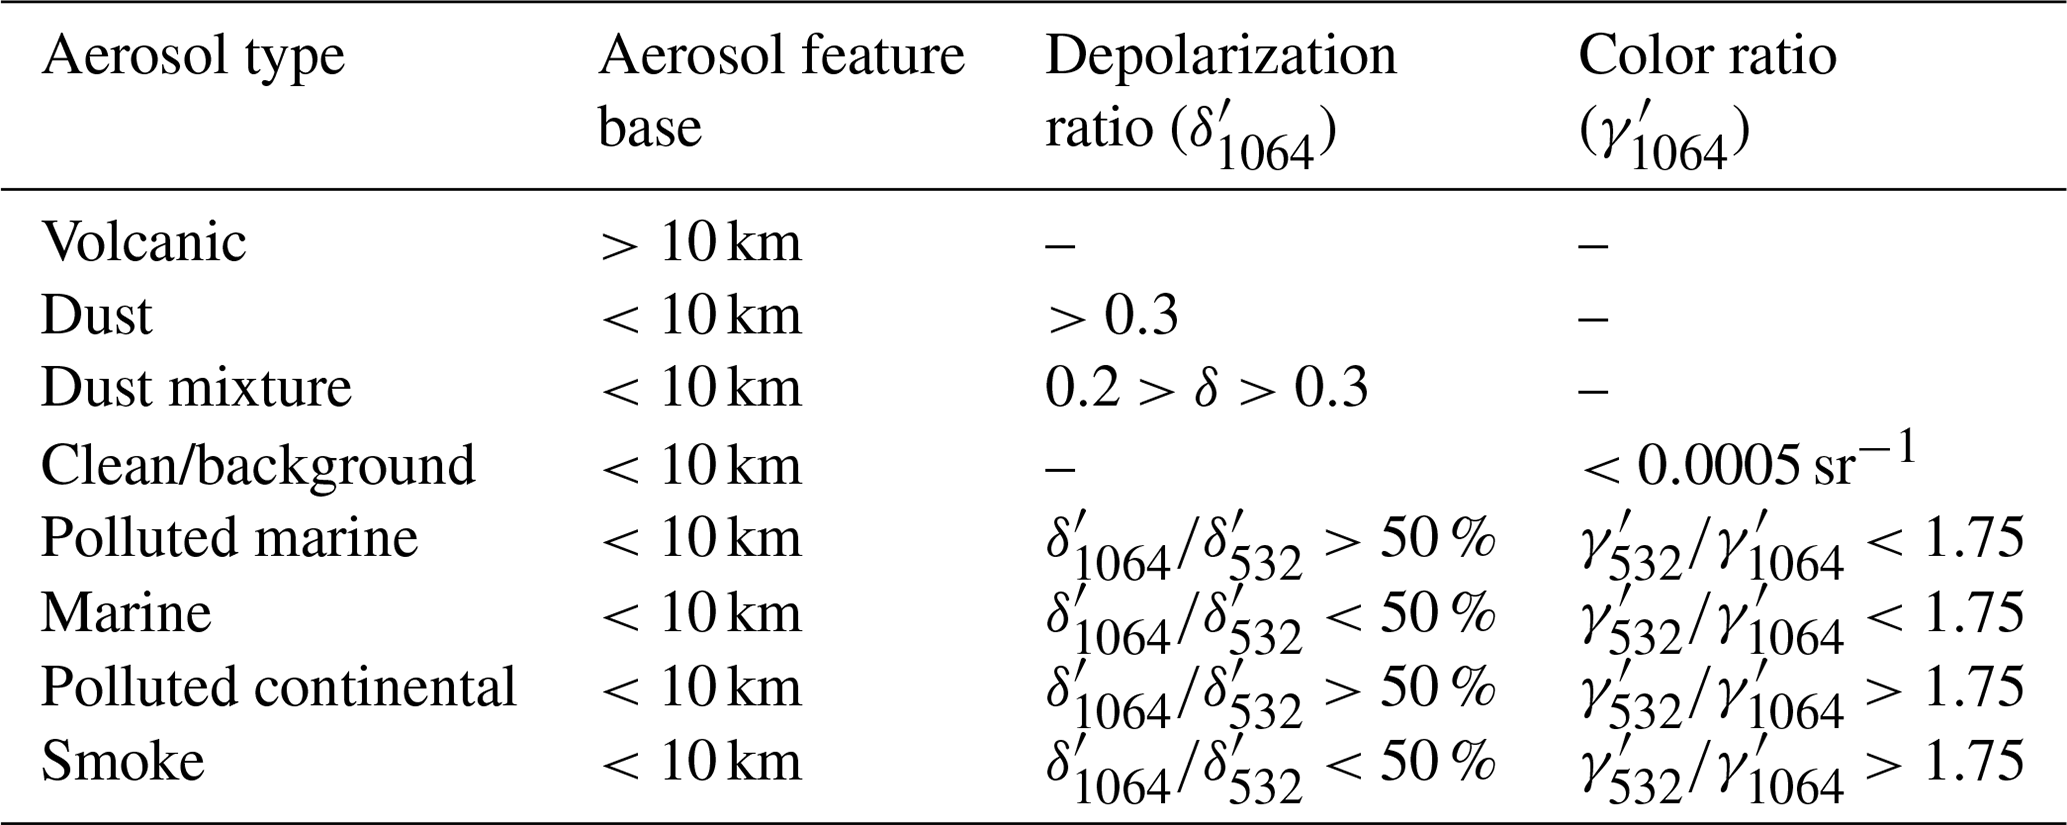
Supporting data used in this study include aerosol backscattering coefficients and depolarization ratio measured by the Cloud-Aerosol Transport System (CATS) aboard the International Space Station (ISS). The CATS is comprised of an elastic backscatter lidar consisting of two high-repetition-rate (4–5 kHz), low-energy (1–2 mJ) Nd:YVO4 lasers operating at three wavelengths (1064, 532 and 355 nm). The receiver subsystem consists of a 60 cm telescope having a 110 µrad field of view, photon-counting detectors and associated control electronics (Yorks et al., 2014, 2016). As the altitude of ISS orbit is about 405 km (51∘ inclination), CATS provides a comprehensive coverage of the tropics and midlatitudes, with nearly a 3 d repeat cycle. Level 2 data of CATS (https://cats.gsfc.nasa.gov/data/, last access: 9 July 2020) are used (Lee et al., 2019) in the present study, which provide the geophysical parameters, such as the vertical feature mask, profiles of cloud and aerosol properties (i.e., extinction, particle backscatter), and layer-integrated parameters (i.e., lidar ratio, optical depth). In addition, types of aerosols are also derived based on CATS aerosol typing algorithms where eight aerosol types (in CATS mode 7.1) are identified: volcanic, dust, dust mixture, clean/background, polluted marine, marine, polluted continental and smoke. Incorporating the information of backscatter color ratio (1064∕532 nm) and spectral depolarization (ratio of perpendicular to parallel backscatter) ratio (1064∕532 nm), CATS operating mode 7.1 provides the characteristics of aerosol regimes (Yorks et al., 2016) as given in Table 1.
Table 1Classification of aerosol types for CATS operating mode 7.1 (Yorks et al., 2016).
3.1 Aerosol number size distributions
Aerosol number size distributions [d(N)∕d(log Dp)], representative of each of the three subregions of IGP are presented in Fig. 3; the panels from left to right represent the subregions JDR, VNS and BBR, from the west to east IGP. Three distributions are shown for each station, representative of (i) near the surface with proximity to emission sources (600 m a.g.l.), (ii) in the upper atmospheric boundary layer (ABL, 2000 m a.g.l.) and (iii) in the free troposphere (3100 m a.g.l.) following the mean ABL heights (1.3±0.5, 2.3±0.5 and 1.4±0.2 km for JDR, VNS and BBR respectively; Vaishya et al., 2018) at local noon time. Aerosol number concentrations below 0.542 µm are not size-classified and represented as a single count (between 0.3 and 0.542 µm); they are shown as a function of altitude in Fig. 4a. The figures clearly reveal that at all altitudes above different stations, the size distributions are consistently bimodal, with a prominent accumulation mode (<1 µm) and a weaker secondary mode (>1 µm). The concentration of particles in the unclassified size regime (below 0.542 µm) showed a gradual decrease with increase in altitude at all stations and a spatial distinctiveness with the highest near-surface concentration in the central IGP (most anthropogenically impacted subregion of the IGP) depicting sharper altitude variation compared with the other two subregions.

Figure 3Aerosol number size distributions (mean profiles averaged for all the days) at three distinct altitudes of JDR, VNS and BBR, representative of (i) near the surface (600 m a.g.l.) having proximity to emission sources, (ii) the upper ABL (2000 m a.g.l.) and (iii) the free troposphere (3100 m). Vertical bars over the points are the ensemble standard deviations. Individual size distributions at different heights of ∼500 m intervals are given in Fig. S1 in the Supplement.
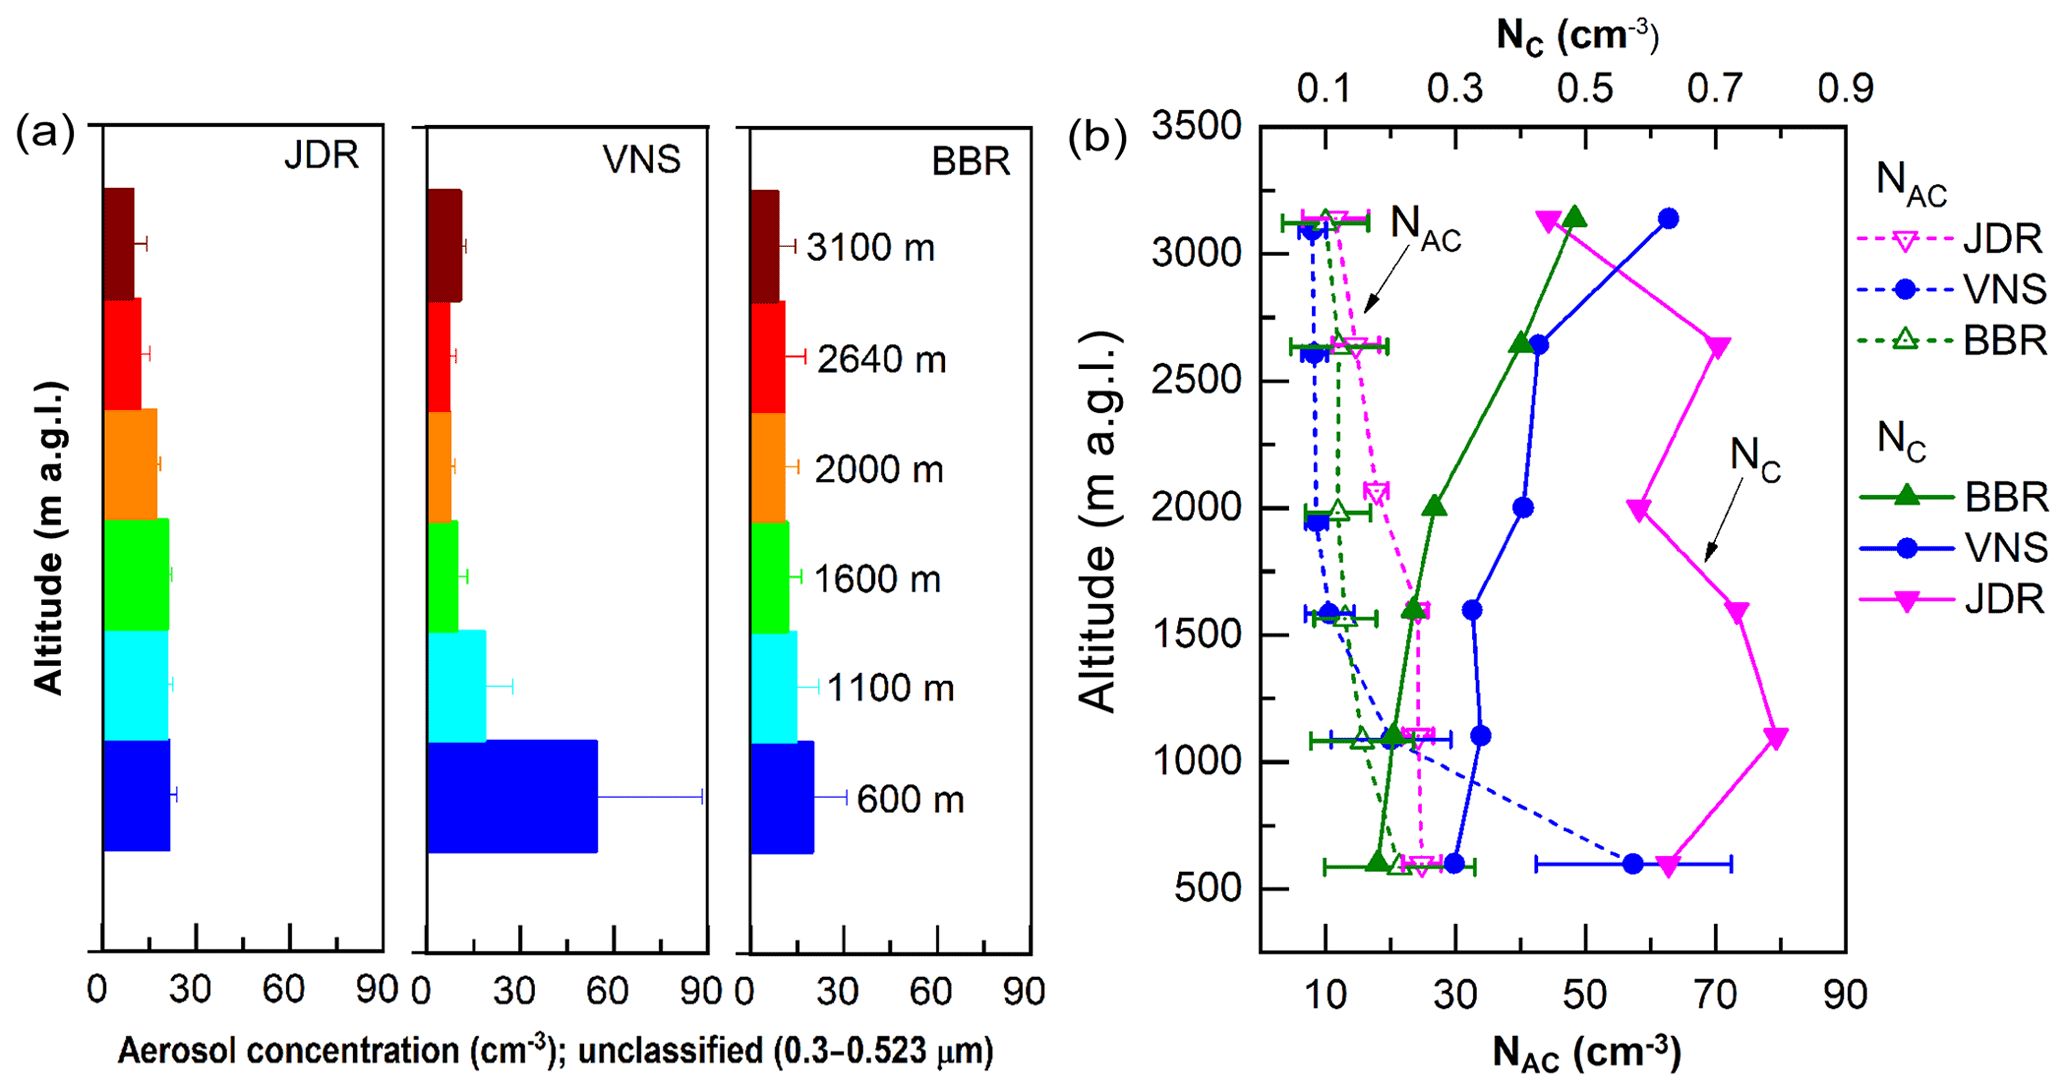
Figure 4Vertical profiles of aerosol number concentrations in the (a) unclassified size range of APS (between 0.3 and 0.523 µm); (b) accumulation (NAC<1 µm) and coarse (NC>1 µm) mode size range.
As is well-established that during the pre-monsoon and prior to the onset of the monsoon, both the natural and anthropogenic aerosol species coexist in large abundance over the IGP. We examined in Fig. 4b, the altitude profiles of accumulation mode aerosols (NAC, concentration below 1 µm), which are mostly attributed to anthropogenic origin and coarse mode aerosols (above 1 µm), which are mostly of natural origin. NAC showed only weak altitudinal dependence above 1 km at all the subregions; though at VNS, there was a sharp increase in the concentration below 1 km, obviously due to source proximity. This feature is seen in Fig. 4a also. This observation is supported by the collocated measurements of aerosol total number concentrations (NT) as measured by a condensation nuclei (CN) counter aboard the aircraft (Jayachandran et al., 2020) in the size range above 2.5 nm, showing the highest values of NT in the entire altitude range of measurements over VNS. On the other hand, the vertical profiles of coarse mode aerosol concentrations (NC) showed significantly large abundance over the western IGP (arid/semiarid regions) represented by JDR, similar to the springtime observations reported by Gogoi et al. (2019).
These observations are also in line with the reported values of dust fractions (Vaishya et al., 2018) during the same campaign, showing the enhancement of dust fraction from 10 % to 20 % at 300 m to more than 90 % above 2 km altitude at JDR, while the smallest dust faction (<10 %) was observed at BBR in the entire altitude range. Over the central IGP, synoptic wind-driven desert dust aerosols lead to elevated layers of aerosols having a higher dust fraction (>50 %). However, it should be noted that dust over the central IGP is more absorbing in nature because of its mixing with other anthropogenic emissions (such as BC; Vaishya et al., 2018), while that over western IGP is rather pristine in nature. Thus, quantification of the absolute magnitude of coarse mode aerosol concentrations is very important to understand the significance of elevated aerosol load on radiative perturbations. The increasing concentration of coarse mode particles with the increase in altitude across the entire IGP is another interesting feature in the present study, which is most conspicuous at the central IGP and least at the west, implying their increasing role at higher altitude, probably due to the lofted regional dust and advected mineral dust from west Asian regions.
With the goal of quantifying this, the size distribution spectra are averaged for each altitude level and for each station. From these spectra, the geometrical mean diameter (Dg) is estimated as a function of altitude, using the following equation:
where denotes the geometric midpoint of each channel of the APS, ni is the particle concentration in the ith channel and is the total concentration. Accordingly, Dg of a spectrum of particles is the 50 % probability point of an equivalent diameter having half of the particle concentrations larger than this size and the remaining half below. The vertical profiles of Dg and mode () of the distributions are shown in Fig. 5. It clearly shows the increase in the coarse mode fraction in the size distribution, with both the mode and Dg showing a steady increase with altitude, especially Dg. The rate of increase in Dg with altitude increases from west to east across the IGP, with the highest values in BBR (Fig. 5b). In the central IGP where the mixed aerosol type prevails, the increase in Dg within the ABL is rather weak, but in the free troposphere it increases more sharply probably due to the faster decrease in the accumulation mode concentration (Fig. 4) or the prevalence of advected dust at higher altitudes or both. The previous observations reveal the nonuniform distribution of dust and anthropogenic sources of aerosols. Nearly steady values of NC in the entire column at JDR are attributed to the strong convective mixing of coarse mode dust aerosols up to the lower free-tropospheric region. On the other hand, altitude variation in accumulation and coarse mode aerosols is relatively more variable at BBR and VNS, compared to that at JDR (Fig. 4b) as indicated by the profiles of Dg.

Figure 5Vertical profiles of (a) mode and (b) geometric mean diameters (Dg) of aerosol number size distributions at different heights above the ground level, indicating the change in the pattern of distribution with altitude and from the western to the eastern part of the IGP.
Apart from the number-weighted expression of aerosol size distributions, the mass-weighted distributions carry useful information for quantifying regional distinctiveness of the dominance of coarse mode particles. Even though the fine mode aerosols are extremely numerous in the atmosphere and important for microphysical processes, they represent only a very small proportion of total particle mass, whereas coarse mode particles, even though far less numerous, have significant volume. In simple terms, particle number concentrations are dominant in the fine mode (<0.1 µm), the surface area is predominantly in the accumulation mode (0.1 to 1 µm) and the volume, and hence mass, is divided between the accumulation mode and coarse particle mode. In the present study, since the size range of particle counts is confined in the accumulation and coarse mode regimes (between 0.5 and 20 µm), a quantitative picture of aerosol mass concentrations is obtained by assuming a uniform density equal to 2 g cm−3 following Moorthy et al. (1998) and Pillai and Moorthy (2001). Since the size-resolved particle densities are not known, we did not use effective density (mass–mobility relationship defined as the mass of the particle divided by its mobility equivalent volume) of particles to calculate the mean particle mass size distributions.
Figure 6a shows the altitudinal variation in coarse mode aerosol mass concentrations over all the observational sites, along with the values of coarse mode mass fractions (FMC). Over VNS and JDR, consistently higher values of MC were seen in the entire altitude range. This is in line with the higher values of coarse mode aerosol concentrations (NC) at these sites, JDR being the highest. On the other hand, the values of MC at BBR decreased significantly from the surface to the lower free-tropospheric region. The higher values MC observed near the surface at BBR can be attributed to the influence of local sea-salt aerosols, however not affecting the values of Dg, due to the abundance of accumulation mode aerosols over this site.
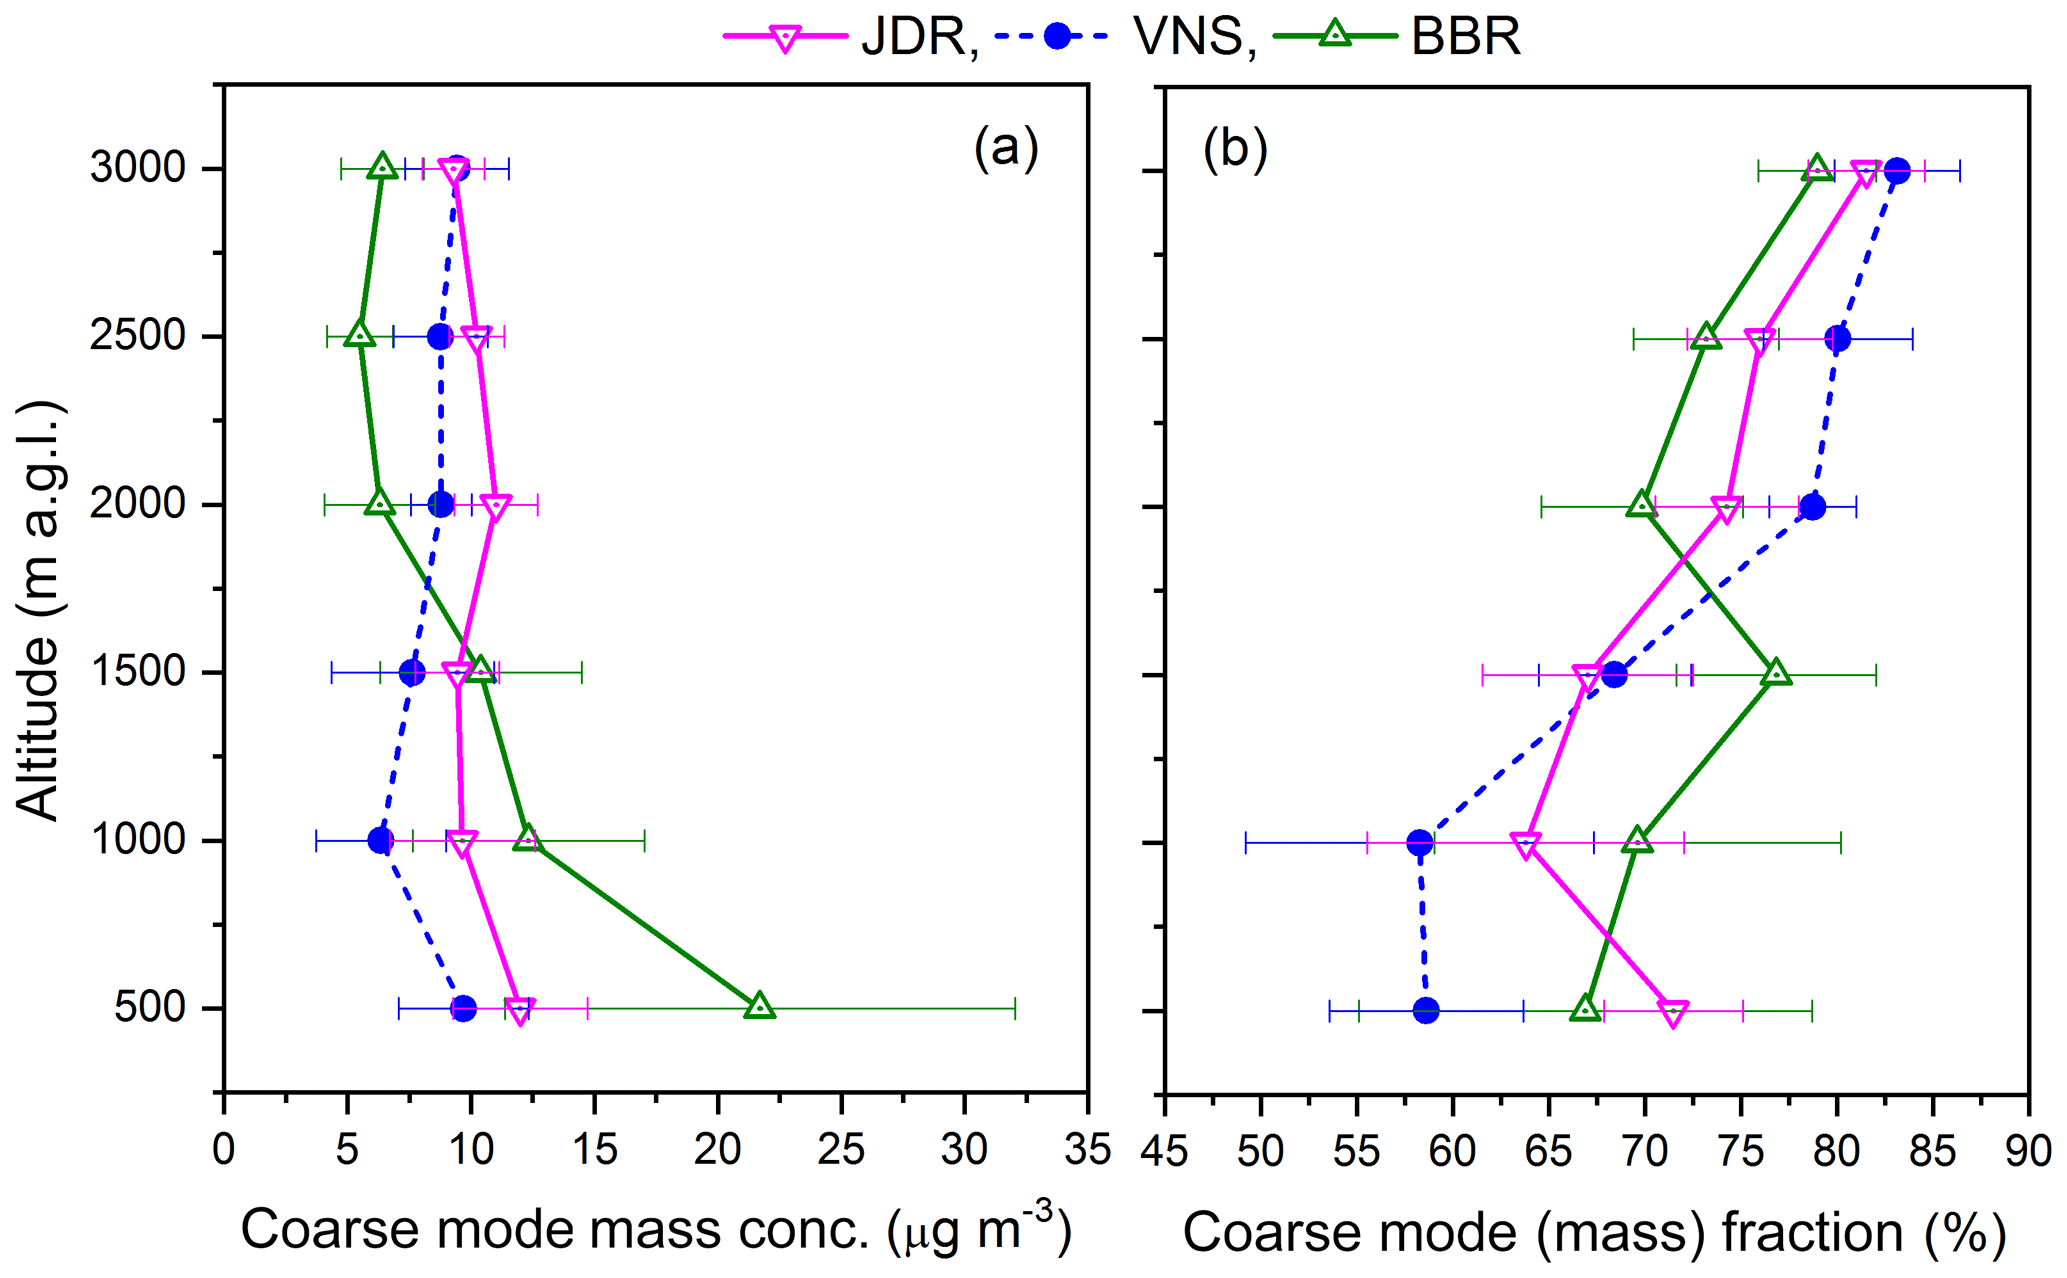
Figure 6Vertical profiles (mean and standard deviations) of (a) coarse mode aerosol mass concentrations (MC); the values are derived from the aerosol number concentrations at different size bins, assuming a density of 2 g cm−3 and (b) aerosol coarse mode fractions (FMC) at different locations.
Similar to that of NC, FMC showed (Fig. 6b) gradually increasing values with altitude at all the locations. The high values of coarse mode mass fraction and an increasing trend with altitude are indicative of the role of upper-level transport of dust from the western desert region, in addition to those contributed locally due to thermal convective processes. Compared to the other two stations, the highest value of FMC (∼70 %) near the surface was seen at JDR indicating the role of the arid nature of the region. This exercise clearly explains the abundance coarse mode dust decreasing from west to east, along with an increase in the contribution of anthropogenic fine/accumulation mode aerosols.
With the goal of examining the transport of mineral dust (by the synoptic winds), the spatial distributions of UV aerosol index, aerosol types and aerosol absorption optical depth (AAOD), all derived from the Level-3 OMAERUVd data product (daily, ) from the Ozone Monitoring Instrument (OMI, on board the Aura satellite; Levelt et al., 2006), are examined. OMAERUV uses the pixel-level Level-2 aerosol data product of OMI at three wavelengths (355, 388 and 500 nm) to derive AAOD. Higher values of AAOD at 388 nm are indicative of the presence of dust or biomass burning aerosols. This is because absorption by dust and organic carbon from biomass burning sources has strong wavelength dependency, with higher absorption at near-UV wavelengths. As the period of this campaign was devoid of major fire activities over the study region (northern India) which normally peaks in April to May and October to November, corresponding to burning after the wheat and rice harvests (Vadrevu et al., 2011; Venkataraman et al., 2006), the AAOD values would be representative of dust loading. This aspect is confirmed in the subsequent section using lidar depolarization ratio.
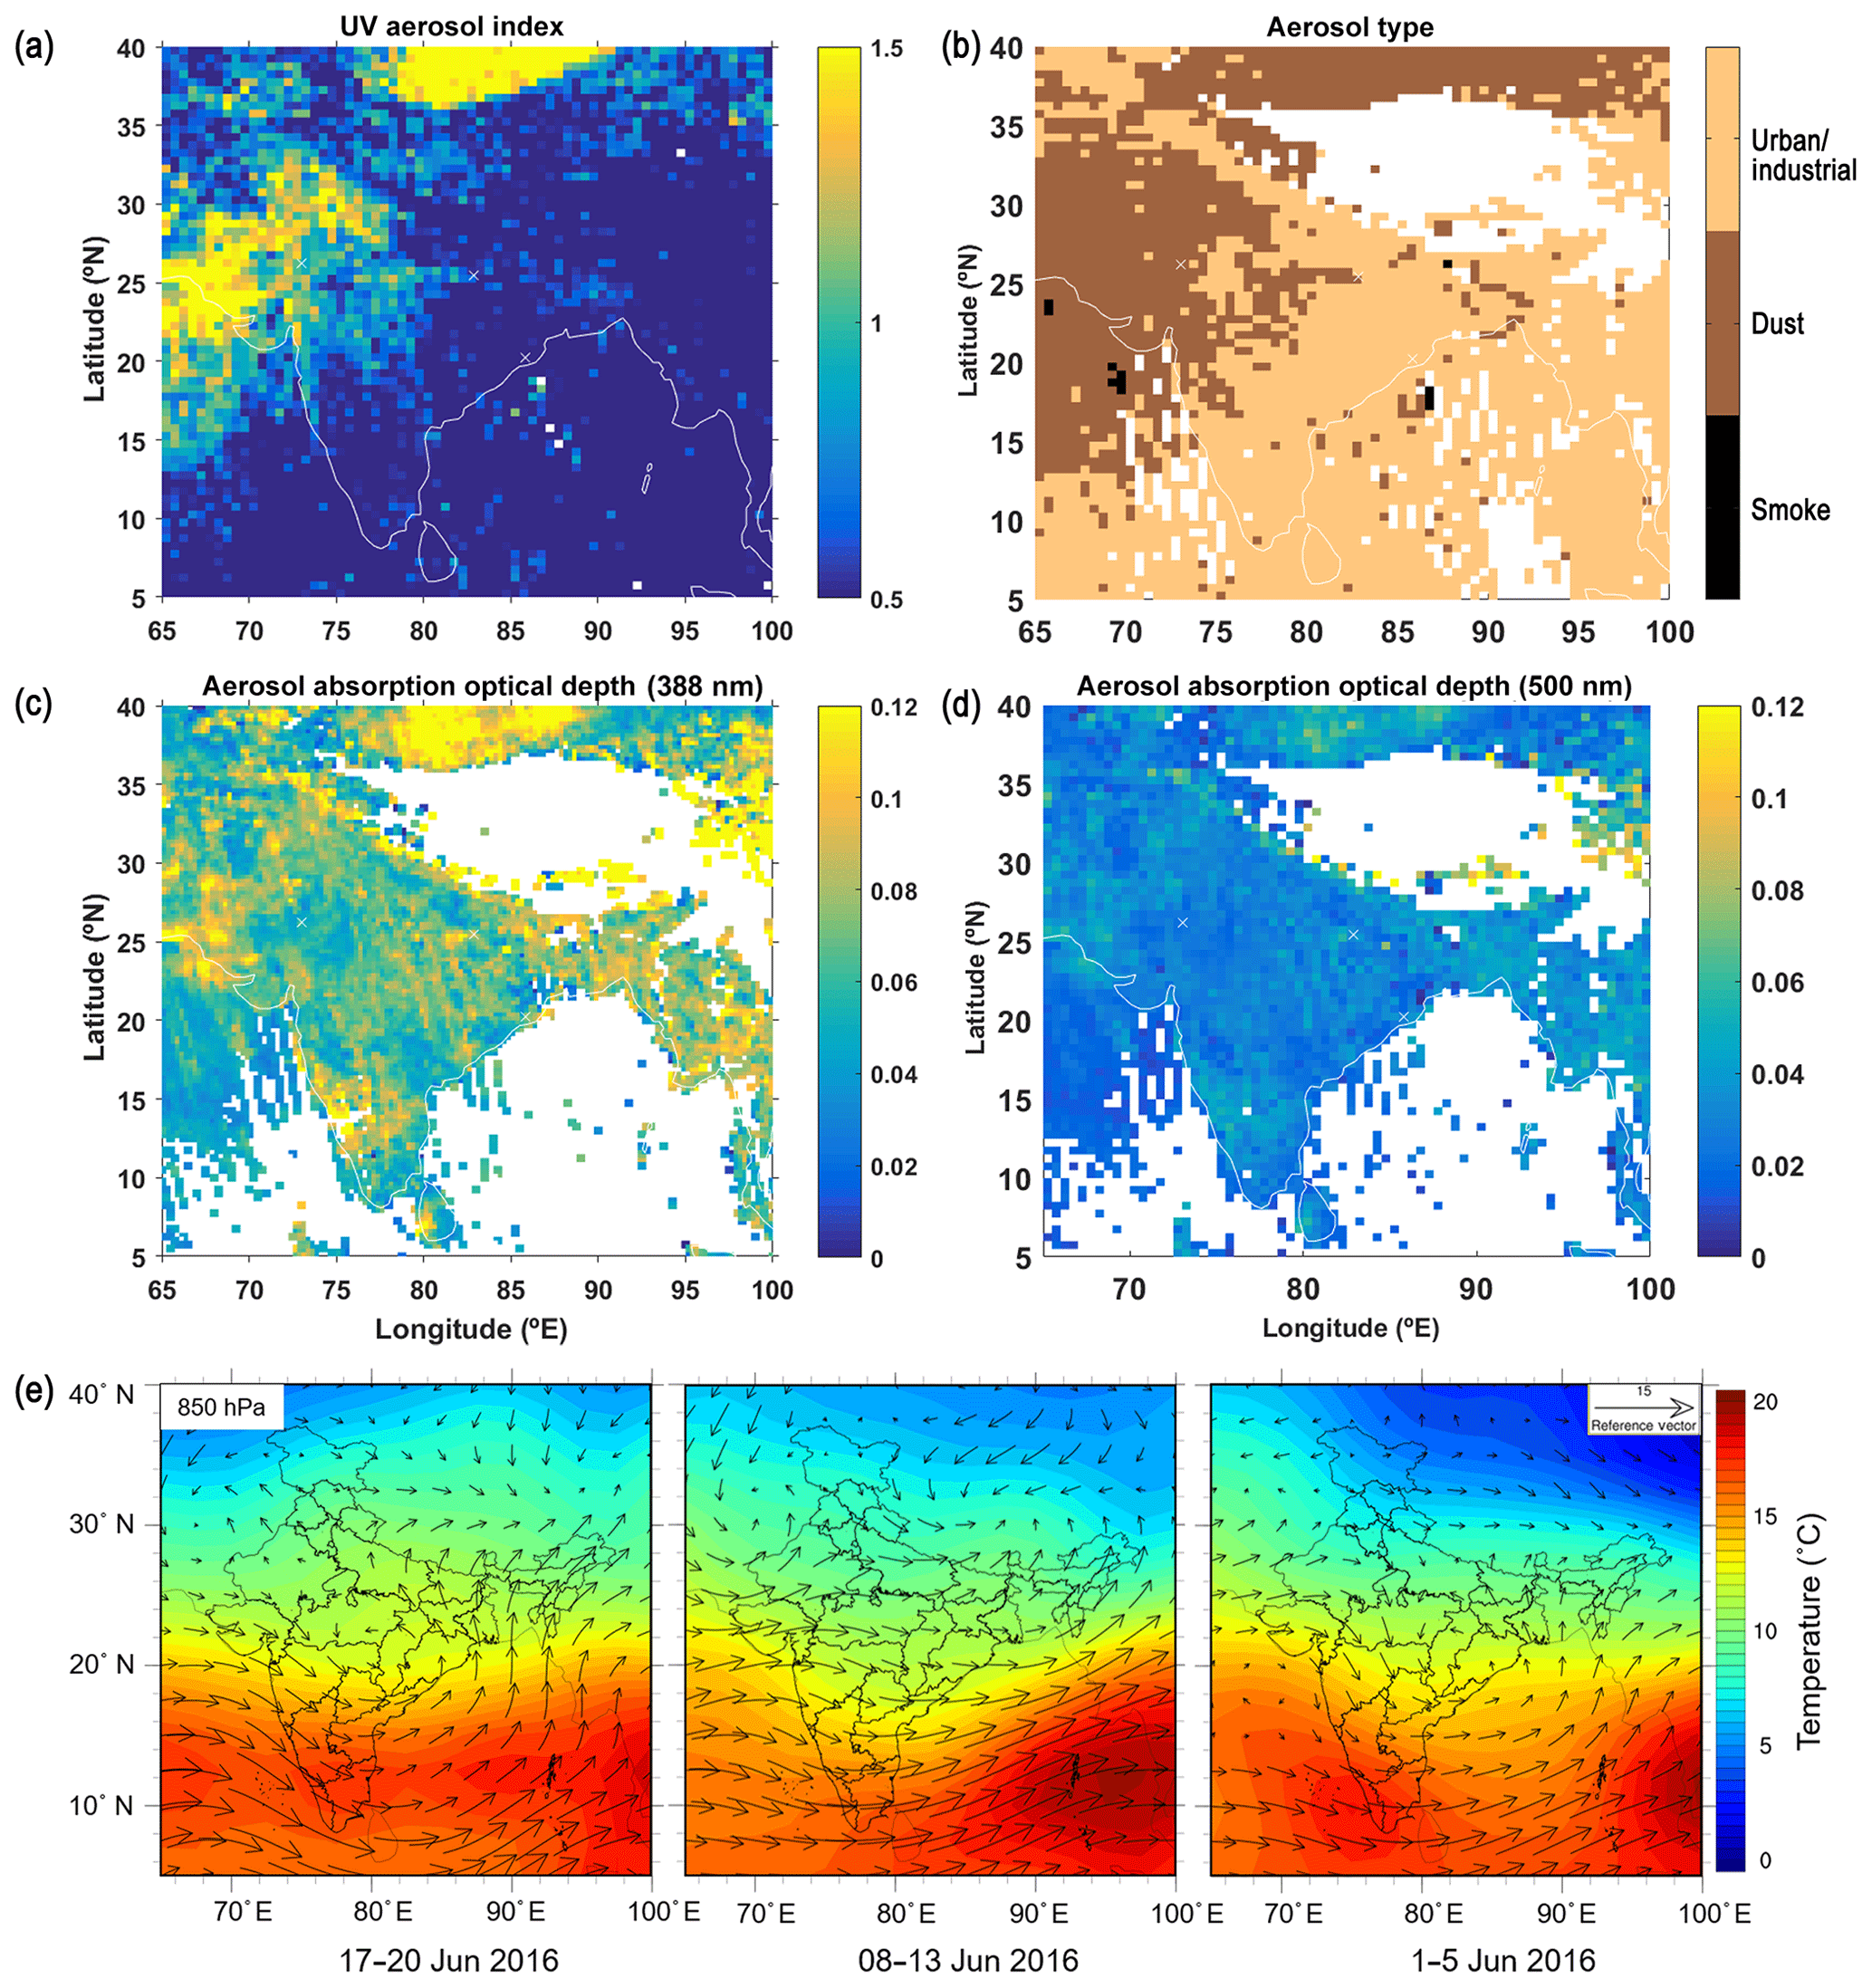
Figure 7Spatial distribution of (a) UV aerosol index, (b) aerosol type, (c) aerosol absorption optical depth (AAOD) at 388 nm and (d) AAOD at 500 nm during June 2016. (e) Synoptic wind and temperature at 850 hPa.
Figure 7a–d show the spatial distributions of UV aerosol index, aerosol type and AAOD at 388 and 500 nm, while the synoptic winds are shown in Fig. 7e. A very good association between the westerly advection and dust loading extending from west to central IGP is noticeable from the figure. This lends further support to the role of advected dust leading to higher MC and FMC at higher altitudes, seen in Fig. 6. In this context, it is also worth noticing that based on observational data and regional climate modeling, Banerjee et al. (2019) have clearly shown (in their Fig. 7) the significant vertical extent of dust loading, of both local and remote origin, during the pre-monsoon and summer across the IGP reaching altitudes as high as 600 hPa.
The volume size distribution of aerosols (shown in Fig. 8) at three distinct altitude regions of the atmosphere also clearly shows the altitudinal change in the pattern of distribution, changing from coarse mode dominance near the surface to accumulation mode dominance at the ceiling altitude over BBR. Those at JDR, the pattern of distributions remains the same in the entire column. Similar to JDR, VNS also depicted a significant enhancement in coarse mode aerosols in the upper levels (at 2 and 3 km altitudes) of the atmosphere. Similar to these observations, based on the collocated spectral scattering properties of aerosols obtained during the same experiment, Vaishya et al. (2018) have reported that the aerosol population changes from supermicron-mode-dominant natural aerosols to submicron-mode-dominant anthropogenic aerosols, as we move from west to east in the IGP. Moreover, the large abundance of coarse particles (>2 µm) along with significant fine/accumulation mode aerosols in the column highlights the complex mixture of dust with other anthropogenic components in all three regions, making a complex scenario for aerosol radiation and aerosol cloud interaction processes. Based on the combination of satellite remote sensing and regional climate model simulations, Banerjee et al. (2019) have also shown the presence of a dry elevated layer of dust (at altitudes between 850 and 700 hPa, taking place in multiple layers) during June across the IGP, transported from the Thar Desert to the northern Bay of Bengal. To ascertain this further, we have examined the data from CATS aboard ISS.
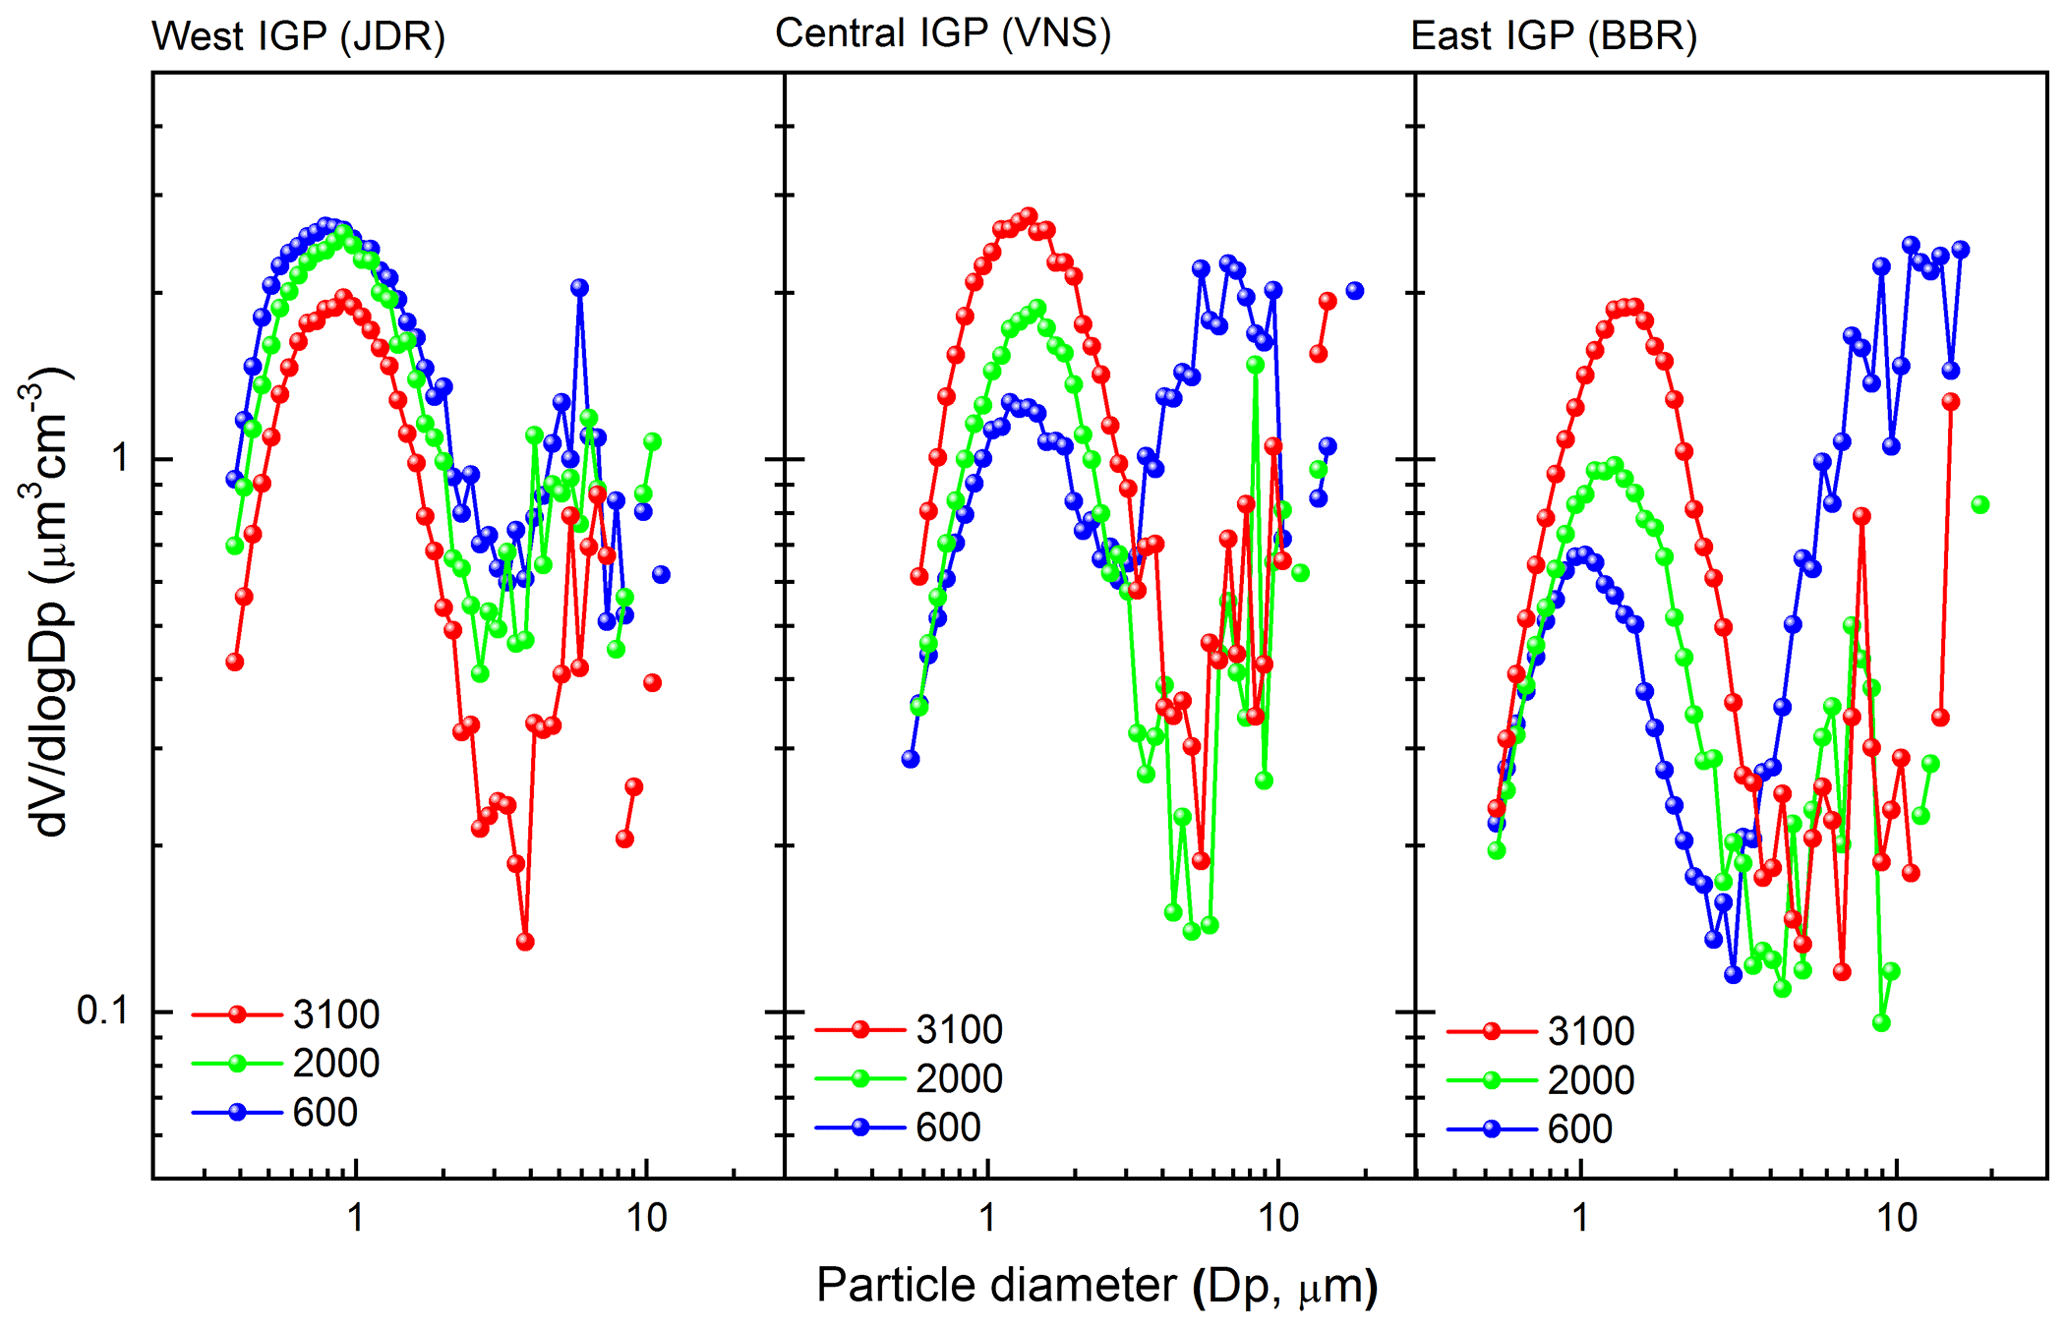
Figure 8Aerosol volume size distributions (mean profiles averaged for all the days) at three distinct altitudes (600, 2000 and 3100 m) of the atmosphere (shown by different color) over JDR, VNS and BBR.
3.2 Inferences from the CATS data
Geophysical parameters derived from CATS on board the ISS are very useful to infer aerosol features in the atmospheric column, especially at altitudes above the ceiling altitude of the aircraft (3.1 km). In the present study, we have considered three products from CATS for the campaign period, viz. (i) depolarization ratio, (ii) attenuated backscatter coefficients and (iii) aerosol types.

Figure 9Aerosol depolarization ratio (obtained from Cloud-Aerosol Transport System (CATS) on the International Space Station, ISS) for three different passes of the ISS over the three subregions during the period of aircraft observation. The tracks of CATS are shown by the solid lines in the left panel, and the rectangular boxes in the right panels show the data over the subregions.
Figure 9 shows the vertical cross section of depolarization ratio for three passes during the campaign period and close to the three subregions (identified by the rectangular boxes in the figure). Higher values (∼0.3) of depolarization ratios are seen in the western IGP (JDR, bottom panel), suggesting the dominance of nonspherical (dust) particles. The depolarization ratio decreases towards the east across the IGP with values equal to 0.1 at the central IGP and ∼0.2 in the eastern BBR. These lend additional support to the inference on the influence of dust aerosols during the campaign period. Supporting the patterns of depolarization ratio, aerosol types (from CATS operating mode 7.1) in Fig. 10a indicate the significant presence of dust at JDR, while the aerosol types over VNS and BBR are a mixture of dust and polluted continental and carbonaceous aerosols. Vertical profiles of total attenuated backscatter coefficients show the vertical extent of the aerosol layer to be as high as 5 km (as has been shown by Banerjee et al., 2019) over all the sites (Fig. 10b).
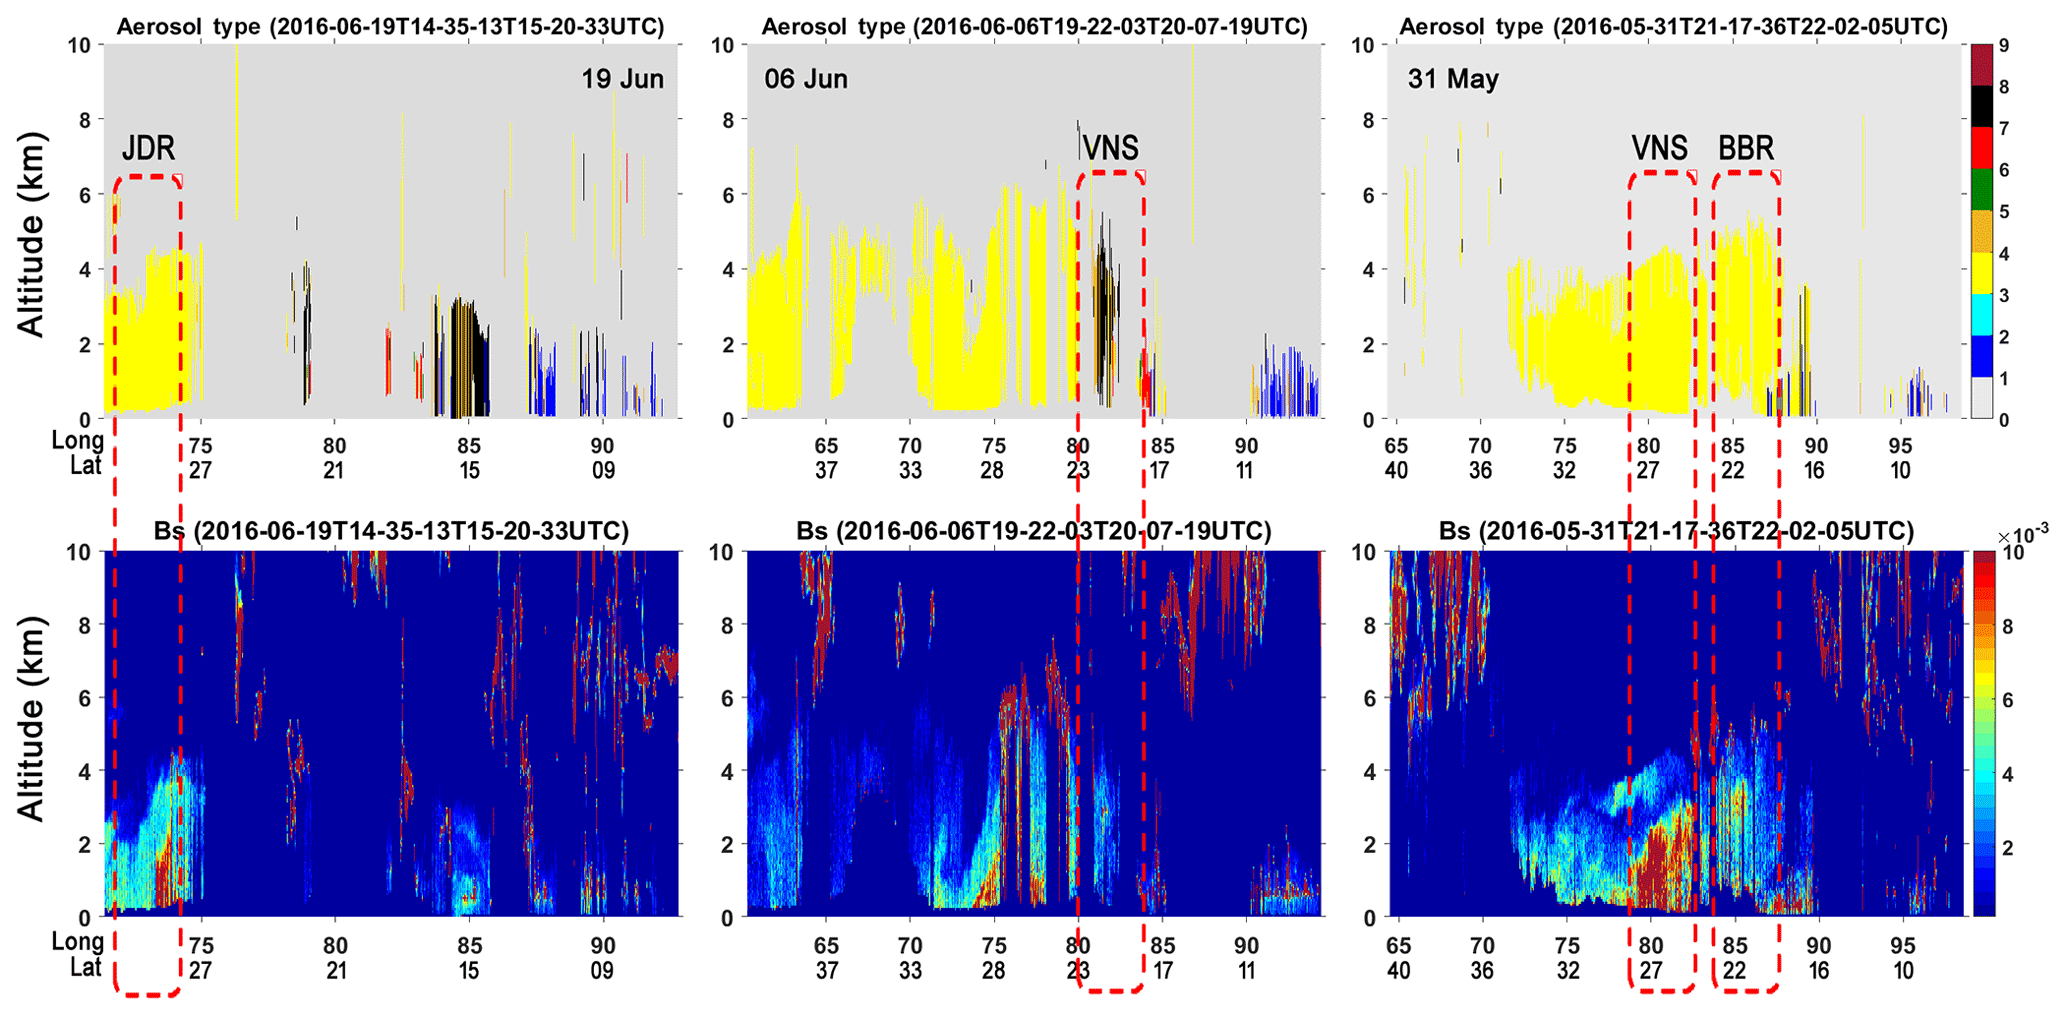
Figure 10Transects of (a) aerosol types (1 – marine, 2 – marine mixture, 3 – dust, 4 – dust mixture, 5 – clean/background, 6 – polluted continental, 7 – smoke, 8 – volcanic) and (b) backscatter coefficients (Bs, km−1 Sr−1) at 1064 nm obtained during the period of aircraft observation corresponding to the overpass of the ISS.
3.3 Vertical profiles of BC
BC is the chief anthropogenic absorbing aerosol species, and the IGP is known to be among the global hot spots of it (Govardhan et al., 2019). The height resolved information on FBC is important not only in radiative forcing but also in CCN activation as well (Bhattu et al., 2016). Collocated measurements of BC during SWAAMI–RAWEX have been used to examine the vertical profiles of BC and its variation across the IGP prior to the onset of the Indian summer monsoon. Figure 11a shows the vertical profiles of BC for the three subregions. Each profile is the average of all the profiles obtained from measurements made from each of the base stations. It is seen that BC remained low (∼1 µg m−3) and depicted very weak altitude variations at the western and eastern IGP regions, while in the central IGP there is a rapid decrease in BC from the high value (∼3 µg m−3) near the surface. Above 2 km, all the profiles overlap, though a weak increase is indicated over BBR, which is examined later. The very high values of BC close to the surface at VNS are attributed to the wide-spread anthropogenic activities in the central IGP including the cluster of thermal power plants in that region. Consequently, the columnar concentration of BC (integrated up to 3.1 km) is also the highest at VNS.
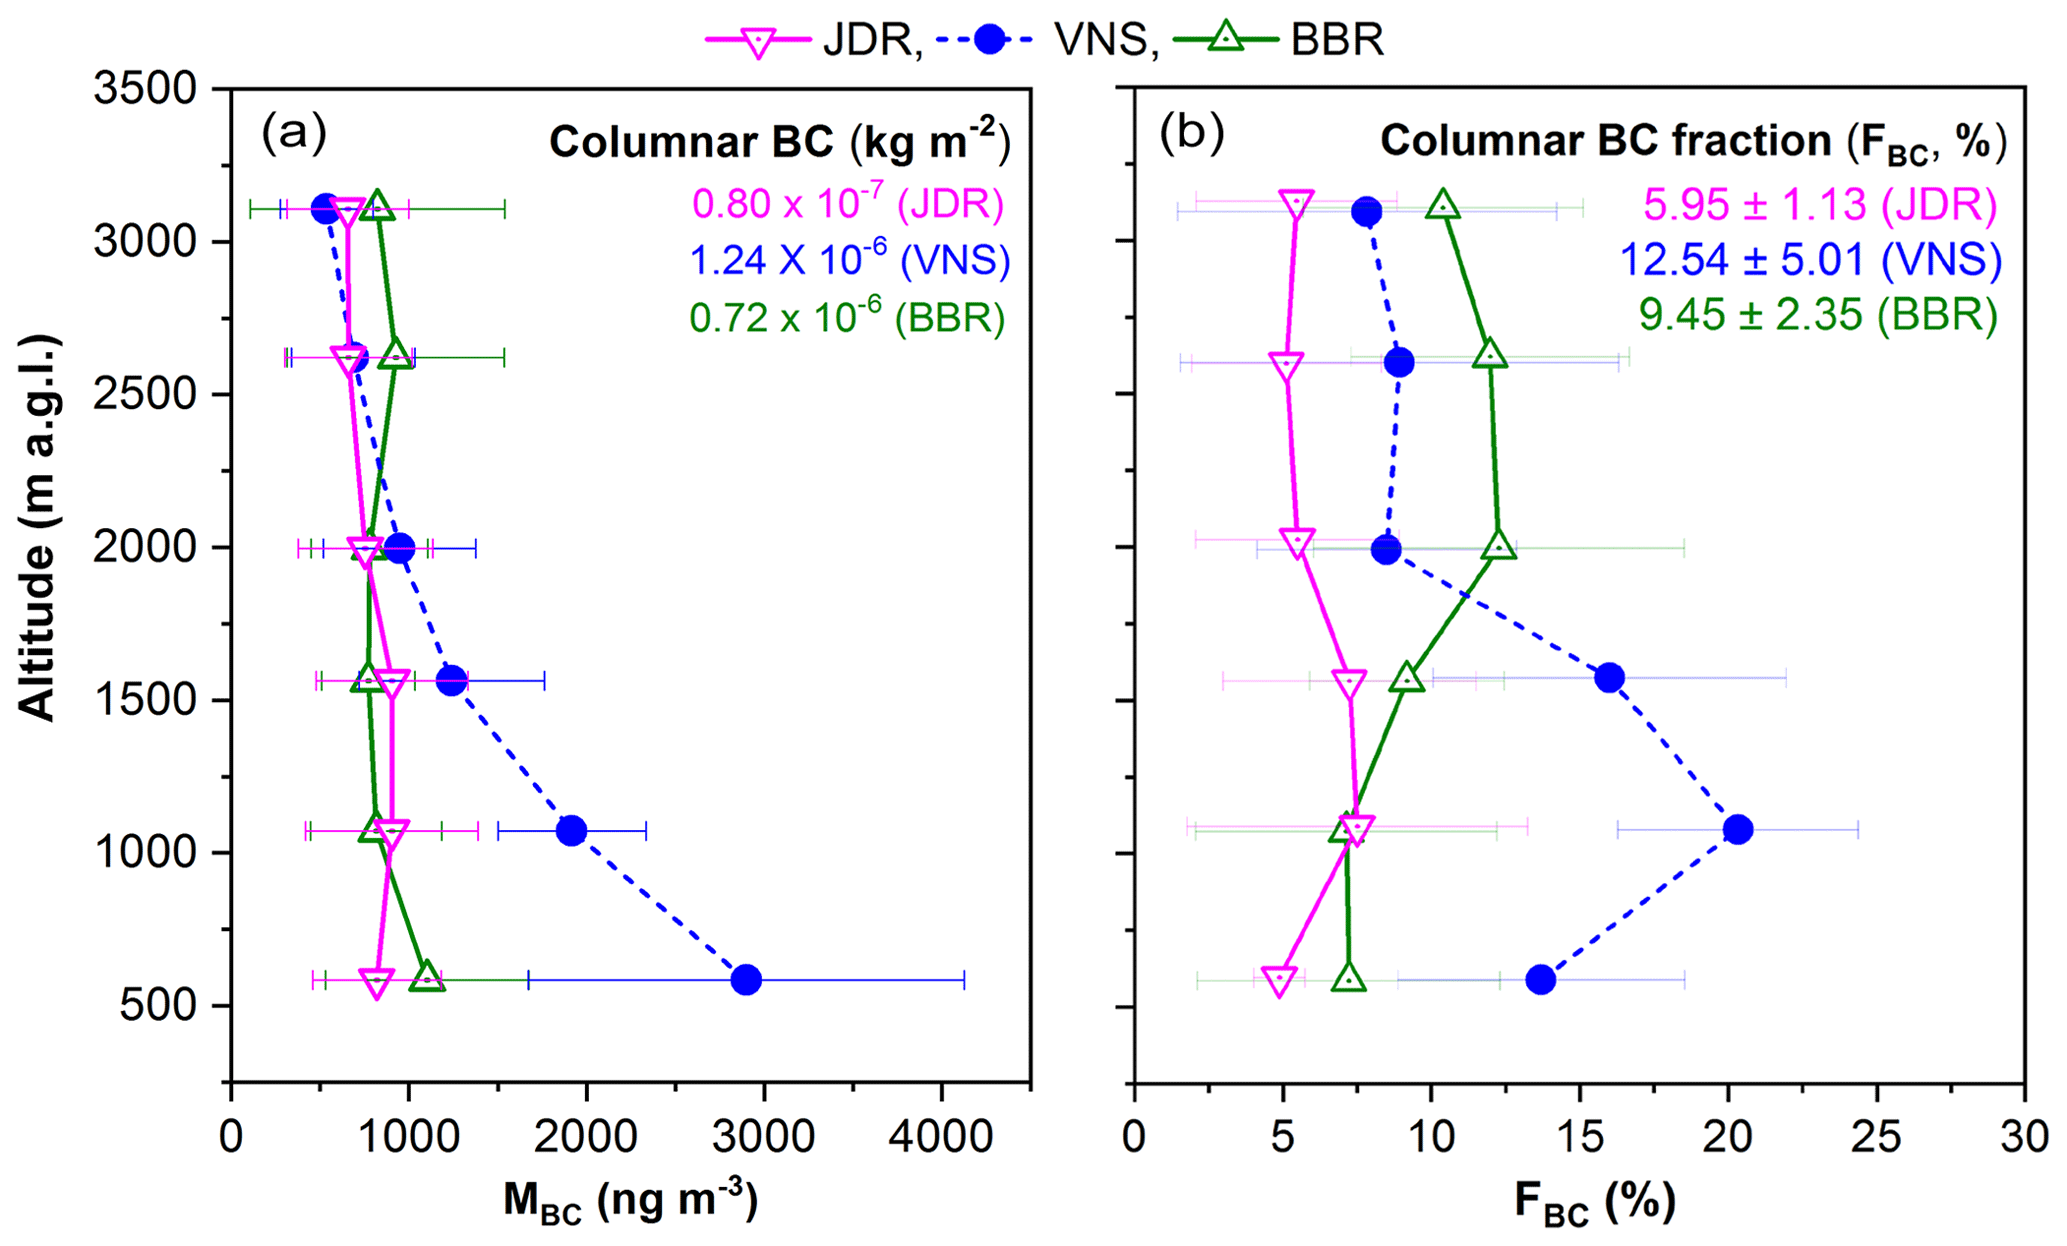
Figure 11Vertical profiles of (a) mean values of BC mass concentrations (MBC) and (b) BC mass fractions (FBC) at JDR, VNS and BBR.
However, the vertical profiles of the fractional contribution of BC (FBC) to the total composite aerosol mass (estimated from the volume size distribution, considering a uniform density of 2 g cm−3, especially in view of the abundance of dust) shows (Fig. 11b) subregional distinctiveness. It remains the lowest (∼6 %) in the western IGP, with very little altitude variation. In the central IGP, FBC is quite high (∼15 % to 20 %) within the ABL and drops off fast above 2 km approaching the values seen for the western IGP. FBC depicts an elevated peak at around 1 km above ground level at VNS, while at BBR, higher FBC values occur at still higher altitudes, where the near-surface values are much lower and comparable to those at JDR. There is a steady increase in FBC from near the surface to higher altitudes, and above 2 km the values are comparable to the peak values seen at VNS (at ∼1 km altitude). Despite this, the integrated BC concentration at BBR falls in between that of JDR and VNS, mainly because of the large values occurring in the lower atmosphere at VNS. It may be recalled that based on SWAAMI–RAWEX aircraft measurements, Vaishya et al. (2018) have reported uniform scattering characteristics across the IGP, while the absorption coefficients showed subregional distinctiveness leading to a west-to-east gradient (decrease) in the vertical structure of single-scattering albedo (SSA).
Investigation of the vertical profiles of BC mass concentrations on individual days (Fig. S2 in the Supplement) helps to see the distinctiveness in each subregion, resulting from the spatially heterogeneous nature of emission sources and advection, especially at BBR where the inland profiles, made during flights perpendicular to the coastline (on 2 and 3 June), show significantly higher values of BC at higher altitudes than those along the coastline. At BBR, this arises mainly because of spatially heterogeneous source impacts. The regions towards the northwest of BBR are characterized by large-scale urban and industrial activities (“Ambient air quality status and trends in Odisha: 2006–2014”). Similarly, near-surface BC concentrations at VNS were higher when the flights were confined to the NE, NW and SW of the city center, while the values in the SE sector were lower. On the other hand, at JDR, the profiles revealed a better spatial homogeneity.
To quantify the climatic implications of BC, the heating rate profiles of BC are examined based on the estimation of shortwave aerosol direct radiative forcing (DRF) due to BC alone. DRF due to BC represents the difference between the DRF for aerosols with and without the BC component. The in situ values of scattering (σsca) and absorption (σabs) coefficients measured on board the aircraft were used to estimate spectral values of AOD (layer-integrated σsca+σabs), single-scattering albedo (SSA) and asymmetry parameter (g) for each level, assuming a well-mixed layer of 200 m above and below the measurement altitude (details are available in Vaishya et al., 2018). The layer mean values of AOD, SSA and Legendre moments of the aerosol phase function (derived from the Henyey–Greenstein approximation) are used as input in the Santa Barbara DISORT Atmospheric Radiative Transfer (SBDART; Ricchiazzi et al., 1998) model to estimate diurnally averaged DRF (net flux with and without aerosols) at the top (DRFTOA) and bottom (DRFSUR) of each of the layers. The atmospheric forcing (DRFATM) for each of the levels is then estimated as
In order to estimate the forcing due to BC alone, optical parameters for aerosols were deduced again. For this, values of σabs were segregated into the contributions by BC (σBC) and organic carbon (OC) (σOC), where σBC was estimated following inverse wavelength dependence of BC (e.g., Vaishya et al., 2017). Based on this, a new set of AOD and SSA for BC-free atmosphere is calculated and fed into SBDART for estimating DRFALL-BC without the BC component. Thus, DRF due to BC is
Here, DRFALL represents forcing due to all the aerosol components, including BC.
The vertical profiles of atmospheric heating rate (HR, estimated based on the atmospheric pressure difference between the top and bottom of each layer and aerosol-induced forcing in that layer) due to BC alone show (Fig. 12) maximum influence of BC in trapping the SW radiation at VNS, followed by BBR and JDR. Interestingly, the altitudinal profiles of heating rate are distinctly different over the regions, with BBR showing an increase with altitude, while VNS shows the opposite pattern with maximum heating (∼0.81 K d−1) at 500 m above ground. Enhanced heating at 500–2000 m altitude is seen at JDR. These results indicate the dominant role of absorbing aerosols near the surface at VNS, while the atmospheric perturbation due to elevated layers of absorbing aerosols is conspicuous at BBR (HR ∼0.35 K d−1 at the ceiling altitude). The column-integrated values of atmospheric forcing due to BC alone are 7.9, 14.3 and 8.4 W m−2 at JDR, VNS and BBR, respectively.
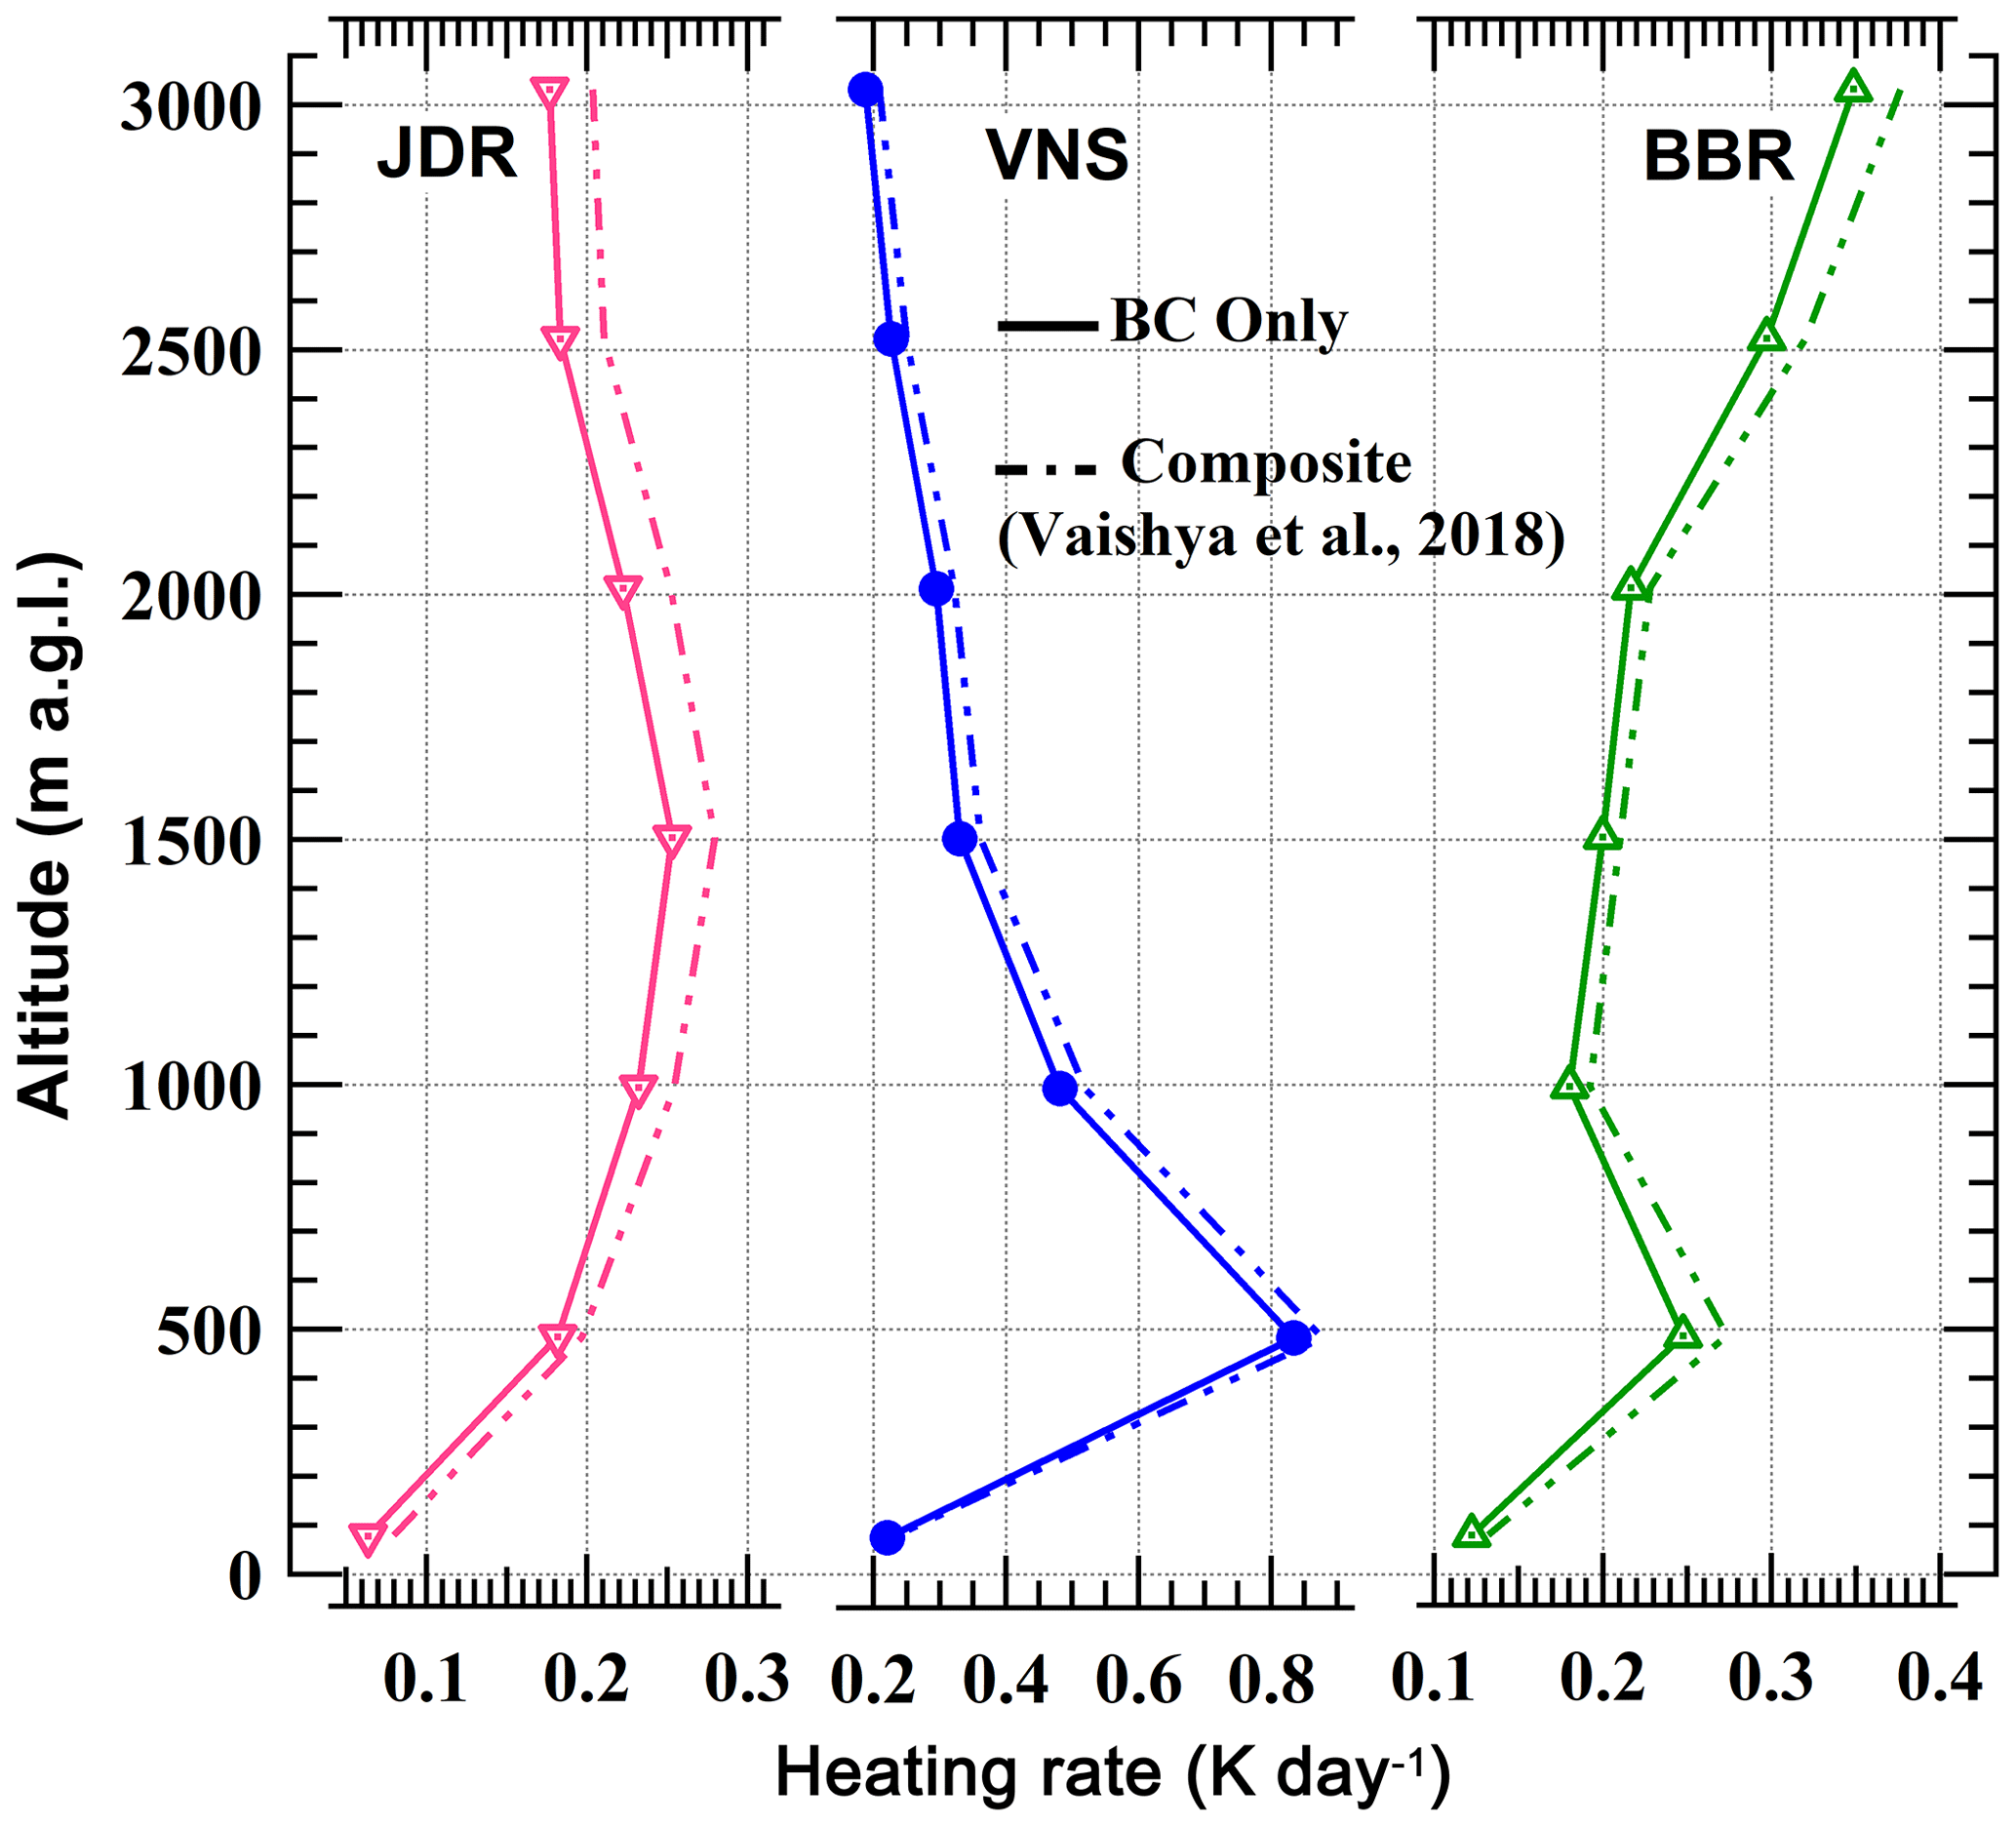
Figure 12Vertical profiles of atmospheric heating rate due to BC (solid lines) and composite (dashed lines) aerosols for the regions of the IGP: (a) JDR in western IGP, (b) VNS in central IGP and (c) BBR in eastern IGP. Data for the composite heating rate profiles are from Vaishya et al. (2018).
In this context, we have examined the possible role of the large network of thermal power plants (TPPs) over the northern part of India, which is reported to have a significant contribution to regional emissions (Singh et al., 2019). These include the emissions of SO2, NOx, CO2, CO, volatile organic compounds (VOCs), suspended particulate matter (PM2.5 and PM10, including BC and OC) and other trace metals like mercury (Guttikanda and Jawahar, 2014; Sahu et al., 2017), dispersing over large areas through stacks. Fly ash from coal-fired power plants causes severe environmental degradation in the nearby environments (5–10 km) of TPPs (Tiwari et al., 2019). Over the IGP, since more than 70 % of the thermal power plants are coal based, emissions of CO2 and SO2 make up more than 47 % of the total emission share, while the relative share of PM2.5 and NOx is ∼15 % and 30 % (GAINS, 2010). Based on the in situ measurement of BC in fixed and transit areas in close proximity of seven coal-fired TPPs in Singrauli (located ∼700 km northwest of BBR), Singh et al. (2019) have reported that BC concentration reached as high as 200 µg m−3 in the transit measurements. The Energy and Resources Institute, India, has also reported that emission levels of the carbonaceous (soot or BC) particles are estimated to be around 0.061 gm kW h−1 per unit of electricity from Indian thermal power plants (Vipradas et al., 2004). Based on emission pathways and ambient PM2.5 pollution over India, Venkataraman et al. (2018) have reported that the types of aerosols emitted from coal burning in thermal power plants and industry in eastern and peninsular India are similar to those of residential biomass combustion. The ongoing discussion thus clearly indicates that TPPs are major sources of BC in the atmosphere.
As it is not possible to measure BC from space, to infer the role of these emissions from thermal power plants in causing the higher BC fraction at higher altitude over BBR, we have examined the spatial distribution of the concentrations of the co-emitted NO2 and SO2 in Fig. 13, in which the locations of major coal-based TPPs (https://www.ntpc.co.in/en/power-generation/coal-based-power-stations, last access: 9 July 2020) are also marked. The data are obtained from OMI on board the Aura satellite. Higher concentrations of NO2 and SO2 are readily discernible from the figure around the regions (marked in the figure) during the period of flight experiments where there are clusters of TPPs. As the energy consumption is the highest during summer and most dependent on TPPs, these TPPs should be operating to near full capacity. This provides indirect support to the high concentrations of BC (co-emitted) at higher levels. In general, these TPPs have tall stacks (heights in the range 200 to 400 m) and aid easy ventilation to the lower free-tropospheric altitudes.
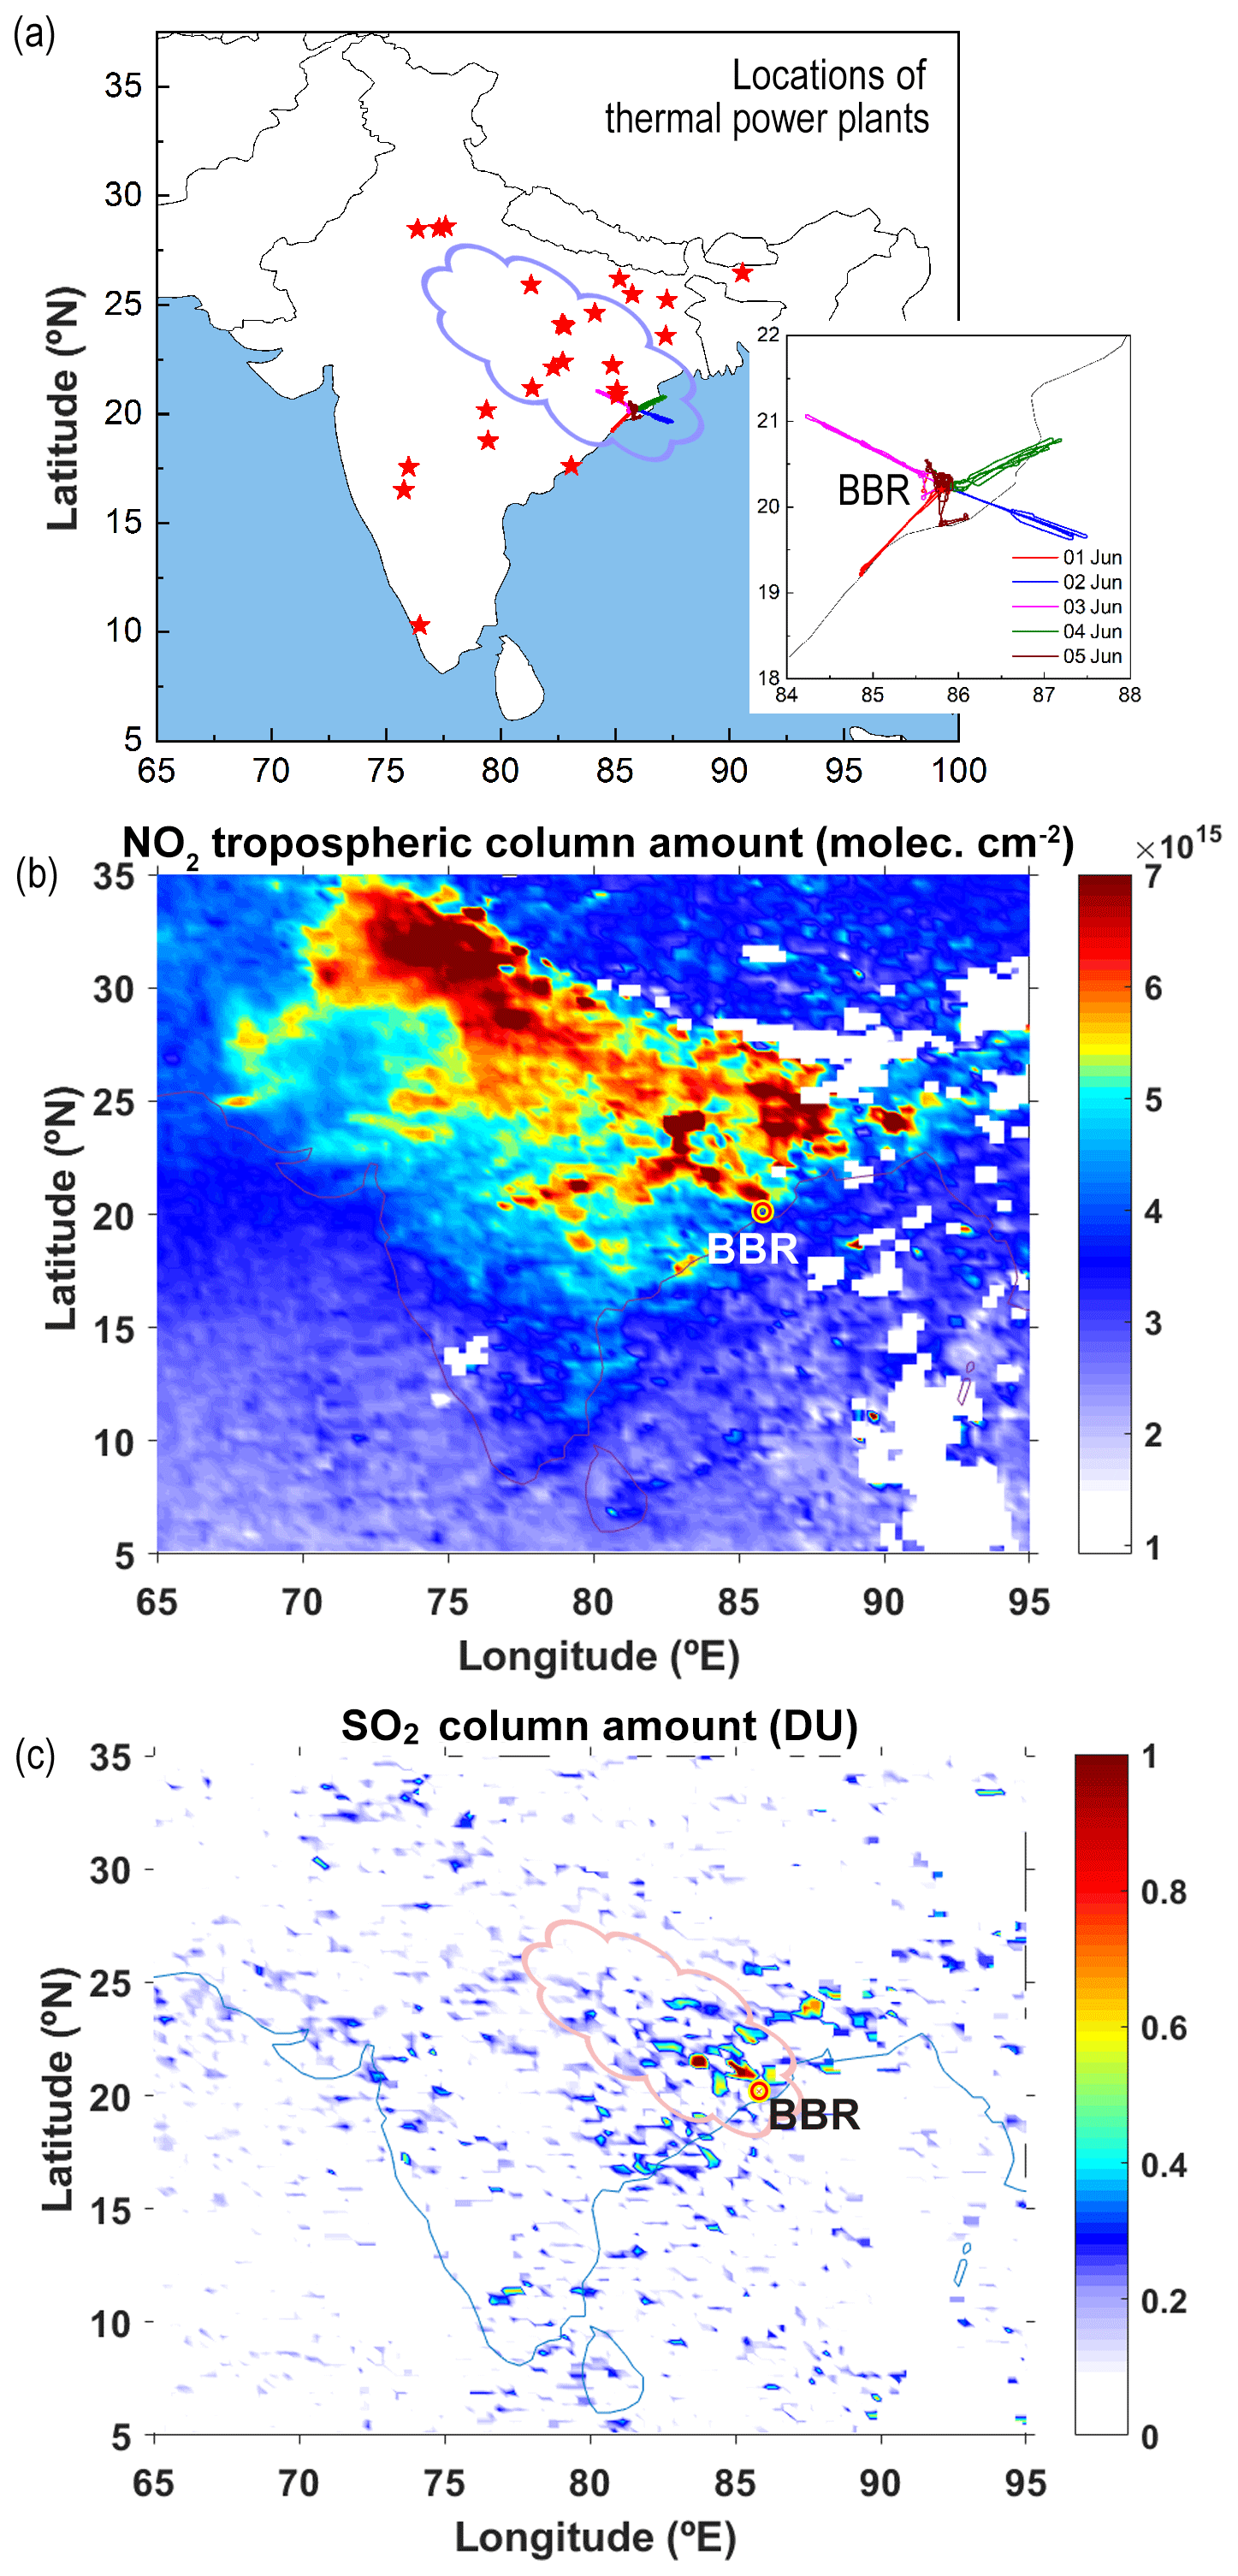
Figure 13(a) Geographic position of thermal power plants (TPP) over India, along with the spatial map of (b) NO2 tropospheric column density (molecules cm−2) and (c) SO2 column amount (DU, 1 DU molecules cm−2) over the northern part of India.
To further ascertain this, the spectral properties of aerosol absorption are examined. First, we have examined the frequency distribution of absorption Ångström exponent (αabs, derived from the linear fit on log-log scale between corresponding absorption coefficients to Aethalometer wavelengths) in Fig. 14, separately for the mixed layer (ML, below 1.5 km) and above (≥2 km). The frequency distribution of αabs reveals a clear shift towards lower values as we move from JDR to BBR, both within the ML and above, even though the values of αabs are mostly between 1 and 1.5. Based on laboratory studies and field investigations, it has been shown that the higher values of αabs (∼2) are representative of biomass burning emissions, while the values of ∼1 are indicative of fossil fuel combustions (Kirchstetter et al., 2004). The values of αabs>1 are indicative of the presence of biomass burning, whose relative abundance increases with the steepness of the absorption spectra, as has been reported elsewhere from the laboratory experiments (Hopkins et al., 2007).
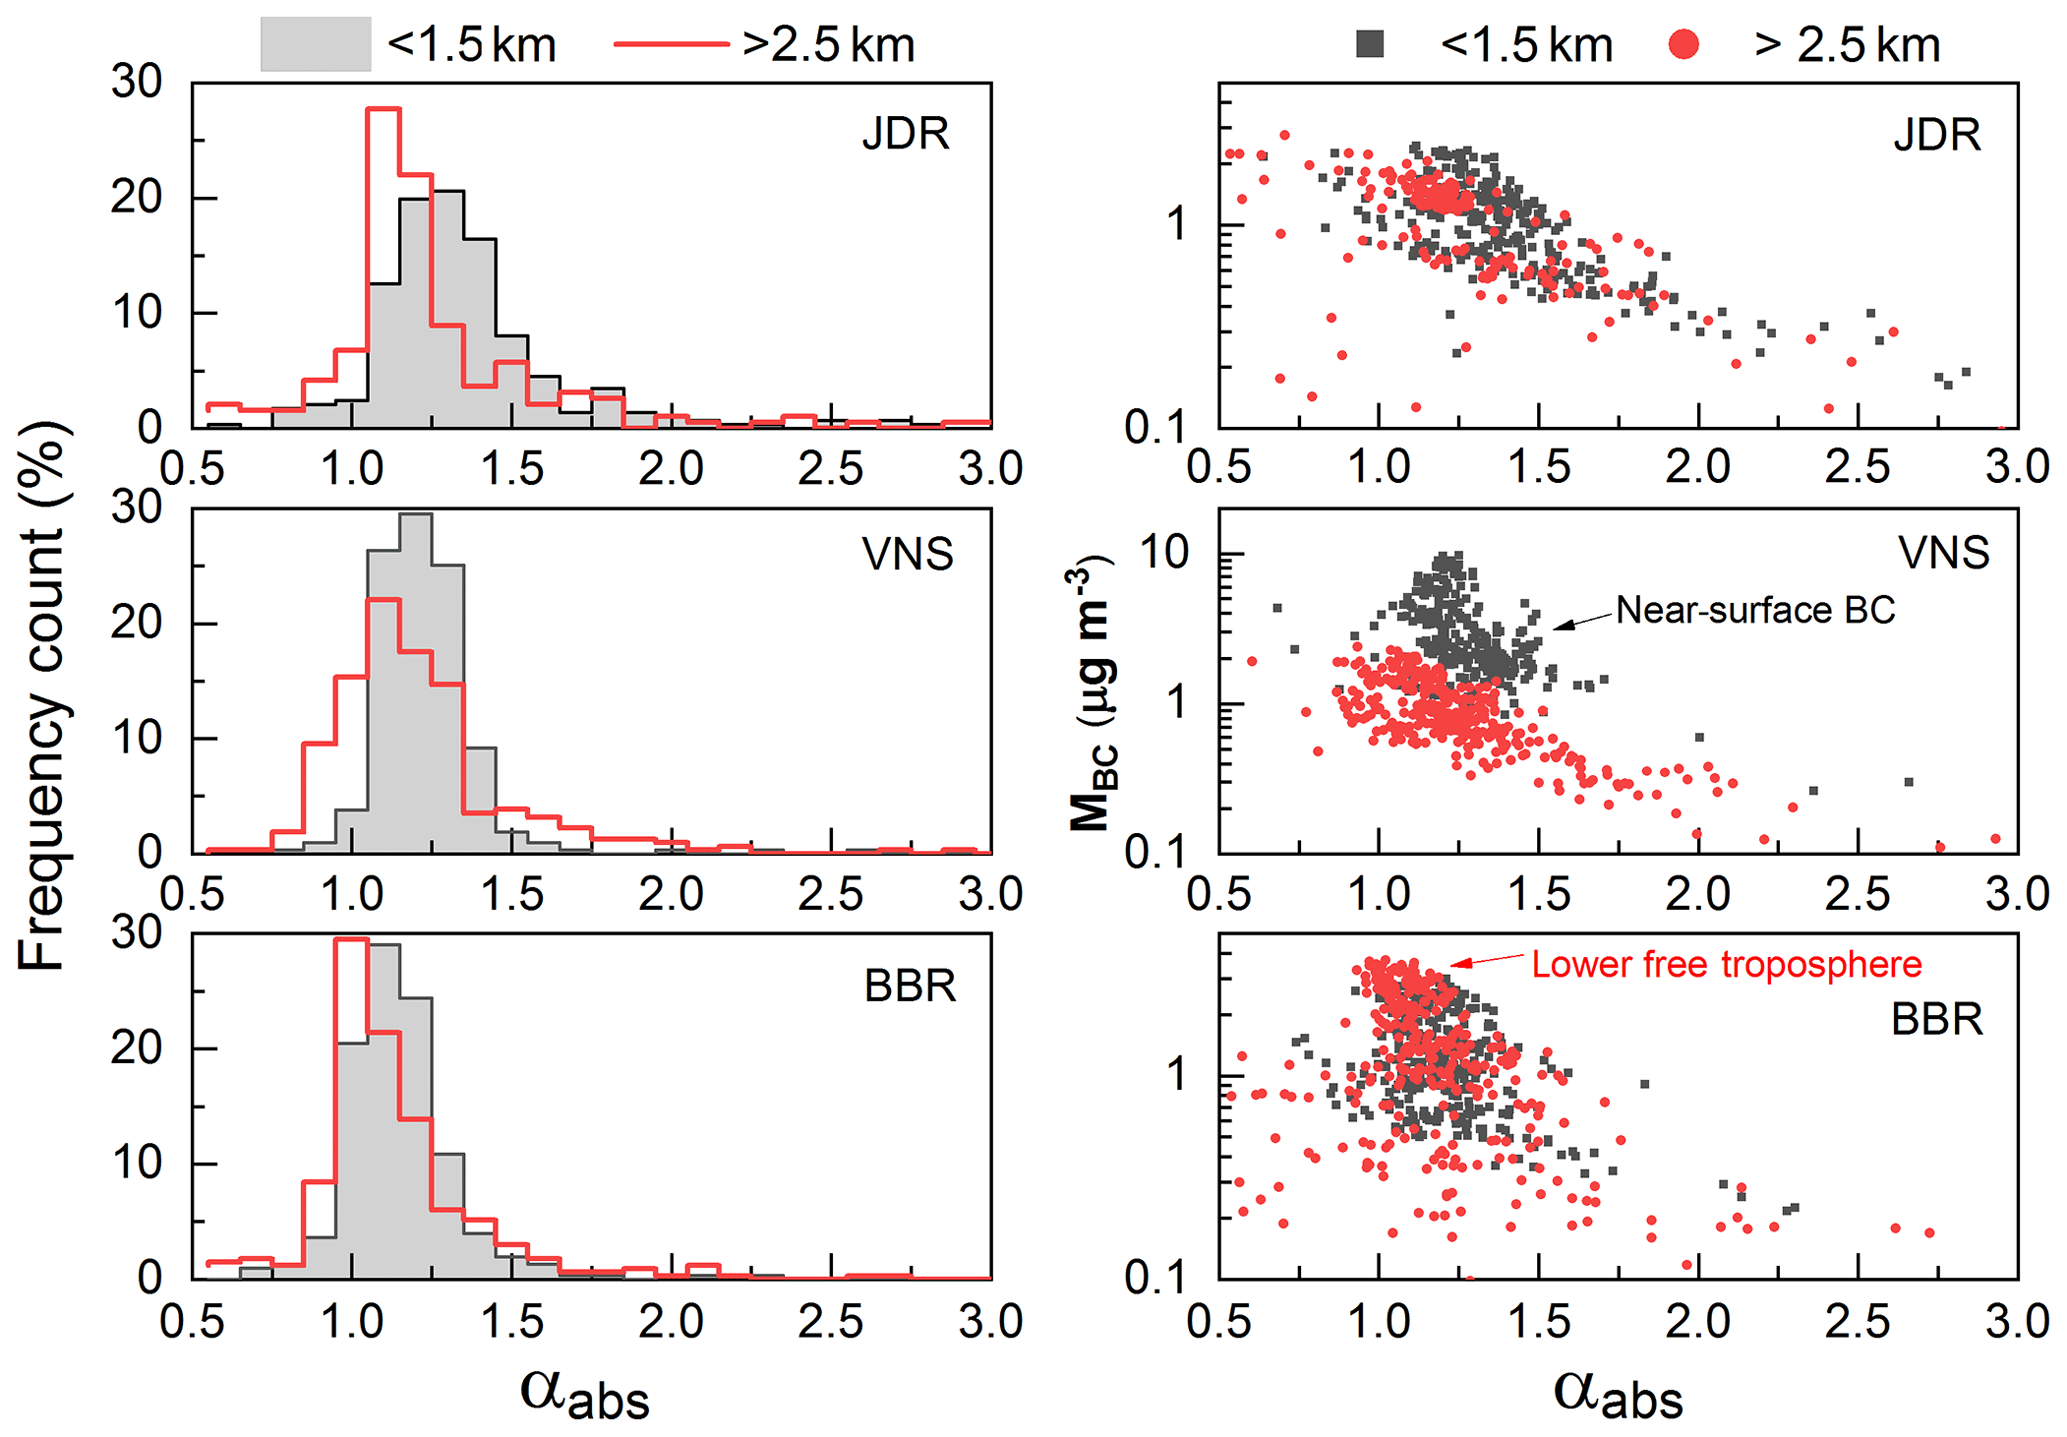
Figure 14(a) Frequency of occurrences of absorption Ångström exponent (αabs) below 1.5 km and above 2.5 km altitude; (b) variation in BC mass concentrations corresponding to different values of αabs is shown in the right panels for the same two altitude regimes at distinct locations of northern India.
Examining Fig. 14 in the above light, it emerges that a significant contribution of BC from fossil fuel combustions mixed with biomass burning origin prevails at higher altitudes over BBR, while the association between the two decreases abruptly from ML to a higher height at VNS. The consistent higher values of BC in the column associated with the values of αabs lying between 1 and 1.5 can also be due to the aging of BC at higher heights, during which BC mixes with other species and its Ångström exponent increases. This is because the spectral dependence of absorption steepens when BC (even though its source could be fossil fuel) is coated with a concentric shell of weakly absorbing material (Gogoi et al., 2017). Further investigations are needed in this direction.
3.4 Inter-seasonal variability: a case study at JDR
The spatial variation in the altitude profiles of NAC, Dg, FMC and FBC across the IGP hints to several possible implications of their direct and indirect effects. Altitudinal increases in the values of Dg and FMC along with depolarization ratios are indicative of the presence of dust (>4 µm) in the lower free troposphere, which is known to produce a long-wave (warming) radiative effect (Miller et al., 2006; Tegen and Lacis, 1996). Conversely, significant abundance of accumulation mode aerosols, in general, might contribute significantly to scattering. For example, a clear seasonal change in the vertical profiles of aerosol concentrations (NT-APS) as measured by APS in the size (diameter) regime of 0.5 to 20 µm is noticeable at JDR, changing from the much steeper variation (vertically) in winter (as reported by Gogoi et al., 2019) to a near-steady one during prior to the onset of the monsoon (Fig. 15). Based on airborne measurements during SWAAMI–RAWEX, Vaishya et al. (2018) have reported that the values of SSA at west IGP varied between 0.935 (at 530) in spring and 0.84 (at 530 nm) prior to the onset of the monsoon, indicating a seasonal change in the aerosol type and consequently their optical properties.
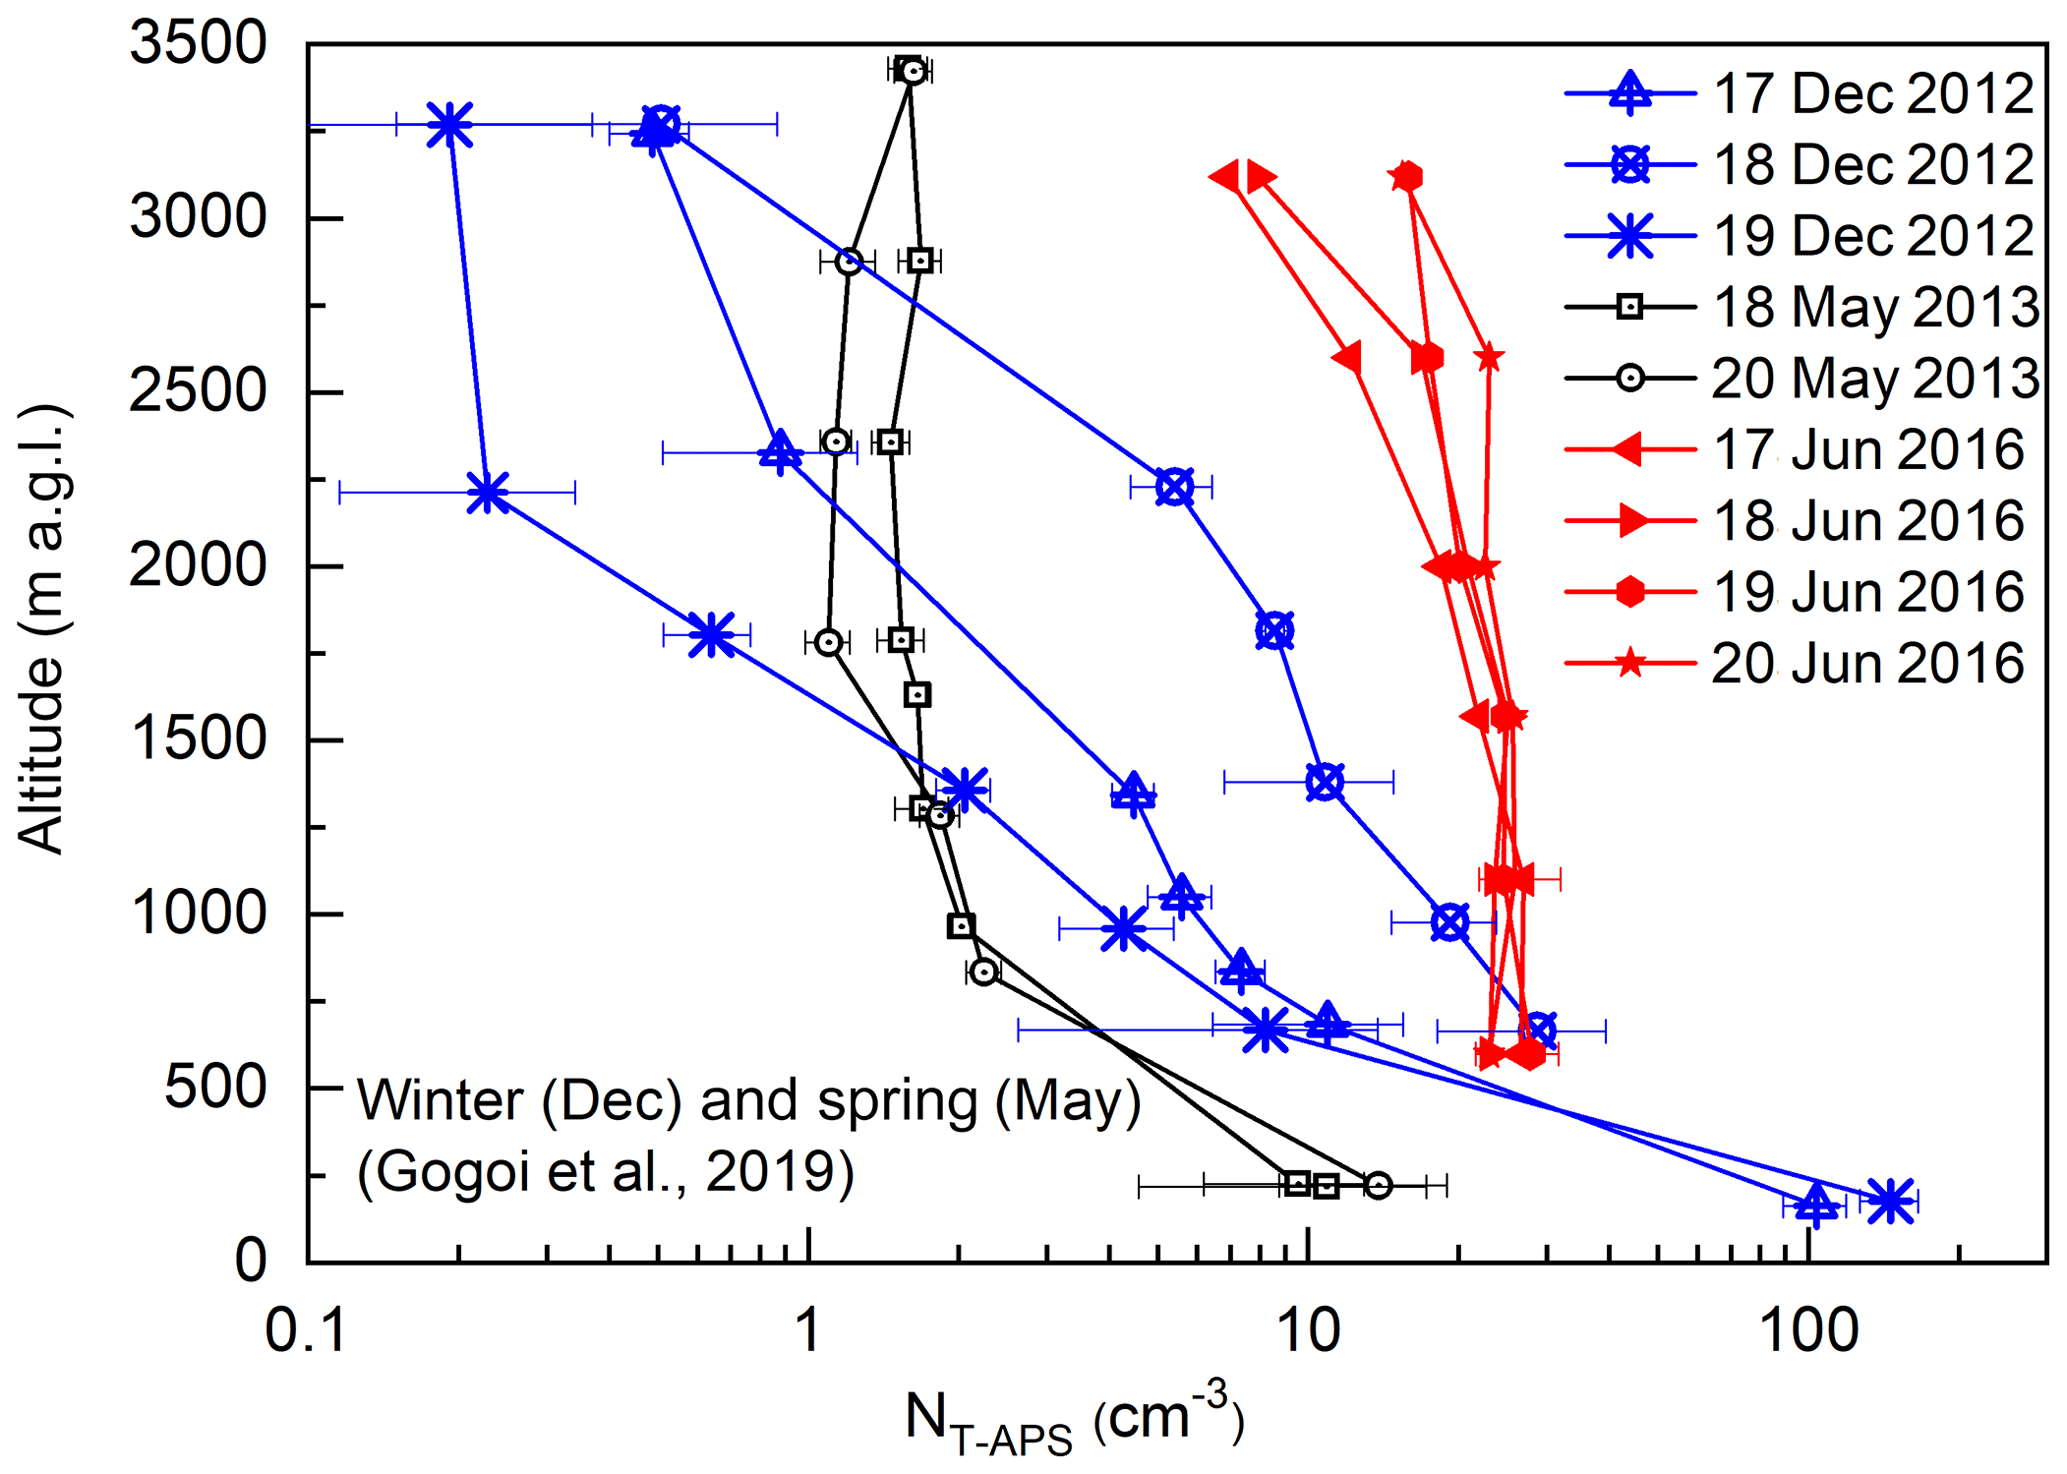
Figure 15Vertical profiles of seasonal mean values of aerosol number concentrations (NT, as measured by APS in the size (diameter) of regime 0.5 to 20 µm) at Jodhpur during winter 2012 (17–19 December), spring 2013 (18 and 20 May) and just prior to the onset of the monsoon 2016 (17–20 June).
To examine the role of the dynamical processes in different seasons, we have shown the profiles of vertical velocity (in pressure coordinates from 1000 to 100 hPa) in Fig. 16. These are obtained from ERA-Interim reanalysis data sets. Here, the positive and negative signs of vertical velocity (ω) are indicative of updraft (as indicated by −ve values of ω) and downdraft (as indicated by +ve values of ω). A clear seasonal transformation is seen, with increasingly stronger updrafts dominating over the IGP from December to June, with the intensity increasing from west to east. In the western IGP regions, the sign of vertical velocity seems to change from December to June, progressively enhancing the magnitude of deep convection towards the onset of the monsoon, imparting stronger vertical dispersion and more homogeneous distribution of aerosols in the column.
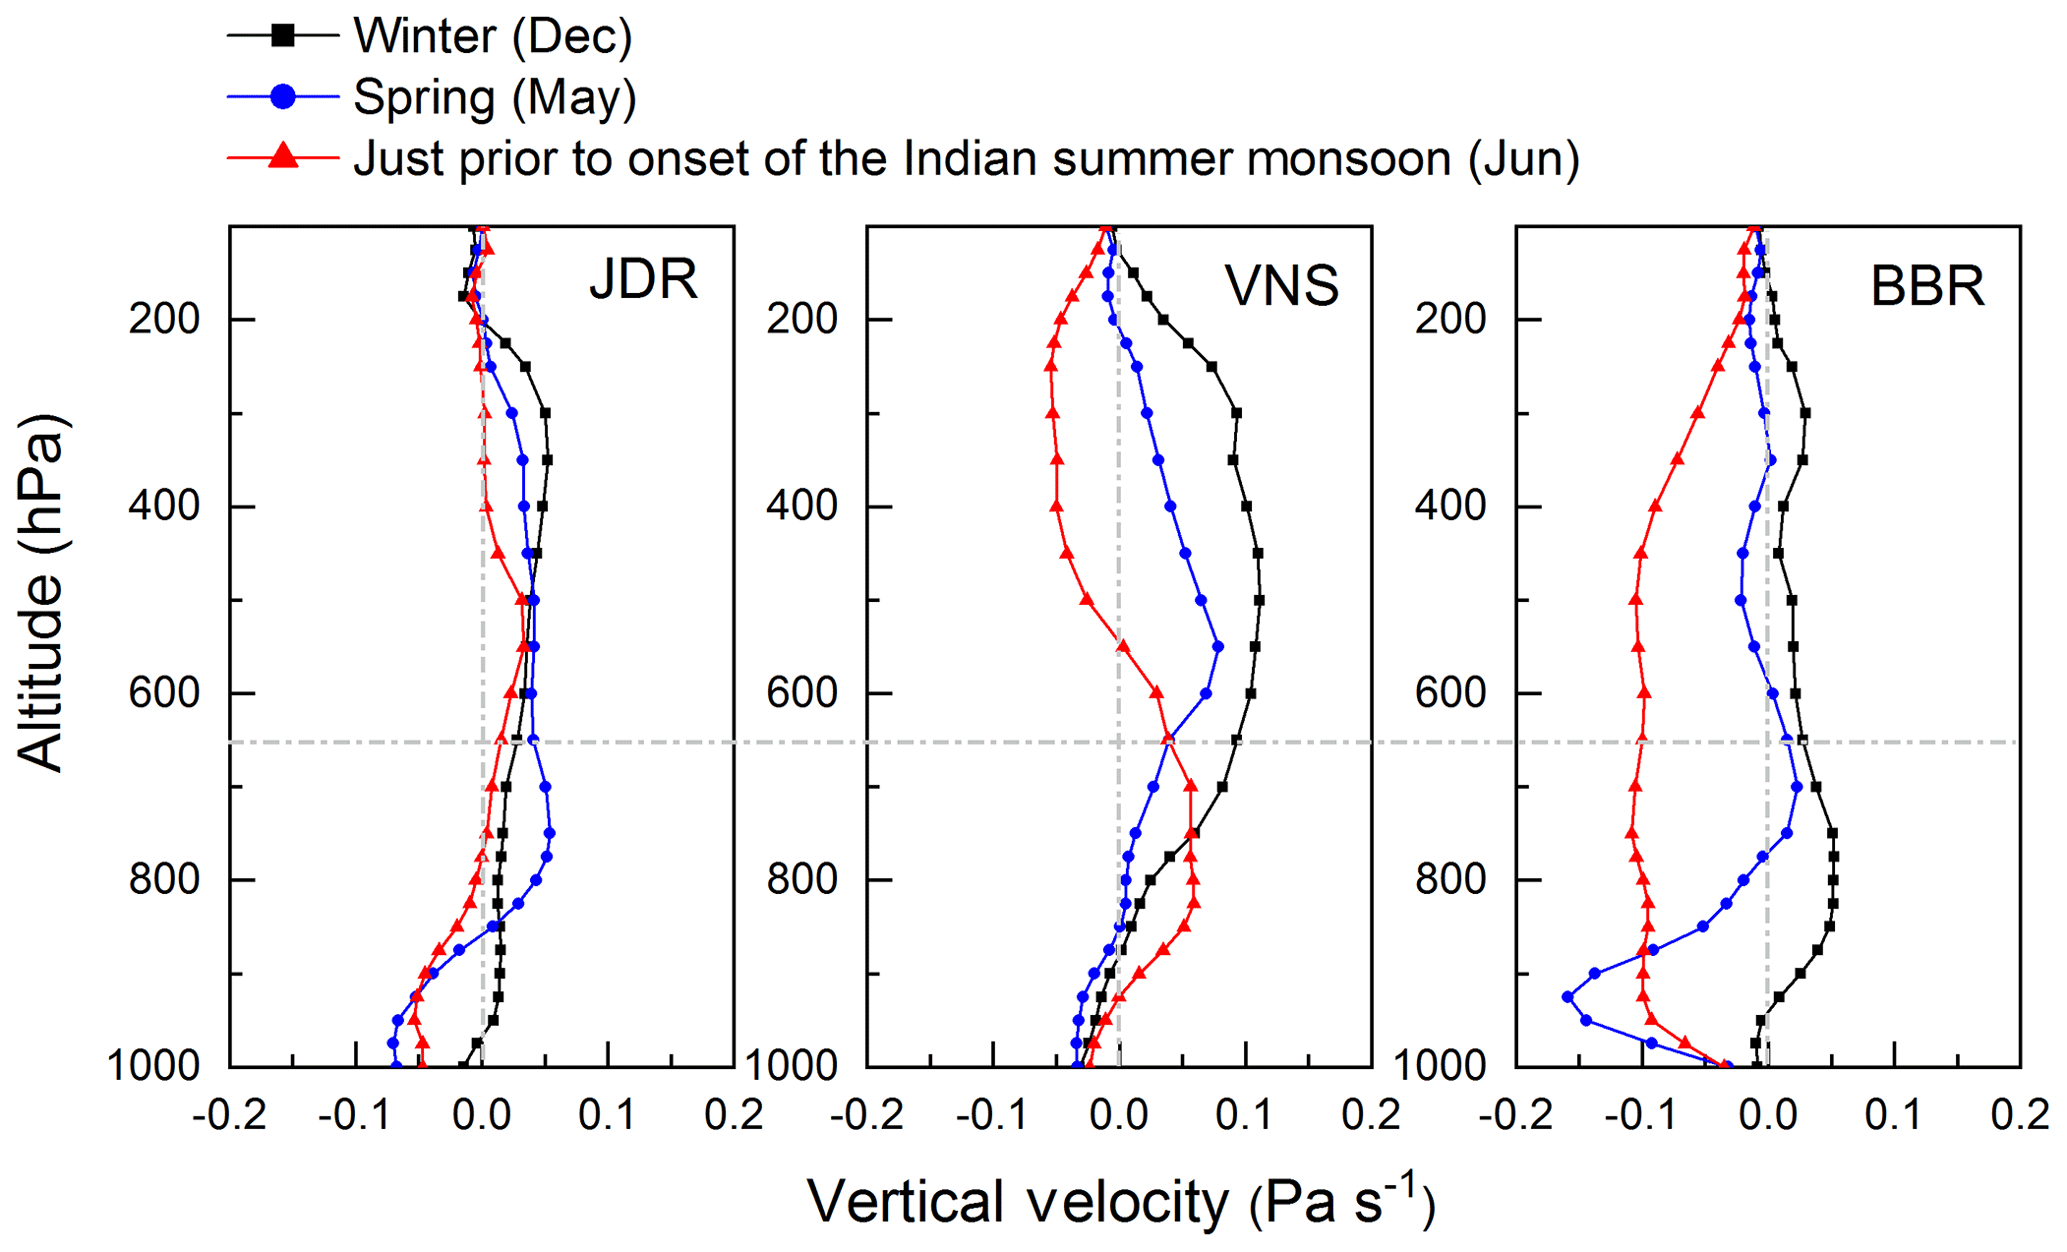
Figure 16Vertical profiles of vertical velocity (Pa s−1) over the study locations representing winter (December 2012), spring (May 2013) and just prior to the onset of the Indian summer monsoon (June 2016) at different pressure levels from 1000 to 100 hPa. The positive and negative values are indicative of the descending and ascending motions, respectively. The horizontal dashed line indicated the ceiling altitude (∼3.5 km above ground level) of aircraft measurements while the vertical dashed lines mark the boundary of vertical velocity (=0) changing from positive to negative and vice versa.
Regionally, the seasonal transformation of vertical velocity is more prominent over the eastern IGP BBR, where the magnitude of vertical velocity is consistently higher from surface to upper-tropospheric regions prior to the onset of the monsoon. During this period, the head of the Bay of Bengal is known to be one of the regions where deep convection exists (Bhat et al., 2001). Since size distribution is a dominant factor in determining the direct radiative forcing (Tegen and Lacis, 1996; Liao and Seinfeld, 1998; Seinfeld et al., 2016), a clear seasonal change in the altitudinal variations in aerosol type and size distributions associated with distinct transport and convective processes will have a strong radiative impact. In particular the columnar distribution of coarse mode dust and highly absorbing BC needs explicit representations in climate models for accurate understanding of the net top-of-atmosphere (TOA) direct radiative forcing. Apart from the direct radiative implications, abundance of coarse mode dust particles (having sizes larger than critical diameter) and aged BC (coated with hygroscopic materials) in the lower free troposphere can act as CCN in a supersaturated environment. Recent studies suggest that mineral aerosols are the dominant IN for cirrus clouds (Storelvmo and Herger, 2014).
Extensive airborne measurements of aerosol number–size distribution profiles are carried out, for the first time across the IGP prior to the onset of the Indian summer monsoon as part of the South-West Asian Aerosol–Monsoon Interactions and Regional Aerosol Warming Experiment (SWAAMI–RAWEX), a joint India–UK field experiment. Collocated measurements of BC profiles are also carried out. The main findings are as follows.
Aerosol size distribution depicted significant altitudinal variation in the coarse mode regime, having the highest coarse mode mass fraction (72 %) near the surface at the western IGP (represented by Jodhpur – JDR), while BC mass fractions (FBC) as well as aerosol accumulation and coarse mode number concentrations (NAC) remained nearly steady from the surface to the ceiling altitude (∼3.5 km) of the aircraft measurements. However, the pattern was significantly different at the eastern IGP (represented by Bhubaneswar – BBR) transforming to gradually decreasing values of coarse mode mass concentration (MC) and NAC, but with a corresponding increase in the values of FBC with altitude. At subregional scales, BBR depicted higher spatial (vertical) heterogeneity in the above aerosol characteristics, while the highest homogeneity was observed at JDR.
Number concentrations showed dominance of the accumulation mode near the surface, with the central IGP (represented by Varanasi – VNS) depicting the highest values NAC (FBC∼15 %), while the coarse mode remained nearly steady throughout the vertical column.
Atmospheric heating rate due to BC is highest near the surface at VNS (∼0.81 K d−1), while showing an increasing pattern with altitude at BBR (∼0.35 K d−1 at the ceiling altitude).
Our measurements, supplemented with information from different spaceborne sensors (Cloud Aerosol Transportation System – CATS aboard International Space Station – ISS and Ozone Monitoring Instrument – OMI on board the Aura satellite) and model results clearly indicated the role of mineral dust, both locally generated and advected from the west Asian region, in contributing to the aerosol loading across the IGP, especially at free-tropospheric altitudes. The vertical extents of these layers reached as high as 5 km during the period of observation.
Data are available upon request from Surendran Nair Suresh Babu (s_sureshbabu@vssc.gov.in).
The supplement related to this article is available online at: https://doi.org/10.5194/acp-20-8593-2020-supplement.
SNSB, SKS and KKM conceptualized the experiment and finalized the methodology. SNSB, MMG, VNJ and AV conducted the measurement on board aircraft. MMG carried out the scientific analysis of the aircraft data and drafted the manuscript with contributions from AV and VNJ. KKM, SKS and SNSB carried out the review and editing of the manuscript.
The authors declare that they have no conflict of interest.
This article is part of the special issue “Interactions between aerosols and the South West Asian monsoon”. It is not associated with a conference.
This study was a part of joint India–UK field campaign, South-West Asian Aerosol–Monsoon Interactions and Regional Aerosol Warming Experiment (SWAAMI–RAWEX). The aircraft and the flying support were provided by National Remote Sensing Centre (NRSC), Hyderabad. Sreedharan Krishnakumari Satheesh would like to acknowledge the J. C. Bose Fellowship awarded to him by SERB-DST. Aditya Vaishya was supported by the Department of Science and Technology, Government of India, through its INSPIRE Faculty program. We acknowledge the CATS science team for providing valuable data sets (freely) for scientific applications.
The RAWEX project is supported by ISRO (Indian Space Research Organisation), and the SWAAMI project is supported by MoES (Ministry of Earth Science), Government of India.
This paper was edited by B. V. Krishna Murthy and reviewed by two anonymous referees.
Arnott, W. P., Hamasha, K., Moosmuller, H., Sheridan, P. J., and Ohren, J. A.: Towards aerosol light-absorption measurements with a 7-wavelength aethalometer: Evaluation with a photoacoustic instrument and 3-wavelength nephelometer, Aerosol Sci. Tech., 39, 17–29, 2005.
Babu, S. S., Nair, V. S., Gogoi, M. M., and Moorthy, K. K.: Seasonal variation of vertical distribution of aerosol single scattering albedo over Indian sub-continent: RAWEX aircraft observations, Atmos. Environ., 125, 312–323, https://doi.org/10.1016/j.atmosenv.2015.09.041, 2016.
Banerjee, P., Satheesh, S. K., Moorthy, K. K., Nanjundiah, R. S., and Nair, V. S.: Long-range transport of mineral dust to the Northeast Indian Ocean: regional versus remote sources and the implications, J. Climate, 32, 1525–1549, https://doi.org/10.1175/JCLI-D-18-0403.1, 2019.
Bansal, O., Singh, A., and Singh, D.: Aerosol Characteristics over the Northwestern Indo-Gangetic Plain: Clear-Sky Radiative Forcing of Composite and Black Carbon Aerosol, Aerosol Air Qual. Res., 19, 5–14, 2019.
Bhat, G. S., Gadgil, S., Kumar, P. V. S., Kalsi, S. R., Madhusoodanan, P., Murty, V. S. N., Rao, V. V. K. P., Babu, V. R., Rao, L. V. G., Rao, R. R., Ravichandran, R., Reddy, K. G., Rao, P. S., Sengupta, D., Sikka, D. R., Swain, J., and Vinayachandran, P. N.: BOBMEX: The Bay of Bengal Monsoon Experiment, B. Am. Meteorol. Soc., 82, 2217–2243, 2001.
Bhattu, D., Tripathi, S., and Chakraborty, A.: Deriving aerosol hygroscopic mixing state from size-resolved ccn activity and HR-TOF-AMS measurements, Atmos. Environ., 142, 57–70, 2016.
Brooks, J., Allan, J. D., Williams, P. I., Liu, D., Fox, C., Haywood, J., Langridge, J. M., Highwood, E. J., Kompalli, S. K., O'Sullivan, D., Babu, S. S., Satheesh, S. K., Turner, A. G., and Coe, H.: Vertical and horizontal distribution of submicron aerosol chemical composition and physical characteristics across northern India during pre-monsoon and monsoon seasons, Atmos. Chem. Phys., 19, 5615–5634, https://doi.org/10.5194/acp-19-5615-2019, 2019.
Corrigan, C. E., Ramanathan, V., and Schauer, J. J.: Impact of monsoon transitions on the physical and optical properties of aerosols, J. Geophys. Res., 111, D18208, https://doi.org/10.1029/2005JD006370, 2006.
Drinovec, L., Močnik, G., Zotter, P., Prévôt, A. S. H., Ruckstuhl, C., Coz, E., Rupakheti, M., Sciare, J., Müller, T., Wiedensohler, A., and Hansen, A. D. A.: The ”dual-spot” Aethalometer: an improved measurement of aerosol black carbon with real-time loading compensation, Atmos. Meas. Tech., 8, 1965–1979, https://doi.org/10.5194/amt-8-1965-2015, 2015.
GAINS (Greenhouse Gas and Air Pollution Interactions and Synergies): Scenarios for cost-effective control of air pollution and greenhouse gases in India, International Institute of Applied Systems Analysis, Laxenburg, Austria, 2010.
Gautam, R., Hsu, N. C., and Lau, K. M.: Premonsoon aerosol characterization and radiative effects over the Indo-Gangetic Plains: Implications for regional climate warming, J. Geophys. Res., 115, D17208, https://doi.org/10.1029/2010JD013819, 2010.
Gautam, R., Hsu, N. C., Tsay, S. C., Lau, K. M., Holben, B., Bell, S., Smirnov, A., Li, C., Hansell, R., Ji, Q., Payra, S., Aryal, D., Kayastha, R., and Kim, K. M.: Accumulation of aerosols over the Indo-Gangetic plains and southern slopes of the Himalayas: distribution, properties and radiative effects during the 2009 pre-monsoon season, Atmos. Chem. Phys., 11, 12841–12863, https://doi.org/10.5194/acp-11-12841-2011, 2011.
Giles, D. M., Holben, B. N., Eck, T. F., Sinyuk, A., Smirnov, A., Slutsker, I., Dickerson, R. R., Thompson, A. M., and Schafer, J. S.: An analysis of AERONET aerosol absorption properties and classifications representative of aerosol source regions, J. Geophys. Res., 117, D17203, https://doi.org/10.1029/2012JD018127, 2012.
Gogoi, M. M., Babu, S. S., Moorthy, K. K., Bhuyan, P. K., Pathak, B., Subba, T., Chutia, L., Kundu, S. S., Bharali, C., Borgohain, A., Guha, A., De, B. K., Singh, B., and Chin, M.: Radiative effects of absorbing aerosols over northeastern India: Observations and model simulations, J. Geophys. Res., 122, 1–26, https://doi.org/10.1002/2016JD025592, 2017.
Gogoi, M. M., Lakshmi, N. B., Nair, V. S., Kompalli, S. K., Moorthy, K. K., and Babu, S. S.: Seasonal contrast in the vertical profiles of aerosol number concentrations and size distributions over India: implications from RAWEX aircraft campaign, J. Earth Sys. Sc., 128, 225, https://doi.org/10.1007/s12040-019-1246-y, 2019.
Govardhan, G., Satheesh, S. K., Moorthy, K. K., and Nanjundiah, R.: Simulations of black carbon over the Indian region: improvements and implications of diurnality in emissions, Atmos. Chem. Phys., 19, 8229–8241, https://doi.org/10.5194/acp-19-8229-2019, 2019.
Guttikunda, S. K. and Jawahar, P.: Atmospheric emissions and pollution from the coal-fired thermal power plants in India, Atmos. Environ., 92, 449–460, https://doi.org/10.1016/j.atmosenv.2014.04.057, 2014.
Hopkins, R. J., Tivanski, A. V., Marten, B. D., and Gilles, M. K.: Chemical bonding and structure of black carbon reference materials and individual carbonaceous atmospheric aerosols, J. Aerosol Sci. 38, 573–591, 2007.
Jayachandran, V. N., Suresh Babu, S. N., Vaishya, A., Gogoi, M. M., Nair, V. S., Satheesh, S. K., and Krishna Moorthy, K.: Altitude profiles of cloud condensation nuclei characteristics across the Indo-Gangetic Plain prior to the onset of the Indian summer monsoon, Atmos. Chem. Phys., 20, 561–576, https://doi.org/10.5194/acp-20-561-2020, 2020.
Kedia, S., Ramachandran, S., Holben, B. N., and Tripathi, S. N.: Quantification of aerosol type, and sources of aerosols over the Indo-Gangetic Plain, Atmos. Environ., 98, 607–619, 2014.
Kirchstetter, T. W., Novakov, T., and Hobbs, P. V.: Evidence that the spectral dependence of light absorption byaerosols is affected by organic carbon, J. Geophys. Res., 109, D21208, https://doi.org/10.1029/2004JD004999, 2004.
Kulkarni, J. R., Maheskumar, R. S., Morwal, S. B., Padma Kumari, B., Konwar, M., Deshpande, C. G., Joshi, R. R., Bhalwankar, R. V., Pandithurai, G., Safai, P. D., Narkhedkar, S. G., Dani, K. K., Nath, A., Nair, S., Sapre, V. V., Puranik, P. V., Kandalgaonkar, S., Mujumdar, V. R., Khaladkar, R. M., Vijayakumar, R., Prabha, T. V., and Goswami, B. N.: The Cloud Aerosol Interactions and Precipitation Enhancement Experiment (CAIPEEX): Overview and Preliminary Results, Curr. Sci. India, 102, 413–425, 2012.
Kumar, M., Parmar, K. S., Kumar, D. B., Mhawish, A., Broday, D. M., Malla, R. K., and Banerjeea, T.: Long-term aerosol climatology over Indo-Gangetic Plain: Trend, prediction and potential source fields, Atmos. Environ., 180, 37–50, 2018.
Lee, L., Zhang, J., Reid, J. S., and Yorks, J. E.: Investigation of CATS aerosol products and application toward global diurnal variation of aerosols, Atmos. Chem. Phys., 19, 12687–12707, https://doi.org/10.5194/acp-19-12687-2019, 2019.
Levelt, P. F., van den Oord, G. H. J., Dobber, M. R., Mälkki, A., Visser, H., de Vries, J., Stammes, P., Lundell, J. O. V., and Saari, H.: The Ozone Monitoring Instrument, IEEE T. Geosci. Remote, 44, 1093–1101, https://doi.org/10.1109/TGRS.2006.872333, 2006.
Li, Z., Lau, W. K. M., Ramanathan, V., Wu, G., Ding, Y., Manoj, M. G., Liu, J., Qian, Y., Li, J., Zhou, T., Fan, J., Rosenfeld, D., Ming, Y., Wang, Y., Huang, J., Wang, B., Xu, X., Lee, S. S., Cribb, M., Zhang, F., Yang, X., Zhao, C., Takemura, T., Wang, K., Xia, X., Yin, Y., Zhang, H., Guo, J., Zhai, P. M., Sugimoto, N., Babu, S. S., and Brasseur, G. P.: Aerosol and monsoon climate interactions over Asia, Aerosol and monsoon climate interactions over Asia, Rev. Geophys., 54, 866–929, https://doi.org/10.1002/2015RG000500, 2016.
Liao, H. and Seinfeld, J. H.: Radiative forcing by mineral dust aerosols: Sensitivity to key variables, J. Geophys. Res., 103, 31637–31645, 1998.
Mhawish, A., Banerjeea, T., Broday, D. M., Misra, A., and Tripathi, S. N.: Evaluation of MODIS Collection 6 aerosol retrieval algorithms over Indo-Gangetic Plain: Implications of aerosols types and mass loading, Remote Sens. Environ., 201, 297–313, 2017.
Miller, R. L., Cakmur, R. V., Perlwitz, J. P., Geogdzhayev, I. V., Ginoux, P., Kohfeld, K. E., Koch, D., Prigent, C., Ruedy, R., Schmidt, G. A., and Tegen, I.: Mineral dust aerosols in the NASA Goddard Institute for Space Sciences ModelE atmospheric general circulation model, J. Geophys. Res., 111, D06208, https://doi.org/10.1029/2005JD005796, 2006.
Mitchell, J. P. and Nagel, M. W.: Time-of-flight aerodynamic particle size analysers: their use and limitations for the evaluation of medical aerosols, J. Aerosol Med., 12, 217–240, 1999.
Moorthy, K. K., Satheesh, S. K., and Murthy, B. V. K.: Characteristics of spectral optical depths and size distributions of aerosols over tropical oceanic regions, J. Atmos. Sol.-Terr. Phy., 60, 981–992, 1998.
Moorthy, K. K., Babu, S. S., Sunilkumar, S. V., Gupta, P. K., and Gera, B. S.: Altitude profiles of aerosol BC, derived from aircraft measurements over an inland urban location in India, Geophys. Res. Lett., 31, L22103, https://doi.org/10.1029/2004GL021336, 2004.
Moorthy, K. K., Babu, S. S., Satheesh, S. K., Srinivasan, J., and Dutt, C. B. S.: Dust absorption over the “Great Indian Desert” inferred using ground-based and satellite remote sensing, J. Geophys. Res., 112, D09206, https://doi.org/10.1029/2006JD007690, 2007.
Moorthy, K. K., Satheesh, S. K., and Kotamarthi, V. R.: Evolution of aerosol research in India and the RAWEX–GVAX: an overview, Curr. Sci. India, 111, 53–75, https://doi.org/10.18520/cs/v111/i1/53-75, 2016.
Nair, V. S., Babu, S. S., Gogoi, M. M., and Moorthy, K. K.: Large-scale enhancement in aerosol absorption in the lower free troposphere over continental India during spring, Geophys. Res. Lett., 43, 11453–11461, https://doi.org/10.1002/2016GL070669, 2016.
Nath, R., Luo, Y., Chen, W., and Cui, X.: On the contribution of internal variability and external forcing factors to the Cooling trend over the Humid Subtropical Indo-Gangetic Plain in India, Sci. Rep., 8, 18047, https://doi.org/10.1038/s41598-018-36311-5, 2018.
Padmakumari, B., Maheskumar, R. S., Harikishan, G., Morwal, S. B., Prabha, T. V., and Kulkarni, J. R.: In situ measurements of aerosol vertical and spatial distributions over continental India during the major drought year 2009, Atmos. Environ., 80, 107–121, 2013.
Panda, U. and Das, T.: Micro-structural analysis of individual aerosol coarse particles during different seasons at an eastern coastal site in India, Atmos. Pollut. Res., 8, 196–207, https://doi.org/10.1016/j.apr.2016.08.012, 2016.
Pandey, S. K., Vinoj, V., Landu, K., and Babu, S. S.: Declining pre-monsoon dust loading over South Asia: Signature of a changing regional climate, Sci. Rep., 7, 16062, https://doi.org/10.1038/s41598-017-16338-w, 2017.
Pillai, P. S. and Moorthy, K. K.: Aerosol mass-size distributions at a tropical coastal environment: Response to mesoscale and synoptic processes, Atmos. Environ., 35, 4099–4112, 2001.
Praveen, P. S., Ahmed, T., Kar, A., Rehman, I. H., and Ramanathan, V.: Link between local scale BC emissions in the Indo-Gangetic Plains and large scale atmospheric solar absorption, Atmos. Chem. Phys., 12, 1173–1187, https://doi.org/10.5194/acp-12-1173-2012, 2012.
Rana, A., Jia, S., and Sarkar, S.: Black carbon aerosol in India: A comprehensive review of current status and future prospects, Atmos. Res., 218, 207–230, 2019.
Ricchiazzi, P., Yang, S., Gautier, C., and Sowle, D.: SBDART: A research and teaching software tool for plane-parallel radiative transfer in the Earth's atmosphere, B. Am. Meteorol. Soc., 79, 2101–2114, 1998.
Sahu, S. K., Ohara. T., and Beig, G.: The role of coal technology in redefining India's climate change agents and other pollutants, Environ. Res. Lett., 12, 105006, https://doi.org/10.1088/1748-9326/aa814a, 2017.
Seinfeld, J. H., Bretherton, C., Carslaw, K. S., Coe, H., DeMott, P. J., Dunlea, E. J., Feingold, G., Ghan, S., Guenther, A. B., Kahn, R., Kraucunas, I., Kreidenweis, S. M., Molinal, M. J., Nenes, A., Penner, J. E., Prather, K. A., Ramanathan, V., Ramaswamy, V., Rasch, P. J., Ravishankara, A. R., Rosenfeld, D., Stephens, G., and Wood, R.: Improving our fundamental understanding of the role of aerosol-cloud interactions in the climate system, P. Natl. Acad. Sci. USA, 113, 5781–5790, 2016.
Singh, A., Mahata, K. S., Rupakheti, M., Junkermann, W., Panday, A. K., and Lawrence, M. G.: An overview of airborne measurement in Nepal – Part 1: Vertical profile of aerosol size, number, spectral absorption, and meteorology, Atmos. Chem. Phys., 19, 245–258, https://doi.org/10.5194/acp-19-245-2019, 2019.
Srivastava, R.: Trends in aerosol optical properties over South Asia, Int. J. Climatol., 37, 371–380, https://doi.org/10.1002/joc.4710, 2016.
Storelvmo, T. and Herger, N.: Cirrus cloud susceptibility to the injection of ice nuclei in the upper troposphere, J. Geophys. Res., 119, 2375–2389, https://doi.org/10.1002/2013JD020816, 2014.
Tegen, I. and Lacis, A. A.: Modelling of particle size distribution and its influence on the radiative properties of mineral dust aerosol, J. Geophys. Res., 101, 19237–19244 1996.
Tiwari, M. K., Bajpai, S., and Dewangan, U. K.: Environmental Issues in Thermal Power Plants – Review in Chhattisgarh Context, J. Mater. Environ. Sci., 10, 1123–1134, 2019.
Vadrevu, K. P., Ellicott, E., Badarinath, K. V. S., and Vermote, E.: MODIS derived fire characteristics and aerosol optical depth variations during the agricultural residue burning season, north India, Environ. Pollut., 159, 1560–1569, 2011.
Vaishya, A., Singh, P., Rastogi, S., and Babu, S. S.: Aerosol black carbon quantification in the central Indo-Gangetic Plain: Seasonal heterogeneity and source apportionment, Atmos. Res., 185, 13–21, https://doi.org/10.1016/j.atmosres.2016.10.001, 2017.
Vaishya, A., Babu, S. N. S., Jayachandran, V., Gogoi, M. M., Lakshmi, N. B., Moorthy, K. K., and Satheesh, S. K.: Large contrast in the vertical distribution of aerosol optical properties and radiative effects across the Indo-Gangetic Plain during the SWAAMI–RAWEX campaign, Atmos. Chem. Phys., 18, 17669–17685, https://doi.org/10.5194/acp-18-17669-2018, 2018.
Venkataraman, C., Habib, G., Kadamba, D., Shrivastava, M., Leon, J. F., Crouzille, B., Boucher, O., and Streets, D. G.: Emissions from open biomass burning in India: Integrating the inventory approach with high-resolution Moderate Resolution Imaging Spectroradiometer (MODIS) active-fire and land cover data, Global Biogeochem. Cy., 20, GB2013, https://doi.org/10.1029/2005GB002547, 2006.
Venkataraman, C., Brauer, M., Tibrewal, K., Sadavarte, P., Ma, Q., Cohen, A., Chaliyakunnel, S., Frostad, J., Klimont, Z., Martin, R. V., Millet, D. B., Philip, S., Walker, K., and Wang, S.: Source influence on emission pathways and ambient PM2.5 pollution over India (2015–2050), Atmos. Chem. Phys., 18, 8017–8039, https://doi.org/10.5194/acp-18-8017-2018, 2018.
Vipradas, M., Babu, Y. D., Garud, S., and Kumar, A.: Preparation of road map for mainstreaming wind energy in India, TERI project report No. 2002RT66, The Energy and Resources Institute, New Delhi, India, 2004.
Weingartner, E., Saathoff, H., Schnaiter, M., Streit, N., Bitnar, B., and Baltensperger, U.: Absorption of light by soot particles: Determination of the absorption coefficient by means of aethalometers, J. Aerosol Sci., 34, 1445–1463, 2003.
Yorks, J. E., McGill, M. J., Scott, V. S., Wake, S. W., Kupchock, A., Hlavka, D. L., Hart, W. D., and Selmer, P. A.: The Airborne Cloud–Aerosol Transport System: Overview and Description of the Instrument and Retrieval Algorithms, J. Atmos. Ocean. Tech., 31, 2482–2497, https://doi.org/10.1175/JTECH-D-14-00044.1, 2014.
Yorks, J. E.., McGill, M. J., Palm, S. P., Hlavka, D. L., Selmer, P. A., Nowottnick, E. P., Vaughan, M. A., Rodier, S. D., and Hart, W. D.: An overview of the CATS level 1 processing algorithms and data products, Geophys. Res. Lett., 43, 4632–4639, https://doi.org/10.1002/2016GL068006, 2016.