the Creative Commons Attribution 4.0 License.
the Creative Commons Attribution 4.0 License.
 | 22 Jul 2020
Particle number concentrations and size distribution in a polluted megacity: the Delhi Aerosol Supersite study
Shahzad Gani
Sahil Bhandari
Kanan Patel
Sarah Seraj
Prashant Soni
Zainab Arub
Gazala Habib
Lea Hildebrandt Ruiz
The Indian national capital, Delhi, routinely experiences some of the world's highest urban particulate matter concentrations. While fine particulate matter (PM2.5) mass concentrations in Delhi are at least an order of magnitude higher than in many western cities, the particle number (PN) concentrations are not similarly elevated. Here we report on 1.25 years of highly time-resolved particle size distribution (PSD) data in the size range of 12–560 nm. We observed that the large number of accumulation mode particles – that constitute most of the PM2.5 mass – also contributed substantially to the PN concentrations. The ultrafine particle (UFP; Dp<100 nm) fraction of PNs was higher during the traffic rush hours and for daytimes of warmer seasons, which is consistent with traffic and nucleation events being major sources of urban UFPs. UFP concentrations were found to be relatively lower during periods with some of the highest mass concentrations. Calculations based on measured PSDs and coagulation theory suggest UFP concentrations are suppressed by a rapid coagulation sink during polluted periods when large concentrations of particles in the accumulation mode result in high surface area concentrations. A smaller accumulation mode for warmer months results in an increased UFP fraction, likely owing to a comparatively smaller coagulation sink. We also see evidence suggestive of nucleation which may also contribute to the increased UFP proportions during the warmer seasons. Even though coagulation does not affect mass concentrations, it can significantly govern PN levels with important health and policy implications. Implications of a strong accumulation mode coagulation sink for future air quality control efforts in Delhi are that a reduction in mass concentration, especially in winter, may not produce a proportional reduction in PN concentrations. Strategies that only target accumulation mode particles (which constitute much of the fine PM2.5 mass) may even lead to an increase in the UFP concentrations as the coagulation sink decreases.
- Article
(6238 KB) - Companion paper
-
Supplement
(2845 KB) - BibTeX
- EndNote


Outdoor air pollution has detrimental health effects (Pope and Dockery, 2006; Schraufnagel et al., 2019a) and is responsible for more than 4 million deaths globally every year (Cohen et al., 2017), resulting in substantial global and regional decrements in life expectancy (Apte et al., 2018). There has been a continued growth in megacities (population >10 million), and as of 2018 there are 47 megacities (United Nations, 2018). Many of the lower-income megacities experience persistently severe air pollution problems, and Delhi (population: 28 million) routinely experiences the highest annual average fine particle mass (PM2.5) concentrations of any megacity in the world (World Health Organization, 2018). In addition to aerosol mass, there is now growing evidence of potential health risks associated with ultrafine particles (UFP; Dp<100 nm). These particles can penetrate and deposit deep within the lungs, may enter the bloodstream, and can reach sensitive internal organs (Yeh and Schum, 1980; Oberdörster et al., 2005; Salma et al., 2015; Schraufnagel et al., 2019b). While UFPs scarcely contribute to aerosol mass (PM), they have been observed to dominate particle number (PN) concentrations observed in urban environments (Hussein et al., 2004; Rodríguez et al., 2007; Wu et al., 2008).
Atmospheric particle size distributions (PSDs) are often categorized by the nucleation mode (3–25 nm), the Aitken mode (25–100 nm), and the accumulation mode (100–1000 nm). UFPs include both the nucleation and the Aitken modes. Most of the PM2.5 mass is usually contributed by the accumulation mode particles, whereas UFPs constitute most of the PNs (Seinfeld and Pandis, 2006). Given that different modes of the PSDs contribute disproportionately to aerosol mass (accumulation mode for PM2.5) and aerosol number (UFPs for PNs) concentrations, PN concentrations do not necessarily share the same spatial or temporal dynamics as PM (Johansson et al., 2007; Puustinen et al., 2007; Reche et al., 2011). The accumulation mode particles in urban environments result from a wide range of anthropogenic sources (traffic, industrial, biomass burning, etc.), natural sources (wildfires, volcanoes, deserts, etc.), and chemical processing of gases and aerosol (Robinson et al., 2007; Zhang et al., 2007; Jimenez et al., 2009; Calvo et al., 2013). However, traffic (Zhu et al., 2002; Charron and Harrison, 2003; Fruin et al., 2008; Wehner et al., 2009), cooking (Saha et al., 2019; Abernethy et al., 2013), and new particle formation (Brines et al., 2015; Hofman et al., 2016) are generally considered the only major sources of urban UFPs.
In cities with high aerosol mass loadings (e.g., Beijing and Delhi), coagulation scavenging can be a major sink of UFPs – the numerous but smaller UFPs are “lost” to the fewer but larger particles that contribute most to the aerosol mass (Kerminen et al., 2001; Zhang and Wexler, 2002; Kulmala, 2003; Kulmala and Kerminen, 2008). Specifically, coagulation plays a crucial role in the rapid removal of freshly nucleated particles onto preexisting, larger particles (Kerminen et al., 2001; Kulmala, 2003). Short-term studies from Delhi have observed coagulation as a major sink for UFPs (Mönkkönen et al., 2004a, 2005), similar to observations from polluted cities in the USA in the 1970s (Husar et al., 1972; Whitby et al., 1972; Willeke and Whitby, 1975) and contemporary polluted cities in China (Cai and Jiang, 2017; Peng et al., 2014; Wu et al., 2008). Polluted megacities such as Delhi often experience aerosol mass concentrations that are an order of magnitude higher than those experienced in cities in high-income countries (Pant et al., 2015; Jaiprakash et al., 2017; Gani et al., 2019), yet PN concentrations are not high in similar proportions (Mönkkönen et al., 2004b; Apte et al., 2011).
As part of the Delhi Aerosol Supersite (DAS) study, we investigated Delhi′s aerosol chemical composition and its sources (Gani et al., 2019; Bhandari et al., 2020). Here we use long-term observations from Delhi to present seasonal and diurnal profiles of PSDs in this polluted megacity. We also provide insights into the phenomena – such as coagulation – that influence PSDs in Delhi and interpret their implications for future policy measures. This study has the potential to help understand processes that drive PSDs in other cities with similar sources and meteorology across the Indo-Gangetic Plain (Kumar et al., 2017; Singh et al., 2015) and is relevant for other highly polluted urban environments.
2.1 Sampling site
We installed a suite of high-time-resolution online aerosol measurement instrumentation at the Indian Institute of Technology Delhi (IIT Delhi) campus in South Delhi. The instruments were located on the top floor of a four-story building, and the nearest source of local emissions is an arterial road located 150 m away from the building. Delhi experiences a wide range of meteorological conditions with large diurnal and seasonal variations in temperature, relative humidity (RH), and wind speed, among other parameters (Fig. 1). Furthermore, shallow inversion layers also occur frequently, especially for cooler periods. The prevailing wind direction in Delhi is from the northwest, implying that the air we sampled would have traversed through ∼20 km of industrial, commercial, and residential areas in Delhi before reaching our site. We discussed the meteorology of Delhi in further detail in an earlier publication (Gani et al., 2019).
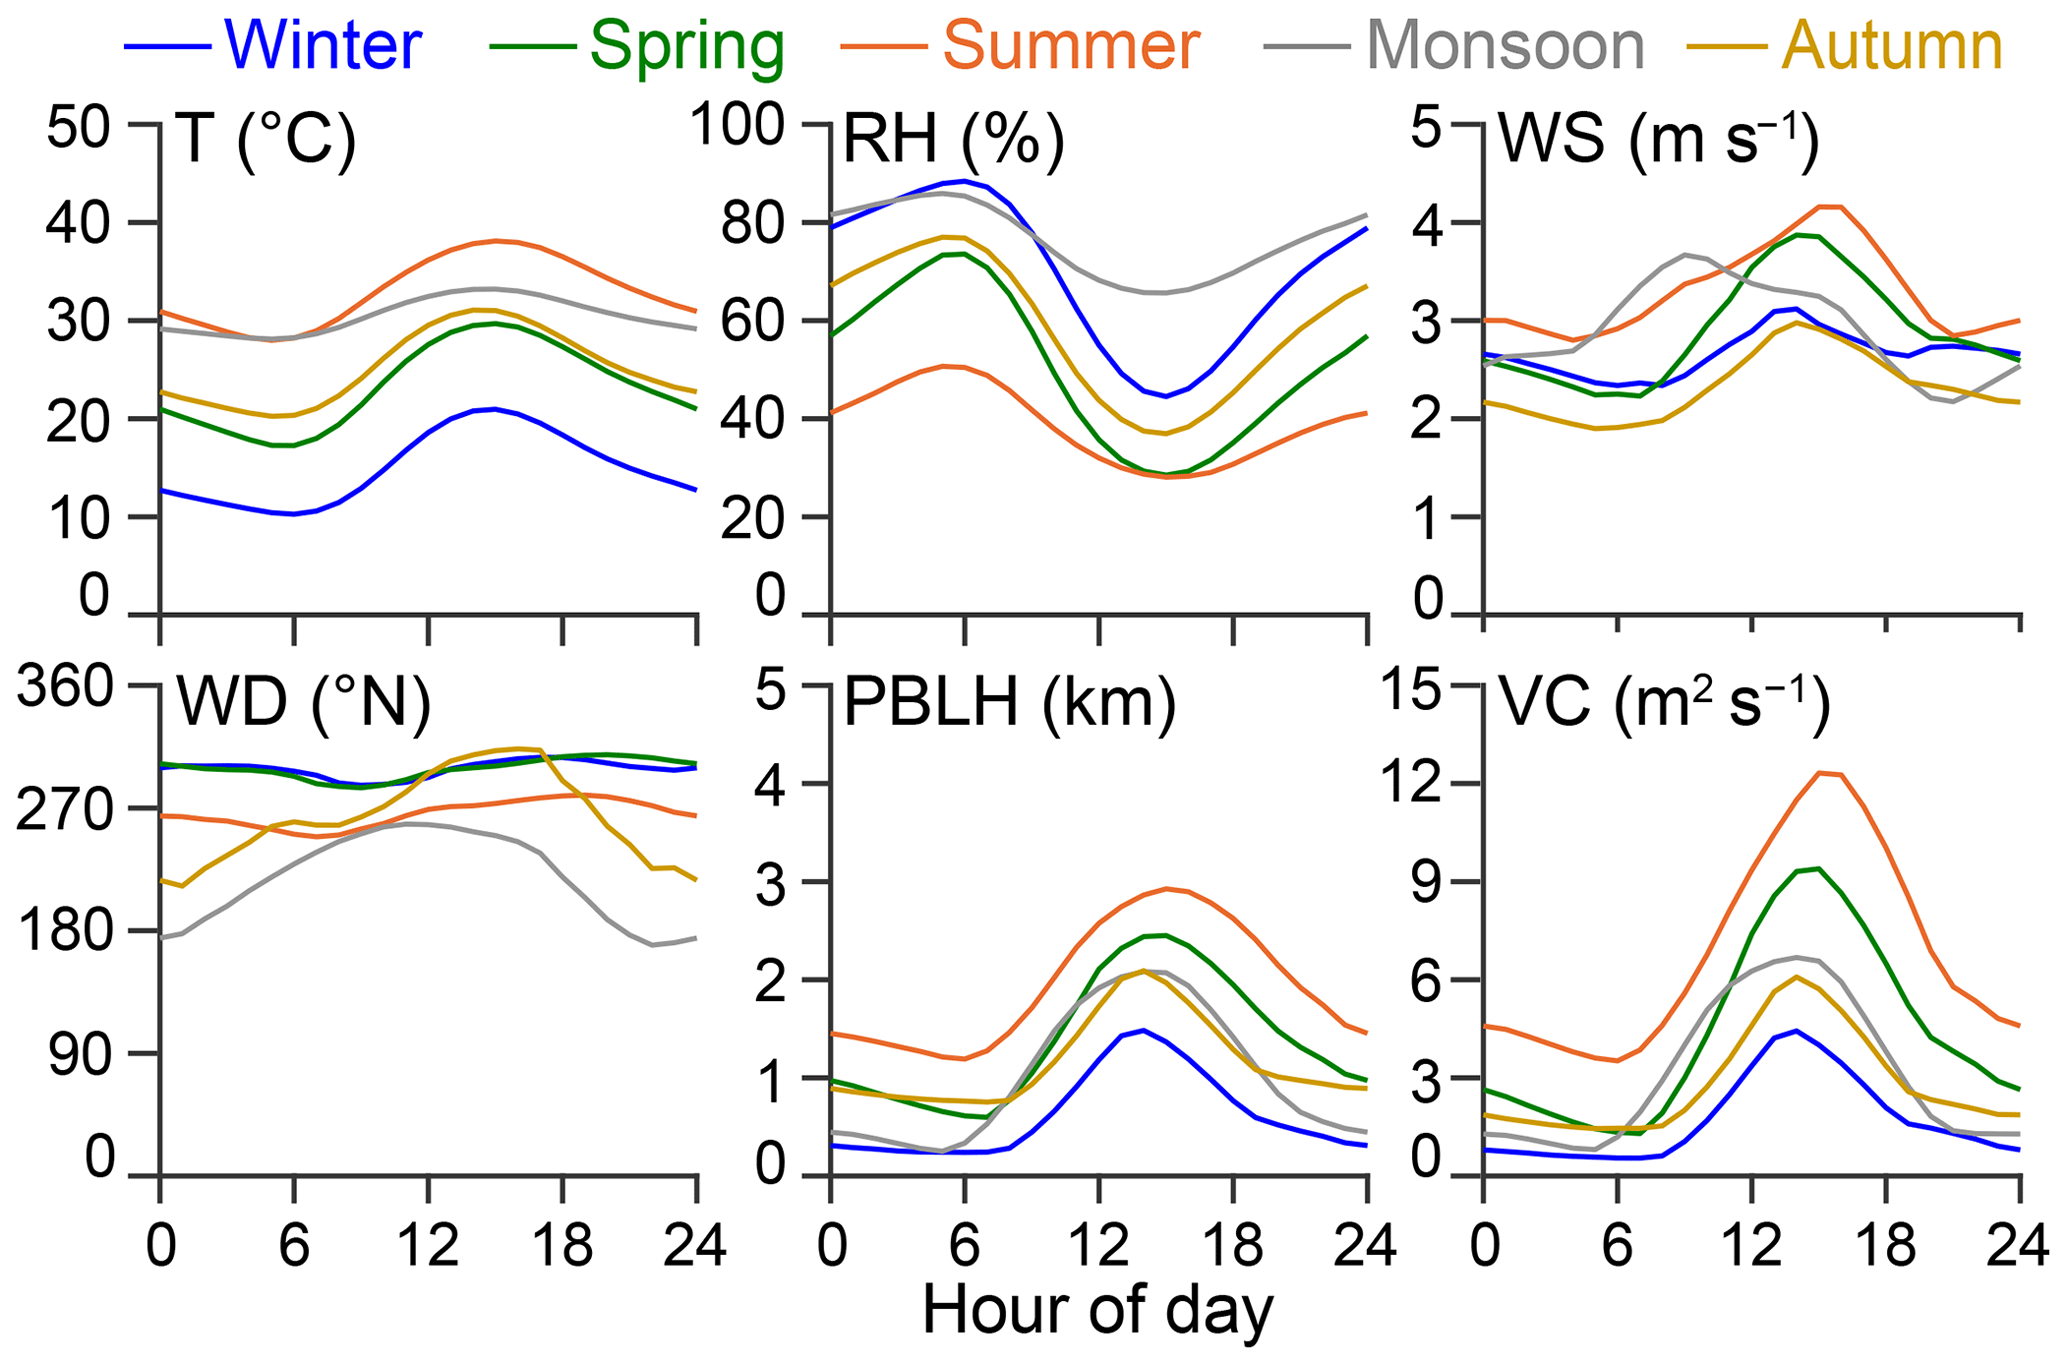
Figure 1Diurnal profiles of meteorological parameters (temperature, relative humidity, wind speed, wind direction, planetary boundary layer height (PBLH), and ventilation coefficient) by season. Average values by season and hour of day are presented for all parameters except wind direction. The median value is presented for wind direction. Ventilation coefficient (VC) = PBLH × wind speed.
2.2 Instrumentation and setup
We measured PSDs using a scanning mobility particle sizer (SMPS; TSI, Shoreview, Minnesota, USA) consisting of an electrostatic classifier (model 3080; TSI, Shoreview, Minnesota, USA), a differential mobility analyzer (DMA; model 3081; TSI, Shoreview, Minnesota, USA), an x-ray aerosol neutralizer (model 3088; TSI, Shoreview, Minnesota, USA), and a water-based condensation particle counter (CPC; model 3785; TSI, Shoreview, Minnesota, USA). Chemical composition of nonrefractory PM1 (NR–PM1) was obtained using an aerosol chemical speciation monitor (ACSM; Aerodyne Research, Inc., Billerica, Massachusetts, USA), and black carbon (BC) was measured using a multichannel Aethalometer (model AE33; Magee Scientific, Berkeley, California, USA). The inlet had a PM2.5 cyclone, followed by a water trap and a Nafion membrane diffusion dryer (sample stream dryer; Magee Scientific, Berkeley, California, USA). Further details of the instrumentation, sampling setup, and the data processing methodology for the instrumentation (SMPS, ACSM, and the Aethalometer) and meteorological parameters are provided in Gani et al. (2019).
2.3 Data processing and analysis
The SMPS at our site scanned from 12 to 560 nm with each subsequent scan being 135 s apart. We used the Aerosol Instrument Manager version 9.0 (TSI, Shoreview, Minnesota, USA) software for logging data from the SMPS (software sampling loss corrections turned off). We calculated the transmission efficiency for the DAS sampling line based on the diffusion (Ingham, 1975) and settling (Pich, 1972) losses. We correct the observed PSDs for these transmission efficiency losses and calculate the number concentrations (individual size modes and total) and the median diameter based on the updated PSDs. Multimodal lognormal fitting has been widely used to parameterize the PSDs (Whitby, 1978; Seinfeld and Pandis, 2006). The parameterization allows for a quantitative description of the PSDs and easier comparisons between different PSD datasets. Separating the various PSD modes can also help to understand the role of sources in driving each mode. We use a multimodal fitting technique described in Hussein et al. (2005) to estimate individual log normal modes of the PSDs (Sect. 3.6). We included PSD data from January 2017 to April 2018 in this study.
Studies from Asia have estimated aerosol densities in the range 1.3–1.6 g cm−3 (Sarangi et al., 2016; Hu et al., 2012). A previous study from Delhi used a density of 1.7 g cm−3 to estimate aerosol mass from their PSD observations (Laakso et al., 2006). Based on aerosol composition data, we estimated a density of ∼1.5 g cm−3 for the nonrefractory portion of the aerosol. However, that did not include the BC and metal component of the aerosol mass (we did not measure metals). We assume an overall average particle density of 1.6 g cm−3 as it provides a better mass closure (Gani et al., 2019) and is within the uncertainty bounds based on previous density estimates as well. We use this assumed density to estimate the mass in the observed PSDs (PM0.56), ultrafine particles (PMUFP) and accumulation mode particles (PMacc).
We calculated the Fuchs form of the Brownian coagulation coefficient (K12) using equations published by Seinfeld and Pandis (2006) and then estimated the characteristic coagulation timescale (τcoag,i) of a particle of any size onto particles of any size greater than that particle using the technique of Westerdahl et al. (2009). We calculate condensation sink (CS) for vapor condensing on the aerosol distribution following Kulmala et al. (2001, 1998) and the growth rate (GR) following Kulmala et al. (2012).
where Ki,j is the coagulation coefficient for particle in bin i of the PSDs coagulating with those in bin j, and Nj is the concentration of particles in bin j of the PSDs. D is the diffusion coefficient of the condensing vapor (we use H2SO4 for our calculations), β is the transitional correction factor, rp,i is the radius of a particle in bin i of the PSDs, and Ni is the concentration of particles in bin i of the PSDs. Dp1 and Dp2 are the diameters of the particles at times t1 and t2, respectively.
For our analysis, we categorize the seasons as winter (December to mid-February), spring (mid-February to March), summer (April to June), monsoon (July to mid-September), and autumn (mid-September to November) (Indian National Science Academy, 2018). We define the day as 07:00–19:00 and the night as 19:00–07:00. All times in this paper are local times recorded in Indian Standard Time (IST; GMT+05:30).
2.4 Limitations and uncertainties
Like most measurement studies, the limitations and the uncertainties of this study arise from instrumentation and the sampling system. While we have applied correction for diffusion and settling losses in our sampling system, future studies can reduce sampling losses and subsequent uncertainties – especially for ultrafine particles – by designing shorter sampling systems with higher flow rates. The SMPS used for the PSD measurements has a ∼30 % uncertainty for submicron aerosol (Buonanno et al., 2009). Furthermore, we only measure particles larger than 12 nm, potentially underestimating concentrations of nucleation mode particles. Our study does not provide any information on nanocluster aerosol (1–3 nm), which can contribute to a significant fraction of PN concentrations, and their detection is made possible by recent advances in aerosol measurement instrumentation (Rönkkö et al., 2017; Kontkanen et al., 2017; Kangasluoma and Attoui, 2019). Measuring the complete nucleation mode range along with these nascent nanoclusters can advance our knowledge of particle formation pathways and their subsequent growth that leads to high air pollution (Yao et al., 2018; Guo et al., 2014).
Another limitation of this study is that our measurements were limited to a single site and therefore do not capture the spatial variability within Delhi. UFP concentrations can be quite variable even within a small spatial domain (Saha et al., 2019; Puustinen et al., 2007), so it is likely that a megacity like Delhi with diverse local sources will have strong spatial variability in PSD and PN concentrations. Future studies can quantify this spatial variability by measuring PSDs at multiple fixed sites and using techniques such as mobile monitoring (e.g., Apte et al., 2017).
3.1 Particle number and mass concentrations
Delhi experiences large seasonal and diurnal variations in aerosol mass concentrations. In Gani et al. (2019), we showed that the wintertime submicron aerosol concentration was higher than spring and higher than the warmer months. In Fig. 2 we compare the seasonal changes in aerosol mass and PN concentrations. In contrast to the sharp seasonal variation in aerosol mass loadings, PN levels had much lower variability. The average PN levels were as follows: winter – 52 500 cm−3; spring – 49 000 cm−3; summer – 43 400 cm−3; the monsoon – 35 400 cm−3; and autumn – 38 000 cm−3. The differences in the variability of number and mass concentrations are potentially explained by the difference in the sources and processes that drive their concentrations (Sect. 1).
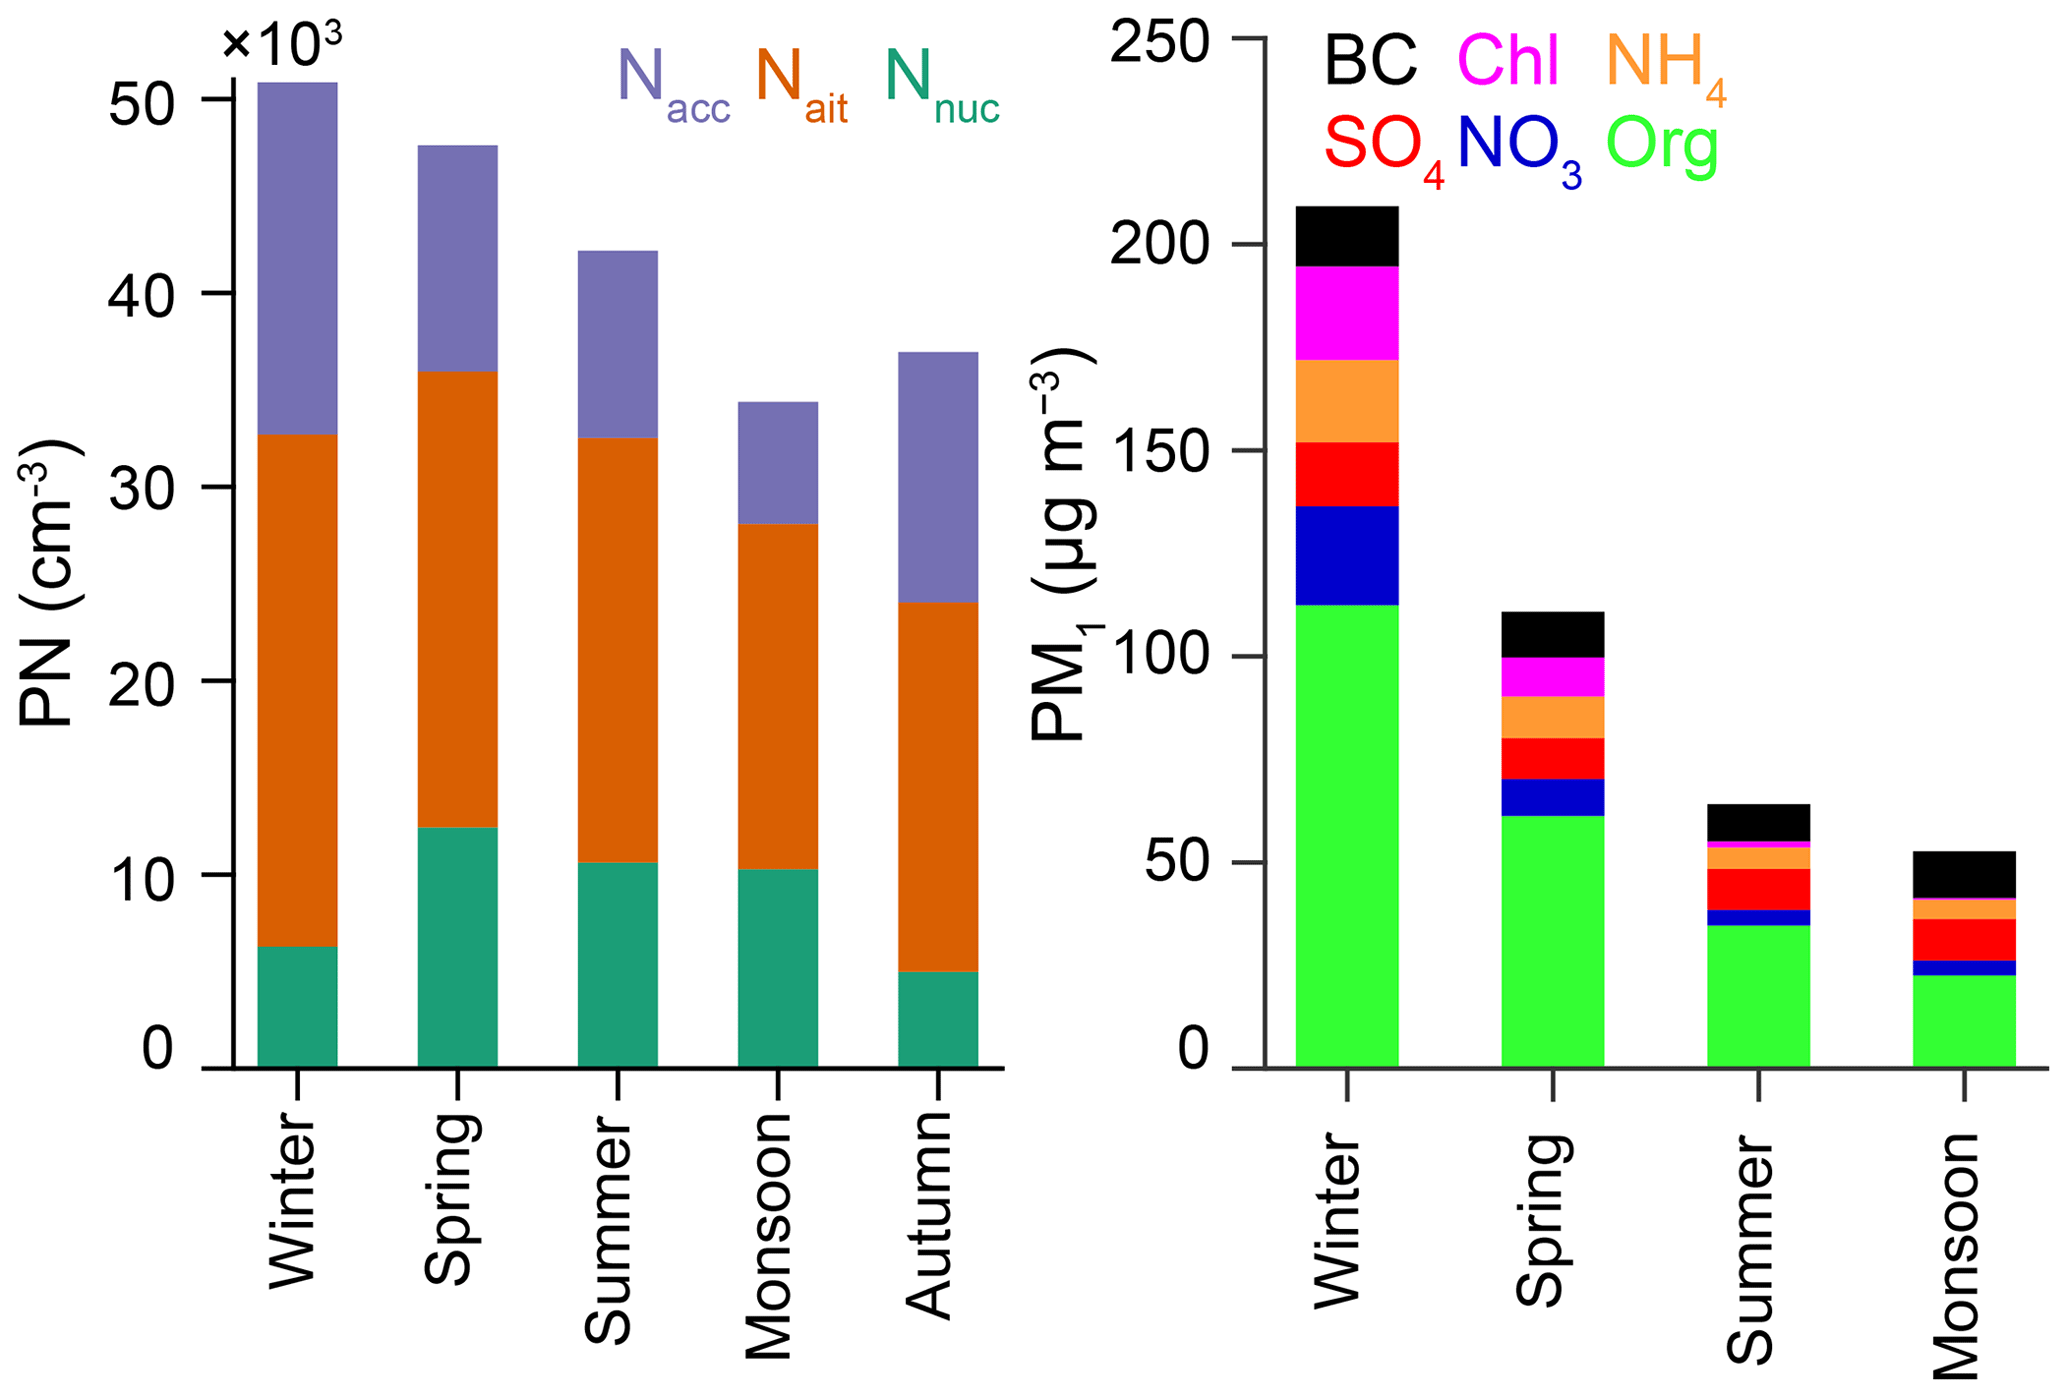
Figure 2Average particle number (PN) levels for each season by mode. The modes are based on scanning mobility particle sizer (SMPS) observations, namely nucleation ( nm), Aitken ( nm), and accumulation ( nm) modes. The PM1 plot is reproduced from Gani et al. (2019) to illustrate seasonal variation in aerosol mass loadings. The PM1 species are organics (Org), chloride (Chl), ammonium (NH4), nitrate (NO3), sulfate (SO4), and black carbon (BC). While we had SMPS data for all seasons, we did not collect PM composition data during autumn due to instrumentation (aerosol chemical speciation monitor – ACSM) downtime.
For each season, PN concentrations varied by the time of day (Fig. 3). In winter, average hourly PN concentrations ranged between 32 400 and 77 500 cm−3. The hourly averaged winter PN levels had a morning (08:00) peak, followed by lowest concentrations during the afternoon (14:00) and highest concentrations during the evening (21:00). The spring hourly averaged concentrations ranged between 38 100 and 62 400 cm−3. The hourly averaged spring levels also had the morning (08:00) and evening (21:00) peaks, and the PN concentrations were lowest around 15:00. Summer hourly averaged concentrations ranged between 35 900 and 54 200 cm−3. The hourly averaged summer levels also had the morning (08:00) and evening (21:00) peaks; there was also a small peak during the midday (11:00), and the PN concentrations were lowest around 03:00. The monsoon hourly PN concentrations ranged between 25 800 and 43 500 cm−3. The monsoon PNs hourly average concentrations were lowest during early morning (04:00) and highest during the midday (12:00), followed by another peak in the evening (21:00). Autumn hourly average PN concentrations ranged between 25 500 and 49 200 cm−3. The autumn diurnal profile had a morning (07:00) and an evening peak (21:00), with the concentrations being the lowest during the daytime (13:00). While hourly averaged PN concentrations for all seasons had peaks during the morning and the evening, additional midday peaks were observed during the summer and the monsoon.
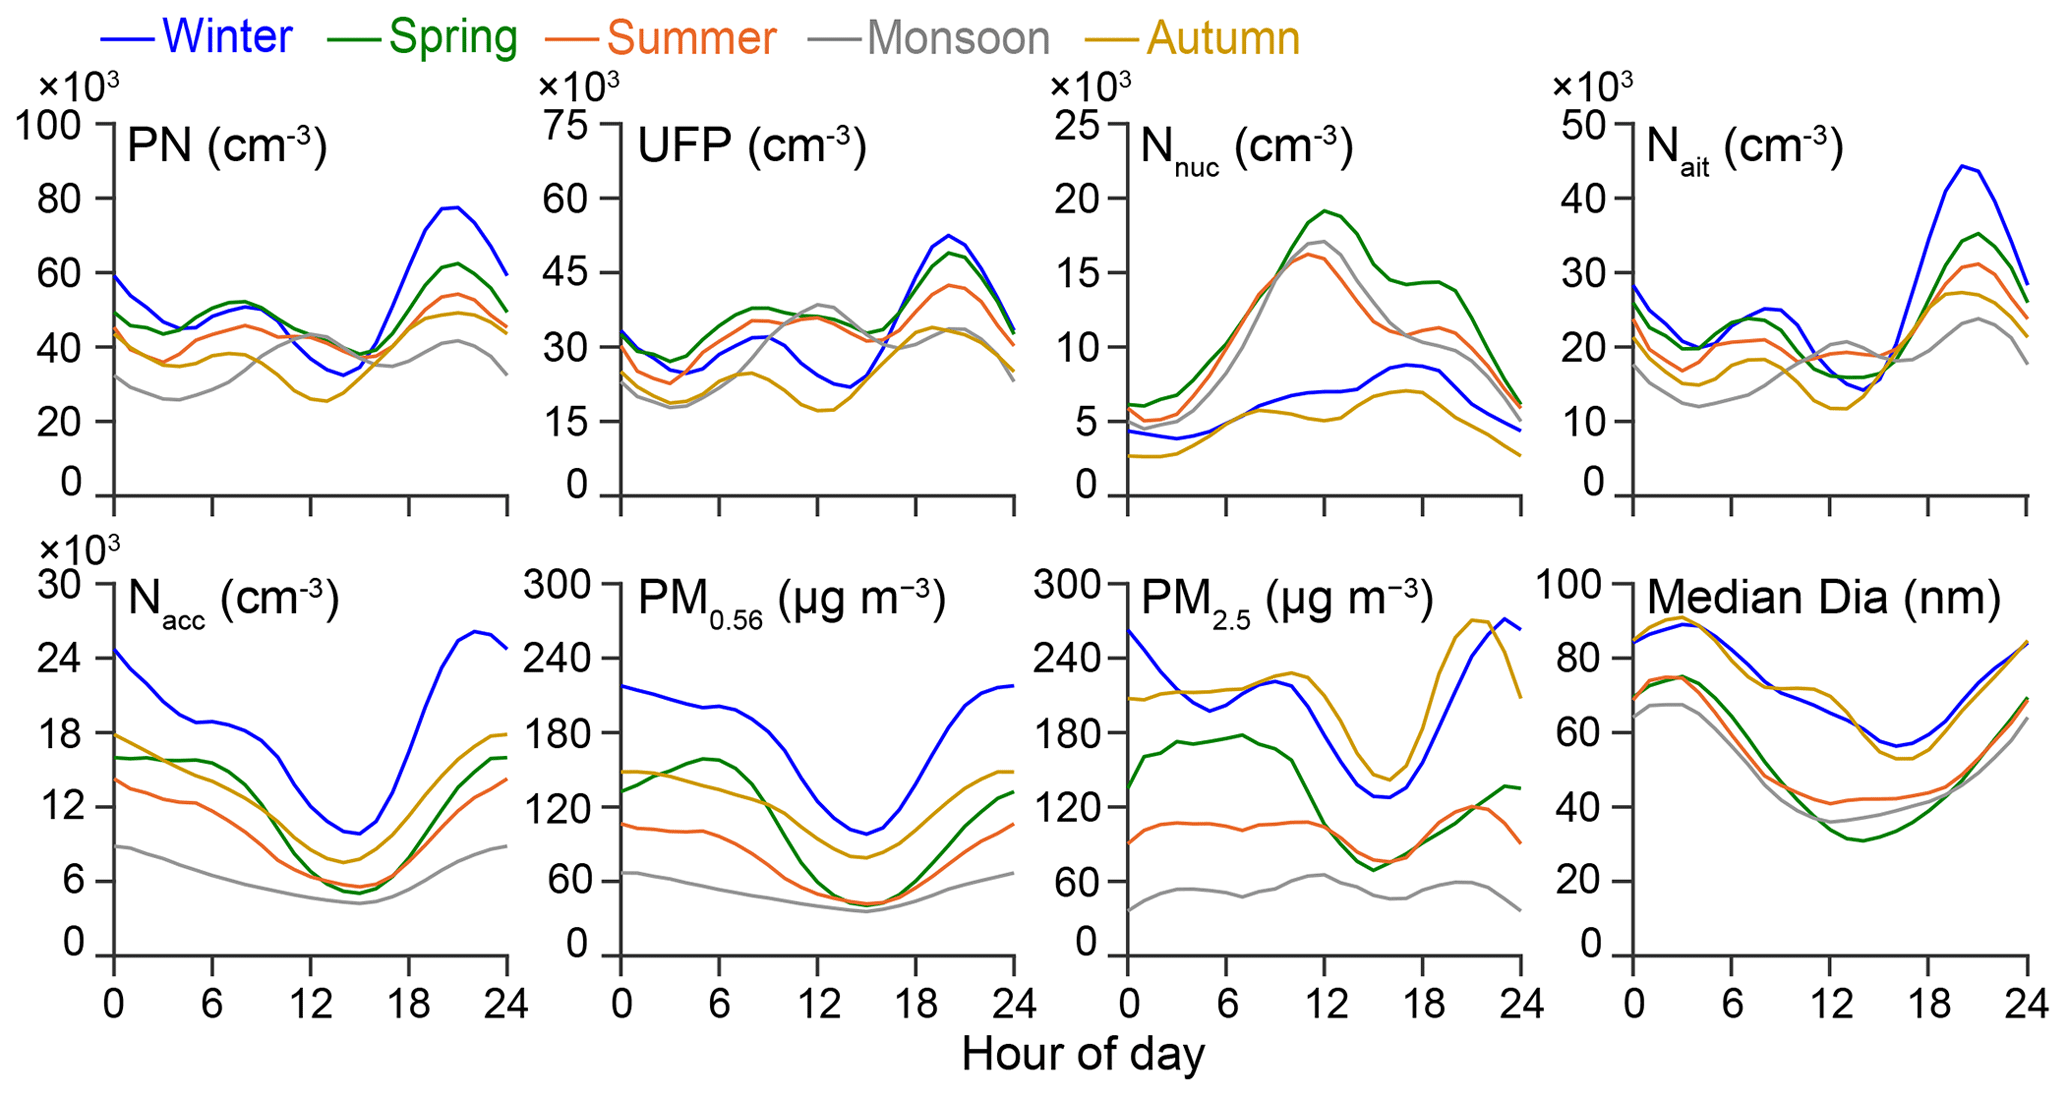
Figure 3Average diurnal and seasonal variations for PNs, UFPs (Dp<100 nm), Nnuc (Dp<25 nm), Nait ( nm), Nacc (Dp>100 nm), and median particle diameter. These averages are based on the observed SMPS data ( nm). Also included are the average diurnal and seasonal variations of the mass concentrations estimated from the observed SMPS data (PM0.56) and the PM2.5 concentrations from a regulatory monitor (Delhi Pollution Control Committee – DPCC; Rama Krishna Puram, 3 km from our site), which were accessed from the OpenAQ Platform (http://openaq.org, last access: 1 August 2019).
In Fig. 3 we also compare the seasonal and diurnal changes in PN and PM0.56 concentrations, namely number and mass concentrations observed from the SMPS. The SMPS-based mass concentrations follow the diurnal profile similar to those of aerosol mass loadings in Delhi (Gani et al., 2019). However, PN diurnal profiles do not closely follow those of PM0.56 (campaign R2 of the hourly averaged time series of PNs and PM0.56=0.26). The low correlation of aerosol number and mass is consistent with UFPs making up a large fraction of the PNs (Sect. 3.2) but contributing much less to the aerosol mass compared to larger accumulation mode particles. In Fig. 4, we estimate the aerosol mass loading in the ultrafine mode and the accumulation mode particles. While PMacc generally accounted for more than 90 % of the PM0.56 concentrations, the PMUFP fraction of PM0.56 ranged between 3 % and 10 % depending on the season and time of day. The fractional PMUFP contribution to PM0.56 was highest during the evening traffic rush hours for the summer and the monsoon and lowest during the nontraffic rush hours of the winter and autumn. The average wintertime PMUFP concentrations ranged from 2.8 µg m−3 for midday to 10.3 µg m−3 during the evening traffic. For the other seasons, average PMUFP concentrations were in the range ∼2–5 µg m−3. Overall, the mass contributions of UFPs ranged between 2.1 and 10.3 µg m−3, depending on season and time of day. For contrast, mass concentrations of UFPs have been observed to be <3 µg m−3 in Germany (Brüggemann et al., 2009), <2 µg m−3 in Taiwan (Cheung et al., 2016), and <0.2 µg m−3 in California (Xue et al., 2019). Furthermore, even if the fractional contribution to total mass in Delhi remains low (<10 %), the absolute mass concentrations from the observed UFPs during polluted periods were nearly as high as the PM2.5 concentrations observed in many cities in North America (∼8–12 µg m−3; Manning et al., 2018).
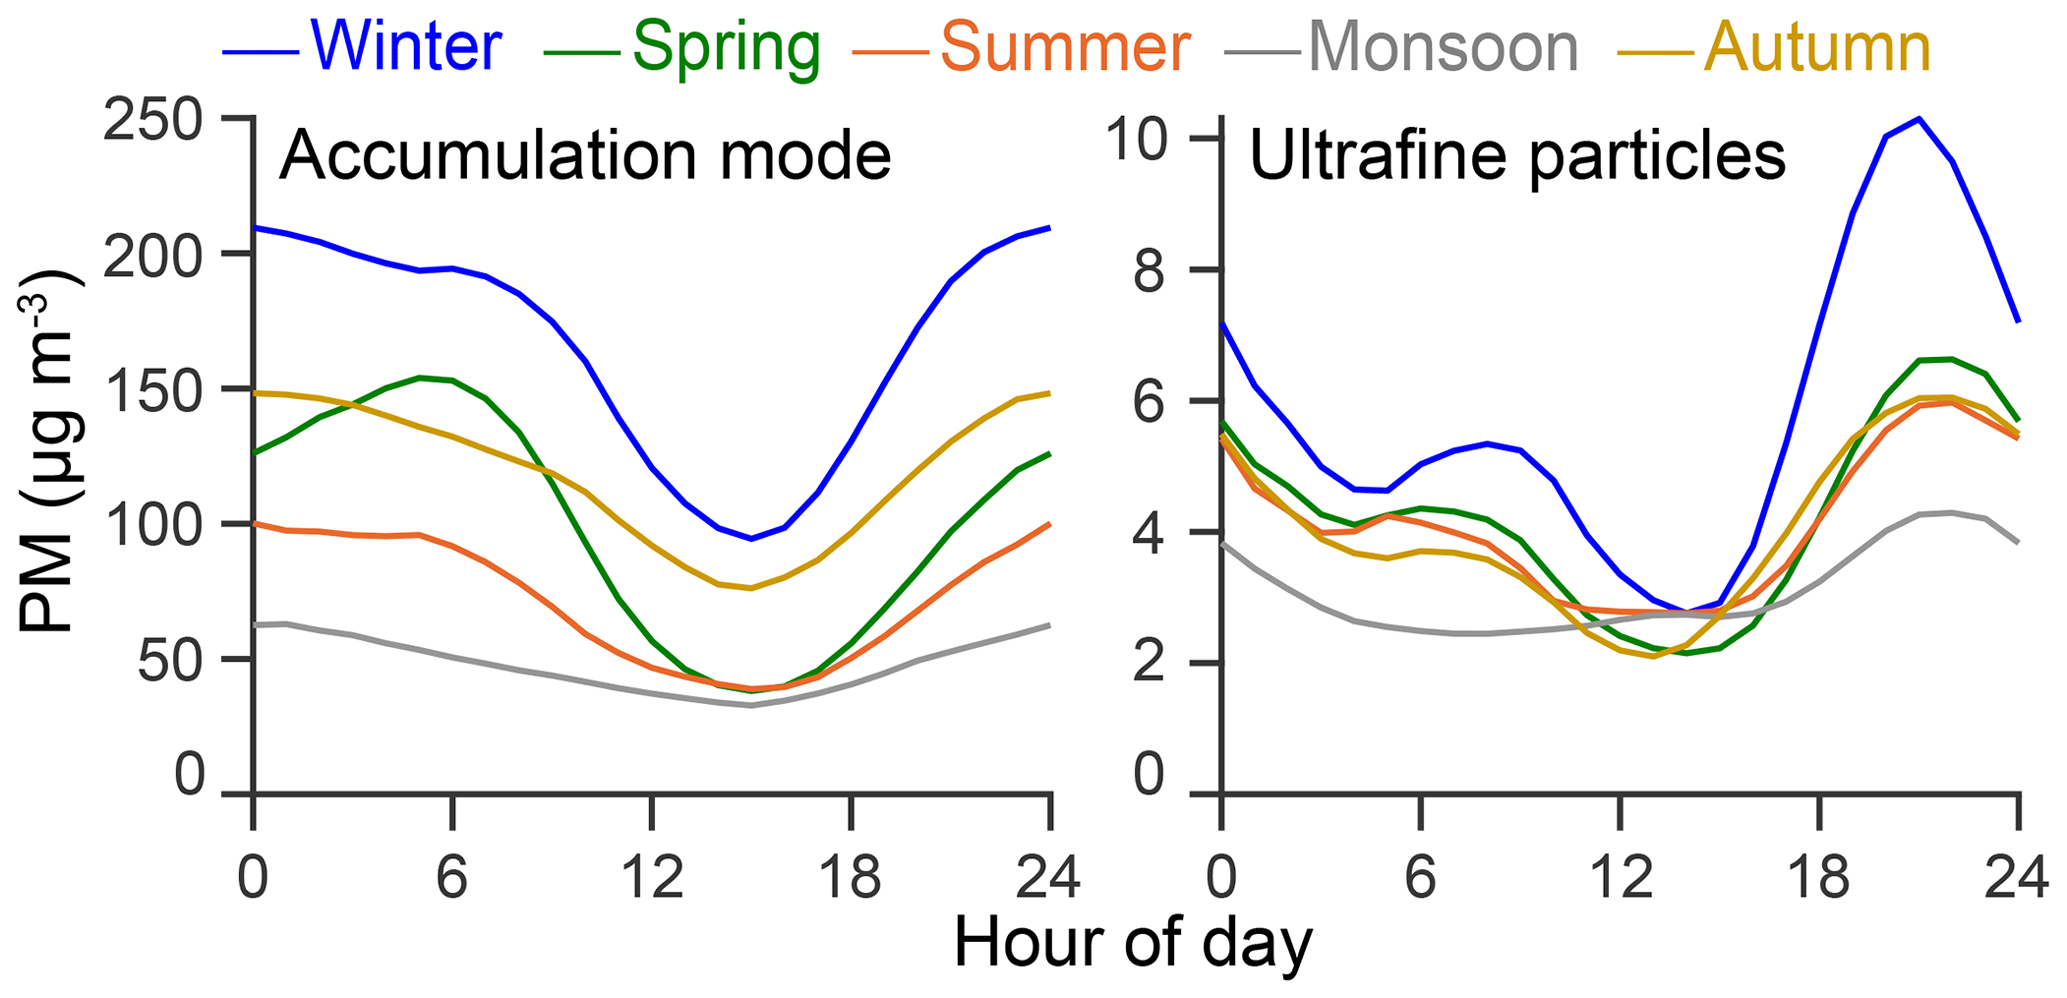
Figure 4Average mass concentrations of observed accumulation mode (100–560 nm) and ultrafine particles (<100 nm) by season and time of day. Estimation of mass concentrations based on assumed particle density of 1.6 g cm−3.
3.2 Size-resolved particle concentrations
The PN concentrations and mass loadings are driven by the concentrations of the individual size modes, namely nucleation (Nnuc), Aitken (Nait), and accumulation (Nacc). It should be noted that the Nnuc, Nait, and Nacc refer to the specific particle size range and not the individual lognormal modes that constitute the PSDs (Sect. 3.6). While the Nnuc and Nait constitute the UFP concentrations (), Nacc contributes to both the total PN concentrations () and most of the fine aerosol mass (Seinfeld and Pandis, 2006). In Fig. 3 we present the seasonal and diurnal variation of Nnuc, Nait, Nacc, UFPs, PNs, and the median particle diameter. In Fig. 5 we present the stacked absolute and fractional diurnal profiles of the PN components for each season to illustrate the varying contribution of each size mode to the PN concentrations by season and time of day. Furthermore, in Table 1 we present the summary of the daytime and nighttime averages for all seasons.

Figure 5Stacked average absolute and fractional diurnal profiles of Nnuc (Dp<25 nm), Nait ( nm), and Nacc (Dp>100 nm) by season. These averages are based on the observed SMPS data ( nm). We also include seasonal average concentrations for the PM2.5 concentrations from a regulatory monitor (DPCC; Rama Krishna Puram, 3 km from our site) and mass concentrations estimated from the observed SMPS data (PM0.56).
Table 1Day and night summary of observations derived from the particle size distributions (PSDs) and meteorological parameters. Arithmetic mean was used for all species and parameters, except wind direction (for which we used the median to estimate its central tendency).
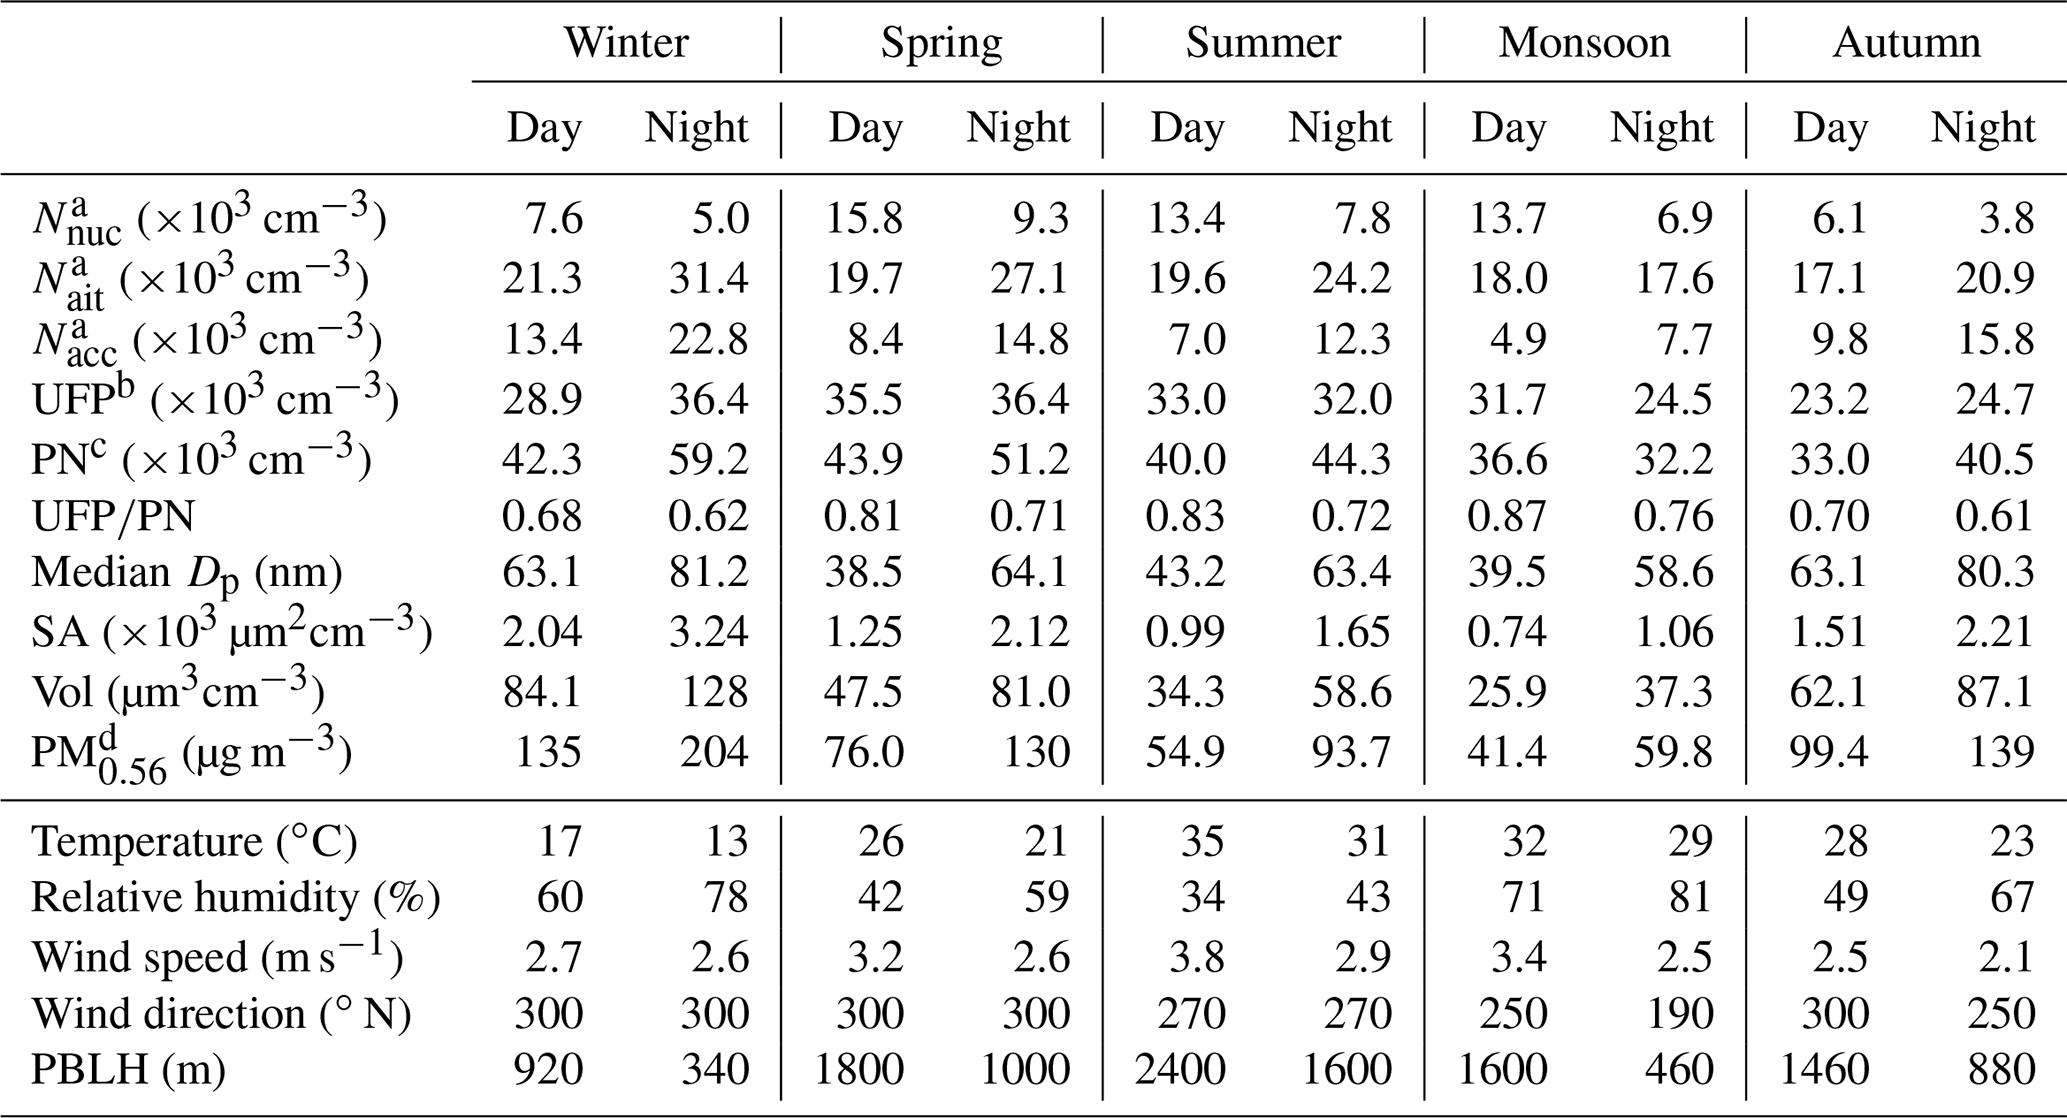
a The modes are based on SMPS observations – nucleation ( nm), Aitken ( nm), and accumulation ( nm) modes. b . c . d Estimation of PM0.56 concentrations were based on the volume concentrations observed by the SMPS and assuming particle density to be 1.6 g cm−3.
The nucleation mode particle concentrations were highest (in magnitude and fraction of PNs) during the warmer periods, when particle mass concentrations tend to be lower. The average hourly Nnuc peaked around 11:00–12:00 for spring, summer, and the monsoon. These Nnuc peak hourly averaged concentrations were ∼18 000 cm−3 and contributed to almost 40 %–50 % of the PN concentrations for these periods. For the nighttime during spring, summer, and the monsoon and for all times of day for autumn and spring, hourly averaged Nnuc concentrations were usually less than 10 000 cm−3 and contributed to within 10 %–20 % of the PN concentrations. The low particle mass concentrations and high insolation during the daytime of warmer months act together to favor nucleation and survival of nucleated particles (Kerminen et al., 2018), resulting in higher Nnuc concentrations during these periods. In Sect. 3.3, we discuss the strong condensation and coagulation sink during extremely polluted periods (such as winter and autumn) and its role in suppressing Nnuc concentrations.
The Aitken mode particle concentrations generally constituted the largest fraction of the PN concentrations. Nait contributed to 40 %–60 % of PN concentrations, depending on season and time of day. Nait concentrations were highest during the morning and evening hours, i.e., periods with lower ventilation and high vehicular traffic. The average hourly Nait concentrations ranged from 12 000 cm−3 (monsoon early morning) to 44 300 cm−3 (winter evening). The hourly averaged Nait profiles for most seasons had a morning and an evening peak. For winter, autumn, and spring, the hourly averaged Nait concentrations were lowest during the midday. However, for summer and the monsoon there was another peak during the midday, with the lowest levels observed early in the morning. The small daytime Nait peaks for the warmer months are consistent with nucleation mode particles growing to the Aitken mode (Kulmala et al., 2004). The Nait peaks during the morning and the evening traffic rush hours are consistent with vehicular emissions contributing to this size range (Paasonen et al., 2016; Kumar et al., 2010). Studies from other cities – especially from near-roadway sites – also observe a large fraction of the Aitken mode particles in the total PN concentrations (Zhu et al., 2002; Wu et al., 2008). In addition to traffic, other sources contributing to Aitken mode particles include cooking, industrial activities, solid waste burning, and construction activities (Kumar et al., 2013; Riffault et al., 2015; Chen et al., 2017).
Accumulation mode particles contribute to almost all of the submicron aerosol mass, so it is unsurprising that the diurnal and seasonal variation of Nacc concentrations are similar to those of aerosol mass concentrations (Gani et al., 2019). In addition to contributing to most of the fine PM mass concentrations, Nacc in Delhi also constituted a significant fraction of the PN concentrations. The Nacc fraction of PNs was the highest for the nighttimes of autumn and winter (∼ 45 %) and the lowest for the daytimes of the warmer summer and monsoon seasons (∼15 %). The average hourly Nacc concentrations ranged from 4200 cm−3 (monsoon midday) to 26 200 cm−3 (winter evening). For all seasons, the hourly averaged hourly Nacc concentrations had a morning (07:00) peak and an evening (20:00–22:00) peak, with the lowest concentrations during the daytime (13:00–15:00). In addition to emitting in the Aitken mode, biomass burning and older diesel vehicles emit in the accumulation mode as well (Chen et al., 2017; Paasonen et al., 2016; Kumar et al., 2010). Additionally, particles from fresh vehicular emissions can grow rapidly from the Aitken mode at the tailpipe to accumulation mode at roadside and ambient locations (Ning et al., 2013). We speculate that the traffic-related particles in Delhi may become smaller as India's vehicle fleet (especially heavy-duty trucks) is upgraded (Guttikunda and Mohan, 2014; L. Zhou et al., 2020).
Overall, UFPs contributed to ∼65 % of the PN concentrations for winter and autumn. The UFP fraction of PN concentrations was relatively higher for spring (75 %), summer (78 %), and the monsoon (80 %). The average hourly UFP concentrations ranged from 17 200 cm−3 (autumn midday) to 52 500 cm−3 (winter evening). For all seasons, UFP concentrations had peaks in the morning (07:00–09:00) and the evening (19:00–21:00). For the relatively warmer seasons (summer, monsoon, and spring), there were additional peaks during the daytime (11:00–13:00). The UFP fraction of PNs (UFP∕PN) was generally the highest during the daytime in spring, summer, and the monsoon (∼85 %). Conversely, some of the lowest UFP∕PN levels were observed during the nighttime of winter and autumn (∼55 %). The UFP∕PN levels observed in Delhi are generally lower than those in cleaner cities (Hussein et al., 2004; Rodríguez et al., 2007; Putaud et al., 2010) and even lower compared to some other polluted ones where mass concentrations often exceeded ∼100 µg m−3 (Whitby et al., 1975; Laakso et al., 2006; Wu et al., 2008). As a result of the relatively large fraction of PNs being constituted by non-UFPs (Nacc) in Delhi, the median diameter size observed was often much larger than those observed in these cleaner cities.
The hourly averaged median diameters were largest during the nighttime of winter and autumn, reaching up to ∼90 nm. The smallest hourly averaged median diameters (∼40 nm) were observed during the daytime of spring, summer, and the monsoon. As with the concentrations and fractions of the PN modes, the median diameters also had sharp seasonal and diurnal variations. For winter and autumn, the hourly averaged median diameters ranged from 50 nm during the late afternoon (16:00) to 90 nm during the late night/early morning (03:00). The median diameters were the smallest for the relatively less polluted warmer months (summer, monsoon, and spring), with the hourly averaged median diameters ranging from 35 nm (12:00) to 75 nm (03:00). For comparison, the median diameter in Helsinki (calculated for ∼12–560 nm) was ∼30 nm (Hussein et al., 2004). In Los Angeles, the median diameters up to 150 m from a freeway (our site is ∼150 m from an arterial road) were <50 nm (Zhu et al., 2002). We found that for all seasons, the nighttime had larger particles than the daytime. For winter and autumn, the average median diameters were ∼65 nm during the day and ∼80 nm during the night. For the spring, summer, and the monsoon, the average median diameters were ∼40 nm during the day and ∼65 nm during the night.
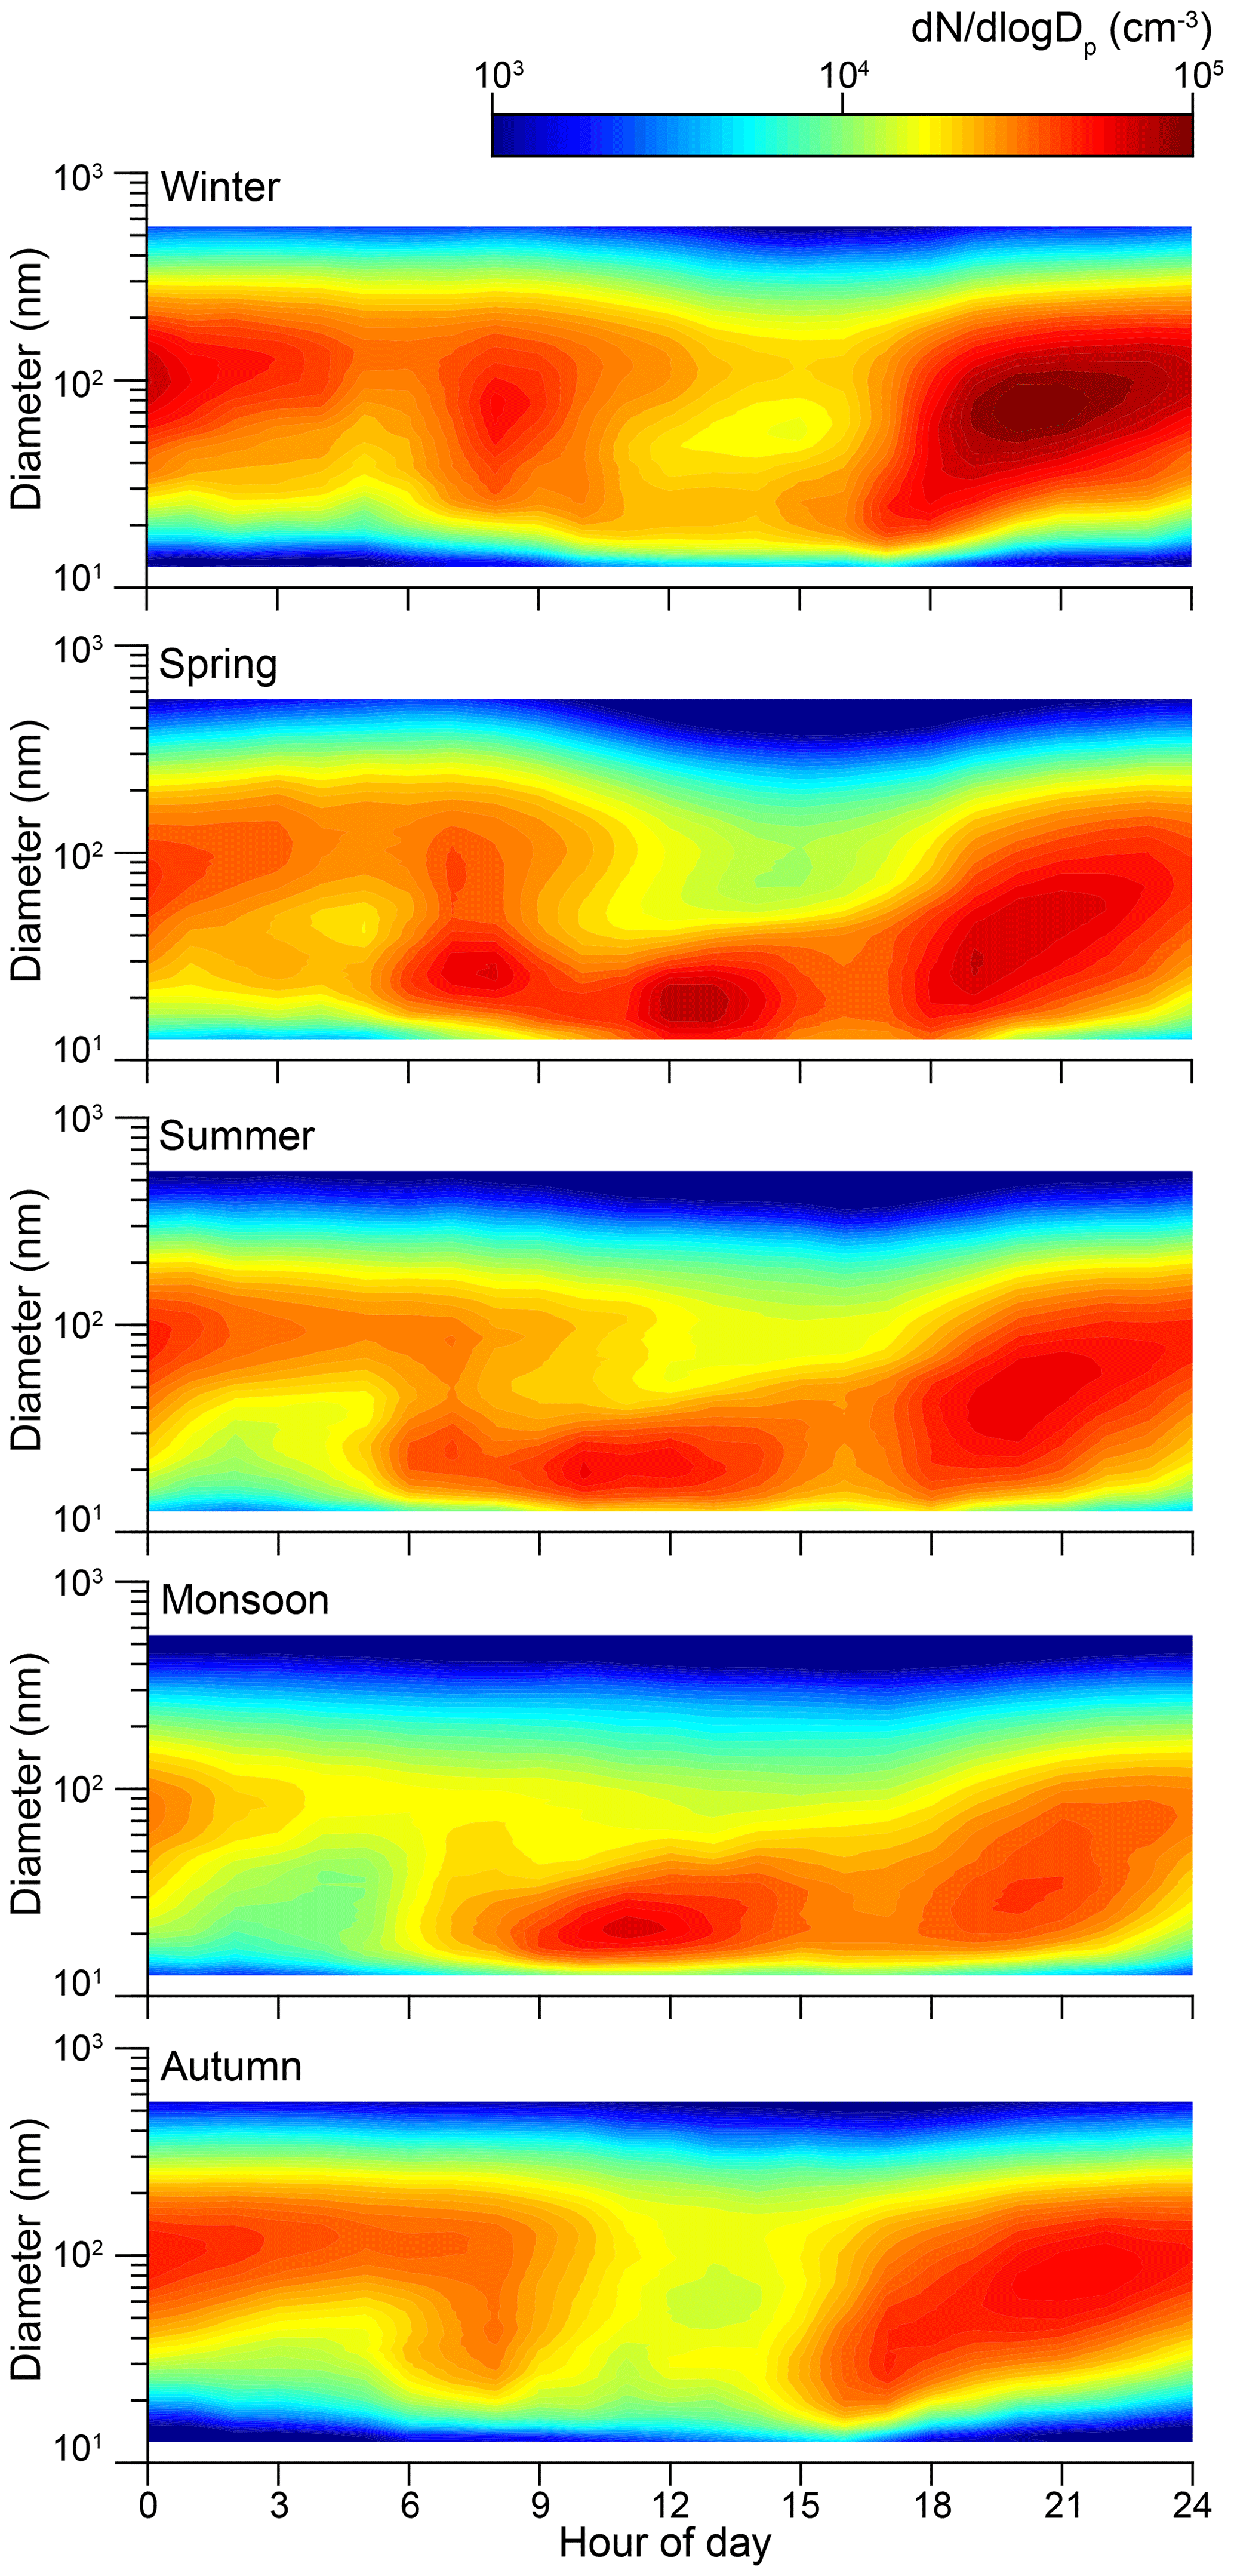
In Fig. 6, we present the average observed PSDs evolving over the day for each season as a heat map. For the spring, summer, and the monsoon, the average seasonal heat map indicates daytime new particle formation. However, winter and autumn had lower concentrations of the smaller particles that are generally associated with new particle formation. In the following section (Sect. 3.3) we explore the role of coagulation scavenging during polluted periods in selectively suppressing concentrations of smaller particles and resulting in an increase in the median diameter size.
3.3 Coagulation scavenging
The evolution of ambient particle size distributions reflects the complex interplay between emissions, atmospheric dilution, and a wide range of aerosol dynamic processes including new particle formation, evaporation/condensation, and coagulation. In this section, we explore the role of coagulation scavenging in suppressing both the existing UFP concentrations and new particle formation during periods with high aerosol mass loadings corresponding to elevated Nacc levels. During the polluted winter and autumn seasons, the daytime UFP levels were often lower than those during the same period in the warmer months.
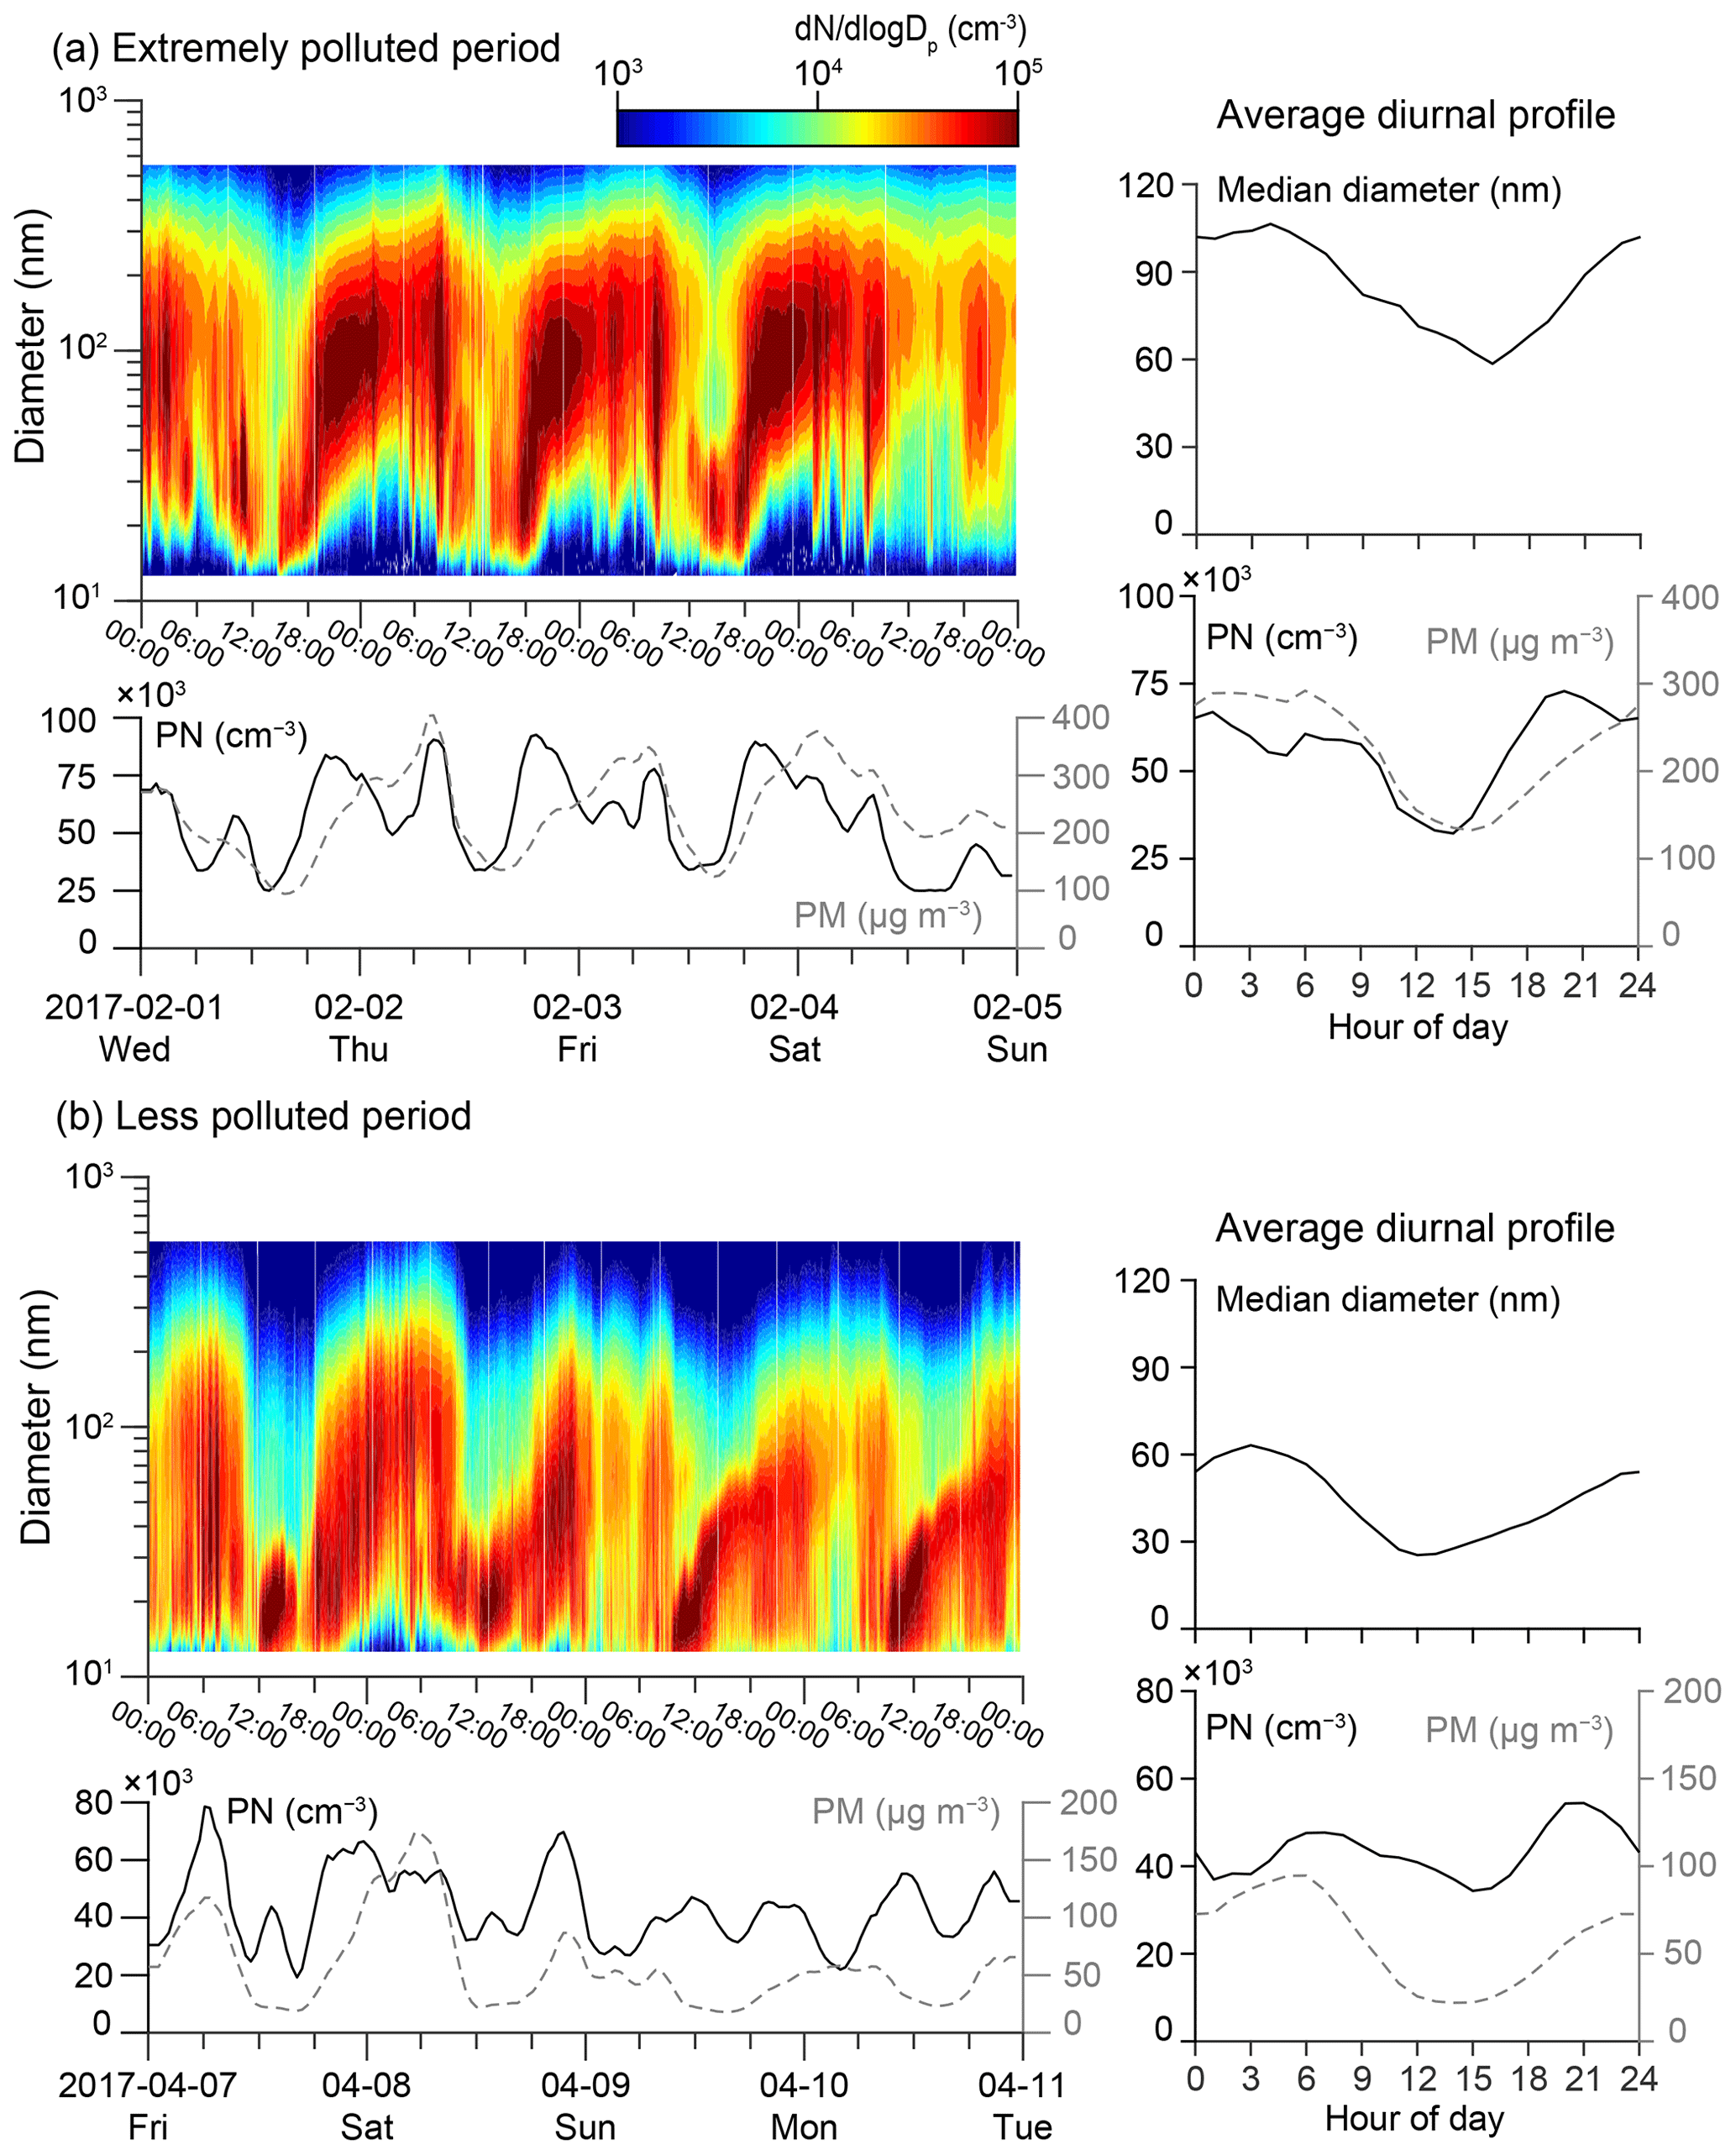
Figure 7Heat map showing the evolution of the PSDs for a (a) polluted period with prominent coagulation scavenging and (b) less polluted period with some new particle formation and growth. Bulk PN and PM concentrations for the same period as the heat map are also presented for both periods. The average diurnal profile of the median diameter, along with the PN and PM concentrations over the two periods, is presented in the right panels. Estimation of PM concentrations were based on the volume concentrations observed by the SMPS and assuming the particle density to be 1.6 g cm−3.
In Fig. 7 we present PSD heat maps for an extremely polluted (high aerosol mass loading) period (1–5 February 2017). During the polluted episode (Fig. 7a), the PM0.56 concentrations ranged between 100 and 400 µg m−3 and the PN concentrations between 25 000 and 80 000 cm−3. The peak PN levels were observed during the evening traffic rush hours. Even though PN concentrations decreased during the late evening (∼20:00–23:00), the PM0.56 levels kept continuously increasing all night. The Nnuc levels decreased during these polluted evening periods even as Nait and Nacc levels increased (Fig. S13 in the Supplement). This dynamic suggests that coagulation may be acting as a strong control on concentrations of smaller particles, even as emissions are high. The characteristic timescale for particles smaller than 15 nm to be lost to coagulation scavenging by larger particles was less than 15 min for these polluted evenings. The size of the particles rapidly increased from the evening to the nighttime (growth rates up to ∼10 nm h−1), and coagulation may be one of the mechanisms that contributes to this rapid growth.
Since coagulation only affects particle number concentrations, and not mass concentrations, PM0.56 increased into the night, possibly owing to a combination of increased sources (e.g., nocturnal truck traffic and biomass burning for cooking and heat) and decreasing ventilation (Guttikunda and Gurjar, 2012; Guttikunda and Calori, 2013; Bhandari et al., 2020). The PN concentrations dropped after the evening traffic rush hours and only increased again during the morning traffic rush hours.
We followed Westerdahl et al. (2009) to calculate the coagulation timescales corresponding to the observed PSDs (Sect. 2.3). When a small particle coagulates onto a larger particle, the small particle is lost and the big particle scarcely grows. In Fig. 8 we have presented the diurnal and seasonal profiles for the modeled coagulation timescales for a 15, 30, and 100 nm particle. For the nucleation mode particle (15 nm), the timescales ranged from a few minutes for the polluted periods (mornings and evenings of cooler seasons) to ∼1 h for the relatively less polluted periods (midday of warmer seasons). The corresponding range for an Aitken mode particle (30 nm) was ∼1–4 h. Finally, for an accumulation mode particle (100 nm), coagulation was not a significant sink owing to the extremely long timescales (tens of hours). Advection timescales across Delhi are ∼3–5 h based on a length scale of ∼40 km at typical wind speeds.

Table 2Characteristic coagulation and condensation sinks for Delhi and comparison with those calculated using PSDs in the literature for other cities.
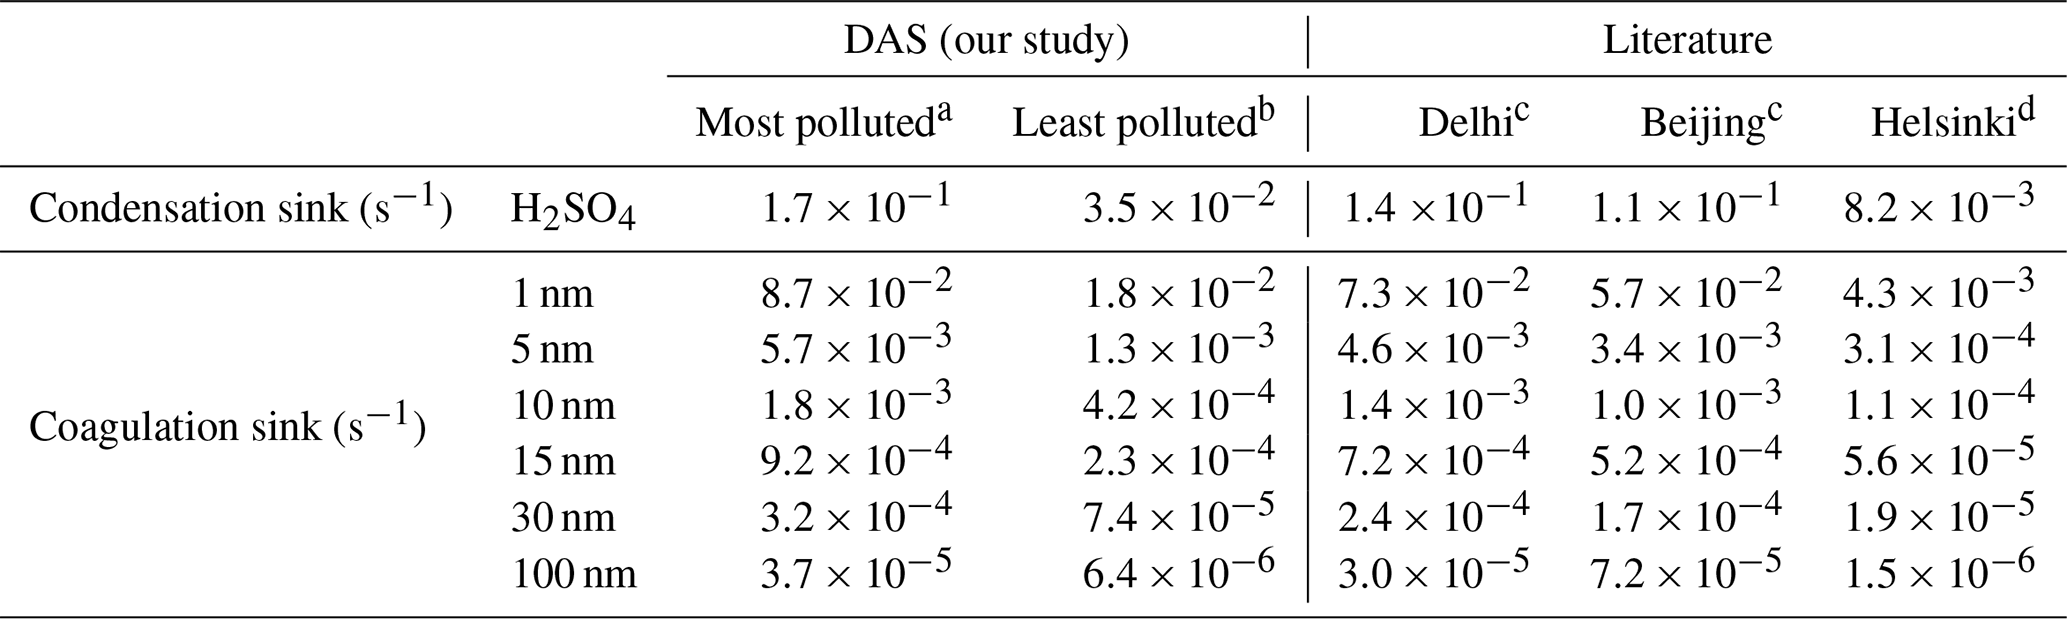
a Average PSDs for winter 20:00–21:00. b Average PSDs for the monsoon 14:00–15:00. c PSDs from Fig. 2 in Laakso et al. (2006). d PSDs from Table 1 in Hussein et al. (2004).
Coagulation scavenging of UFPs onto the larger accumulation mode particles could explain the suppression in UFP concentrations for polluted periods which have high accumulation mode concentrations. The high aerosol surface area from particles in the accumulation mode, in addition to contributing to most of the mass, can act as a coagulation sink for the smaller particles. The scavenging of UFPs in Delhi during the polluted periods could explain the higher median particle diameters than those usually observed in other urban environments (Salma et al., 2011). In Table 2, we compare the characteristic condensation sink (H2SO4) and coagulation sink (for 1, 5, 10, 15, 30, and 100 nm particles) for Delhi (least and most polluted) with other cities (clean and polluted). Based on the coagulation timescales for these polluted periods, for a 1 h period coagulation scavenging could result in removal of ∼85 % of the 10 nm particles, ∼50 % of the 30 nm particles, and ∼10 % of the 100 nm particles present at the beginning of the hour. The coagulation sink for UFPs in Delhi during the polluted periods was ∼20 times larger compared to a clean city (Helsinki). Even for least polluted periods in Delhi, the coagulation sink for UFPs was ∼4 times larger than Helsinki.
3.4 New particle formation
For the less polluted seasons (Fig. 6), we observed a sharp increase in the concentration of nucleation mode particles during midday, suggesting new particle formation. In Fig. 7b we present PSD heat maps for a relatively less polluted period (7–11 April 2017). During some days for this period we observed new particle formation and growth. The growth of particles in the nucleation mode was especially prominent for the latter 2 d of this episode when the PM0.56 concentrations were almost half the PM0.56 concentrations of the first 2 d, and consequently both the condensation and coagulation sinks (across particle sizes) also decreased by ∼50 %. We observed banana-shaped new particle formation and growth events during these relatively clean conditions, which were consistent with growth of atmospheric nanoparticles observed elsewhere (Kulmala and Kerminen, 2008). The growth rate of the nucleation mode particles based on the average PSDs for these clean conditions was ∼5 nm h−1. It should be noted that our SMPS measurements had a lower size cutoff of 12 nm, implying that the particles in the nucleation mode had already grown before being detected.
Growth rates depend on particle size, concentrations of condensable gases (H2SO4, highly oxygenated molecules, etc.), and condensation and coagulation sinks, and they can range from 0.1 to 10s of nm h−1 across various environments (Kerminen et al., 2018; Nieminen et al., 2018; Bianchi et al., 2016). We did not observe banana-shaped new particle formation and growth events during the polluted winter or autumn seasons as the growth phase was probably disrupted by coagulation scavenging. For example, during winter, coagulation timescales for a 15 nm particle were <1 h (Fig. 8). Growth rates for polluted megacities are also usually slower than 10 nm h−1 (Y. Zhou et al., 2020; Chu et al., 2019). It is likely that a nucleation mode particle is more likely to coagulate with a larger particle than to grow to the Aitken or accumulation mode. Overall, the aerosol dynamics are a complex interplay of both new particle formation and coagulation scavenging, with nucleation mode particles in highly polluted environments generally being susceptible to scavenging by the accumulation mode particles.
Large accumulation mode concentrations also act as a strong condensation sink (Table 2), causing vapors to condense onto existing particles instead of forming new particles (Mönkkönen et al., 2004a). During the most polluted time in Delhi (generally 20:00–21:00 during the winter), the condensation sink was 20 times larger than Helsinki (clean city; Hussein et al., 2004). Even for the least polluted period in Delhi (generally 14:00–15:00 during the monsoon), the condensation sink was ∼4 times larger than Helsinki. The condensation sink for the polluted periods was somewhat higher than Beijing (polluted city; Laakso et al., 2006) but within the same order of magnitude. For spring, summer, and the monsoon, we estimated the condensation sink to be more than an order of magnitude lower than the winter and autumn. Consequently, unlike winter and autumn, we observed an increase in daytime UFP concentrations (around 12–30 nm) for the relatively less polluted months, which was consistent with daytime new particle formation from nucleation events (Kulmala et al., 2004; Brines et al., 2015). Based on the survival parameter () defined in Kulmala et al. (2017), new particle formation would not be expected even during some of the least polluted periods in Delhi. Why we observe any new particle formation events in Delhi – similar to observations from megacities in China – is still not well understood (Kulmala et al., 2017).
3.5 Role of meteorology
In Gani et al. (2019) we showed that meteorology – specifically change in ventilation – was an important factor in driving the seasonal aerosol mass variations observed in Delhi. However, PN levels did not show similar seasonal variation (Fig. 2). In Fig. S11, we have presented the 2-week averages for ventilation and PN concentrations (by mode and total). Nacc concentrations decrease as the ventilation coefficient increases. Since accumulation mode particles constitute most of the submicron mass, a decrease in Nacc concentrations with increasing ventilation is consistent with our previous analysis that showed a decrease in mass loadings with increasing ventilation. Nait concentrations seem to have a smaller slope than accumulation mode concentrations. Nnuc concentrations increased with increasing ventilation, which is consistent with new particle formation and/or less coagulation scavenging. Comparing rainy and nonrainy days during the monsoon, our observations suggest that rain reduces the accumulation mode concentrations (Fig. S12) as observed in other studies (Luan et al., 2019; Hussein et al., 2018). However, we do not observe that rain causes a clear reduction in either nucleation or Aitken mode concentrations. Parametrization studies suggest that rain is more effective in scavenging nucleation mode particles compared to Aitken mode particles (Pryor et al., 2016; Laakso et al., 2003). Lower accumulation mode concentrations following rain events imply lower condensation and coagulation sinks. While we cannot fully reconcile our observations here with theory, possible explanations include (i) differential water solubility by particle size and age or (ii) that the rain washout of the nucleation mode particles is “balanced” by the reduction in the condensation and coagulation sink due to the rain washout of accumulation mode particles.
The lower sensitivity of PNs to ventilation changes can be explained by the dissimilar sources and atmospheric processes that contribute to PN and PM levels. While PNs are mostly comprised of UFPs, accumulation mode particles constitute most of the fine aerosol mass. Traffic, cooking, and nucleation events contribute to urban UFPs. A large fraction of accumulation mode particles, in contrast, result from biomass burning and aging of aerosol, which result in particles often being larger than 100 nm (Janhäll et al., 2010). Periods with lower ventilation that result in high aerosol mass loadings also create a large coagulation sink for UFPs (Sect. 3.3). While coagulation suppresses the PN levels, the aerosol mass remains conserved. While a decrease in ventilation should initially increase concentrations for all particle sizes similarly, coagulation causes the smaller UFPs to be selectively lost, which causes a larger increase in aerosol mass compared to number. Conversely, periods with high ventilation (daytime of warmer months) also have more nucleation events resulting in increased UFP concentrations but with almost no contribution to aerosol mass (Brines et al., 2015). In addition to large condensation sinks from existing particles (Sect. 3.4), it is possible that the elevated RH during the cooler winter and autumn (Fig. 1) could further suppress atmospheric nucleation. It has been observed in both clean and polluted environments that the RH during new particle formation event days tends to be lower compared to nonevent days (Kerminen et al., 2018; Dada et al., 2017; Hamed et al., 2011). Overall, ventilation strongly influences aerosol mass loadings in Delhi, with higher ventilation often resulting in reduction of PM concentrations and vice versa. However, we do not observe such a simple relationship between ventilation and PN levels. The complex interplay of sources, aerosol dynamics, and atmospheric processes, as discussed previously, make PN levels less sensitive to meteorological changes compared to aerosol mass loadings.
3.6 Lessons from multimodal PSD fitting
In this section we present the parameters obtained by fitting multimodal lognormal distributions to the seasonal and characteristic time-of-day averages of the observed PSDs (Table 3). For most seasons and times of day, the PSDs were bimodal. Even when there was a third mode, it contained less than 10 % of the total PN concentration. While the smaller mode (ultrafine mode) ranged from 20 to 40 nm depending on season and time of day, the larger mode (accumulation mode) ranged from 80 to 120 nm. For all seasons the late night ultrafine mode concentrations contributed to less than half of the total PN concentration. This observation can be explained by fewer sources of UFPs – less traffic and no nucleation events – and a large coagulation sink from nighttime aerosol mass loadings (from accumulation mode) which are often high in part due to unfavorable nighttime meteorology (Gani et al., 2019). Delhi traffic usually peaks around 08:00–11:00 in the morning and 17:00–21:00 in the evening. Restrictions on daytime heavy-duty truck traffic have resulted in increased nocturnal truck traffic after 22:00 (Mishra et al., 2019; Guttikunda and Calori, 2013). The accumulation mode during late nights had median diameters from 100 nm for the relatively less polluted summer and monsoon to 120 nm for spring, winter, and autumn.
Table 3Multimodal lognormal fitting parameters for the average particle size distribution of each season and characteristic times of day.
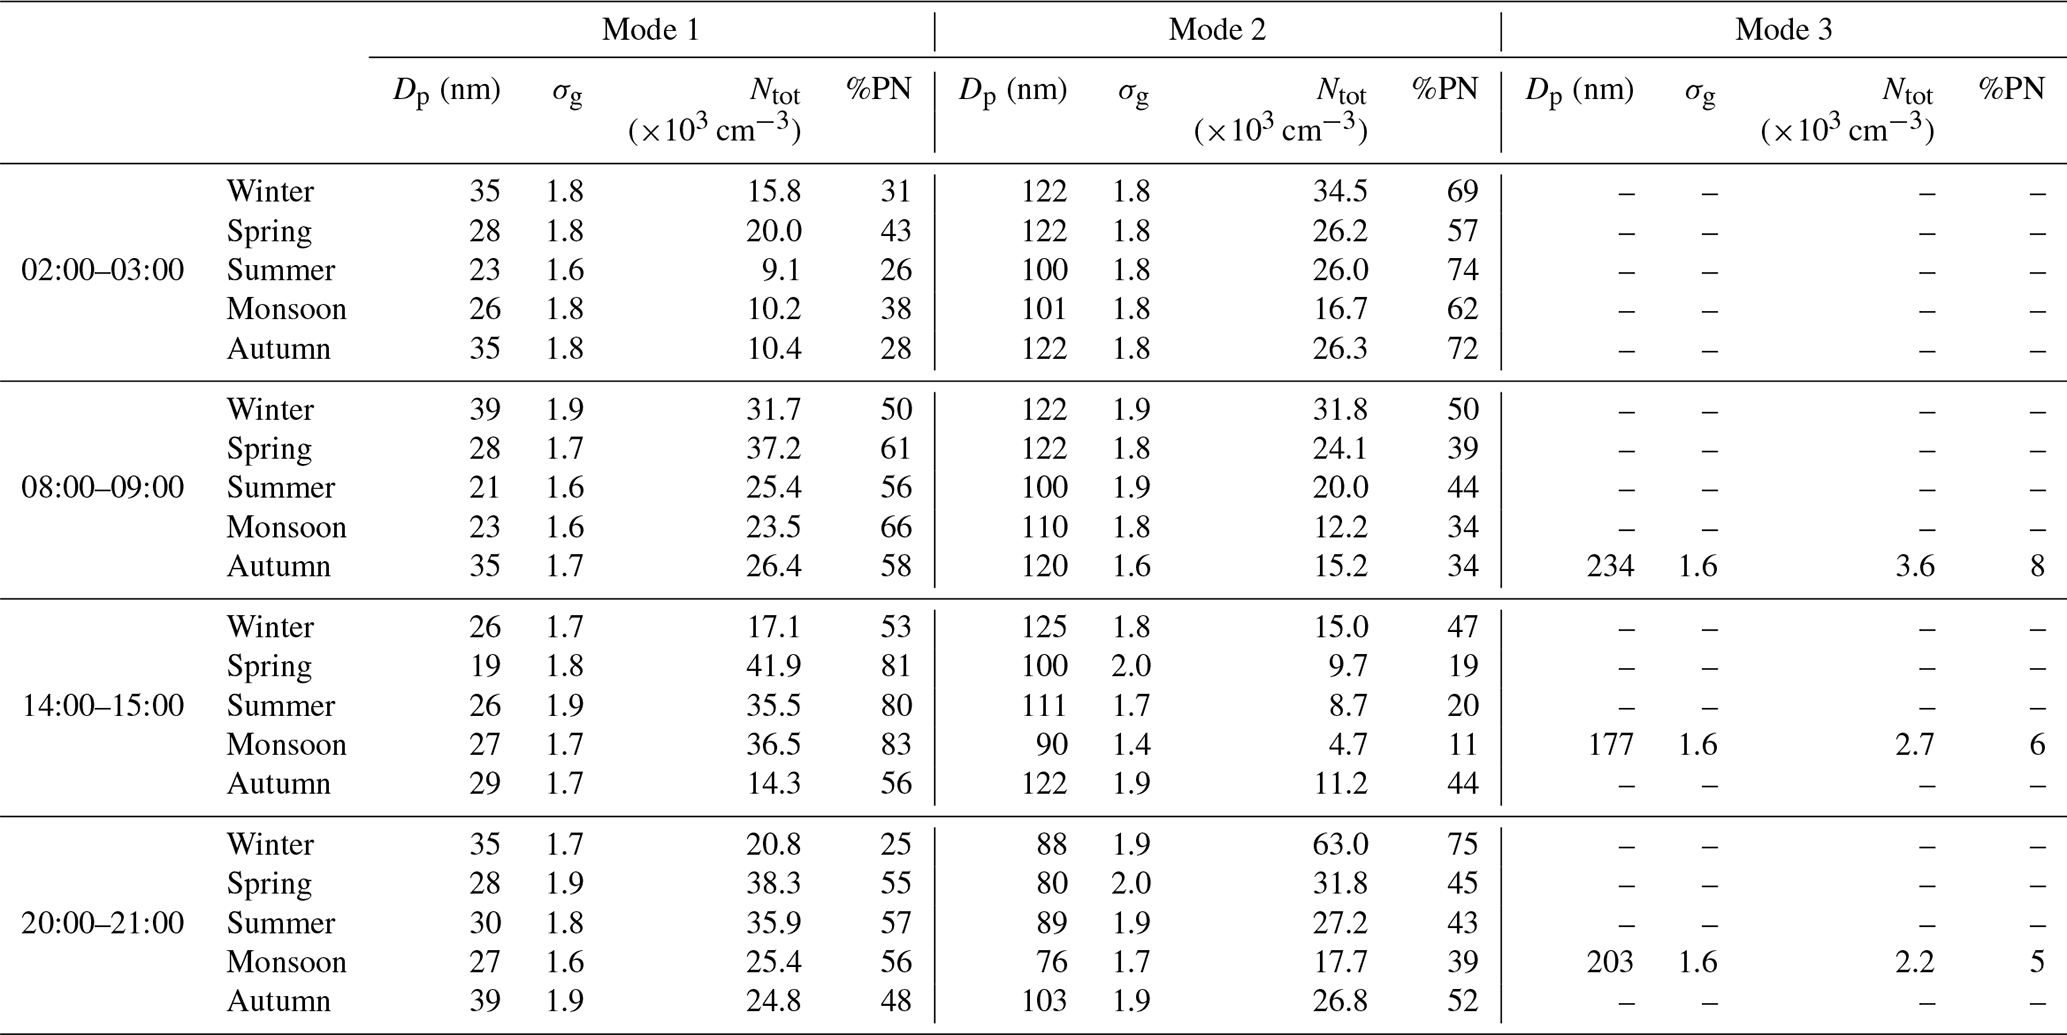
During the morning rush hour, the median diameter of the ultrafine and accumulation modes were the smallest for the summer (21 and 100 nm for ultrafine and accumulation mode) and the monsoon (23 and 110 nm) compared to spring (28 and 122 nm), autumn (35 and 120 nm), and winter (39 and 122 nm). Autumn had three modes (35, 120, and 234 nm), with the ultrafine mode contributing to 58 %, the accumulation mode to 34 %, and the third mode contributing to only 8 % of the total PN concentration. For winter during the same period, half of the PN concentrations were in the ultrafine mode (∼40 nm) and the other half in the accumulation mode (∼120 nm). The fraction of PNs in the ultrafine mode during the same period was relatively higher for the other seasons which had fewer aerosol mass loadings compared to winter, with the least polluted monsoon having 66 % of the PNs in the ultrafine mode.
The midday PSDs were bimodal for winter (26 and 125 nm), autumn (29 and 122 nm), spring (19 and 100 nm), and summer (26 and 111 nm). For the monsoon the PSDs were trimodal (27, 90, and 177 nm), with only 6 % of the PN fractions in the third mode. Generally, the midday hour had some of the highest fractions of PN concentrations in the ultrafine mode, especially for summer (80 %), the monsoon (83 %), and spring (81 %). The corresponding levels, while much lower for the more polluted autumn (56 %) and winter (53 %), were higher than most other times of day within those seasons. Even in absolute terms, summer, the monsoon, and spring had some of the highest PN concentrations in the ultrafine modes. The high ultrafine mode concentrations – both magnitude and PN fraction – are potentially from new particle formation (Kulmala et al., 2004). We observe characteristic new particle formation followed by some growth for the warmer seasons (Fig. 6). However, during the more polluted winter and autumn, daytime new particle formation is not observed – potentially because of the strong coagulation and condensation sink (Sec 3.4).
During the evening rush hour, the PSDs were bimodal for winter (35 and 88 nm), autumn (39 and 103 nm), spring (28 and 80 nm), and summer (30 and 89 nm). For the monsoon the PSDs were trimodal (27, 76, and 203 nm), with only 5 % of the PN fraction in the third mode. The relatively smaller median diameter for the accumulation mode during the traffic rush hour is consistent with particles from fresh vehicle exhausts – both gasoline and diesel – being smaller than those from biomass burning and other aged aerosols. While gasoline engines emit in the ∼20–60 nm range, some of the older diesel engines still prevalent in India can emit larger accumulation mode particles (Kumar et al., 2010). Particles from biomass burning are in the ∼50–200 nm size range (Chen et al., 2017; Janhäll et al., 2010). For the warmer periods which have relatively few biomass burning emissions, the ultrafine modes contribute to relatively higher fractions of PN – especially during traffic rush hours. These findings are consistent with studies from cities in high-income countries where traffic and nucleation events are considered the major source of UFPs (Brines et al., 2015).
We used continuous, highly time-resolved, and long-term data to provide a detailed seasonal and diurnal characterization of Delhi's PN concentrations. The number of concentrations for each mode (nucleation, Aitken, and accumulation) varied dynamically by season and by time of day. While Delhi experiences PM levels 10 times higher than cities in North America and western Europe, PN levels were comparable to those observed in urban sites in relatively cleaner (in terms of aerosol mass) cities. Observations from other polluted cities (e.g., in China) also show that high aerosol mass does not necessarily imply similarly high PN concentrations (Shen et al., 2011; Wu et al., 2008; Laakso et al., 2006). Furthermore, the seasonal variability of PNs was much less than that of the PM measured at our site. While it is generally assumed that UFPs constitute most of the PN concentrations, we observed that a large number of accumulation particles – that constitute most of the fine aerosol mass – contributed to almost half of the PN concentrations for some of the extremely polluted periods. UFP concentrations were found to be lower during periods with some of the highest mass concentrations.
We show that the lack of proportionality between aerosol mass and number concentrations results from the rapid coagulation of UFPs, especially during periods with high accumulation mode concentrations. Furthermore, the accumulation mode particles can also act as a strong condensation sink, causing vapors to condense onto existing particles instead of forming new particles. Even though coagulation does not affect mass concentrations, it can significantly govern PN levels with important health and policy implications. Furthermore, implications of a strong accumulation mode coagulation sink for future air quality control efforts in Delhi are that a reduction in mass concentration may not produce a proportional reduction in PN concentrations. Long-term, continuous observations of PSDs from Delhi will be able to provide important insights into the role of sources and atmospheric processes that drive aerosol number concentrations.
Hourly PSD data used in this study are available via the Texas Data Repository at https://doi.org/10.18738/T8/PCO1BP (Gani et al., 2020).
The supplement related to this article is available online at: https://doi.org/10.5194/acp-20-8533-2020-supplement.
JSA, LHR, GH, SG, and SB designed the study. SG, SB, PS, ZA, and SS carried out the data collection. SG carried out the data processing and analyses. All coauthors contributed to interpretation of results, writing, and reviewing the paper.
The authors declare that they have no conflict of interest.
We are thankful to the IIT Delhi for the institutional support. We are grateful to all student and staff members at the Aerosol Research and Characterization Laboratory (especially Nisar Ali Baig and Mohammad Yawar Hasan) and the Environmental Engineering Laboratory (especially Sanjay Gupta) at IIT Delhi for their constant support. We are thankful to Maynard Havlicek (TSI) for always providing timely technical support for the instrumentation. Tareq Hussein provided the scripts used for the mode fitting of the particle size distribution.
This research has been supported by the ClimateWorks Foundation.
This paper was edited by Veli-Matti Kerminen and reviewed by two anonymous referees.
Abernethy, R. C., Allen, R. W., McKendry, I. G., and Brauer, M.: A land use regression model for ultrafine particles in Vancouver, Canada, Environ. Sci. Technol., 47, 5217–5225, https://doi.org/10.1021/es304495s, 2013. a
Apte, J. S., Kirchstetter, T. W., Reich, A. H., Deshpande, S. J., Kaushik, G., Chel, A., Marshall, J. D., and Nazaroff, W. W.: Concentrations of fine, ultrafine, and black carbon particles in auto-rickshaws in New Delhi, India, Atmos. Environ., 45, 4470–4480, https://doi.org/10.1016/j.atmosenv.2011.05.028, 2011. a
Apte, J. S., Messier, K. P., Gani, S., Brauer, M., Kirchstetter, T. W., Lunden, M. M., Marshall, J. D., Portier, C. J., Vermeulen, R. C., and Hamburg, S. P.: High-resolution air pollution mapping with Google Street View cars: Exploiting big data, Environ. Sci. Technol., 51, 6999–7008, https://doi.org/10.1021/acs.est.7b00891, 2017. a
Apte, J. S., Brauer, M., Cohen, A. J., Ezzati, M., and Pope, C. A.: Ambient PM2.5 reduces global and regional life expectancy, Environ. Sci. Technol. Lett., 5, 546–551, https://doi.org/10.1021/acs.estlett.8b00360, 2018. a
Bhandari, S., Gani, S., Patel, K., Wang, D. S., Soni, P., Arub, Z., Habib, G., Apte, J. S., and Hildebrandt Ruiz, L.: Sources and atmospheric dynamics of organic aerosol in New Delhi, India: insights from receptor modeling, Atmos. Chem. Phys., 20, 735–752, https://doi.org/10.5194/acp-20-735-2020, 2020. a, b
Bianchi, F., Tröstl, J., Junninen, H., Frege, C., Henne, S., Hoyle, C. R., Molteni, U., Herrmann, E., Adamov, A., Bukowiecki, N., Chen, X., Duplissy, J., Gysel, M., Hutterli, M., Kangasluoma, J., Kontkanen, J., Kürten, A., Manninen, H. E., Münch, S., Peräkylä, O., Petäjä, T., Rondo, L., Williamson, C., Weingartner, E., Curtius, J., Worsnop, D. R., Kulmala, M., Dommen, J., and Baltensperger, U.: New particle formation in the free troposphere: A question of chemistry and timing, Science, 352, 1109–1112, https://doi.org/10.1126/science.aad5456, 2016. a
Brines, M., Dall'Osto, M., Beddows, D. C. S., Harrison, R. M., Gómez-Moreno, F., Núñez, L., Artíñano, B., Costabile, F., Gobbi, G. P., Salimi, F., Morawska, L., Sioutas, C., and Querol, X.: Traffic and nucleation events as main sources of ultrafine particles in high-insolation developed world cities, Atmos. Chem. Phys., 15, 5929–5945, https://doi.org/10.5194/acp-15-5929-2015, 2015. a, b, c, d
Brüggemann, E., Gerwig, H., Gnauk, T., Müller, K., and Herrmann, H.: Influence of seasons, air mass origin and day of the week on size-segregated chemical composition of aerosol particles at a kerbside, Atmos. Environ., 43, 2456–2463, https://doi.org/10.1016/j.atmosenv.2009.01.054, 2009. a
Buonanno, G., Dell'Isola, M., Stabile, L., and Viola, A.: Uncertainty Budget of the SMPS–APS System in the Measurement of PM1, PM2.5, and PM10, Aerosol Sci. Tech., 43, 1130–1141, https://doi.org/10.1080/02786820903204078, 2009. a
Cai, R. and Jiang, J.: A new balance formula to estimate new particle formation rate: reevaluating the effect of coagulation scavenging, Atmos. Chem. Phys., 17, 12659–12675, https://doi.org/10.5194/acp-17-12659-2017, 2017. a
Calvo, A., Alves, C., Castro, A., Pont, V., Vicente, A., and Fraile, R.: Research on aerosol sources and chemical composition: Past, current and emerging issues, Atmos. Res., 120–121, 1–28, https://doi.org/10.1016/j.atmosres.2012.09.021, 2013. a
Charron, A. and Harrison, R. M.: Primary particle formation from vehicle emissions during exhaust dilution in the roadside atmosphere, Atmos. Environ., 37, 4109–4119, https://doi.org/10.1016/S1352-2310(03)00510-7, 2003. a
Chen, J., Li, C., Ristovski, Z., Milic, A., Gu, Y., Islam, M. S., Wang, S., Hao, J., Zhang, H., He, C., Guo, H., Fu, H., Miljevic, B., Morawska, L., Thai, P., LAM, Y. F., Pereira, G., Ding, A., Huang, X., and Dumka, U. C.: A review of biomass burning: Emissions and impacts on air quality, health and climate in China, Sci. Total Environ., 579, 1000–1034, https://doi.org/10.1016/j.scitotenv.2016.11.025, 2017. a, b, c
Cheung, H. C., Chou, C. C.-K., Chen, M.-J., Huang, W.-R., Huang, S.-H., Tsai, C.-Y., and Lee, C. S. L.: Seasonal variations of ultra-fine and submicron aerosols in Taipei, Taiwan: implications for particle formation processes in a subtropical urban area, Atmos. Chem. Phys., 16, 1317–1330, https://doi.org/10.5194/acp-16-1317-2016, 2016. a
Chu, B., Kerminen, V.-M., Bianchi, F., Yan, C., Petäjä, T., and Kulmala, M.: Atmospheric new particle formation in China, Atmos. Chem. Phys., 19, 115–138, https://doi.org/10.5194/acp-19-115-2019, 2019. a
Cohen, A. J., Brauer, M., Burnett, R., Anderson, H. R., Frostad, J., Estep, K., Balakrishnan, K., Brunekreef, B., Dandona, L., Dandona, R., Feigin, V., Freedman, G., Hubbell, B., Jobling, A., Kan, H., Knibbs, L., Liu, Y., Martin, R., Morawska, L., Pope, C. A., Shin, H., Straif, K., Shaddick, G., Thomas, M., van Dingenen, R., van Donkelaar, A., Vos, T., Murray, C. J. L., and Forouzanfar, M. H.: Estimates and 25-year trends of the global burden of disease attributable to ambient air pollution: an analysis of data from the Global Burden of Diseases Study 2015, Lancet, 389, 1907–1918, https://doi.org/10.1016/S0140-6736(17)30505-6, 2017. a
Dada, L., Paasonen, P., Nieminen, T., Buenrostro Mazon, S., Kontkanen, J., Peräkylä, O., Lehtipalo, K., Hussein, T., Petäjä, T., Kerminen, V.-M., Bäck, J., and Kulmala, M.: Long-term analysis of clear-sky new particle formation events and nonevents in Hyytiälä, Atmos. Chem. Phys., 17, 6227–6241, https://doi.org/10.5194/acp-17-6227-2017, 2017. a
Fruin, S., Westerdahl, D., Sax, T., Sioutas, C., and Fine, P.: Measurements and predictors of on-road ultrafine particle concentrations and associated pollutants in Los Angeles, Atmos. Environ., 42, 207–219, https://doi.org/10.1016/j.atmosenv.2007.09.057, 2008. a
Gani, S., Bhandari, S., Seraj, S., Wang, D. S., Patel, K., Soni, P., Arub, Z., Habib, G., Hildebrandt Ruiz, L., and Apte, J. S.: Submicron aerosol composition in the world's most polluted megacity: the Delhi Aerosol Supersite study, Atmos. Chem. Phys., 19, 6843–6859, https://doi.org/10.5194/acp-19-6843-2019, 2019. a, b, c, d, e, f, g, h, i, j, k
Gani, S., Bhandari, S., Patel, K., Seraj, S., Soni, P., Arub, Z., Habib, G., Hildebrandt Ruiz, L., and Apte, J. S.: Data published in “Particle number concentrations and size distribution in a polluted megacity: The Delhi Aerosol Supersite study”, Texas Data Repository Dataverse, V1, https://doi.org/10.18738/T8/PCO1BP, 2020. a
Guo, S., Hu, M., Zamora, M. L., Peng, J., Shang, D., Zheng, J., Du, Z., Wu, Z., Shao, M., Zeng, L., Molina, M. J., and Zhang, R.: Elucidating severe urban haze formation in China, P. Natl. Acad. Sci. USA, 111, 17373–17378, https://doi.org/10.1073/pnas.1419604111, 2014. a
Guttikunda, S. K. and Calori, G.: A GIS based emissions inventory at 1 km × 1 km spatial resolution for air pollution analysis in Delhi, India, Atmos. Environ., 67, 101–111, https://doi.org/10.1016/j.atmosenv.2012.10.040, 2013. a, b
Guttikunda, S. K. and Gurjar, B. R.: Role of meteorology in seasonality of air pollution in megacity Delhi, India, Environ. Monit. Assess., 184, 3199–3211, https://doi.org/10.1007/s10661-011-2182-8, 2012. a
Guttikunda, S. K. and Mohan, D.: Re-fueling road transport for better air quality in India, Energ. Policy, 68, 556–561, https://doi.org/10.1016/j.enpol.2013.12.067, 2014. a
Hamed, A., Korhonen, H., Sihto, S.-L., Joutsensaari, J., Järvinen, H., Petäjä, T., Arnold, F., Nieminen, T., Kulmala, M., Smith, J. N., Lehtinen, K. E. J., and Laaksonen, A.: The role of relative humidity in continental new particle formation, J. Geophys. Res., 116, D03202, https://doi.org/10.1029/2010JD014186, 2011. a
Hofman, J., Staelens, J., Cordell, R., Stroobants, C., Zikova, N., Hama, S., Wyche, K., Kos, G., Zee, S. V. D., Smallbone, K., Weijers, E., Monks, P., and Roekens, E.: Ultrafine particles in four European urban environments: Results from a new continuous long-term monitoring network, Atmos. Environ., 136, 68–81, https://doi.org/10.1016/j.atmosenv.2016.04.010, 2016. a
Hu, M., Peng, J., Sun, K., Yue, D., Guo, S., Wiedensohler, A., and Wu, Z.: Estimation of size-resolved ambient particle density based on the measurement of aerosol number, mass, and chemical size distributions in the winter in Beijing, Environ. Sci. Technol., 46, 9941–9947, https://doi.org/10.1021/es204073t, 2012. a
Husar, R., Whitby, K., and Liu, B.: Physical mechanisms governing the dynamics of Los Angeles smog aerosol, J. Colloid Interf. Sci., 39, 211–224, https://doi.org/10.1016/0021-9797(72)90155-5, 1972. a
Hussein, T., Puustinen, A., Aalto, P. P., Mäkelä, J. M., Hämeri, K., and Kulmala, M.: Urban aerosol number size distributions, Atmos. Chem. Phys., 4, 391–411, https://doi.org/10.5194/acp-4-391-2004, 2004. a, b, c, d, e
Hussein, T., Dal Maso, M., Petäjä, T., Koponen, I. K., Paatero, P., Aalto, P. P., Hämeri, K., and Kulmala, M.: Evaluation of an automatic algorithm for fitting the particle number size distributions, Boreal Environ. Res., 10, 337–355, 2005. a
Hussein, T., Sogacheva, L., and Petäjä, T.: Accumulation and coarse modes particle concentrations during dew formation and precipitation, Aerosol Air Qual. Res., 18, 2929–2938, https://doi.org/10.4209/aaqr.2017.10.0362, 2018. a
Indian National Science Academy: Seasons of Delhi, available at: http://www.insaindia.res.in/climate.php (last access: 1 December 2019), 2018. a
Ingham, D.: Diffusion of aerosols from a stream flowing through a cylindrical tube, J. Aerosol Sci., 6, 125–132, https://doi.org/10.1016/0021-8502(75)90005-1, 1975. a
Jaiprakash, Singhai, A., Habib, G., Raman, R. S., and Gupta, T.: Chemical characterization of PM1.0 aerosol in Delhi and source apportionment using positive matrix factorization, Environ. Sci. Pollut. R., 24, 445–462, https://doi.org/10.1007/s11356-016-7708-8, 2017. a
Janhäll, S., Andreae, M. O., and Pöschl, U.: Biomass burning aerosol emissions from vegetation fires: particle number and mass emission factors and size distributions, Atmos. Chem. Phys., 10, 1427–1439, https://doi.org/10.5194/acp-10-1427-2010, 2010. a, b
Jimenez, J. L., Canagaratna, M. R., Donahue, N. M., Prevot, A. S. H., Zhang, Q., Kroll, J. H., DeCarlo, P. F., Allan, J. D., Coe, H., Ng, N. L., Aiken, A. C., Docherty, K. S., Ulbrich, I. M., Grieshop, A. P., Robinson, A. L., Duplissy, J., Smith, J. D., Wilson, K. R., Lanz, V. A., Hueglin, C., Sun, Y. L., Tian, J., Laaksonen, A., Raatikainen, T., Rautiainen, J., Vaattovaara, P., Ehn, M., Kulmala, M., Tomlinson, J. M., Collins, D. R., Cubison, M. J., Dunlea, J., Huffman, J. A., Onasch, T. B., Alfarra, M. R., Williams, P. I., Bower, K., Kondo, Y., Schneider, J., Drewnick, F., Borrmann, S., Weimer, S., Demerjian, K., Salcedo, D., Cottrell, L., Griffin, R., Takami, A., Miyoshi, T., Hatakeyama, S., Shimono, A., Sun, J. Y., Zhang, Y. M., Dzepina, K., Kimmel, J. R., Sueper, D., Jayne, J. T., Herndon, S. C., Trimborn, A. M., Williams, L. R., Wood, E. C., Middlebrook, A. M., Kolb, C. E., Baltensperger, U., and Worsnop, D. R.: Evolution of organic aerosols in the atmosphere, Science, 326, 1525–1529, https://doi.org/10.1126/science.1180353, 2009. a
Johansson, C., Norman, M., and Gidhagen, L.: Spatial & temporal variations of PM10 and particle number concentrations in urban air, Environ. Monit. Assess., 127, 477–487, https://doi.org/10.1007/s10661-006-9296-4, 2007. a
Kangasluoma, J. and Attoui, M.: Review of sub-3 nm condensation particle counters, calibrations, and cluster generation methods, Aerosol Sci. Tech., 53, 1277–1310, https://doi.org/10.1080/02786826.2019.1654084, 2019. a
Kerminen, V.-M., Pirjola, L., and Kulmala, M.: How significantly does coagulational scavenging limit atmospheric particle production?, J. Geophys. Res.-Atmos., 106, 24119–24125, https://doi.org/10.1029/2001JD000322, 2001. a, b
Kerminen, V.-M., Chen, X., Vakkari, V., Petäjä, T., Kulmala, M., and Bianchi, F.: Atmospheric new particle formation and growth: Review of field observations, Environ. Res. Lett., 13, 103003, https://doi.org/10.1088/1748-9326/aadf3c, 2018. a, b, c
Kontkanen, J., Lehtipalo, K., Ahonen, L., Kangasluoma, J., Manninen, H. E., Hakala, J., Rose, C., Sellegri, K., Xiao, S., Wang, L., Qi, X., Nie, W., Ding, A., Yu, H., Lee, S., Kerminen, V.-M., Petäjä, T., and Kulmala, M.: Measurements of sub-3 nm particles using a particle size magnifier in different environments: from clean mountain top to polluted megacities, Atmos. Chem. Phys., 17, 2163–2187, https://doi.org/10.5194/acp-17-2163-2017, 2017. a
Kulmala, M.: How particles nucleate and grow?, Science, 302, 1000–1001, https://doi.org/10.1126/science.1090848, 2003. a, b
Kulmala, M. and Kerminen, V.-M.: On the formation and growth of atmospheric nanoparticles, Atmos. Res., 90, 132–150, https://doi.org/10.1016/j.atmosres.2008.01.005, 2008. a, b
Kulmala, M., Toivonen, A., Mäkelä, J. M., and Laaksonen, A.: Analysis of the growth of nucleation mode particles observed in Boreal forest, Tellus B, 50, 449–462, https://doi.org/10.3402/tellusb.v50i5.16229, 1998. a
Kulmala, M., Maso, M. D., Mäkelä, J. M., Pirjola, L., Väkevä, M., Aalto, P., Miikkulainen, P., Hämeri, K., and O'Dowd, C. D.: On the formation, growth and composition of nucleation mode particles, Tellus B, 53, 479–490, https://doi.org/10.3402/tellusb.v53i4.16622, 2001. a
Kulmala, M., Vehkamäki, H., Petäjä, T., Maso, M. D., Lauri, A., Kerminen, V.-M., Birmili, W., and McMurry, P.: Formation and growth rates of ultrafine atmospheric particles: A review of observations, J. Aerosol Sci., 35, 143–176, https://doi.org/10.1016/j.jaerosci.2003.10.003, 2004. a, b, c
Kulmala, M., Petäjä, T., Nieminen, T., Sipilä, M., Manninen, H. E., Lehtipalo, K., Dal Maso, M., Aalto, P. P., Junninen, H., Paasonen, P., Riipinen, I., Lehtinen, K. E. J., Laaksonen, A., and Kerminen, V.-M.: Measurement of the nucleation of atmospheric aerosol particles, Nat. Prot., 7, 1651–67, https://doi.org/10.1038/nprot.2012.091, 2012. a
Kulmala, M., Kerminen, V.-M., Petäjä, T., Ding, A. J., and Wang, L.: Atmospheric gas-to-particle conversion: Why NPF events are observed in megacities?, Faraday Discuss., 200, 271–288, https://doi.org/10.1039/C6FD00257A, 2017. a, b
Kumar, M., Raju, M. P., Singh, R., Singh, A., Singh, R. S., and Banerjee, T.: Wintertime characteristics of aerosols over middle Indo-Gangetic Plain: Vertical profile, transport and radiative forcing, Atmos. Res., 183, 268–282, https://doi.org/10.1016/j.atmosres.2016.09.012, 2017. a
Kumar, P., Robins, A., Vardoulakis, S., and Britter, R.: A review of the characteristics of nanoparticles in the urban atmosphere and the prospects for developing regulatory controls, Atmos. Environ., 44, 5035–5052, https://doi.org/10.1016/j.atmosenv.2010.08.016, 2010. a, b, c
Kumar, P., Pirjola, L., Ketzel, M., and Harrison, R. M.: Nanoparticle emissions from 11 non-vehicle exhaust sources – A review, Atmos. Environ., 67, 252–277, https://doi.org/10.1016/j.atmosenv.2012.11.011, 2013. a
Laakso, L., Grönholm, T., Rannik, U., Kosmale, M., Fiedler, V., Vehkamäki, H., and Kulmala, M.: Ultrafine particle scavenging coefficients calculated from 6 years field measurements, Atmos. Environ., 37, 3605–3613, https://doi.org/10.1016/S1352-2310(03)00326-1, 2003. a
Laakso, L., Koponen, I. K., Mönkkönen, P., Kulmala, M., Kerminen, V.-M., Wehner, B., Wiedensohler, A., Wu, Z., and Hu, M.: Aerosol particles in the developing world; a comparison between New Delhi in India and Beijing in China, Water Air Soil Poll., 173, 5–20, https://doi.org/10.1007/s11270-005-9018-5, 2006. a, b, c, d, e
Luan, T., Guo, X., Zhang, T., and Guo, L.: Below-cloud aerosol scavenging by different-intensity rains in Beijing city, J. Meteorol. Res., 33, 126–137, https://doi.org/10.1007/s13351-019-8079-0, 2019. a
Manning, M. I., Martin, R. V., Hasenkopf, C., Flasher, J., and Li, C.: Diurnal patterns in global fine particulate matter concentration, Environ. Sci. Technol. Lett., 5, 687–691, https://doi.org/10.1021/acs.estlett.8b00573, 2018. a
Mishra, R. K., Pandey, A., Pandey, G., and Kumar, A.: The effect of odd-even driving scheme on PM2.5 and PM1.0 emission, Transport. Res. D-Tr. E., 67, 541–552, https://doi.org/10.1016/j.trd.2019.01.005, 2019. a
Mönkkönen, P., Koponen, I., Lehtinen, K., Uma, R., Srinivasan, D., Hämeri, K., and Kulmala, M.: Death of nucleation and Aitken mode particles: Observations at extreme atmospheric conditions and their theoretical explanation, J. Aerosol Sci., 35, 781–787, https://doi.org/10.1016/j.jaerosci.2003.12.004, 2004a. a, b
Mönkkönen, P., Uma, R., Srinivasan, D., Koponen, I., Lehtinen, K., Hämeri, K., Suresh, R., Sharma, V., and Kulmala, M.: Relationship and variations of aerosol number and PM10 mass concentrations in a highly polluted urban environment – New Delhi, India, Atmos. Environ., 38, 425–433, https://doi.org/10.1016/j.atmosenv.2003.09.071, 2004b. a
Mönkkönen, P., Koponen, I. K., Lehtinen, K. E. J., Hämeri, K., Uma, R., and Kulmala, M.: Measurements in a highly polluted Asian mega city: observations of aerosol number size distribution, modal parameters and nucleation events, Atmos. Chem. Phys., 5, 57–66, https://doi.org/10.5194/acp-5-57-2005, 2005. a
Nieminen, T., Kerminen, V.-M., Petäjä, T., Aalto, P. P., Arshinov, M., Asmi, E., Baltensperger, U., Beddows, D. C. S., Beukes, J. P., Collins, D., Ding, A., Harrison, R. M., Henzing, B., Hooda, R., Hu, M., Hõrrak, U., Kivekäs, N., Komsaare, K., Krejci, R., Kristensson, A., Laakso, L., Laaksonen, A., Leaitch, W. R., Lihavainen, H., Mihalopoulos, N., Németh, Z., Nie, W., O'Dowd, C., Salma, I., Sellegri, K., Svenningsson, B., Swietlicki, E., Tunved, P., Ulevicius, V., Vakkari, V., Vana, M., Wiedensohler, A., Wu, Z., Virtanen, A., and Kulmala, M.: Global analysis of continental boundary layer new particle formation based on long-term measurements, Atmos. Chem. Phys., 18, 14737–14756, https://doi.org/10.5194/acp-18-14737-2018, 2018. a
Ning, Z., Chan, K. L., Wong, K. C., Westerdahl, D., Močnik, G., Zhou, J. H., and Cheung, C. S.: Black carbon mass size distributions of diesel exhaust and urban aerosols measured using differential mobility analyzer in tandem with Aethalometer, Atmos. Environ., 80, 31–40, https://doi.org/10.1016/j.atmosenv.2013.07.037, 2013. a
Oberdörster, G., Oberdörster, E., and Oberdörster, J.: Nanotoxicology: An emerging discipline evolving from studies of ultrafine particles, Environ. Health Persp., 113, 823–839, https://doi.org/10.1289/ehp.7339, 2005. a
Paasonen, P., Kupiainen, K., Klimont, Z., Visschedijk, A., Denier van der Gon, H. A. C., and Amann, M.: Continental anthropogenic primary particle number emissions, Atmos. Chem. Phys., 16, 6823–6840, https://doi.org/10.5194/acp-16-6823-2016, 2016. a, b
Pant, P., Shukla, A., Kohl, S. D., Chow, J. C., Watson, J. G., and Harrison, R. M.: Characterization of ambient PM2.5 at a pollution hotspot in New Delhi, India and inference of sources, Atmos. Environ., 109, 178–189, https://doi.org/10.1016/j.atmosenv.2015.02.074, 2015. a
Peng, J. F., Hu, M., Wang, Z. B., Huang, X. F., Kumar, P., Wu, Z. J., Guo, S., Yue, D. L., Shang, D. J., Zheng, Z., and He, L. Y.: Submicron aerosols at thirteen diversified sites in China: size distribution, new particle formation and corresponding contribution to cloud condensation nuclei production, Atmos. Chem. Phys., 14, 10249–10265, https://doi.org/10.5194/acp-14-10249-2014, 2014. a
Pich, J.: Theory of gravitational deposition of particles from laminar flows in channels, J. Aerosol Sci., 3, 351–361, https://doi.org/10.1016/0021-8502(72)90090-0, 1972. a
Pope, C. A. and Dockery, D. W.: Health effects of fine particulate air pollution: Lines that connect, J. Air Waste Manage., 56, 709–742, https://doi.org/10.1080/10473289.2006.10464485, 2006. a
Pryor, S. C., Joerger, V. M., and Sullivan, R. C.: Empirical estimates of size-resolved precipitation scavenging coefficients for ultrafine particles, Atmos. Environ., 143, 133–138, https://doi.org/10.1016/j.atmosenv.2016.08.036, 2016. a
Putaud, J.-P., Dingenen, R. V., Alastuey, A., Bauer, H., Birmili, W., Cyrys, J., Flentje, H., Fuzzi, S., Gehrig, R., Hansson, H., Harrison, R., Herrmann, H., Hitzenberger, R., Hüglin, C., Jones, A., Kasper-Giebl, A., Kiss, G., Kousa, A., Kuhlbusch, T., Löschau, G., Maenhaut, W., Molnar, A., Moreno, T., Pekkanen, J., Perrino, C., Pitz, M., Puxbaum, H., Querol, X., Rodriguez, S., Salma, I., Schwarz, J., Smolik, J., Schneider, J., Spindler, G., ten Brink, H., Tursic, J., Viana, M., Wiedensohler, A., and Raes, F.: A European aerosol phenomenology – 3: Physical and chemical characteristics of particulate matter from 60 rural, urban, and kerbside sites across Europe, Atmos. Environ., 44, 1308–1320, https://doi.org/10.1016/j.atmosenv.2009.12.011, 2010. a
Puustinen, A., Hämeri, K., Pekkanen, J., Kulmala, M., de Hartog, J., Meliefste, K., ten Brink, H., Kos, G., Katsouyanni, K., Karakatsani, A., Kotronarou, A., Kavouras, I., Meddings, C., Thomas, S., Harrison, R., Ayres, J. G., van der Zee, S., and Hoek, G.: Spatial variation of particle number and mass over four European cities, Atmos. Environ., 41, 6622–6636, https://doi.org/10.1016/j.atmosenv.2007.04.020, 2007. a, b
Reche, C., Querol, X., Alastuey, A., Viana, M., Pey, J., Moreno, T., Rodríguez, S., González, Y., Fernández-Camacho, R., de la Rosa, J., Dall'Osto, M., Prévôt, A. S. H., Hueglin, C., Harrison, R. M., and Quincey, P.: New considerations for PM, Black Carbon and particle number concentration for air quality monitoring across different European cities, Atmos. Chem. Phys., 11, 6207–6227, https://doi.org/10.5194/acp-11-6207-2011, 2011. a
Riffault, V., Arndt, J., Marris, H., Mbengue, S., Setyan, A., Alleman, L. Y., Deboudt, K., Flament, P., Augustin, P., Delbarre, H., and Wenger, J.: Fine and ultrafine particles in the vicinity of industrial activities: A review, Crit. Rev. Env. Sci. Tec., 45, 2305–2356, https://doi.org/10.1080/10643389.2015.1025636, 2015. a
Robinson, A. L., Donahue, N. M., Shrivastava, M. K., Weitkamp, E. A., Sage, A. M., Grieshop, A. P., Lane, T. E., Pierce, J. R., and Pandis, S. N.: Rethinking organic aerosols: Semivolatile emissions and photochemical aging, Science, 315, 1259–1262, https://doi.org/10.1126/science.1133061, 2007. a
Rodríguez, S., Van Dingenen, R., Putaud, J.-P., Dell'Acqua, A., Pey, J., Querol, X., Alastuey, A., Chenery, S., Ho, K.-F., Harrison, R., Tardivo, R., Scarnato, B., and Gemelli, V.: A study on the relationship between mass concentrations, chemistry and number size distribution of urban fine aerosols in Milan, Barcelona and London, Atmos. Chem. Phys., 7, 2217–2232, https://doi.org/10.5194/acp-7-2217-2007, 2007. a, b
Rönkkö, T., Kuuluvainen, H., Karjalainen, P., Keskinen, J., Hillamo, R., Niemi, J. V., Pirjola, L., Timonen, H. J., Saarikoski, S., Saukko, E., Järvinen, A., Silvennoinen, H., Rostedt, A., Olin, M., Yli-Ojanperä, J., Nousiainen, P., Kousa, A., and Dal Maso, M.: Traffic is a major source of atmospheric nanocluster aerosol, P. Natl. Acad. Sci. USA, 114, 7549–7554, https://doi.org/10.1073/pnas.1700830114, 2017. a
Saha, P. K., Zimmerman, N., Malings, C., Hauryliuk, A., Li, Z., Snell, L., Subramanian, R., Lipsky, E., Apte, J. S., Robinson, A. L., and Presto, A. A.: Quantifying high-resolution spatial variations and local source impacts of urban ultrafine particle concentrations, Sci. Total Environ., 655, 473–481, https://doi.org/10.1016/j.scitotenv.2018.11.197, 2019. a, b
Salma, I., Borsós, T., Weidinger, T., Aalto, P., Hussein, T., Dal Maso, M., and Kulmala, M.: Production, growth and properties of ultrafine atmospheric aerosol particles in an urban environment, Atmos. Chem. Phys., 11, 1339–1353, https://doi.org/10.5194/acp-11-1339-2011, 2011. a
Salma, I., Füri, P., Németh, Z., Balásházy, I., Hofmann, W., and Farkas, Á.: Lung burden and deposition distribution of inhaled atmospheric urban ultrafine particles as the first step in their health risk assessment, Atmos. Environ., 104, 39–49, https://doi.org/10.1016/j.atmosenv.2014.12.060, 2015. a
Sarangi, B., Aggarwal, S. G., Sinha, D., and Gupta, P. K.: Aerosol effective density measurement using scanning mobility particle sizer and quartz crystal microbalance with the estimation of involved uncertainty, Atmos. Meas. Tech., 9, 859–875, https://doi.org/10.5194/amt-9-859-2016, 2016. a
Schraufnagel, D. E., Balmes, J. R., Cowl, C. T., Matteis, S. D., Jung, S.-H., Mortimer, K., Perez-Padilla, R., Rice, M. B., Riojas-Rodriguez, H., Sood, A., Thurston, G. D., To, T., Vanker, A., and Wuebbles, D. J.: Air pollution and noncommunicable diseases: A review by the Forum of International Respiratory Societies' Environmental Committee, Part 1: The damaging effects of air pollution, Chest, 155, 409–416, https://doi.org/10.1016/j.chest.2018.10.042, 2019a. a
Schraufnagel, D. E., Balmes, J. R., Cowl, C. T., Matteis, S. D., Jung, S.-H., Mortimer, K., Perez-Padilla, R., Rice, M. B., Riojas-Rodriguez, H., Sood, A., Thurston, G. D., To, T., Vanker, A., and Wuebbles, D. J.: Air pollution and noncommunicable diseases: A review by the Forum of International Respiratory Societies' Environmental Committee, Part 2: Air pollution and organ systems, Chest, 155, 417–426, https://doi.org/10.1016/j.chest.2018.10.041, 2019b. a
Seinfeld, J. H. and Pandis, S. N.: Atmospheric Chemistry and Physics: From Air Pollution to Climate Change, 2nd edn., J. Wiley, New Jersey, USA, 2006. a, b, c, d
Shen, X. J., Sun, J. Y., Zhang, Y. M., Wehner, B., Nowak, A., Tuch, T., Zhang, X. C., Wang, T. T., Zhou, H. G., Zhang, X. L., Dong, F., Birmili, W., and Wiedensohler, A.: First long-term study of particle number size distributions and new particle formation events of regional aerosol in the North China Plain, Atmos. Chem. Phys., 11, 1565–1580, https://doi.org/10.5194/acp-11-1565-2011, 2011. a
Singh, A., Rastogi, N., Sharma, D., and Singh, D.: Inter and intra-annual variability in aerosol characteristics over Northwestern Indo-Gangetic plain, Aerosol Air Qual. Res., 15, 376–386, https://doi.org/10.4209/aaqr.2014.04.0080, 2015. a
United Nations: World Urbanization Prospects, available at: https://population.un.org/wup/ (last access: 15 August 2019), 2018. a
Wehner, B., Uhrner, U., von Löwis, S., Zallinger, M., and Wiedensohler, A.: Aerosol number size distributions within the exhaust plume of a diesel and a gasoline passenger car under on-road conditions and determination of emission factors, Atmos. Environ., 43, 1235–1245, https://doi.org/10.1016/j.atmosenv.2008.11.023, 2009. a
Westerdahl, D., Wang, X., Pan, X., and Zhang, K. M.: Characterization of on-road vehicle emission factors and microenvironmental air quality in Beijing, China, Atmos. Environ., 43, 697–705, https://doi.org/10.1016/j.atmosenv.2008.09.042, 2009. a, b
Whitby, K. T.: The physical characteristics of sulfur aerosols, Atmos. Environ., 12, 135–159, https://doi.org/10.1016/0004-6981(78)90196-8, 1978. a
Whitby, K. T., Husar, R., and Liu, B.: The aerosol size distribution of Los Angeles smog, J. Colloid Interf. Sci., 39, 177–204, https://doi.org/10.1016/0021-9797(72)90153-1, 1972. a
Whitby, K. T., Clark, W., Marple, V., Sverdrup, G., Sem, G., Willeke, K., Liu, B., and Pui, D.: Characterization of California aerosols? I. Size distributions of freeway aerosol, Atmos. Environ., 9, 463–482, https://doi.org/10.1016/0004-6981(75)90107-9, 1975. a
Willeke, K. and Whitby, K. T.: Atmospheric Aerosols: Size Distribution Interpretation, JAPCA J. Air Waste Ma., 25, 529–534, https://doi.org/10.1080/00022470.1975.10470110, 1975. a
World Health Organization: AAP Air Quality Database, available at: http://www.who.int/phe/health_topics/outdoorair/databases/cities/en/ (last access: 1 August 2019), 2018. a
Wu, Z., Hu, M., Lin, P., Liu, S., Wehner, B., and Wiedensohler, A.: Particle number size distribution in the urban atmosphere of Beijing, China, Atmos. Environ., 42, 7967–7980, https://doi.org/10.1016/j.atmosenv.2008.06.022, 2008. a, b, c, d, e
Xue, J., Xue, W., Sowlat, M. H., Sioutas, C., Lolinco, A., Hasson, A., and Kleeman, M. J.: Seasonal and annual source appointment of carbonaceous ultrafine particulate matter (PM0.1) in polluted California cities, Environ. Sci. Technol., 53, 39–49, https://doi.org/10.1021/acs.est.8b04404, 2019. a
Yao, L., Garmash, O., Bianchi, F., Zheng, J., Yan, C., Kontkanen, J., Junninen, H., Mazon, S. B., Ehn, M., Paasonen, P., Sipilä, M., Wang, M., Wang, X., Xiao, S., Chen, H., Lu, Y., Zhang, B., Wang, D., Fu, Q., Geng, F., Li, L., Wang, H., Qiao, L., Yang, X., Chen, J., Kerminen, V.-M., Petäjä, T., Worsnop, D. R., Kulmala, M., and Wang, L.: Atmospheric new particle formation from sulfuric acid and amines in a Chinese megacity, Science, 361, 278–281, https://doi.org/10.1126/science.aao4839, 2018. a
Yeh, H.-C. and Schum, G. M.: Models of human lung airways and their application to inhaled particle deposition, B. Math. Biol., 42, 461–480, https://doi.org/10.1016/S0092-8240(80)80060-7, 1980. a
Zhang, K. M. and Wexler, A. S.: Modeling the number distributions of urban and regional aerosols: theoretical foundations, Atmos. Environ., 36, 1863–1874, https://doi.org/10.1016/S1352-2310(02)00095-X, 2002. a
Zhang, Q., Jimenez, J. L., Canagaratna, M. R., Allan, J. D., Coe, H., Ulbrich, I., Alfarra, M. R., Takami, A., Middlebrook, A. M., Sun, Y. L., Dzepina, K., Dunlea, E., Docherty, K., DeCarlo, P. F., Salcedo, D., Onasch, T., Jayne, J. T., Miyoshi, T., Shimono, A., Hatakeyama, S., Takegawa, N., Kondo, Y., Schneider, J., Drewnick, F., Borrmann, S., Weimer, S., Demerjian, K., Williams, P., Bower, K., Bahreini, R., Cottrell, L., Griffin, R. J., Rautiainen, J., Sun, J. Y., Zhang, Y. M., and Worsnop, D. R.: Ubiquity and dominance of oxygenated species in organic aerosols in anthropogenically-influenced Northern Hemisphere midlatitudes, Geophys. Res. Lett., 34, L13801, https://doi.org/10.1029/2007GL029979, 2007. a
Zhou, L., Hallquist, Å. M., Hallquist, M., Salvador, C. M., Gaita, S. M., Sjödin, Å., Jerksjö, M., Salberg, H., Wängberg, I., Mellqvist, J., Liu, Q., Lee, B. P., and Chan, C. K.: A transition of atmospheric emissions of particles and gases from on-road heavy-duty trucks, Atmos. Chem. Phys., 20, 1701–1722, https://doi.org/10.5194/acp-20-1701-2020, 2020. a
Zhou, Y., Dada, L., Liu, Y., Fu, Y., Kangasluoma, J., Chan, T., Yan, C., Chu, B., Daellenbach, K. R., Bianchi, F., Kokkonen, T. V., Liu, Y., Kujansuu, J., Kerminen, V.-M., Petäjä, T., Wang, L., Jiang, J., and Kulmala, M.: Variation of size-segregated particle number concentrations in wintertime Beijing, Atmos. Chem. Phys., 20, 1201–1216, https://doi.org/10.5194/acp-20-1201-2020, 2020. a
Zhu, Y., Hinds, W. C., Kim, S., and Sioutas, C.: Concentration and size distribution of ultrafine particles near a major highway, J. Air Waste Manage., 52, 1032–1042, https://doi.org/10.1080/10473289.2002.10470842, 2002. a, b, c