the Creative Commons Attribution 4.0 License.
the Creative Commons Attribution 4.0 License.
 | 15 Jul 2020
Atmospheric reactivity and oxidation capacity during summer at a suburban site between Beijing and Tianjin
Yuan Yang
Putian Zhou
Dan Yao
Dongsheng Ji
Jie Sun
Yinghong Wang
Shuman Zhao
Wei Huang
Shuanghong Yang
Dean Chen
Wenkang Gao
Zirui Liu
Renjian Zhang
Limin Zeng
Tuukka Petäjä
Veli-Matti Kerminen
Markku Kulmala
Yuesi Wang
Hydroxyl (OH) radicals, nitrate (NO3) radicals and ozone (O3) play central roles in the troposphere because they control the lifetimes of many trace gases that result from anthropogenic and biogenic origins. To estimate the air chemistry, the atmospheric reactivity and oxidation capacity were comprehensively analyzed based on a parameterization method at a suburban site in Xianghe in the North China Plain from 6 July 2018 to 6 August 2018. The total OH, NO3 and O3 reactivities at the site varied from 9.2 to 69.6, 0.7 to 27.5 and to s−1 with campaign-averaged values of 27.5±9.7, 2.2±2.6 and s−1 (± standard deviation), respectively. NOx (NO+NO2) was by far the main contributor to the reactivities of the three oxidants, with average values of 43 %–99 %. Alkenes dominated the OH, NO3 and O3 reactivities towards total nonmethane volatile organic compounds (NMVOCs), accounting for 42.9 %, 77.8 % and 94.0 %, respectively. The total OH, NO3 and O3 reactivities displayed similar diurnal variations with the lowest values during the afternoon but the highest values during rush hours, and the diurnal profile of NOx appears to be the major driver for the diurnal profiles of the reactivities of the three oxidants. A box model (a model to Simulate the concentrations of Organic vapors, Sulfuric Acid and Aerosols; SOSAA) derived from a column chemical transport model was used to simulate OH and NO3 concentrations during the observation period. The calculated atmospheric oxidation capacity (AOC) reached 4.5×10⁸ , with a campaign-averaged value of 7.8×10⁷ dominated by OH (7.7×10⁷ , 98.2 %), O3 (1.2×10⁶ , 1.5 %) and NO3 (1.8×10⁵ , 0.3 %). Overall, the integration of OH, NO3 and O3 reactivities analysis could provide useful insights for NMVOC pollution control in the North China Plain. We suggest that further studies, especially direct observations of OH and NO3 radical concentrations and their reactivities, are required to better understand trace gas reactivity and AOC.
- Article
(3968 KB) -
Supplement
(1008 KB) - BibTeX
- EndNote


In the planetary boundary layer, high concentrations of primary pollutants, such as carbon monoxide (CO), nitrogen oxides (), and volatile organic compounds (VOCs) from both biogenic and anthropogenic origins, are transformed by reactions with atmospheric oxidants, such as hydroxyl (OH) radicals, nitrate (NO3) radicals, chlorine atoms and ozone (O3) on local to global scales (Atkinson and Arey, 2003; Heard and Pilling, 2003; Lu et al., 2018; Wang et al., 2020), with the dominant reaction depending on the time of day and specific trace gases. Ultimately, these processes lead to the formation of a series of important secondary pollutants, including tropospheric O3 and secondary organic aerosols (SOAs) (Goldstein and Galbally, 2007).
OH radicals control the daytime oxidation capacity of the atmosphere (Heard and Pilling, 2003), initiating and participating in many oxidation reaction processes. OH can react by adding OH groups to or abstracting H from trace gases, such as CO, NOx, methane (CH4) and nonmethane volatile organic compounds (NMVOCs) (Kovacs et al., 2003; Sadanaga et al., 2005). The total OH reactivity, which is equivalent to the inverse chemical OH lifetime, is the sum of the products of the concentrations and respective reaction rate coefficients for all gases that react with OH. The online techniques used to determine OH reactivity include a flow tube with sliding injector method (Kovacs et al., 2003), a comparative rate method (Sinha et al., 2008) and a laser flash photolysis pump probe technique (Whalley et al., 2016). Based on these online methods, total OH reactivity values have been measured in urban, suburban, remote and forest areas during the last decade. The urban areas investigated include Nashville, USA (SOS) (Kovacs et al., 2003), New York, USA (PMTACS-NY2004) (Ren et al., 2006a), Mexico City, Mexico (MCMA-2003) (Shirley et al., 2006), Houston, USA (TRAMP2006) (Mao et al., 2010), Paris, France (MEGAPOLI) (Dolgorouky et al., 2012), London, UK (ClearfLo) (Whalley et al., 2016), Helsinki, Finland (Praplan et al., 2017), Seoul, South Korea (Kim et al., 2016), and Beijing, China (Yang et al., 2017). The total OH reactivity in these urban areas ranged from 1 s−1 in clean air to 200 s−1 in extremely polluted air, and NOx, CO, formaldehyde (HCHO) and nonmethane hydrocarbons (NMHCs) were the main contributors (Ferracci et al., 2018). The suburban areas investigated include Whiteface Mountain, USA (PMTACS-NY2002) (Ren et al., 2006b), Weybourne, UK (TORCH-2) (Lee et al., 2010), Yufa, China (CAREBeijing-2006) (Lu et al., 2010), Backgarden, China (PRIDE-PRD) (Lou et al., 2010), Jülich, Germany (HOxComp) (Elshorbany et al., 2012), Ersa, Corsica (CARBOSOR-ChArMeX) (Zannoni et al., 2017), Po Valley, Italy (Kaiser et al., 2015), the Indo-Gangetic Plain, India (Kumar et al., 2018), and Heshan, China (Yang et al., 2017). The total OH reactivity in these suburban areas ranged from 4.6 to 64 s−1. OH reactivity was also modeled by a global model by Ferracci et al. (2018) and by a box model based on the Master Chemical Mechanism (MCM) (Whalley et al., 2016). The calculated total OH reactivity is the sum of the OH reactivities that are attributed to measured trace gases. The concentrations (in molecules cm−3) of trace gases and the reaction rate constants (in ) of these trace gases with the OH radical are the key factors for computing OH reactivity (Mogensen et al., 2011, 2015). In general, the trace gases considered in calculating OH reactivity include NMVOCs, CH4, CO, NOx, SO2 and O3. As reported, the contribution from NOx exceeds 50 % for the cities of Paris, Tokyo, New York and Beijing, showing the large influence of traffic-related emissions on OH reactivity (Dolgorouky et al., 2012; Ren, 2003; Yang et al., 2017; Yoshino et al., 2006), but the contribution from NMVOCs reaches 50 % in Mexico and Houston due to the large quantity of biomass fuel being burned and high industrial solvent emissions (Mao et al., 2010; Shirley et al., 2006).
As OH levels are vastly reduced during the nighttime due to the absence of photolysis, NO3 formed by the slow reaction is the main initiator of nighttime oxidation chemistry in the troposphere (Asaf et al., 2009; Geyer et al., 2001). NO3 reacts effectively with unsaturated NMVOCs, such as certain alkenes or aromatics via additions to double bonds, which can initiate the formation of peroxyl radicals (HO2 and RO2) and even OH (Geyer et al., 2001). High NO3 mixing ratios and large reaction rate constants with several unsaturated NMVOCs result in NO3 being the dominant sink of many unsaturated NMVOCs during the nighttime. The role of NO3 as an oxidizing agent can be assessed via its total reactivity towards trace gases. The total NO3 reactivity is an indication of nighttime oxidation rates of trace gases with direct impacts on NOx levels and indirect impacts on heterogeneous NOx losses and ClNO2 formation (Liebmann et al., 2017). As frequently reported for total OH reactivity, total NO3 reactivity can be measured online or calculated by summing the loss rates for a set of reactive trace gases. Previous works on measured total NO3 reactivity have revealed strong diel variation. For instance, the total NO3 reactivity obtained in Hyytiälä, Finland, displayed strong diel variation, with a campaign-averaged nighttime value of 0.11 s−1 and daytime value of 0.04 s−1 (Liebmann et al., 2018a), but values varied from 0.005 to 0.1 s−1 during the nighttime and reached values as high as 1.4 s−1 in the daytime in Taunus, Germany (Liebmann et al., 2017).
Along with reactions with OH and NO3 radicals, trace gases are also oxidized in the troposphere by reactions with O3. Although most NMVOCs have reaction rates with O3 that are much lower than those with either OH or NO3, O3 is very important because it is present at elevated mixing ratios in clean or contaminated atmospheres (Wang et al., 2013). The rate constants of the reactions for some alkenes with O3 are even comparable to those with NO3 (Atkinson and Arey, 2003). The total reactivity of O3 with trace gases can reflect the role of O3 as an oxidizing agent. Direct measurements of total O3 reactivity were not available until very recently (Geyer, 2003); hence, the reactivity of O3 has traditionally been calculated by summing the reactivities due to individual reactive trace gases. The calculated O3 reactivity obtained in Pabstthum, Germany, revealed that terpenes (20 %), isoprene (20 %) and other alkenes (60 %) were the dominant contributors during the night of 20 and 21 July but arose mainly (83 %) from nonbiogenic alkenes during the night of 4 and 5 August (Geyer, 2003).
As mentioned above OH radicals, NO3 radicals and O3 react with trace gases via different rate coefficients and mechanisms, resulting in profoundly different reactivities. Therefore, comprehensive evaluations of OH, NO3 and O3 reactivities are key to understanding atmospheric oxidation capacity and identifying the controlling active species of secondary pollution in the atmosphere. However, comprehensive evaluations of the total calculated OH, NO3 and O3 reactivities are scarce in China. In this study, we calculated the OH, O3 and NO3 reactivities at a suburban site (Xianghe) in the North China Plain during an intensive measurement campaign in the summer of 2018. By combining simulated OH and NO3 concentrations using a box model (a model to Simulate the concentrations of Organic vapors, Sulfuric Acid and Aerosols; SOSAA), we calculated the oxidation capacities of OH, NO3 and O3 and estimated their relative contributions.
2.1 Site description
The sampling site is located at the Xianghe Atmospheric Observatory (39.798∘ N, 116.958∘ E; 15 m above sea level), which is operated by the Institute of Atmospheric Physics (IAP)/Chinese Academy of Sciences (CAS). The sampling site is a typical suburban site in the seriously polluted Beijing–Tianjin–Hebei large urban region, which is approximately 50 km southeast of Beijing, 75 km northwest of Tianjin and 35 km northeast of Langfang in Hebei Province. The sampling site is approximately 4 km west of the downtown center and is surrounded by residential areas and agricultural land (see Fig. 1).
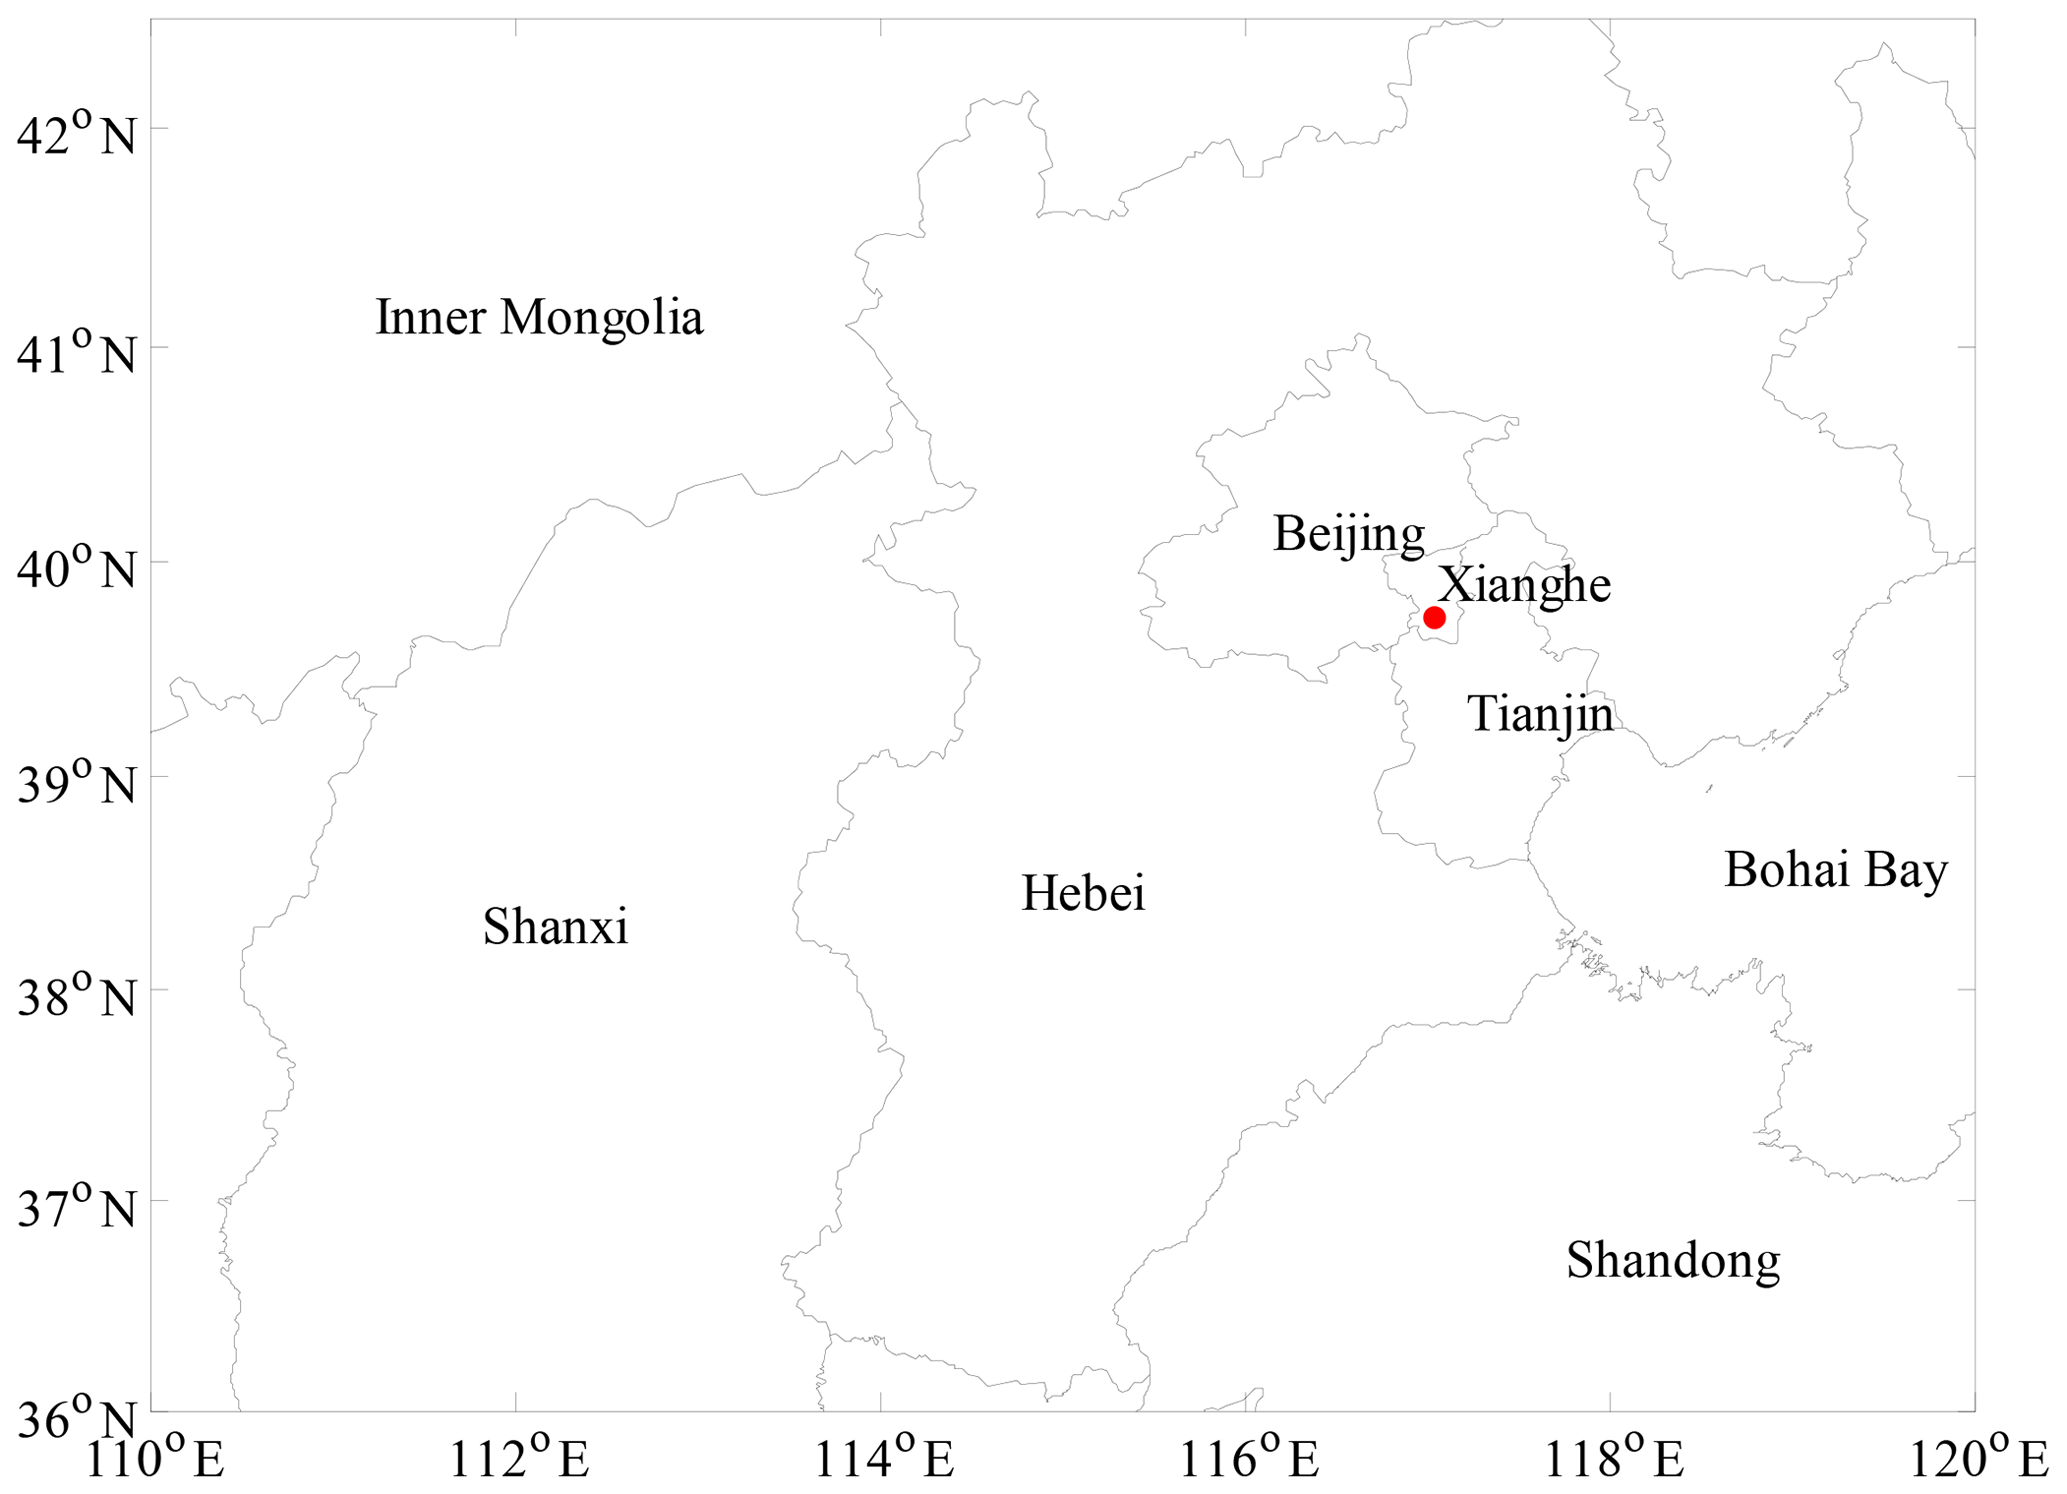
Figure 1The location of the sampling site, which is marked with a red dot. The black lines are provincial boundary lines of each province.
2.2 Experimental method
Ambient NMVOCs were collected and analyzed continuously and automatically with a time resolution of 1 h using a custom-built gas chromatography-mass spectrometry/flame ionization detection (GC-MS/FID) instrument. The suitability of this system for NMVOC measurements is well verified, and it has been used in several large field campaigns (Chen et al., 2014; Yuan et al., 2013; Wu et al., 2016). Detailed descriptions of the configuration of the GC-MS/FID system, the detection limits and the precision of NMVOC measurements can be found in our previous paper (Yang et al., 2019). CH4 was analyzed by an Agilent 7890A gas chromatography (GC) instrument with a flame ionization detector (FID). HCHO was measured by Hantzsch fluorimetry with a commercial instrument (AL4021, Aero-Laser GmbH, Germany) (Lu et al., 2019). Air-quality-related trace gases, including O3, NO–NO2–NOx, SO2 and CO were measured by analyzers from Thermo Fisher Scientific, United States. High-resolution (5 min averages) data sets of O3, NO–NO2–NOx, SO2 and CO were obtained, and hourly averaged data were used after applying strict data quality control measures. HONO mixing ratios were determined using a custom-made HONO analyzer (Zhang et al., 2019; Tong et al., 2015). The photolysis frequencies, JO1D, JNO2 and JNO3, in the atmosphere were measured by a PFS-100 photolysis spectrometer – Juguang Technology (Hangzhou) Co., Ltd, Hangzhou, China. Further details of the measurements of NMVOCs, CH4, HCHO, trace gases, HONO and photolysis frequencies can be found in the Supplement. The meteorological parameters, including wind speed, wind direction, temperature and relative humidity, were obtained from the National Meteorological Information Center (http://data.cma.cn/, last access: 20 August 2018). The sensors are approximately 3000 m away from the measurement area.
2.3 Atmospheric chemical transport model: SOSAA
SOSAA is a column (or one-dimensional) chemical transport model that was first developed by Boy et al. (2011). A more detailed description of its newest version can be found in Zhou et al. (2017a, b). In this study, a box model version of SOSAA was used, in which the meteorological variables, including air temperature, air pressure, relative humidity and incoming global radiation, were directly read from the measurement data. The chemistry scheme was generated by MCM v3.3.1 (http://mcm.leeds.ac.uk/MCMv3.3.1, last access: 25 March 2020) (Jenkin et al., 1997, 2015; Saunders et al., 2003) and then converted to Fortran code with kinetic preprocessor (KPP) (Damian et al., 2002). The mixing ratios of chemical species included in the chemistry scheme, e.g., O3, NO, NO2, SO2, CO, HONO, HCHO, isoprene and acetone, were read from the measured data when available. Ten oxygenated VOCs (OVOCs) – acrolein (ACR), C2H5CHO, methacrolein (MACR), C3H7CHO, methylvinylketone (MVK), methylethylketone (MEK), 2-pentanone (MPRK), C4H9CHO, diethylketone (DIEK) and C5H11CHO – were excluded from the input list, despite also being measured, because their simulated concentrations were compared with the measurement data to validate the model performance. Seven photolysis rates (JO1D, JHCHO_M, JNO2, JH2O2, JHONO, JNO3_M, JNO3_R) were also read from the measurement data, and the related photochemical reactions are shown below.
The other photolysis rates were calculated using the incoming global radiation. The deposition velocities of all non-input species were set to 0.01 m s−1, and the boundary layer height was assumed to be 1 km (Lu et al., 2013; Zhu et al., 2020). The simulated OVOCs were also assumed to condense onto pre-existing aerosols. Their condensation sinks were set to make their simulated concentrations approach the measurement data. The model time step was set to 10 s, and the data were output every 0.5 h. All the input data were interpolated to the model time step.
2.4 Speciated oxidant reactivity
Atmospheric oxidant reactivity is a measure of the strength of the reaction of trace gases with an oxidant (OH, O3 or NO3) (Kovacs et al., 2003; Mogensen et al., 2015). High oxidant reactivity values correspond to short lifetimes, and long-lived species have low reactivities. The total OH, NO3 and O3 reactivities can be calculated by Eqs. (1)–(3), respectively.
In the above equations, the temperature-dependent reaction rate coefficients (in ) for OH–NMVOCi (), OH–CO (kOH+CO), NO3–NMVOCi () and O3–NMVOCi () are from Atkinson and Arey (2003), Atkinson et al. (2006, 1983), Salgado et al. (2008) and MCM v3.3.1 via the website at http://mcm.leeds.ac.uk/MCM (last access: 25 March 2020). OH–NO (kOH+NO), OH–NO2 (), OH–SO2 (), OH–O3 (), NO3–NO (), NO3–NO2 (), NO3–SO2 (), O3–NO () and O3–NO2 () are from Atkinson et al. (2004). The temperature-dependent reaction rate coefficients are listed in Table S1 in the Supplement. [NMVOCi], [CH4], [CO], [NO], [NO2], [SO2] and [O3] are the corresponding number concentrations (in molecules cm−3).
2.5 Atmospheric oxidation capacity (AOC)
The term “oxidation capacity” of an oxidant X (NO3, OH and O3) is defined as the sum of the respective oxidation rates of the molecules Yi (NMVOCs, CH4 and CO) (Geyer et al., 2001).
Here, [Yi] and [X] are number concentrations of molecule Yi and oxidant X, respectively. is the temperature-dependent reaction rate coefficient of molecule Yi with oxidant X. is the oxidant X reactivity of molecule Yi.
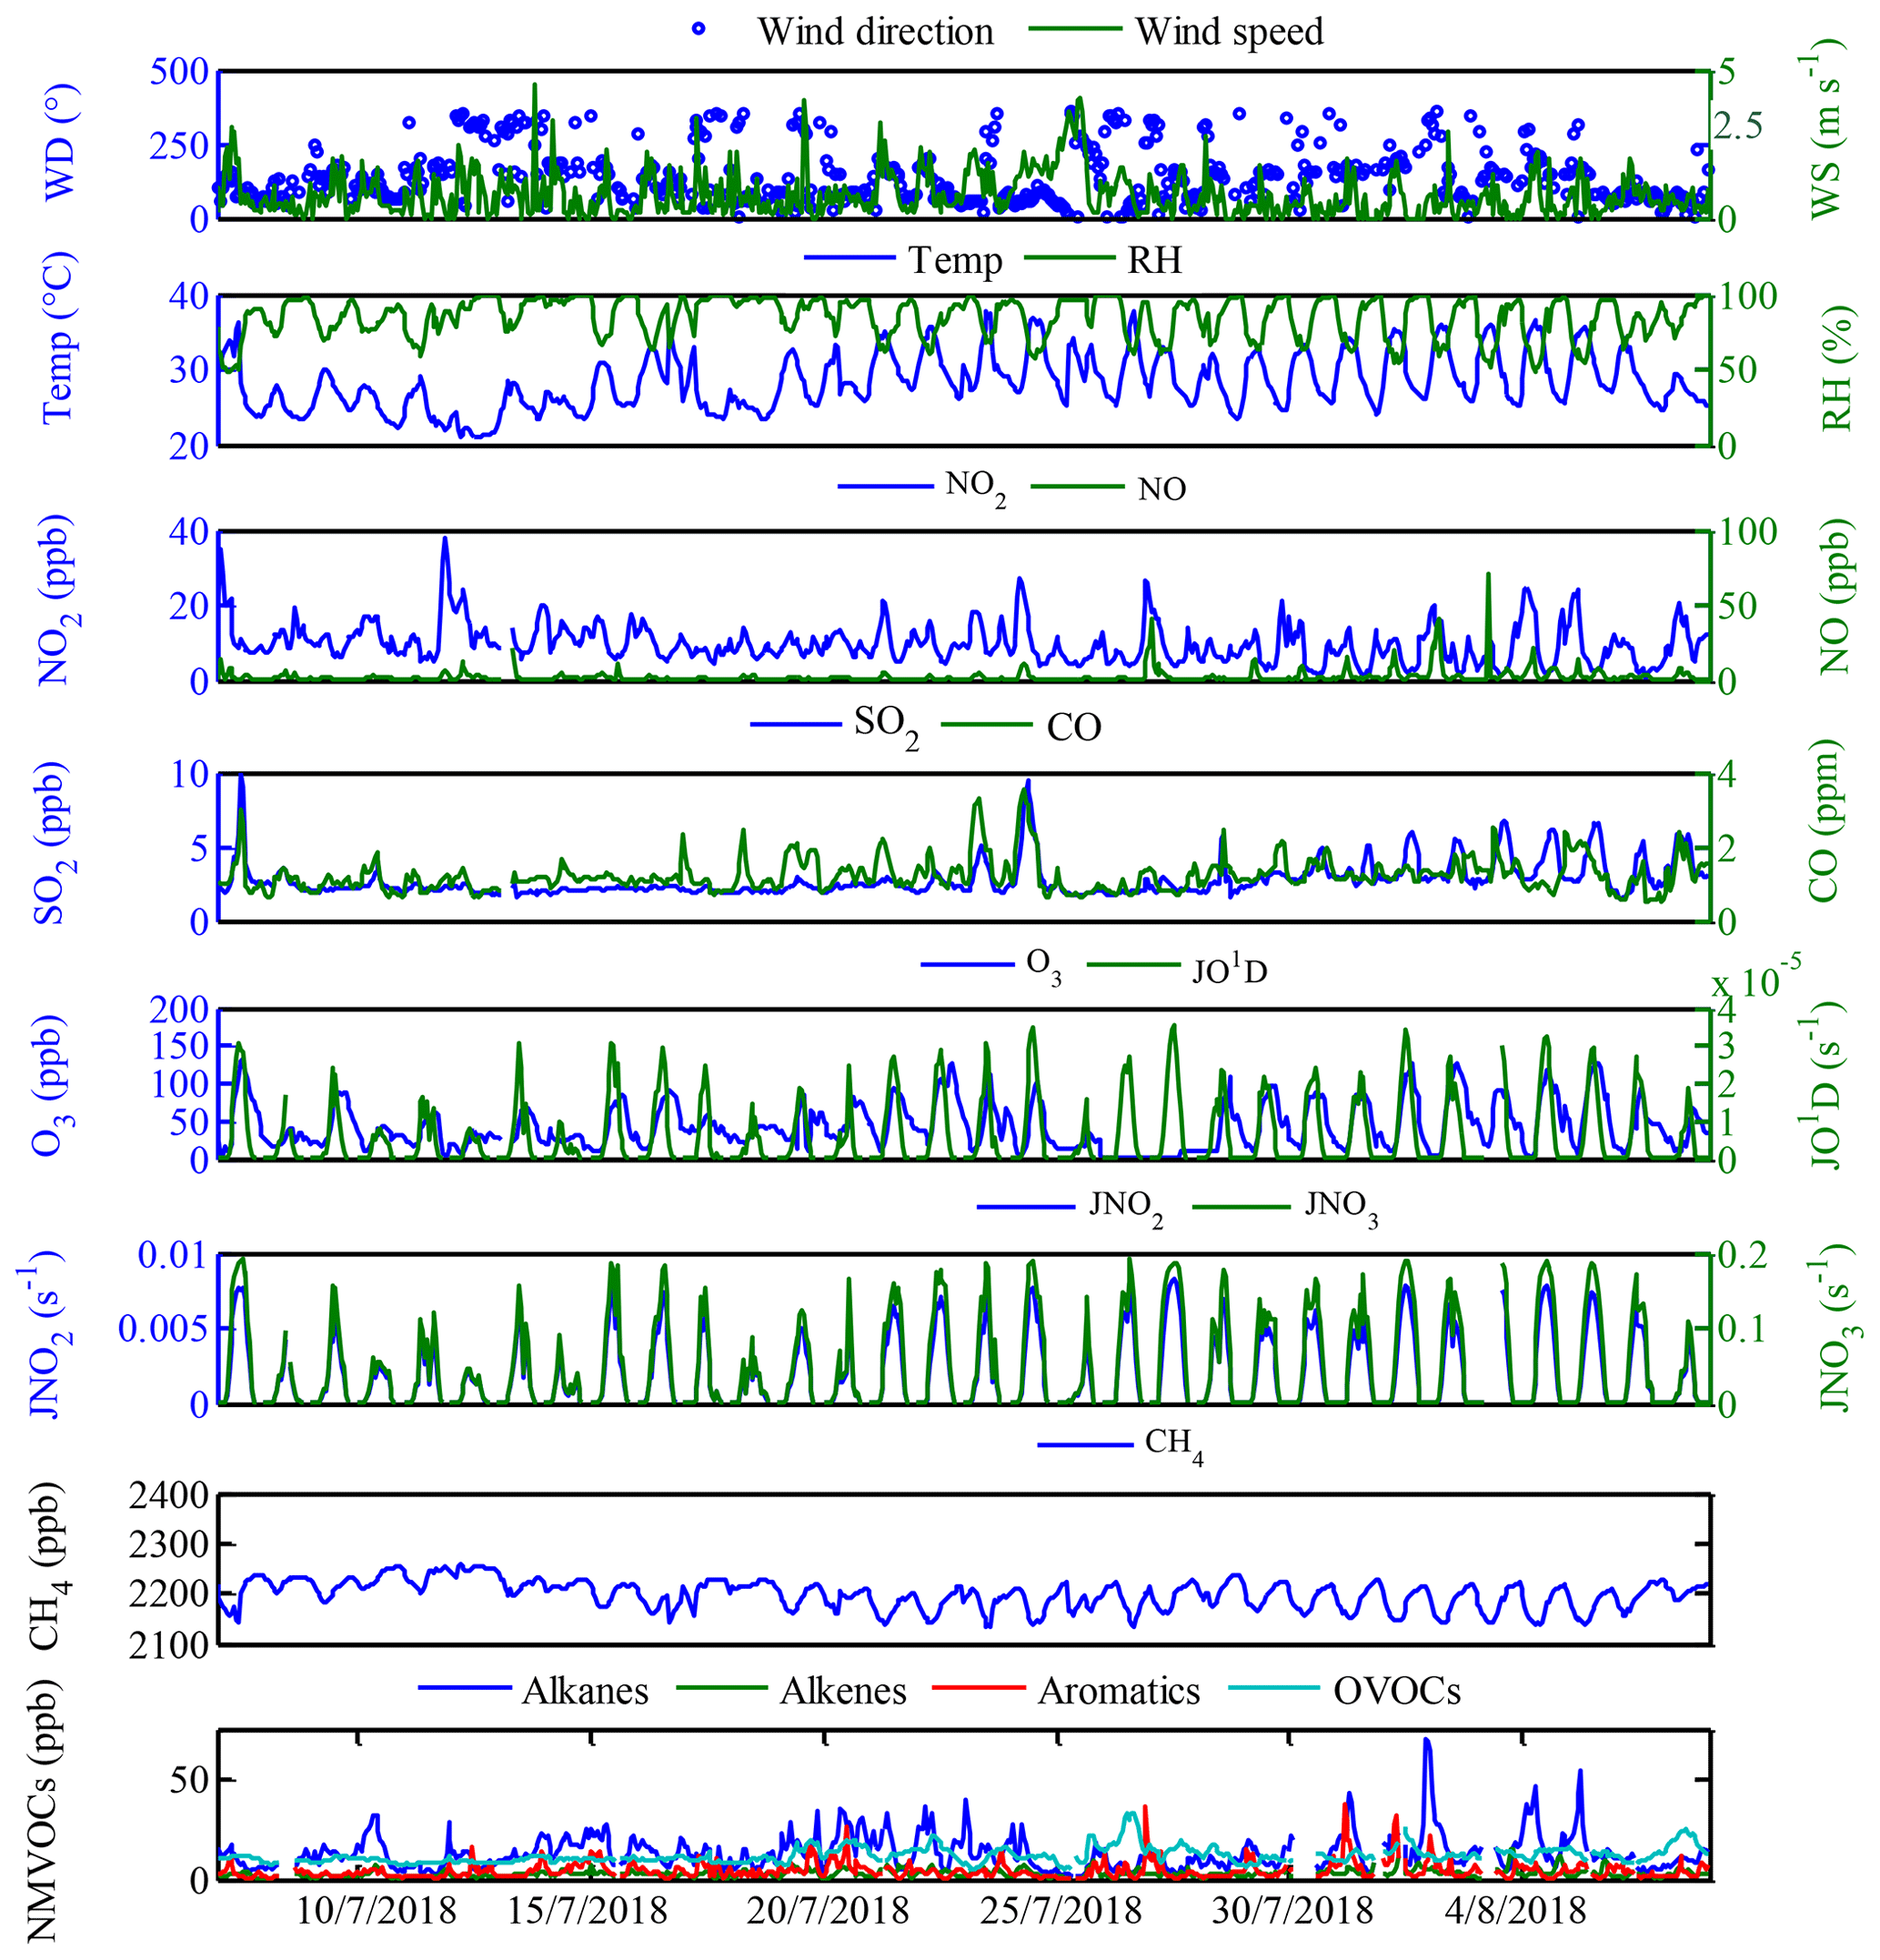
Figure 2Time series of meteorology parameters, trace gases, photolysis rates and VOC concentrations during the field campaign at Xianghe from 6 July to 6 August 2018.
3.1 Overview of measurements
For the data evaluation, all measurements were averaged over 1 h time intervals. The measured concentrations of major pollutants and meteorological parameters at Xianghe are depicted in Fig. 2, while the mean diurnal profiles are shown in Fig. S1 in the Supplement. During the campaign, sunny weather conditions prevailed with temperatures ranging from 25 to 31∘C during the daytime. Wind data suggested that the prevailing wind was from the eastern sampling site with a mean wind speed of 1.0 m s−1 ranging from 0.3 to 1.4 m s−1, and the average relative humidity was 85 %, reaching up to 96 % during the night (Fig. 2). Campaign-averaged maximum and minimum SO2 mixing ratios of 3.6 ppb at approximately 14:00 h (local time, LT) and 2.3 ppb during the nighttime were obtained (Fig. S1a). For JO1D, JNO2 and JNO3, a similar maximum at ∼14:00 h was observed, with maximum values of , and s−1, respectively (Fig. S1k–m). The maximum JO1D at this site was comparable with those in Shanghai and Chongqing but higher than that in Guangzhou and lower than that in Beijing (Tan et al., 2019; Wang et al., 2019). The observed mean daily maxima of JNO2 at this site were higher than those observed in the eastern Mediterranean (Gerasopoulos et al., 2012) but lower than those in Beijing (Wang et al., 2019).
The diurnal maximum O3 concentration was 72 ppb at this site (Fig. S1d), which was in line with that observed in Beijing (72 ppb) but higher than those measured in Guangzhou (65 ppb) and Chongqing (56 ppb) and lower than that observed in Shanghai (80 ppb) (Tan et al., 2019). The O3 precursors, CO, NOx, CH4 and NMVOCs, are shown in Figs. 2 and S1. The trend of NMVOCs was inversely related to that of O3. When the NMVOC concentrations in the atmosphere accumulates to a certain level, as photochemical reactions progress, the O3 concentration gradually increases, and the NMVOC concentrations gradually decrease (Kansal, 2009; Song et al., 2018). CO and NOx showed a similar diurnal profile with a maximum during rush hour and a minimum in the afternoon (Fig. S1b and c), suggesting that both CO and NOx originated from the same source (enhanced traffic emission) and/or were manipulated by the same factor (e.g., poor dilution conditions). During the campaign, the average mixing ratio of total NMVOC was 32.4 ppb, with the highest contributions from alkanes (13.2 ppb, 40.6 %), followed by OVOCs (12.0 ppb, 37.0 %), aromatics (4.3 ppb, 13.2 %) and alkenes (3.0 ppb, 9.2 %). The top 10 NMVOC species (Fig. 3a), in terms of emissions, consisted of HCHO (7.0 ppb), propane (3.7 ppb), acetone (3.2 ppb), ethane (3.2 ppb), n-butane (1.9 ppb), m/p-xylene (1.6 ppb), iso-pentane (1.3 ppb), ethylene (1.3 ppb), iso-butane (1.1 ppb) and isoprene (1.0 ppb), accounting for 78.4 % of the total NMVOC concentration. As typical tracers of vehicle-related emissions, propane, ethane, ethene, butanes and pentanes were present in high concentrations, suggesting that vehicle-related emissions were likely to be the dominant source of NMVOCs at this site. In addition, the shape of the diurnal variations in total NMVOCs backed the presence of vehicle-related emissions, presenting higher mixing ratios during the early morning and from evening to midnight, which may be related to enhanced traffic emissions during rush hours and poor dilution conditions (Yuan et al., 2009; He et al., 2019; Tan et al., 2019). On the other hand, the mixing ratios of total NMVOCs began to decrease at 10:00 h and maintained a broad trough during daytime hours, probably due to increased photochemical removal processes favoring the destruction of NMVOCs, the elevated planetary boundary layer (PBL) promoting the dispersion of NMVOCs and/or reduced NMVOC emissions reducing the levels of NMVOCs (He et al., 2019; Zheng et al., 2018). In contrast, the OVOC concentrations (Fig. S1i) increased from a minimum near sunrise and reached a maximum in the late afternoon, reflecting the accumulation of OVOCs during the photochemically active period of the day and illustrating the time profile of the formation of secondary species (Yuan et al., 2012).

Figure 3The top 10 NMVOCs' contribution to (a) total NMVOC concentration, (b) OH reactivity, (c) NO3 reactivity and (d) O3 reactivity during the field campaign at Xianghe from 6 July to 6 August 2018.
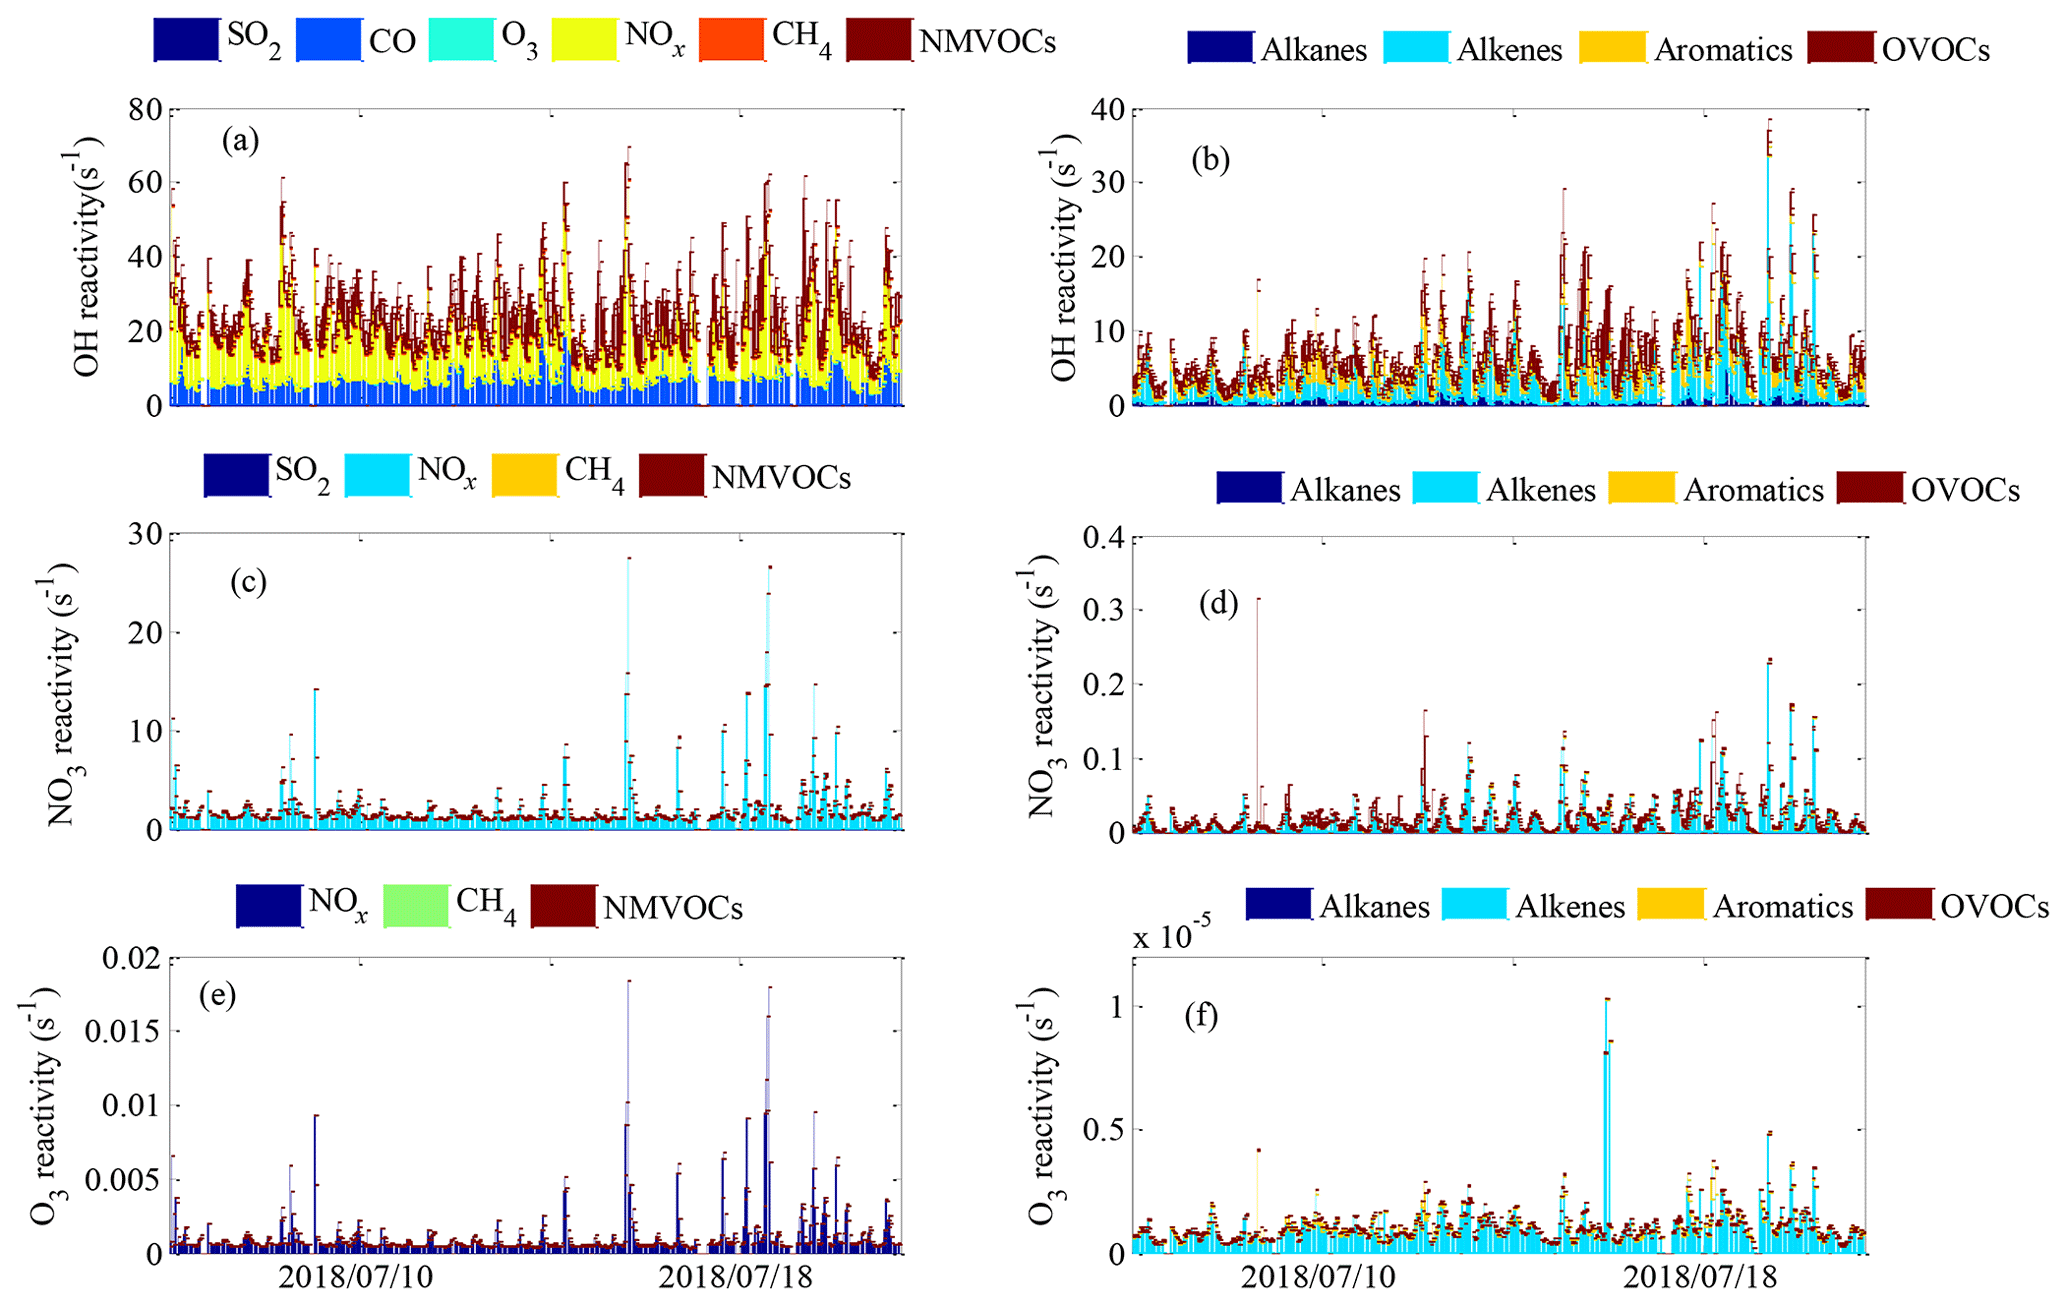
Figure 4The time series of (a, b) OH reactivity, (c, d) NO3 reactivity and (e, f) O3 reactivity during the field campaign at Xianghe from 6 July to 6 August 2018.
3.2 Reactivities of OH, NO3 and O3
3.2.1 OH reactivity
The OH reactivity of trace gases was categorized into SO2, CO, O3, NOx, CH4 and total NMVOCs, which were grouped into alkanes, alkenes, aromatics and OVOCs (Table S1 lists the NMVOCs included in each group), as shown in Fig. 4a and b. The total OH reactivity was between 9.2 and 69.6 s−1, with an average of 27.5±9.7 s−1 (± standard deviation). Statistically, the average total OH reactivity was much higher than those determined in Beijing (16.4 s−1 and 20±11 s−1) (Tan et al., 2019; Yang et al., 2017), Shanghai (13.5 s−1) (Tan et al., 2019), Chongqing (17.8 s−1) (Tan et al., 2019), Jinan (19.4±2.1 s−1) (Lyu et al., 2019), Wangdu (10–20 s−1) (Fuchs et al., 2017), Houston (9–22 s−1) (Mao et al., 2010), London (18.1 s−1) (Whalley et al., 2016) and Nashville (11.3±4.8 s−1) (Kovacs et al., 2003) but was comparable to or lower than those in Heshan (31±20 s−1) (Yang et al., 2017), Backgarden (mean maximum value of 50 s−1) (Lou et al., 2010) and New York (25 s−1) (Ren et al., 2006b). The OH reactivity towards SO2, CO and NOx was higher than the values reported in various Chinese cities (Xu et al., 2011; Zhu et al., 2020; Liu et al., 2009) (Table 1). It should be noted that the OH reactivity in this study was calculated from the sum of the products of measured species and their rate coefficients for reactions with OH and does not involve species that were not measured, such as monoterpenes and alcohols. Previous studies have shown that there are some discrepancies between the actual measured values and the calculated values of OH reactivity, which may be attributed to missing OH reactivity that originates from VOC oxidation products of both biogenic and anthropogenic origin (Di Carlo et al., 2004; Dolgorouky et al., 2012; Yoshino et al., 2006; Zhu et al., 2020). Therefore, the OH reactivity calculated in this study is somewhat underestimated.
The total OH reactivity was mainly contributed by NOx (12.0±7.1 s−1, 43.7 %), followed by NMVOCs (7.9±4.8 s−1, 28.5 %), CO (7.2±2.6 s−1, 26.0 %) and CH4 (0.3±0.1 s−1, 1.3 %) and to a lesser extent by SO2 and O3 (0.2±0.1 s−1, 0.6 %), indicating the strong influence of anthropogenic emissions in Xianghe. The majority of total OH reactivity values were below 30 s−1, as seen in the frequency distribution, which was dominated by the sum of low-OH-reactivity contributions and less influenced by single compounds with high OH reactivity (Fig. S2a–f). Specifically, the cumulative frequency distribution (Fig. S3a) clearly showed that the OH reactivity at values >40 s−1 was dominated entirely by OH reactivity towards NOx, and the OH reactivity at values from 20–40 s−1 was nearly completely dominated by OH reactivity towards NOx and total NMVOCs. In general, the frequency distributions and cumulative frequency distributions of OH reactivity highlighted the necessity of considering a large number of species to obtain a better understanding of OH reactivity.
The OH reactivity towards total NMVOCs was 7.9±4.8 s−1, which was much lower than those in Beijing (11.2 s−1) and Heshan (18.3 s−1) (Yang et al., 2017) due to the higher content of reactive hydrocarbons (e.g., alkenes and aromatics) in Beijing and Heshan and due to the unmeasured species (e.g., acetaldehyde) in this study. Alkenes (3.4±3.7 s−1, 42.9 %) dominated over OVOCs (2.4±1.5 s−1, 30.2 %), aromatics (1.5±1.7 s−1, 18.6 %) and alkanes (0.7±0.5 s−1, 8.3 %) in the OH reactivity towards total NMVOCs. The majority of the values of OH reactivity towards total NMVOCs were below 13 s−1 (Fig. S4a–d). The cumulative frequency distribution showed that the OH reactivity towards total NMVOCs at values of >6 s−1 was dominated by OH reactivity towards alkenes, aromatics and OVOCs and that the OH reactivity towards total NMVOCs at values of <6 s−1 was dominated by OH reactivity towards alkanes (Fig. S5). Alkanes accounted for >50 % of the mixing ratio of NMVOCs but only 8.3 % of the OH reactivity towards total NMVOCs. In contrast, aromatics, alkenes and OVOCs accounted for 44.6 % of the mixing ratio of NMVOCs, providing 91.7 % of the OH reactivity towards total NMVOCs. Significantly, isoprene accounted for only 4 % of the mixing ratio of NMVOCs but provided 31.2 % of the OH reactivity towards total NMVOCs. This result was explained by (1) the relatively low concentration of aromatics, alkenes, and OVOCs measured during the campaign; (2) the relatively high concentration of isoprene; and (3) the generally large isoprene reaction rate coefficient with OH ( ) (Atkinson et al., 2006). The top 10 species, in terms of OH reactivity towards total NMVOCs, consisted of isoprene, HCHO, m/p-xylene, ethylene, hexanal, o-xylene, propylene, styrene, MACR and cis-2-butene (Fig. 3b). These species contributed only 39.1 % to NMVOC emissions but accounted for 80.3 % of OH reactivity towards total NMVOCs. As shown in Table 1, the OH reactivity towards the speciated NMVOCs in this study was basically within the values reported in various Chinese cities (Tan et al., 2019; Xu et al., 2011; Yang et al., 2017; Zhu et al., 2020).
Table 1Comparison of speciated OH reactivity with former studies in China.

a Xu et al. (2011). b Yang et al. (2017). c Tan et al. (2019). d Liu et al. (2009). e Zhu et al. (2020).

Figure 5Mean diurnal variations in (a–f) OH reactivity, (g–k) NO3 reactivity and (l–o) O3 reactivity of trace gases during the field campaign at Xianghe from 6 July to 6 August 2018.
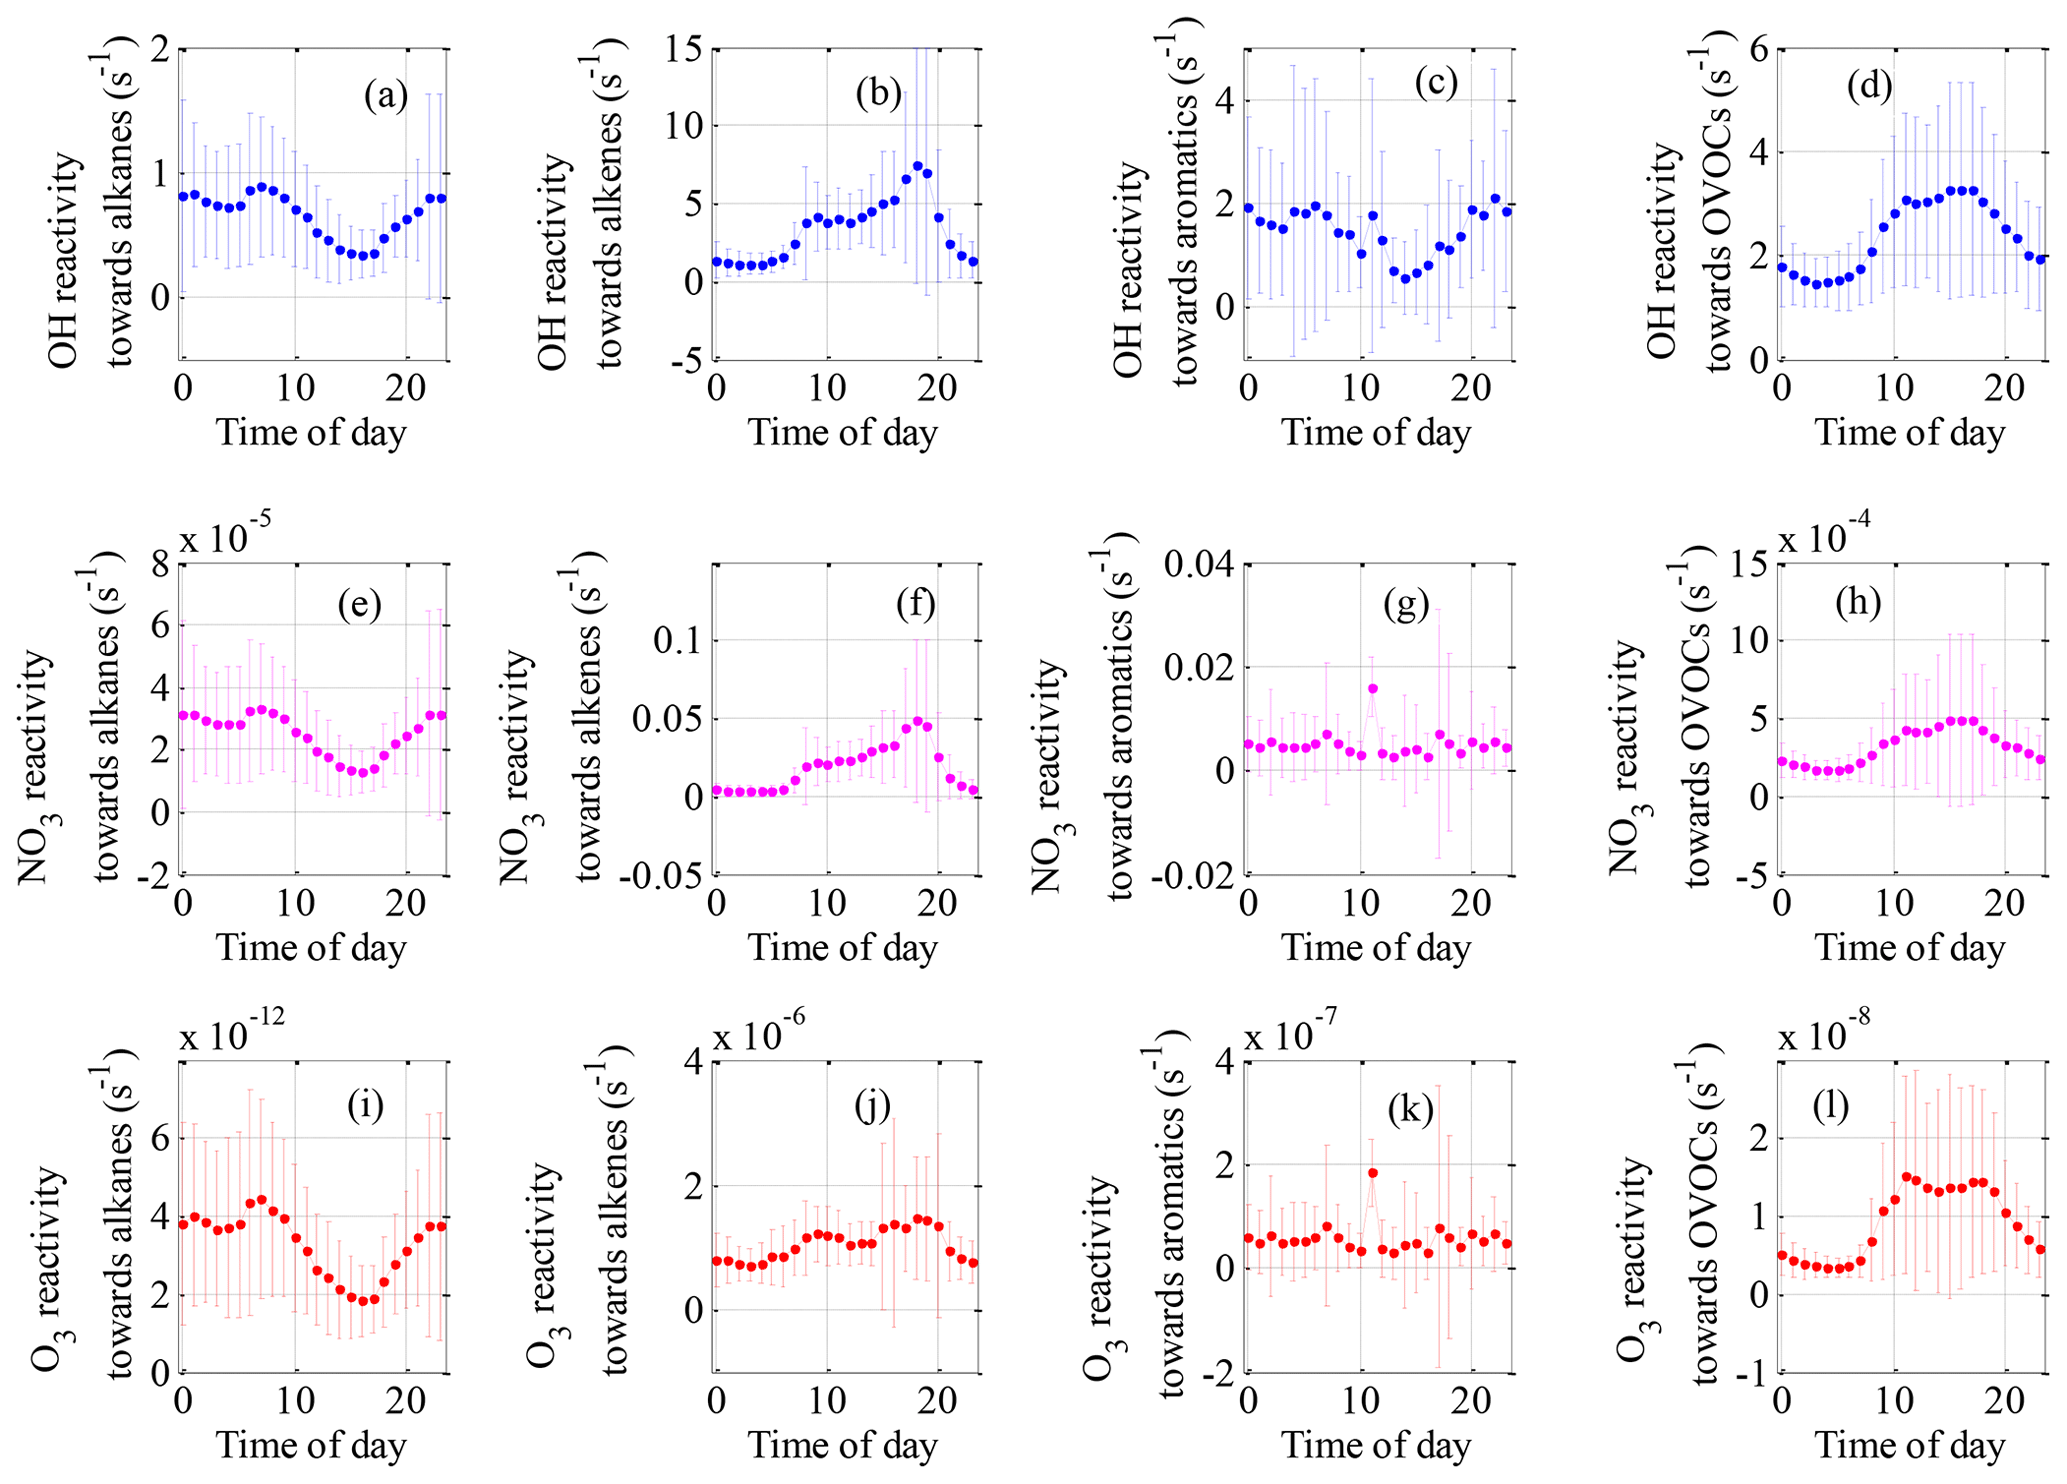
Figure 6Mean diurnal variations in OH reactivity (a–d), NO3 reactivity (e–h) and O3 reactivity (i–l) of NMVOC groups during the field campaign at Xianghe from 6 July to 6 August 2018.
The mean diurnal profiles of the OH reactivity of trace gases and NMVOCs are presented in Figs. 5a–f and 6a–d, respectively. In general, the total OH reactivity was the lowest in the afternoon and the highest during rush hours, reaching a maximum of 33.0 s−1 during the morning rush hour and a nighttime peak of 30.5 s−1 (Fig. 5a). Most campaigns have also reported slightly higher OH reactivity in the morning traffic rush hour, which can be explained by higher levels of reactive gases such as NO and NMVOCs due to heavy traffic, as well as slower reactions (Fuchs et al., 2017; Yang et al., 2016). A similar diurnal profile was also observed for contributions from NOx, CO, alkane and aromatic species, which are typically connected to emissions from anthropogenic activities. The shape of the total OH reactivity diurnal pattern was slightly shifted in the direction of OH reactivity towards NOx, strengthening the idea that the local pollution in Xianghe was possibly impacted by traffic emissions. However, a different diurnal behavior to that of the above species was observed for alkenes (Fig. 6b) and OVOCs (Fig. 6d), which are emitted by plants or produced photochemically. The OH reactivity from OVOCs increased by a factor of approximately 2 from nighttime to daytime, suggesting that during the daytime, dilution or chemical removal had a weaker influence on the observed OVOCs than fresh production by photochemistry. The opposite diurnal variation was reported in Wangdu, which showed a weak diurnal variation with a decrease by a factor of approximately 2 from the morning to the evening (Fuchs et al., 2017). The diurnal profile of OH reactivity towards isoprene appears to be the major driver for the diurnal profile of OH reactivity towards alkenes. Biogenic isoprene is dependent on temperature and light intensity (Chang et al., 2014), and anthropogenic isoprene is predominantly emitted by road traffic (Ye et al., 1997); hence, the OH reactivity from alkenes increased during the daytime, with a morning peak of 4.1 s−1 at 09:00 h and a nighttime peak of 7.4 s−1 at 18:00 h. Many rainforest campaigns have also reported a significant diurnal pattern with higher OH reactivity from alkenes and OVOCs at noontime or a maximum at the beginning of the night (Yang et al., 2016). Notably, the large amplitude of the standard deviation bars highlighted the large diel variability.
3.2.2 NO3 reactivity
The NO3 reactivity of trace gases was categorized into SO2, NOx, CH4 and NMVOCs, as shown in Fig. 4c and d. The campaign-averaged values of total NO3 reactivity were 2.2±2.6 s−1, ranging from 0.7 to 27.5 s−1. The average total NO3 reactivity was much higher than those determined during the IBAIRN campaign (Liebmann et al., 2018a) and at a rural mountain site (988 m a.s.l.) in southern Germany in 2017 (Liebmann et al., 2018b) due to higher contributions from NOx. We noted that NOx was by far the main contributor to the total NO3 reactivity, representing 99 % of the total NO3 reactivity on average. NO exhibited the most prominent contribution to the total NO3 reactivity and represented an average of 78.0 % of the total NO3 reactivity. In contrast to NO, NO2 had a maximum contribution during the nighttime and represented, on average, 27 % of the total NO3 reactivity. The NO3 reactivity towards CH4, NMVOCs and SO2 was very minor, accounting for no more than 1 % of the total NO3 reactivity over the whole campaign. The majority of the total NO3 reactivity values were below 3 s−1, but values below , 0.1, 3 and s−1 were observed for NO3 reactivity towards CH4, total NMVOCs, NOx and SO2, respectively, as seen in the frequency distribution (Fig. S2g–k). The cumulative frequency distribution clearly showed that the total NO3 reactivity at low and high values was entirely dominated by NO3 reactivity towards SO2 and NOx, respectively (Fig. S3b). In total, the frequency distributions and cumulative frequency distributions of NO3 reactivity highlighted the necessity of considering a large number of species to obtain a complete picture of NO3 reactivity.
The NO3 reactivity towards total NMVOCs was s−1 on average, with a minimum of s−1 and a maximum of 0.3 s−1. The largest fraction of attributed NO3 reactivity towards total NMVOCs was provided by alkenes (77.8 %), followed by aromatics (20.7 %) and OVOCs (1.3 %). The measured alkanes played virtually no role in NO3 reactivity towards total NMVOCs, although they accounted for more than 50 % of the mixing ratio of NMVOCs. This result can be largely explained by the fact that the reaction rate coefficients of alkenes, aromatics and OVOCs with NO3 are 1–5 orders of magnitude higher than the alkane reaction rate coefficients with NO3 (Atkinson and Arey, 2003; Atkinson et al., 2006). The majority of the NO3 reactivity values towards alkanes, alkenes, aromatics and OVOCs were below , 0.1, and s−1, respectively (Fig. S4e–f). The cumulative frequency distribution showed that the NO3 reactivity towards total NMVOCs at values of >0.1 s−1 was entirely dominated by NO3 reactivity towards alkenes, the NO3 reactivity towards total NMVOCs at values from 0.01 to 0.1 s−1 was dominated by NO3 reactivity towards alkenes and aromatics, and the NO3 reactivity towards total NMVOCs at values of s−1 was entirely dominated by NO3 reactivity towards alkanes (Fig. S6). The top 10 species in terms of NO3 reactivity towards total NMVOCs consisted of isoprene, styrene, cis-2-butene, trans-2-butene, cis-2-pentene, hexanal, HCHO, propylene, 1,3-butadiene and trans-2-pentene (Fig. 3c). These species contributed only 27.7 % to NMVOC emissions but accounted for 99.2 % of the NO3 reactivity towards total NMVOCs.
Total NO3 reactivity displayed a weak diel variation, with a campaign-averaged morning peak value of 4.0 s−1 at 06:00–07:00 h (Fig. 5g). The diurnal profile of NO3 reactivity towards NOx (Fig. 5i) appears to be the major driver for the diurnal profile of total NO3 reactivity. The morning peak value of total NO3 reactivity could be explained by the accumulation of NOx due to traffic emissions that are released into the shallow nocturnal boundary layer during the morning rush hours. In contrast, the average diurnal profile of NO3 reactivity towards total NMVOCs (Fig. 5k) had a maximum at 18:00 h, which was slightly shifted in the direction of NO3 reactivity towards alkenes (Fig. 6j). The evening peak value of NO3 reactivity towards total NMVOCs could be accounted for by the accumulation of alkenes due to vegetation emissions and traffic emissions that are released into the shallow nocturnal boundary layer. NO3 reactivity towards alkanes (Fig. 6e), alkenes (Fig. 6f), aromatics (Fig. 6g), OVOCs (Fig. 6h) and SO2 (Fig. 5h) played virtually no role in the diurnal variations in total NO3 reactivity and NO3 reactivity towards total NMVOCs but exhibited a more distinct diurnal profile.
3.2.3 O3 reactivity
The O3 reactivity of trace gases was categorized into NOx, CH4 and total NMVOCs, as shown in Fig. 4e and f. The total O3 reactivity at the site varied between a minimum of s−1 and a maximum of s−1 and was s−1 on average. NO exhibited the most prominent contribution to the total O3 reactivity and represented >99 % of the total O3 reactivity on average, whereas nearly all other contributions were <1 %. This result can be largely accounted for by the generally large NO reaction rate coefficients with O3 ( ) (Atkinson et al., 2006), which are several orders of magnitude higher than the reaction rate coefficients of NO2, alkanes, alkenes, aromatics and OVOCs with NO3 (Atkinson et al., 2006; Atkinson and Arey, 2003; Yuan et al., 2013; Ferracci et al., 2018; Jenkin et al., 2015). The majority of the total O3 reactivity values were below s−1, but values below , and s−1 were observed for the O3 reactivity towards CH4, total NMVOCs and NOx, respectively, as seen in the frequency distribution (Fig. S2l–o). The cumulative frequency distribution clearly showed that the total O3 reactivity at low and high values was entirely dominated by O3 reactivity towards CH4 and NOx, respectively (Fig. S3c). Generally, the frequency distributions and cumulative frequency distributions of O3 reactivity highlight the necessity of considering a large number of species to obtain a complete picture of O3 reactivity.
The O3 reactivity towards total NMVOCs was s−1 on average, ranging from a minimum of s−1 to a maximum of s−1. Alkenes clearly dominated the O3 reactivity towards total NMVOCs, with a campaign-averaged contribution of 94.0 %. Aromatics were the second largest contributor, comprising an average of 5.2 % of the O3 reactivity towards total NMVOCs. In comparison, OVOCs accounted for only 0.8 % of the O3 reactivity towards total NMVOCs. In contrast, the measured alkanes played nearly no role in the O3 reactivity towards total NMVOCs due to their small reaction rate coefficients with O3 ( ) (Atkinson and Arey, 2003; Atkinson et al., 2006). The majority of the O3 reactivity values towards alkanes, alkenes, aromatics and OVOCs were below , , and s−1, respectively (Fig. S4i–l). The cumulative frequency distribution (Fig. S7) clearly showed that the O3 reactivity towards total NMVOCs at s−1 was dominated by O3 reactivity towards alkenes and aromatics; the O3 reactivity towards total NMVOCs between and s−1 was dominated by O3 reactivity towards alkenes, aromatics and OVOCs, and the O3 reactivity towards NMVOCs s−1 was entirely dominated by O3 reactivity towards alkanes. In terms of individual species, isoprene, cis-2-butene, trans-2-butene, cis-2-pentene, propylene, styrene, ethylene, 1-butene, trans-2-pentene and 1-pentene were the top 10 species (Fig. 3d), accounting for 28 %, 25 %, 20 %, 8 %, 7 %, 5 %, 5 %, 3 %, 2 % and 1 %, respectively, of the O3 reactivity towards total NMVOCs and 3.1 %, 0.3 %, 0.1 %, 0.1 %, 1 %, 0.4 %, 4.1 %, 0.4 %, 0.1 % and 0.1 %, respectively, of the total NMVOC emissions.
Compared with the OH and NO3 reactivities, O3 reactivity displayed a much weaker diel variation, especially the O3 reactivity towards alkenes and aromatics, as shown in Figs. 5 and 6. This weakness can be explained by the following reasons. First, for a given species, the reaction rate coefficients with O3 were much smaller than the corresponding reaction rate coefficients with OH and NO3. For example, the ethylene reaction rate coefficients with OH ( ) and NO3 ( ) are 6 and 2 orders of magnitude higher, respectively, than the ethylene reaction rate coefficient with O3 ( ) (Atkinson and Arey, 2003; Atkinson et al., 2006). Second, the high-emission species reaction rate coefficients with O3 are smaller than the low-emission species reaction rate coefficients with O3. For instance, the m/p-xylene (one of the top five species in terms of emissions) reaction rate coefficient with O3 ( ) are much smaller than the 1-hexene (one of the bottom five emissions species) reaction rate coefficients with O3 ( ) (Atkinson and Arey, 2003; Atkinson et al., 2006). The above two factors largely weaken the diurnal variation in O3 reactivity.
Table 2The top 10 NMVOC species in terms of concentration (ppb, first column), OH reactivity (s−1, second column), NO3 reactivity (s−1, third column), and O3 reactivity (s−1, fourth column) and their corresponding contributions to concentration, OH, NO3, and O3 reactivity towards NMVOCs (%). Bold values denote the top 10 NMVOC species in terms of concentration, OH reactivity, NO3 reactivity and O3 reactivity.

3.3 Implications for OH, NO3 and O3 reactivity-based NMVOC control strategies
Table 2 lists the top 10 NMVOC species (excluding isoprene) in terms of concentration and OH, NO3, and O3 reactivities and their corresponding contributions to concentrations and OH, NO3, and O3 reactivities. The order of the major OH, NO3 and O3 reactivity-contributing species differed significantly from that of concentration-contributing species. Therefore, NMVOC control strategies based on OH, NO3 and O3 reactivities differ significantly from those based on concentrations.
From the perspective of concentration, HCHO, propane, acetone, ethane, n-butane, m/p-xylene, iso-pentane, ethylene, iso-butane and n-pentane should be targeted. If these 10 species were fully controlled, it would lead to an NMVOC concentration reduction of 79.9 % with OH, NO3 and O3 reactivity reductions of only 58.4 %, 2.1 % and 6.4 %, respectively. These species are mainly from fuel combustion and vehicle exhaust (Song et al., 2018; Liu et al., 2017); hence, from the perspective of the current emission-based limits, we recommend that the priorities for the control of NMVOC sources include fuel combustion and vehicle exhaust.
From the perspective of OH reactivity, HCHO, m/p-xylene, ethylene, hexanal, o-xylene, propylene, styrene, MACR, cis-butene and MVK were the key species. If the releases of these compounds were reduced to zero without any offset, OH reactivity would be reduced by 73.3 % with an NMVOC concentration reduction of 38.1 %, a NO3 reactivity reduction of 86.4 % and O3 reactivity reduction of 55.7 %. From the perspective of NO3 reactivity, the top 10 NMVOC species consisted of styrene, cis-2-butene, trans-2-butene, cis-2-pentene, hexanal, HCHO, propylene, 1,3-butadiene, trans-2-pentene and 1-butene. If the concentrations of these species were completely eliminated, it would reduce NO3 reactivity by 97.8 % with an NMVOC concentration reduction of 25.8 %, an OH reactivity reduction of 49.7 % and an O3 reactivity reduction of 91.8 %. From the perspective of O3 reactivity, cis-2-butene, trans-2-butene, cis-2-pentene, propylene, styrene, ethylene, 1-butene, trans-2-pentene, 1-pentene and MACR should be the key targets for control. If the concentrations of these compounds were reduced to zero without any offset, it would lead to an O3 reactivity reduction of 98.9 % with an NMVOC concentration reduction of 7.3 %, an OH reactivity reduction of 22.3 % and a NO3 reactivity reduction of 94.2 %. The top 10 species associated with OH, NO3 and O3 reactivities are mainly from traffic-related emissions, industry and solvent usage (Song et al., 2018; Liu et al., 2017; Chen et al., 2014). Therefore, in terms of reactivity-based limits, we recommend that the priorities for the control of NMVOC sources include traffic-related emissions, industry and solvent usage.
Clearly, species with large concentrations do not necessarily have high OH, NO3 and O3 reactivities, and a small concentration reduction can result in a maximum reduction in reactivity. The key NMVOC species in terms of OH, NO3 and O3 reactivities also differed from each other. However, reducing the concentrations of propylene, styrene and cis-2-butene may likely achieve a win-win-win situation. Although the above comparisons were made under the assumption that concentrations would be significantly reduced, it is obvious that OH, NO3 and O3 reactivity-based control strategies are more efficient than concentration-based policies in terms of reducing NMVOC pollution. Overall, the combined integration and comparison of OH, NO3 and O3 reactivities towards NMVOCs could provide useful suggestions for VOC pollution control in the North China Plain.
3.4 AOC
3.4.1 Modeling OVOCs, OH, HO2, RO2 and NO3 by SOSAA
With the appropriate setup of the condensation sinks for the 10 calculated OVOCs (ACR, C2H5CHO, MACR, C3H7CHO, MVK, MEK, MPRK, C4H9CHO, DIEK and C5H11CHO), the modeled diurnal mean pattern generally followed the measured pattern within 1 standard deviation of the measurement data, although the model underestimated measurements, predicting values of less than 1 ppb from 19:00 to 24:00 h (Fig. S8a). With the inclusion of input MTBE (methyl tert-butyl ether) and CH3COCH3 (acetone), which constituted more than 50 % of the total OVOCs, the modeled total OVOC concentration agreed better with the measurements than expected (Fig. S8b). The modeled diurnal median number concentrations of OH, HO2 and RO2 showed an apparent diurnal pattern with peaks during midday and values approaching zero during night, which resulted from the dependence of their chemical production reactions on incoming solar radiation (Fig. S9a, b and c). The midday time (12:00–16:00 h) median number concentrations of OH, HO2 and RO2 were 1.2×10⁷, 5.9×10⁸ and 3.7×10⁸ molecules cm−3, respectively, which were comparable to previous studies (Tan et al., 2017). The diurnal variation of in the hourly median NO3 concentration showed two peaks which were consistent with the high chemical production from NO2+O3 (Fig. S9d). Figure S10 shows the relationship between the modeled OH number concentration and the measured JO1D. The coefficient of determination (R2) was 0.86, and the linear regression fit showed that the slope was 6.1×10¹¹ and the intercept was 0.9×106 cm−3. These values were comparable to Tan et al. (2017), except that the slope here was approximately 36 % higher than the observed fit in Tan et al. (2017).
3.4.2 Overall characteristics of AOC
The loss rates of NMVOCs, CH4 and CO via reactions with OH, O3 and NO3 were calculated. The calculated AOC was up to 4.5×10⁸ , with a campaign-averaged value of 7.8×10⁷ , daytime average (06:00–18:00 h) of 1.4×10⁸ and nighttime average of 6.7×10⁶ . As such, the total number of NMVOC, CH4 and CO molecules depleted during the daytime and nighttime were, respectively, 6.0×10¹² and 2.9×10¹¹ per cm−3 of air. These AOC levels were higher than those determined at the Tung Chung air quality monitoring station (Xue et al., 2016), a polluted area in Santiago, Chile (Elshorbany et al., 2009), and Hong Kong Polytechnic University's air monitoring station at Hok Tsui (Li et al., 2018).
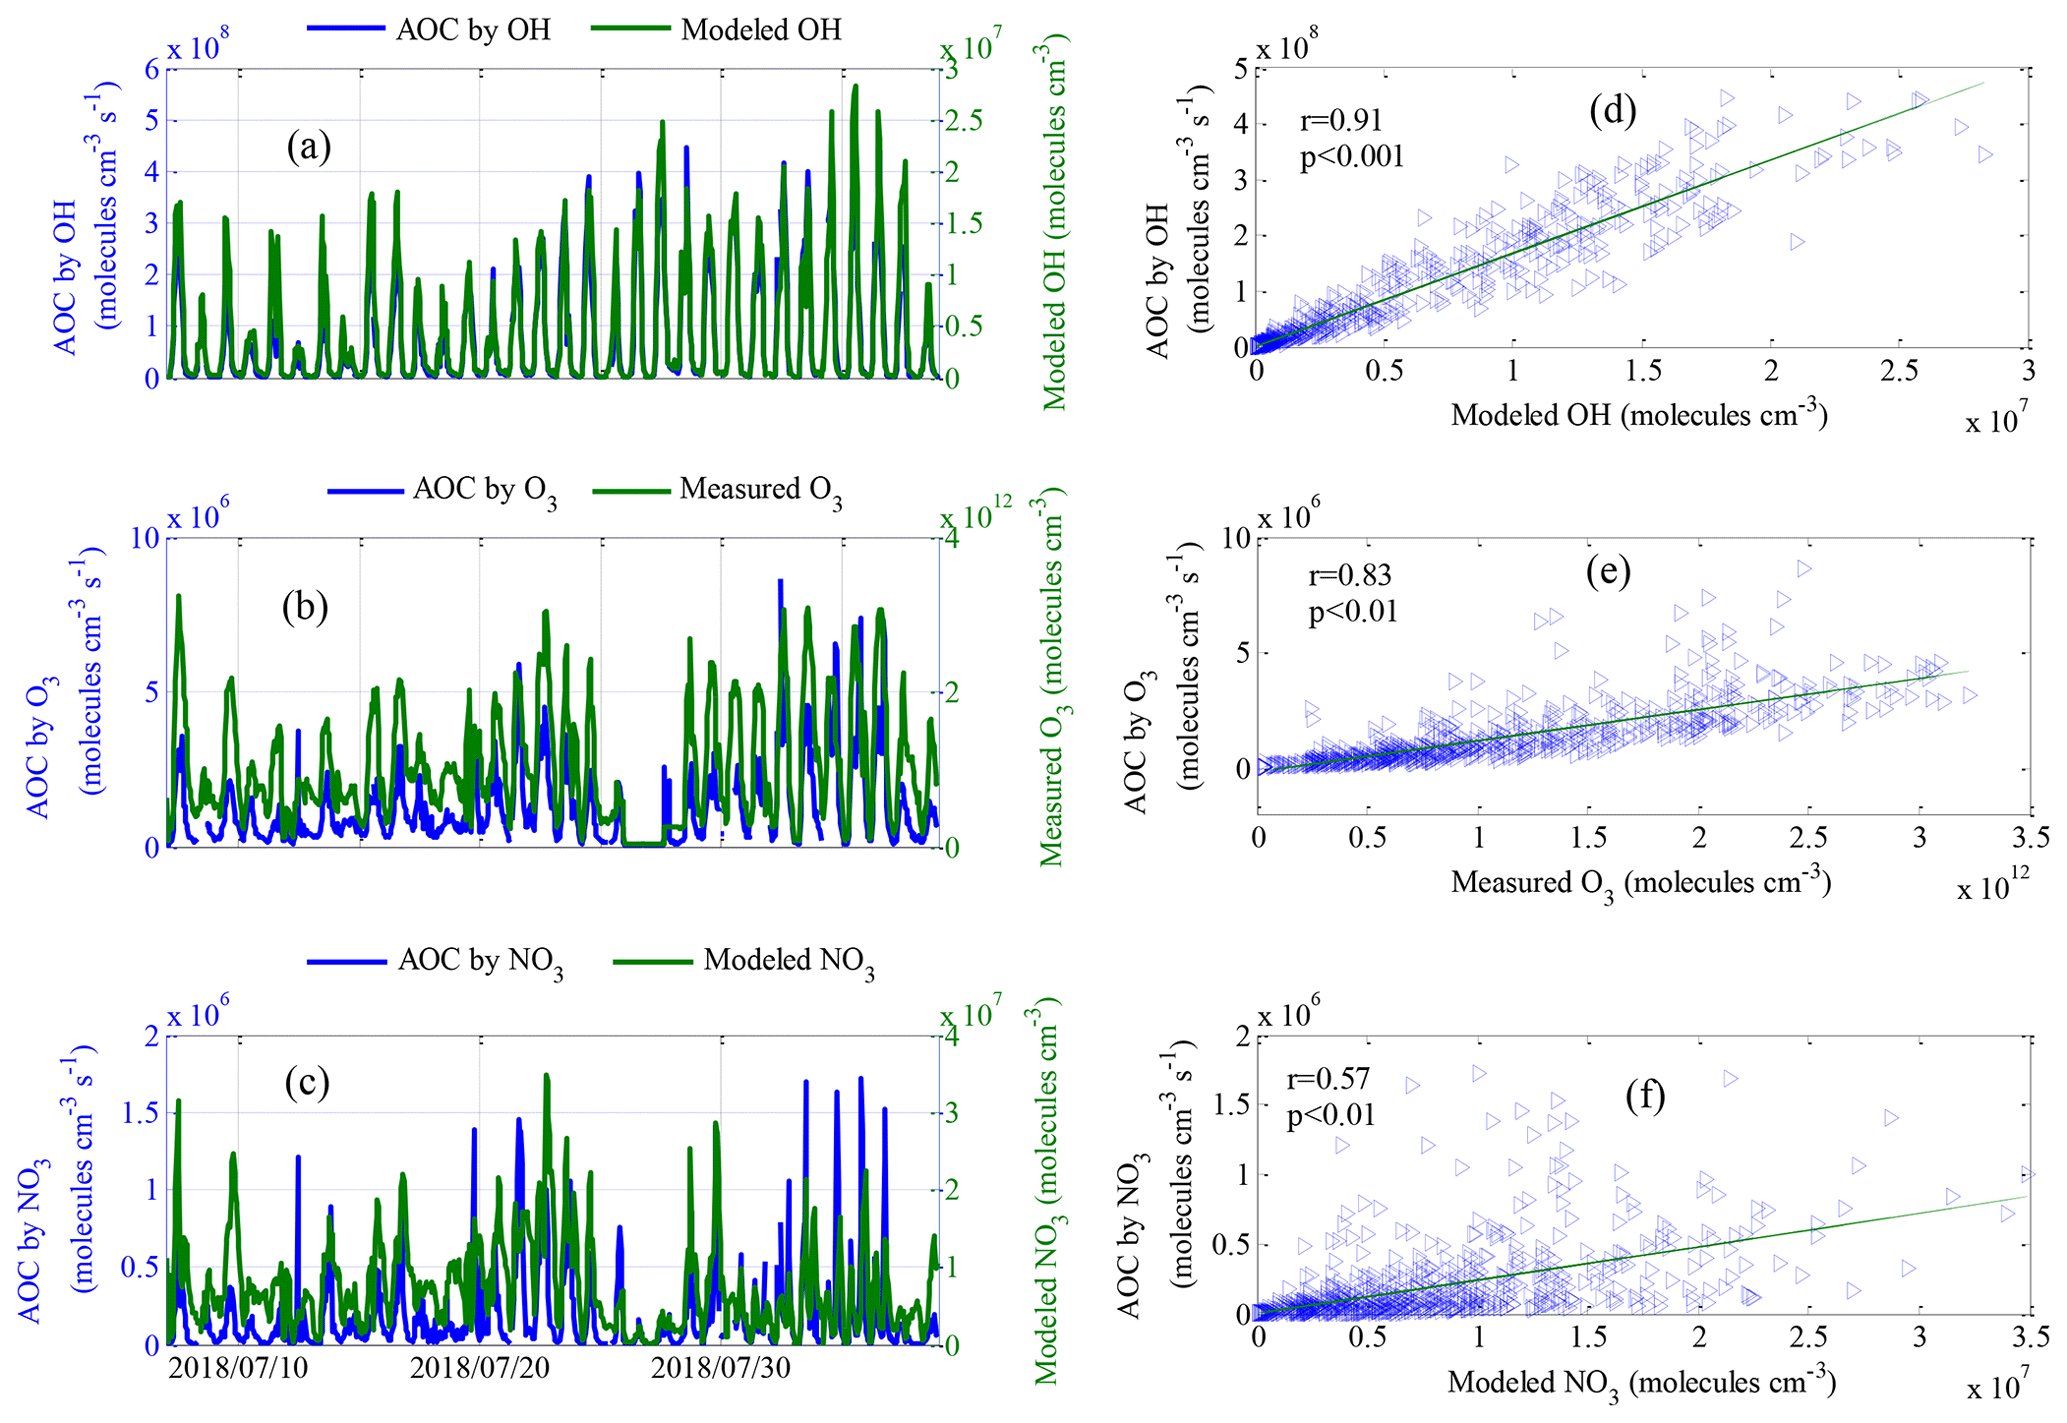
Figure 7Comparisons of calculated AOC by (a) modeled OH, (b) measured O3 and (c) modeled NO3 along with corresponding oxidation concentrations. Panels (a)–(c) show the time series, and (d)–(f) show scatterplots of calculated AOC and corresponding oxidation concentrations. Note: r and p are the correlation coefficient and the significance level, respectively.
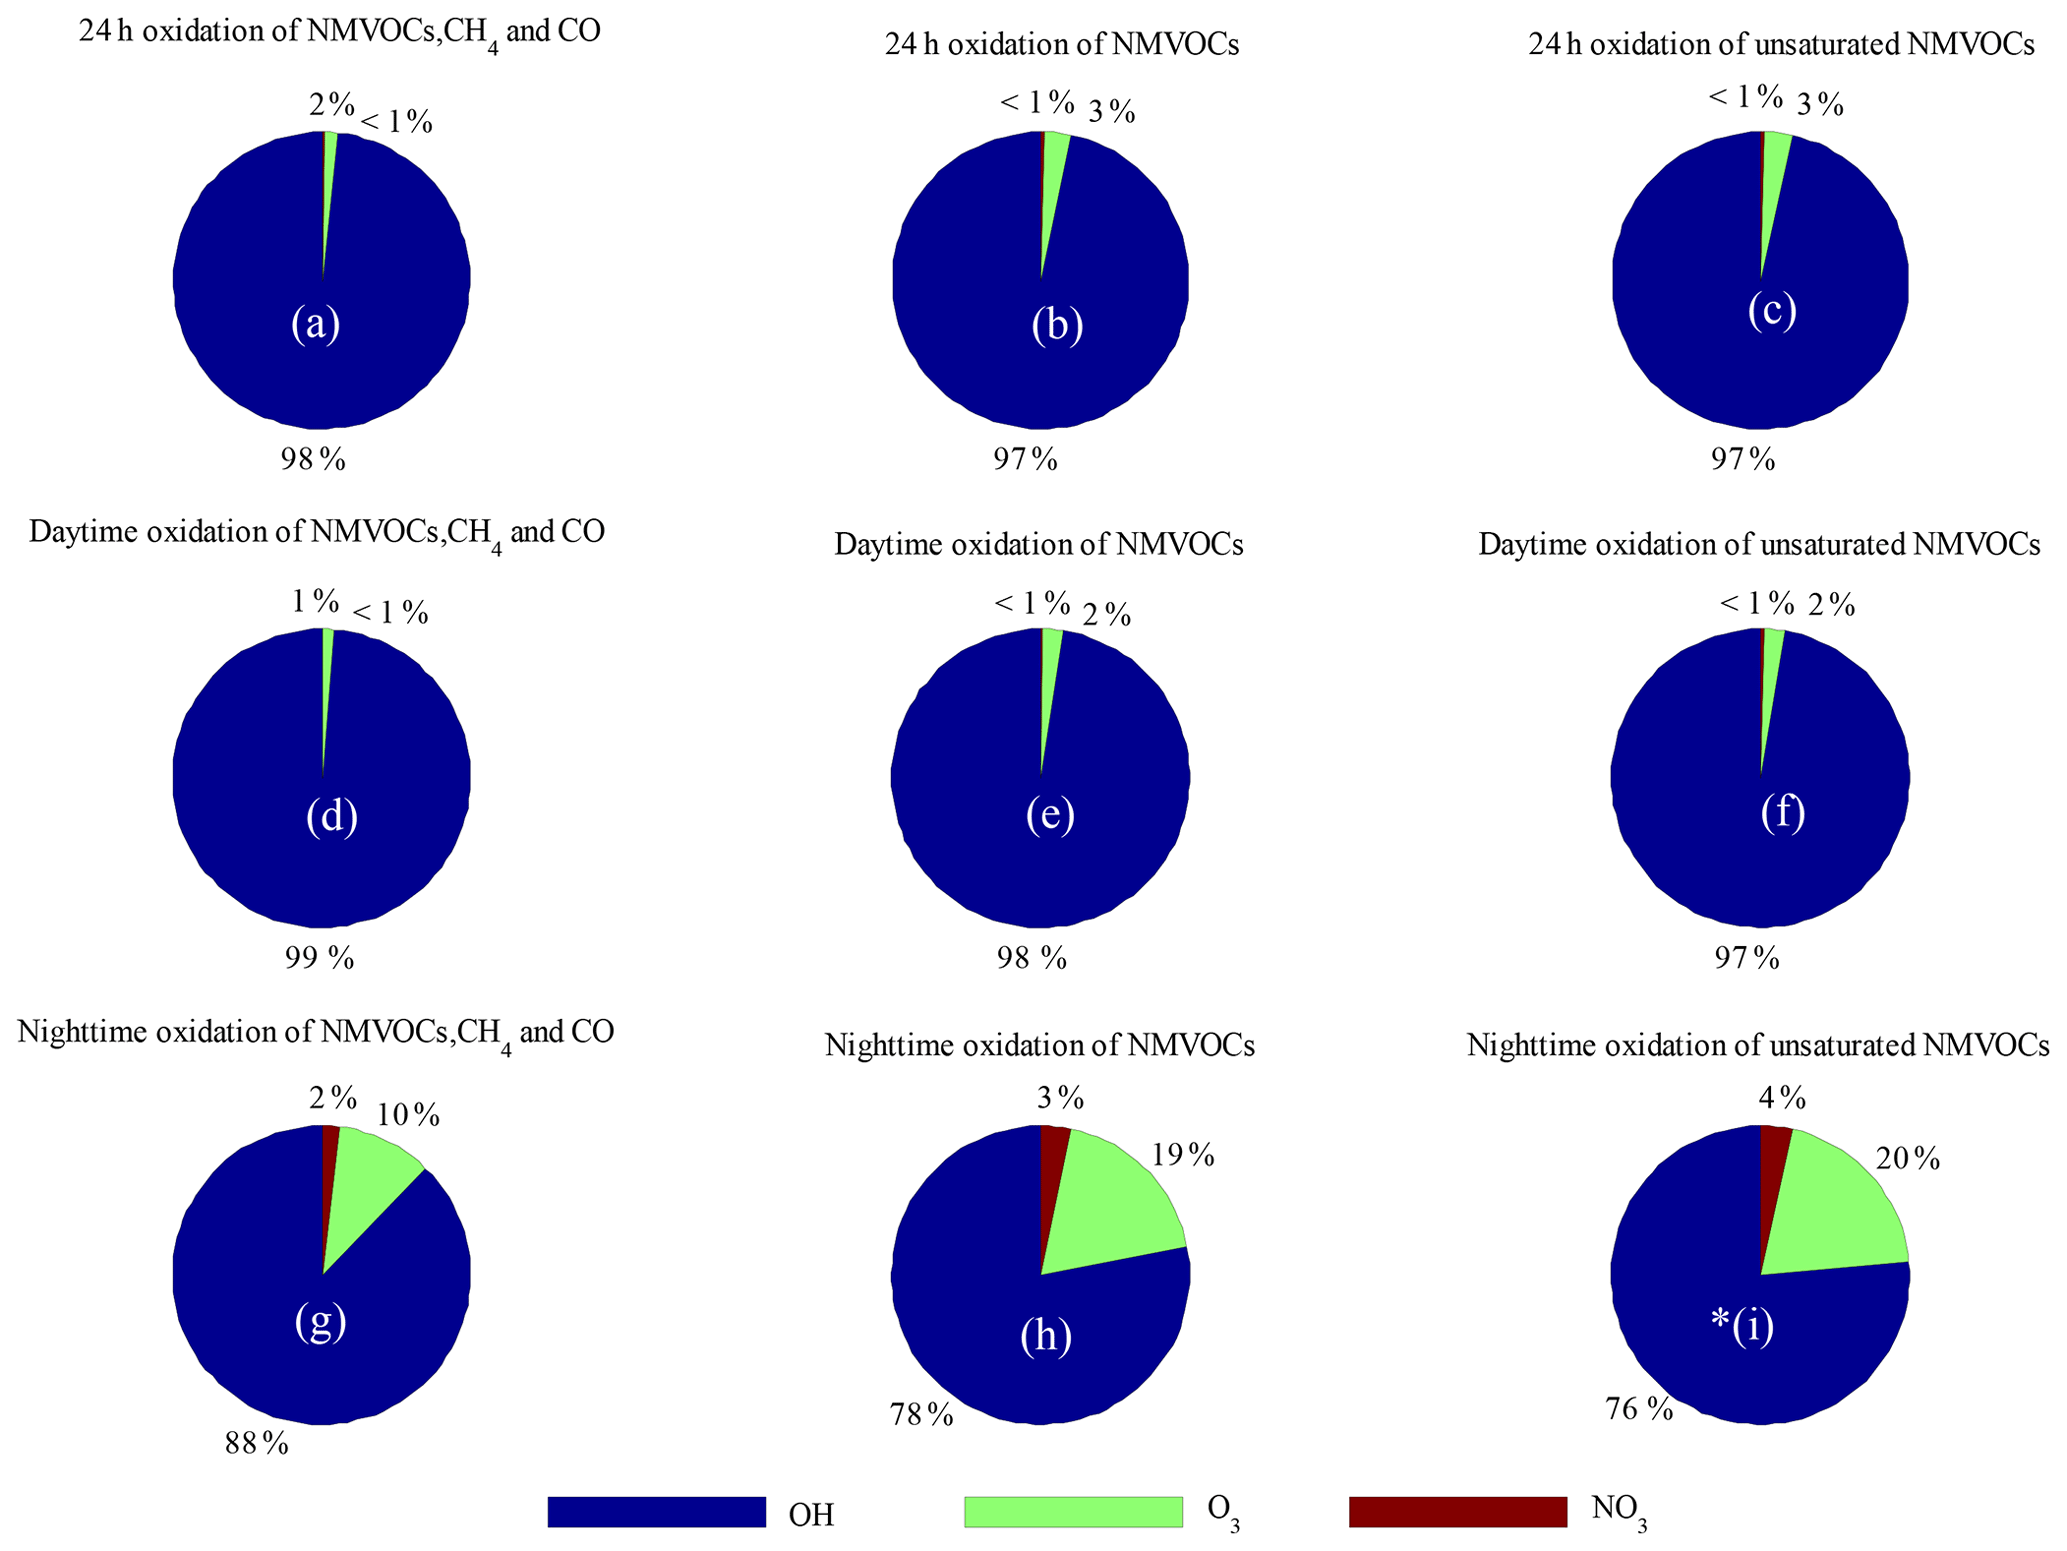
Figure 8Comparison of the relative contributions of OH, NO3 and O3 to the 24 h, daytime and nighttime-averaged loss rates. Data are calculated for the loss rates of (a, d, g) NMVOCs, CH4 and CO; (b, e, h) NMVOCs only; and (c, f, i) unsaturated NMVOCs only.
Comparisons of the AOC values calculated from OH, O3, and NO3 and the corresponding oxidation concentrations are shown in Fig. 7. The OH and NO3 radical concentrations were simulated by the SOSAA box model. The AOC calculated from OH, O3 and NO3 correlated well with the corresponding oxidation concentrations, with correlation coefficients (r) of 0.91, 0.83 and 0.57, respectively, suggesting that the parameterized AOC here was consistent with that obtained using radical concentration to indicate AOC. Specifically, the average oxidation capacities of OH, O3 and NO3 radicals throughout the entire campaign were 7.7×10⁷, 1.2×10⁶ and 1.8×10⁵ , representing 98.2 %, 1.5 % and 0.3 % of the total oxidation capacity, respectively. The total number of depleted molecules per day due to oxidation by OH, O3 and NO3 was 6.6×10¹², 1.0×10¹¹ and 1.5×10¹⁰ molecules cm−3, respectively; these values were slightly higher than those assessed in a polluted area in Santiago, Chile (Elshorbany et al., 2009). Accordingly, OH radicals are the driving force of AOC in Xianghe, especially during the daytime. Figure 8 shows a comparison of the oxidation capacities of OH, O3 and NO3. On average, the relative contribution of O3 and NO3 oxidation capacities when integrated over 24 h was less than 4 % (Fig. 8a–c). OH is the only oxidant of CO in the troposphere. As expected, OH was responsible for 99 % of the oxidation capacity regarding NMVOCs, CH4 and CO during the daytime (Fig. 8d). The relative contribution of OH to oxidation capacity decreased to 98 % when restricting the calculation to NMVOC families alone (Fig. 8e). Focusing on the oxidation of unsaturated NMVOCs, OH was the dominant oxidant with a relative proportion of approximately 97 % (Fig. 8f). Note that the influence of NO3 and O3 on the oxidation of CO and VOCs can be neglected during the daytime. However, elevated relative contributions of O3 and NO3 to oxidation capacity can be observed during the nighttime. As expected, O3 and NO3 accounted for 10 % and 2 %, respectively, of the oxidation capacity with respect to NMVOCs, CH4 and CO (Fig. 9g), but 19 % and 3 % of NMVOC families alone (Fig. 8h) occurred at night. Focusing on the oxidation of unsaturated NMVOCs, O3 and NO3 accounted for 20 % and 4 %, respectively, of the oxidation capacity (Fig. 8i). This quantitative intercomparison of the oxidation capacities of OH, O3 and NO3 confirms the important role of OH in the degradation of NMVOCs, CH4 and CO. Compared with OH and O3, NO3 had a lower contribution during both the daytime and nighttime, which was mainly caused by high NO concentrations (Liebmann et al., 2018b).
In the summer of 2018, a comprehensive field campaign was conducted at a suburban site in the North China Plain. Based on simultaneous measurements of O3, CO, SO2, NO, NO2, JO1D, JNO2, JNO3, HONO, HCHO, CH4 and 65 NMVOCs, the reactivities (OH, NO3 and O3 reactivities) towards trace gases and AOC were comprehensively analyzed. The main findings are summarized as follows.
The total OH reactivity was between 9.2 and 69.6 s−1 with an average of 27.5±9.7 s−1, which was mainly contributed by NOx (43.7 %), followed by NMVOCs (28.5 %), CO (26.0 %), CH4 (1.3 %), and SO2 and O3 (0.5 %). OH reactivity towards total NMVOCs was 7.9±4.8 s−1 and dominated by alkenes (42.9 %). The campaign-averaged value of total NO3 reactivity was 2.2±2.6 s−1, ranging from 0.7 to 27.5 s−1. NOx was the main contributor to the total NO3 reactivity, representing 99 % of the total NO3 reactivity on average. NO3 reactivity towards total NMVOCs was s−1, on average, and it was dominated by alkenes (77.8 %). The total O3 reactivity varied between a minimum of s−1 and a maximum of s−1, with an average of s−1. NO exhibited the most prominent contribution to the total O3 reactivity and represented an average of >99 % of the total O3 reactivity. The O3 reactivity towards total NMVOCs was s−1 on average, ranging from to s−1 and dominated by alkenes (94.0 %). The total OH, NO3 and O3 reactivities displayed a similar diel variation with the lowest value in the afternoon and the highest value during rush hours, and the diurnal profile of NOx appears to be the major driver for the diurnal profiles of total OH, NO3 and O3 reactivities. Compared with the OH and NO3 reactivities, O3 reactivity displayed a much weaker diel variation, especially the O3 reactivity towards alkenes and aromatics due to (1) the rate coefficients with O3 being much smaller than the corresponding reaction rate coefficients with OH and NO3 for the same species and (2) the high-emission species reaction rate coefficients with O3 being smaller than the low-emission species reaction rate coefficients with O3.
OH, NO3 and O3 reactivity-based control strategies are more efficient than concentration-based policies in terms of reducing NMVOC pollution. We suggest that policy makers shift the current concentration-based limits to reactivity-based policies.
The loss rates of NMVOCs, CH4 and CO via reactions with OH, O3 and NO3 were calculated; these loss rates were up to 4.5×10⁸ , with a campaign-averaged value of 7.8×10⁷ , daytime average (06:00–18:00 h) of 1.4×10⁸ and nighttime average of 6.7×10⁶ . AOC was dominated by OH radicals (7.7×10⁷ , 98.2 %), O3 (1.2×10⁶ , 1.5 %) and NO3 radicals (1.8×10⁵ , 0.3 %), suggesting that the OH radical is the driving force of the oxidation capacity in the atmosphere in Xianghe, especially during the daytime.
Our study provides useful insights for VOC pollution control in a typical suburban site in the North China Plain. Further studies, especially direct observations of OH and NO3 radicals, OH and NO3 reactivity measurements and speciated measurements, are required to further explore trace gas reactivity and AOC.
The underlying research data can be accessed upon contact with the corresponding author (Yuesi Wang: wys@mail.iap.ac.cn; Yonghong Wang: yonghong.wang@helsinki.fi).
The supplement related to this article is available online at: https://doi.org/10.5194/acp-20-8181-2020-supplement.
YuW designed the research. YY and DY, SZ, DJ and YiW conducted the measurements. YY and YoW interpreted the data and wrote the paper. PZ and DC conducted SOSAA simulation. All the authors contributed to discussing results and commenting on the paper.
The authors declare that they have no conflict of interest.
All referenced supplemental figures and tables can be found in the Supplement. The authors are grateful to all staff and workers from the Xianghe Atmospheric Observatory of the Institute of Atmospheric Physics (IAP) of the Chinese Academy of Sciences for their support during the sampling campaign. We also acknowledge the National Meteorological Information Center for providing high-quality meteorology parameters. Putian Zhou would also like to acknowledge the University of Helsinki Three Year Grant (“AGES”: 2018–2020).
This research has been supported by the Ministry of Science and Technology of China (grant no. 2017YFC0210000) and the Beijing Major Science and Technology Project (grant no. Z181100005418014).
This paper was edited by Qiang Zhang and reviewed by three anonymous referees.
Asaf, D., Pedersen, D., Matveev, V., Peleg, M., Kern, C., Zingler, J., Platt, U., and Luria, M.: Long-Term Measurements of NO3 Radical at a Semiarid Urban Site: 1. Extreme Concentration Events and Their Oxidation Capacity, Environ. Sci. Technol., 43, 9117–9123, https://doi.org/10.1021/es900798b, 2009.
Atkinson, R. and Arey, J.: Atmospheric Degradation of Volatile Organic Compounds, Chem. Rev., 103, 4605–4638, https://doi.org/10.1021/cr0206420, 2003.
Atkinson, R., Aschmann, S. M., and Pitts Jr., J. N.: Kinetics of the gas-phase reactions of OH radicals with a series of α, β-unsaturated carbonyls at 299±2 K, Int. J. Chem. Kinet., 15, 75–81, https://doi.org/10.1002/kin.550150108, 1983.
Atkinson, R., Baulch, D. L., Cox, R. A., Crowley, J. N., Hampson, R. F., Hynes, R. G., Jenkin, M. E., Rossi, M. J., and Troe, J.: Evaluated kinetic and photochemical data for atmospheric chemistry: Volume I – gas phase reactions of Ox, HOx, NOx and SOx species, Atmos. Chem. Phys., 4, 1461–1738, https://doi.org/10.5194/acp-4-1461-2004, 2004.
Atkinson, R., Baulch, D. L., Cox, R. A., Crowley, J. N., Hampson, R. F., Hynes, R. G., Jenkin, M. E., Rossi, M. J., Troe, J., and IUPAC Subcommittee: Evaluated kinetic and photochemical data for atmospheric chemistry: Volume II – gas phase reactions of organic species, Atmos. Chem. Phys., 6, 3625–4055, https://doi.org/10.5194/acp-6-3625-2006, 2006.
Boy, M., Sogachev, A., Lauros, J., Zhou, L., Guenther, A., and Smolander, S.: SOSA – a new model to simulate the concentrations of organic vapours and sulphuric acid inside the ABL – Part 1: Model description and initial evaluation, Atmos. Chem. Phys., 11, 43–51, https://doi.org/10.5194/acp-11-43-2011, 2011.
Chang, C.-C., Wang, J.-L., Candice Lung, S.-C., Chang, C.-Y., Lee, P.-J., Chew, C., Liao, W.-C., Chen, W.-N., and Ou-Yang, C.-F.: Seasonal characteristics of biogenic and anthropogenic isoprene in tropical–subtropical urban environments, Atmos. Environ., 99, 298–308, https://doi.org/10.1016/j.atmosenv.2014.09.019, 2014.
Chen, W. T., Shao, M., Lu, S. H., Wang, M., Zeng, L. M., Yuan, B., and Liu, Y.: Understanding primary and secondary sources of ambient carbonyl compounds in Beijing using the PMF model, Atmos. Chem. Phys., 14, 3047–3062, https://doi.org/10.5194/acp-14-3047-2014, 2014.
Damian, V., Sandu, A., Damian, M., Potra, F., and Carmichael, G. R.: The kinetic preprocessor KPP-a software environment for solving chemical kinetics, Comput. Chem. Eng., 26, 1567–1579, https://doi.org/10.1016/s0098-1354(02)00128-x, 2002.
Di Carlo, P., Brune, W. H., Martinez, M., Harder, H., Lesher, R., Ren, X., Thornberry, T., Carroll, M. A., Young, V., Shepson, P. B., Riemer, D., Apel, E., and Campbell, C.: Missing OH reactivity in a forest: evidence for unknown reactive biogenic VOCs, Science, 304, 722–725, https://doi.org/10.1126/science.1094392, 2004.
Dolgorouky, C., Gros, V., Sarda-Esteve, R., Sinha, V., Williams, J., Marchand, N., Sauvage, S., Poulain, L., Sciare, J., and Bonsang, B.: Total OH reactivity measurements in Paris during the 2010 MEGAPOLI winter campaign, Atmos. Chem. Phys., 12, 9593–9612, https://doi.org/10.5194/acp-12-9593-2012, 2012.
Elshorbany, Y. F., Kurtenbach, R., Wiesen, P., Lissi, E., Rubio, M., Villena, G., Gramsch, E., Rickard, A. R., Pilling, M. J., and Kleffmann, J.: Oxidation capacity of the city air of Santiago, Chile, Atmos. Chem. Phys., 9, 2257–2273, https://doi.org/10.5194/acp-9-2257-2009, 2009.
Elshorbany, Y. F., Kleffmann, J., Hofzumahaus, A., Kurtenbach, R., Wiesen, P., Brauers, T., Bohn, B., Dorn, H. P., Fuchs, H., Holland, F., Rohrer, F., Tillmann, R., Wegener, R., Wahner, A., Kanaya, Y., Yoshino, A., Nishida, S., Kajii, Y., Martinez, M., Kubistin, D., Harder, H., Lelieveld, J., Elste, T., Plass-Dülmer, C., Stange, G., Berresheim, H., and Schurath, U.: HOx budgets during HOxComp: A case study of HOx chemistry under NOx-limited conditions, J. Geophys. Res.-Atmos., 117, D03307, https://doi.org/10.1029/2011jd017008, 2012.
Ferracci, V., Heimann, I., Abraham, N. L., Pyle, J. A., and Archibald, A. T.: Global modelling of the total OH reactivity: investigations on the “missing” OH sink and its atmospheric implications, Atmos. Chem. Phys., 18, 7109–7129, https://doi.org/10.5194/acp-18-7109-2018, 2018.
Fuchs, H., Tan, Z., Lu, K., Bohn, B., Broch, S., Brown, S. S., Dong, H., Gomm, S., Häseler, R., He, L., Hofzumahaus, A., Holland, F., Li, X., Liu, Y., Lu, S., Min, K.-E., Rohrer, F., Shao, M., Wang, B., Wang, M., Wu, Y., Zeng, L., Zhang, Y., Wahner, A., and Zhang, Y.: OH reactivity at a rural site (Wangdu) in the North China Plain: contributions from OH reactants and experimental OH budget, Atmos. Chem. Phys., 17, 645–661, https://doi.org/10.5194/acp-17-645-2017, 2017.
Gerasopoulos, E., Kazadzis, S., Vrekoussis, M., Kouvarakis, G., Liakakou, E., Kouremeti, N., Giannadaki, D., Kanakidou, M., Bohn, B., and Mihalopoulos, N.: Factors affecting O3 and NO2 photolysis frequencies measured in the eastern Mediterranean during the five-year period 2002–2006, J. Geophys. Res.-Atmos., 117, D22305, https://doi.org/10.1029/2012jd017622, 2012.
Geyer, A.: Nighttime formation of peroxy and hydroxyl radicals during the BERLIOZ campaign: Observations and modeling studies, J. Geophys. Res., 108, 8249, https://doi.org/10.1029/2001jd000656, 2003.
Geyer, A., Alicke, B., Konrad, S., Schmitz, T., Stutz, J., and Platt, U.: Chemistry and oxidation capacity of the nitrate radical in the continental boundary layer near Berlin, J. Geophys. Res.-Atmos., 106, 8013–8025, https://doi.org/10.1029/2000jd900681, 2001.
Goldstein, A. H. and Galbally, I. E.: Known and unexplored organic constituents in the earth's atmosphere, Environ. Sci. Technol., 41, 1514–1521, https://doi.org/10.1021/es072476p, 2007.
He, Z., Wang, X., Ling, Z., Zhao, J., Guo, H., Shao, M., and Wang, Z.: Contributions of different anthropogenic volatile organic compound sources to ozone formation at a receptor site in the Pearl River Delta region and its policy implications, Atmos. Chem. Phys., 19, 8801–8816, https://doi.org/10.5194/acp-19-8801-2019, 2019.
Heard, D. E. and Pilling, M. J.: Measurement of OH and HO2 in the troposphere, Chem. Rev., 103, 5163–5198, https://doi.org/10.1021/cr020522s, 2003.
Jenkin, M. E., Saunders, S. M., and Pilling, M. J.: The tropospheric degradation of volatile organic compounds: a protocol for mechanism development, Atmos. Environ., 31, 81–104, https://doi.org/10.1016/S1352-2310(96)00105-7, 1997.
Jenkin, M. E., Young, J. C., and Rickard, A. R.: The MCM v3.3.1 degradation scheme for isoprene, Atmos. Chem. Phys., 15, 11433–11459, https://doi.org/10.5194/acp-15-11433-2015, 2015.
Kaiser, J., Wolfe, G. M., Bohn, B., Broch, S., Fuchs, H., Ganzeveld, L. N., Gomm, S., Häseler, R., Hofzumahaus, A., Holland, F., Jäger, J., Li, X., Lohse, I., Lu, K., Prévôt, A. S. H., Rohrer, F., Wegener, R., Wolf, R., Mentel, T. F., Kiendler-Scharr, A., Wahner, A., and Keutsch, F. N.: Evidence for an unidentified non-photochemical ground-level source of formaldehyde in the Po Valley with potential implications for ozone production, Atmos. Chem. Phys., 15, 1289–1298, https://doi.org/10.5194/acp-15-1289-2015, 2015.
Kansal, A.: Sources and reactivity of NMHCs and VOCs in the atmosphere: a review, J. Hazard. Mater., 166, 17–26, https://doi.org/10.1016/j.jhazmat.2008.11.048, 2009.
Kim, S., Sanchez, D., Wang, M., Seco, R., Jeong, D., Hughes, S., Barletta, B., Blake, D. R., Jung, J., Kim, D., Lee, G., Lee, M., Ahn, J., Lee, S. D., Cho, G., Sung, M. Y., Lee, Y. H., Kim, D. B., Kim, Y., Woo, J. H., Jo, D., Park, R., Park, J. H., Hong, Y. D., and Hong, J. H.: OH reactivity in urban and suburban regions in Seoul, South Korea – an East Asian megacity in a rapid transition, Faraday Discuss., 189, 231–251, https://doi.org/10.1039/c5fd00230c, 2016.
Kovacs, T. A., Brune, W. H., Harder, H., Martinez, M., Simpas, J. B., Frost, G. J., Williams, E., Jobson, T., Stroud, C., Young, V., Fried, A., and Wert, B.: Direct measurements of urban OH reactivity during Nashville SOS in summer 1999, J. Environ. Monitor., 5, 68–74, https://doi.org/10.1039/b204339d, 2003.
Kumar, V., Chandra, B. P., and Sinha, V.: Large unexplained suite of chemically reactive compounds present in ambient air due to biomass fires, Sci. Rep.-UK, 8, 626, https://doi.org/10.1038/s41598-017-19139-3, 2018.
Lee, J. D., Young, J. C., Read, K. A., Hamilton, J. F., Hopkins, J. R., Lewis, A. C., Bandy, B. J., Davey, J., Edwards, P., Ingham, T., Self, D. E., Smith, S. C., Pilling, M. J., and Heard, D. E.: Measurement and calculation of OH reactivity at a United Kingdom coastal site, J. Atmos. Chem., 64, 53–76, https://doi.org/10.1007/s10874-010-9171-0, 2010.
Li, Z., Xue, L., Yang, X., Zha, Q., Tham, Y. J., Yan, C., Louie, P. K. K., Luk, C. W. Y., Wang, T., and Wang, W.: Oxidizing capacity of the rural atmosphere in Hong Kong, Southern China, Sci. Total Environ., 612, 1114–1122, https://doi.org/10.1016/j.scitotenv.2017.08.310, 2018.
Liebmann, J. M., Schuster, G., Schuladen, J. B., Sobanski, N., Lelieveld, J., and Crowley, J. N.: Measurement of ambient NO3 reactivity: design, characterization and first deployment of a new instrument, Atmos. Meas. Tech., 10, 1241–1258, https://doi.org/10.5194/amt-10-1241-2017, 2017.
Liebmann, J. M., Karu, E., Sobanski, N., Schuladen, J., Ehn, M., Schallhart, S., Quéléver, L., Hellen, H., Hakola, H., Hoffmann, T., Williams, J., Fischer, H., Lelieveld, J., and Crowley, J. N.: Direct measurement of NO3 radical reactivity in a boreal forest, Atmos. Chem. Phys., 18, 3799–3815, https://doi.org/10.5194/acp-18-3799-2018, 2018a.
Liebmann, J. M., Muller, J. B. A., Kubistin, D., Claude, A., Holla, R., Plass-Dülmer, C., Lelieveld, J., and Crowley, J. N.: Direct measurements of NO3 reactivity in and above the boundary layer of a mountaintop site: identification of reactive trace gases and comparison with OH reactivity, Atmos. Chem. Phys., 18, 12045–12059, https://doi.org/10.5194/acp-18-12045-2018, 2018b.
Liu, C., Ma, Z., Mu, Y., Liu, J., Zhang, C., Zhang, Y., Liu, P., and Zhang, H.: The levels, variation characteristics, and sources of atmospheric non-methane hydrocarbon compounds during wintertime in Beijing, China, Atmos. Chem. Phys., 17, 10633–10649, https://doi.org/10.5194/acp-17-10633-2017, 2017.
Liu, Y., Shao, M., Kuster, W. C., Goldan, P. D., Li, X., Lu, S., and de Gouw, J. A.: Source identification of reactive hydrocarbons and oxygenated VOCs in the summertime in Beijing, Environ. Sci. Technol., 43, 75–81, https://doi.org/10.1021/es801716n, 2009.
Lou, S., Holland, F., Rohrer, F., Lu, K., Bohn, B., Brauers, T., Chang, C. C., Fuchs, H., Häseler, R., Kita, K., Kondo, Y., Li, X., Shao, M., Zeng, L., Wahner, A., Zhang, Y., Wang, W., and Hofzumahaus, A.: Atmospheric OH reactivities in the Pearl River Delta – China in summer 2006: measurement and model results, Atmos. Chem. Phys., 10, 11243–11260, https://doi.org/10.5194/acp-10-11243-2010, 2010.
Lu, K., Zhang, Y., Su, H., Brauers, T., Chou, C. C., Hofzumahaus, A., Liu, S. C., Kita, K., Kondo, Y., Shao, M., Wahner, A., Wang, J., Wang, X., and Zhu, T.: Oxidant (O3+NO2) production processes and formation regimes in Beijing, J. Geophys. Res., 115, D07303, https://doi.org/10.1029/2009jd012714, 2010.
Lu, K., Guo, S., Tan, Z., Wang, H., Shang, D., Liu, Y., Li, X., Wu, Z., Hu, M., and Zhang, Y.: Exploring the Atmospheric Free Radical chemistry in China: The Self-Cleansing Capacity and the Formation of Secondary air Pollution, Natl. Sci. Rev., 6, 579–594, https://doi.org/10.1093/nsr/nwy073, 2018.
Lu, K., Fuchs, H., Hofzumahaus, A., Tan, Z., Wang, H., Zhang, L., Schmitt, S. H., Rohrer, F., Bohn, B., Broch, S., Dong, H., Gkatzelis, G. I., Hohaus, T., Holland, F., Li, X., Liu, Y., Liu, Y., Ma, X., Novelli, A., Schlag, P., Shao, M., Wu, Y., Wu, Z., Zeng, L., Hu, M., Kiendler-Scharr, A., Wahner, A., and Zhang, Y.: Fast Photochemistry in Wintertime Haze: Consequences for Pollution Mitigation Strategies, Environ. Sci. Technol., 53, 10676–10684, https://doi.org/10.1021/acs.est.9b02422, 2019.
Lu, K. D., Hofzumahaus, A., Holland, F., Bohn, B., Brauers, T., Fuchs, H., Hu, M., Häseler, R., Kita, K., Kondo, Y., Li, X., Lou, S. R., Oebel, A., Shao, M., Zeng, L. M., Wahner, A., Zhu, T., Zhang, Y. H., and Rohrer, F.: Missing OH source in a suburban environment near Beijing: observed and modelled OH and HO2 concentrations in summer 2006, Atmos. Chem. Phys., 13, 1057–1080, https://doi.org/10.5194/acp-13-1057-2013, 2013.
Lyu, X., Wang, N., Guo, H., Xue, L., Jiang, F., Zeren, Y., Cheng, H., Cai, Z., Han, L., and Zhou, Y.: Causes of a continuous summertime O3 pollution event in Jinan, a central city in the North China Plain, Atmos. Chem. Phys., 19, 3025–3042, https://doi.org/10.5194/acp-19-3025-2019, 2019.
Mao, J., Ren, X., Chen, S., Brune, W. H., Chen, Z., Martinez, M., Harder, H., Lefer, B., Rappenglück, B., Flynn, J., and Leuchner, M.: Atmospheric oxidation capacity in the summer of Houston 2006: Comparison with summer measurements in other metropolitan studies, Atmos. Environ., 44, 4107–4115, https://doi.org/10.1016/j.atmosenv.2009.01.013, 2010.
Mogensen, D., Smolander, S., Sogachev, A., Zhou, L., Sinha, V., Guenther, A., Williams, J., Nieminen, T., Kajos, M. K., Rinne, J., Kulmala, M., and Boy, M.: Modelling atmospheric OH-reactivity in a boreal forest ecosystem, Atmos. Chem. Phys., 11, 9709–9719, https://doi.org/10.5194/acp-11-9709-2011, 2011.
Mogensen, D., Gierens, R., Crowley, J. N., Keronen, P., Smolander, S., Sogachev, A., Nölscher, A. C., Zhou, L., Kulmala, M., Tang, M. J., Williams, J., and Boy, M.: Simulations of atmospheric OH, O3 and NO3 reactivities within and above the boreal forest, Atmos. Chem. Phys., 15, 3909–3932, https://doi.org/10.5194/acp-15-3909-2015, 2015.
Praplan, A. P., Pfannerstill, E. Y., Williams, J., and Hellén, H.: OH reactivity of the urban air in Helsinki, Finland, during winter, Atmos. Environ., 169, 150–161, https://doi.org/10.1016/j.atmosenv.2017.09.013, 2017.
Ren, X.: HOx concentrations and OH reactivity observations in New York City during PMTACS-NY2001, Atmos. Environ., 37, 3627–3637, https://doi.org/10.1016/s1352-2310(03)00460-6, 2003.
Ren, X., Brune, W. H., Mao, J., Mitchell, M. J., Lesher, R. L., Simpas, J. B., Metcalf, A. R., Schwab, J. J., Cai, C., and Li, Y.: Behavior of OH and HO2 in the winter atmosphere in New York City, Atmos. Environ., 40, 252–263, https://doi.org/10.1016/j.atmosenv.2005.11.073, 2006a.
Ren, X., Brune, W. H., Oliger, A., Metcalf, A. R., Simpas, J. B., Shirley, T., Schwab, J. J., Bai, C., Roychowdhury, U., Li, Y., Cai, C., Demerjian, K. L., He, Y., Zhou, X., Gao, H., and Hou, J.: OH, HO2, and OH reactivity during the PMTACS-NY Whiteface Mountain 2002 campaign: Observations and model comparison, J. Geophys. Res.-Atmos., 111, D10S03, https://doi.org/10.1029/2005jd006126, 2006b.
Sadanaga, Y., Yoshino, A., Kato, S., and Kajii, Y.: Measurements of OH reactivity and photochemical ozone production in the urban atmosphere, Environ. Sci. Technol., 39, 8847–8852, https://doi.org/10.1021/es049457p, 2005.
Salgado, M. S., Monedero, E., Villanueva, F., Martín, P., Tapia, A., and Cabanas, B.: Night-Time Atmospheric Fate of Acrolein and Crotonaldehyde, Environ. Sci. Technol., 42, 2394–2400, https://doi.org/10.1021/es702533u, 2008.
Saunders, S. M., Jenkin, M. E., Derwent, R. G., and Pilling, M. J.: Protocol for the development of the Master Chemical Mechanism, MCM v3 (Part A): tropospheric degradation of non-aromatic volatile organic compounds, Atmos. Chem. Phys., 3, 161–180, https://doi.org/10.5194/acp-3-161-2003, 2003.
Shirley, T. R., Brune, W. H., Ren, X., Mao, J., Lesher, R., Cardenas, B., Volkamer, R., Molina, L. T., Molina, M. J., Lamb, B., Velasco, E., Jobson, T., and Alexander, M.: Atmospheric oxidation in the Mexico City Metropolitan Area (MCMA) during April 2003, Atmos. Chem. Phys., 6, 2753–2765, https://doi.org/10.5194/acp-6-2753-2006, 2006.
Sinha, V., Williams, J., Crowley, J. N., and Lelieveld, J.: The Comparative Reactivity Method – a new tool to measure total OH Reactivity in ambient air, Atmos. Chem. Phys., 8, 2213–2227, https://doi.org/10.5194/acp-8-2213-2008, 2008.
Song, M. D., Tan, Q. W., Feng, M., Qu, Y., Liu, X. G., An, J. L., and Zhang, Y. H.: Source Apportionment and Secondary Transformation of Atmospheric Nonmethane Hydrocarbons in Chengdu, Southwest China, J. Geophys. Res.-Atmos., 123, 9741–9763, https://doi.org/10.1029/2018jd028479, 2018.
Tan, Z., Fuchs, H., Lu, K., Hofzumahaus, A., Bohn, B., Broch, S., Dong, H., Gomm, S., Häseler, R., He, L., Holland, F., Li, X., Liu, Y., Lu, S., Rohrer, F., Shao, M., Wang, B., Wang, M., Wu, Y., Zeng, L., Zhang, Y., Wahner, A., and Zhang, Y.: Radical chemistry at a rural site (Wangdu) in the North China Plain: observation and model calculations of OH, HO2 and RO2 radicals, Atmos. Chem. Phys., 17, 663–690, https://doi.org/10.5194/acp-17-663-2017, 2017.
Tan, Z., Lu, K., Jiang, M., Su, R., Wang, H., Lou, S., Fu, Q., Zhai, C., Tan, Q., Yue, D., Chen, D., Wang, Z., Xie, S., Zeng, L., and Zhang, Y.: Daytime atmospheric oxidation capacity in four Chinese megacities during the photochemically polluted season: a case study based on box model simulation, Atmos. Chem. Phys., 19, 3493–3513, https://doi.org/10.5194/acp-19-3493-2019, 2019.
Tong, S., Hou, S., Zhang, Y., Chu, B., Liu, Y., He, H., Zhao, P., and Ge, M.-F.: Exploring the nitrous acid (HONO) formation mechanism in winter Beijing: direct emissions and heterogeneous production in urban and suburban areas, Faraday Discuss., 189, 213–230, https://doi.org/10.1039/C5FD00163C, 2015.
Wang, W., Li, X., Shao, M., Hu, M., Zeng, L., Wu, Y., and Tan, T.: The impact of aerosols on photolysis frequencies and ozone production in Beijing during the 4-year period 2012–2015, Atmos. Chem. Phys., 19, 9413–9429, https://doi.org/10.5194/acp-19-9413-2019, 2019.
Wang, Y., Hu, B., Tang, G., Ji, D., Zhang, H., Bai, J., Wang, X., and Wang, Y.: Characteristics of ozone and its precursors in Northern China: A comparative study of three sites, Atmos. Res., 132–133, 450–459, https://doi.org/10.1016/j.atmosres.2013.04.005, 2013.
Wang, Y., Riva, M., Xie, H., Heikkinen, L., Schallhart, S., Zha, Q., Yan, C., He, X.-C., Peräkylä, O., and Ehn, M.: Formation of highly oxygenated organic molecules from chlorine-atom-initiated oxidation of alpha-pinene, Atmos. Chem. Phys., 20, 5145–5155, https://doi.org/10.5194/acp-20-5145-2020, 2020.
Whalley, L. K., Stone, D., Bandy, B., Dunmore, R., Hamilton, J. F., Hopkins, J., Lee, J. D., Lewis, A. C., and Heard, D. E.: Atmospheric OH reactivity in central London: observations, model predictions and estimates of in situ ozone production, Atmos. Chem. Phys., 16, 2109–2122, https://doi.org/10.5194/acp-16-2109-2016, 2016.
Wu, R., Li, J., Hao, Y., Li, Y., Zeng, L., and Xie, S.: Evolution process and sources of ambient volatile organic compounds during a severe haze event in Beijing, China, Sci. Total Environ., 560–561, 62–72, https://doi.org/10.1016/j.scitotenv.2016.04.030, 2016.
Xu, J., Ma, J. Z., Zhang, X. L., Xu, X. B., Xu, X. F., Lin, W. L., Wang, Y., Meng, W., and Ma, Z. Q.: Measurements of ozone and its precursors in Beijing during summertime: impact of urban plumes on ozone pollution in downwind rural areas, Atmos. Chem. Phys., 11, 12241–12252, https://doi.org/10.5194/acp-11-12241-2011, 2011.
Xue, L., Gu, R., Wang, T., Wang, X., Saunders, S., Blake, D., Louie, P. K. K., Luk, C. W. Y., Simpson, I., Xu, Z., Wang, Z., Gao, Y., Lee, S., Mellouki, A., and Wang, W.: Oxidative capacity and radical chemistry in the polluted atmosphere of Hong Kong and Pearl River Delta region: analysis of a severe photochemical smog episode, Atmos. Chem. Phys., 16, 9891–9903, https://doi.org/10.5194/acp-16-9891-2016, 2016.
Yang, Y., Shao, M., Wang, X., Nölscher, A. C., Kessel, S., Guenther, A., and Williams, J.: Towards a quantitative understanding of total OH reactivity: A review, Atmos. Environ., 134, 147–161, https://doi.org/10.1016/j.atmosenv.2016.03.010, 2016.
Yang, Y., Shao, M., Keßel, S., Li, Y., Lu, K., Lu, S., Williams, J., Zhang, Y., Zeng, L., Nölscher, A. C., Wu, Y., Wang, X., and Zheng, J.: How the OH reactivity affects the ozone production efficiency: case studies in Beijing and Heshan, China, Atmos. Chem. Phys., 17, 7127–7142, https://doi.org/10.5194/acp-17-7127-2017, 2017.
Yang, Y., Ji, D., Sun, J., Wang, Y., Yao, D., Zhao, S., Yu, X., Zeng, L., Zhang, R., Zhang, H., Wang, Y., and Wang, Y.: Ambient volatile organic compounds in a suburban site between Beijing and Tianjin: Concentration levels, source apportionment and health risk assessment, Sci. Total Environ., 695, 133889, https://doi.org/10.1016/j.scitotenv.2019.133889, 2019.
Ye, Y., Galbally, I., and Weeks, I.: Emission of 1,3-butadiene from petrol-driven motor vehicles, Atmos. Environ., 31, 1157–1165, https://doi.org/10.1016/S1352-2310(96)00308-1, 1997.
Yoshino, A., Sadanaga, Y., Watanabe, K., Kato, S., Miyakawa, Y., Matsumoto, J., and Kajii, Y.: Measurement of total OH reactivity by laser-induced pump and probe technique – comprehensive observations in the urban atmosphere of Tokyo, Atmos. Environ., 40, 7869–7881, https://doi.org/10.1016/j.atmosenv.2006.07.023, 2006.
Yuan, B., Shao, M., de Gouw, J., Parrish, D. D., Lu, S., Wang, M., Zeng, L., Zhang, Q., Song, Y., Zhang, J., and Hu, M.: Volatile organic compounds (VOCs) in urban air: How chemistry affects the interpretation of positive matrix factorization (PMF) analysis, J. Geophys. Res.-Atmos., 117, 24302, https://doi.org/10.1029/2012jd018236, 2012.
Yuan, B., Hu, W. W., Shao, M., Wang, M., Chen, W. T., Lu, S. H., Zeng, L. M., and Hu, M.: VOC emissions, evolutions and contributions to SOA formation at a receptor site in eastern China, Atmos. Chem. Phys., 13, 8815–8832, https://doi.org/10.5194/acp-13-8815-2013, 2013.
Yuan, Z. B., Lau, A. K. H., Shao, M., Louie, P. K. K., Liu, S. C., and Zhu, T.: Source analysis of volatile organic compounds by positive matrix factorization in urban and rural environments in Beijing, J. Geophys. Res.-Atmos., 114, D00G15, https://doi.org/10.1029/2008JD011190, 2009.
Zannoni, N., Gros, V., Sarda Esteve, R., Kalogridis, C., Michoud, V., Dusanter, S., Sauvage, S., Locoge, N., Colomb, A., and Bonsang, B.: Summertime OH reactivity from a receptor coastal site in the Mediterranean Basin, Atmos. Chem. Phys., 17, 12645–12658, https://doi.org/10.5194/acp-17-12645-2017, 2017.
Zhang, W., Tong, S., Ge, M.-F., An, J., Shi, Z., Hou, S., Xia, K., Qu, Y., Zhang, H., Chu, B., Sun, Y., and He, H.: Variations and sources of nitrous acid (HONO) during a severe pollution episode in Beijing in winter 2016, Sci. Total Environ., 648, 253–262, https://doi.org/10.1016/j.scitotenv.2018.08.133, 2019.
Zheng, H., Kong, S., Xing, X., Mao, Y., Hu, T., Ding, Y., Li, G., Liu, D., Li, S., and Qi, S.: Monitoring of volatile organic compounds (VOCs) from an oil and gas station in northwest China for 1 year, Atmos. Chem. Phys., 18, 4567–4595, https://doi.org/10.5194/acp-18-4567-2018, 2018.
Zhou, P., Ganzeveld, L., Rannik, Ü., Zhou, L., Gierens, R., Taipale, D., Mammarella, I., and Boy, M.: Simulating ozone dry deposition at a boreal forest with a multi-layer canopy deposition model, Atmos. Chem. Phys., 17, 1361–1379, https://doi.org/10.5194/acp-17-1361-2017, 2017a.
Zhou, P., Ganzeveld, L., Taipale, D., Rannik, Ü., Rantala, P., Rissanen, M. P., Chen, D., and Boy, M.: Boreal forest BVOC exchange: emissions versus in-canopy sinks, Atmos. Chem. Phys., 17, 14309–14332, https://doi.org/10.5194/acp-17-14309-2017, 2017b.
Zhu, J., Wang, S., Wang, H., Jing, S., Lou, S., Saiz-Lopez, A., and Zhou, B.: Observationally constrained modeling of atmospheric oxidation capacity and photochemical reactivity in Shanghai, China, Atmos. Chem. Phys., 20, 1217–1232, https://doi.org/10.5194/acp-20-1217-2020, 2020.