the Creative Commons Attribution 4.0 License.
the Creative Commons Attribution 4.0 License.
 | 14 Jul 2020
Ice-supersaturated air masses in the northern mid-latitudes from regular in situ observations by passenger aircraft: vertical distribution, seasonality and tropospheric fingerprint
Patrick Neis
Mihal Rütimann
Susanne Rohs
Florian Berkes
Herman G. J. Smit
Martina Krämer
Nicole Spelten
Peter Spichtinger
Philippe Nédélec
Andreas Wahner
The vertical distribution and seasonal variation of water vapour volume mixing ratio (H2O VMR), of relative humidity with respect to ice (RHice) and particularly of regions with ice-supersaturated air masses (ISSRs) in the extratropical upper troposphere and lowermost stratosphere are investigated at northern mid-latitudes over the eastern North American, North Atlantic and European regions for the period 1995 to 2010. Observation data originate from regular and continuous long-term measurements on board instrumented passenger aircraft in the framework of the European research programme MOZAIC (1994–2010), which continues as the European research infrastructure IAGOS (from 2011). Data used in our study result from collocated observations of O3 VMR, RHice and temperature, as well as H2O VMR deduced from RHice and temperature data. The in situ observations of H2O VMR and RHice with a vertical resolution of 30 hPa (< 750 m at the extratropical tropopause level) and a horizontal resolution of 1 km resolve detailed features of the distribution of water vapour and ice-supersaturated air relative to the thermal tropopause, including their seasonal and regional variability and chemical signatures at various distances from the tropopause layer. Annual cycles of the investigated properties document the highest H2O VMR and temperatures above the thermal tropopause in the summer months, whereas RHice above the thermal tropopause remains almost constant in the course of the year. Over all investigated regions, upper tropospheric air masses close to the tropopause level are nearly saturated with respect to ice and contain a significant fraction of ISSRs with a distinct seasonal cycle of minimum values in summer (30 % over the ocean, 20 %–25 % over land) and maximum values in late winter (35 %–40 % over both land and ocean). Above the thermal tropopause, ISSRs are occasionally observed with an occurrence probability of 1.5 ± 1.1 %, whereas above the dynamical tropopause at 2 PVU (PVU: potential vorticity unit), the occurrence probability increases 4-fold to 8.4 ± 4.4 %. In both coordinate systems related to tropopause height (TPH), the ISSR occurrence probabilities drop to values below 1 % for the next higher air mass layer with pressure levels p < pTPH−15 hPa. For both tropopause definitions, the tropospheric nature or fingerprint, based on O3 VMR, indicates the continuing tropospheric influence on ISSRs inside and above the respective tropopause layer. For the non-ISSRs, however, the stratospheric nature is clearly visible above the thermal tropopause, whereas above the dynamical tropopause the air masses show a still substantial tropospheric influence. For all three regions, seasonal deviations from the long-term annual cycle of ISSR occurrence show no significant trends over the observation period of 15 years, whereas a statistically significant correlation between the North Atlantic Oscillation (NAO) index and the deviation of ISSR occurrence from the long-term average is observed for the North Atlantic region but not for the eastern North American and European regions.


Relative humidity over ice (RHice) and in particular ice-supersaturated air masses (RHice > 100 %) is of ample importance for the occurrence and life cycle of high ice clouds, or cirrus clouds, which have a large but still not fully understood impact on Earth's climate, with its net radiation impact being unknown and even the sign being unclear (Chen et al., 2000; Boucher et al., 2013). In this context, long-term observations of the properties of water vapour are an indispensable prerequisite for the investigation of potential changes in its abundance in the global upper troposphere and lowermost stratosphere (e.g. Müller et al., 2016) and the resulting effects on atmospheric radiation (e.g. Riese et al., 2012), as well as on cirrus cloud occurrence and life cycle (Gettelman et al., 2012; Krämer et al., 2016; Heymsfield et al., 2017).
The extratropical upper troposphere and lowermost stratosphere (ExUTLS) is characterized by thermal gradients and dynamical barriers which inhibit mixing, give rise to specific trace gas distributions and lead to a variety of definitions of the tropopause (Gettelman et al., 2011; Ivanova, 2013). The thermal tropopause according to WMO criteria (WMO, 1957) is defined as the level at which the lapse rate decreases to 2 K km−1 or less and remains so small at least in the overlying layer of 2 km. This definition identifies the vertical change in the static stability and allows for the existence of multiple tropopause layers. The dynamical tropopause is based on the potential vorticity (PV) and includes both changes in static stability and vorticity (i.e. horizontal and vertical wind shear), also viewed as the dynamic stability. The PV values in the stratosphere exceed the values in the troposphere by an order of magnitude. The threshold value of 2 PVU (PVU: potential vorticity unit; 1 PVU = 10−6 ) for separating tropospheric and stratospheric air masses is commonly used in studies on stratosphere–troposphere transport. The chemical tropopause is based on the chemical change at the tropopause, identified from tracer–tracer correlations (Zahn and Brenninkmeijer, 2003), with a threshold value of O3 VMR = 120 ppbv (VMR: volume mixing ratio) being used to distinguish stratospheric from tropospheric air (Thouret et al., 2006). The coexistence of different definitions of the tropopause and the observation that characteristics of air masses around the tropopause depend on the applied definition motivated the concept of the extratropical transition layer (ExTL) which describes the extratropical layer around the tropopause (see Gettelman et al., 2011, and references therein).
The vertical distribution of trace species in the ExUTLS is controlled by the strong static stability gradients and the dynamic barriers to transport in this atmospheric layer. In the case of water vapour, the H2O VMR is also determined by the coldest temperature the air parcel has experienced on its way to the tropopause (the Lagrangian cold point), which decouples the abundance of water vapour from local cross-tropopause mixing to some extent (Hoor et al., 2010; Zahn et al., 2014). The distribution is described by a steep decrease in the H2O VMR up to the tropopause layer. Across the tropopause layer, H2O VMR decreases further but less steep until it reaches its near-constant stratospheric value of 5 ppmv at about 2 km altitude above the tropopause. The thermal tropopause thus forms an efficient barrier for the large-scale vertical transport of H2O into the stratosphere, whereas troposphere–stratosphere transport occurs for specific local-scale dynamic situations such as, for example, tropopause folds (Hoor et al., 2004, 2010; Gettelman et al., 2011).
These features are reported from extensive research campaigns like SPURT (Hoor et al., 2004), which was designed on a climatological approach and compared to climatological data from the research programme MOZAIC (Marenco et al., 1998), from long-term sampling by the CARIBIC passenger aircraft which carries an instrumented airfreight container (Dyroff et al., 2014; Zahn et al., 2014), and from instrumented balloons (Kunz et al., 2013).
Of particular interest with respect to ice cloud formation and life cycle is the thermodynamic state parameter RHice which controls the properties of ice clouds by setting the thermodynamic conditions for cirrus cloud formation, existence and dissolution (Pruppacher and Klett, 1997). Air masses supersaturated with respect to ice (RHice > 100 %), so-called ice-supersaturated regions (ISSRs), have mostly faced a decrease in temperature or increase in water vapour mixing ratio, i.e. specific humidity during their past lifetime (Spichtinger and Leschner, 2016). As a result, these air parcels are generally both colder and of higher absolute humidity than the embedded subsaturated atmosphere (Gierens et al., 1999; Spichtinger et al., 2003b), which did not experience similar changes in its atmospheric state parameters.
In the northern mid-latitudes, ISSR occurrence coincides strongly with the storm tracks over the North Atlantic (Spichtinger et al., 2003b; Gettelman et al., 2006; Lamquin et al., 2012), on the anticyclonic side of the polar jet stream (Diao et al., 2015), and inside the anvil cirrus clouds (D'Alessandro et al., 2017). Frequently occurring synoptic weather features such as fronts or warm conveyor belts lead to synoptic-scale upward motion and thus facilitate the formation of ISSRs (Spichtinger et al., 2005). However, ice supersaturation also occurs in regions of high pressure and anticyclonic flow (Gierens and Brinkop, 2012). Detailed studies of the ISSR life cycle by means of Lagrangian trajectory analyses (Irvine et al., 2014) indicate that the lifetime of an air parcel in the state of supersaturation below the tropopause is generally short with the median duration being less than 6 h for both winter and summer conditions. In an Eulerian view, however, these ISSRs composed of many supersaturated air parcels may persist on a much longer timescale (Spichtinger et al., 2005).
In contrast to the strong negative gradient in H2O VMR at altitudes below but close to the thermal tropopause, ISSRs occur frequently in the humid and cold upper tropospheric air masses. Detailed investigations of the distribution and structure of ice supersaturation in the northern mid-latitude tropopause region over Lindenberg, Germany, from 15 months of balloon soundings showed that ice saturation occurs in most cases below the thermal tropopause even in meteorological situations where the tropopause pressure is relatively high (Spichtinger et al., 2003a). On the other hand, the occurrence of an ISSR above the thermal tropopause is very rare with a fraction of approx. 6 % of the observations over Lindenberg reporting ice supersaturation above the thermal tropopause. Direct evidence of the occurrence of ice supersaturation above but close to the thermal tropopause reports a fraction of 2 % from an earlier analysis of MOZAIC data (Gierens et al., 1999). Furthermore, research aircraft observations over North America showed that most of the clear-sky ISSRs are located within ± 500 m of the thermal tropopause (Diao et al., 2015).
ISSRs constitute potential formation regions for ice clouds, persistent contrails and contrail cirrus. In these cold and humid air masses, natural cirrus clouds may form by heterogeneous or homogeneous freezing processes (Koop et al., 2000; Hoose and Möhler, 2012; Heymsfield et al., 2017), and long-lived contrails and contrail cirrus are generated by cruising aircraft, causing the major non-CO2 climate impact of civil aviation (Aaltonen et al., 2006; Stuber et al., 2006; Burkhardt et al., 2008; Lee et al., 2010; Burkhardt and Kärcher, 2011; Kärcher, 2018; Bock and Burkhardt, 2019).
The occurrence of an ISSR and its close link to the occurrence of cirrus clouds is reported from a joint analysis of SAGE II data on subvisible cirrus and MOZAIC ice supersaturation by Gierens et al. (2000), which provides an almost 1:1 relationship between subvisible cirrus occurrence and ice supersaturation but without discrimination between tropospheric and stratospheric air masses. From other platforms, there are only very few reports of cirrus clouds above the tropopause layer either from satellite retrievals (Spang et al., 2015) or from research aircraft flights (Müller et al., 2015).
Despite the high climate-related relevance of the vertical distribution of water vapour VMR and related RHice in the vicinity of the extratropical tropopause layer, only very few approaches exist for the continuous global-scale monitoring of water vapour abundance and RHice with sufficient precision and vertical resolution (see Müller et al., 2016, for an overview). Among space-borne techniques, the High-resolution Infrared Radiation Sounder (HIRS) instruments are most important since they cover more than 3 decades of observations (Gierens et al., 2014), whereas the Microwave Limb Sounder (MLS) and the Atmospheric Infrared Sounder (AIRS) were particularly used for the space-borne global mapping of ISSRs (Spichtinger et al., 2003b; Lamquin et al., 2012) and cirrus cloud coverage (Stubenrauch et al., 2010). However, the vertical resolution provided by space-borne instruments in the ExUTLS is very limited and does not allow detailed studies on the vertical distribution of RHice in this region. In addition, satellite observations such as NASA AIRS data contain biases in temperature and water vapour retrievals compared with aircraft observations by 1–2 K and 30 %–40 % of H2O VMR, respectively (Diao et al., 2013).
Concerning in situ observations of water vapour, the international network of weather balloons has been in operation for many decades, but the observations are considered insufficient for detecting trends and variability in upper troposphere and lowermost stratosphere (UTLS) water vapour (see Müller et al., 2016, and references therein). The Global Climate Observing System (GCOS) Reference Upper-Air Network (GRUAN) targets the provision of climate-quality measurements of tropospheric and lower stratospheric variables (Seidel et al., 2009). GRUAN has established rigorous data quality assessment measures to provide reference-quality in situ and ground-based remote sensing observations of upper-air essential climate variables and serves as another source of high-quality water vapour data, albeit for a limited number of certified surface stations so far (Bodeker et al., 2016).
The only other existing global-scale in situ observation infrastructure for atmospheric composition in the ExUTLS uses instrumented passenger aircraft for routine measurements of trace gases like H2O, O3, CO, greenhouse gases, nitrogen oxides, aerosols and clouds at cruise altitude. IAGOS (In-service Aircraft for a Global Observing System; for details see Petzold et al., 2015; Nédélec et al., 2015; https://www.iagos.org, last access: 6 July 2020) and its predecessor research programmes MOZAIC (Marenco et al., 1998) and CARIBIC (Brenninkmeijer et al., 1999; Brenninkmeijer et al., 2007) have been conducting regular measurements of water vapour and relative humidity since 1994. The transformation of both former research projects MOZAIC and CARIBIC into the current IAGOS research infrastructure took place in 2011. These regular flights on a global scale are unique in their quantity, continuity and quality of measurements of ExUTLS air masses and have provided detailed insights into the distribution of RHice (Gierens et al., 1999; Spichtinger et al., 2002), the distribution and properties of ISSR (Gierens and Spichtinger, 2000; Spichtinger and Leschner, 2016), their link to cirrus clouds (Gierens et al., 2000; Petzold et al., 2017), and the processes controlling the water vapour distribution (Zahn et al., 2014).
In the present study, we analysed the distribution properties of RHice and of ISSRs in the ExUTLS for a latitudinal band reaching from eastern North America across the North Atlantic to Europe. We used the full MOZAIC period from 1995 to 2010 which permits the robust seasonal analysis for the identified target regions. Our studies focus on the structure of the vertical distribution of RHice, its variability and seasonality, and potential trends. The horizontal resolution of our data set is 1 km, set by the instrument time resolution of 4 s and the cruising speed of approx. 250 m s−1. The vertical resolution is set to 30 hPa, which corresponds to a vertical distance of approx. 750 m at cruise altitude (Thouret et al., 2006) and assures sufficient statistical robustness of the conducted analyses. This vertical resolution is of a similar order as the typical resolution of UTLS data with a vertical grid spacing of about 50 hPa in the vicinity of the tropopause (Reichler et al., 2003). Chemistry–climate models like EMAC (ECHAM/MESSy Atmospheric Chemistry model) with vertical resolutions L90MA and L47MA use a vertical grid spacing of 15–25 hPa near the extratropical tropopause (Jöckel et al., 2016), which is reflected in the selected vertical resolution of MOZAIC data layers.
2.1 Data coverage and vertical distribution
The MOZAIC RH data set used for this analysis spans the period from 1995 to 2010 and is constrained to cruise altitude conditions, i.e. pressure below 350 hPa (above approx. 8 km altitude), and to ambient temperatures below 233 K to exclude potential sensor contamination by supercooled liquid water droplets. The aerial boundaries of the analysed data set are 40 to 60∘ N and cover the eastern North American (105 to 65∘ W), North Atlantic (65 to 5∘ W) and European (5∘ W to 30∘ E) regions. Figure 1 illustrates the global coverage of water vapour observations by MOZAIC for the years 1995 to 2010. Inserted boxes mark the eastern North American, North Atlantic and European regions. The annual data coverage for each analysed regional box varies between 30 and 65 flight hours of MOZAIC aircraft per season (3 months), which corresponds to 27 000 to 60 000 data points of 4 s duration each per season per year. All investigated regions are characterized by continuous data coverage over the investigated period with no data gaps. Data are available through the open-access IAGOS data portal at https://doi.org/10.25326/20.

Figure 1Global coverage of water vapour observations by MOZAIC for the period 1995 to 2010 shown as decadal logarithm of the fraction of measurements in a certain grid box. Red boxes indicate the target areas for our analyses.
Since MOZAIC data are collected at constant pressure cruise levels of passenger aircraft which may cross from the upper troposphere (UT) through the tropopause layer (TPL) into the lowermost stratosphere (LMS) and back, the data vertical coordinates are reported relative to the tropopause pressure level.
The pressure levels of the thermal tropopause (ptherm.TPH) and the dynamical 2 PVU tropopause (pdyn.TPH) were derived from ERA-Interim (ERA-I; Dee et al., 2011) which uses 60 model layers with the top of the atmosphere located at 0.1 hPa. For our analysis, the 6-hourly outputs from ERA-I (0.75∘ × 0.75∘) were interpolated onto a 1∘ × 1∘ horizontal grid and on 60 vertical levels of constant pressure and potential temperature (Kunz et al., 2014; Berkes et al., 2017). Additionally, the variables of the PV and the pressure of the thermal tropopause based on the WMO criteria were calculated (WMO, 1957; Reichler et al., 2003). The ERA-Interim data were then linearly interpolated with respect to longitude, latitude, pressure and time onto each flight track with a 4 s resolution, as described by Kunz et al. (2014). Interpolated tropopause pressure levels were finally used to determine the position of the aircraft relative to the thermal tropopause or to the 2 PVU isosurface and thus to distinguish whether the aircraft sampled air masses of UT, TPL or LMS origin with respect to the chosen tropopause definition.
In order to reach both a sufficiently large data set for robust statistical analyses and good vertical resolution, the ExUTLS is subdivided into seven layers of 30 hPa thickness each, with three layers located below the thermal tropopause height and three layers above. Thouret et al. (2006) used a similar definition but with reference to the dynamical tropopause at 2 PVU; i.e. they defined the tropopause as a mixing zone 30 hPa thick across the 2 PVU potential vorticity surface.
The seven layers of 30 hPa thickness each are centred at ptherm.TPH=0 hPa for the tropopause layer (TPL) itself and then at ptherm.TPH ± 30 hPa, ptherm.TPH ± 60 hPa and finally ptherm.TPH ± 90 hPa. From this vertical spacing, the separation of air masses is achieved by applying the following criteria (formulated for the thermal tropopause only).
-
LMS: hPa, which is limited by the maximum cruise altitude with p ≈ 190 hPa.
-
TPL: hPa.
-
UT: hPa, limited to lower altitudes by p < 350 hPa.
The bulk of our analyses refers to the classic thermal tropopause according to WMO criteria (WMO, 1957) with the exception of the occurrence of ISSRs above the tropopause, for which we present the analyses for both tropopause definitions and compare the results to learn more about the processes influencing the formation of ISSRs (see Sect. 3.3).
Since each data set from one single flight provides only a one-dimensional snapshot of the state of the atmosphere along the flight track and each aircraft cruises at a slightly different pressure level, the entire MOZAIC data are merged to season files of 3-month durations, allowing the analysis of vertical distributions of atmospheric state parameters on a robust statistical basis. For each season file, the statistical distribution (average and standard deviation, median, and percentiles) of investigated properties (temperature, O3 VMR, H2O VMR, RHice and ISSR fraction) is calculated with respect to the above-defined UT, TP and LMS vertical layers. From these seasonal averages or percentiles, respective 15-year mean values and standard deviations are determined.
In our study, we use statistical analyses in the following manner: when assessing results from laboratory studies and calibration experiments based on reproducible observations, we apply the 2σ criterion for the 95 % confidence level; when interpreting results from atmospheric observations which are taken from fast-flying airborne platforms that cover 15 years of observations, including their interannual and lateral variabilities, we report the mean values and respective 1σ standard deviations and state the statistical significance or insignificance, accordingly.
2.2 RH and O3 instrumentation
The relative humidity measurements of MOZAIC and now IAGOS use a thin-film HUMICAP® capacitive sensor (Vaisala) which is mounted inside an aeronautic Rosemount inlet attached to the aircraft's hull. The MOZAIC capacitive hygrometers (MCHs) are calibrated in the laboratory against a Lyman-α resonance fluorescence hygrometer (Kley and Stone, 1978) with respect to RH over liquid water (Helten et al., 1998; Smit et al., 2014). The conversion to RHice uses the equations by Sonntag (1994). The MCH reports RH data with an average uncertainty of 4 % RH (span 1 % to 6 % RH) in the middle troposphere at 4 to 8 km altitude during ascent and descent and 5 % RH (span 2 % to 8 % RH) at the tropopause and lowermost stratosphere at 10 to 12 km cruising altitude (Smit et al., 2014). The H2O VMR was finally calculated from the simultaneously measured RHice and temperature data and from the pressure recordings of the aircraft avionic system.
The deployed sensor has been carefully compared to high-precision water vapour instruments in dedicated research aircraft studies (Helten et al., 1999; Neis et al., 2015a, b) which demonstrates a remarkably good agreement between the MCH and reference instruments with Pearson's R2=0.92 and a slope of m=1.02 from linear regression analyses. The authors report an MCH uncertainty of 5 % RH, which is in close agreement with the uncertainty determined from error propagation analysis (Smit et al., 2014).
Kunz et al. (2008), who performed a statistical analysis of water vapour measurements from the SPURT campaigns between 2001 and 2003 with a Lyman-α photo-fragment fluorescence hygrometer (Zöger et al., 1999; Meyer et al., 2015) and MOZAIC water vapour data from the same period, determined a limit of detection (LOD) of 10 ppmv for the MOZAIC sensor. Applying the same 2σ criterion (95 % confidence level), we obtain a MCH LOD of RHice,LOD=10 %, which again signifies a minimum detectable H2O VMR of approx. 10 ppmv at typical mid-latitude upper tropospheric conditions (T=218 K, p=250 hPa) (see also Neis et al., 2015a, for a detailed discussion). As discussed by Smit et al. (2014), the uncertainty of the temperature measurement of the MCH sensor is included in the determination of the MCH RHice uncertainty so that the precision of H2O VMR data deduced from MCH RHice data can be determined directly from the uncertainty of RHice measurements. Overall, the 5 % RH uncertainty leads to a decreasing precision of H2O VMR deeper in the stratosphere and implies a limited use of the MOZAIC H2O sensor in the stratosphere dominated by low RHice and thus an increasingly large uncertainty (Kunz et al., 2008).
The Pt100 temperature sensor of the MCH is characterized by an overall uncertainty of the ambient air temperature of ± 0.5 K, which includes the data processing (Berkes et al., 2017). The temperature range encountered during the MOZAIC observations in the ExUTLS ranges from 200 to 245 K at mid-latitudes (see Fig. 9 in Berkes et al., 2017, for details).
Since the launch of MOZAIC, the programme has also provided O3 VMR data in addition to H2O and RHice observations. On board the MOZAIC and now IAGOS aircraft, ozone is measured by means of a UV absorption instrument which is characterized by an instrumental noise of ± 2 ppbv and an integration time of 4 s (Nédélec et al., 2015). We used the collocated measurement of O3 and RHice for the characterization of ice-supersaturated air masses with respect to a potential stratospheric influence.
2.3 RH data processing
The processing of the MCH data had been subjected to a calibration error from 2000 CE onwards. This error in the data analysis caused a bias of data towards higher RHice values and shifted the peak value of the RHice probability distribution function (PDF) for in-cloud observations to approx. 130 % RHice, which is far above the physically expected value of 100 % RHice. Earlier MCH data for the period 1995 to 1999, however, are not affected. The publications by Lamquin et al. (2012) (Fig. 5 of that publication) and Penner et al. (2018) (Fig. 6 of that publication) illustrate the shift of the erroneous MOZAIC data towards higher RHice values very clearly.
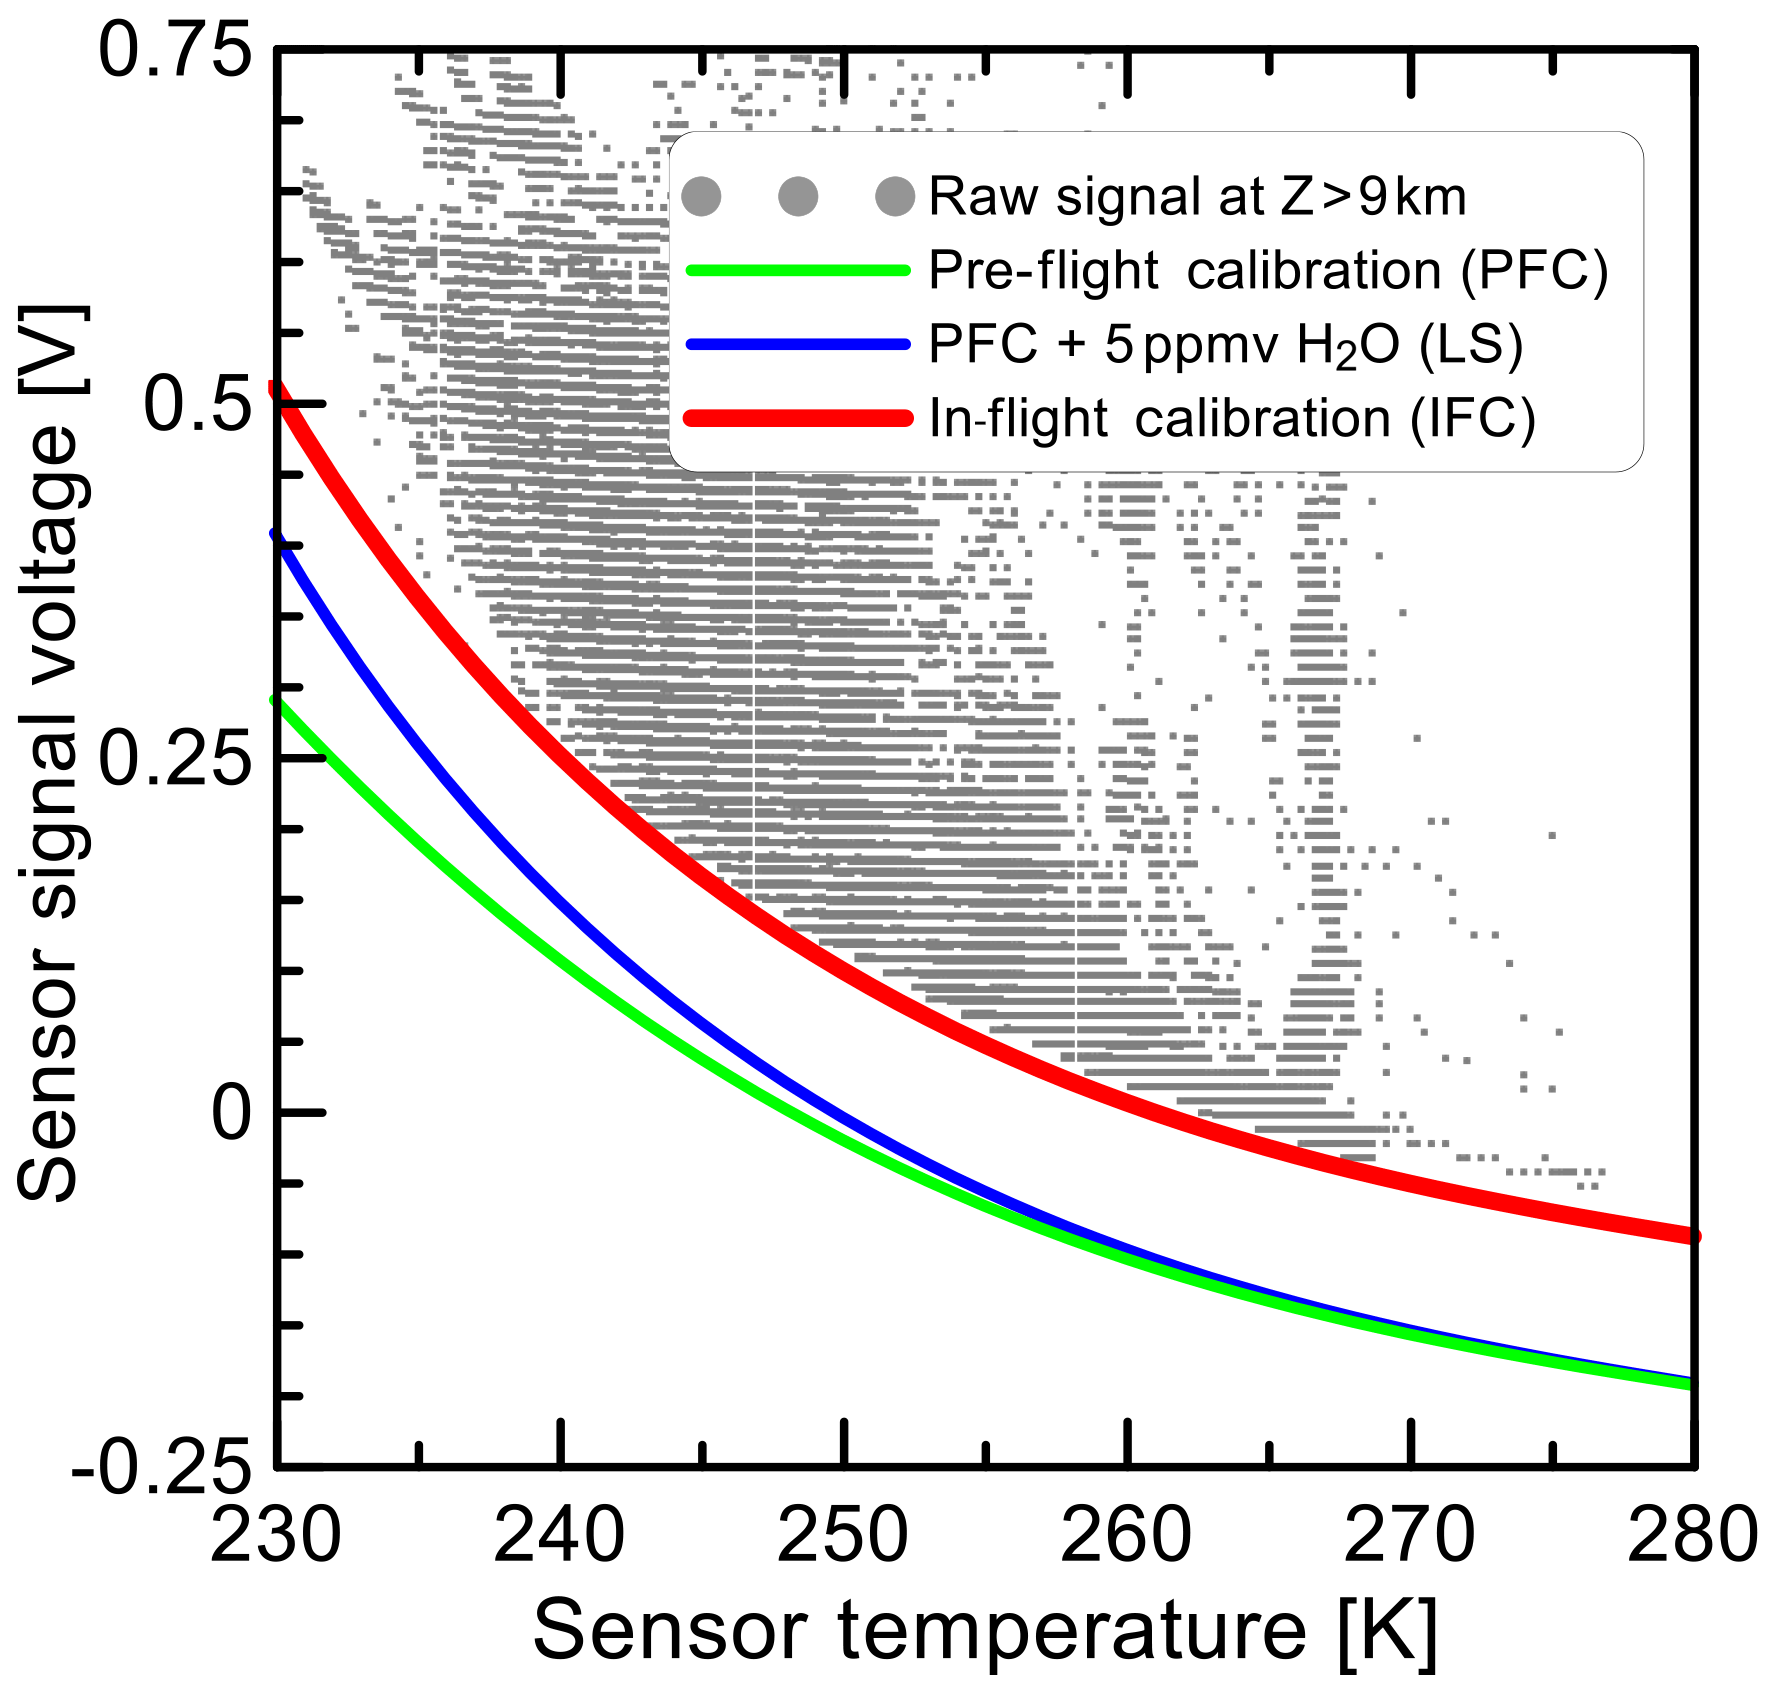
Figure 2Raw signal of the MOZAIC humidity sensor on board one MOZAIC aircraft as a function of the sensor temperature inside the aeronautic housing obtained at cruise altitude (z=9–12 km). Green line: zero signal from pre-flight calibration (PFC); blue line: superposition of zero signal from PFC and contribution of 5 ppmv water vapour; red line: zero signal from in-flight calibration (IFC).
The calibration error was corrected in a recent reanalysis, and the PDFs of RHice are now consistent for the full MOZAIC period and physically reasonable with the PDF showing a second maximum at 100 % RHice, as expected for in-cloud segments (Smit et al., 2014).
Besides the calibration error, another limitation of the MOZAIC RH data set stemming from MCH sensor drifts required correction. In its standard operation mode, MCH sensors were replaced every 3 to 6 months. During their deployment periods, the sensors occasionally showed drifts of the sensor output signal caused by a shift of the sensor offset voltage, which results in erroneous RHice values. To overcome this measurement artefact, the so-called in-flight calibration method (IFC) was developed by Smit et al. (2008), which references the offset voltage of the sensor to signals from flight segments in dry stratospheric air masses where the expected RHice signal is below the MCH LOD, and thus the true MCH signal is considered zero RH.
The method is illustrated in Fig. 2; the MCH sensors leave the calibration facility with a baseline for dry conditions (green curve), the theoretical signal expected from the stratospheric H2O background of 5 ppmv is then added, and this new baseline (blue curve) is the reference line for the offset determination. In the operational mode of the IFC method, the lower bound values of the MCH signal during an operational period of typically 15 consecutive flights are determined as the observations below the 1st percentile value (P01) of the data collected during the respective flight sequence. In the case of a sensor offset drift during MCH operation, the lower envelope from the P01 values is similar to the baseline for dry conditions at calibration plus the 5 ppmv stratospheric H2O background value but shifted by a voltage offset. The difference between the lower envelope and the baseline from calibration determines the sensor offset voltage which is then subtracted from the raw signal. Details of the method are described by Smit et al. (2008).
2.4 RH data validation
The IFC method was applied to the full reanalysis data set from 1995 to 2010. Figure 3a illustrates the effect of the IFC method for the averaged RHice PDF for the entire MOZAIC data set, irrespective of the geographical regions where the data were collected. The average PDF and variability presented is calculated from annual PDFs. Solid lines refer to the MOZAIC average PDFs without the IFC method (white) and with the IFC method applied (blue). Grey areas (without IFC) and dashed and dotted blue lines (with IFC applied) represent the ± 1σ and ± 2σ ranges. Figure 3b shows a zoom into the PDF for the range with RHice > 100 %. In addition to panel (a), the red area marks the difference between the averaged PDFs with and without IFC applied.
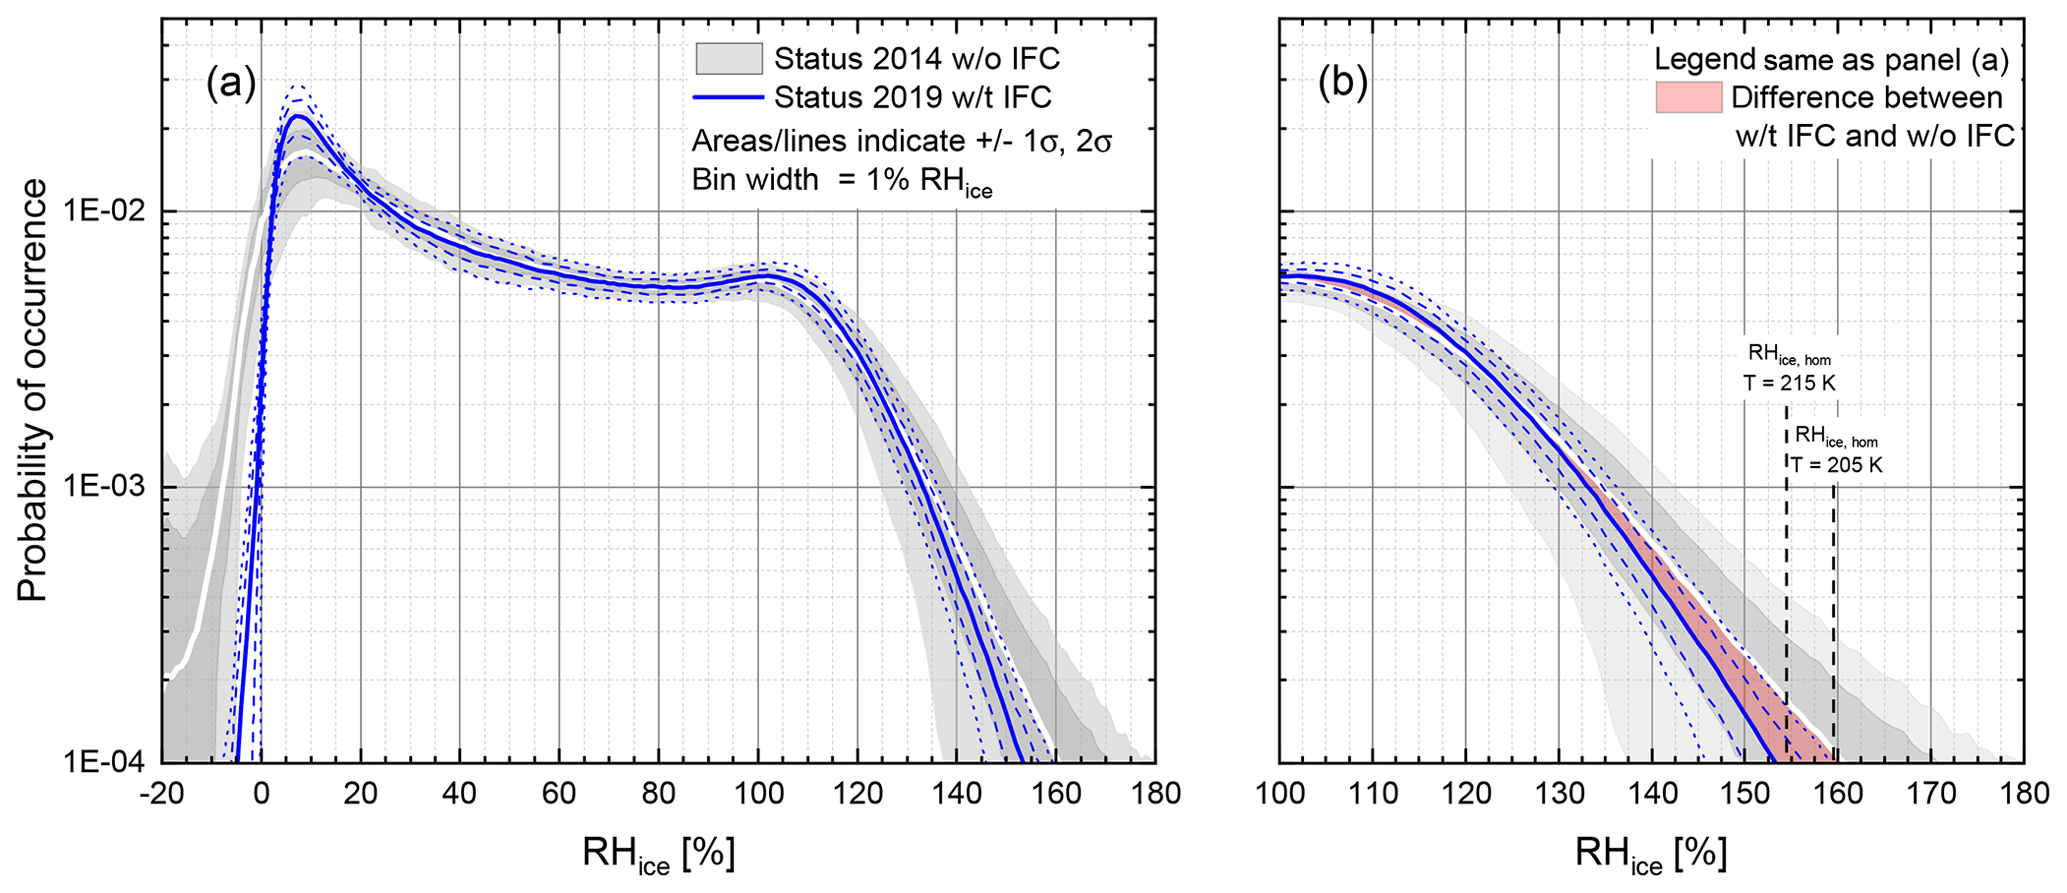
Figure 3Averaged probability density functions of RHice for the entire MOZAIC period from 1995 to 2010 (a) and the zoomed in region of ice supersaturation (b). Data stem from the reanalysis (Smit et al., 2014) without (w/o: white line, grey areas) and with (w/t: blue lines) the in-flight calibration method applied to the data. The red-shaded area indicates the difference between IFC applied (w/t IFC) and not applied (w/o IFC), and vertical lines indicate the threshold RHice values for the homogeneous nucleation of ice at T= 205 K and T= 215 K (Koop et al., 2000).

Figure 4Distribution of RHice for the entire MOZAIC period from 1995 to 2010 with IFC applied as a function of ambient temperature with the colour indicating the probability of occurrence. The lines represent water saturation (solid line; Sonntag, 1994) and the threshold RHice for homogeneous ice nucleation (dotted line; Koop et al., 2000; Kärcher and Lohmann, 2002).
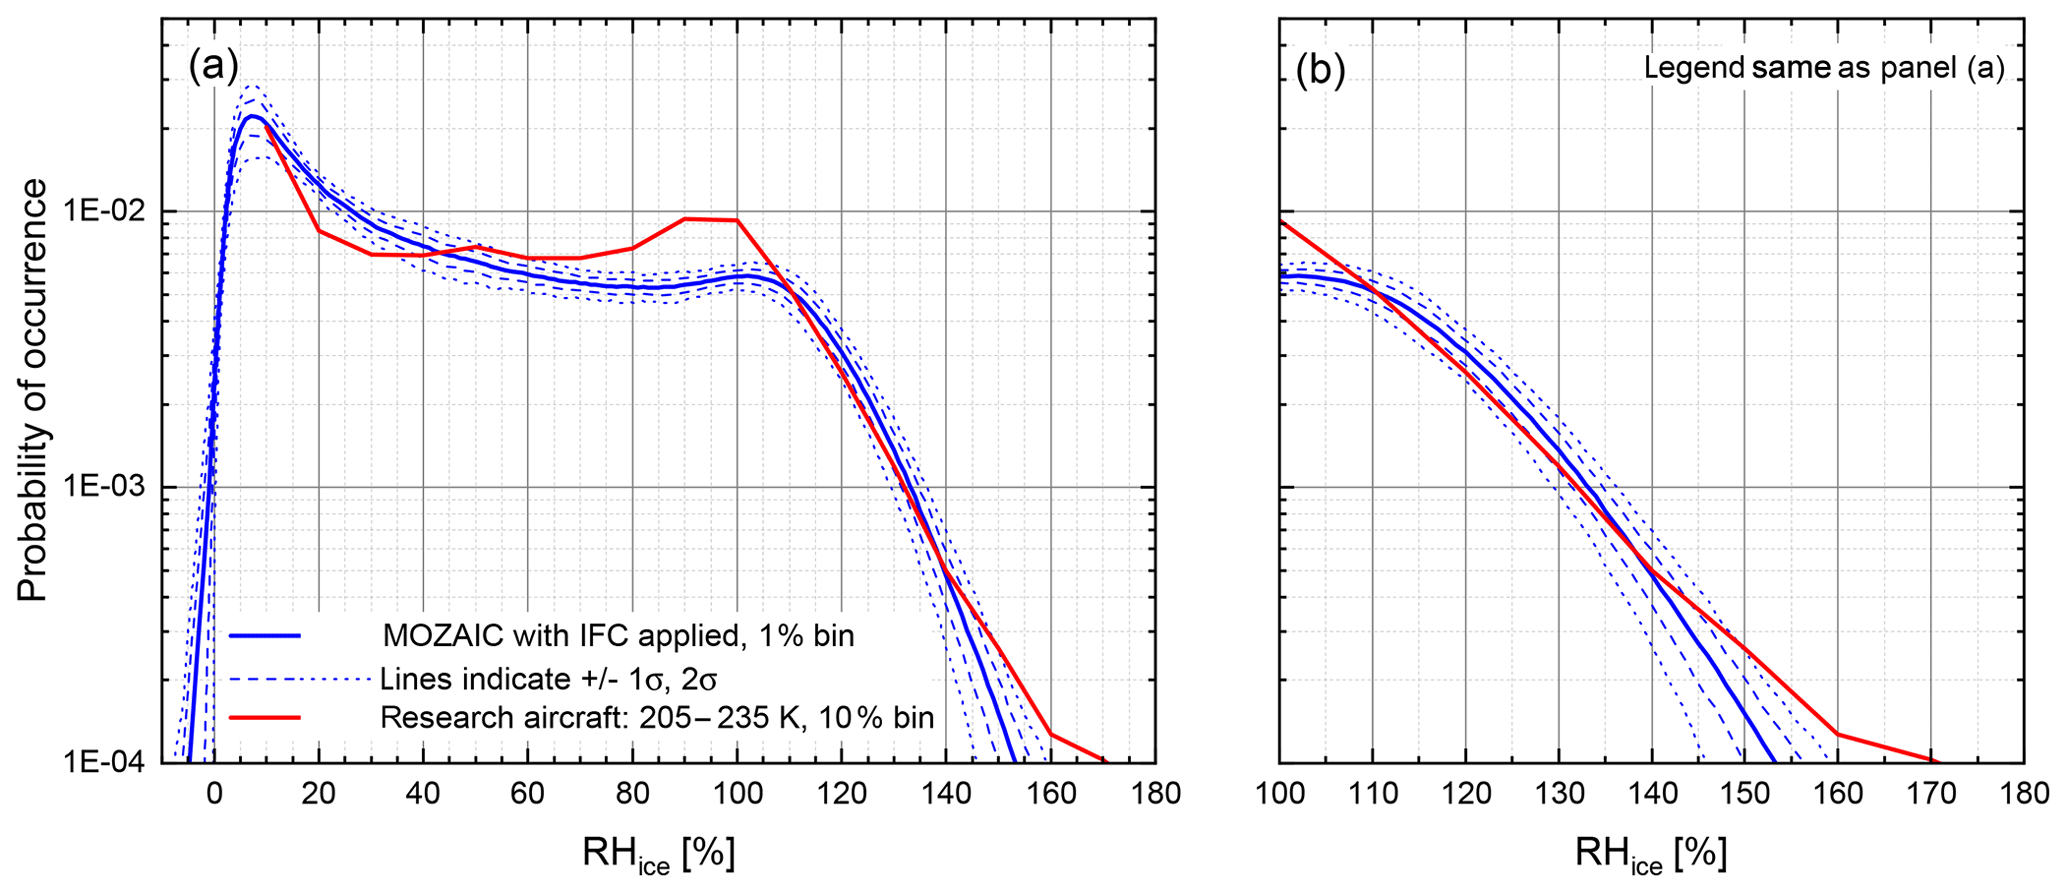
Figure 5Averaged probability density functions of RHice for the entire MOZAIC period from 1995 to 2010 with the in-flight calibration method applied (blue lines) and respective RHice PDF from 250 research aircraft flights collected in the Jülich in situ airborne database (Krämer et al., 2016).
The overall features of the RHice PDF with an overall maximum value at dry stratospheric air mass values with RHice being close to the LOD of approx. 10 % and a second local maximum at RHice ≈ 100 % for observations inside cirrus clouds remain unaffected, whereas the deviation between the average PDFs becomes relevant for RHice values above 130 %. Here, the IFC leads to an average reduction of < 5 % RHice for an occurrence probability of 10−3 and approx. 7.5 % RHice for an occurrence probability of 10−4. More relevant, the 2σ variability of the observed ice supersaturations at 10−4 occurrence probability reduces from max. 180 % RHice (without IFC applied) to max. 155 % RHice (with IFC applied). The latter value with the IFC applied fits into the range of the homogeneous freezing thresholds at typical extratropical tropopause conditions of RHice,hom = 158.25 % at 205 K to RHice,hom = 154.15 % at 215 K (Koop et al., 2000), as sampled by MOZAIC. Respective values without the IFC applied, however, exceed the homogeneous nucleation threshold significantly. Unphysical negative values of RHice connected to observations below the LOD of 10 % RHice vanish within the range of uncertainty when applying the IFC method.
Figure 4 illustrates the distribution of RHice observations from the entire MOZAIC data set shown in Fig. 1 as a function of ambient temperature, colour coded by the probability of occurrence, i.e. the fraction of data points for a specific combination of temperature and RHice with respect to the entire ensemble. About 98 % of RHice observations remain inside the physical boundaries set by the water saturation line and the line for homogeneous ice nucleation. The remaining 2 % are considered outliers associated with aircraft manoeuvres. Overall, ice-supersaturated air masses are characterized by H2O VMR ≥ 25 ppmv (1st percentile value; see Fig. 10 for details), which is in good agreement with observations of H2O VMR > 15ppmv (Krämer et al., 2020) and 20 ppmv (Diao et al., 2014), both reported from research aircraft observations at mid-latitudes for T > 200 K (see also Sect. 3.3 for more details).
Besides the validation of MOZAIC RHice distributions with respect to the homogeneous nucleation thresholds from Koop et al. (2000), the data were compared to the distribution of RHice from observations on board of research aircraft by high-precision water vapour instruments such as Lyman-α photo-fragment fluorescence hygrometers (Zöger et al., 1999; Sitnikov et al., 2007), tunable diode laser absorption spectrometers (May and Webster, 1993; Krämer et al., 2009; Buchholz et al., 2013) and frost point hygrometers (see Meyer et al., 2015, for details). In total, 250 research flights from 32 field campaigns conducted between 1999 and 2017 globally were analysed. To ensure comparability to the MOZAIC data set, the temperature range was restricted to 205 to 235 K, which corresponds to the MOZAIC observation range with the upper temperature limit set by the homogeneous freezing threshold.
The result of this comparison is shown in Fig. 5. The MOZAIC RHice PDF is plotted similar to Fig. 3, whereas the RHice PDF from the research aircraft campaigns is shown as a red line calculated for RHice bin widths of 10 %. Both probability distribution functions show excellent agreement within the uncertainty ranges particularly for the regime of ice supersaturation (panel b). The differences for RHice near 100 % are caused by the preferred sampling of ice clouds during the field campaigns (higher probability of ice clouds at RHice ≈ 100 %) and by the frequent sampling of contrails at subsaturated conditions (RHice < 100 %).
RHice observations from the CARIBIC passenger aircraft exhibit similar features as the observations shown here from MOZAIC and from research aircraft with maximum probability of occurrence at RHice = 100 % and maximum RHice values of approx. 150 % (Dyroff et al., 2014). In that respect, all observation platforms provide consistent information on the distribution of ice supersaturation in the extratropical tropopause.
With the IFC method applied to the full MOZAIC RHice data, this data set is successfully validated against RHice observations by high-precision instruments and against physically justified bounding values. In summary, this data set is now considered of the highest possible quality achievable by the type of sensor applied and for the type of routine observations performed.
3.1 Annual cycles of water vapour and RHice distributions at the tropopause
The annual cycles of the vertical distributions of water vapour volume mixing ratio (H2O VMR) and RHice were analysed for the three target regions of eastern North America (ENA), the North Atlantic (NAtl) and Europe (EU) based on 15-year averages of monthly mean profiles relative to the thermal tropopause. For all investigated regions, the annual cycles of H2O VMR vertical distributions are shown in Fig. 6. For the lowest layer of the lowermost stratosphere, bounded from below by the thermal tropopause layer, the patterns are similar for the three regions, characterized by low H2O VMR values in winter and spring months and a maximum H2O VMR during summer. For all regions, the influence of upper tropospheric air masses reaches approx. 1.0–2.0 km above the tropopause with the strongest influence in summer.
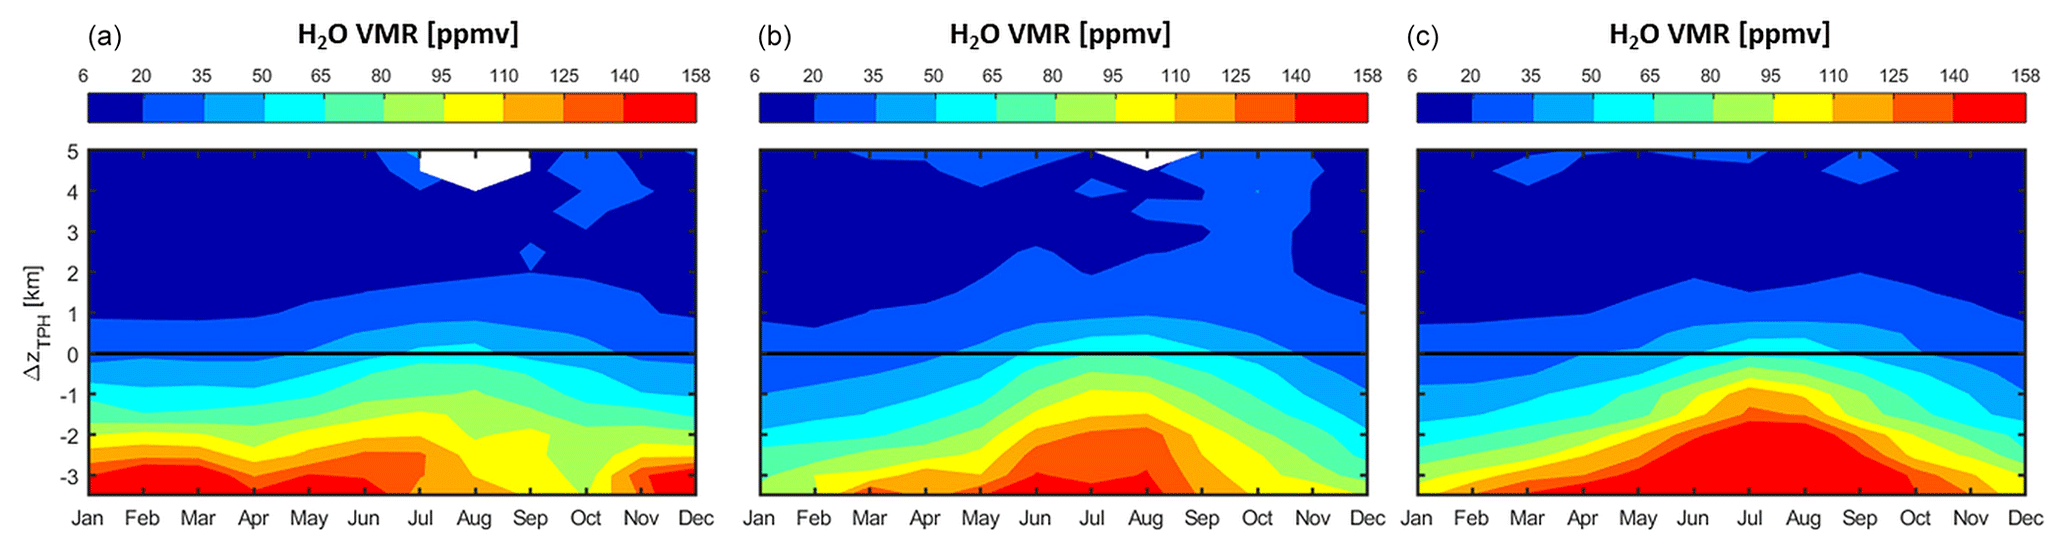
Figure 6The 15-year averaged annual cycles of H2O VMR vertical distributions of H2O VMR for latitudes 40 to 60∘ N and for the regions of (from a to c) eastern North America (105 to 65∘ W), the North Atlantic (65 to 5∘ W) and Europe (5∘ W to 30∘ E).
Below the tropopause layer, however, we find different behaviours for the studied regions. It appears that over the North Atlantic and over Europe, which is strongly influenced by the North Atlantic synoptic weather systems due to the prevailing westerly winds, the annual cycles of H2O VMR in the uppermost tropospheric and tropopause layers are coupled, while for the eastern North American region the upper free tropospheric layers seem to exhibit higher specific humidity in winter than respective air masses over the ocean. At the tropopause level, however, the differences vanish, and the annual cycles converge.
A similar behaviour of the annual cycle of H2O VMR was reported by Zahn et al. (2014) from zonal-averaged H2O VMR observations by the CARIBIC system. In contrast to MOZAIC, the CARIBIC H2O sensor provides reliable data also for the lower stratosphere where the MOZAIC RH sensor loses its sensitivity, but, due to its limited regional coverage, the CARIBIC data set cannot provide regional-scale resolution. In that respect, these data sets complement each other with CARIBIC observations backing up the MOZAIC H2O VMR reported for the atmospheric layers just above the thermal tropopause and MOZAIC providing regional-scale resolution of seasonal patterns which would not be possible otherwise.
Potential transport pathways of water vapour into the lowermost stratosphere are not in the scope of this study and cannot be deduced from the analysis shown in Fig. 6, but they are discussed in depth elsewhere (see e.g. Gettelman et al., 2011; Zahn et al., 2014; and references given therein). In summary, the seasonal variation of H2O in the first 1–2 km above the tropopause is controlled by shallow, fast, two-way cross-tropopause mixing which is active throughout the year and is responsible for the extratropical tropopause mixing layer, or ExTL (Hoor et al., 2004), localized deep convection events which occur mainly in the summer period over continents (Anderson et al., 2012; Schwartz et al., 2013) and the hemisphere-scale effect of the Asian summer monsoon (Santee et al., 2017; Rolf et al., 2018).
Strong cases of the deep convection events have been reported particularly in the central United States with unusually wet conditions in the lowermost stratosphere being associated with these events (Anderson et al., 2017). Our long-term data do not point at a significantly higher humidity over the eastern North American region in summer compared to the North Atlantic and to Europe. However, it has to be noted that our observations are within the northern half of the continental United States and the southern half of Canada (see Fig. 1 for the aerial coverage of MOZAIC observations), whereas the deep convection events with strong overshooting are reported for regions further south over the Great Plains. This regional difference may explain the differing observations.
3.2 Annual cycles of RHice and ISSR distributions at the tropopause
Our study is focusing on the vertical distribution, seasonality and regional variability of RHice and ice-supersaturated regions in particular which are linked to the water vapour content of the investigated atmospheric layers. Therefore, we discussed the observed water vapour distribution patterns in the preceding section. To shift the focus to RHice, Fig. 7 represents an analysis similar to that shown in Fig. 6 but for relative humidity with respect to ice. In contrast to the differing annual cycles of water vapour distributions at the tropopause as discussed above, we find similar patterns for RHice over all target regions: a tropopause layer characterized by mean RHice of 60 % almost independent of the season, a very humid layer just below the tropopause with mean RHice reaching 80 % and weak seasonality, and a stronger seasonality of RHice approx. 1 km below the tropopause and further down into the upper free troposphere with dryer air during the summer season and very humid conditions particularly during winter and spring. Similar average values of RHice of 60 %–70 % for the uppermost troposphere without significant seasonality are reported from CARIBIC observations (Dyroff et al., 2014; Zahn et al., 2014).
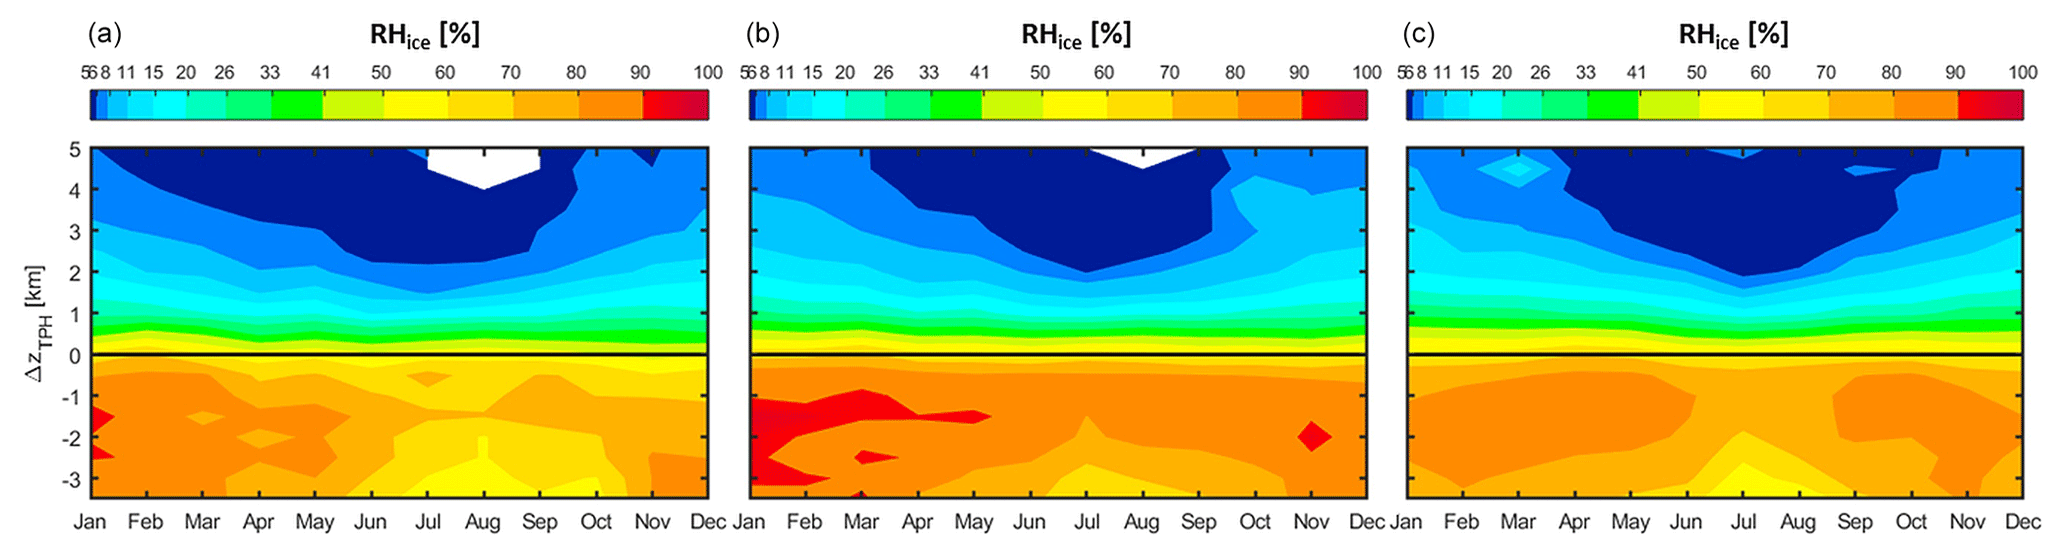
Figure 7The 15-year averaged annual cycles of RHice for latitudes 40 to 60∘ N and for the regions of (from a to c) eastern North America (105 to 65∘ W), the North Atlantic (65 to 5∘ W) and Europe (5∘ W to 30∘ E).
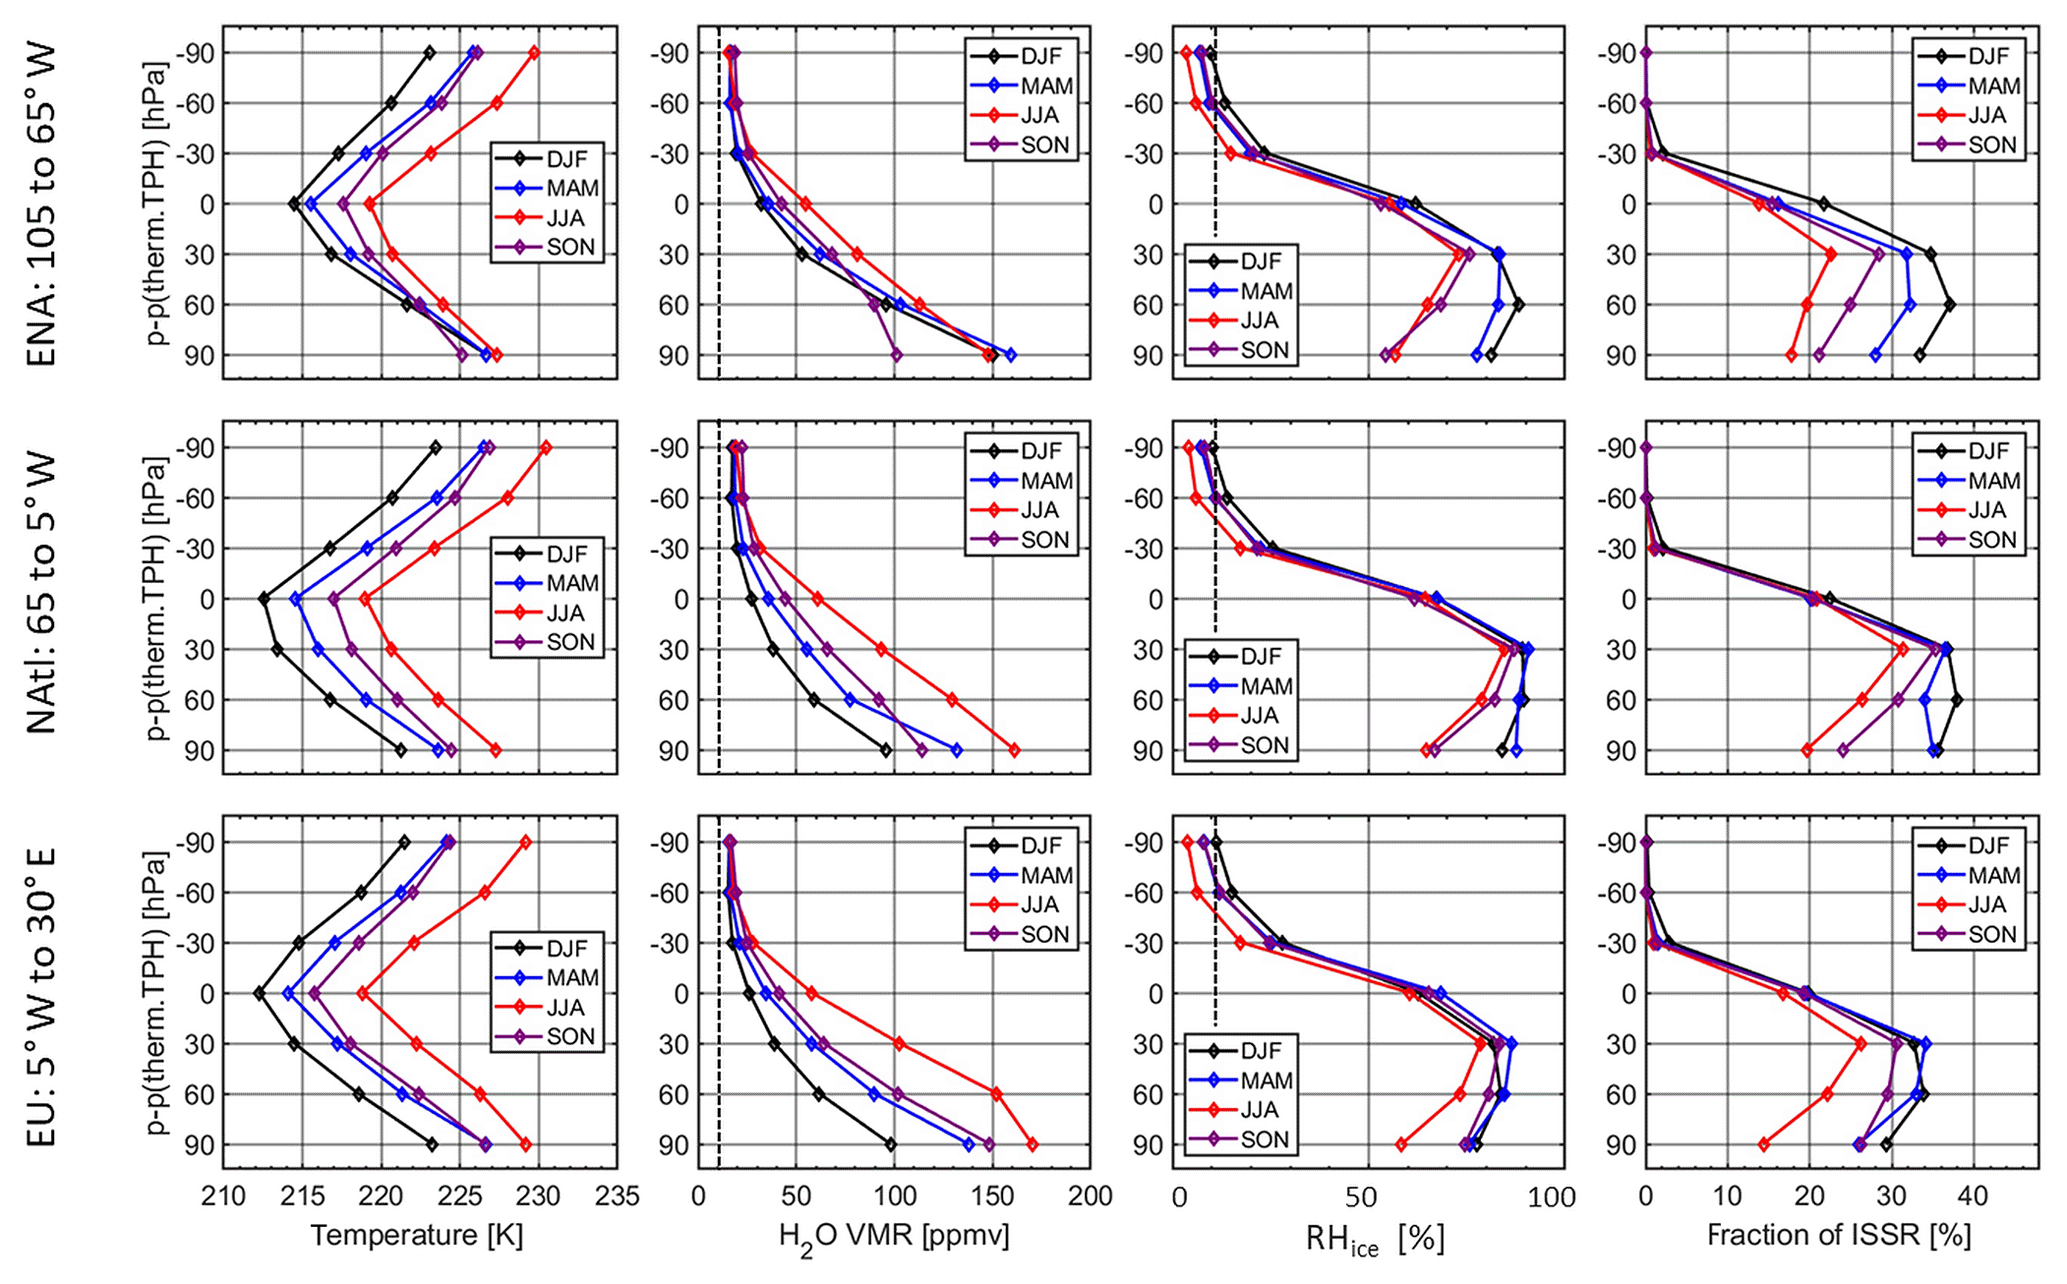
Figure 8Vertical distribution of mean temperature, H2O mixing ratio, RHice and fraction of ice-supersaturated regions (ISSR) for seven pressure layers around the thermal tropopause. Layer thickness is 30 hPa, and layers are spaced equally relative to the tropopause pressure level. Dotted lines indicate the MCH 2σ limit of detection of RHice,LOD = 12 % and the resulting minimum detectable H2O VMR of approx. 10 ppmv.
Grouping the data set shown in Fig. 7 into seasonal clusters of layers of 30 hPa thickness around the tropopause allows the robust statistical analysis of the vertical distributions of temperature, H2O VMR, average RHice and the fraction of ice-supersaturated regions. The applied concept of the vertical spacing is described in Sect. 2.1. The seasonal variation of the vertical distributions of the selected properties is compiled in Fig. 8.
Tables 1 and 2 present the mean fractions (Table 1) and associated standard deviations normalized to the respective mean values (Table 2) for ISSR occurrence, separated for regions and seasons, and in the last set of columns averaged over all regions. As is already indicated in Fig. 7, the variation of RHice with altitude and season is similar for the three target regions.
Table 1ISSR frequency of occurrence: seasonal mean values are reported in percentages; the vertical distance to the thermal tropopause is reported as Δp = player−ptherm.TPH.
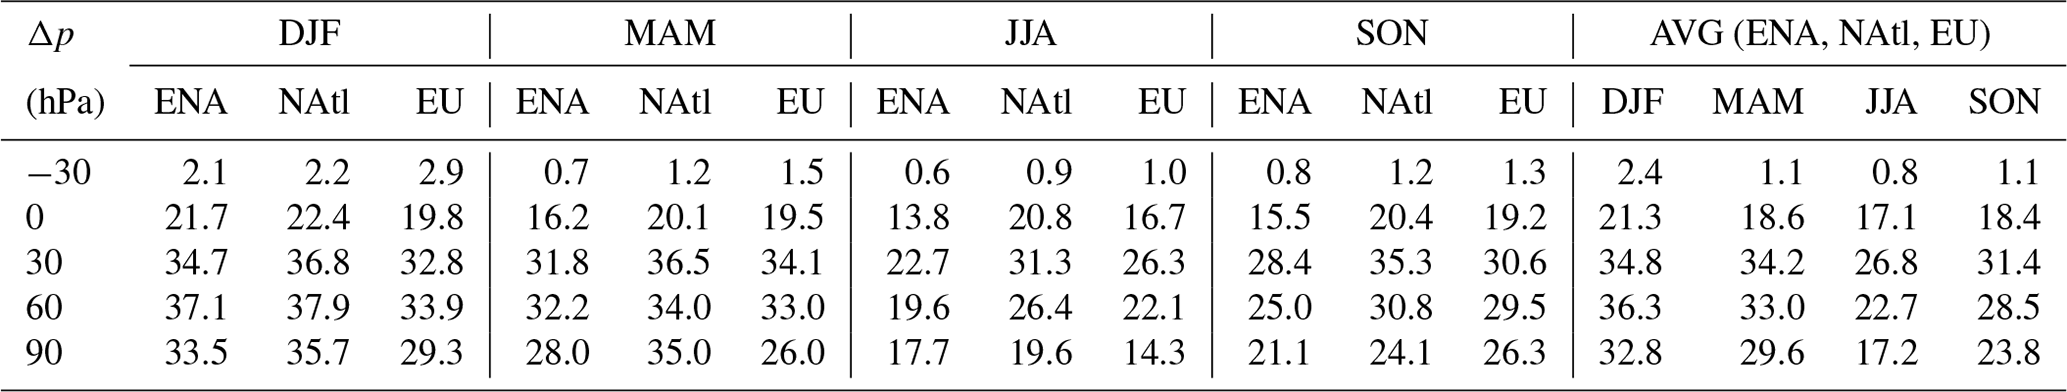
Table 2ISSR frequency of occurrence: normalized standard deviations of seasonal mean values are reported in percentages, and the vertical distance to the thermal tropopause is reported as Δp = player−ptherm.TPH.
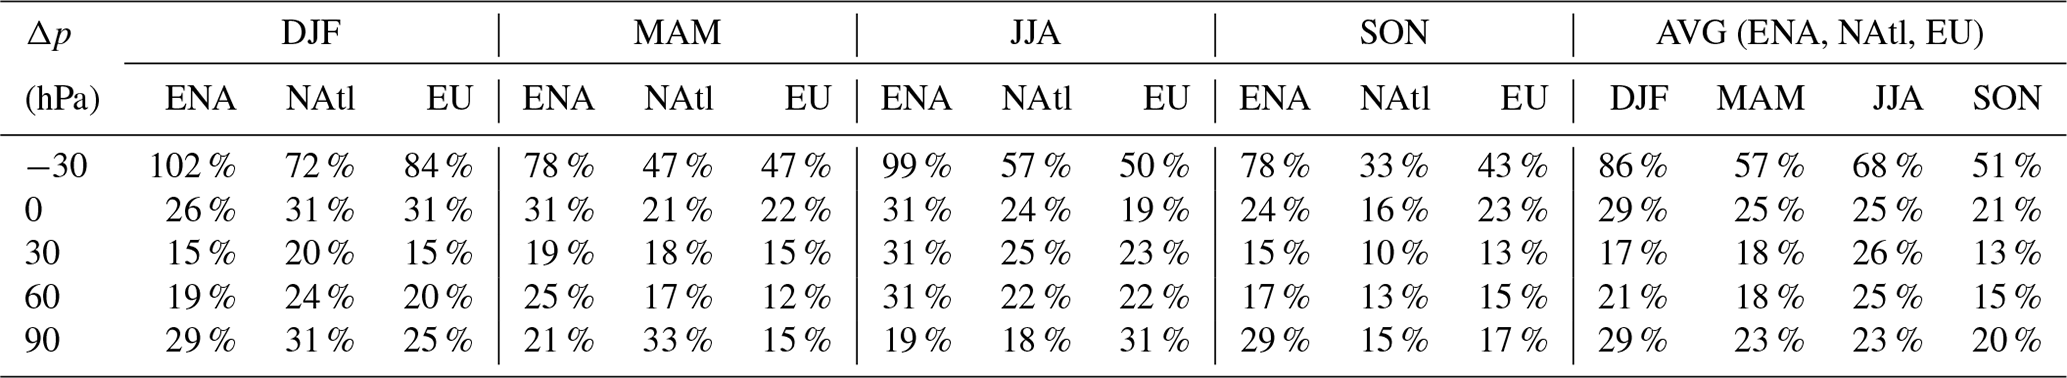
For all regions, the highest RHice values and also the highest fraction of ISSR occurrence are observed for the two upper tropospheric layers closest to the tropopause layer, whereas for the third layer situated deepest inside the UT, RHice values and ISSR fractions are considerably lower. Only in the spring season (MAM) over the North Atlantic does the lowest third layer reach values similar to the RHice values and ISSR fractions of the two layers above. Focusing on the UT layers, the relative standard deviations of the ISSR fractions are highest for the lowest layer investigated here, at least for winter and spring seasons for which the largest ISSR fractions are found.
3.3 Physico-chemical signature of ice-supersaturated regions in the vicinity of the tropopause
As discussed in detail by Spichtinger and Leschner (2016), ice-supersaturated air masses have mostly faced a decrease in temperature or an increase in water vapour mixing ratio, i.e. specific humidity, during their lifetime. Thus, these air parcels are generally known as both colder and of higher absolute humidity than the surrounding subsaturated air masses (Gierens et al., 1999; Spichtinger et al., 2003b); for instance, research aircraft observations from 87∘ N to 6∘ S showed that 73 % of the ISSRs have both lower temperature and higher H2O VMR than their horizontally adjacent subsaturated air, whereas 27 % of the ISSRs show higher temperature and higher H2O VMR than their surroundings (Diao et al., 2014). This conclusion is valid for both ISSRs in the uppermost troposphere and the rarer cases of ISSRs above the tropopause.
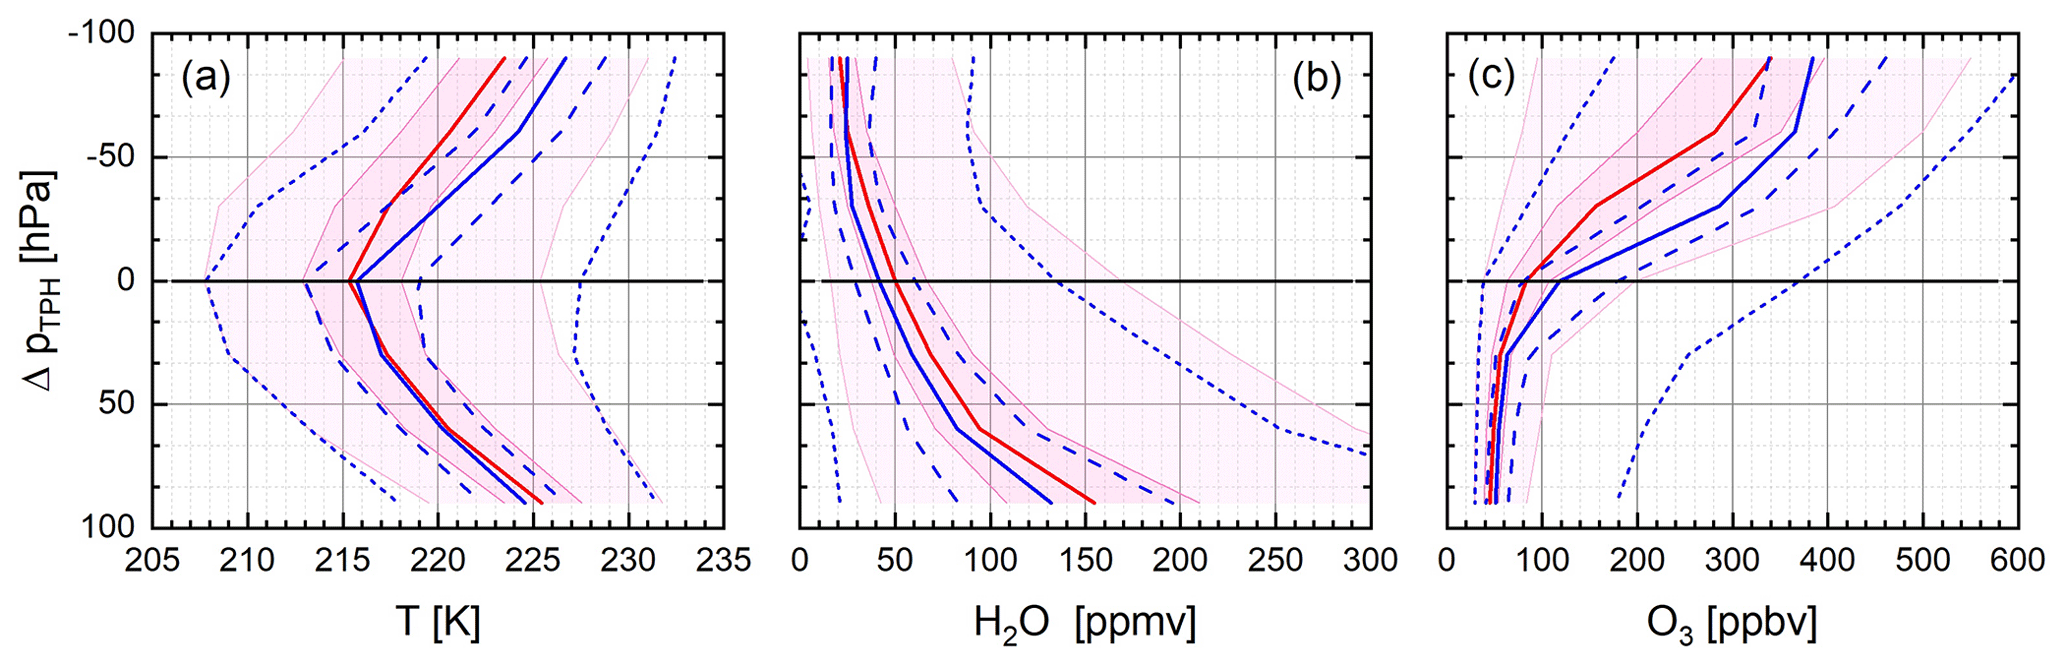
Figure 9Vertical distribution of temperature T (a), H2O VMR (b), and O3 VMR (c) relative to the 2 PVU dynamical tropopause and to the thermal tropopause. Vertical distributions relative to the thermal tropopause are presented as percentiles (1, 25, 50, 75 and 99) by blue lines, and those relative to the 2 PVU tropopause conditions are represented by red-shaded areas.
In order to study the formation history of ISSRs and involved processes, we analysed the occurrence frequency and physico-chemical signature of ISSRs around the tropopause layer and referred our analyses to both the thermal and the dynamical tropopause. We want to recall the tropopause definitions given in Sect. 2.1. The thermal tropopause according to WMO criteria (WMO, 1957) is usually seen as an effective transport barrier hampering troposphere–stratosphere exchange, whereas the dynamical tropopause is commonly used for separating tropospheric and stratospheric air masses in studies on troposphere–stratosphere transport since it represents the lower bound of the ExTL. These complementary views on the tropopause have been developed from extensive CO–O3 analyses, which showed that the 2 PVU surface approximately separates the troposphere from the stratosphere with the ExTL as a transition layer of about 2 km thickness above it and centred on the thermal tropopause (Hoor et al., 2004; Pan et al., 2010; Gettelman et al., 2011). These tracer studies in the extratropics showed that on average the dynamical tropopause is situated slightly below the thermal tropopause and that the gradients of CO and O3 are much sharper across the thermal tropopause compared to the dynamical tropopause (Hoor et al., 2004; Pan et al., 2010).
Similar features are observed for the gradients of temperature T, H2O VMR and O3 VMR, as shown in Fig. 9 for the North Atlantic region. Similar to the tracer gradients, the temperature gradient is also sharper across the thermal tropopause compared to the dynamical tropopause. In addition, the results confirm the good agreement between the ERA-Interim thermal tropopause height indicated by ΔpTPH=0 hPa, the lowest temperatures detected at ΔpTPH=0 hPa (panel a, blue lines) and the chemical tropopause indicated by O3 VMR = 120 ppbv at ΔpTPH=0 hPa (panel c, blue lines) and thus the consistency of the used data set. Furthermore, the analysis of the pressure difference between the thermal and dynamical tropopauses reveal an offset of approx. 25 hPa (15–35 hPa) which translates into an altitude difference of approx. 750 m (Neis, 2017).
Our analysis of ISSR occurrence in the vicinity of the ExTL is confined to the North Atlantic region, for which we have the highest data density available with respect to vertical resolution. As described generally in Sect. 2.1, the entire data set of individual RHice observations over the North Atlantic region was divided into yearly subsets of seasons: DJF, MAM, JJA and SON. For each year, season and altitude layer relative to the thermal and dynamical tropopauses, the average frequency of occurrence of observations with RHice > 100 % was determined. The probability of ISSR occurrence per altitude layer with respect to the entire period of 15 years was then calculated from this record of seasonally averaged ISSR frequencies of occurrence. The results are compiled in Table 3 for both tropopause definitions used here. Please note that the ISSR fractions compiled for the thermal tropopause correspond to the values listed in Table 1 but without distinction for seasons.
Table 3Mean and standard deviation of seasonal fraction of ice-supersaturated regions (ISSRs) for the seven vertical layers distributed around the thermal and dynamical tropopause.
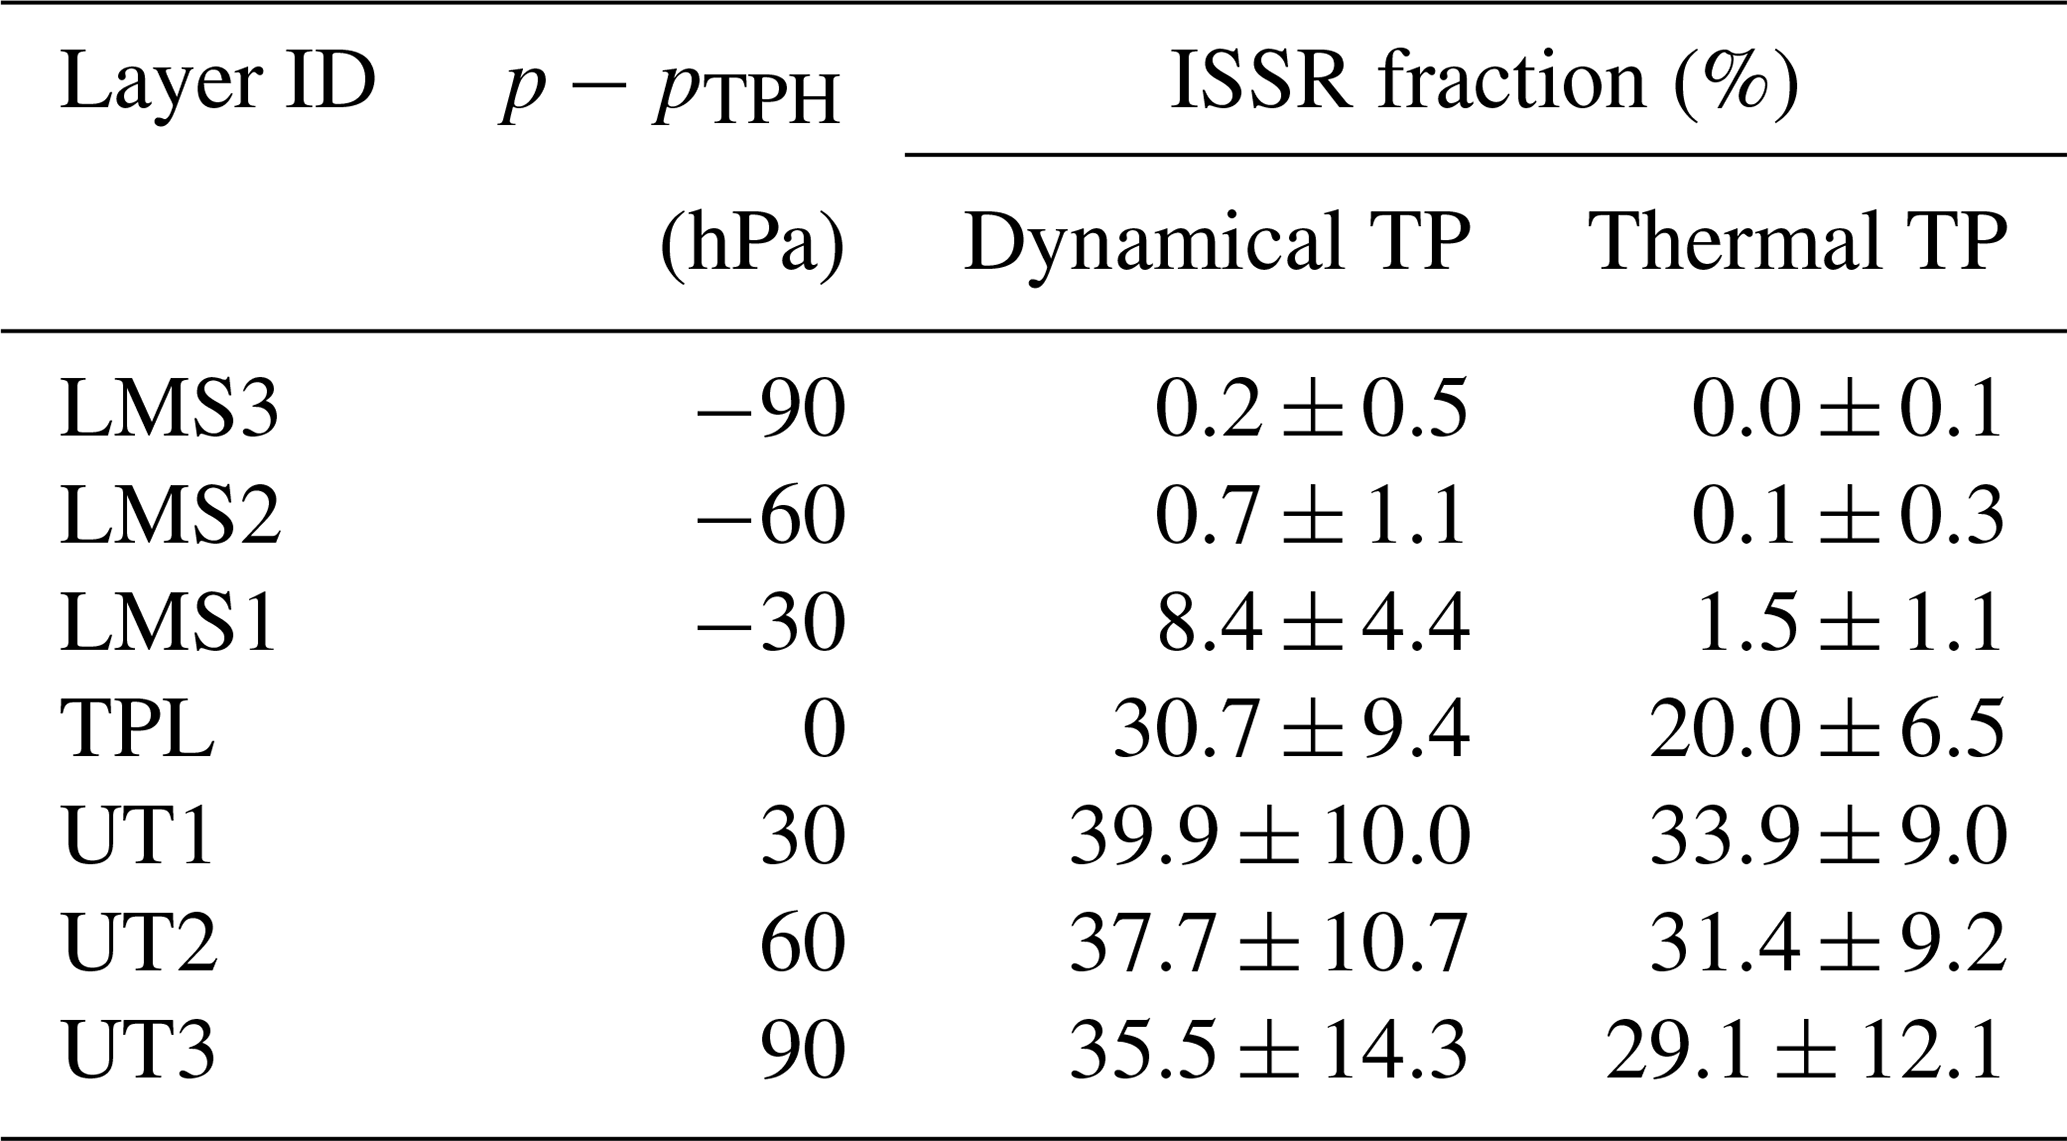
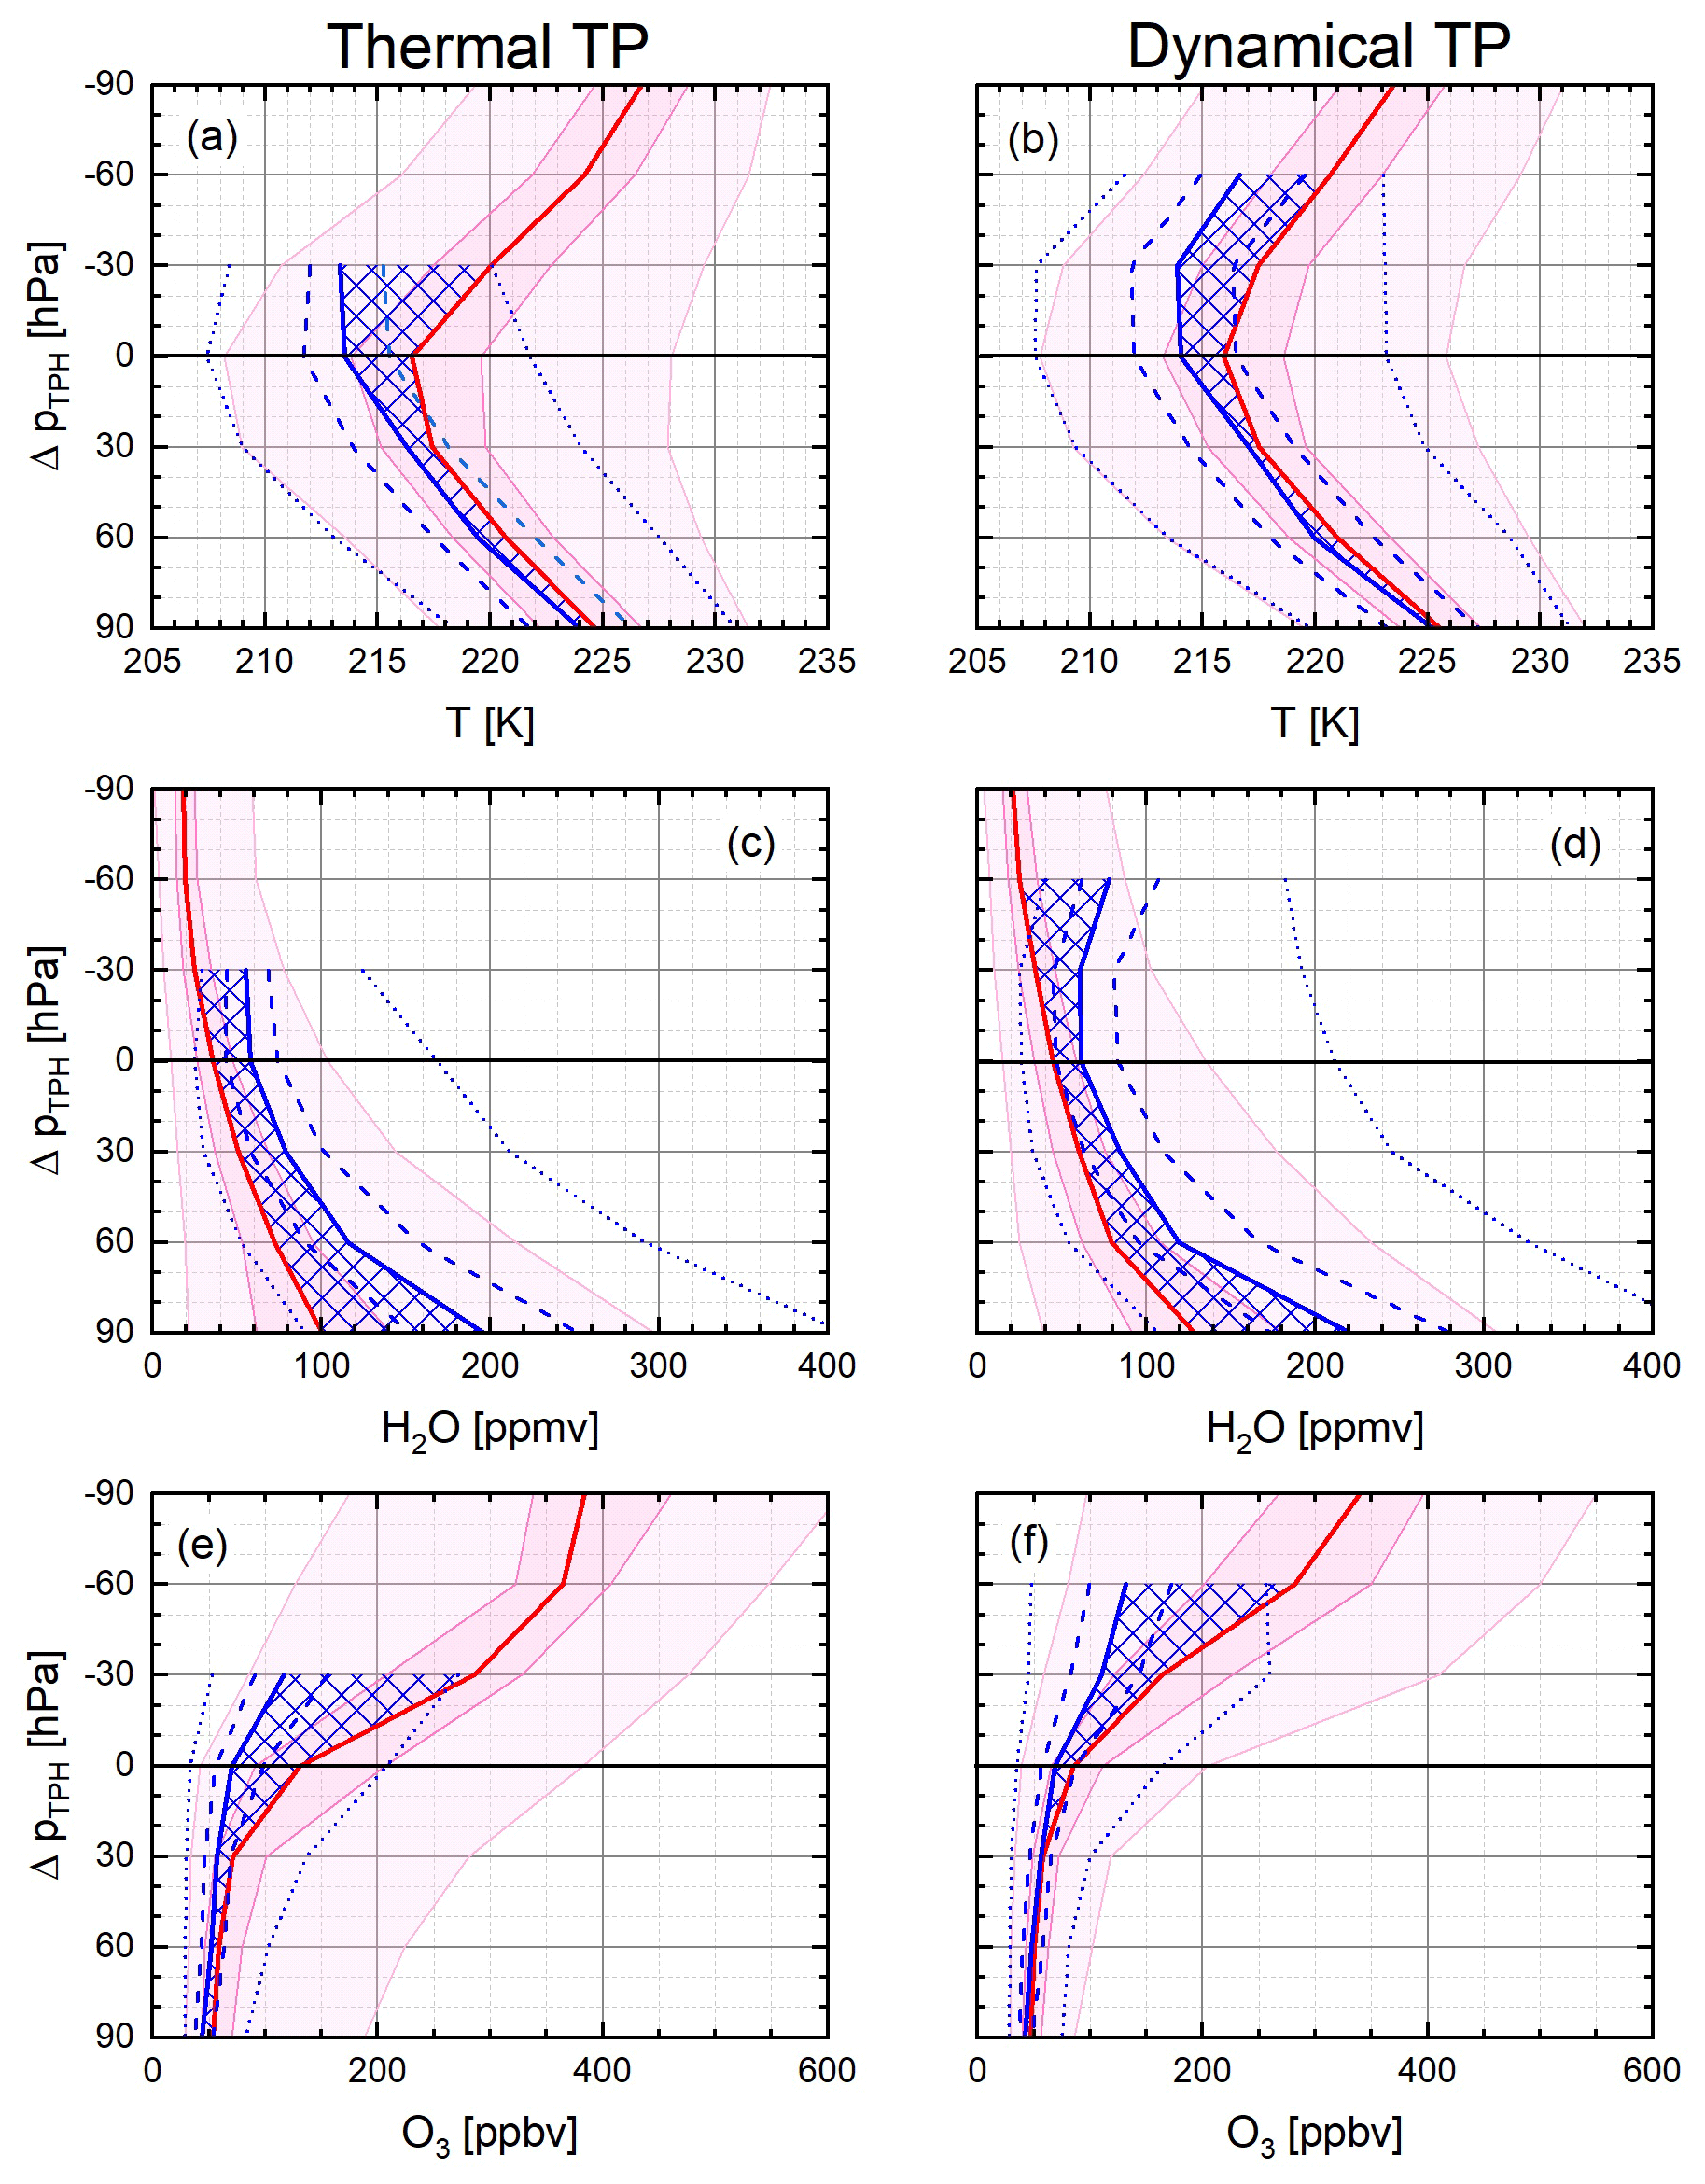
Figure 10Vertical distribution of temperature, H2O VMR and ozone VMR for ISSRs relative to the thermal tropopause height (a, c, e) and 2 PVU dynamical tropopause height (b, d, f). ISSR conditions are presented as percentiles (1, 25, 50, 75 and 99) by blue lines and non-ISSR conditions by red-shaded areas. Blue cross-hatched areas highlight the deviation of median values between ISSR and non-ISSR conditions.
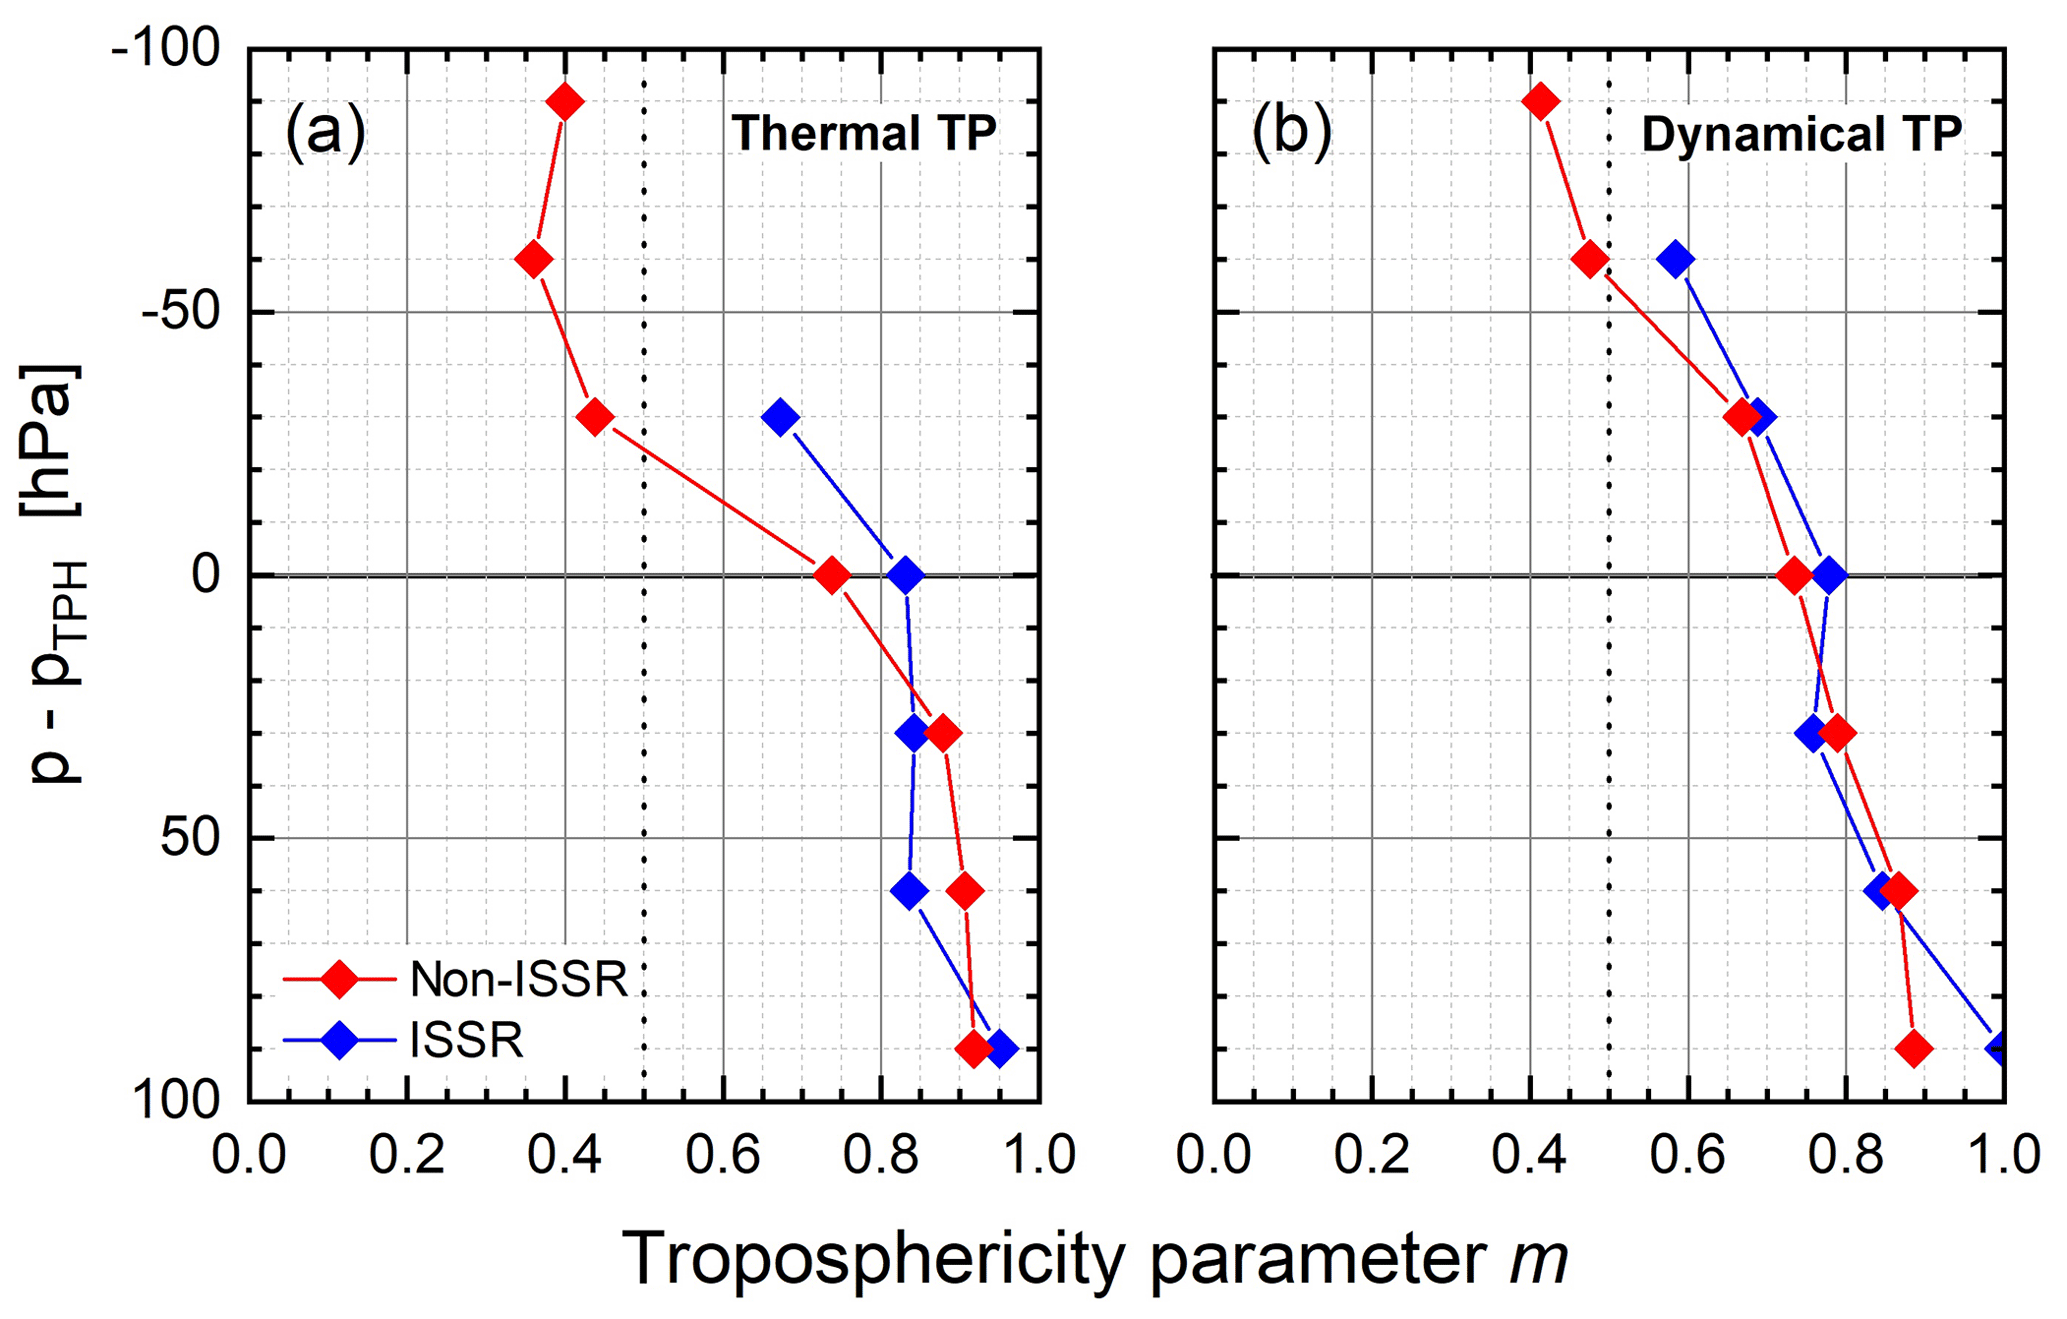
Figure 11Vertical distribution of the troposphericity parameter m for ISSR and non-ISSR air masses with respect to the thermal (a) and dynamical (b) tropopause.
With reference to the thermal (dynamical) tropopause, the mean ISSR occurrence probability is 31 % (38 %) in the upper troposphere below the tropopause layer (UT1–3). The observed increases in mean ISSR occurrence probabilities towards the tropopause layer are, however, below statistical significance, and the average values for the respective pressure layers differ for the two tropopause definitions. Our finding that the ISSR occurrence probability is increasing towards the tropopause agrees with results from a previous research aircraft study using the CO–O3 tracer correlation approach, in which the majority (69 %) of clear-sky ISSRs was found within the ExTL, while the rest were located below the transition layer (Diao et al., 2015).
Since the thermal tropopause is located at a higher altitude than the dynamical tropopause, the pressure layers below the thermal tropopause include parts of the ExTL, which explains the lower ISSR fractions for UT1–3 below the thermal tropopause compared to UT1–3 below the dynamical tropopause. Sorting the data according to their vertical distance to the respective tropopause also results in different data ensembles for the respective pressure layers because of the strong horizontal variability of RHice along the flight trajectories. This strong horizontal variability explains the different absolute values of ISSR occurrence with respect to the tropopause definitions. For both tropopause definitions, the standard deviation of observed ISSR fractions is largest for the lowest UT layer of the analysed atmospheric region and decreases with increasing altitude.
When crossing the thermal tropopause, the ISSR fraction drops sharply to values of 1.5 % for the lowest layer above the thermal tropopause and to statistically insignificant fractions when reaching further up into the stratosphere. In the case of the dynamical tropopause, we find a significantly higher ISSR fraction of 8.4 % for the lowest stratosphere layer and again insignificant fractions further above. This strong contrast in the ISSR occurrence probability for the lowest stratosphere layers with reference to the two tropopause definitions coincides with the behaviour of other tracers in the ExTL (see Fig. 9 for details).
In order to learn more about the history of ice-supersaturated air parcels, we further analysed the ozone content of an ISSR compared to the subsaturated air around it for air parcels below and above the thermal and dynamical tropopauses and combined the results with the distributions of temperature and H2O VMR. The thermodynamic and chemical properties of the ISSR and the comparison between the ISSR (blue lines) and ice-subsaturated air masses (red-shaded areas and red lines) are presented in Fig. 10 with reference to both tropopause definitions. In general, ISSRs are colder than their subsaturated counterparts. The difference is low in the UT with a value of 1–2 K, which compares well to the value of 2 K at 215 hPa obtained from MLS satellite measurements (Spichtinger et al., 2003b), and it increases to a more than 6 K difference in the stratosphere above the thermal tropopause and approx. 4 K above the dynamical tropopause. The temperature difference of 3–4 K between colder tropospheric ISSRs and the surrounding subsaturated air masses reported by Gierens et al. (1999) is comparable to the temperature difference in the 30 hPa thick tropopause layer we find in our analysis.
Figure 10 also indicates a similar behaviour of the vertical distribution of H2O VMR for ice-supersaturated and ice-subsaturated regions with exponentially decreasing absolute humidity up to the tropopause layer. Above both tropopause layers, H2O VMR further decreases in the case of non-ISSR conditions. For ISSR conditions, however, H2O VMR remains constant with height throughout the layer just above the tropopause. Doubling of H2O VMR for tropopause ISSR conditions compared to non-ISSR conditions is close to the results reported from MLS observations (Spichtinger et al., 2003b). In contrast, Gierens et al. (1999) found an increase of only 50 % for H2O VMR inside ISSRs compared to non-ISSRs. In turn, this value compares well with our observations in the uppermost troposphere.
The vertical distribution of the ozone VMR behaves in a similar way to the temperature for ice-supersaturated and ice-subsaturated regions with small differences in the ozone VMR of less than 15 ppbv in the troposphere. Already for the tropopause layer and even more pronounced for the first layer above the thermal tropopause, however, the difference increases to 60 ppmv ozone VMR and beyond.
Quantitative conclusions on air mass characteristics and history are drawn from the vertical distributions of thermodynamic and chemical properties shown in Fig. 10. The underlying concept of troposphericity (Cirisan et al., 2013) quantifies the tropospheric nature or fingerprint, of an air mass on the basis of the observed O3 VMR. In the context of our study, we refer to troposphericity for consistency with the literature.
Using the O3 VMR as a stratospheric air mass tracer, and, adapting the approach of Cirisan et al. (2013), we define the troposphericity parameter m for an ensemble of data characterized by median (med) and 99th percentile (P99) values as
and we apply the median value of the lowest layer analysed here as background tropospheric value so that (O3)tropo = 42 ppbv. Petetin et al. (2018) reported a median O3 VMR of 49 ppbv for the Central European mountain station Sonnblick (3106 ) in the Austrian Alps and a value of 50 ppbv for the high Alpine station Jungfraujoch (3580 ), whereas Cirisan et al. (2013) use a value of 33.5 ppbv from ERA-Interim air mass trajectory analyses as the tropospheric background ozone value in the upper troposphere at mid-latitudes.
Applying this definition of the troposphericity parameter m to MOZAIC and IAGOS observations over Central Europe (Petetin et al., 2018) at 4000 m altitude with (O3)med = 50 ppbv and (O3)P99 = 82 ppbv yields m=0.80, and for observations at 1500 m altitude with (O3)med = 42 ppbv and (O3)P99 = 83 ppbv we find m=1.00.
For MOZAIC and IAGOS observations in the ExUTLS, Cohen et al. (2018) report, e.g. for springtime lowermost stratosphere conditions, values of (O3)med = 400 ppbv and (O3)P95 = 600 ppbv, resulting in m=0.36, and, for tropopause layer conditions, values of (O3)med = 110 ppbv and (O3)P95 = 200 ppbv and m=0.57; note that P95 refers here to the 95th percentile value of the analysed data ensemble, as taken from Cohen et al. (2018). Deeper into the stratosphere beyond the reach of MOZAIC and IAGOS aircraft, the value of m approaches m=0.0. Thus, similar to the troposphericity parameter defined by Cirisan et al. (2013) from trajectory analyses, a value of m=0 indicates that an air parcel contains only stratospheric air, while m=1 is fully tropospheric. Defining the troposphericity as described here, we connect the troposphericity of an air mass to the observed variability of the O3 VMR.
The analysis of troposphericity of the seven investigated layers with respect to the 99th percentile and median O3 VMR values is presented in Fig. 11. With respect to the thermal and to the dynamical tropopause, the layers up to the tropopause layer are characterized by similar values of m>0.80 for ISSR and m>0.75 for non-ISSR air masses. The first layer above the thermal tropopause, however, shows a clear difference between ISSR (m=0.67) and non-ISSR (m=0.44) with respect to the thermal tropopause but similar values of m=0.67–0.69 for ISSR and non-ISSR with respect to the dynamical tropopause.
Recalling the structure of the ExTL with the 2 PVU dynamical tropopause at its lower bound separating the stratosphere from the troposphere and centred on the thermal tropopause, we find that on top of the ExTL non-ISSR air masses show a clear stratospheric signature, while ISSR air masses are still strongly influenced by mixing and carry a significant tropospheric fingerprint compared to the non-ISSR air masses. Above the dynamical tropopause and thus inside the ExTL, the influence of mixing increases gradually for both ISSR and non-ISSR air masses, and the difference in troposphericity is much less pronounced than near the top of the ExTL.
3.4 ISSR fraction and cirrus cloud occurrence
Ice supersaturation in the atmosphere is a prerequisite for the formation of cirrus clouds, and the degree of super-saturation, mostly driven by atmospheric dynamics, determines the mechanism by which ice particles form (e.g. Kärcher et al., 2014; Krämer et al., 2016; Heymsfield et al., 2017). On the other hand, RHice probability distribution functions inside cirrus clouds are characterized by most probable values at or slightly above ice-saturation at RHice = 100 % (Krämer et al., 2009; Diao et al., 2014, 2015; Petzold et al., 2017), which means that cirrus clouds exist to a considerable fraction also in ice-subsaturated air masses depending on their state of life. Finally, ice supersaturation can also occur in cloud-free air masses, but the fraction of ice-supersaturated air in clear sky conditions is largely unknown. However, these cloud-free ISSRs are of high importance for the formation of persistent contrails and thus for the climate impact of aviation (Irvine and Shine, 2015; Kärcher, 2018).
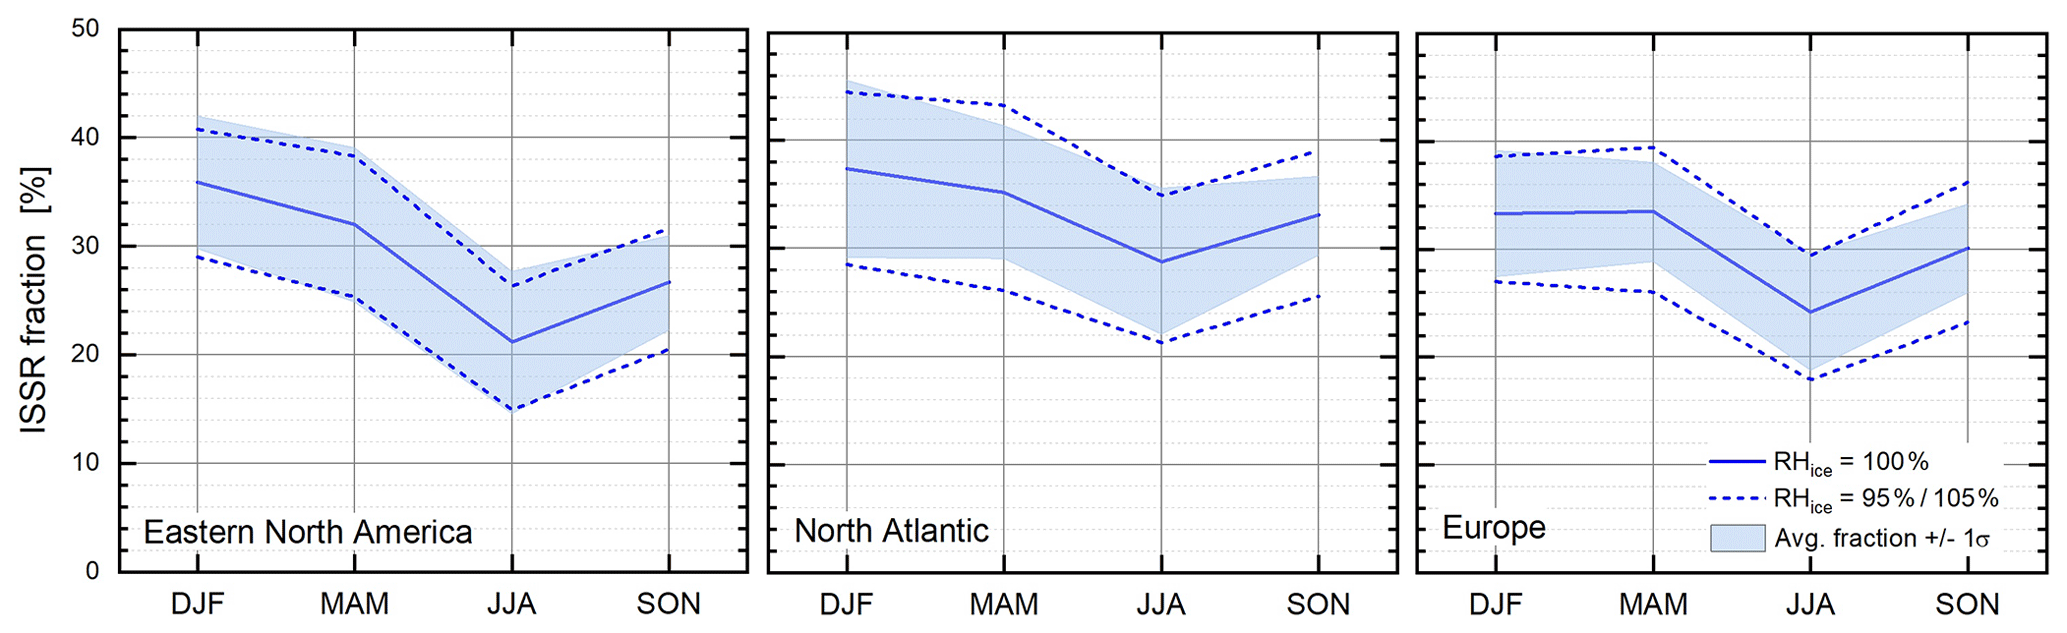
Figure 12Annual cycles of ISSR occurrence shown as occurrence probability for RHice > 100 % for the eastern North American, North Atlantic and European regions. The considered years are 1995 to 2010, with shaded areas representing probabilities for the average value (thick lines) ± 1σ and the dashed lines representing average fractions for RHice > = 95 % and 105 %. Calculations were conducted for the two UT layers positioned closest to the thermal tropopause.
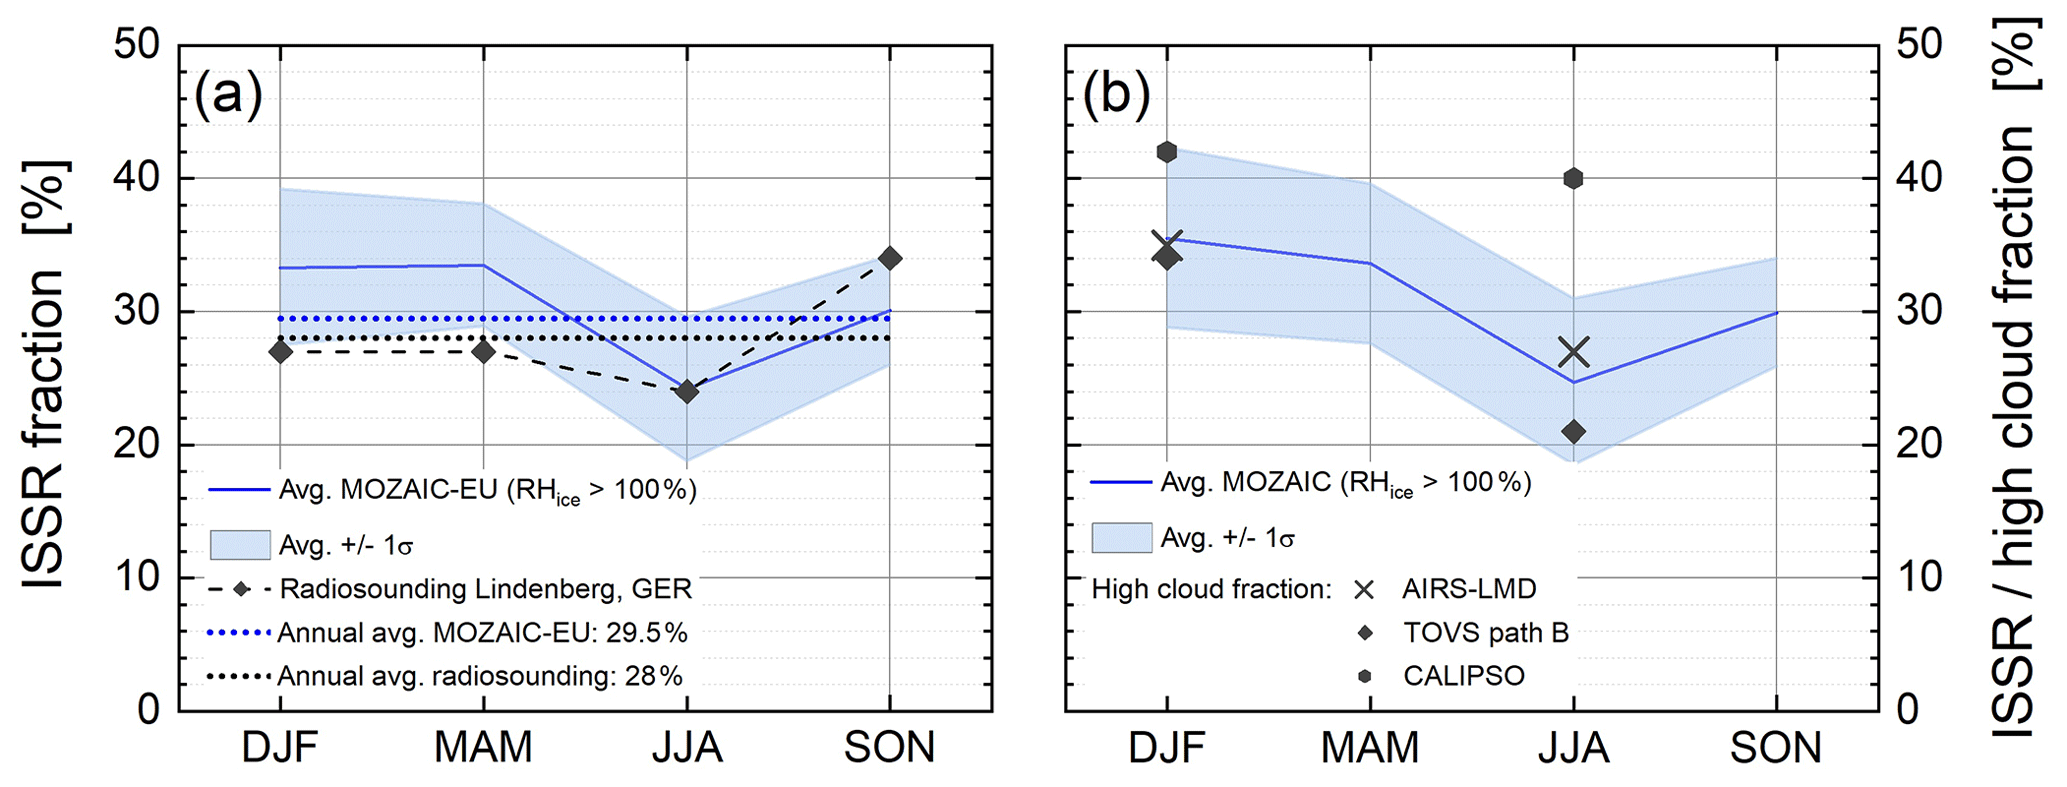
Figure 13(a) Seasonal cycle of ISSR occurrence probability, i.e. p(RHice > 100 %), averaged over Europe for the years 1995 to 2010 for the two UT layers positioned closest to the thermal tropopause. The symbols represent the annual cycle of the Lindenberg sounding (2000–2001) from Spichtinger et al. (2003a). (b) seasonal cycle of ISSR occurrence probability, as p(RHice > 100 %), averaged over the northern mid-latitudes from eastern North America to Europe for the period 1995 to 2010. The symbols represent high cloud fractions from the satellite cloud climatology by Stubenrauch et al. (2010) for northern mid-latitudes and the years 2003 to 2008 for AIRS-LMD (Atmospheric Infrared Sounder analysed at the Laboratoire de Météorologie Dynamique in Paris), 1987 to 1995 for TOVS-Path B (TIROS-N Operational Vertical Sounder Path-B cloud retrieval) and 2006 to 2007 for CALIPSO.
Motivated by the high importance of ISSRs for cirrus formation and existence and also for the formation and persistence of contrails, we converted the vertically resolved observations of ISSR fractions into an annual cycle of ISSR occurrence for the three target regions. The seasonal-mean occurrence probabilities were analysed for RHice values of 95, 100 and 105 %, based on the sensor precision of 5 % RHice. The resulting annual cycles for the top two UT layers, situated just below the thermal tropopause layer are shown in Fig. 12. The range bound by the probabilities of occurrence for RHice > 95 % and 105 % defines the uncertainty of our analysis. Additionally, we analysed the interannual variability of ISSR occurrence from the standard deviation of the mean ISSR occurrence probability for RHice > 100 %. The respective variability range is shown as blue-shaded areas in Fig. 12.
For all regions, ISSR occurrence probabilities are highest in winter and spring and lowest in summer, while the absolute values particularly in summer are considerably different. The probability for finding ice-supersaturated air masses during summer is 20 % over the eastern North American regions but 30 % over the North Atlantic with Europe showing values in the range in between.
To the present, there is only very limited in situ information available about the occurrence probability of ice-supersaturated air masses in the upper troposphere in general and about their seasonality in particular. One source for in situ information stems from radiosonde observations conducted by the German Weather Service over the Lindenberg observatory in Germany (Spichtinger et al., 2003a).
Figure 13a shows the average annual cycles of ISSR occurrence frequency from 15 years of MOZAIC observations over Europe and from 15 months of radiosonde observations over Lindenberg published by Spichtinger et al. (2003a). The 15-month cycle from the radio soundings is covered by the 15 years of climatology of ISSR occurrence from MOZAIC, but it contributes only a snapshot compared to the time series of 15 years. Based on the 15 months of observation, the authors report a mean frequency of occurrence of ice-supersaturation layers over Lindenberg of 28 %, whereas the annual cycle of ISSR occurrence from our 15 years of MOZAIC observations over Europe yields a mean value of 29.5 % with a range from 35 % (RHice > 95 %) to 23 % (RHice ≥ 105 %).
Another source of data but for the occurrence frequency of cirrus clouds originates from long-term analyses of satellite observations (Stubenrauch et al., 2010, 2013). In their 6-year climatological study, Stubenrauch et al. (2010) report cirrus cloud coverage fractions for northern mid-latitudes of 35 % in January and 27 % in July from the Atmospheric Infrared Sounder analysed at the Laboratoire de Météorologie Dynamique in Paris (AIRS-LMD; 2003 to 2008), and respective fractions of 34 % and 21 % from the TIROS-N Operational Vertical Sounder Path-B cloud retrieval (TOVS-Path B; 1987 to 1995), and 42 % and 40 % from the Cloud-Aerosol Lidar and Infrared Pathfinder Satellite Observation (CALIPSO; 2006 to 2007). The compilation of our annual cycle of ISSR occurrence and the respective observations from space-borne sensors is shown in Fig. 13b. The agreement of the observations of ISSR occurrence from the very different sources is remarkably good with the exception of CALIPSO observations which provide higher values. According to Stubenrauch et al. (2010), the high cloud fraction of CALIPSO is about 10 % larger than respective values of CALIPSO for clouds excluding subvisible cirrus. Therefore, the difference between high cloud fractions from CALIPSO and from the other instruments shown in Fig. 13 can be attributed to instrument sensitivities.
The good agreement between MOZAIC in situ observations of ISSR occurrence with the high cloud fraction from satellite instruments encourages further detailed studies on this matter. First analyses of simultaneous observations of RHice and Nice, which are now possible within the ongoing IAGOS programme, already indicate a strong correlation of high RHice values with its occurrence inside cirrus clouds (Petzold et al., 2017).
3.5 Trend analysis
Finally, we analysed the 15-year records of the validated MOZAIC RHice observations and the resulting fraction of ISSR observations for the three regions of eastern North America, the North Atlantic and Europe for potential trends. The bases of our analyses were the seasonally averaged observations in the uppermost tropospheric layer (UT) with respect to the thermal tropopause and the respective average seasonal cycles depicted in Fig. 12. The resulting time series are shown in Fig. 14. The seasonality of ISSR occurrence is clearly visible for each region but with considerable interannual variability. Similar to Fig. 12, the shaded regions represent the average fractions for 95 % < RHice < 105 % and indicate thus the uncertainty resulting from the instrument precision of RHice = 5 %. For none of the regions do we find significant trends in ISSR occurrence. Therefore, the distribution of RHice in the uppermost troposphere close to the tropopause layer and the resulting occurrence of ice supersaturation seem to be stable over the investigated time period from 1995 to 2010.
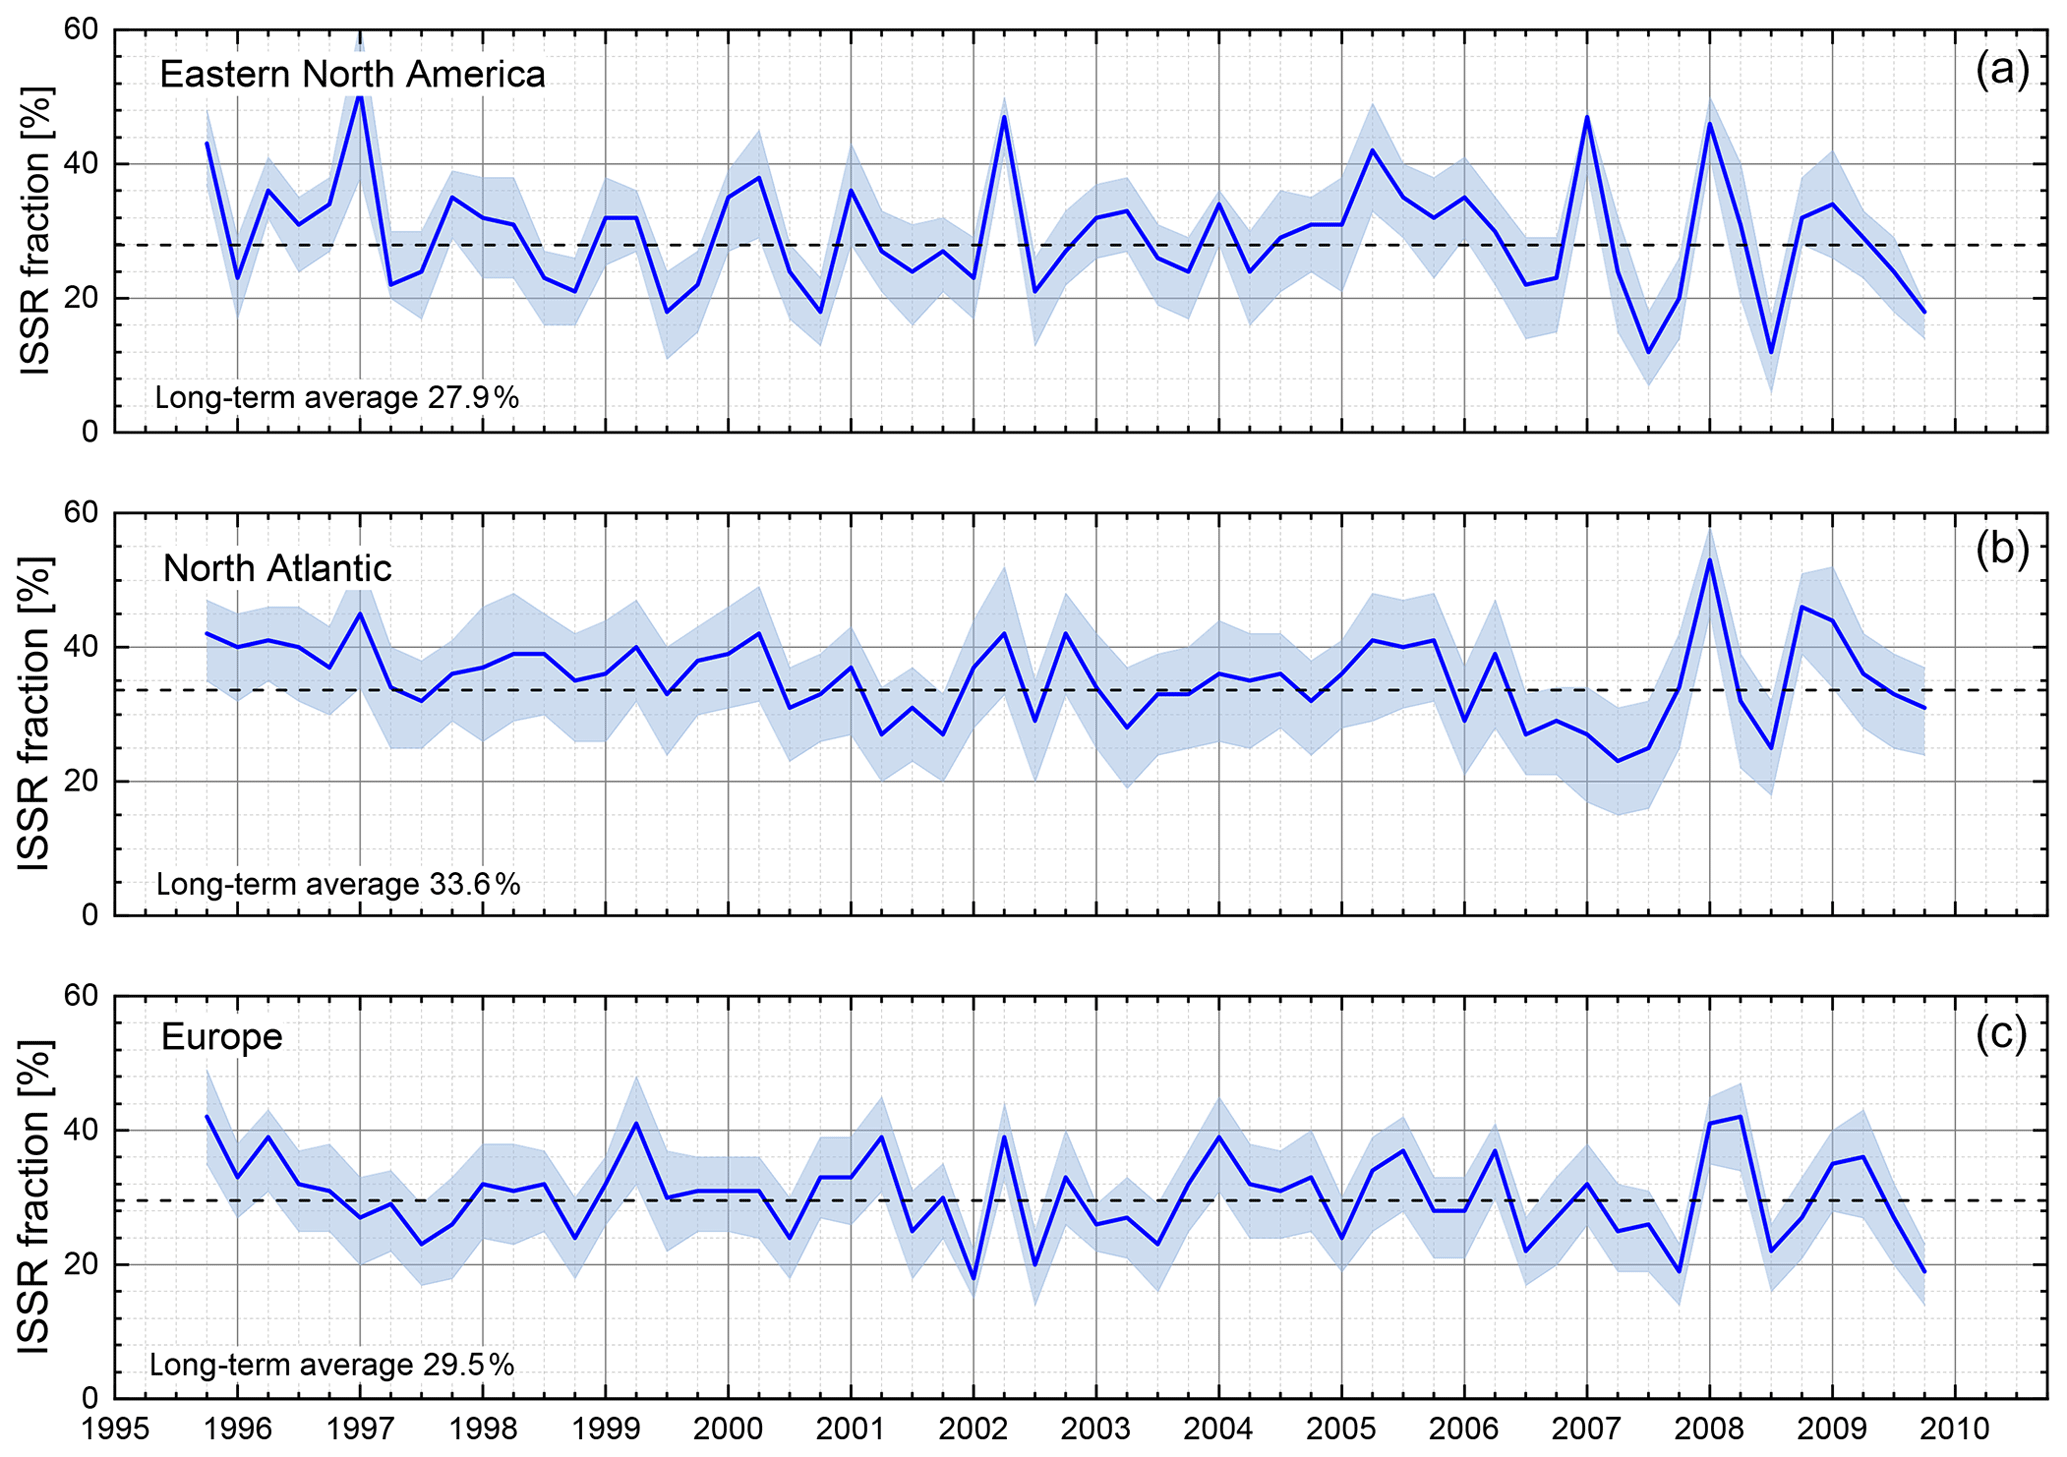
Figure 14Time series of ISSR fraction (probability of occurrence) for latitudes 40 to 60∘ N and for the regions of (from a to c) eastern North America (105 to 65∘ W), the North Atlantic (65 to 5∘ W) and Europe (5∘ W to 30∘ E) for the top UT layer, situated just below the tropopause layer. Solid lines represent probabilities for the average value for RHice = 100 %, the shaded areas represent average fractions for 95 % < RHice < 105 % and long-term average values for RHice = 100 % are added in the panels.
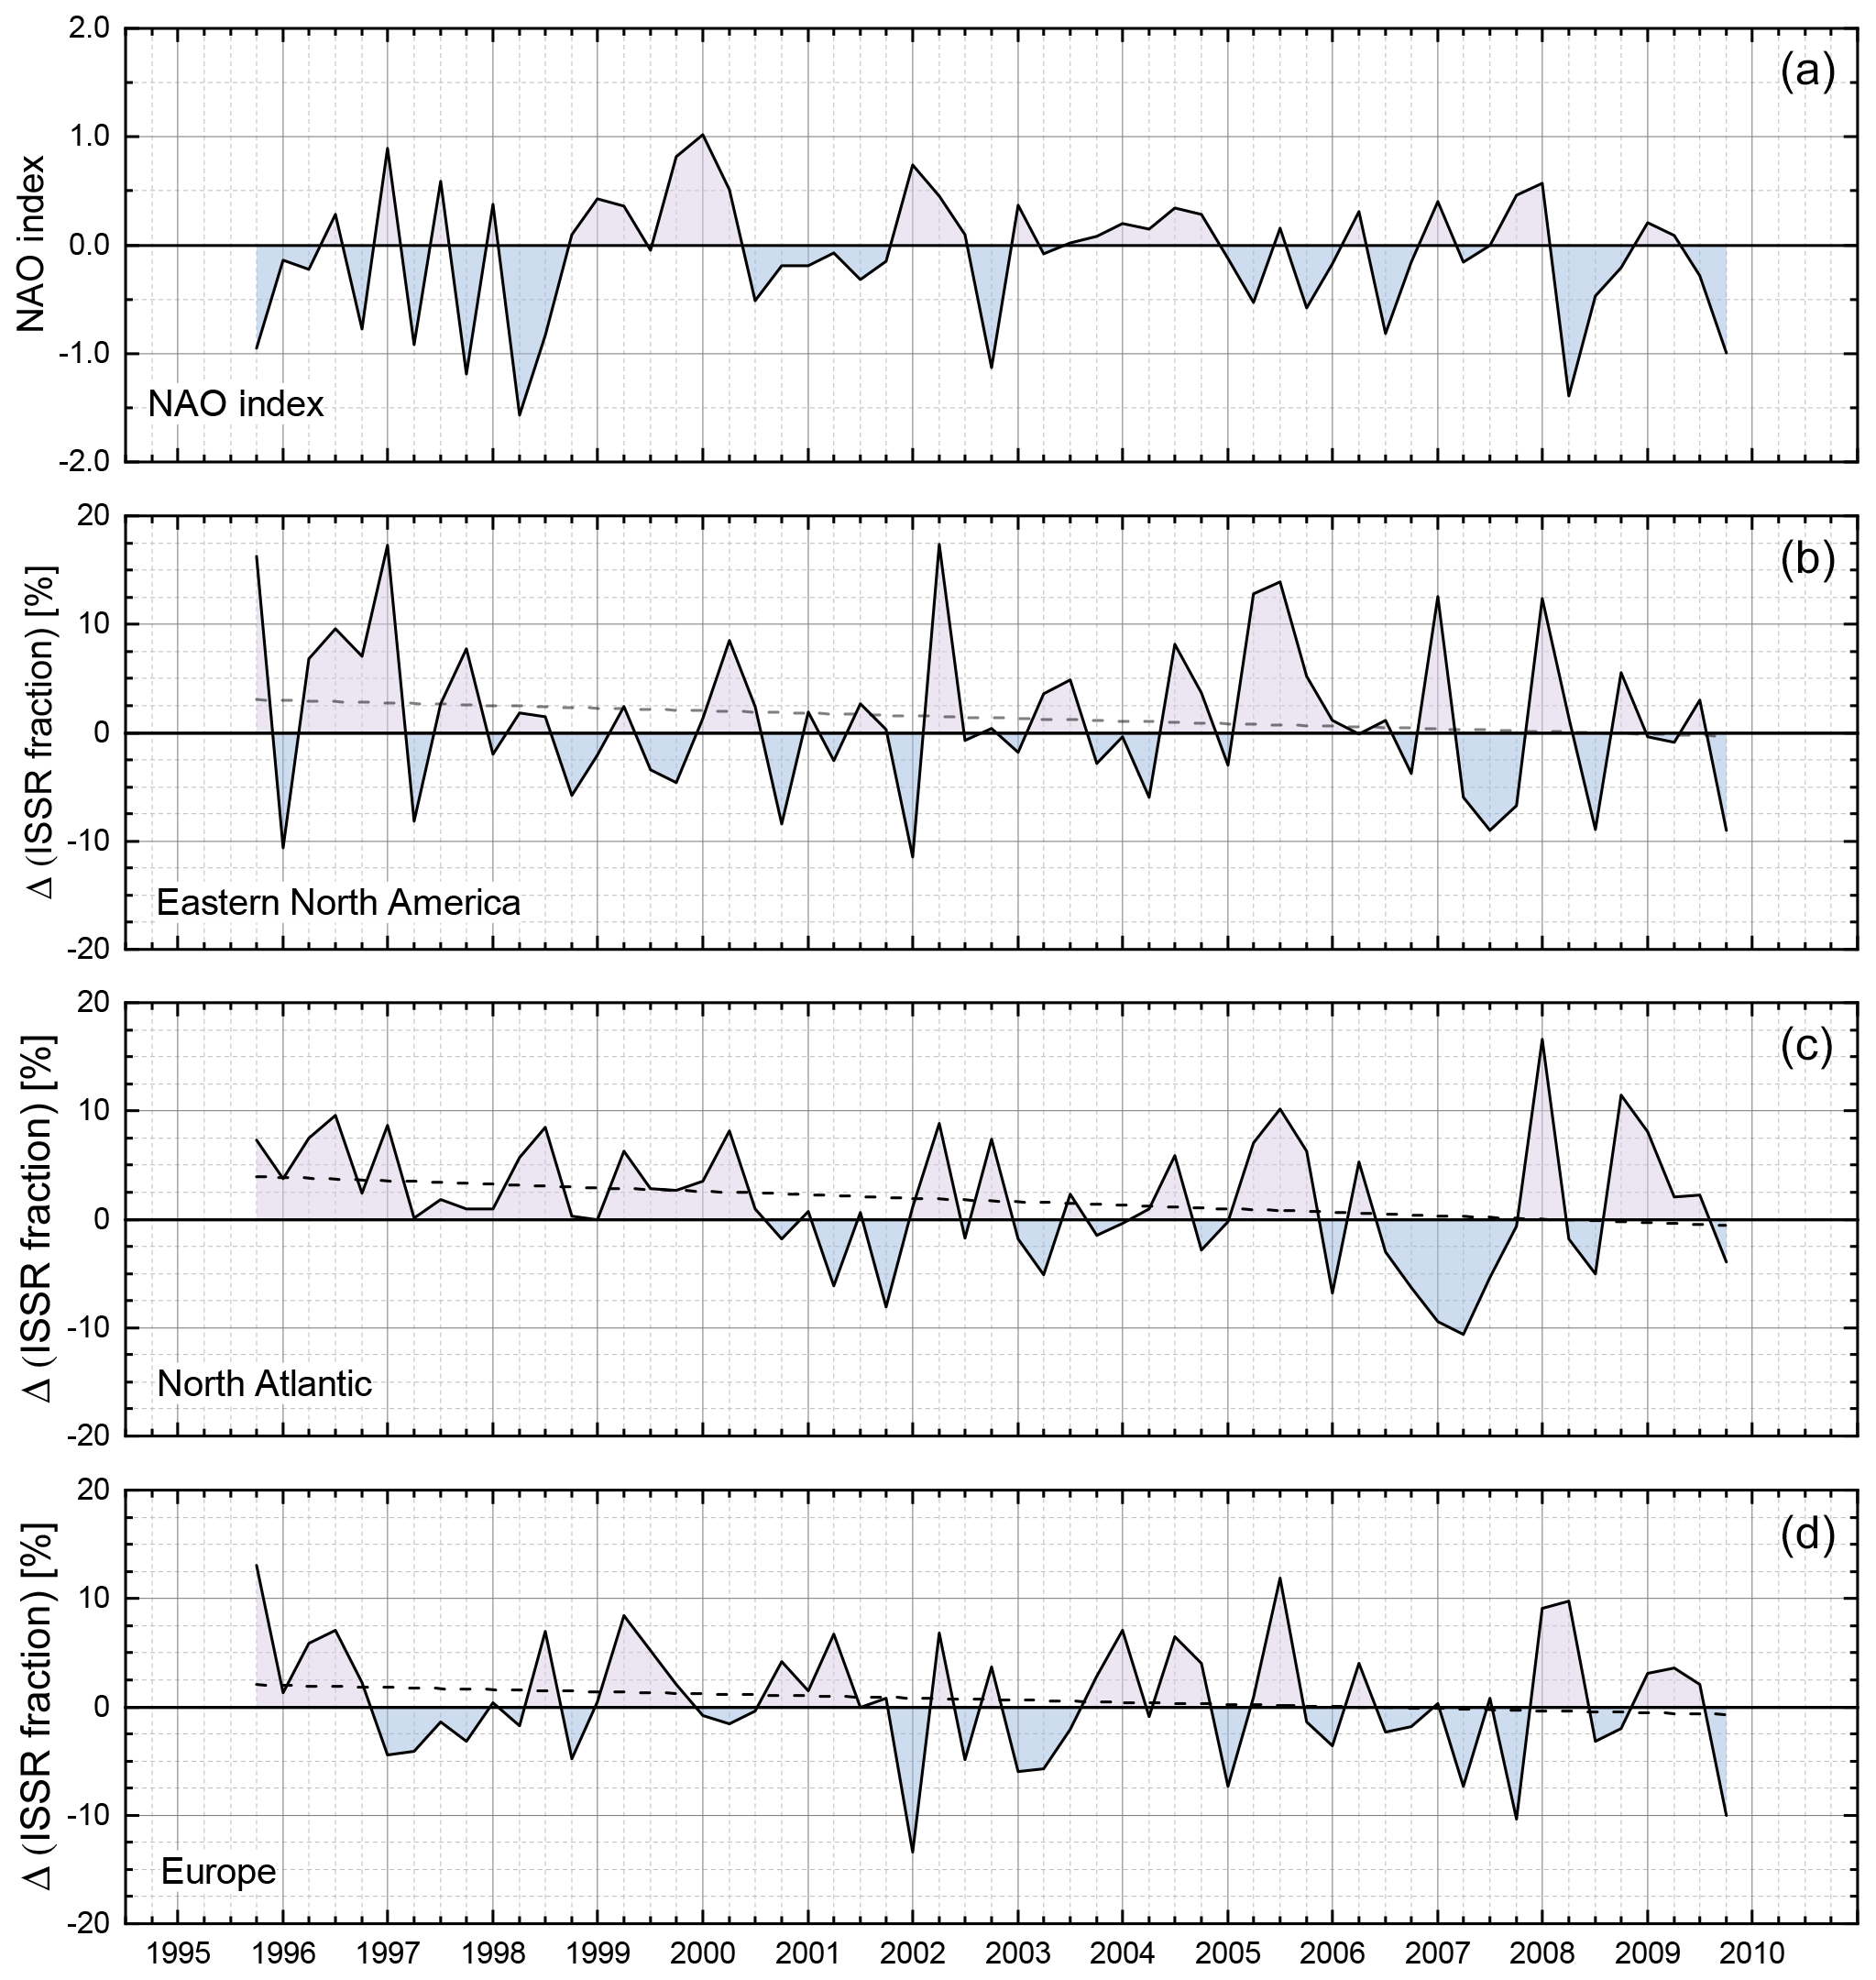
Figure 15Time series of the North Atlantic Oscillation (NAO) index (a) and de-seasonalized time series of ISSR fraction (probability of occurrence) for latitudes of 40 to 60∘ N and for the regions of (from b to d) eastern North America (105 to 65∘ W), the North Atlantic (65 to 5∘ W) and Europe (5∘ W to 30∘ E).

Figure 16Correlation analysis with respect to the correlation of signs between NAO index and deviation of ISSR occurrence from the long-term average (Δ ISSR) for the target regions. Numbers indicate the results from the correlation analysis with respect to number of samples n, Pearson's R and significance level p.
In order to get a clearer understanding of the reasons for the interannual variability, we further analysed the de-seasonalized time series of the ISSR fractions by calculating the difference between each seasonal value of the ISSR fraction and the 15-year seasonal average (see Fig. 12).
The de-seasonalized time-series thus show positive and negative deviations from the long-term seasonal average values. The resulting time series are presented in Fig. 15. As for the time series of ISSR occurrence, we performed a trend analysis and added the obtained trend lines to Fig. 15. Respective decadal slopes are −1.95 ± 1.77 % for eastern North America, −3.21 ± 1.78 % for the North Atlantic and −2.39 ± 2.29 % for Europe, and the indicated uncertainties of the determined slopes refer to 1 standard deviation. Thus none of the slopes differ significantly from zero, and, similar to the time series of ISSR occurrence, we do not observe significant trends for the seasonal deviation of ISSR occurrence from the long-term average for the three target regions.
One potential weather phenomenon driving the deviation of seasonal ISSR occurrence from the long-term average in the investigated region is the North Atlantic Oscillation (NAO). The NAO index describes the deviation of the pressure difference between the Iceland low and the Azores high pressure systems from the long-term average value. As an example, a positive value of the NAO index indicates that Δp (Iceland L to Azores H) is larger than on average. This larger pressure difference causes stronger westerly winds and thereby more active storm tracks over the North Atlantic. Under such conditions, we would expect a higher probability of ice supersaturation in the uppermost troposphere due to more frequent warm conveyor belts that can induce the formation of ISSRs in the upper troposphere (Spichtinger et al., 2005). Such a positive correlation between NAO and cirrus cloud cover is reported from an analysis of cirrus cloud cover data from the International Satellite Cloud Climatology Project and relative humidity data from ECMWF/ERA40 by Eleftheratos et al. (2007).
To investigate this potential link, we added the seasonally averaged NAO index to Fig. 15 (panel a). Since there is no immediate evidence given for a link between the NAO index and the deviation of ISSR occurrence from the long-term average (Δ ISSR), we further searched for a potential link of signs in the sense that positive and negative NAO index values are associated with positive and negative deviations of ISSR occurrence from the long-term average, respectively. The results of this cross-correlation analysis are presented in Fig. 16.
For the eastern North American and European regions, the correlation between NAO index and Δ ISSR is not statistically significant. For the North Atlantic, however, the results of the cross-correlation analysis indicate statistical significance at a level of 99 %. The obtained correlation of signs is in line with the observation that the occurrence of ice supersaturation is well correlated with the storm track activity (Spichtinger et al., 2003b; Gettelman et al., 2006; Lamquin et al., 2012).
The European Research Infrastructure IAGOS (from 2011) and its predecessor programme MOZAIC (1994–2010) perform global-scale routine in situ observations of relative humidity with respect to ice (RHice) by using instrumented passenger aircraft. The validated RHice data set from the MOZAIC period between 1995 and 2010 was analysed for latitudes of 40 to 60∘ N and for the eastern North American (105 to 65∘ W), North Atlantic (65 to 5∘ W) and European (5∘ W to 30∘ E) regions to study the occurrence of ice-supersaturated regions (ISSRs) in the uppermost troposphere and tropopause layers. Determined seasonal cycles agree very well with observations of ISSR occurrence from radio soundings (Spichtinger et al., 2003a) and from satellite observations (Spichtinger et al., 2003b; Lamquin et al., 2012).
The high vertical resolution of the MOZAIC RHice data set with 30 hPa layer thickness allows the determination of the vertical position of the ice-supersaturated air masses with respect to the thermal tropopause. It occurs that the fraction of ice-supersaturated regions is largest for the atmospheric layers of 60 hPa thickness directly below the thermal tropopause.
Comparing the ISSR fraction from MOZAIC in situ observations with the high cloud fraction from satellite instruments (Stubenrauch et al., 2010) yields remarkably close agreement between the two different observations and supports the interpretation that cirrus clouds exist to a considerable fraction also in ice-subsaturated air masses depending on their state of life. This interpretation is also supported by the first exemplary analyses of simultaneous observations of RHice and ice crystal number density Nice from the ongoing IAGOS programme (Petzold et al., 2017). In addition, the close agreement between satellite-based observations of ice cloud occurrence and the MOZAIC and IAGOS in situ observations of ice supersaturation demonstrate the unique contribution that MOZAIC and now IAGOS long-term observations can make to this scientific area in particular with the detailed seasonality of ISSR occurrence over different regions. Future work will combine RHice and Nice observations, which are now available from IAGOS, and link them to AIRS time series.
The findings that ice-supersaturated air is generally colder, associated with higher absolute humidity and – in the case of observations inside or above the tropopause layer – carries less ozone than the surrounding air masses are in close agreement with reported results for temperature and absolute humidity. However, we were also able to use ozone as a tracer for stratospheric air and calculate the troposphericity of ice-supersaturated and ice-subsaturated air masses. The analysis yields a significant impact of tropospheric air even on ISSRs observed above the thermal tropopause. The thermodynamic features together with the increased troposphericity indicate vertical mixing in the vicinity of the tropopause layer as one important formation process of ice supersaturation. Future work in this direction will be conducted once the full IAGOS data set on RHice, ozone and ice clouds is validated and available.
Over the investigated period of 15 years, no significant trends are observed either for the occurrence of ISSRs or for the deviation of seasonal ISSR occurrence probabilities from the long-term average. This statement is valid for all three investigated regions. Yet, we identify a significant correlation of signs between the NAO index and the deviation of seasonal ISSR occurrence probabilities from the long-term average for the North Atlantic, whereas no such correlation was found for eastern North America or Europe. The resulting interpretation is that a positive NAO index correlates with an increased occurrence of ISSRs (positive deviation from the long-term average). This interpretation is in agreement with the understanding that a positive NAO index leads to an increased storm track activity which then may induce more frequent formation of ISSRs in the upper troposphere.
Finally, in a concomitant study by Reutter et al. (2020), MOZAIC RHice observations have been compared to European Centre for Medium-Range Weather Forecasts (ECMWF) ERA-Interim data, and significant deviations are reported for ice-supersaturated conditions both in number and strength of supersaturation. Accurately representing the magnitude of an ISSR, as well as its coexistence with ice crystals, is crucial for quantifying radiative forcing since mistakenly representing ISSRs as ice crystals can lead to an average decrease of 2.7 W m−2 in surface radiation (Tan et al., 2016). The high quality and very good resolution of MOZAIC and later IAGOS RHice observations will certainly help to further improve the representation of ice supersaturation in ERA5, as well as in numerical weather and climate forecasting models.
The IAGOS data are available through the IAGOS data portal at https://doi.org/10.25326/20 (Boulanger, 2020). The IAGOS time series data set used for this analysis is referenced at https://doi.org/10.25326/06 (Boulanger et al., 2018). The data versions used for our analyses are version 1.0 of IAGOS air_temp and air_stag_temp data, based on the method described in Helten et al. (1998), and version 3.0 of IAGOS RHL, RHI and H2O_gas data, based on the calibration techniques and data inversion algorithms published in Helten et al. (1998). In addition, version 3.0 has implemented the in-flight calibration technique adapted from Smit et al. (2008), which adjusts for an offset drift of the MCH sensor during a flight period.
AP designed the study and prepared the paper with contributions from all co-authors. PaN, SR, MR and HGJS performed the quality control and analysis of MOZAIC and IAGOS water vapour data. FB provided the thermal tropopause pressure levels and performed the quality control and analysis of temperature data. MK and NS contributed to the analysis of the research aircraft data. PhN performed the quality control and analysis of ozone data. AW and PS contributed to the interpretation of the study results.
The authors declare that they have no conflict of interest.
MOZAIC/IAGOS data are created with support from the European Commission, national agencies in Germany (BMBF), France (MESR) and the UK (NERC), and the IAGOS member institutions. The participating airlines (Deutsche Lufthansa, Air France, Austrian, China Airlines, Iberia, Cathay Pacific, Air Namibia, Sabena) have supported IAGOS by carrying the measurement equipment free of charge since 1994. The data are available at https://doi.org/10.25326/20 thanks to additional support from AERIS. Martina Krämer thanks JGU Mainz for support as a GFK fellow. Finally, the authors gratefully acknowledge the highly valuable comments from three anonymous reviewers and Minghui Diao, who helped improve the paper.
This research has been supported by the German Ministry for Education and Research (BMBF grant no. 01LK1301A).
The article processing charges for this open-access
publication were covered by a Research
Centre of the Helmholtz Association.
This paper was edited by Xiaohong Liu and reviewed by Minghui Diao and three anonymous referees.
Aaltonen, V., Lihavainen, H., Kerminen, V.-M., Komppula, M., Hatakka, J., Eneroth, K., Kulmala, M., and Viisanen, Y.: Measurements of optical properties of atmospheric aerosols in Northern Finland, Atmos. Chem. Phys., 6, 1155–1164, https://doi.org/10.5194/acp-6-1155-2006, 2006.
Anderson, J. G., Wilmouth, D. M., Smith, J. B., and Sayres, D. S.: UV Dosage Levels in Summer: Increased Risk of Ozone Loss from Convectively Injected Water Vapor, Science, 337, 835–839, https://doi.org/10.1126/science.1222978, 2012.
Anderson, J. G., Weisenstein, D. K., Bowman, K. P., Homeyer, C. R., Smith, J. B., Wilmouth, D. M., Sayres, D. S., Klobas, J. E., Leroy, S. S., Dykema, J. A., and Wofsy, S. C.: Stratospheric ozone over the United States in summer linked to observations of convection and temperature via chlorine and bromine catalysis, P. Natl. Acad. Sci. USA, 114, E4905–E4913, https://doi.org/10.1073/pnas.1619318114, 2017.
Berkes, F., Neis, P., Schultz, M. G., Bundke, U., Rohs, S., Smit, H. G. J., Wahner, A., Konopka, P., Boulanger, D., Nédélec, P., Thouret, V., and Petzold, A.: In situ temperature measurements in the upper troposphere and lowermost stratosphere from 2 decades of IAGOS long-term routine observation, Atmos. Chem. Phys., 17, 12495–12508, https://doi.org/10.5194/acp-17-12495-2017, 2017.
Bock, L. and Burkhardt, U.: Contrail cirrus radiative forcing for future air traffic, Atmos. Chem. Phys., 19, 8163–8174, https://doi.org/10.5194/acp-19-8163-2019, 2019.
Bodeker, G. E., Bojinski, S., Cimini, D., Dirksen, R. J., Haeffelin, M., Hannigan, J. W., Hurst, D. F., Leblanc, T., Madonna, F., Maturilli, M., Mikalsen, A. C., Philipona, R., Reale, T., Seidel, D. J., Tan, D. G. H., Thorne, P. W., Vomel, H., and Wang, J.: Reference upper air observations for climate: From concept to reality, B. Am. Meteorol. Soc., 97, 123–135, https://doi.org/10.1175/bams-d-14-00072.1, 2016.
Boucher, O., Randall, D., Artaxo, P., Bretherton, C., Feingold, G., Forster, P., Kerminen, V.-M., Kondo, Y., Liao, H., Lohmann, U., Rasch, P., Satheesh, S. K., Sherwood, S., Stevens, B., and Zhang, X. Y.: Clouds and Aerosols, in: Climate Change 2013: The Physical Science Basis. Contribution of Working Group I to the Fifth Assessment Report of the Intergovernmental Panel on Climate Change, edited by: Stocker, T. F., Qin, D., Plattner, G.-K., Tignor, M., Allen, S. K., Boschung, J., Nauels, A., Xia, Y., Bex, V., and Midgley, P. M., Cambridge University Press, Cambridge, UK and New York, NY, USA, 2013.
Boulanger, D: IAGOS data portal, available at: http://www.iagos-data.fr (last access: 6 July 2020), https://doi.org/10.25326/20, 2020.
Boulanger, D., Bundke, U., Smit, H., Berkes, F., Sauvage, B., Nédélec, P., Gerbig, C., Hermann, M., Gallagher, M., Ziereis, H., Thouret, V., and Petzold, A.: IAGOS Time series [Data set], AERIS, https://doi.org/10.25326/06, 2018.
Brenninkmeijer, C. A. M., Crutzen, P. J., Fischer, H., Gusten, H., Hans, W., Heinrich, G., Heintzenberg, J., Hermann, M., Immelmann, T., Kersting, D., Maiss, M., Nolle, M., Pitscheider, A., Pohlkamp, H., Scharffe, D., Specht, K., and Wiedensohler, A.: CARIBIC – Civil aircraft for global measurement of trace gases and aerosols in the tropopause region, J. Atmos. Ocean. Tech., 16, 1373–1383, https://doi.org/10.1175/1520-0426(1999)016<1373:ccafgm>2.0.co;2, 1999.
Brenninkmeijer, C. A. M., Crutzen, P., Boumard, F., Dauer, T., Dix, B., Ebinghaus, R., Filippi, D., Fischer, H., Franke, H., Frieß, U., Heintzenberg, J., Helleis, F., Hermann, M., Kock, H. H., Koeppel, C., Lelieveld, J., Leuenberger, M., Martinsson, B. G., Miemczyk, S., Moret, H. P., Nguyen, H. N., Nyfeler, P., Oram, D., O'Sullivan, D., Penkett, S., Platt, U., Pupek, M., Ramonet, M., Randa, B., Reichelt, M., Rhee, T. S., Rohwer, J., Rosenfeld, K., Scharffe, D., Schlager, H., Schumann, U., Slemr, F., Sprung, D., Stock, P., Thaler, R., Valentino, F., van Velthoven, P., Waibel, A., Wandel, A., Waschitschek, K., Wiedensohler, A., Xueref-Remy, I., Zahn, A., Zech, U., and Ziereis, H.: Civil Aircraft for the regular investigation of the atmosphere based on an instrumented container: The new CARIBIC system, Atmos. Chem. Phys., 7, 4953–4976, https://doi.org/10.5194/acp-7-4953-2007, 2007.
Buchholz, B., Kuehnreich, B., Smit, H. G. J., and Ebert, V.: Validation of an extractive, airborne, compact TDL spectrometer for atmospheric humidity sensing by blind intercomparison, Appl. Phys. B, 110, 249–262, https://doi.org/10.1007/s00340-012-5143-1, 2013.
Burkhardt, U. and Kärcher, B.: Global radiative forcing from contrail cirrus, Nature, 1, 54–58, https://doi.org/10.1038/NCLIMATE1068, 2011.
Burkhardt, U., Kärcher, B., Ponater, M., Gierens, K., and Gettelman, A.: Contrail cirrus supporting areas in model and observations, Geophys. Res. Lett., 35, L16808, https://doi.org/10.1029/2008gl034056, 2008.
Chen, T., Rossow, W. B., and Zhang, Y. C.: Radiative effects of cloud-type variations, J. Climate, 13, 264–286, https://doi.org/10.1175/1520-0442(2000)013<0264:Reoctv>2.0.Co;2, 2000.
Cirisan, A., Spichtinger, P., Luo, B. P., Weisenstein, D. K., Wernli, H., Lohmann, U., and Peter, T.: Microphysical and radiative changes in cirrus clouds by geoengineering the stratosphere, J. Geophys. Res.-Atmos., 118, 4533–4548, https://doi.org/10.1002/jgrd.50388, 2013.
Cohen, Y., Petetin, H., Thouret, V., Marécal, V., Josse, B., Clark, H., Sauvage, B., Fontaine, A., Athier, G., Blot, R., Boulanger, D., Cousin, J.-M., and Nédélec, P.: Climatology and long-term evolution of ozone and carbon monoxide in the upper troposphere–lower stratosphere (UTLS) at northern midlatitudes, as seen by IAGOS from 1995 to 2013, Atmos. Chem. Phys., 18, 5415–5453, https://doi.org/10.5194/acp-18-5415-2018, 2018.
D'Alessandro, J. J., Diao, M. H., Wu, C. L., Liu, X. H., Chen, M., Morrison, H., Eidhammer, T., Jensen, J. B., Bansemer, A., Zondlo, M. A., and DiGangi, J. P.: Dynamical conditions of ice supersaturation and ice nucleation in convective systems: A comparative analysis between in situ aircraft observations and WRF simulations, J. Geophys. Res.-Atmos., 122, 2844–2866, https://doi.org/10.1002/2016jd025994, 2017.
Dee, D. P., Uppala, S. M., Simmons, A. J., Berrisford, P., Poli, P., Kobayashi, S., Andrae, U., Balmaseda, M. A., Balsamo, G., Bauer, P., Bechtold, P., Beljaars, A. C. M., van de Berg, L., Bidlot, J., Bormann, N., Delsol, C., Dragani, R., Fuentes, M., Geer, A. J., Haimberger, L., Healy, S. B., Hersbach, H., Holm, E. V., Isaksen, L., Kallberg, P., Kohler, M., Matricardi, M., McNally, A. P., Monge-Sanz, B. M., Morcrette, J. J., Park, B. K., Peubey, C., de Rosnay, P., Tavolato, C., Thepaut, J. N., and Vitart, F.: The ERA-Interim reanalysis: configuration and performance of the data assimilation system, Q. J. Roy. Meteor. Soc., 137, 553–597, https://doi.org/10.1002/qj.828, 2011.
Diao, M., Zondlo, M. A., Heymsfield, A. J., Avallone, L. M., Paige, M. E., Beaton, S. P., Campos, T., and Rogers, D. C.: Cloud-scale ice-supersaturated regions spatially correlate with high water vapor heterogeneities, Atmos. Chem. Phys., 14, 2639–2656, https://doi.org/10.5194/acp-14-2639-2014, 2014.
Diao, M., Jensen, J. B., Pan, L. L., Homeyer, C. R., Honomichl, S., Bresch, J. F., and Bansemer, A.: Distributions of ice supersaturation and ice crystals from airborne observations in relation to upper tropospheric dynamical boundaries, J. Geophys. Res.-Atmos., 120, 5101–5121, https://doi.org/10.1002/2015jd023139, 2015.
Diao, M. H., Jumbam, L., Sheffield, J., Wood, E. F., and Zondlo, M. A.: Validation of AIRS/AMSU-A water vapor and temperature data with in situ aircraft observations from the surface to UT/LS from 87∘ N–67∘ S, J. Geophys. Res.-Atmos., 118, 6816–6836, https://doi.org/10.1002/jgrd.50483, 2013.
Dyroff, C., Zahn, A., Christner, E., Forbes, R., Tompkins, A. M., and van Velthoven, P. F. J.: Comparison of ECMWF analysis and forecast humidity data with CARIBIC upper troposphere and lower stratosphere observations, Q. J. Roy. Meteor. Soc., https://doi.org/10.1002/qj.2400, 2014.
Eleftheratos, K., Zerefos, C. S., Zanis, P., Balis, D. S., Tselioudis, G., Gierens, K., and Sausen, R.: A study on natural and manmade global interannual fluctuations of cirrus cloud cover for the period 1984–2004, Atmos. Chem. Phys., 7, 2631–2642, https://doi.org/10.5194/acp-7-2631-2007, 2007.
Gettelman, A., Fetzer, E. J., Eldering, A., and Irion, F. W.: The global distribution of supersaturation in the upper troposphere from the Atmospheric Infrared Sounder, J. Climate, 19, 6089–6103, https://doi.org/10.1175/jcli3955.1, 2006.
Gettelman, A., Hoor, P., Pan, L. L., Randel, W. J., Hegglin, M. I., and Birner, T.: The extratropical upper troposphere and lower stratosphere, Rev. Geophys., 49, RG3003, https://doi.org/10.1029/2011rg000355, 2011.
Gettelman, A., Liu, X., Barahona, D., Lohmann, U., and Chen, C.: Climate impacts of ice nucleation, J. Geophys. Res.-Atmos., 117, D20201, https://doi.org/10.1029/2012jd017950, 2012.
Gierens, K. and Brinkop, S.: Dynamical characteristics of ice supersaturated regions, Atmos. Chem. Phys., 12, 11933–11942, https://doi.org/10.5194/acp-12-11933-2012, 2012.
Gierens, K. and Spichtinger, P.: On the size distribution of ice-supersaturated regions in the upper troposphere and lowermost stratosphere, Ann. Geophys., 18, 499–504, https://doi.org/10.1007/s005850050907, 2000.
Gierens, K., Schumann, U., Helten, M., Smit, H., and Marenco, A.: A distribution law for relative humidity in the upper troposphere and lower stratosphere derived from three years of MOZAIC measurements, Ann. Geophys., 17, 1218–1226, https://doi.org/10.1007/s005850050846, 1999.
Gierens, K., Schumann, U., Helten, M., Smit, H., and Wang, P. H.: Ice-supersaturated regions and subvisible cirrus in the northern midlatitude upper troposphere, J. Geophys. Res., 105, 22743–22753, https://doi.org/10.1029/2000jd900341, 2000.
Gierens, K., Eleftheratos, K., and Shi, L.: Technical Note: 30 years of HIRS data of upper tropospheric humidity, Atmos. Chem. Phys., 14, 7533–7541, https://doi.org/10.5194/acp-14-7533-2014, 2014.
Helten, M., Smit, H. G. J., Sträter, W., Kley, D., Nédélec, P., Zöger, M., and Busen, R.: Calibration and performance of automatic compact instrumentation for the measurement of relative humidity from passenger aircraft, J. Geophys. Res., 103, 25643–25652, https://doi.org/10.1029/98jd00536, 1998.
Helten, M., Smit, H. G. J., Kley, D., Ovarlez, J., Schlager, H., Baumann, R., Schumann, U., Nédélec, P., and Marenco, A.: In-flight comparison of MOZAIC and POLINAT water vapor measurements, J. Geophys. Res., 104, 26087–26096, https://doi.org/10.1029/1999jd900315, 1999.
Heymsfield, A. J., Krämer, M., Luebke, A., Brown, P., Cziczo, D. J., Franklin, C., Lawson, P., Lohmann, U., McFarquhar, G., Ulanowski, Z., and Tricht, K. V.: Cirrus Clouds, Meteor. Mon., 58, 2.1–2.26, https://doi.org/10.1175/amsmonographs-d-16-0010.1, 2017.
Hoor, P., Gurk, C., Brunner, D., Hegglin, M. I., Wernli, H., and Fischer, H.: Seasonality and extent of extratropical TST derived from in-situ CO measurements during SPURT, Atmos. Chem. Phys., 4, 1427–1442, https://doi.org/10.5194/acp-4-1427-2004, 2004.
Hoor, P., Wernli, H., Hegglin, M. I., and Bönisch, H.: Transport timescales and tracer properties in the extratropical UTLS, Atmos. Chem. Phys., 10, 7929–7944, https://doi.org/10.5194/acp-10-7929-2010, 2010.
Hoose, C. and Möhler, O.: Heterogeneous ice nucleation on atmospheric aerosols: a review of results from laboratory experiments, Atmos. Chem. Phys., 12, 9817–9854, https://doi.org/10.5194/acp-12-9817-2012, 2012.
Irvine, E. A. and Shine, K. P.: Ice supersaturation and the potential for contrail formation in a changing climate, Earth Syst. Dynam., 6, 555–568, https://doi.org/10.5194/esd-6-555-2015, 2015.
Irvine, E. A., Hoskins, B. J., and Shine, K. P.: A Lagrangian analysis of ice-supersaturated air over the North Atlantic, J. Geophys. Res., 119, 90–100, https://doi.org/10.1002/2013jd020251, 2014.
Ivanova, A. R.: The tropopause: Variety of definitions and modern approaches to identification, Russ. Meteorol. Hydrol., 38, 808–817, https://doi.org/10.3103/s1068373913120029, 2013.
Jöckel, P., Tost, H., Pozzer, A., Kunze, M., Kirner, O., Brenninkmeijer, C. A. M., Brinkop, S., Cai, D. S., Dyroff, C., Eckstein, J., Frank, F., Garny, H., Gottschaldt, K.-D., Graf, P., Grewe, V., Kerkweg, A., Kern, B., Matthes, S., Mertens, M., Meul, S., Neumaier, M., Nützel, M., Oberländer-Hayn, S., Ruhnke, R., Runde, T., Sander, R., Scharffe, D., and Zahn, A.: Earth System Chemistry integrated Modelling (ESCiMo) with the Modular Earth Submodel System (MESSy) version 2.51, Geosci. Model Dev., 9, 1153–1200, https://doi.org/10.5194/gmd-9-1153-2016, 2016.
Kärcher, B.: Formation and radiative forcing of contrail cirrus, Nat. Commun., 9, 1824, https://doi.org/10.1038/s41467-018-04068-0, 2018.
Kärcher, B. and Lohmann, U.: A parameterization of cirrus cloud formation: Homogeneous freezing of supercooled aerosols, J. Geophys. Res.-Atmos., 107, AAC 4-1–AAC 4-10, https://doi.org/10.1029/2001jd000470, 2002.
Kärcher, B., Dörnbrack, A., and Sölch, I.: Supersaturation Variability and Cirrus Ice Crystal Size Distributions, J. Atmos. Sci., 71, 2905–2926, https://doi.org/10.1175/JAS-D-13-0404.1, 2014.
Kley, D. and Stone, E. J.: Measurement of water-vapor in the stratosphere by photo-dissociation with Ly-alpha (1216 A) light, Rev. Sci. Instrum., 49, 691–697, https://doi.org/10.1063/1.1135596, 1978.
Koop, T., Luo, B. P., Tsias, A., and Peter, T.: Water activity as the determinant for homogeneous ice nucleation in aqueous solutions, Nature, 406, 611–614, https://doi.org/10.1038/35020537, 2000.
Krämer, M., Schiller, C., Afchine, A., Bauer, R., Gensch, I., Mangold, A., Schlicht, S., Spelten, N., Sitnikov, N., Borrmann, S., de Reus, M., and Spichtinger, P.: Ice supersaturations and cirrus cloud crystal numbers, Atmos. Chem. Phys., 9, 3505–3522, https://doi.org/10.5194/acp-9-3505-2009, 2009.
Krämer, M., Rolf, C., Luebke, A., Afchine, A., Spelten, N., Costa, A., Meyer, J., Zöger, M., Smith, J., Herman, R. L., Buchholz, B., Ebert, V., Baumgardner, D., Borrmann, S., Klingebiel, M., and Avallone, L.: A microphysics guide to cirrus clouds – Part 1: Cirrus types, Atmos. Chem. Phys., 16, 3463–3483, https://doi.org/10.5194/acp-16-3463-2016, 2016.
Krämer, M., Rolf, C., Spelten, N., Afchine, A., Fahey, D., Jensen, E., Khaykin, S., Kuhn, T., Lawson, P., Lykov, A., Pan, L. L., Riese, M., Rollins, A., Stroh, F., Thornberry, T., Wolf, V., Woods, S., Spichtinger, P., Quaas, J., and Sourdeval, O.: A Microphysics Guide to Cirrus – Part II: Climatologies of Clouds and Humidity from Observations, Atmos. Chem. Phys. Discuss., https://doi.org/10.5194/acp-2020-40, in review, 2020.
Kunz, A., Schiller, C., Rohrer, F., Smit, H. G. J., Nédélec, P., and Spelten, N.: Statistical analysis of water vapour and ozone in the UT/LS observed during SPURT and MOZAIC, Atmos. Chem. Phys., 8, 6603–6615, https://doi.org/10.5194/acp-8-6603-2008, 2008.
Kunz, A., Mueller, R., Homonnai, V., Janosi, I. M., Hurst, D., Rap, A., Forster, P. M., Rohrer, F., Spelten, N., and Riese, M.: Extending water vapor trend observations over Boulder into the tropopause region: Trend uncertainties and resulting radiative forcing, J. Geophys. Res.-Atmos., 118, 11269–11284, https://doi.org/10.1002/jgrd.50831, 2013.
Kunz, A., Spelten, N., Konopka, P., Müller, R., Forbes, R. M., and Wernli, H.: Comparison of Fast In situ Stratospheric Hygrometer (FISH) measurements of water vapor in the upper troposphere and lower stratosphere (UTLS) with ECMWF (re)analysis data, Atmos. Chem. Phys., 14, 10803–10822, https://doi.org/10.5194/acp-14-10803-2014, 2014.
Lamquin, N., Stubenrauch, C. J., Gierens, K., Burkhardt, U., and Smit, H.: A global climatology of upper-tropospheric ice supersaturation occurrence inferred from the Atmospheric Infrared Sounder calibrated by MOZAIC, Atmos. Chem. Phys., 12, 381–405, https://doi.org/10.5194/acp-12-381-2012, 2012.
Lee, D. S., Pitari, G., Grewe, V., Gierens, K., Penner, J. E., Petzold, A., Prather, M. J., Schumann, U., Bais, A., Berntsen, T., Iachetti, D., Lim, L. L., and Sausen, R.: Transport impacts on atmosphere and climate: Aviation, Atmos. Environ., 44, 4678–4734, https://doi.org/10.1016/j.atmosenv.2009.06.005, 2010.
Marenco, A., Thouret, V., Nédélec, P., Smit, H., Helten, M., Kley, D., Karcher, F., Simon, P., Law, K., Pyle, J., Poschmann, G., Von Wrede, R., Hume, C., and Cook, T.: Measurement of ozone and water vapor by Airbus in-service aircraft: The MOZAIC airborne program, An overview, J. Geophys. Res., 103, 25631–25642, https://doi.org/10.1029/98jd00977, 1998.
May, R. D. and Webster, C. R.: Data processing and calibration for tunable diode-laser harmonic absorption spectrometers, J. Quant. Spectrosc. Ra., 49, 335–347, https://doi.org/10.1016/0022-4073(93)90098-3, 1993.
Meyer, J., Rolf, C., Schiller, C., Rohs, S., Spelten, N., Afchine, A., Zöger, M., Sitnikov, N., Thornberry, T. D., Rollins, A. W., Bozóki, Z., Tátrai, D., Ebert, V., Kühnreich, B., Mackrodt, P., Möhler, O., Saathoff, H., Rosenlof, K. H., and Krämer, M.: Two decades of water vapor measurements with the FISH fluorescence hygrometer: a review, Atmos. Chem. Phys., 15, 8521–8538, https://doi.org/10.5194/acp-15-8521-2015, 2015.
Müller, R., Kunz, A., Hurst, D. F., Rolf, C., Krämer, M., and Riese, M.: The need for accurate long-term measurements of water vapor in the upper troposphere and lower stratosphere with global coverage, Earths Future, 4, 25–32, https://doi.org/10.1002/2015ef000321, 2016.
Müller, S., Hoor, P., Berkes, F., Bozem, H., Klingebiel, M., Reutter, P., Smit, H. G. J., Wendisch, M., Spichtinger, P., and Borrmann, S.: In situ detection of stratosphere-troposphere exchange of cirrus particles in the midlatitudes, Gephys. Res. Lett., 42, 949–955, https://doi.org/10.1002/2014gl062556, 2015.
Nédélec, P., Blot, R., Boulanger, D., Athier, G., Cousin, J.-M., Gautron, B., Volz-Thomas, A., Petzold, A., and Thouret, V.: Instrumentation on commercial aircraft for monitoring the atmospheric composition on a global scale: The IAGOS system, technical overview of ozone and carbon monoxide measurements, Tellus B, 67, 27791, https://doi.org/10.3402/tellusb.v67.27791, 2015.
Neis, P.: Water Vapour in the UTLS – Climatologies and Transport, Forschugszentrum Jülich, Schriften des Forschungszentrums Jülich, Reihe Energie und Umwelt FZJ-2017–07862, 124 pp., 2017.
Neis, P., Smit, H. G. J., Krämer, M., Spelten, N., and Petzold, A.: Evaluation of the MOZAIC Capacitive Hygrometer during the airborne field study CIRRUS-III, Atmos. Meas. Tech., 8, 1233–1243, https://doi.org/10.5194/amt-8-1233-2015, 2015a.
Neis, P., Smit, H. G. J., Rohs, S., Bundke, U., Krämer, M., Spelten, N., Ebert, V., Buchholz, B., Thomas, K., and Petzold, A.: Quality assessment of MOZAIC and IAGOS capacitive hygrometers: Insights from airborne field studies, Tellus B, 67, 28320, https://doi.org/10.3402/tellusb.v67.28320, 2015b.
Pan, L. L., Bowman, K. P., Atlas, E. L., Wofsy, S. C., Zhang, F. Q., Bresch, J. F., Ridley, B. A., Pittman, J. V., Homeyer, C. R., Romashkin, P., and Cooper, W. A.: The Stratosphere-Troposphere Analyses of Regional Transport 2008 experiment, B. Am. Meteorol. Soc., 91, 327–342, https://doi.org/10.1175/2009bams2865.1, 2010.
Penner, J. E., Zhou, C., Garnier, A., and Mitchell, D. L.: Anthropogenic Aerosol Indirect Effects in Cirrus Clouds, J. Geophys. Res.-Atmos., 123, 11652–11677, https://doi.org/10.1029/2018jd029204, 2018.
Petetin, H., Jeoffrion, M., Sauvage, B., Athier, G., Blot, R., Boulanger, D., Clark, H., Cousin, J.-M., Gheusi, F., Nédélec, P., Steinbacher, M., and Thouret, V.: Representativeness of the IAGOS airborne measurements in the lower troposphere, Elementa Sci. Anth., 6, 23, https://doi.org/10.1525/elementa.280, 2018.
Petzold, A., Thouret, V., Gerbig, C., Zahn, A., Brenninkmeijer, C. A. M., Gallagher, M., Hermann, M., Pontaud, M., Ziereis, H., Boulanger, D., Marshall, J., Nédélec, P., Smit, H. G. J., Frieß, U., Flaud, J.-M., Wahner, A., Cammas, J.-P., Volz-Thomas, A., and IAGOS-Team: Global-Scale Atmosphere Monitoring by In-Service Aircraft – Current Achievements and Future Prospects of the European Research Infrastructure IAGOS, Tellus B, 67, 28452, https://doi.org/10.3402/tellusb.v67.28452, 2015.
Petzold, A., Krämer, M., Neis, P., Rolf, C., Rohs, S., Berkes, F., Smit, H. G. J., Gallagher, M., Beswick, K., Lloyd, G., Baumgardner, D., Spichtinger, P., Nédélec, P., Ebert, V., Buchholz, B., Riese, M., and Wahner, A.: Upper tropospheric water vapour and its interaction with cirrus clouds as seen from IAGOS long-term routine in situ observations, Faraday Discuss., 200, 229–249, https://doi.org/10.1039/c7fd00006e, 2017.
Pruppacher, H. R. and Klett, J. D.: Microphysics of Clouds and Precipitation, 2nd Edn., Kluwer Academic Publishers, AA Dordrecht, 1997.
Reichler, T., Dameris, M., and Sausen, R.: Determining the tropopause height from gridded data, Geophys. Res. Lett., 30, 2042, https://doi.org/10.1029/2003gl018240, 2003.
Reutter, P., Neis, P., Rohs, S., and Sauvage, B.: Ice supersaturated regions: properties and validation of ERA-Interim reanalysis with IAGOS in situ water vapour measurements, Atmos. Chem. Phys., 20, 787–804, https://doi.org/10.5194/acp-20-787-2020, 2020.
Riese, M., Ploeger, F., Rap, A., Vogel, B., Konopka, P., Dameris, M., and Forster, P.: Impact of uncertainties in atmospheric mixing on simulated UTLS composition and related radiative effects, J. Geophys. Res.-Atmos., 117, D16305, https://doi.org/10.1029/2012jd017751, 2012.
Rolf, C., Vogel, B., Hoor, P., Afchine, A., Günther, G., Krämer, M., Müller, R., Müller, S., Spelten, N., and Riese, M.: Water vapor increase in the lower stratosphere of the Northern Hemisphere due to the Asian monsoon anticyclone observed during the TACTS/ESMVal campaigns, Atmos. Chem. Phys., 18, 2973–2983, https://doi.org/10.5194/acp-18-2973-2018, 2018.
Santee, M. L., Manney, G. L., Livesey, N. J., Schwartz, M. J., Neu, J. L., and Read, W. G.: A comprehensive overview of the climatological composition of the Asian summermonsoon anticyclone based on 10 years of Aura Microwave Limb Sounder measurements, J. Geophys. Res.-Atmos., 122, 5491–5514, https://doi.org/10.1002/2016jd026408, 2017.
Schwartz, M. J., Read, W. G., Santee, M. L., Livesey, N. J., Froidevaux, L., Lambert, A., and Manney, G. L.: Convectively injected water vapor in the North American summer lowermost stratosphere, Geophys. Res. Lett., 40, 2316–2321, https://doi.org/10.1002/grl.50421, 2013.
Seidel, D. J., Berger, F. H., Diamond, H. J., Dykema, J., Goodrich, D., Immler, F., Murray, W., Peterson, T., Sisterson, D., Sommer, M., Thorne, P., Voemel, H., and Wang, J.: Reference Upper-Air Observations for Climate: Rationale, Progress, and Plans, B. Am. Meteorol. Soc., 90, 361–369, https://doi.org/10.1175/2008bams2540.1, 2009.
Sitnikov, N. M., Yushkov, V. A., Afchine, A. A., Korshunov, L. I., Astakhov, V. I., Ulanovskii, A. E., Krämer, M., Mangold, A., Schiller, C., and Ravegnani, F.: The FLASH instrument for water vapor measurements on board the high-altitude airplane, Instrum. Exp. Tech., 50, 113–121, https://doi.org/10.1134/s0020441207010174, 2007.
Smit, H. G. J., Volz-Thomas, A., Helten, M., Paetz, W., and Kley, D.: An in-flight calibration method for near-real-time humidity measurements with the airborne MOZAIC sensor, J. Atmos. Ocean. Tech., 25, 656–666, https://doi.org/10.1175/2007jtecha975.1, 2008.
Smit, H. G. J., Rohs, S., Neis, P., Boulanger, D., Krämer, M., Wahner, A., and Petzold, A.: Technical Note: Reanalysis of upper troposphere humidity data from the MOZAIC programme for the period 1994 to 2009, Atmos. Chem. Phys., 14, 13241–13255, https://doi.org/10.5194/acp-14-13241-2014, 2014.
Sonntag, D.: Advances in the field of hygrometry, Meteorol. Z., 3, 51–66, 1994.
Spang, R., Günther, G., Riese, M., Hoffmann, L., Müller, R., and Griessbach, S.: Satellite observations of cirrus clouds in the Northern Hemisphere lowermost stratosphere, Atmos. Chem. Phys., 15, 927–950, https://doi.org/10.5194/acp-15-927-2015, 2015.
Spichtinger, P. and Leschner, M.: Horizontal scales of ice-supersaturated regions, Tellus B, 68, https://doi.org/10.3402/tellusb.v68.29020, 2016.
Spichtinger, P., Gierens, K., and Read, W.: The statistical distribution law of relative humidity in the global tropopause region, Meteorol. Z., 11, 83–88, https://doi.org/10.1127/0941-2948/2002/0011-0083, 2002.
Spichtinger, P., Gierens, K., Leiterer, U., and Dier, H.: Ice supersaturation in the tropopause region over Lindenberg, Germany, Meteorol. Z., 12, 143–156, https://doi.org/10.1127/0941-2948/2003/0012-0143, 2003a.
Spichtinger, P., Gierens, K., and Read, W.: The global distribution of ice-supersaturated regions as seen by the Microwave Limb Sounder, Q. J. Roy. Meteor. Soc., 129, 3391–3410, https://doi.org/10.1256/qj.02.141, 2003b.
Spichtinger, P., Gierens, K., and Wernli, H.: A case study on the formation and evolution of ice supersaturation in the vicinity of a warm conveyor belt's outflow region, Atmos. Chem. Phys., 5, 973–987, https://doi.org/10.5194/acp-5-973-2005, 2005.
Stubenrauch, C. J., Cros, S., Guignard, A., and Lamquin, N.: A 6-year global cloud climatology from the Atmospheric InfraRed Sounder AIRS and a statistical analysis in synergy with CALIPSO and CloudSat, Atmos. Chem. Phys., 10, 7197–7214, https://doi.org/10.5194/acp-10-7197-2010, 2010.
Stubenrauch, C. J., Rossow, W. B., Kinne, S., Ackerman, S., Cesana, G., Chepfer, H., Di Girolamo, L., Getzewich, B., Guignard, A., Heidinger, A., Maddux, B. C., Menzel, W. P., Minnis, P., Pearl, C., Platnick, S., Poulsen, C., Riedi, J., Sun-Mack, S., Walther, A., Winker, D., Zeng, S., and Zhao, G.: Assessment of Global Cloud Datasets from Satellites: Project and Database Initiated by the GEWEX Radiation Panel, B. Am. Meteorol. Soc., 94, 1031–1049, https://doi.org/10.1175/bams-d-12-00117.1, 2013.
Stuber, N., Forster, P., Radel, G., and Shine, K.: The importance of the diurnal and annual cycle of air traffic for contrail radiative forcing, Nature, 441, 864–867, https://doi.org/10.1038/nature04877, 2006.
Tan, X. X., Huang, Y., Diao, M. H., Bansemer, A., Zondlo, M. A., DiGangi, J. P., Volkamer, R., and Hu, Y. Y.: An assessment of the radiative effects of ice supersaturation based on in situ observations, Geophys. Res. Lett., 43, 11039–11047, https://doi.org/10.1002/2016gl071144, 2016.
Thouret, V., Cammas, J.-P., Sauvage, B., Athier, G., Zbinden, R., Nédélec, P., Simon, P., and Karcher, F.: Tropopause referenced ozone climatology and inter-annual variability (1994–2003) from the MOZAIC programme, Atmos. Chem. Phys., 6, 1033–1051, https://doi.org/10.5194/acp-6-1033-2006, 2006.
WMO: Meteorology – a three-dimensipnal science, WMO Bull., 6, 134–138, 1957.
Zahn, A. and Brenninkmeijer, C. A. M.: New directions: A chemical tropopause defined, Atmos. Environ., 37, 439–440, https://doi.org/10.1016/s1352-2310(02)00901-9, 2003.
Zahn, A., Christner, E., van Velthoven, P. F. J., Rauthe-Schoech, A., and Brenninkmeijer, C. A. M.: Processes controlling water vapor in the upper troposphere/lowermost stratosphere: An analysis of 8 years of monthly measurements by the IAGOS-CARIBIC observatory, J. Geophys. Res.-Atmos., 119, 11505–11525, https://doi.org/10.1002/2014jd021687, 2014.
Zöger, M., Afchine, A., Eicke, N., Gerhards, M. T., Klein, E., McKenna, D. S., Morschel, U., Schmidt, U., Tan, V., Tuitjer, F., Woyke, T., and Schiller, C.: Fast in situ stratospheric hygrometers: A new family of balloon-borne and airborne Lyman alpha photofragment fluorescence hygrometers, J. Geophys. Res., 104, 1807–1816, https://doi.org/10.1029/1998jd100025, 1999.