the Creative Commons Attribution 4.0 License.
the Creative Commons Attribution 4.0 License.
 | 10 Jul 2020
Marine productivity and synoptic meteorology drive summer-time variability in Southern Ocean aerosols
Joel Alroe
Luke T. Cravigan
Branka Miljevic
Graham R. Johnson
Paul Selleck
Ruhi S. Humphries
Melita D. Keywood
Scott D. Chambers
Alastair G. Williams
Zoran D. Ristovski
Cloud–radiation interactions over the Southern Ocean are not well constrained in climate models, in part due to uncertainties in the sources, concentrations, and cloud-forming potential of aerosol in this region. To date, most studies in this region have reported measurements from fixed terrestrial stations or a limited set of instrumentation and often present findings as broad seasonal or latitudinal trends. Here, we present an extensive set of aerosol and meteorological observations obtained during an austral summer cruise across the full width of the Southern Ocean south of Australia. Three episodes of continental-influenced air masses were identified, including an apparent transition between the Ferrel atmospheric cell and the polar cell at approximately 64∘ S, and accompanied by the highest median cloud condensation nuclei (CCN) concentrations, at 252 cm−3. During the other two episodes, synoptic-scale weather patterns diverted air masses across distances greater than 1000 km from the Australian and Antarctic coastlines, respectively, indicating that a large proportion of the Southern Ocean may be periodically influenced by continental air masses. In all three cases, a highly cloud-active accumulation mode dominated the size distribution, with up to 93 % of the total number concentration activating as CCN. Frequent cyclonic weather conditions were observed at high latitudes and the associated strong wind speeds led to predictions of high concentrations of sea spray aerosol. However, these modelled concentrations were not achieved due to increased aerosol scavenging rates from precipitation and convective transport into the free troposphere, which decoupled the air mass from the sea spray flux at the ocean surface. CCN concentrations were more strongly impacted by high concentrations of large-diameter Aitken mode aerosol in air masses which passed over regions of elevated marine biological productivity, potentially contributing up to 56 % of the cloud condensation nuclei concentration. Weather systems were vital for aerosol growth in biologically influenced air masses and in their absence ultrafine aerosol diameters were less than 30 nm. These results demonstrate that air mass meteorological history must be considered when modelling sea spray concentrations and highlight the potential importance of sub-grid-scale variability when modelling atmospheric conditions in the remote Southern Ocean.
- Article
(3531 KB) -
Supplement
(1493 KB) - BibTeX
- EndNote


Aerosols have an important role in radiative forcing both through direct absorption and scattering of incident solar radiation and through their indirect effects on cloud formation, structure, and lifetime (Haywood and Boucher, 2000; Albrecht, 1989). However, they have been identified as the largest source of uncertainty in the global radiation budget (Myhre et al., 2013). Oceans cover 70 % of the Earth's surface, and thus aerosols within the marine environment are of particular importance for climate models. To illustrate this, Rosenfeld et al. (2019) recently proposed that 75 % of the uncertainty in the cooling effect of marine boundary layer (MBL) clouds may be associated with the influence of aerosols on cloud area and lifetime. General circulation models exhibit persistent biases in the levels of cloud-based radiative forcing estimated for the Southern Ocean, with insufficient reflected shortwave radiation particularly occurring behind cold fronts and during the austral summer (Williams et al., 2013; Protat et al., 2017).
The Southern Ocean receives minimal anthropogenic influence, so the relatively pristine conditions offer a valuable opportunity to investigate the interlinked atmospheric and oceanic processes that govern the natural marine environment. The main sources of aerosol to the Southern Ocean boundary layer are well known and include sea spray aerosol (SSA) generated from wind shear and bubble bursting, non-sea salt sulfates (nss-SO4) formed from the condensation of volatile biogenic precursor gases, and the long-range transport of anthropogenic shipping emissions or continental aerosols from the surrounding land masses. However, due to its vast extent and the logistical challenges involved with performing in situ measurements in such remote and harsh conditions, observations from this region are very limited. To address this gap, recent years have seen a surge in sampling expeditions (e.g. Fossum et al., 2018; O'Shea et al., 2017; Stephens et al., 2018; Protat et al., 2017; Schmale et al., 2019; Dall'Osto et al., 2017; Humphries et al., 2016) with a focus on quantifying the aerosol production sources in this region and their contribution to cloud condensation nuclei (CCN).
The Southern Ocean represents a wide band of open ocean that encircles the globe between approximately 40 and 70∘ S and is largely uninterrupted by land masses. Its location, straddling the transition between the Ferrel and polar atmospheric circulation cells, gives rise to a relentless eastward procession of cyclonic low-pressure systems, which particularly develop in the southern Indian Ocean and to the south of Australia (Simmonds et al., 2003). Their associated high wind speeds and wave heights promote the generation of SSA, which contributes a major fraction of the global aerosol mass loading (Vignati et al., 2010).
SSA is composed of an internal mixture of inorganic salts and biogenic organic material (Cravigan et al., 2020; Ault et al., 2013). Typically it forms coarse-mode aerosol with mean diameters in the range of approximately 200–500 nm (Quinn et al., 2017; Lewis et al., 2004), although substantial number concentrations have been observed at smaller sizes, containing enhanced organic fractions (Andreae and Rosenfeld, 2008). Due to both their size and hygroscopic nature, these aerosols are highly effective CCN, rapidly adsorbing water to activate as cloud droplets when exposed to relatively low water supersaturations (SS). These same properties limit their lifetime in the marine boundary layer, leading to relatively low number concentrations. In turn, they often represent a small fraction of total CCN concentrations. However, recent studies from the Southern Ocean have reported significant and varied SSA contributions to CCN number concentrations of between 19 % and 32 % at 0.15 % SS (Schmale et al., 2019), up to 65 % at 0.1 % SS (Quinn et al., 2017), and 60 %–100 % at <0.32 % SS (Fossum et al., 2018). These inconsistent and widely spread results illustrate the need for further investigation into the causes of this variability.
In addition to tempestuous atmospheric conditions, the Southern Ocean also hosts extensive upwelling of nutrient-rich waters along the Antarctic coastline and the Antarctic Convergence. The high levels of biological activity in these locations generate an increased flux of dimethyl sulfide (DMS) into the atmosphere, with the potential for increased production of nss-SO4 or methanesulfonic acid aerosol (Simpson et al., 2014). This nss-SO4 production depends significantly on precursor concentrations and favourable meteorological conditions (Bianchi et al., 2016), while the resulting size distribution of nss-SO4 aerosol is affected by the surface area concentration of other aerosols that can act as condensation sinks (O'Dowd and de Leeuw, 2007). In both the tropics and the Southern Ocean, cloud-based convective transport of air masses into the free troposphere has been shown to result in new particle formation (NPF) (Clarke et al., 1998; Williamson et al., 2019). The colder air temperatures of the free troposphere promote partitioning into the aerosol phase, while the in-cloud wet scavenging of CCN removes competing condensation sinks. Depending on the precursor concentrations, when entrained back into the MBL in the cloud outflow regions, these newly formed aerosols can greatly increase nucleation or even Aitken mode aerosol number concentrations. Conversely, if meteorological conditions do not support this convective transport and removal of condensation sinks, any nss-SO4 is more likely to partition to existing aerosol, increasing the mean size of the aerosol distribution.
The strong weather systems present in the Southern Ocean could be expected to promote NPF. In support of this, Fossum et al. (2018) reported Aitken mode number concentrations that were substantially higher than the accumulation mode in characteristic Southern Ocean air masses, while the reverse was true for air masses from the Antarctic continent. Conversely, Dall'Osto et al. (2017) and Humphries et al. (2016) both reported episodes of nucleation mode aerosol concentrations that were 3 times higher within the sea ice zone than from the open ocean. In the latter case, the air mass originated in the Antarctic free troposphere and, as such, the precursor source was not immediately apparent. Throughout two-thirds of their circumnavigation of Antarctica, Schmale et al. (2019) observed slightly higher aerosol number concentrations for aerosol with diameters smaller than 80 nm. However, since the observations were averaged across each leg of the voyage, it is difficult to directly examine the impact of changes in air mass or meteorological conditions.
These discrepancies do not stop at physical observations. Current global climate models operate over spatial grids that can span hundreds of kilometres per grid box and sub-grid variability within these boxes can significantly limit the accuracy of the model, particularly for aerosol parameters such as CCN (Lin et al., 2017; Weigum et al., 2016). Given the highly dynamic conditions within the Southern Ocean and the limited and sometimes conflicting observations reported to date, further investigation is required to identify the main factors contributing to aerosol variability.
This study presents in situ aerosol and meteorological measurements from the Cold Water Trial (CWT) voyage in the austral summer over a full latitudinal transect of the Southern Ocean, between Hobart, Australia, and the marginal ice zone. To our knowledge, it represents the first comprehensive dataset focused on this region of the Southern Ocean. We examine characteristic changes in the aerosol number size distribution and identify air masses or aerosol sources that likely contributed to these changes. In particular, we examine the variation in CCN concentrations between each air mass and investigate the contributing sources. Several episodes of long-range transport of continental aerosol are identified. Ultimately, we show that synoptic-scale weather systems both directly and indirectly have an important influence on aerosol properties by promoting or inhibiting SSA and secondary aerosol generation.
2.1 Voyage overview
The measurements were conducted during the first voyage of RV Investigator into polar waters, over a 3-week period from January to February 2015. The ship travelled southward from Hobart to the marginal ice zone, primarily along the 146th line of longitude, reaching a maximum latitude of 65∘ S before returning along a similar course (Fig. 1). Aerosol sampling was performed through a common sampling inlet mounted on a mast, located approximately 18 m above sea level at the bow of the ship and co-located with a suite of meteorological instruments. Sample air was drawn through this inlet at a flow rate of approximately 420 L min−1. The sample passed through a 161.5 mm stainless steel tube to a manifold in the bow of the ship, 8 m below the mast in the ship's bow. Most aerosol instruments sampled from this manifold through stainless steel tubing. The remaining flow was passed through a 32 mm stainless steel tube to a manifold in a second laboratory and the ACSM sampled from this secondary manifold through stainless steel tubing.

Figure 1Voyage track (red line) of RV Investigator during the CWT voyage. The colour scale represents the mean chlorophyll a concentrations for February 2015, derived from MODIS satellite images. A logarithmic scale has been used and has been limited to the range 0.03–7 mg m−3 to enhance visual detail. White regions represent unavailable data due to sea ice or persistent cloud cover, and a region of high marine biological activity has been marked in the vicinity of the Kerguelen Plateau.
Additional details regarding this ship and its sampling facilities are discussed in Humphries et al. (2019). As this was a trial voyage of a new research vessel, navigational records are unavailable for several periods of up to 18 h. Location coordinates were interpolated assuming a constant ship velocity throughout these times.
2.2 Primary in situ measurements
Aerosol size distributions were measured over the diameter range 4–673 nm with two TSI 3080 Scanning Mobility Particle Sizers (SMPS). One was configured with a TSI 3085 Nano Differential Mobility Analyser (DMA) and a TSI 3776 Ultrafine Condensation Particle Counter (CPC), while the other used a TSI 3081 Long DMA and TSI 3010 CPC. The combined sample flow rate was 2.5 L min−1 and was dried with a membrane dryer (Nafion MD-700) upstream of both instruments. Size distributions were obtained with a time resolution of 5 min.
For comparison, a Neutral Cluster and Air Ion Spectrometer (NAIS) was used to obtain size distributions of ultrafine aerosol with diameters between 2 and 42 nm. The lower size limit offered by this instrument makes it well suited for observing aerosol nucleation events and any subsequent growth of the newly formed aerosol into the Aitken size range. The NAIS was operated with a 4 min time resolution and a sample flow rate of 60 L min−1 to minimise diffusional losses. No sample drying was applied for this instrument due to the high flow rate.
CCN concentrations were measured with a Droplet Measurement Technologies single growth column CCN counter (model CCN-100), operated at a SS of 0.5 %. For comparison, total number concentrations (N10) of aerosol with diameters larger than 10 nm were measured with a TSI 3772 CPC.
Chemical analysis of non-refractory submicron aerosol was generated by an Aerodyne Time of Flight Aerosol Chemical Speciation Monitor (ACSM) and a full description of its design and operation is given in Fröhlich et al. (2013). An integrated Nafion membrane drier maintained the relative humidity at <40 % in the ACSM inlet. Measurements were averaged to a 1 h time resolution and a collection efficiency of 1 was applied to reflect high aerosol acidity observed throughout the voyage. The instrument's size-dependent inlet transmission is at a maximum for vacuum aerodynamic diameters between 100 and 450 nm (Jayne et al., 2000; Liu et al., 2007), and therefore the composition measurements best represent primary marine aerosol and accumulation mode aerosol. SSA can be challenging to quantify from ACSM measurements. Most compounds present in SSA are refractory and are not efficiently vaporised in the ACSM. Since NaCl is typically the most abundant compound, Ovadnevaite et al. (2012) demonstrated that the NaCl+ ion signal could be used to estimate sea salt mass concentrations by applying a scaling factor of 51. The same scaling factor has been used in this study since there were no independent measures of sea salt mass concentration and the ACSM was not calibrated against sea salt or a NaCl laboratory standard. In Sect. 3.3, as an alternate evaluation of the scaling factor, the resulting sea salt concentrations have been contrasted against modelled values derived from wind speed.
2.3 Supporting measurements
Black carbon (BC) and carbon monoxide (CO) concentrations were measured with a Thermo Fisher Scientific 5012 Multi-Angle Absorption Photometer (MAAP) and an Aerodyne Research Inc. infrared Laser Trace Gas Monitor, respectively. The trace gas monitor was not adequately calibrated and, on average, the CO measurements were 19±5 ppb higher than the estimated reference concentrations given by the Global Greenhouse Gas Reference Network (GLOBALVIEW-CO, 2009). This indicates that the measurements were not quantitatively accurate, but correlations between BC and CO were examined when identifying periods contaminated by ship emissions. Atmospheric radon concentrations were obtained from a 700 L dual-flow-loop two-filter radon detector, described in Chambers et al. (2018), providing a signature of air masses that have passed over land. Sea surface chlorophyll a (Chl a) concentrations were sourced from the MODIS-Aqua Level-3 Binned dataset maintained by the NASA Goddard Space Flight Center Ocean Biology Processing Group (OBPG, 2018). These represent monthly-average sea surface concentrations at 4 km spatial resolution.
Seven-day backward air mass trajectories were estimated using the HYSPLIT Lagrangian dispersion model (Stein et al., 2015). The modelled trajectories were based on Global Data Assimilation System (GDAS) meteorological data, gridded at a 1∘ spatial resolution. Back trajectories were obtained for each hour of the voyage, and associated parameters were recorded, including surface Chl a, rainfall, and air mass altitude relative to the boundary layer mixing height (e.g. Fig. S1 in the Supplement). The accuracy of these back trajectories is inherently restricted by the accuracy of the model and the limited spatial and temporal resolution of the underlying meteorological data. In light of this, ensembles of 27 trajectories have been obtained for each hour of the voyage. The HYSPLIT modelling system generates ensembles by applying spatial offsets to the meteorology for each trajectory (Draxler, 2003). The offset is approximately 250 m in the vertical direction, so all trajectories were propagated from this initial altitude above sea level. The median boundary layer depth was 1200 m along the voyage track, so it has been assumed that trajectories initiated at an altitude of 250 m offer a reasonable representation of the air masses sampled at the ship, within the limitations of the model. For each ensemble, all associated parameters were averaged at each time step along the back trajectory as a best estimate of the air mass position and conditions. In support of the back trajectories and for identification of synoptic weather systems, mean sea level pressure charts were accessed from the Australian Bureau of Meteorology weather maps archive.
3.1 Identification of ship emissions
Due to the position of the sampling inlet at the bow of the ship, gas- and particle-phase measurements were excluded where wind directions were from the rear of the ship, defined as between 120 and 240∘ relative to the ship's heading. Further contamination from ship exhaust was identified by applying a 1 h rolling mean to the BC concentrations. At this time resolution, the MAAP had a nominal detection limit of 8 ng m−3 and clean marine air masses often exhibited concentrations below this limit (Fig. 2c). Since the aim of this study was to assess the characteristic air masses present in the Southern Ocean, data were excluded where the 1 h mean concentration was above 30 ng m−3, where the 1 min BC concentration was above 150 ng m−3, or where the air mass back trajectories crossed the ship's path and may have captured its plume. Other studies have reported BC concentrations from Southern Ocean air masses that range between 1 and 70 ng m−3 (Cravigan et al., 2015; Kim et al., 2017; Humphries et al., 2019; Schmale et al., 2019). Therefore, the selected limit was well within this range and allowed periods associated with long-range transport of continental air masses to be retained while minimising local contamination from the ship. After applying the above thresholds, the remaining BC measurements were manually assessed for correlation with radon and CO, which were treated as proxies for continental emissions and local combustion, respectively.
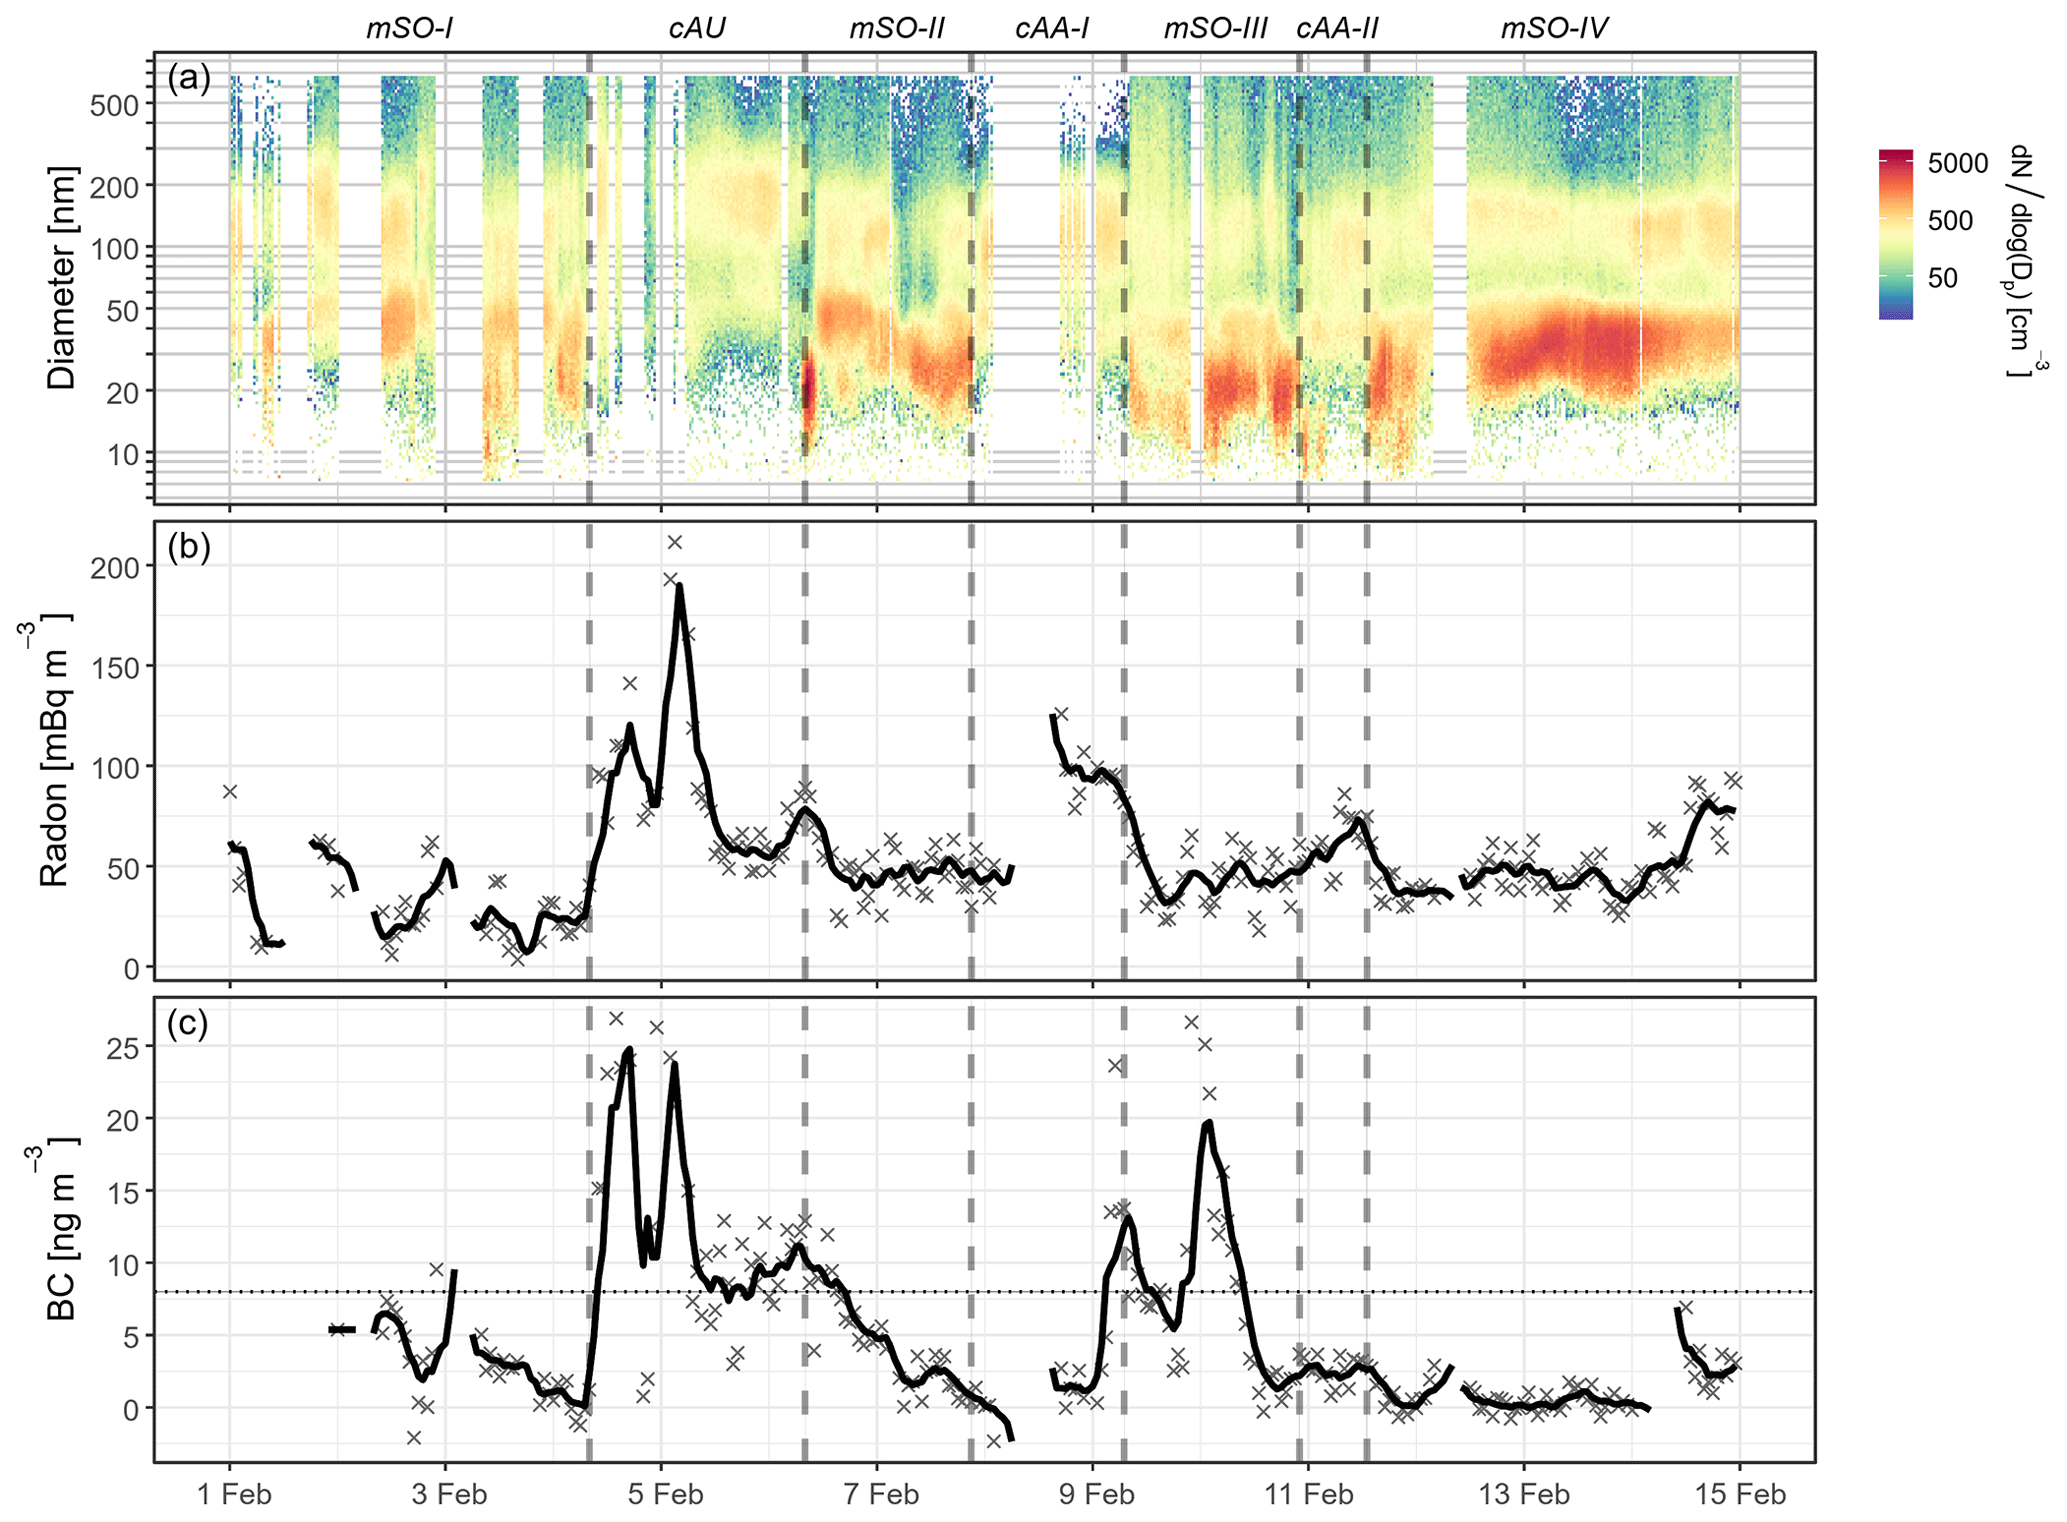
Figure 2Time series of (a) aerosol size distributions, (b) atmospheric radon concentrations, and (c) BC concentrations throughout the Cold Water Trial voyage. Periods influenced by different air masses are labelled and delimited by dotted lines. Blank regions represent periods of instrument maintenance or contamination from ship emissions which have been excluded from analysis. The smoothed black lines in panels (b) and (c) represent rolling 6 h averages to assist in identification of temporal trends. Periods influenced by ship emissions have been removed from the BC concentrations and the dotted horizontal line gives the BC detection limit of 8 ng m−3.
3.2 Particle diameter mode fits
After removing ship-contaminated measurements, the remaining distributions often exhibited local minima at 30 and 80 nm, separating peaks corresponding to the nucleation, Aitken, and accumulation modes. A modified version of the log-normal mode fitting scheme discussed in Modini et al. (2015) was applied to the 1 h average particle size distributions. Up to three log-normal modes were fitted using the above minima as bounds for the respective means and their spread was limited to the range 1.1–1.7, or 1.1–1.5 for the nucleation mode. At diameters <7 nm the distributions became persistently noisy due to low particle counts, while at diameters >300 nm the distributions were often broadened by contributions from SSA. These diameter ranges were excluded from the fitting process.
SSA is generated through multiple production pathways that lead to a very broad range of diameters, extending from ultrafine (Cravigan et al., 2015) to supermicron-sized aerosol (Grythe et al., 2014). The resulting distribution can be approximated with a single broad characteristic SSA mode (Quinn et al., 2017). To avoid bias from other non-SSA, this mode is often fitted to the tail of the aerosol size distribution at diameters >500 nm. In this study, size distributions only extended to a maximum diameter of 673 nm. The SSA mode could not be adequately constrained by this narrow range of diameters. Therefore, the other fitted modes likely contain some proportion of SSA and represent an upper bound on their true contribution to the aerosol distribution.
The mode fitting was performed using the “minpack.lm” non-linear least squares minimisation package in the R software environment (Scrucca et al., 2016). In each case, the number of fitted modes was selected using the Bayesian information criterion, an estimator of model accuracy that penalises the complexity of the model to avoid overfitting.
In some cases, the fitted nucleation mode became sufficiently broad or exhibited mean diameters that prevented meaningful separation of the Aitken and nucleation modes. In these cases, both modes were combined and assigned to the nucleation or Aitken mode, dependent on whether the combined peak diameter was larger or smaller than 30 nm. In this study, both modes will be collectively termed ultrafine aerosol when distinguishing them from accumulation mode aerosol or SSA.
As will be discussed in Sect. 4.2, the volume concentration of the Aitken mode aerosol can be a useful predictor of their contribution to CCN0.5 % number concentrations. At the Aitken size range, aerosol number concentrations are poorly correlated with CCN because CCN activation potential is strongly dependent on particle size (Dusek et al., 2006). In contrast, the aerosol volume concentration weights the number concentration with a cubic dependence on particle diameter, devaluing contributions from small diameter aerosol that are less likely to have a role as CCN. These volume concentrations were determined by integrating over both the Aitken and nucleation modes in the number size distribution, assuming spherical-shaped aerosol. The nucleation mode was included to account for the periods when the two modes could not be adequately separated but where their combined mode extended into CCN-relevant sizes.
3.3 Evaluation of SSA measurements
There were no independent measures of sea salt mass concentration and the ACSM was not calibrated against laboratory standards for this species. So to evaluate the suitability of the NaCl+ scaling factor (see Sect. 2.2), the sea salt mass concentrations were estimated using the sea salt source function given by Ovadnevaite et al. (2012). This source function was developed based on measurements from an Aerodyne High Resolution Time of Flight Aerosol Mass Spectrometer, employing the same approach for scaling the NaCl+ signal. While the ACSM does not share the same resolution, the two instruments are otherwise highly similar, making this source function the most ideally suited for comparison with the ACSM measurements.
The source function depends on the sea-surface mass flux of submicron sea salt in ng m−2, given as a function of wind speed (U10) at 10 m above sea level and for U10≥3.7 m s−1. At wind speeds below this limit, the flux is assumed to be zero due to a lack of whitecapping (Callaghan et al., 2008).
Ovadnevaite et al. (2012) observed decreased sea salt fluxes during periods of increasing wind speeds and increased flux for decreasing wind speeds. As a result, the authors presented separate wind-dependent flux parameterisations for each case and the following parameterisation based on the total dataset with no differentiation between increasing or decreasing wind speed:
The resulting submicron sea salt mass concentration (CSS) was then given by
HMBL is the marine boundary layer height in metres, and t is the filling time in seconds. Ovadnevaite et al. (2012) found that a 2 d filling time gave the best agreement. This reflected the approximate frequency of passing synoptic systems or changes in air mass observed during the CWT cruise, so in this study the filling time was taken to be the time since the air mass last subsided from the free troposphere into the MBL prior to reaching the ship, up to a maximum of 48 h. Over the same time interval, U10 was taken to be the surface wind speed at each hour along the air mass trajectory, to reflect the wind conditions where the aerosol production was taking place.
The sea salt concentrations modelled with Eq. (1) overpredicted the observed data in most cases but broadly reproduced many of the trends (Fig. S2). The worst predictions occurred when there was substantial rainfall during the 48 h fill time. In contrast, the best agreement was found during the final 3.5 d of the cruise, where sea salt concentrations were high and air masses experienced stable dry conditions within the MBL for >48 h prior to reaching the ship. During this period, the modelled concentrations overpredicted the in situ measurements by 61 %, on average.
The sea salt flux parameterisation for decreasing wind speed was disregarded since it would have further inflated the model concentrations. Much better agreement was obtained using the parameterisation corresponding to increasing wind speeds, which overestimated the observed concentrations by only 13 %, on average (Fig. S2). Given this relatively close agreement during ideal conditions for SSA production, the modelled results offer support for the accuracy of the scaled sea salt measurements. Furthermore, it suggests that wind speeds in this region were increasing or variable, leading to an under-developed sea state with lower SSA production rates than would be expected for constant or decreasing wind speeds. This highlights the impact of air mass meteorological history and synoptic-scale weather conditions on SSA concentrations.
3.4 Classification of air masses
There were few instances of “steady-state” conditions in which the aerosol properties remained largely unchanged over extended periods of time. However, in several instances, the aerosol size distribution became significantly biased towards either the Aitken or accumulation mode, and the modal diameters abruptly shifted. The rapid onset of these changes suggested a change in air mass origins. The likely sources of these distinct air masses or aerosol production sources were investigated by examining the corresponding air mass back trajectories, radon concentrations, and the associated aerosol chemical composition.
4.1 General observations
Throughout the voyage, the median air and sea surface temperatures were 4.7 ∘C (IQR: 2.9–8.7 ∘C) and 3.9 ∘C (IQR: 2.6–8.9 ∘C), respectively. Median wind speeds observed at the ship were 12.0 m s−1 (IQR: 9.5–13.9 m s−1) and frequent synoptic-scale weather systems were observed passing the ship throughout the voyage, particularly at latitudes south of 50∘ S.
As shown in Fig. 1, the sea surface Chl a concentrations indicated several regions of elevated biological productivity in this sector of the Southern Ocean. The most intense concentrations were localised along the Antarctic coastline; however, significantly elevated concentrations were also located near the Kerguelen Plateau. This is an underwater volcanic plateau in the vicinity of the Kerguelen, Heard, and McDonald islands that acts as a hotspot for marine biological activity during the austral summer months.
Throughout the voyage, CCN0.5 % concentrations were strongly variable (Fig. S3b), with an overall mean of 189±65 cm−3. To examine the sources of this variability, it is helpful to consider the particle size distributions shown in Fig. 2a. The highest total aerosol number concentrations and the greatest number contributions from Aitken and nucleation mode aerosol were typically associated with maritime Southern Ocean (mSO) air masses. These periods were often characterised by long fetches over the open ocean to the south-west and radon concentrations that averaged 43±17 mBq m−3, in good agreement with the Southern Ocean background concentration of 50 mBq m−3 given in Chambers et al. (2018).
Table 1Physical properties observed for the three air mass classifications, including continental Antarctic (cAA), continental Australian (cAU), and maritime Southern Ocean (mSO). The values represent the median for each air mass, with the interquartile range provided in parentheses.
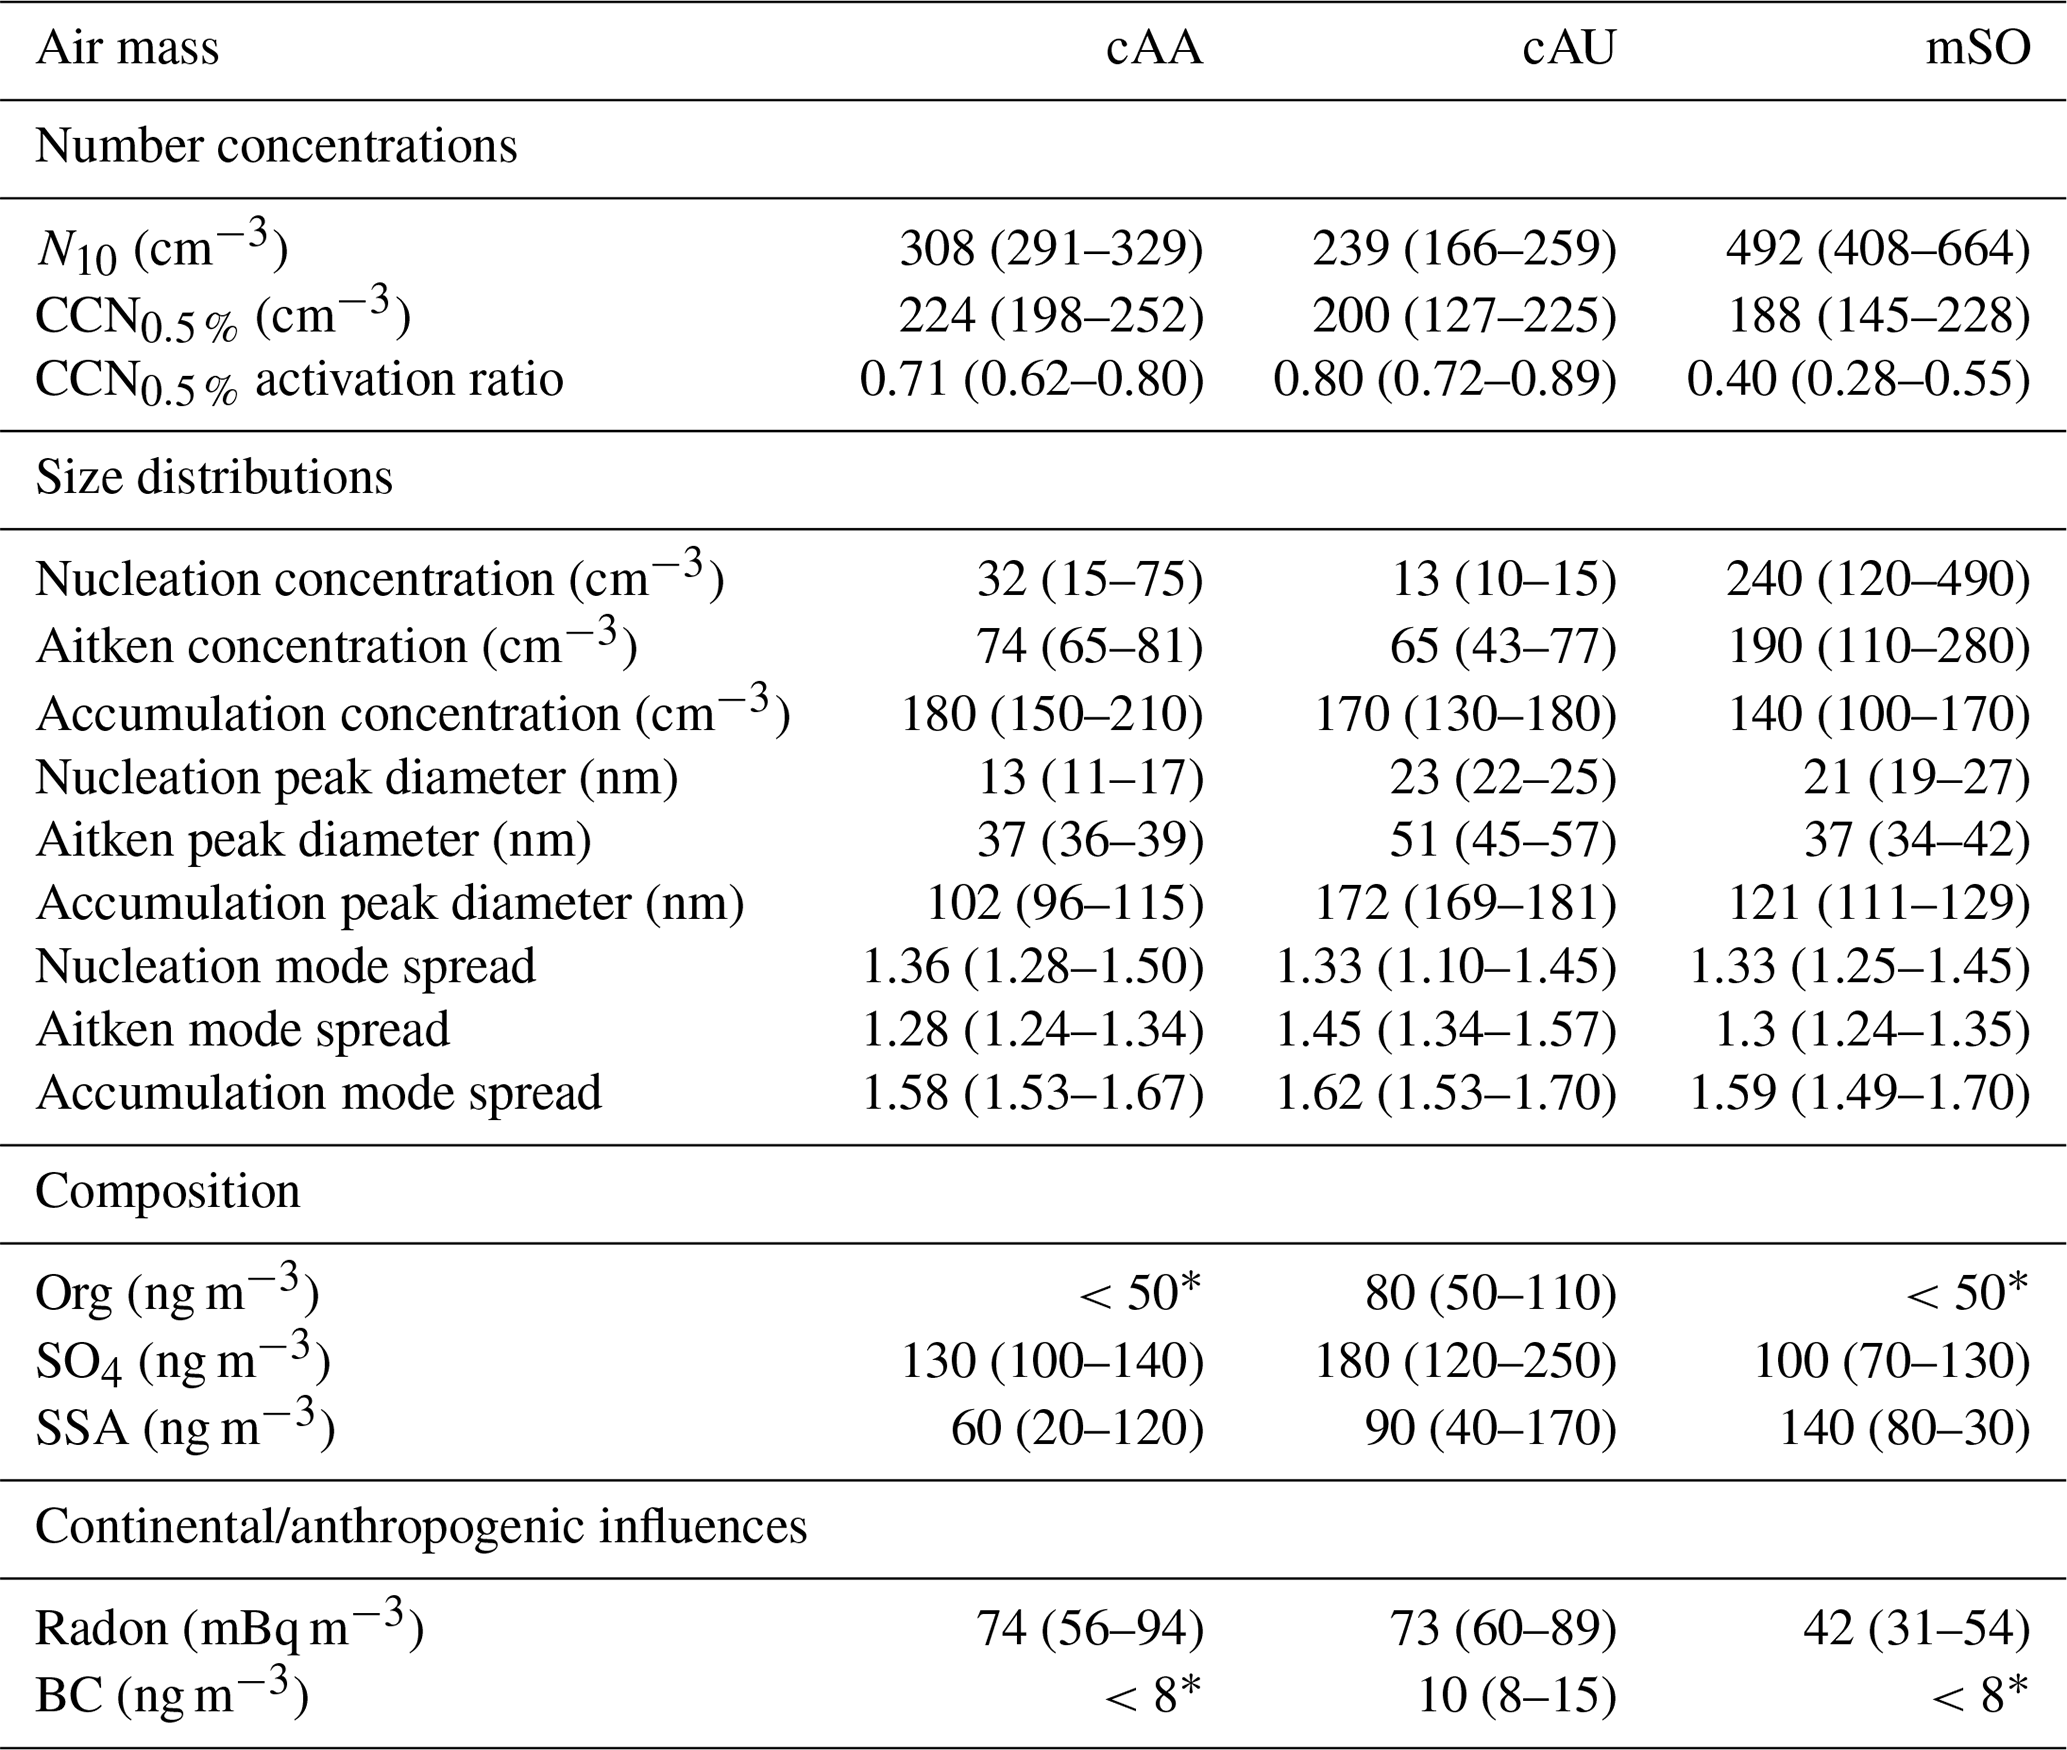
∗ Below detection limit.
The long south-westerly fetches were frequently disrupted by the passage of synoptic and mesoscale weather systems. This was notably observed on 4–6, 8–9, and 11 February. On all three occasions, the aerosol number concentrations decreased, the size distributions became biased towards the accumulation mode, and radon concentrations increased above the marine background (Fig. 2). Air mass trajectories and radon concentrations indicated that the first period was influenced by continental and coastal Australian air masses (cAU), while the latter two received air masses from continental Antarctica (cAA). Aerosol properties observed from each air mass are shown in Table 1. They are further subdivided into discrete episodes for each air mass in Table S1 and are discussed in more detail in the following sections.
4.2 Characteristics of the mSO air mass
Across the four mSO sampling periods, the mean N10 concentration of 540±200 cm−3 was almost double the concentrations observed from the continental air masses. Schmale et al. (2019) reported a similar relative change in number concentration between measurements in the mid-latitudes of the Southern Ocean and those taken close to the Antarctic continent during the ACE-SPACE circumnavigation of Antarctica. The difference was driven by substantially higher Aitken and nucleation mode fractions, as shown in Fig. 3. On average, 57 % of non-SSA in the mSO air mass was attributed to the nucleation mode, and this increased to over 90 % during a brief intense burst of nucleation mode aerosol on 6 February 2015. The marine nucleation and Aitken mode aerosol concentrations were highly variable, rarely remaining constant for more than a few hours at a time (Fig. 4). The NAIS particle spectra did not reveal any instances of newly formed sub-10 nm particles growing into the nucleation range, so the NPF events must have occurred some distance from the ship. At a mean of 26 nm, nucleation mode aerosols were typically at least twice as large as in the continental air masses, at times transitioning into the Aitken size range (Fig. S3) and suggesting a greater availability of aerosol precursors during NPF events or increased condensational growth associated with these marine air masses.
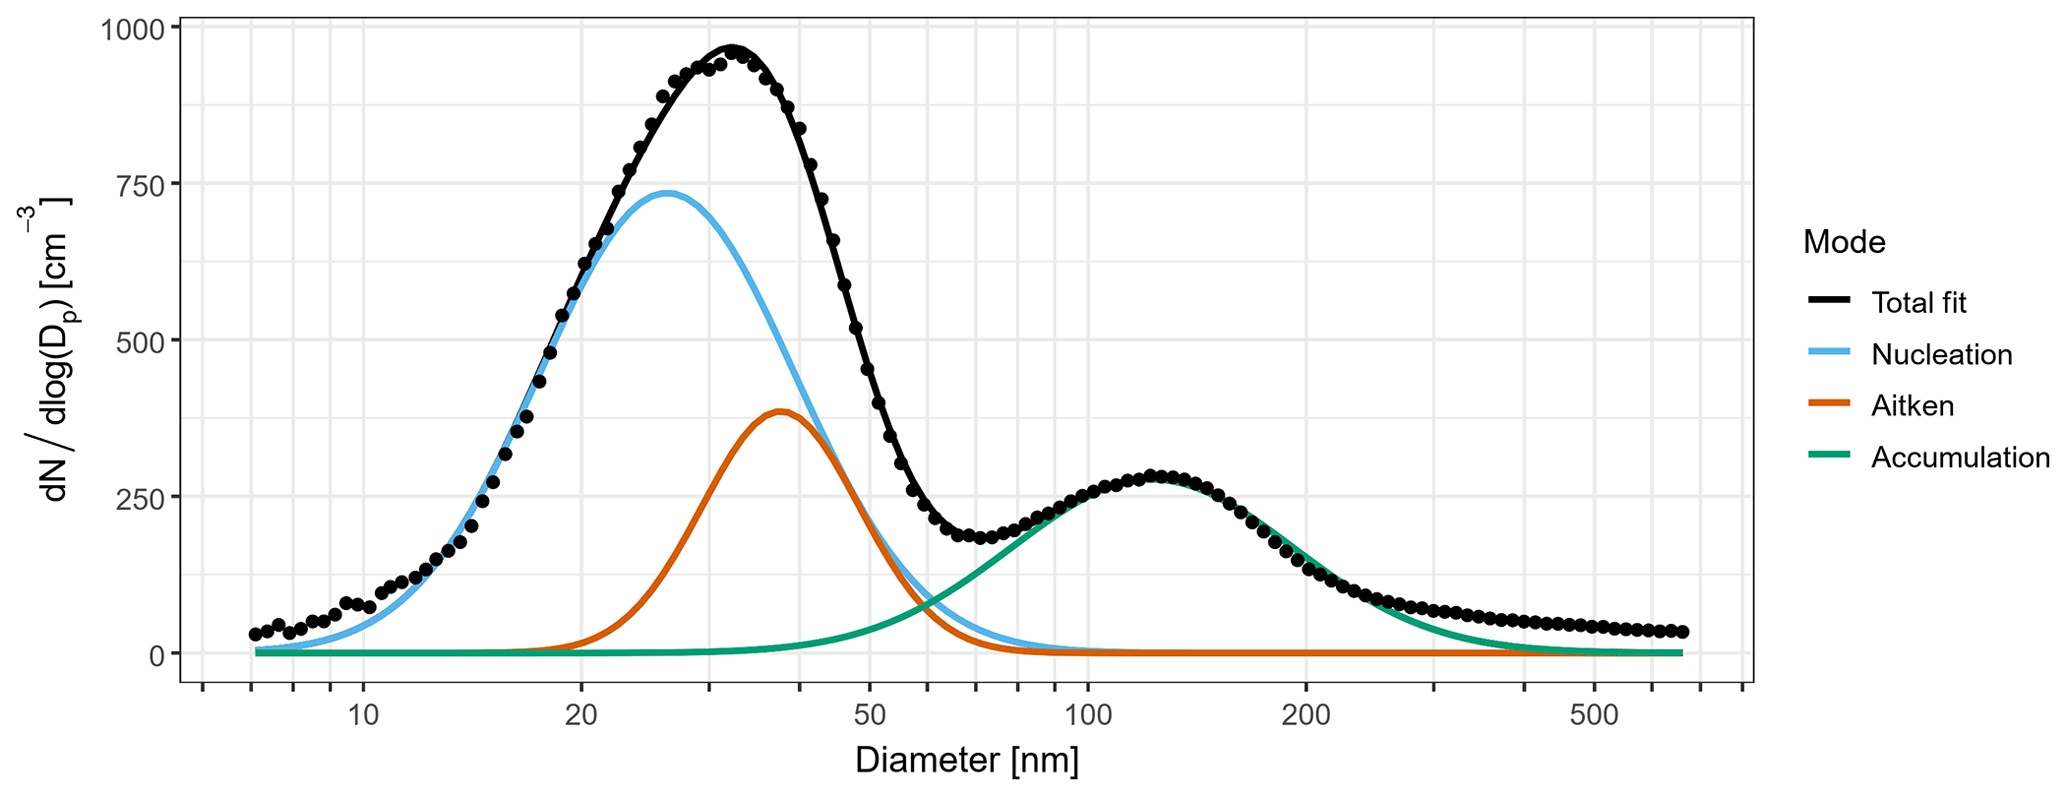
Figure 3Mean number size distribution for sub-micron aerosol during periods of mSO air masses. The coloured lines are fitted log-normal distributions representing contributions from nucleation (blue), Aitken (brown), and accumulation (green) mode aerosol to the observed total size distribution (black points).
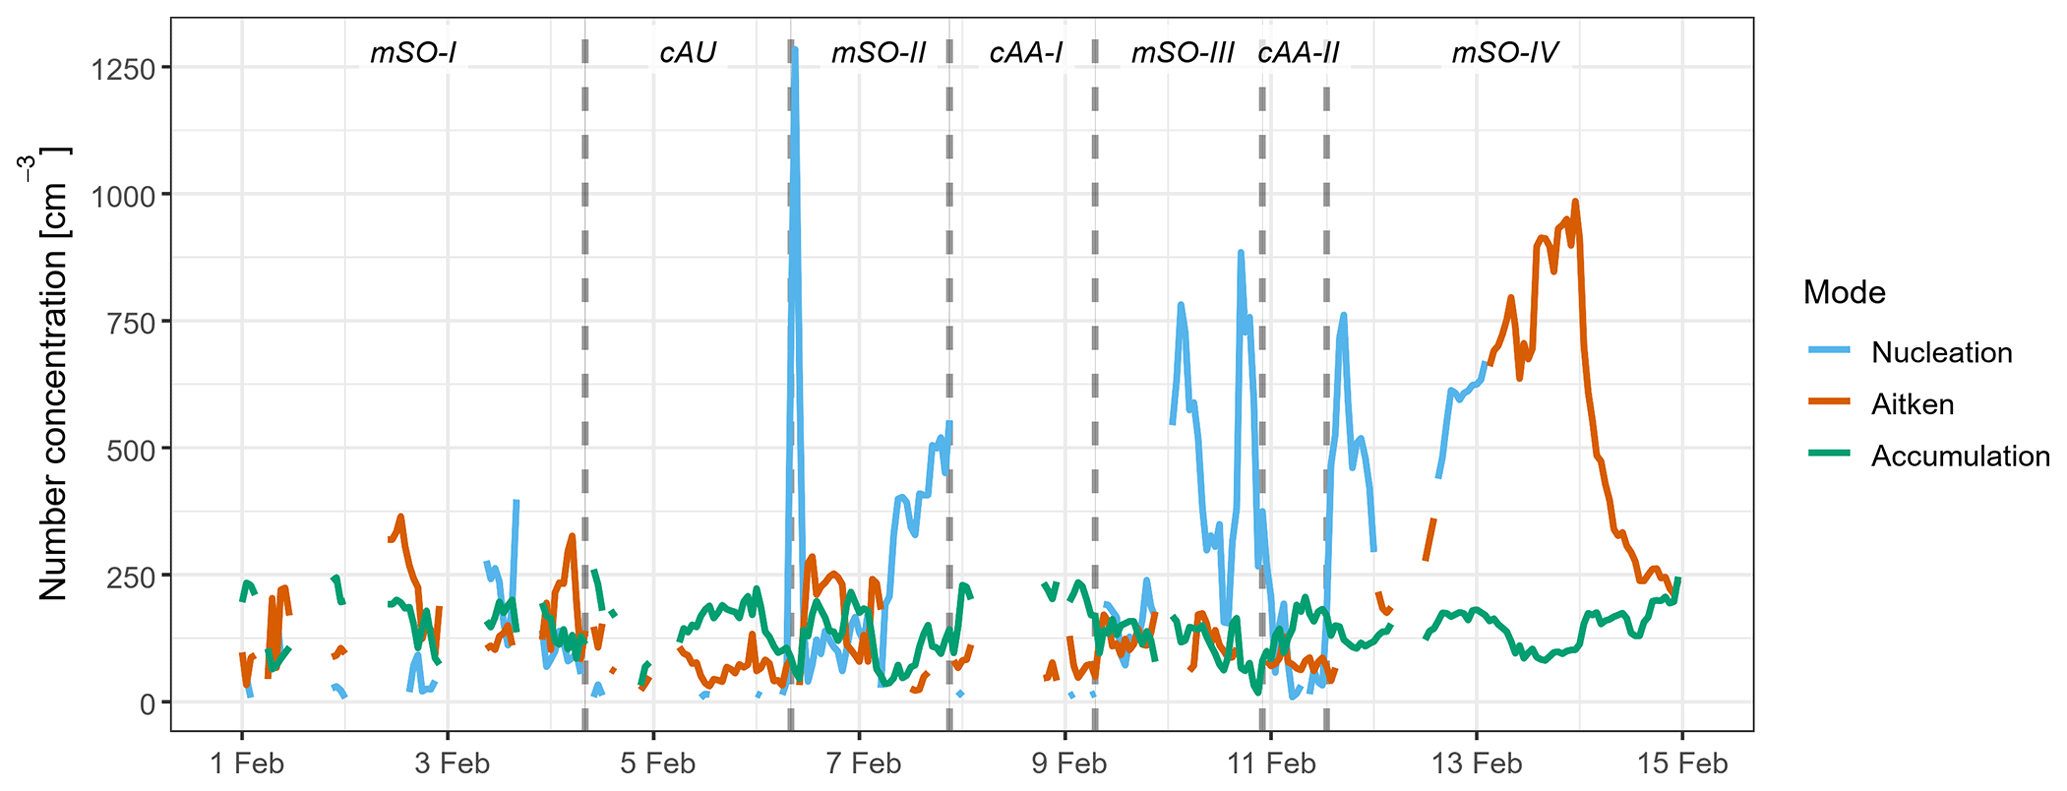
Figure 4Aerosol number concentrations in the nucleation (blue), Aitken (brown), and accumulation (green) modes, as derived from the fitted size distributions. Periods influenced by different air masses are labelled and delimited by dotted lines. Blank regions represent missing data due to contamination from ship emissions or instrument maintenance.
For comparison, similar short-lived sub-20 nm modes were reported by Covert et al. (1996) and Bates et al. (1998) during austral summer voyages in the Pacific and Australian sectors of the Southern Ocean, respectively. In the latter case, nucleation mode concentrations typically did not exceed those of the Aitken mode. However, their cruise did not extend to latitudes south of 55∘ S, and this reflects the latitudinal distribution of Aitken contributions observed during the CWT cruise. In contrast, during a concurrent cruise in 2015 through the Atlantic sector of the Southern Ocean, Fossum et al. (2018) did not observe a significant proportion of nucleation mode aerosol in most marine air masses and saw minimal variability in the Aitken mode diameter. Their analysis centred around periods of steady-state conditions and, as a result, may have excluded transient episodes of NPF and favoured air masses in which the aerosol population had undergone substantial cloud processing, leading to relatively invariant Aitken diameters.
4.3 Influences on marine CCN
CCN0.5 % concentrations were quite similar across the four mSO sampling periods, averaging 189±67 cm−3. The accumulation mode number concentrations were strongly correlated with CCN0.5 % (Pearson's correlation coefficient of 0.824, p value of ), explaining 68 % of the variability in CCN0.5 % in mSO air masses. The remaining variability can be attributed to fluctuations in SSA concentrations or contributions from Aitken mode aerosol with sufficiently large diameter to activate as CCN0.5 %. As discussed in Sect. 3.2 and 3.3, SSA number concentrations could not be adequately constrained, and so the observed sea salt mass concentration was used as a proxy. The contribution from Aitken mode aerosol depended on both the aerosol diameter and number concentration. Independently, these two parameters were poorly correlated with CCN0.5 %. The correlation was improved by combining them to give the ultrafine aerosol volume (Sect. 3.2), which was weighted towards aerosol sizes that were more likely to be CCN active.
After subtracting the accumulation mode contribution, the remaining CCN0.5 % were strongly correlated with sea salt mass concentrations during mSO-IV and, to a lesser extent, during mSO-III (Fig. 5). While both mSO-II and mSO-III shared similar correlation coefficients, the former period exhibited the widest range of non-accumulation mode CCN0.5 % and the narrowest range of sea salt concentrations, and therefore the apparent trend was not physically meaningful.

Figure 5Correlations between non-accumulation mode CCN0.5 % and sea salt mass concentrations derived from ACSM measurements. The point shapes represent the four periods affected by marine air masses, while the colour scale represents the corresponding volume concentrations of ultrafine aerosol. Pearson's correlation coefficients (and p values) were 0.169 (0.30), 0.495 (), 0.516 (), and 0.929 () for each air mass in chronological order.
The strong correlation observed for mSO-IV can be attributed to the fact that concurrent CCN0.5 % and sea salt measurements were only available during a brief 15 h window which coincided with the passage of a cold front across the path of the ship. During the 48 h prior to reaching the ship, the corresponding air masses experienced median wind speeds of up to 12.6 m s−1, leading to sea salt mass concentrations of up to 0.86 µg m−3. Similarly, a cold front passed the ship shortly before the start of mSO-III. During the initial 9 h of this sampling period, the 48 h median wind speeds reached as high as 15.6 m s−1, but the maximum observed sea salt mass was 0.62 µg m−3. The discrepancy between these two cases can be attributed to differences in rainfall history along the air mass trajectories, with 48 h rainfall totals that were up to an order of magnitude higher in mSO-III than mSO-IV (Fig. S4).
Comparing the two sampling periods more broadly, the mSO-III sampling period occurred at higher latitudes where weather systems are typically more frequent and intense. The mass-based source function predicted much higher sea salt concentrations than were observed throughout mSO-III (Fig. S2) due to persistently higher wind speeds, which reached a maximum of 19.4 m s−1. However, only 10 % of the air mass back trajectories for this period remained within the MBL, with rainfall rates <0.25 mm h−1 during the final 48 h prior to reaching the ship. By comparison, 83 % of the back trajectories met these requirements for mSO-IV, leading to much closer agreement between the modelled and observed concentrations.
Given that the mass-based source function was developed on the basis of steady-state SSA concentrations measured during periods of stable wind speeds, it is likely that the unfavourable conditions during mSO-III prevented the SSA from building towards the concentrations predicted by the model. Furthermore, these findings suggest at least 2 d of historical meteorology should be considered for each sampled air mass when estimating SSA production rates and concentrations over the Southern Ocean.
In contrast to SSA, the ultrafine aerosol volume concentrations were strongly correlated with the non-accumulation mode CCN during most mSO sampling periods, with a weaker response during mSO-III (Fig. 6). These strong correlations were driven by three episodes of particularly high ultrafine aerosol volume that occurred on 2, 6, and 13 February 2015 (Fig. S5a). The associated air mass trajectories were averaged for each episode and altitude profiles were generated to investigate the atmospheric conditions which lead to each event (Fig. S6).
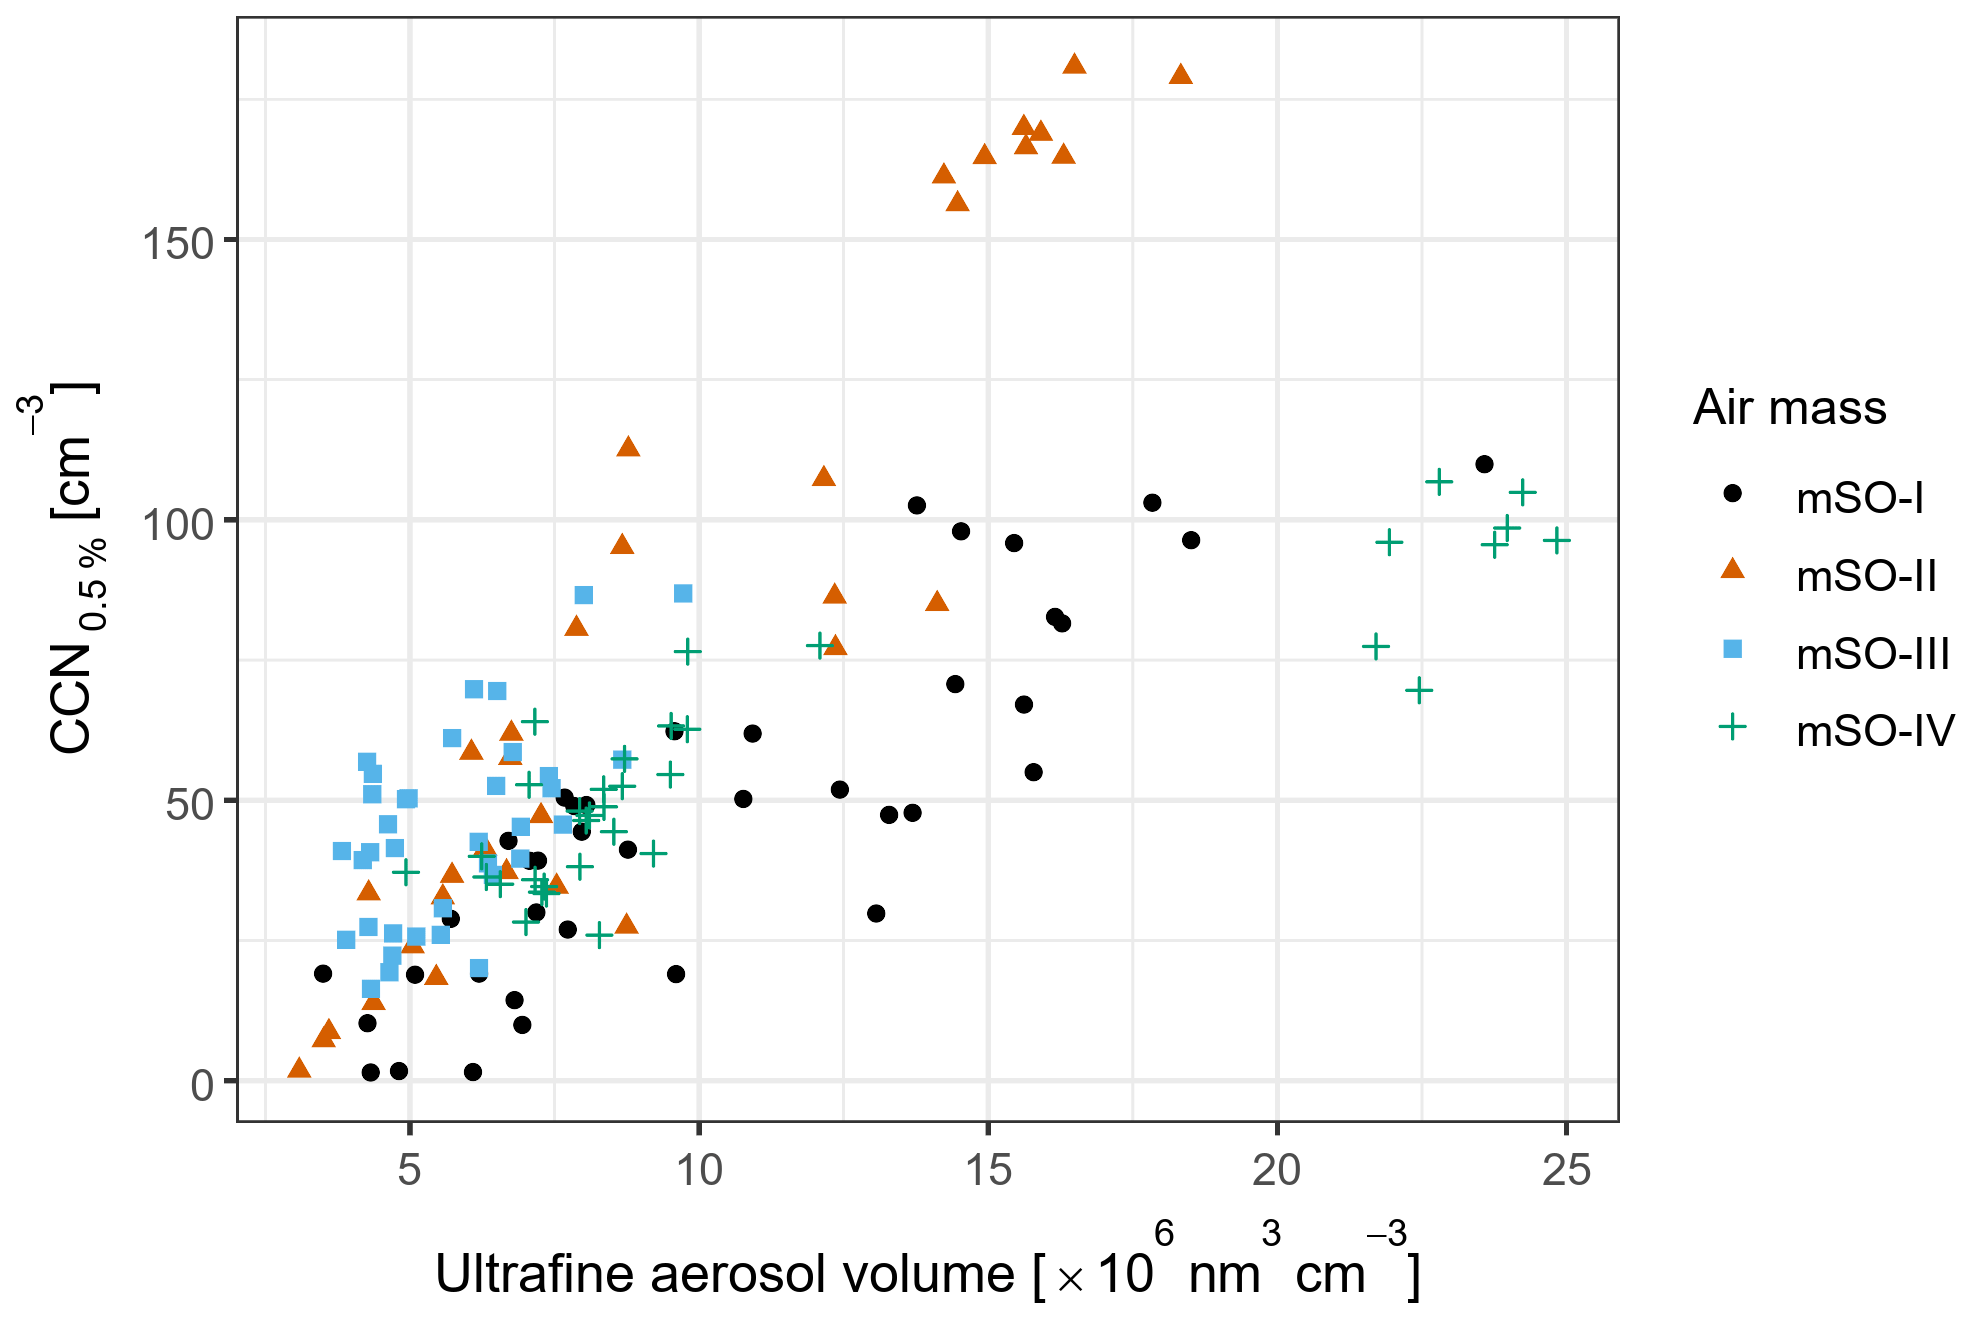
Figure 6Correlations between non-accumulation mode CCN0.5 % and total ultrafine aerosol volume concentration. The point shapes and colours represent the four periods affected by marine air masses. Pearson's correlation coefficients (and p values) were 0.888 (), 0.942 (), 0.580 (), and 0.888 () for each air mass in chronological order.
Each case was characterised by relatively low-altitude air masses which remained at an average of 240±80 m above sea level, facilitating the uptake of biogenic emissions from the ocean surface. They each spent at least 12 h above regions of increased biological productivity, indicated by ocean surface Chl a concentrations well above the regional mean of 0.24 mg m−3, before encountering cold fronts that strongly compressed the boundary layer. The intervening transport times between the biologically active regions and the frontal systems ranged from approximately 48 to 100 h, comparable to the estimated lifetime of DMS in the remote MBL (Langley et al., 2010; Barnes et al., 2006). The subsequent strong compression of the MBL likely increased the vapour pressures of DMS oxidation products, leading to increased condensational growth and the observed increases in the Aitken mode diameters.
Of these three episodes, the largest Aitken mode aerosols were observed on 6 February. Due to the passage of the front, the air masses were transported into the free troposphere, returning to the MBL less than 27 h prior to reaching the ship (Fig. S6d). During this time, rainfall rates peaked at 0.56 mm h−1. As a result, both observations and modelled estimates of sea salt mass concentration were low throughout this episode (Fig. S2), measured at an average of 0.13±0.05 µg m−3. Therefore, assuming minimal contribution to CCN0.5 % from SSA, Aitken mode aerosol contributed up to 181 cm−3 or 56 % of total CCN0.5 % during this period. For comparison, the highest SSA concentrations were observed on 12 February and were associated with non-accumulation mode CCN concentrations that increased to 77.6 cm−3 (Fig. S5b). Due to a coincident increase in ultrafine aerosol volume concentration, it is unclear how much of the increase in CCN0.5 % can be directly attributed to SSA. At most, SSA may have contributed 34 % of the total CCN0.5 %. This is consistent with the contribution from SSA at high latitudes as reported in Quinn et al. (2017) and supports their finding that nss-SO4 represents the dominant source of CCN0.5 % even in the remote Southern Ocean.
Air mass trajectories associated with the 6 February enhancement of the Aitken mode showed high sea surface Chl a concentrations in the vicinity of the Kerguelen Plateau (Fig. S6c). Strong peaks in nucleation mode aerosol concentrations, observed on 3, 7, and 10 February (Fig. 4), also coincided with air mass trajectories that passed over or close to the Kerguelen Plateau (e.g. Fig. S7). However, although they passed over similar concentrations of sea surface Chl a, they generally did so at almost twice the altitude of the air masses associated with Aitken mode aerosol and likely experienced lower flux rates of biogenic emissions. In addition, they did not encounter such pronounced compression of the MBL in a suitable timeframe after passing the high Chl a region and were not transported into the free troposphere at any point along the trajectory. As a result, it seems that they developed sufficient concentrations of nss-SO4 precursors to trigger NPF within the MBL, but could not support the same degree of condensational growth into the Aitken diameter range and therefore had negligible impact on CCN concentrations.
4.4 Continental and coastal Australian air masses (cAU)
The cAU air masses were encountered as the ship moved southward between 54.2 and 58.5∘ S. During this time, the back trajectories indicated air masses circulating around a persistent high-pressure system which was centred approximately 1000 km south of the Australian mainland (Fig. 8). Radon, BC, and organic aerosol concentrations initially rose above the marine background level (Figs. 2 and S8), peaking at hourly means of 220 mBq m−3, 0.027 µg m−3, and 0.18 µg m−3, respectively. The interpretation of this elevated radon concentration has been discussed in detail by Chambers et al. (2018), and it suggests that the air mass was influenced by terrestrial emissions. However, given that the radon concentrations were approximately an order of magnitude lower than is commonly seen over major land masses (Chambers et al., 2011) and the trajectories spent approximately 54 % of their 7 d duration in the free troposphere (Fig. S9), they likely represented long-range transport of aged and diluted terrestrial emissions.
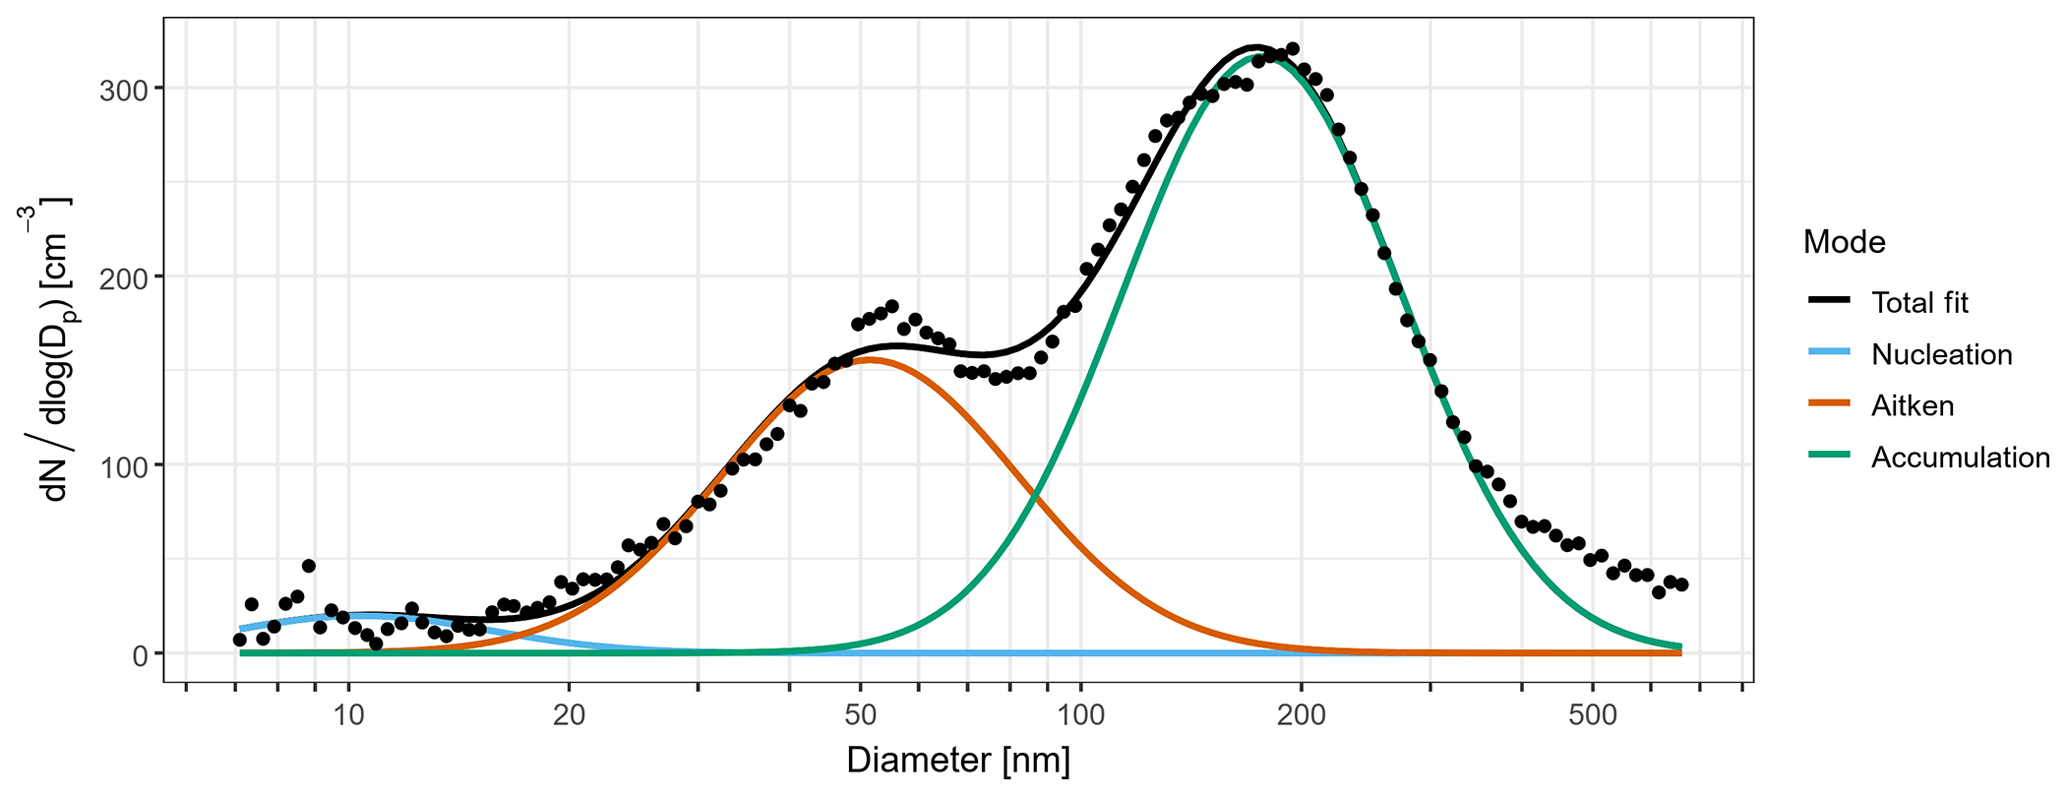
Figure 7Mean number size distribution for sub-micron aerosol during a period likely influenced by continental and coastal Australian air masses. The coloured lines are fitted log-normal distributions representing contributions from nucleation (blue), Aitken (brown), and accumulation (green) mode aerosol to the observed total size distribution (black points).
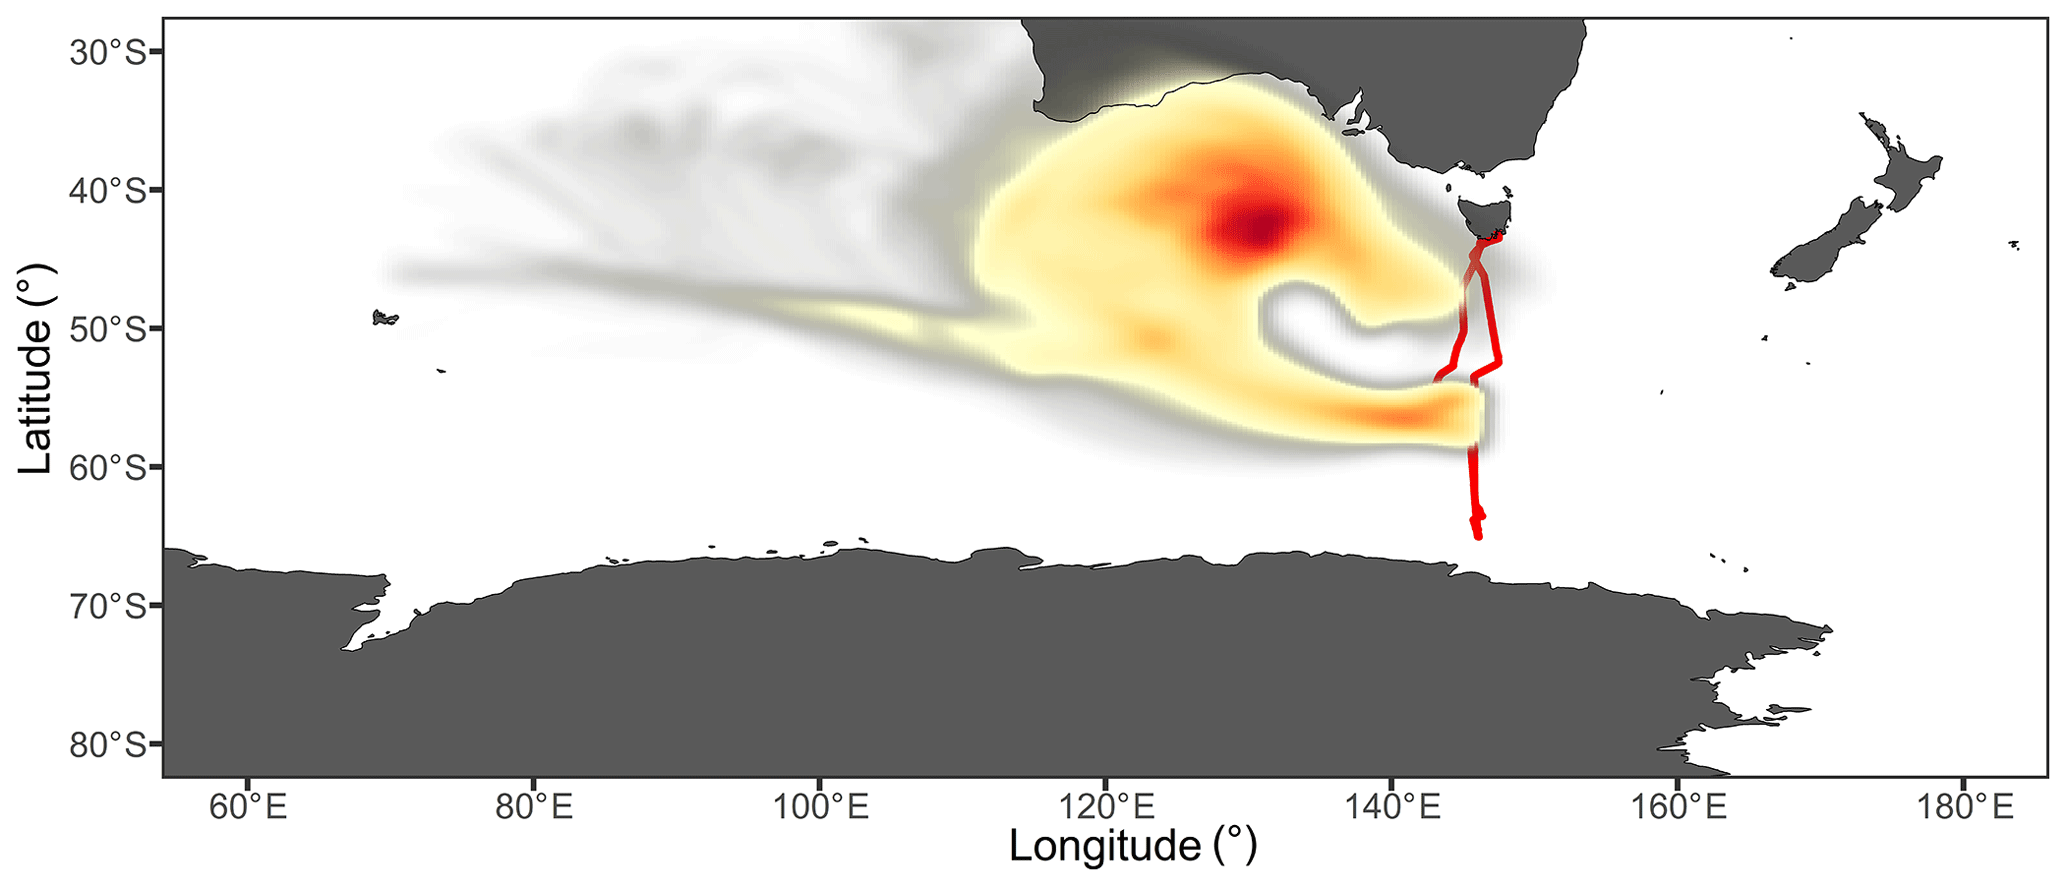
Figure 8Probability distribution of air mass coordinates throughout all back-trajectory ensembles from the cAU sampling period. The colour scale reflects the proportion of trajectories which passed through each location, with the highest density of trajectories found in the dark red region, which coincided with the approximate centre of a high-pressure system. The ship's voyage track is represented in red and the ship was located at a mean latitude of 56∘ S during this period.
N10 concentrations were approximately halved compared to the mSO air masses, including almost complete loss of the nucleation mode. However, the accumulation mode concentrations increased to dominate the size distribution (Fig. 7), and both the Aitken and accumulation modes exhibited the largest mean diameters of the voyage (Table 1 and Fig. S3). Overall, the net result was a slight increase in CCN0.5 % relative to the mSO air masses, with a median concentration of 200 cm−3.
4.5 Continental Antarctic air masses (cAA)
The cAA air masses were encountered when the ship was within 400 km of the Antarctic coastline, between the latitudes of 64–65.1∘ S, and during the northward transit between the latitudes of 57.5–60.1∘ S, at approximately 1000 km from the Antarctic coast. Each cAA period was preceded by strong low-pressure systems centred at approximately 60∘ S, which diverted the air masses northwards from over the Antarctic continent and towards the ship (Figs. 9 and 10). The air masses consistently followed the typical katabatic wind regime (Humphries et al., 2016), remaining within the free troposphere while over the continent and then rapidly subsiding into the MBL as they moved offshore over the coastal region (Fig. S10).
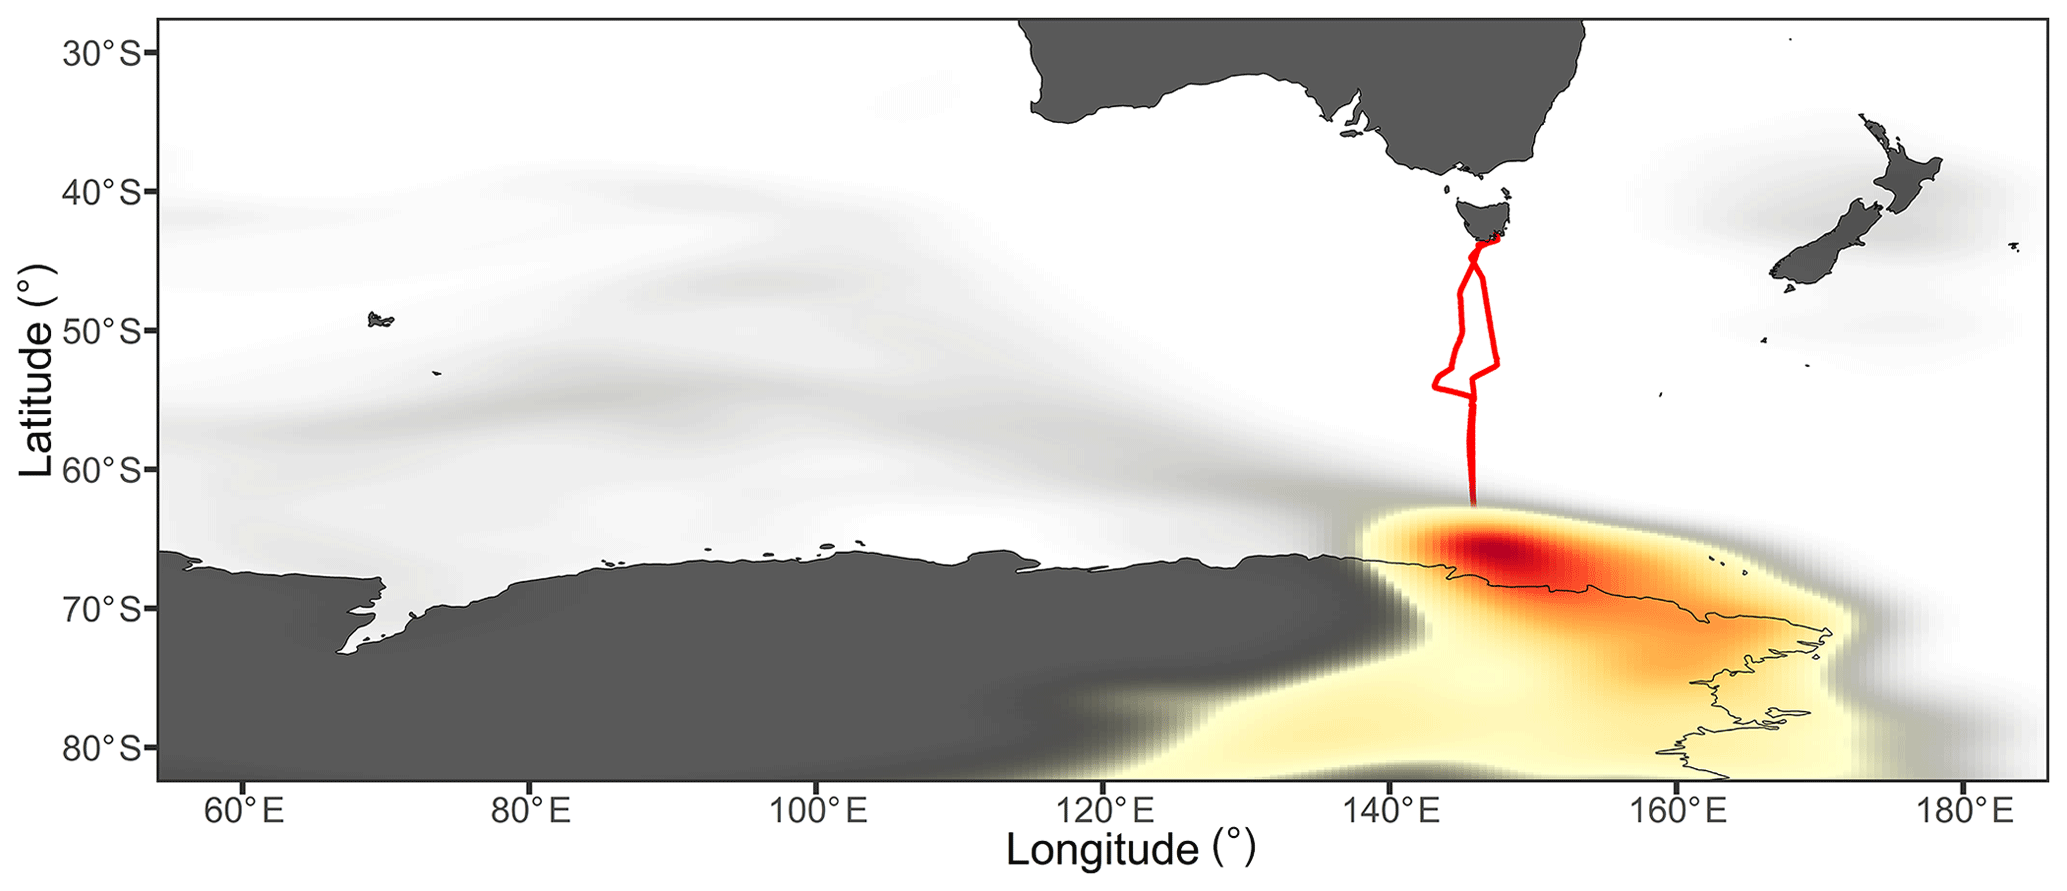
Figure 9Probability distribution of air mass coordinates throughout all back-trajectory ensembles from the cAA-I sampling period. The colour scale reflects the proportion of trajectories which passed through each location, with the highest density of trajectories found in the dark red region. The ship's voyage track is represented in red and the ship was located at a mean latitude of 64.5∘ S during this period.
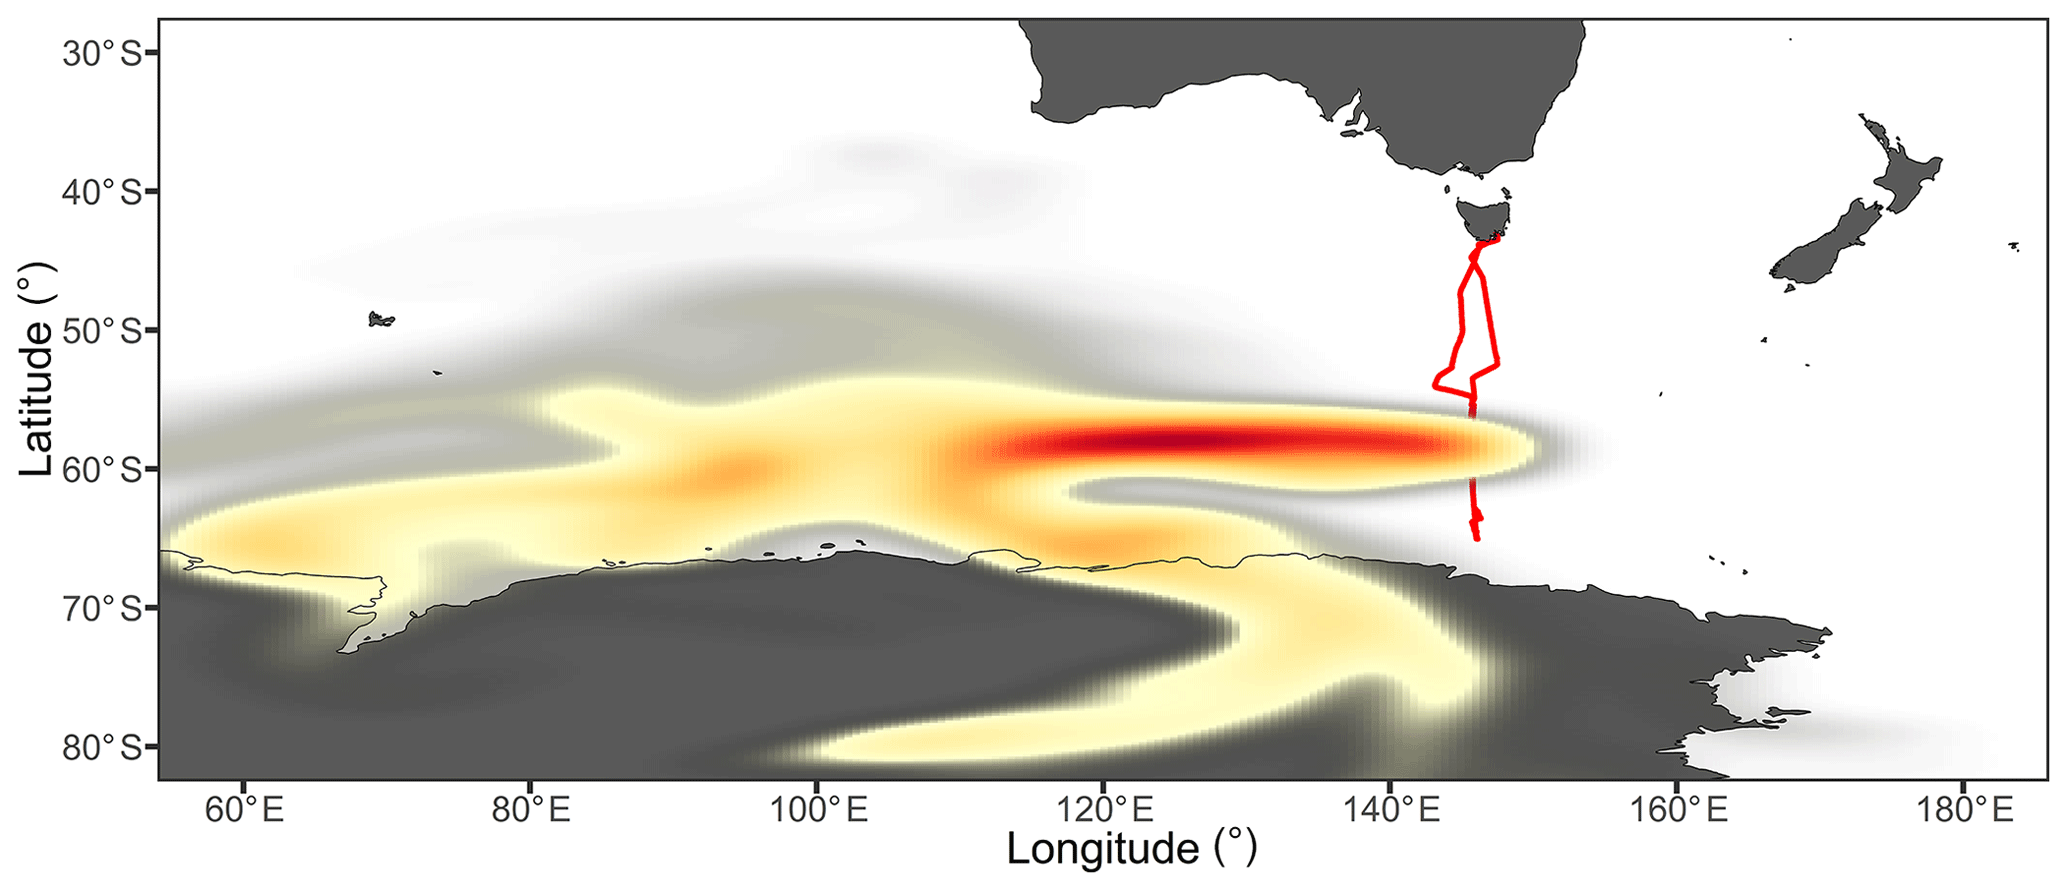
Figure 10Probability distribution of air mass coordinates throughout all back-trajectory ensembles from the cAA-II sampling period. The colour scale reflects the proportion of trajectories which passed through each location, with the highest density of trajectories found in the dark red region. The ship's voyage track is represented in red and the ship was located at a mean latitude of 59∘ S during this period.
The continental influence on the cAA-I air masses was supported by mean radon concentrations of 82±25 mBq m−3. This was consistent with the increase in summer–autumn radon concentrations at latitudes above 64∘ S, as reported by Chambers et al. (2018), through a combination of increased coastal emissions (due to exposed rocks and soils) and subsidence of terrestrially influenced tropospheric air over Antarctica. As with the cAU air mass, the majority of aerosols were in the accumulation mode (Fig. 11, Table S1), in close agreement with cAA observations given by Fossum et al. (2018). For cAA-I, this led to median CCN0.5 % concentrations that were 25 % higher than any other air mass, at 252 cm−3.

Figure 11Mean number size distribution for sub-micron aerosol during two sampling periods influenced by continental Antarctic air masses. The coloured lines are fitted log-normal distributions representing contributions from nucleation (blue), Aitken (brown), and accumulation (green) mode aerosol to the observed total size distribution (black points).
The transitions between the mSO and cAA-II air masses were more gradual, with a greater proportion of the back trajectories passing over the coastal region (Fig. 8). In addition, the increased distance to the ship led to more dilution and mixing within the MBL, resulting in radon concentrations that were only slightly elevated above the marine background, at a mean of 62.5 mBq m−3. Nonetheless, the period shared very similar N10 concentrations, nss-SO4 mass concentrations, and a dominant accumulation mode as cAA-I (Table S1, Figs. S3 and S8).
The transitions between mSO and cAA-I air masses were well defined during both the southward and northward transits, with pronounced and persistent changes particularly in N10 and Aitken number concentrations, as well as meteorological parameters such as air temperature and absolute humidity (Fig. S11). They occurred across a latitude range of approximately 64.0–64.5∘ S. During a nearby cruise in the early austral spring of 2012 and in the same region, Humphries et al. (2016) observed a similar abrupt transition at 64.4∘ S and attributed this to a shift between the Ferrel atmospheric cell and the polar cell. It is interesting to note that while they reported comparable N10 concentrations in the polar region, these decreased to a mean of 194 cm−3 at lower latitudes, rather than increasing as was seen during the CWT voyage reported on here. This may reflect greater seasonal variability in the Southern Ocean compared to polar waters, with lower oceanic productivity in the early spring leading to reduced rates of aerosol formation and growth to diameters above 10 nm. Nonetheless it is difficult to draw conclusions from these two datasets in isolation, highlighting the need for further latitudinal and seasonal studies in this region.
We have presented the first comprehensive study of aerosol properties targeting the full latitudinal width of the Southern Ocean south of Australia. The voyage was carried out during the austral summer of 2015 and extended to the edge of the marginal ice zone at 65∘ S. Despite the short 2-week timeframe of this study, synoptic-scale weather systems interrupted the usual mSO air masses on three occasions, drawing continental-influenced air masses from Australia and Antarctica over 1000 km into the Southern Ocean. In line with observations by Humphries et al. (2016), pronounced changes in aerosol number concentrations, size distributions, CCN activity, air mass trajectories, and other meteorological parameters offer support for a transition into the polar atmospheric cell at an approximate latitude of 64∘ S.
During cAA-I, increased accumulation mode aerosol in the continental outflow led to 25 % higher CCN concentrations than the voyage mean. All other air masses exhibited similar median CCN0.5 % concentrations, but with substantially higher variability in the mSO air masses. Increases in SSA were directly linked to this variability for only two 10 h episodes during the northward transit. In part, this was attributed to the competing influence of strong secondary aerosol production caused by high levels of summer-time marine productivity. However, the frequent synoptic-level weather systems in the Southern Ocean are typically accompanied by rainfall and convective transport into the free troposphere. We suggest that SSA rarely reaches its wind-speed-dependent equilibrium concentration unless the air mass remains within the MBL and is not exposed to substantial rainfall (e.g. >0.25 mm h−1) for approximately 48 h.
During this voyage, secondary aerosol production and growth of the Aitken mode diameter had a stronger influence than SSA, leading to non-accumulation mode CCN concentrations that were up to 200 % higher than the corresponding peaks seen during SSA-influenced episodes. However, although there were several regions of high biological productivity in this sector of the Southern Ocean, Aitken mode aerosol only exhibited growth to CCN-relevant diameters in three instances. These periods were marked by low air mass trajectory altitudes, several hours of exposure to a region of high biological activity, sufficient time for gas-phase photochemistry to occur, and finally strong compression of the MBL during the passage of a cold front which promoted NPF or aerosol condensational growth. In the absence of a cold front or when it coincided with a biologically productive region, high concentrations of nucleation mode aerosol were formed with minimal impact on CCN.
The wind-mediated SSA model predicted the highest concentrations of SSA at high latitudes where cyclonic conditions were most frequent. However, the impact of these weather systems on air mass altitudes and aerosol wet scavenging rates significantly limited the observed SSA concentrations, and in fact the highest concentrations were observed during stable weather conditions, more commonly seen at lower latitudes. Clearly, air mass meteorological history must be carefully considered when predicting SSA concentrations.
These results highlight the fundamental role of synoptic-level weather systems in promoting or inhibiting SSA and CCN-relevant secondary aerosol. Given the current scarcity of data from the Southern Ocean and the over-representation of summer-time voyages, there is a clear need for a greater body of data. This would allow examination of whether the aerosol population exhibits such variability during other seasons and therefore its dependence on biological activity. It would also be valuable to assess the frequency, duration, and characteristics of the long-range transport events.
The underlying research data can be accessed upon request to the corresponding author (Zoran D. Ristovski, z.ristovski@qut.edu.au). All data and samples acquired on the voyage are made publicly available (CSIRO, 2015) in accordance with MNF policy from the CSIRO Data Access Portal (https://data.csiro.au/dap/, last access: 10 July 2020).
The supplement related to this article is available online at: https://doi.org/10.5194/acp-20-8047-2020-supplement.
ZDR was chief scientist for the CWT campaign and coordinated the investigation in conjunction with MDK. ZDR, LTC, and JA managed data collection, daily maintenance, and calibration of the aerosol instrumentation throughout the voyage. Installation, calibration, and data analysis for the ACSM was performed by PS. Processing and interpretation of radon-222 data were completed by SDC and AGW. All other data analysis and interpretation were led by JA with input from all the authors, particularly LTC and ZDR. JA led manuscript preparation with input from all the authors.
The authors declare that they have no conflict of interest.
We acknowledge the NASA Goddard Space Flight Center, Ocean Biology Processing Group, for the provision of the MODIS Aqua chlorophyll data and the NOAA Air Resources Laboratory (ARL) for the provision and support of the HYSPLIT transport and dispersion model. The authors wish to thank the CSIRO Marine National Facility (MNF) for its support in the form of sea time on RV Investigator, support personnel, scientific equipment, and data management. In particular, we thank the technical and IT support personnel onboard the voyage, including Ian McRobert, William Ponsonby, Brett Muir, Steve Thomas, Hugh Barker, Stewart Wilde, and Anoosh Sarraf. We gratefully thank Jason Ward and James Harnwell (CSIRO) for their ongoing support of the permanent aerosol instrumentation on board.
This research has been supported by an Australian Government Research Training Program Scholarship and an Australian Research Council Discovery grant (grant no. DP150101649).
This paper was edited by Radovan Krejci and reviewed by Matthew Salter, Manuel Dall'Osto, and one anonymous referee.
Albrecht, B. A.: Aerosols, Cloud Microphysics, and Fractional Cloudiness, Science, 245, 1227–1230, https://doi.org/10.1126/science.245.4923.1227, 1989.
Andreae, M. O. and Rosenfeld, D.: Aerosol–cloud–precipitation interactions. Part 1. The nature and sources of cloud-active aerosols, Earth-Sci. Rev., 89, 13–41, https://doi.org/10.1016/j.earscirev.2008.03.001, 2008.
Ault, A. P., Moffet, R. C., Baltrusaitis, J., Collins, D. B., Ruppel, M. J., Cuadra-Rodriguez, L. A., Zhao, D., Guasco, T. L., Ebben, C. J., Geiger, F. M., Bertram, T. H., Prather, K. A., and Grassian, V. H.: Size-Dependent Changes in Sea Spray Aerosol Composition and Properties with Different Seawater Conditions, Environ. Sci. Technol., 47, 5603–5612, https://doi.org/10.1021/es400416g, 2013.
Barnes, I., Hjorth, J., and Mihalopoulos, N.: Dimethyl Sulfide and Dimethyl Sulfoxide and Their Oxidation in the Atmosphere, Chem. Rev., 106, 940–975, https://doi.org/10.1021/cr020529+, 2006.
Bates, T. S., Kapustin, V. N., Quinn, P. K., Covert, D. S., Coffman, D. J., Mari, C., Durkee, P. A., De Bruyn, W. J., and Saltzman, E. S.: Processes controlling the distribution of aerosol particles in the lower marine boundary layer during the First Aerosol Characterization Experiment (ACE 1), J. Geophys. Res.-Atmos., 103, 16369–16383, https://doi.org/10.1029/97jd03720, 1998.
Bianchi, F., Tröstl, J., Junninen, H., Frege, C., Henne, S., Hoyle, C. R., Molteni, U., Herrmann, E., Adamov, A., Bukowiecki, N., Chen, X., Duplissy, J., Gysel, M., Hutterli, M., Kangasluoma, J., Kontkanen, J., Kürten, A., Manninen, H. E., Münch, S., Peräkylä, O., Petäjä, T., Rondo, L., Williamson, C., Weingartner, E., Curtius, J., Worsnop, D. R., Kulmala, M., Dommen, J., and Baltensperger, U.: New particle formation in the free troposphere: A question of chemistry and timing, Science, 352, 1109–1112, https://doi.org/10.1126/science.aad5456, 2016.
Callaghan, A., de Leeuw, G., Cohen, L., and O'Dowd, C. D.: Relationship of oceanic whitecap coverage to wind speed and wind history, Geophys. Res. Lett., 35, L23609, https://doi.org/10.1029/2008gl036165, 2008.
Chambers, S., Williams, A. G., Zahorowski, W., Griffiths, A., and Crawford, J.: Separating remote fetch and local mixing influences on vertical radon measurements in the lower atmosphere, Tellus B, 63, 843–859, https://doi.org/10.1111/j.1600-0889.2011.00565.x, 2011.
Chambers, S. D., Preunkert, S., Weller, R., Hong, S.-B., Humphries, R. S., Tositti, L., Angot, H., Legrand, M., Williams, A. G., Griffiths, A. D., Crawford, J., Simmons, J., Choi, T. J., Krummel, P. B., Molloy, S., Loh, Z., Galbally, I., Wilson, S., Magand, O., Sprovieri, F., Pirrone, N., and Dommergue, A.: Characterizing Atmospheric Transport Pathways to Antarctica and the Remote Southern Ocean Using Radon-222, Front. Earth Sci., 6, 190, https://doi.org/10.3389/feart.2018.00190, 2018.
Clarke, A. D., Varner, J. L., Eisele, F., Mauldin, R. L., Tanner, D., and Litchy, M.: Particle production in the remote marine atmosphere: Cloud outflow and subsidence during ACE 1, J. Geophys. Res.-Atmos., 103, 16397–16409, https://doi.org/10.1029/97jd02987, 1998.
Covert, D. S., Kapustin, V. N., Bates, T. S., and Quinn, P. K.: Physical properties of marine boundary layer aerosol particles of the mid-Pacific in relation to sources and meteorological transport, J. Geophys. Res.-Atmos., 101, 6919–6930, https://doi.org/10.1029/95jd03068, 1996.
Cravigan, L. T., Ristovski, Z., Modini, R. L., Keywood, M. D., and Gras, J. L.: Observation of sea-salt fraction in sub-100 nm diameter particles at Cape Grim, J. Geophys. Res.-Atmos., 120, 1848–1864, https://doi.org/10.1002/2014JD022601, 2015.
Cravigan, L. T., Mallet, M. D., Vaattovaara, P., Harvey, M. J., Law, C. S., Modini, R. L., Russell, L. M., Stelcer, E., Cohen, D. D., Olsen, G., Safi, K., Burrell, T. J., and Ristovski, Z.: Sea spray aerosol organic enrichment, water uptake and surface tension effects, Atmos. Chem. Phys., 20, 7955–7977, https://doi.org/10.5194/acp-20-7955-2020, 2020.
CSIRO: RV Investigator Voyage IN2015_E01 End of Voyage (EOV) Archive, v1, CSIRO, Data Collection, 102.100.100/24319, https://doi.org/10.25919/5c36db4b82fae, 2015.
Dall'Osto, M., Ovadnevaite, J., Paglione, M., Beddows, D. C. S., Ceburnis, D., Cree, C., Cortés, P., Zamanillo, M., Nunes, S. O., Pérez, G. L., Ortega-Retuerta, E., Emelianov, M., Vaqué, D., Marrasé, C., Estrada, M., Sala, M. M., Vidal, M., Fitzsimons, M. F., Beale, R., Airs, R., Rinaldi, M., Decesari, S., Cristina Facchini, M., Harrison, R. M., O'Dowd, C., and Simó, R.: Antarctic sea ice region as a source of biogenic organic nitrogen in aerosols, Sci. Rep.-UK, 7, 6047, https://doi.org/10.1038/s41598-017-06188-x, 2017.
Draxler, R. R.: Evaluation of an Ensemble Dispersion Calculation, J. Appl. Meteorol., 42, 308–317, https://doi.org/10.1175/1520-0450(2003)042<0308:eoaedc>2.0.co;2, 2003.
Dusek, U., Frank, G. P., Hildebrandt, L., Curtius, J., Schneider, J., Walter, S., Chand, D., Drewnick, F., Hings, S., Jung, D., Borrmann, S., and Andreae, M. O.: Size matters more than chemistry for cloud-nucleating ability of aerosol particles, Science, 312, 1375–1378, https://doi.org/10.1126/science.1125261, 2006.
Fossum, K. N., Ovadnevaite, J., Ceburnis, D., Dall'Osto, M., Marullo, S., Bellacicco, M., Simó, R., Liu, D., Flynn, M., Zuend, A., and O'Dowd, C.: Summertime Primary and Secondary Contributions to Southern Ocean Cloud Condensation Nuclei, Sci. Rep.-UK, 8, 13844, https://doi.org/10.1038/s41598-018-32047-4, 2018.
Fröhlich, R., Cubison, M. J., Slowik, J. G., Bukowiecki, N., Prévôt, A. S. H., Baltensperger, U., Schneider, J., Kimmel, J. R., Gonin, M., Rohner, U., Worsnop, D. R., and Jayne, J. T.: The ToF-ACSM: a portable aerosol chemical speciation monitor with TOFMS detection, Atmos. Meas. Tech., 6, 3225–3241, https://doi.org/10.5194/amt-6-3225-2013, 2013.
GLOBALVIEW-CO: Co-operative Atmospheric Data Integration Project – Carbon Monoxide, CD-ROM, NOAA ESRL, Boulder, Colorado, USA, available at: ftp://ftp.cmdl.noaa.gov/products/globalview/co (last access: 7 July 2020), 2009.
Grythe, H., Ström, J., Krejci, R., Quinn, P., and Stohl, A.: A review of sea-spray aerosol source functions using a large global set of sea salt aerosol concentration measurements, Atmos. Chem. Phys., 14, 1277–1297, https://doi.org/10.5194/acp-14-1277-2014, 2014.
Haywood, J. and Boucher, O.: Estimates of the direct and indirect radiative forcing due to tropospheric aerosols: A review, Rev. Geophys., 38, 513–543, https://doi.org/10.1029/1999RG000078, 2000.
Humphries, R. S., Klekociuk, A. R., Schofield, R., Keywood, M., Ward, J., and Wilson, S. R.: Unexpectedly high ultrafine aerosol concentrations above East Antarctic sea ice, Atmos. Chem. Phys., 16, 2185–2206, https://doi.org/10.5194/acp-16-2185-2016, 2016.
Humphries, R. S., McRobert, I. M., Ponsonby, W. A., Ward, J. P., Keywood, M. D., Loh, Z. M., Krummel, P. B., and Harnwell, J.: Identification of platform exhaust on the RV Investigator, Atmos. Meas. Tech., 12, 3019–3038, https://doi.org/10.5194/amt-12-3019-2019, 2019.
Jayne, J. T., Leard, D. C., Zhang, X., Davidovits, P., Smith, K. A., Kolb, C. E., and Worsnop, D. R.: Development of an Aerosol Mass Spectrometer for Size and Composition Analysis of Submicron Particles, Aerosol Sci. Technol., 33, 49–70, https://doi.org/10.1080/027868200410840, 2000.
Kim, J., Yoon, Y. J., Gim, Y., Kang, H. J., Choi, J. H., Park, K.-T., and Lee, B. Y.: Seasonal variations in physical characteristics of aerosol particles at the King Sejong Station, Antarctic Peninsula, Atmos. Chem. Phys., 17, 12985–12999, https://doi.org/10.5194/acp-17-12985-2017, 2017.
Langley, L., Leaitch, W. R., Lohmann, U., Shantz, N. C., and Worsnop, D. R.: Contributions from DMS and ship emissions to CCN observed over the summertime North Pacific, Atmos. Chem. Phys., 10, 1287–1314, https://doi.org/10.5194/acp-10-1287-2010, 2010.
Lewis, E. R., Lewis, R., and Schwartz, S. E.: Sea salt aerosol production: mechanisms, methods, measurements, and models, American Geophysical Union, Washington, DC, USA, 2004.
Lin, G., Qian, Y., Yan, H., Zhao, C., Ghan, S. J., Easter, R., and Zhang, K.: Quantification of marine aerosol subgrid variability and its correlation with clouds based on high-resolution regional modeling, J. Geophys. Res.-Atmos., 122, 6329–6346, https://doi.org/10.1002/2017jd026567, 2017.
Liu, P. S. K., Deng, R., Smith, K. A., Williams, L. R., Jayne, J. T., Canagaratna, M. R., Moore, K., Onasch, T. B., Worsnop, D. R., and Deshler, T.: Transmission Efficiency of an Aerodynamic Focusing Lens System: Comparison of Model Calculations and Laboratory Measurements for the Aerodyne Aerosol Mass Spectrometer, Aerosol Sci. Technol., 41, 721–733, https://doi.org/10.1080/02786820701422278, 2007.
Modini, R. L., Frossard, A. A., Ahlm, L., Russell, L. M., Corrigan, C. E., Roberts, G. C., Hawkins, L. N., Schroder, J. C., Bertram, A. K., Zhao, R., Lee, A. K. Y., Abbatt, J. P. D., Lin, J., Nenes, A., Wang, Z., Wonaschütz, A., Sorooshian, A., Noone, K. J., Jonsson, H., Seinfeld, J. H., Toom-Sauntry, D., Macdonald, A. M., and Leaitch, W. R.: Primary marine aerosol-cloud interactions off the coast of California, J. Geophys. Res.-Atmos., 120, 4282–4303, https://doi.org/10.1002/2014jd022963, 2015.
Myhre, G., Shindell, D., Bréon, F.-M., Collins, W., Fuglestvedt, J., Huang, J., Koch, D., Lamarque, J.-F., Lee, D., Mendoza, B., Nakajima, T., Robock, A., Stephens, G., Takemura, T., and Zhang, H.: Anthropogenic and Natural Radiative Forcing, in: Climate Change 2013: The Physical Science Basis. Contribution of Working Group I to the Fifth Assessment Report of the Intergovernmental Panel on Climate Change, edited by: Stocker, T. F., Qin, D., Plattner, G.-K., Tignor, M., Allen, S. K., Boschung, J., Nauels, A., Xia, Y., Bex, V., and Midgley, P. M., Cambridge University Press, Cambridge, UK and New York, NY, USA, 2013.
OBPG: Moderate-resolution Imaging Spectroradiometer (MODIS) Aqua Chlorophyll Data, NASA OB.DAAC, Greenbelt, MD, USA, 2018.
O'Dowd, C. D. and de Leeuw, G.: Marine aerosol production: a review of the current knowledge, Philos. T. R. Soc. A, 365, 1753–1774, https://doi.org/10.1098/rsta.2007.2043, 2007.
O'Shea, S. J., Choularton, T. W., Flynn, M., Bower, K. N., Gallagher, M., Crosier, J., Williams, P., Crawford, I., Fleming, Z. L., Listowski, C., Kirchgaessner, A., Ladkin, R. S., and Lachlan-Cope, T.: In situ measurements of cloud microphysics and aerosol over coastal Antarctica during the MAC campaign, Atmos. Chem. Phys., 17, 13049–13070, https://doi.org/10.5194/acp-17-13049-2017, 2017.
Ovadnevaite, J., Ceburnis, D., Canagaratna, M., Berresheim, H., Bialek, J., Martucci, G., Worsnop, D. R., and O'Dowd, C.: On the effect of wind speed on submicron sea salt mass concentrations and source fluxes, J. Geophys. Res.-Atmos., 117, D16201, https://doi.org/10.1029/2011jd017379, 2012.
Protat, A., Schulz, E., Rikus, L., Sun, Z., Xiao, Y., and Keywood, M.: Shipborne observations of the radiative effect of Southern Ocean clouds, J. Geophys. Res.-Atmos., 122, 318–328, https://doi.org/10.1002/2016jd026061, 2017.
Quinn, P. K., Coffman, D. J., Johnson, J. E., Upchurch, L. M., and Bates, T. S.: Small fraction of marine cloud condensation nuclei made up of sea spray aerosol, Nat. Geosci., 10, 674–679, https://doi.org/10.1038/ngeo3003, 2017.
Rosenfeld, D., Zhu, Y., Wang, M., Zheng, Y., Goren, T., and Yu, S.: Aerosol-driven droplet concentrations dominate coverage and water of oceanic low-level clouds, Science, 363, eaav0566, https://doi.org/10.1126/science.aav0566, 2019.
Schmale, J., Baccarini, A., Thurnherr, I., Henning, S., Efraim, A., Regayre, L., Bolas, C., Hartmann, M., Welti, A., Lehtipalo, K., Aemisegger, F., Tatzelt, C., Landwehr, S., Modini, R. L., Tummon, F., Johnson, J., Harris, N., Schnaiter, M., Toffoli, A., Derkani, M., Bukowiecki, N., Stratmann, F., Dommen, J., Baltensperger, U., Wernli, H., Rosenfeld, D., Gysel-Beer, M., and Carslaw, K.: Overview of the Antarctic Circumnavigation Expedition: Study of Preindustrial-like Aerosols and Their Climate Effects (ACE-SPACE), B. Am. Meteorol. Soc., 100, 2260–2283, https://doi.org/10.1175/bams-d-18-0187.1, 2019.
Scrucca, L., Fop, M., Murphy, T. B., and Raftery, A. E.: mclust 5: Clustering, Classification and Density Estimation Using Gaussian Finite Mixture Models, R. J., 8, 289–317, https://doi.org/10.32614/RJ-2016-021, 2016.
Simmonds, I., Keay, K., and Lim, E.-P.: Synoptic Activity in the Seas around Antarctica, Mon. Weather Rev., 131, 272–288, https://doi.org/10.1175/1520-0493(2003)131<0272:saitsa>2.0.co;2, 2003.
Simpson, R. M. C., Howell, S. G., Blomquist, B. W., Clarke, A. D., and Huebert, B. J.: Dimethyl sulfide: Less important than long-range transport as a source of sulfate to the remote tropical Pacific marine boundary layer, J. Geophys. Res.-Atmos., 119, 9142–9167, https://doi.org/10.1002/2014JD021643, 2014.
Stein, A. F., Draxler, R. R., Rolph, G. D., Stunder, B. J. B., Cohen, M. D., and Ngan, F.: NOAA's HYSPLIT Atmospheric Transport and Dispersion Modeling System, B. Am. Meteorol. Soc., 96, 2059–2077, https://doi.org/10.1175/bams-d-14-00110.1, 2015.
Stephens, B. B., Long, M. C., Keeling, R. F., Kort, E. A., Sweeney, C., Apel, E. C., Atlas, E. L., Beaton, S., Bent, J. D., Blake, N. J., Bresch, J. F., Casey, J., Daube, B. C., Diao, M., Diaz, E., Dierssen, H., Donets, V., Gao, B.-C., Gierach, M., Green, R., Haag, J., Hayman, M., Hills, A. J., Hoecker-Martínez, M. S., Honomichl, S. B., Hornbrook, R. S., Jensen, J. B., Li, R.-R., McCubbin, I., McKain, K., Morgan, E. J., Nolte, S., Powers, J. G., Rainwater, B., Randolph, K., Reeves, M., Schauffler, S. M., Smith, K., Smith, M., Stith, J., Stossmeister, G., Toohey, D. W., and Watt, A. S.: The O2∕N2 Ratio and CO2 Airborne Southern Ocean Study, B. Am. Meteorol. Soc., 99, 381–402, https://doi.org/10.1175/bams-d-16-0206.1, 2018.
Vignati, E., Facchini, M. C., Rinaldi, M., Scannell, C., Ceburnis, D., Sciare, J., Kanakidou, M., Myriokefalitakis, S., Dentener, F., and O'Dowd, C. D.: Global scale emission and distribution of sea-spray aerosol: Sea-salt and organic enrichment, Atmos. Environ., 44, 670–677, https://doi.org/10.1016/j.atmosenv.2009.11.013, 2010.
Weigum, N., Schutgens, N., and Stier, P.: Effect of aerosol subgrid variability on aerosol optical depth and cloud condensation nuclei: implications for global aerosol modelling, Atmos. Chem. Phys., 16, 13619–13639, https://doi.org/10.5194/acp-16-13619-2016, 2016.
Williams, K. D., Bodas-Salcedo, A., Déqué, M., Fermepin, S., Medeiros, B., Watanabe, M., Jakob, C., Klein, S. A., Senior, C. A., and Williamson, D. L.: The Transpose-AMIP II Experiment and Its Application to the Understanding of Southern Ocean Cloud Biases in Climate Models, J. Climate, 26, 3258–3274, https://doi.org/10.1175/jcli-d-12-00429.1, 2013.
Williamson, C. J., Kupc, A., Axisa, D., Bilsback, K. R., Bui, T., Campuzano-Jost, P., Dollner, M., Froyd, K. D., Hodshire, A. L., Jimenez, J. L., Kodros, J. K., Luo, G., Murphy, D. M., Nault, B. A., Ray, E. A., Weinzierl, B., Wilson, J. C., Yu, F., Yu, P., Pierce, J. R., and Brock, C. A.: A large source of cloud condensation nuclei from new particle formation in the tropics, Nature, 574, 399–403, https://doi.org/10.1038/s41586-019-1638-9, 2019.