the Creative Commons Attribution 4.0 License.
the Creative Commons Attribution 4.0 License.
 | 09 Jul 2020
Sea spray aerosol organic enrichment, water uptake and surface tension effects
Luke T. Cravigan
Marc D. Mallet
Petri Vaattovaara
Mike J. Harvey
Cliff S. Law
Robin L. Modini
Lynn M. Russell
Ed Stelcer
David D. Cohen
Greg Olsen
Karl Safi
Timothy J. Burrell
The aerosol-driven radiative effects on marine low-level cloud represent a large uncertainty in climate simulations, in particular over the Southern Ocean, which is also an important region for sea spray aerosol production. Observations of sea spray aerosol organic enrichment and the resulting impact on water uptake over the remote Southern Hemisphere are scarce, and therefore the region is under-represented in existing parameterisations. The Surface Ocean Aerosol Production (SOAP) voyage was a 23 d voyage which sampled three phytoplankton blooms in the highly productive water of the Chatham Rise, east of New Zealand. In this study we examined the enrichment of organics to nascent sea spray aerosol and the modifications to sea spray aerosol water uptake using in situ chamber measurements of seawater samples taken during the SOAP voyage.
Primary marine organics contributed up to 23 % of the sea spray mass for particles with diameter less than approximately 1 µm and up to 79 % of the particle volume for 50 nm diameter sea spray. The composition of the submicron organic fraction was consistent throughout the voyage and was largely composed of a polysaccharide-like component, characterised by very low alkane-to-hydroxyl-concentration ratios of approximately 0.1–0.2. The enrichment of organics was compared to the output from the chlorophyll-a-based sea spray aerosol parameterisation suggested by Gantt et al. (2011) and the OCEANFILMS (Organic Compounds from Ecosystems to Aerosols: Natural Films and Interfaces via Langmuir Molecular Surfactants) models. OCEANFILMS improved on the representation of the organic fraction predicted using chlorophyll a, in particular when the co-adsorption of polysaccharides was included; however, the model still under-predicted the proportion of polysaccharides by an average of 33 %.
Nascent 50 nm diameter sea spray aerosol hygroscopic growth factors measured at 90 % relative humidity averaged 1.93±0.08 and did not decrease with increasing sea spray aerosol organic fractions. The observed hygroscopicity was greater than expected from the assumption of full solubility, particularly during the most productive phytoplankton bloom (B1), during which organic fractions were greater than approximately 0.4. The water uptake behaviour observed in this study is consistent with that observed for other measurements of phytoplankton blooms and can be partially attributed to the presence of sea salt hydrates, which lowers the sea spray aerosol hygroscopicity when the organic enrichment is low. The inclusion of surface tension effects only marginally improved the modelled hygroscopicity, and a significant discrepancy between the observed and modelled hygroscopicity at high organic volume fractions remained. The findings from the SOAP voyage highlight the influence of biologically sourced organics on sea spray aerosol composition; these data improve the capacity to parameterise sea spray aerosol organic enrichment and water uptake.
- Article
(3384 KB) -
Supplement
(14625 KB) - BibTeX
- EndNote


Aerosol–cloud interactions represent a large uncertainty in modelled radiative forcing (Myhre et al., 2013), and in particular a strong radiative bias has been associated with under-representation of low-level cloud over the Southern Ocean (Bodas-Salcedo et al., 2012; Protat et al., 2017). Sea spray aerosol (SSA) is an important contributor to cloud condensation nuclei (CCN), in particular over the Southern Ocean (Quinn et al., 2017; Cravigan et al., 2015; Fossum et al., 2018; Gras and Keywood, 2017). The phytoplankton-derived organic fraction of nascent SSA has been shown to influence water uptake and CCN activity; however, in some cases this relationship is not entirely predictable. For example the drivers of an observed positive correlation between modelled SSA organic mass fraction and cloud droplet number concentrations over the high-latitude Southern Ocean are unclear (McCoy et al., 2015). Models of SSA organic enrichment are largely based on chamber measurements which relate SSA and seawater composition. SSA generation chambers are often used because ambient SSA measurements are hindered by low concentrations and atmospheric processing (Cravigan et al., 2015; Frossard et al., 2014; Laskin et al., 2012; Shank et al., 2012). SSA measurements are scarce in the Southern Hemisphere (Cravigan et al., 2015); therefore, parameterisations of SSA organic enrichment have largely been developed based on Northern Hemisphere measurements. Further constraint of these relationships to observations for the Southern Hemisphere is required.
The inorganic composition of SSA has largely been assumed to mirror the inorganic composition of seawater (Schwartz and Lewis, 2004); however, a few important exceptions have been identified. The enrichment of Ca2+ in SSA, relative to seawater, has been identified in a number of ambient marine (Leck and Svensson, 2015; Sievering et al., 2004) and nascent SSA chamber studies (Keene et al., 2007; Salter et al., 2016; Schwier et al., 2017). Cation enrichment has also been observed in the form of Mg2+ and K+ (Ault et al., 2013b; Schwier et al., 2017) and is also associated with deficits in Cl− (Ault et al., 2013a; Prather et al., 2013; Schwier et al., 2017). PM1 Ca2+ has been observed to be enriched by up to 500 % (Schwier et al., 2017), relative to seawater, with a number of studies showing stronger enrichment for sub-100 nm diameter SSA (Leck and Svensson, 2015; Salter et al., 2016). It is uncertain whether the ocean surface Ca2+ is complexed with organic matter or is the product of precipitation of CaCO3 by certain phytoplankton groups, which can be a product of photosynthetic reactions. Observations of organic carbon particles that contain inorganic cations (such as Ca2+, Mg2+ and K+) but no Cl− has also been reported, suggesting that in some cases these species complex with organic material (Ault et al., 2013a).
Chamber observations of nascent SSA universally indicate the presence of an internally mixed organic component, with the organic contribution varying between studies from approximately 4 % to 80 % by volume, dependent on the method used and size range investigated (Fuentes et al., 2011; Schwier et al., 2015, 2017; Facchini et al., 2008; Bates et al., 2012; Modini et al., 2010a). The majority of observations show that the organic fraction increases with decreasing particle diameter (Facchini et al., 2008; Keene et al., 2007; Prather et al., 2013; Quinn et al., 2014). Estimates of the sub-100 nm SSA organic fraction based on water uptake methods, where volume mixing rules are assumed, are of the order of 5 %–37 % (Fuentes et al., 2011; Modini et al., 2010a) and sit at the lower end of all the nascent SSA organic fraction measurements (Facchini et al., 2008; Keene et al., 2007; Prather et al., 2013). Exceptions include Quinn et al. (2014), who derived an organic volume fraction (OVF) of up to 0.8 (for 40 nm SSA) using CCN measurements. Externally mixed organics have also been observed to comprise the majority of the number concentration of sub-180 nm SSA in some studies (Collins et al., 2014, 2013; Prather et al., 2013). It should be noted that the externally mixed organic fraction still contained inorganic ions but was characterised by an absence of Cl (Ault et al., 2013a).
The organic fraction of sub-200 nm diameter SSA appears to be comprised of a volatilisable component which evaporates at approximately 150–200 ∘C and comprises of the order of 10 % of the SSA volume (Modini et al., 2010a; Quinn et al., 2014). An SSA low-volatility organic component has also been observed in the North Pacific and Atlantic oceans (Quinn et al., 2014) but was not seen in the southwestern Pacific (Modini et al., 2010a). The organic volume fraction of sub-100 nm diameter SSA has been previously estimated by comparing the volatility of nascent SSA generated using natural seawater samples with SSA generated from sea salt samples (Cravigan, 2015; Mallet et al., 2016; Modini et al., 2010a). This method assumes that the volatile organic component is the only cause for the difference in volatility. It has been subsequently noted that components of sea salt aerosol retain hydrates even when dried to very low relative humidity (RH < 5 %), such as MgCl2 and CaCl2 (Rasmussen et al., 2017). Sea salt hydrates need to be taken into account when estimating the SSA OVF using volatility.
The SSA organic fraction has been associated with the phytoplankton decline due to bacterial grazing and viral infection, which releases fatty acids and polysaccharides predisposed to SSA enrichment (O'Dowd et al., 2015). The composition of PM1 SSA organics is characterised by a large fraction (>50 %) of hydroxyl functional groups, with smaller contributions from alkanes and smaller again from amines and carboxylic acid groups (Russell et al., 2010). The hydroxyl functional group is generally consistent with water-soluble polysaccharides (Russell et al., 2010); however, water-insoluble lipopolysaccharides (LPSs) have been observed in SSA (Ceburnis et al., 2008; Facchini et al., 2008; Claeys et al., 2010; Miyazaki et al., 2010; Sciare et al., 2009) and may depress water solubility and enhance surface tension effects. Functional group measurements can be equated to molecular classes; for example higher alkane-to-hydroxyl ratios indicate less-oxygenated and more-lipid-like organics. Chamber-generated nascent PM1 SSA alkane-to-hydroxyl ratios averaging 0.34±0.21 for non-productive waters and 0.93±0.41 for productive waters have been reported (Frossard et al., 2014). The proportion of fatty acids, and therefore alkanes, is linked to phytoplankton production because the lifetime of fatty acids is relatively short, compared to polysaccharides.
Empirical relationships between the nascent PM1 SSA organic fraction and chlorophyll-a (Chl a) concentrations are most commonly used to estimate SSA organic enrichment (Gantt et al., 2011; Schwier et al., 2015; Fuentes et al., 2011). A lagged correlation between the peak in Chl a of a phytoplankton bloom and organic enrichment of SSA has been observed (O'Dowd et al., 2015; Rinaldi et al., 2013). Although Chl a may not represent the molecular processes that drive enrichment, it indicates the spatial and temporal magnitude of phytoplankton whilst providing a proxy for organic compounds released. Chl a is readily available due to satellite retrievals (Rinaldi et al., 2013), and it has been shown that over monthly timescales it correlates well with SSA organic fraction (O'Dowd et al., 2015). Alternative models have been suggested which aim to better explain the molecular drivers of PM1 SSA organic enrichment. OCEANFILMS (Organic Compounds from Ecosystems to Aerosols: Natural Films and Interfaces via Langmuir Molecular Surfactants) is a model of SSA organic enrichment based on the seawater molecular composition (Burrows et al., 2014, 2016). Marine organics are broken up into classes, and adsorption to a surface film (e.g. a bubble) is driven by the Langmuir adsorption coefficient. The molecular classes are a labile lipid-like class, a semi-labile polysaccharide-like class, a protein class with intermediate ocean lifetimes, a long-lived processed class and a humic-like mixture from deep upwelled water. The processed class composition and surface activity is poorly characterised, but this class represents the recalcitrant dissolved organic carbon resulting from biogeochemical ageing of other groups. The Langmuir adsorption coefficient is based on observations of reference molecules for each molecular class (Burrows et al., 2014). The surface coverage representation is further extended by considering the interaction between polysaccharides and more-surface-active molecular classes, which results in co-adsorption of more-soluble polysaccharides (Burrows et al., 2016). Only a small number of long term datasets are available to constrain SSA enrichment, in particular in the Southern Hemisphere (Quinn et al., 2015).
Studies using nascent SSA generation chambers have largely indicated that the presence of primary organics suppresses sub-200 nm diameter SSA hygroscopic growth factors (HGFs) by 4 %–17 % relative to sea salt (Bates et al., 2012; Fuentes et al., 2011; Modini et al., 2010a). Simultaneous measurement of SSA composition and supersaturated water uptake have indicated that the observed hygroscopicity is consistent with the Zdanovskii, Stokes, and Robinson (ZSR) assumption (Stokes and Robinson, 1966; Schwier et al., 2017). Importantly, exceptions have been identified based on CCN measurements which indicate a role of surface tension on SSA water uptake (Ovadnevaite et al., 2011a; Collins et al., 2016; Forestieri et al., 2018b). The suppression of surface tension has been identified as having a potential impact on the hygroscopicity parameter (κ) computed from CCN measurements during nascent SSA microcosm experiments. The hygroscopicity parameter was persistently high (κ>0.7) even with high marine biological activity and high SSA organic fractions (Collins et al., 2016). Alternatives to the assumption of full solubility for the organic component of internal carboxylic acid–salt mixtures have been suggested based on laboratory (Ruehl and Wilson, 2014; Ruehl et al., 2016) and field measurements of secondary particles (Ovadnevaite et al., 2017) and applied to SSA analogues (Forestieri et al., 2018b). It is worth noting that the impact of surface tension on water uptake in the subsaturated regime is generally small (Ruehl et al., 2016; Moore et al., 2008). The compressed film model creates an organically enriched surface layer, which acts to suppress surface tension, and a bulk solution which is a mixture of organic species, inorganic species and water. With a sufficient concentration of a surface-active species the water tension suppression can compensate for the reduction in water uptake due to the Raoult effect. As the droplet grows the organic monolayer becomes increasingly dilute, until the droplet surface tension approaches the surface tension of water. The application of the compressed film model for SSA analogues indicated that the organic component can be considered dissolved into the bulk (Forestieri et al., 2018b; Fuentes et al., 2011; Petters and Petters, 2016; Prisle et al., 2010). The surface tension suppression of SSA is far from consistent, suggesting that regional differences and the richness in organic matter and/or microbial composition are important.
Measurements of nascent SSA composition and water uptake taken during the Surface Ocean Aerosol Production (SOAP) research voyage (Law et al., 2017) over the Chatham Rise in the southwestern Pacific Ocean, on board the R/V Tangaroa (NIWA, Wellington), are reported here. The measured SSA composition and hygroscopicity are presented with respect to an extensive suite of seawater composition. Aitken-mode SSA composition was inferred from volatility data and estimated from ultrafine organic tandem differential mobility analyser (UFO-TDMA) measurements. PM1 composition was measured from analysis of filter samples. These data provide a valuable comparison between Southern Hemisphere observations and existing models for SSA organic enrichment and SSA water uptake.
2.1 SOAP voyage
The SOAP voyage examined air–sea interactions over the biologically productive frontal waters of the Chatham Rise, east of New Zealand in February and March 2012. The Chatham Rise couples pristine marine air masses with high biological activity due to the mixing of warm subtropical water and cool Southern Ocean waters. Subtropical waters have relatively low macronutrient levels, while Southern Ocean waters are depleted in iron but not in macronutrients (Law et al., 2017). Phytoplankton blooms were identified via satellite ocean colour images and further mapped using continuous measurement of seawater parameters (Chl a, dimethyl sulfide and carbon dioxide concentrations). Three broad bloom periods were defined as shown in Fig. 1. The first bloom (B1) occurred 12 h in to the voyage and was characterised by dinoflagellates and displayed elevated Chl a and seawater dimethyl sulfide (DMS), 7 d into the voyage a weakening bloom (B2) was driven by coccolithophores, and a final bloom (B3) displayed a mixture of phytoplankton groups. Bloom 3 was subdivided into B3a and B3b due to changes in the surface water characteristics following the passage of a storm.
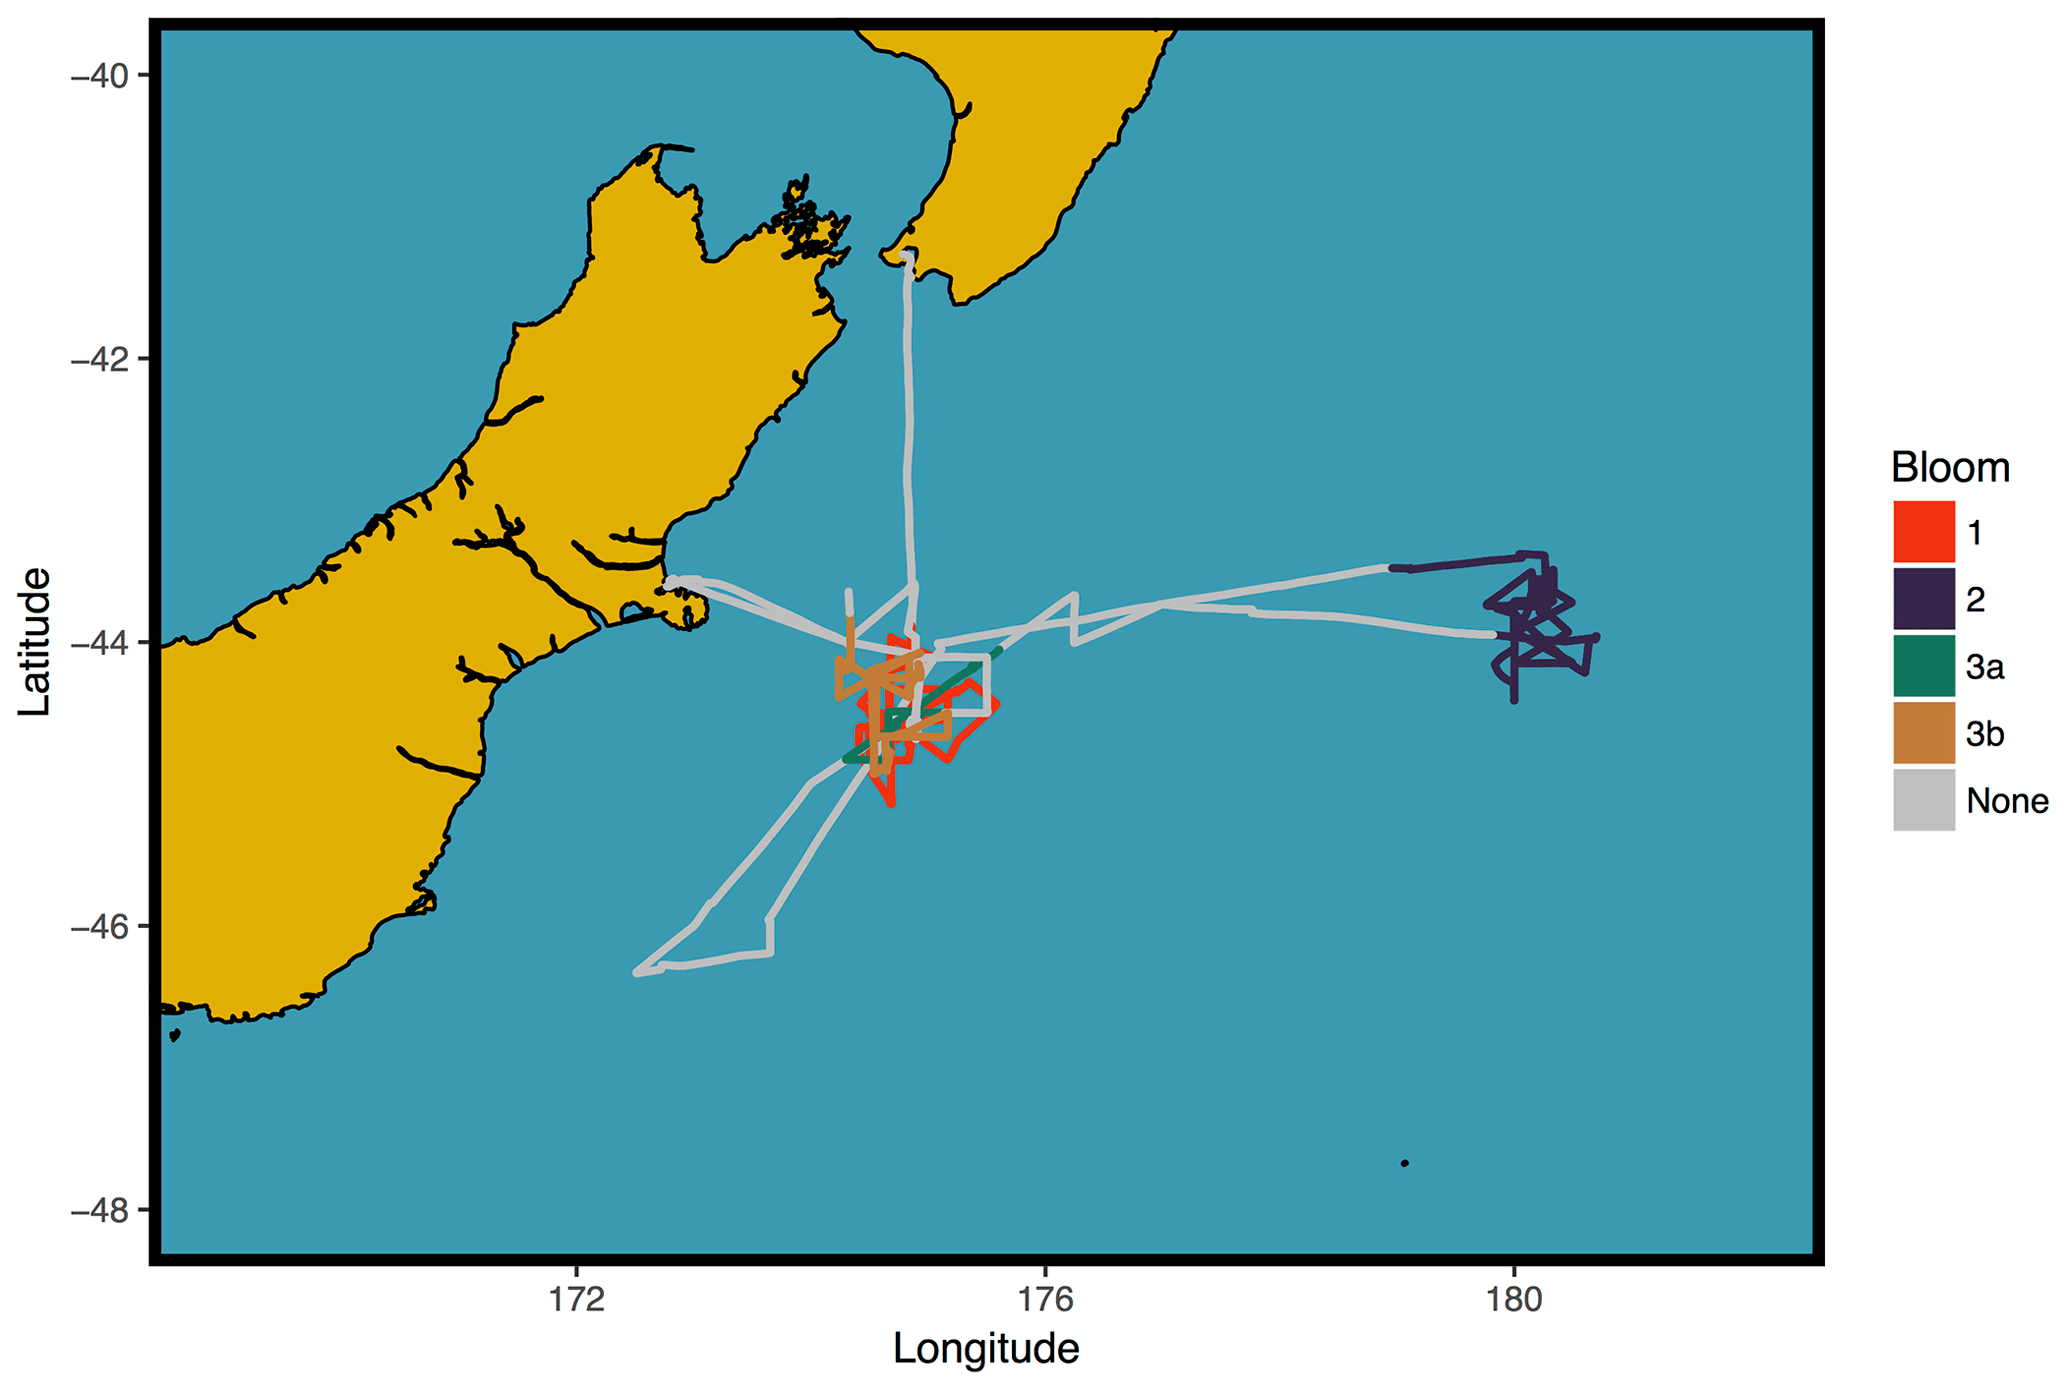
Figure 1Voyage map for SOAP study, coloured by bloom periods.
2.2 Measurements/instrumentation
Seawater samples were collected throughout the voyage for the purpose of generating nascent SSA. Seawater was primarily collected from the ocean surface (approximately 10 cm depth) during workboat operations at a distance from the R/V Tangaroa or from the mixed layer (3–12 m depth, always less than the measured mixed layer depth) from a conductivity, temperature and depth rosette (CTD), and a number of deep water samples were collected for comparison. Due to the sampling method used these seawater samples are not representative of the sea surface microlayer (SML). Samples also spanned the variability in ocean biological conditions observed throughout the SOAP voyage. Table S1 provides a description of the seawater samples that were taken.
Nascent SSA was generated in situ in a 0.45 m3 cylindrical polytetrafluoroethylene chamber housing four sintered glass filters with porosities between 16 and 250 µm (Cravigan, 2015; Mallet et al., 2016). Dried and filtered compressed air was passed through the glass filters at a flow rate of 15.5±3 L min−1, and resulting SSA was sampled from the headspace of the chamber. A diffusion drier was used to dry the sample flow to 20±5 % RH prior to characterisation. Figure 2 shows the sampling set-up used to generate, condition and measure nascent SSA. SSA produced from sintered glass filters does not perfectly represent real-world bubble bursting from wave breaking (Collins et al., 2014; Prather et al., 2013), and the limitations to the methods are discussed in further detail in Sect. 3.2.

Figure 2Experimental schematic of nascent SSA chamber experiments during SOAP voyage. The VH-TDMA (grey) contains an RH-controlled region (blue) used for water uptake measurements.
Size distributions and number concentrations of 10 to 300 nm diameter SSA were measured using a TSI 3080 scanning mobility particle sizer (SMPS), coupled with a 3071 differential mobility analyser and a 3010 condensation particle counter (CPC) (TSI, Shoreview, MN), with an aerosol sample flow rate of 1 L min−1 and a sheath flow rate of 10 L min−1. The volatility and hygroscopicity of nascent SSA was determined with a volatility and hygroscopicity tandem differential mobility analyser (VH-TDMA) (Alroe et al., 2018; Johnson et al., 2008, 2004). The VH-TDMA selects particles based on mobility diameter, conditions them, and measures the resulting particle size distributions using parallel SMPSs (V-SMPS and H-SMPS in Fig. 2), each with a TSI 3010 CPC. The aerosol sample flow rate for each SMPS was 1 L min−1, resulting in a total inlet flow of 2 L min−1, the sheath flows for the pre-DMA, V-DMA and H-DMA were 11, 6 and 6 L min−1, respectively. The VH-TDMA can be operated in a number of sampling modes, although in general the instrument is designed to observe the water uptake at ambient temperature and subsequently observe the water uptake of a low-volatility component (at some elevated temperature), which is used to infer the water uptake of the volatile component. Nascent SSA with a mobility diameter of 50 nm was preselected for each water sample, and a number of water samples were also analysed with a preselected diameter of 30, 100 or 130 nm for comparison. Table S1 details the VH-TDMA analysis preselected particle size. The SSA volatile fraction was determined by measuring the diameter of preselected SSA upon heating by a thermodenuder up to 500 ∘C, in temperature increments of 5–50 ∘C. After heating the SSA hygroscopic growth factor at 90 % RH was measured. The dependence of HGF on RH at ambient temperature was measured for one water sample (Workboat 9) to provide the deliquescence relative humidity (DRH).
Size distributions, volatility and HGFs have also been measured for laboratory sea salt samples, which were generated using the same glass filters, chamber and sample conditioning. A comparison of the sea salt and sea spray volatility (Fig. S3 in the Supplement) was used to calculate the 50 nm SSA organic volume fraction. In addition laboratory sea salt transmission electron microscopy (TEM) samples were collected using a TSI 3089 nanometre aerosol sampler and analysed using X-ray dispersive spectrometry (TEM-EDX). TEM data were collected on a JEOL2100 transmission electron microscope operating at 200 kV coupled with a Gatan high-angle annular dark field (HAADF) detector. TEM images were used to compare the morphology of heated (250 ∘C) and unheated SSA samples, and TEM-EDX data were used to compute enrichment factors for laboratory sea salt.
The ultrafine organic tandem differential mobility analyser (UFO-TDMA, Vaattovaara et al., 2005; Joutsensaari et al., 2001) was used to calculate moderately oxidised organic volume fractions of SSA particles by measuring how much the particle grows in subsaturated (82 % ± 2 %) ethanol vapour. The growth factor of the SSA samples in ethanol vapour was measured at preselected mobility diameters of 15, 30 and 50 nm using the UFO-TDMA. Growth of sodium chloride and ammonium sulfate in ethanol vapour has been shown to be negligible for preselected diameters up to 100 nm (Vaattovaara et al., 2005; Joutsensaari et al., 2001), while oxidised organics (tartaric, benzoic and citric acid) have growth factors of 1.3 to 1.6 in subsaturated (86 %) ethanol vapour. UFO-TDMA and H-TDMA measurements of sample U7520 were pre-treated using a thermodenuder (heated in 10 ∘C steps up to 500 ∘C). This allowed examination of the contribution of volatile components to particle growth in ethanol vapour, but excluded the estimation of organic fractions from VH-TDMA measurements.
SSA generated from 23 ocean water samples was collected on filters for further compositional analysis using transmission Fourier transform infrared (FTIR) and ion beam analysis (IBA). SSA was sampled through a 1 µm sharp cut cyclone (SCC 2.229PM1, BGI Inc., Waltham, Massachusetts) and collected on Teflon filters, with the sample confined to deposit on a 10 mm circular area. Back filter blanks were used to characterise the contamination during handling, and before analysis samples were dehydrated to remove all water, including SSA hydrates, as described in Frossard and Russell (2012). Filter blanks were under the detection limit for the FTIR, and Si was the only compound with blank measurements above the IBA detection limit. FTIR measurements were carried out according to previous marine sampling techniques (Maria et al., 2003; Russell et al., 2011, 2010) and characterised the functional groups associated with major carbon bond types, including saturated aliphatic (alkane) groups, alcohol (used here to include phenol and polyol) groups, carboxylic acid groups, non-acidic carbonyl groups, and primary amine groups. FTIR measurements are non-destructive; therefore, subsequent to FTIR analysis filter samples underwent simultaneous particle-induced X-ray emission (PIXE) and gamma ray emission (PIGE) analysis (Cohen et al., 2004). The elements discussed herein, of interest for SSA, are Na (from PIGE) and Mg, Si, S, Cl, K, Ca, Zn, Br and Sr (from PIXE). It should be noted that Rutherford backscattering and particle elastic scattering analysis did not yield useful results for the analysis of C, N, O and H. The SSA organic concentrations were instead obtained solely from FTIR analysis.
A large number of ocean water measurements were taken, characterising the physical properties, the nutrient concentration, the phytoplankton population, the bloom productivity and the concentration of molecular classes important for SSA, e.g. fatty acids, proteins and carbohydrates. A detailed list of ocean water measurements undertaken during the SOAP voyage is contained in Law et al. (2017). The parameters of interest here are the concentrations of Chl a, dissolved organic carbon (DOC), high-molecular-weight proteins and sugars, alkanes, and the fatty acid concentration. It should be noted that the protein and carbohydrate measurements include both dissolved and particle components. Fatty acid measurements are made up of measurements from 34 individual fatty acid species, which can be broken up into saturated (14 species), monounsaturated (9 species) and polyunsaturated (11 species). Alkanes were also speciated, with carbon numbers ranging from 13 to 36. Details of the sampling and analysis methodology for the parameters used in this paper are available in the Supplement.
2.3 Data analysis
Nascent SSA size distributions for each water sample were averaged and normalised to their maximum value. Non-linear least square fits of up to four log-normal modes were fitted to each distribution with a random selection of initial values for the geometric mean and standard deviation, constrained to 10–320 nm and less than 2, respectively. The most appropriate fit was determined using the Bayesian information criterion, which is a measure of the error in reconstructing the measured size distribution that applies a penalty based on the number of parameters used and therefore avoids overfitting (Sakamoto et al., 1986).
All VH-TDMA data were inverted using the TDMAinv algorithm (Gysel et al., 2009), and external modes were allocated based on local maxima of the resulting piecewise linear GF distribution. Volatility measurements and hygroscopicity measurements were inverted separately and a single volatility growth factor (VGF) mode was used to correct HGF for volatility. The volatile fraction (VF) was computed using Eq. (1), where d is the particle diameter, T denotes the temperature of the thermodenuder and 0 denotes ambient temperature.
In this study SSA organic volume fractions were calculated using volatility measurements, by accounting for the presence of sea salt hydrates. The volatility due to hydrates was used as a proxy for the proportion of inorganic sea salt in the natural seawater samples, which in turn provided the proportion of organics. The volume of hydrates is assumed to be a stable proportion of the sea salt volume, and there is assumed to be no contribution to the hydrates from SSA organics. As the organic fraction of internally mixed SSA increases, the sea salt fraction decreases and the hydrate fraction decreases in proportion to the sea salt as illustrated in Fig. S2. The sea salt fraction was computed by comparing natural sea spray volatility profiles and laboratory sea salt volatility profiles. In this study it was assumed that volatility was due to the evaporation of hydrates over the temperature range 200–400 ∘C, i.e. that semi-volatile organics evaporate at temperatures less than 200 ∘C and non-volatile (or more precisely low volatility) organics evaporate at temperatures above 400 ∘C. This assumption is supported by previously reported volatility profiles of nascent SSA generated from natural seawater and from laboratory sea salts, which are consistently parallel at 200–400 ∘C, indicating that the volatility is due to the evaporation of similar components i.e. hydrates (Modini et al., 2010b; Rasmussen et al., 2017). If the SSA samples contained some organics that evaporated between 200 and 400 ∘C, these would be incorrectly assigned as inorganic sea salt hydrates, in this respect the computed organic volume fractions could be considered lower limits. It is also possible that the charring of semi-volatile organics could also lead to misattribution as low-volatility organics.
The organic volume fraction was inferred from volatility measurements using the linear model outlined in Eq. (2), and shown in Fig. S3, where VFT is the measured volatile fraction of the sea spray sample at thermodenuder temperature T and VFT,SS is the measured volatile fraction of laboratory sea salt at temperature T. The slope of Eq. (2), f, is the proportion of volatility due to sea salt hydrates and was assumed to represent the proportion of hydrated sea salt in the natural seawater samples. The total organic volume fraction is then given by 1−f. For example an internally mixed SSA particle with an organic volume fraction of 50 % and a sea salt (including hydrate) volume fraction of 50 % has half the volume of hydrates compared the laboratory sea salt particles of the same diameter. The volatility due to hydrates will be reduced by half, and therefore f will also be reduced by half relative to laboratory sea salt, assuming that hydrates dominate the volatility at 200–400 ∘C. Further detail on the linear fits for individual samples is shown in the Supplement.
Laboratory sea salt volatility profiles were measured using three different sea salt samples, a commercially available sea salt (Pro Reef Sea Salt, Tropic Marin, Wartenberg, Germany) and two mixtures of laboratory grade salts, one mimicking Sigma-Aldrich sea salts composition and one mimicking the Niedermeier et al. (2008) Atlantic Ocean sea salt composition. Sea salt solutions were all made to a concentration similar to seawater, 35 g L−1, and volatility profiles were within experimental error of one another. The error in the laboratory sea salt volatile fractions was assumed to be the maximum of the standard error in the mean across the three sea salt samples and the instrumental error (±3 %).
The method used to compute the organic volume fraction implicitly assumes that the proportion of hydrates in the sea salt component of SSA is constant; however, observations have shown variability in inorganic composition of SSA can vary (Salter et al., 2016; Schwier et al., 2017; Ault et al., 2013a), particularly species such as Ca, Cl and Mg, which are potentially important for the formation of hydrates. As a result a further correction was applied to f for the case where the composition of inorganic sea salt, and therefore hydrates, is different between the natural SSA sample and the laboratory sea salt sample. The correction is represented by fio in Eq. (3). Ca and Mg enrichment and associated Cl depletion can result in an overall reduction in hydrate-forming sea salt species, such as CaCl2 and MgCl2 (Salter et al., 2016; Schwier et al., 2017). The ionic composition of nascent SSA generated from natural seawater was measured using ion beam analysis and used to compute the inorganic molecular composition, which in turn was used to compute the volume fraction of hydrates for each sample as described in the Supplement. The same analysis was performed based on the ionic composition of laboratory sea salts, and fio was computed as the ratio of natural seawater SSA hydrate volume fraction to laboratory sea salt hydrate volume fraction. These calculations of the sea salt hydrate fraction used the PM1 measurements but were applied to 50 nm diameter SSA. This is a potential source of uncertainty to the computed OVF, which is sensitive to changes in fio. There would have to be an appreciable difference in the enrichment of a hydrate-forming component between the 50 nm SSA and both the PM1 SSA and 50 nm sea salt for this to impact the OVF. Previous observations have shown size-dependent enrichment in the submicron SSA Ca and Mg components for example (Salter et al., 2016; Keene et al., 2007), but this has also been observed for sea salt (Salter et al., 2016). In the context of this study an increase in the volatility due to an increase in hydrates at 50 nm (relative to PM1) is assumed to be reflected in the sea salt volatility and have little impact on the computed OVF.
The volume fraction of semi-volatile organics in the nascent SSA generated from natural seawater, which evaporate at temperatures less than 200 ∘C, was computed from the intercept in Eq. (2). Uncertainties for OVFsv and OVFtot were taken to be whichever is the maximum out of the measurement error for VF and the standard error for the intercept and slope, respectively. The measurement error in VF is ±3 %, which is due to a 1 % DMA sizing uncertainty (Johnson et al., 2004; Modini et al., 2010a). This approach quantifies the proportion of volatility due to the presence of hydrates and due to the presence of organics and is therefore an improvement on previously published estimates of the SSA OVF (Mallet et al., 2016; Modini et al., 2010a; Quinn et al., 2014).
The HGF was computed using Eq. (4), where dRH,T is the measured diameter at the RH of the H-SMPS (90 % for all except the DRH measurement) and thermodenuder temperature T, and ddry,T is the measured dry diameter at thermodenuder temperature T. HGFs for sea salt were shape corrected using the dynamic shape factor from Zieger et al. (2017). The presence of an organic fraction has been observed to increase the sphericity of nascent SSA (Laskin et al., 2012); therefore, an organic-fraction-dependent shape correction was applied (Zelenyuk et al., 2007). A single shape factor was used across all temperatures because TEM images of laboratory sea salt showed an insignificant difference between the apparent shape of SSA at ambient temperature and those heated to 250 ∘C (Fig. S4).
The PM1 organic mass fraction from SSA samples collected on filters was computed from the total organic mass from FTIR analysis and the inorganic mass from ion beam analysis, as in Eq. (5). The filter exposed area (0.785 cm2 was used to convert inorganic areal concentrations into total mass. The inorganic mass (IM) was computed as the sum of Na, Mg, SO4, Cl, K, Ca, Zn, Br and Sr. The measured S mass was used to calculate the SO4 mass; all S was assumed to be in the form of SO4. The uncertainty in the organic mass measured using FTIR is up to 20 % (Russell, 2003; Russell et al., 2010); this is taken as the uncertainty in the PM1 organic mass fraction (OMF).
Enrichment factors for inorganic elements were calculated with respect to the laboratory-prepared seawater and presented with respect to Na+ (Salter et al., 2016), as shown in Eq. (6), where X is the element of interest. Enrichment factors were calculated from ion beam analysis of filter samples and from TEM-EDX analysis of laboratory sea salt samples.
The OCEANFILMS model was implemented for the surface and mixed layer nascent SSA experiments with measured water parameters used to represent bulk seawater molecular classes. Lipids were assumed to be equal to the total concentration of fatty acids, the total high-molecular-weight proteins were used to represent the protein molecular class and high-molecular-weight reducing sugars were used to represent polysaccharides. Note that these measurements were not microlayer measurements; the seawater samples were collected via CTDs or on workboats. Missing water composition data were filled using the relationships outlined in Burrows et al. (2014), based on the lifetime of each molecular class; for example the bulk concentration of proteins was assumed to be equal to one-third of the polysaccharide concentration, when no other data were available. The humic-like molecular class was assumed not to be present at the surface and in the mixed layer and was therefore not included (Burrows et al., 2014). The processed molecular class concentration was assumed to make up the remainder of the dissolved organic carbon (DOC) after polysaccharides, proteins and lipids have been subtracted; a minimum was applied to the concentration of processed compounds to prevent unrealistically low or negative concentrations. The Langmuir adsorption coefficients for each molecular class were taken directly from Burrows et al. (2014). OCEANFILMS was run including the co-adsorption of polysaccharides with all other molecular classes (Burrows et al., 2016) and an assumed bubble thickness of 0.3 µm. The effect of the bubble thickness is to change the ratio of organics to salt in the bubble film and therefore the SSA organic fraction; however, the distribution of organic molecular classes does not vary. The assumed bubble thickness was not based on any measured bubble parameters.
The ZSR approximation was used to compute the ambient temperature nascent SSA HGF, defined as the average of all measurements less than 45 ∘C, and the heated nascent SSA HGF, defined as the average HGF for all measurements between 255 and 405 ∘C. The terms used in the ZSR mixture were sea salt, low-volatility organics, semi-volatile organics and hydrates. The volume fraction of each of these components was based on the volatility measurements (Eqs. 2 and 3); the hydrate fraction was computed from the difference between the VF at 255–405 ∘C and the OVFsv. The HGFs for the hydrate component, semi-volatile organic component and low-volatility organic component were assumed to be 1 (Modini et al., 2010a), and the HGF for the sea salt component was assumed to be 2.15 at 50 nm, based on measurements of heated laboratory sea salt 2.15±0.06 averaged across 300–350 ∘C. The sea salt HGF is also consistent with the HGF of pure NaCl (Zieger et al., 2017), which represents the HGF of sea salt without hydrates. HGFs have not been Kelvin corrected here because all measurements were performed at the same preselected particle size. The hydrate fraction of the salt has been explicitly included here to account for any variation in the proportion of hydrates between samples. Calculations using the ZSR approach were repeated using an organic (semi-volatile and low volatility) HGF of 1.6 as a sensitivity test for the relationship between OVF and HGF. The HGF of 1.6 was chosen as an upper limit for organics that could possibly be present in SSA (Estillore et al., 2016, 2017).
As a counterpoint to the ZSR assumption, which assumes the organic component is dissolved into the bulk, the compressed film model (Ruehl et al., 2016) was applied to explore the influence of partitioning organics to the surface on the nascent SSA water uptake. The composition of the SSA organics is unknown; therefore, the compressed film model was computed for organics with a molecular volume of Vorg of m3 mol−1 and a molecular area (A0) of 150 Å2. A C0 value of 10−9 mol mol−1 and a surface tension minimum of 0.03 J m−2 was applied. The molecular volume was chosen to broadly represent the molecular volume of marine organics, most notably lipids and polysaccharides (Petters et al., 2009). The molecular area was chosen to correspond with calculations on sea spray mimics in Forestieri et al. (2018b), who pointed out that, to have an impact on surface tension, A0 needs to be in excess of 100 Å2. The speciation of organics into molecular classes was calculated from the functional group concentrations as shown in Burrows et al. (2014) and applied in the compressed film model. HGFs were computed using the compressed film model for three cases, assuming that just the lipids are able to partition to the surface, assuming that the lipids and the polysaccharides are able to partition to the surface, and assuming that all of the organics are able to partition to the surface. The hygroscopicity of the bulk aerosol, i.e. the component not partitioned to the surface, was computed using the ZSR assumption as outlined in the previous paragraph, with an organic HGF of 1.6, which matches the hygroscopicity of the surface component. Further detail on the implementation of the compressed film model is included in the Supplement.
3.1 Seawater composition
Chl a concentrations from water samples used to generate SSA ranged from 0.29 to 1.53 µ g L−1 as shown in Fig. 3, which are indicative of productive open-ocean regions (O'Dowd et al., 2015), in particular for the Southern Hemisphere. Measured Chl a concentrations are up to an order of magnitude lower than previous SSA measurements taken in coastal waters (Frossard et al., 2014; Quinn et al., 2014). Significant correlations were observed between Chl a and total high-molecular-weight proteins and polyunsaturated fatty acids (R2=0.51, p value < 0.01). The saturated fatty acid component was the largest contributor to the total fatty acid concentration and was made up of stearic, palmitic, myristic and lauric acid (C18 to C12, all even). Monounsaturated fatty acids were dominated by oleic acid (C18), and polyunsaturated fatty acids were made up of docosahexaenoic and eicosapentaenoic acid (C22 and C20). Fatty acid concentrations showed significant correlation with the concentration of alkanes (R2=0.75, p value < 0.001), particularly monounsaturated fatty acids. Alkanes displayed even carbon numbers from 16 to 28, with peak concentrations for octadecane (C18) and eicosane (C20). It is worth noting that fatty acid and alkane measurements were only done for the surface and mixed layer samples and were not done for the deep water samples.
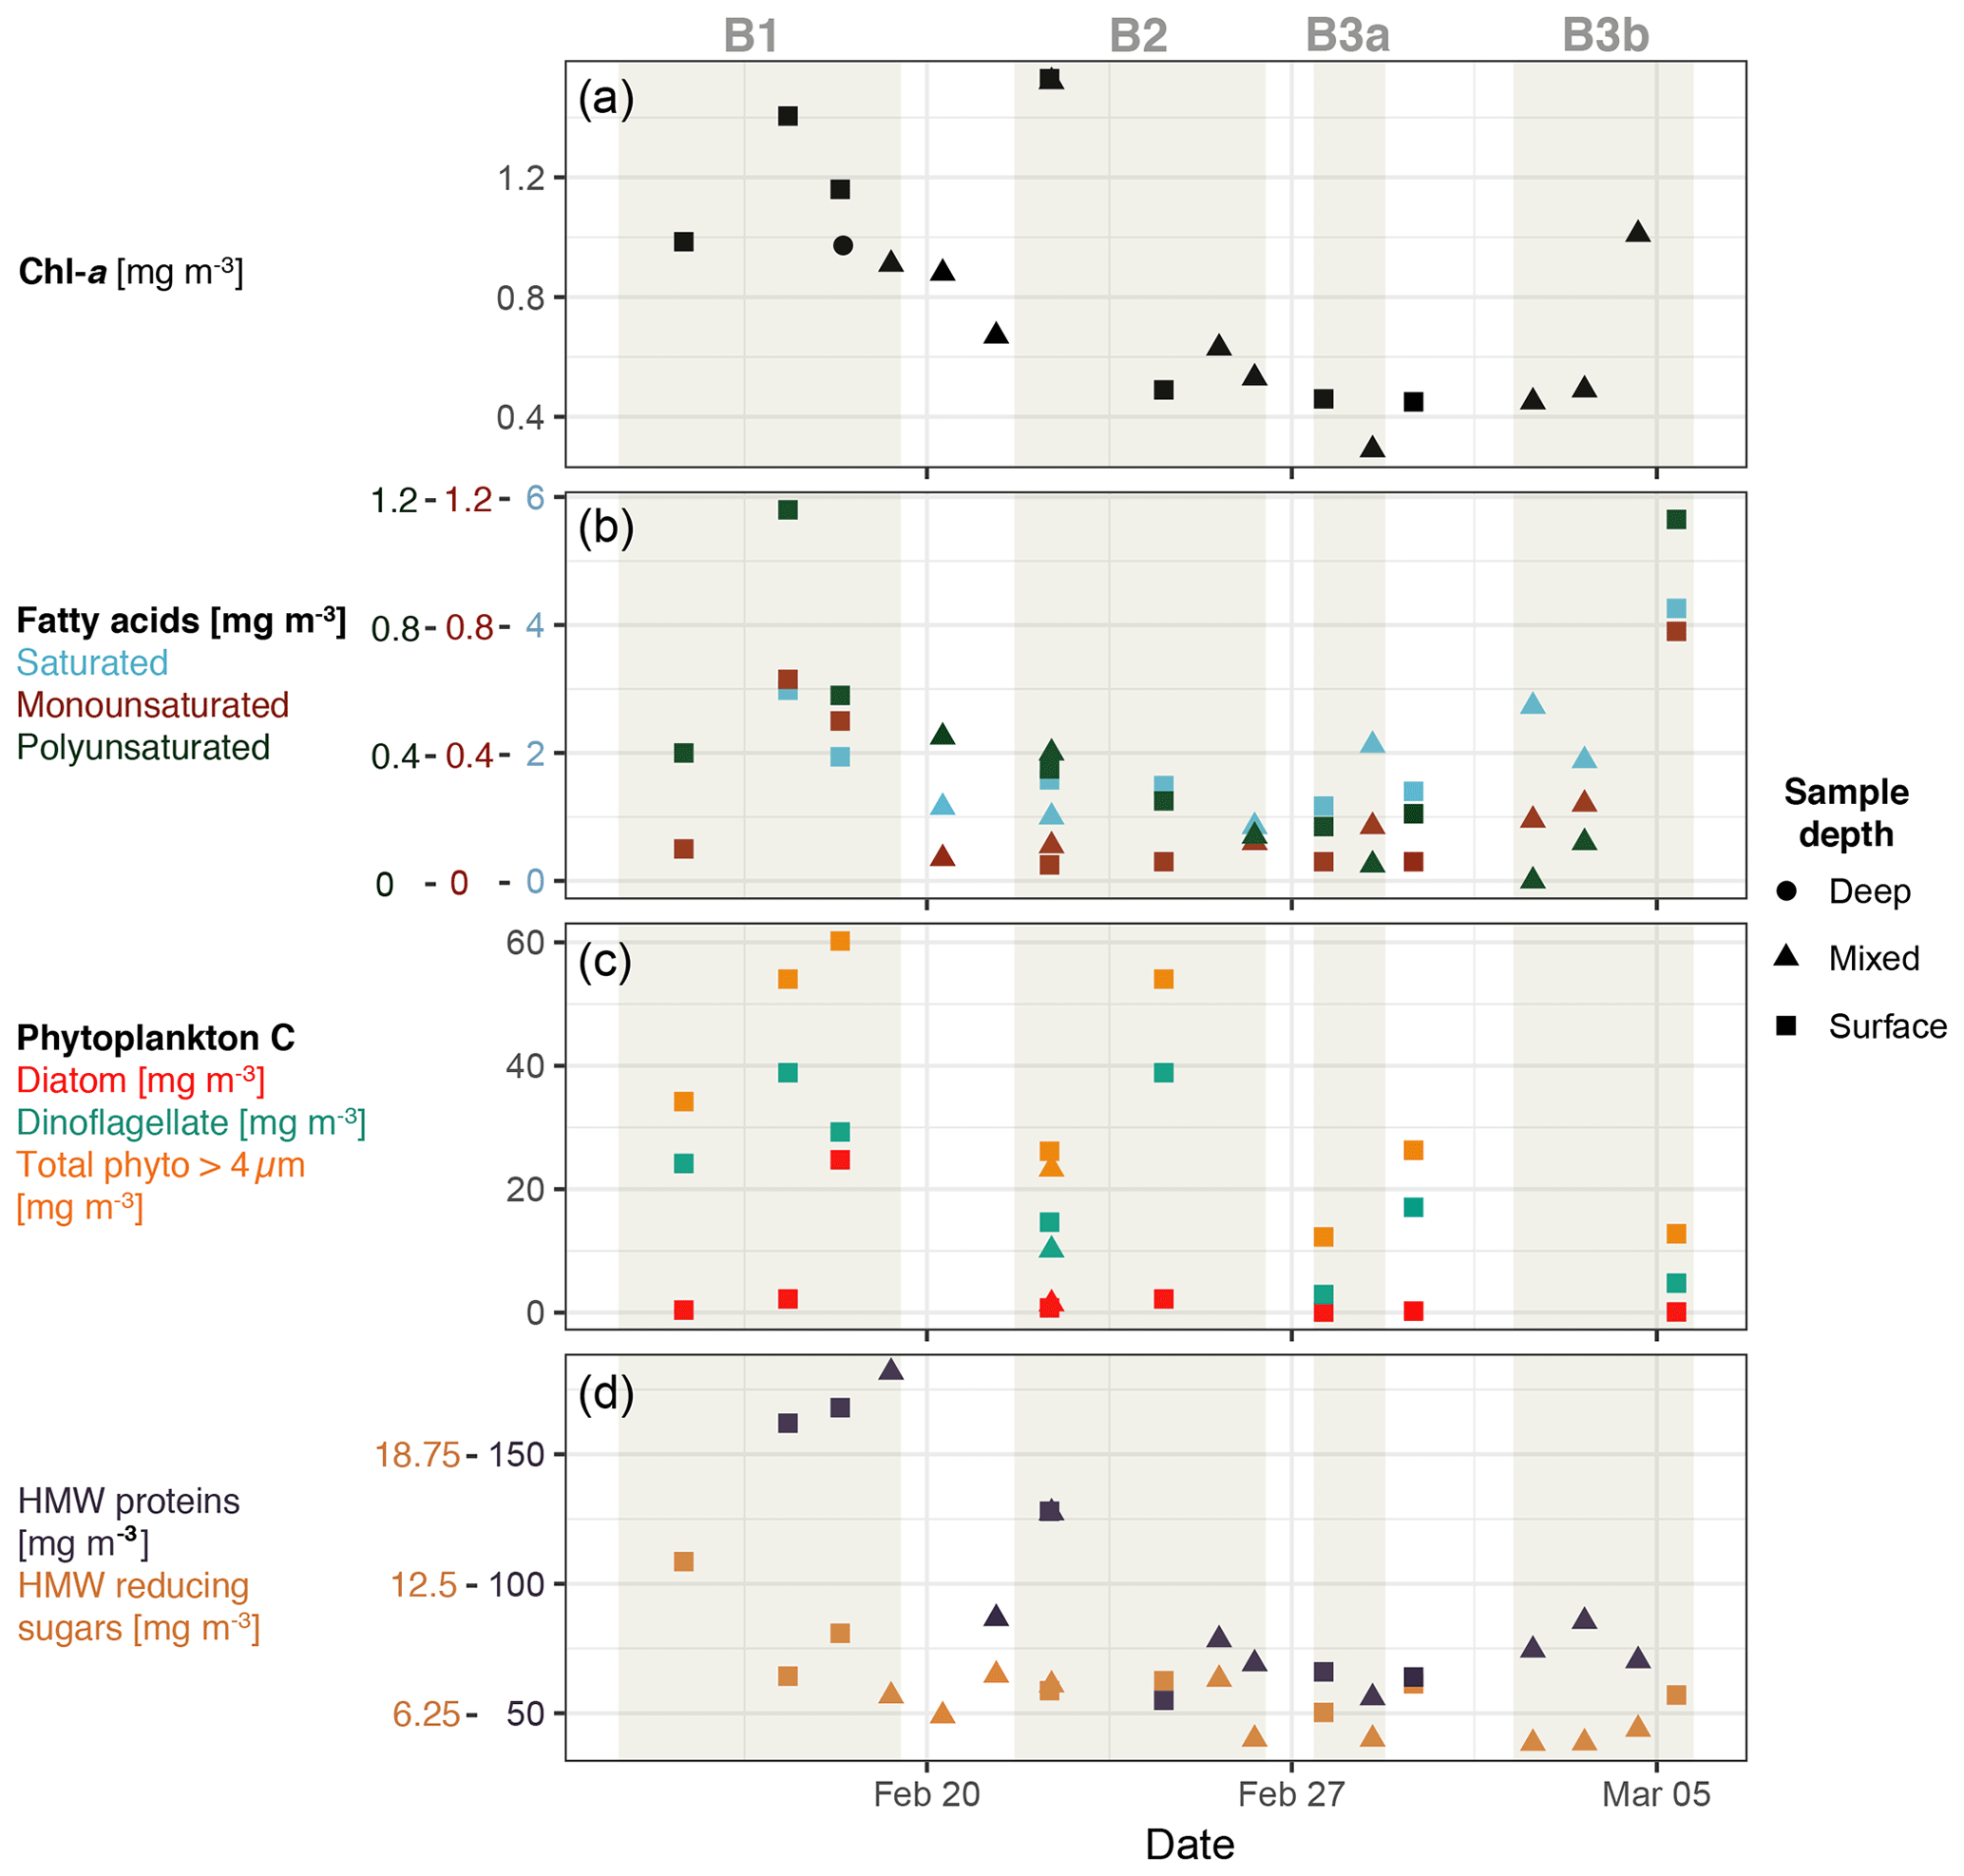
Figure 3Characterisation of biological activity for water samples used to generate SSA. Note that this is a selected subset of all water parameters. Panels show the concentration of Chl a (a), fatty acids (b), phytoplankton carbon (c), and total high-molecular-weight (HMW) reducing sugars and proteins (d). Note that total HMW proteins and reducing sugars include particle and dissolved fractions. Shapes represent the water sample depth class (surface 0.1 m, mixed 3–12 m and deep >12 m).
Bloom 1 was dominated by dinoflagellates and displayed the highest average Chl a concentrations of 0.84±0.2 g L−1 and total phytoplankton carbon concentrations. Relatively short-lived aliphatic species, such as fatty acids and alkanes, were elevated during bloom 1, as were proteins, which are of intermediate lifetime. High-molecular-weight reducing sugars were elevated during bloom 1, although less so than the proteins. Elevated surface concentrations were also noticeable during bloom 1, particularly for the aliphatic species, in particular alkanes with 3.1 times higher average concentration from surface measurements (∼0.1 m) than from shallow mixed layer measurements (∼2 m), as well as fatty acids with 1.7 (saturated) to 4.2 (monounsaturated) times higher surface concentrations. Elevated surface concentrations were also observed for Chl a (1.7 times higher) and carbohydrates (1.5 times higher). The apparent gradient in organics in the surface seawater is distinct for bloom 1 and points to a potentially enhanced contribution from surface-active species over this bloom.
Bloom 2 was characterised as a coccolithophore bloom (Law et al., 2017) and displayed decreasing Chl a, fatty acid and high-molecular-weight protein concentrations throughout the bloom. The overall organic concentrations in bloom 2 were lower than bloom 1, with average Chl a concentrations of 0.67±0.3 g L−1; however, DOC concentrations were slightly elevated (807±65 g L−1) compared to bloom 1 (714±135 g L−1) and bloom 3 (718±84 g L−1). The number of measurements during bloom 3 were limited; however, initially the bloom displayed similar concentrations to bloom 2, Chl a of 0.44±0.17 g L−1, and the final measurements of bloom 3b displayed elevated Chl a and fatty acid concentrations. Bloom 3 displayed the lowest total phytoplankton carbon concentrations.
3.2 SSA size distributions
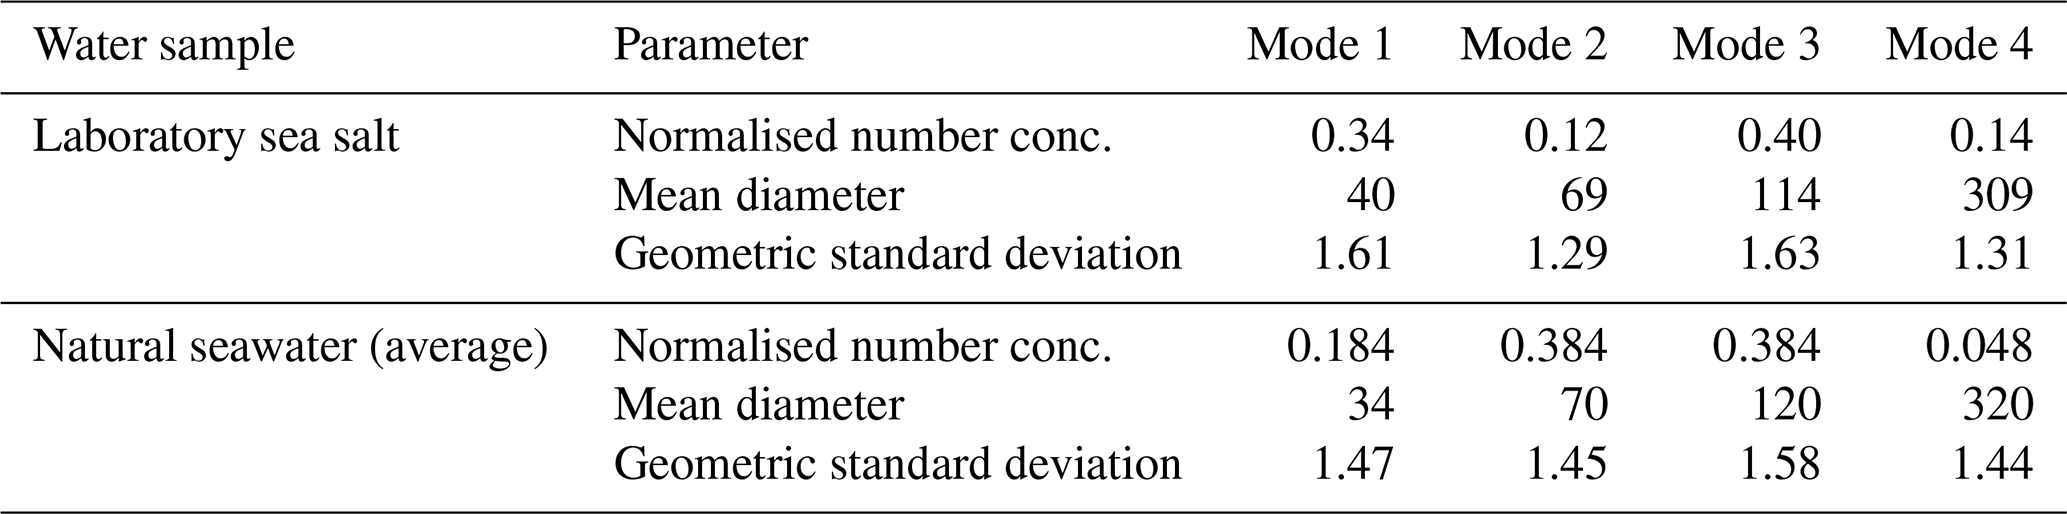
The measured size distributions were broken up into four log-normal modes characterised by geometric mean diameters ranging from 33 to 320 nm, as seen in Fig. 4. This is consistent with the number of log-normal modes fitted by Fuentes et al. (2010) and is not a direct result of the use of four glass filters in this study but a result of using sintered glass filters in general. Size distributions generated from natural seawater were slightly shifted towards larger diameters compared to laboratory sea salt measurements and showed a significant enhancement in mode 2 and lower contributions from modes 1 and 4 (Fig. 4 and Table 1). The size distribution of SSA generated from natural seawater samples is more narrow than laboratory sea salt particle size distributions, which is consistent with the addition of a surfactant material (Fuentes et al., 2010; Modini et al., 2013) which allows the saline components of the bubble film to drain more before bursting, producing an organically enriched particle with a more uniform distribution. Differences between the shape of inorganic sea salt and organically enriched sea spray size distributions have not been observed in all studies (Forestieri et al., 2018a; Zabori et al., 2012).
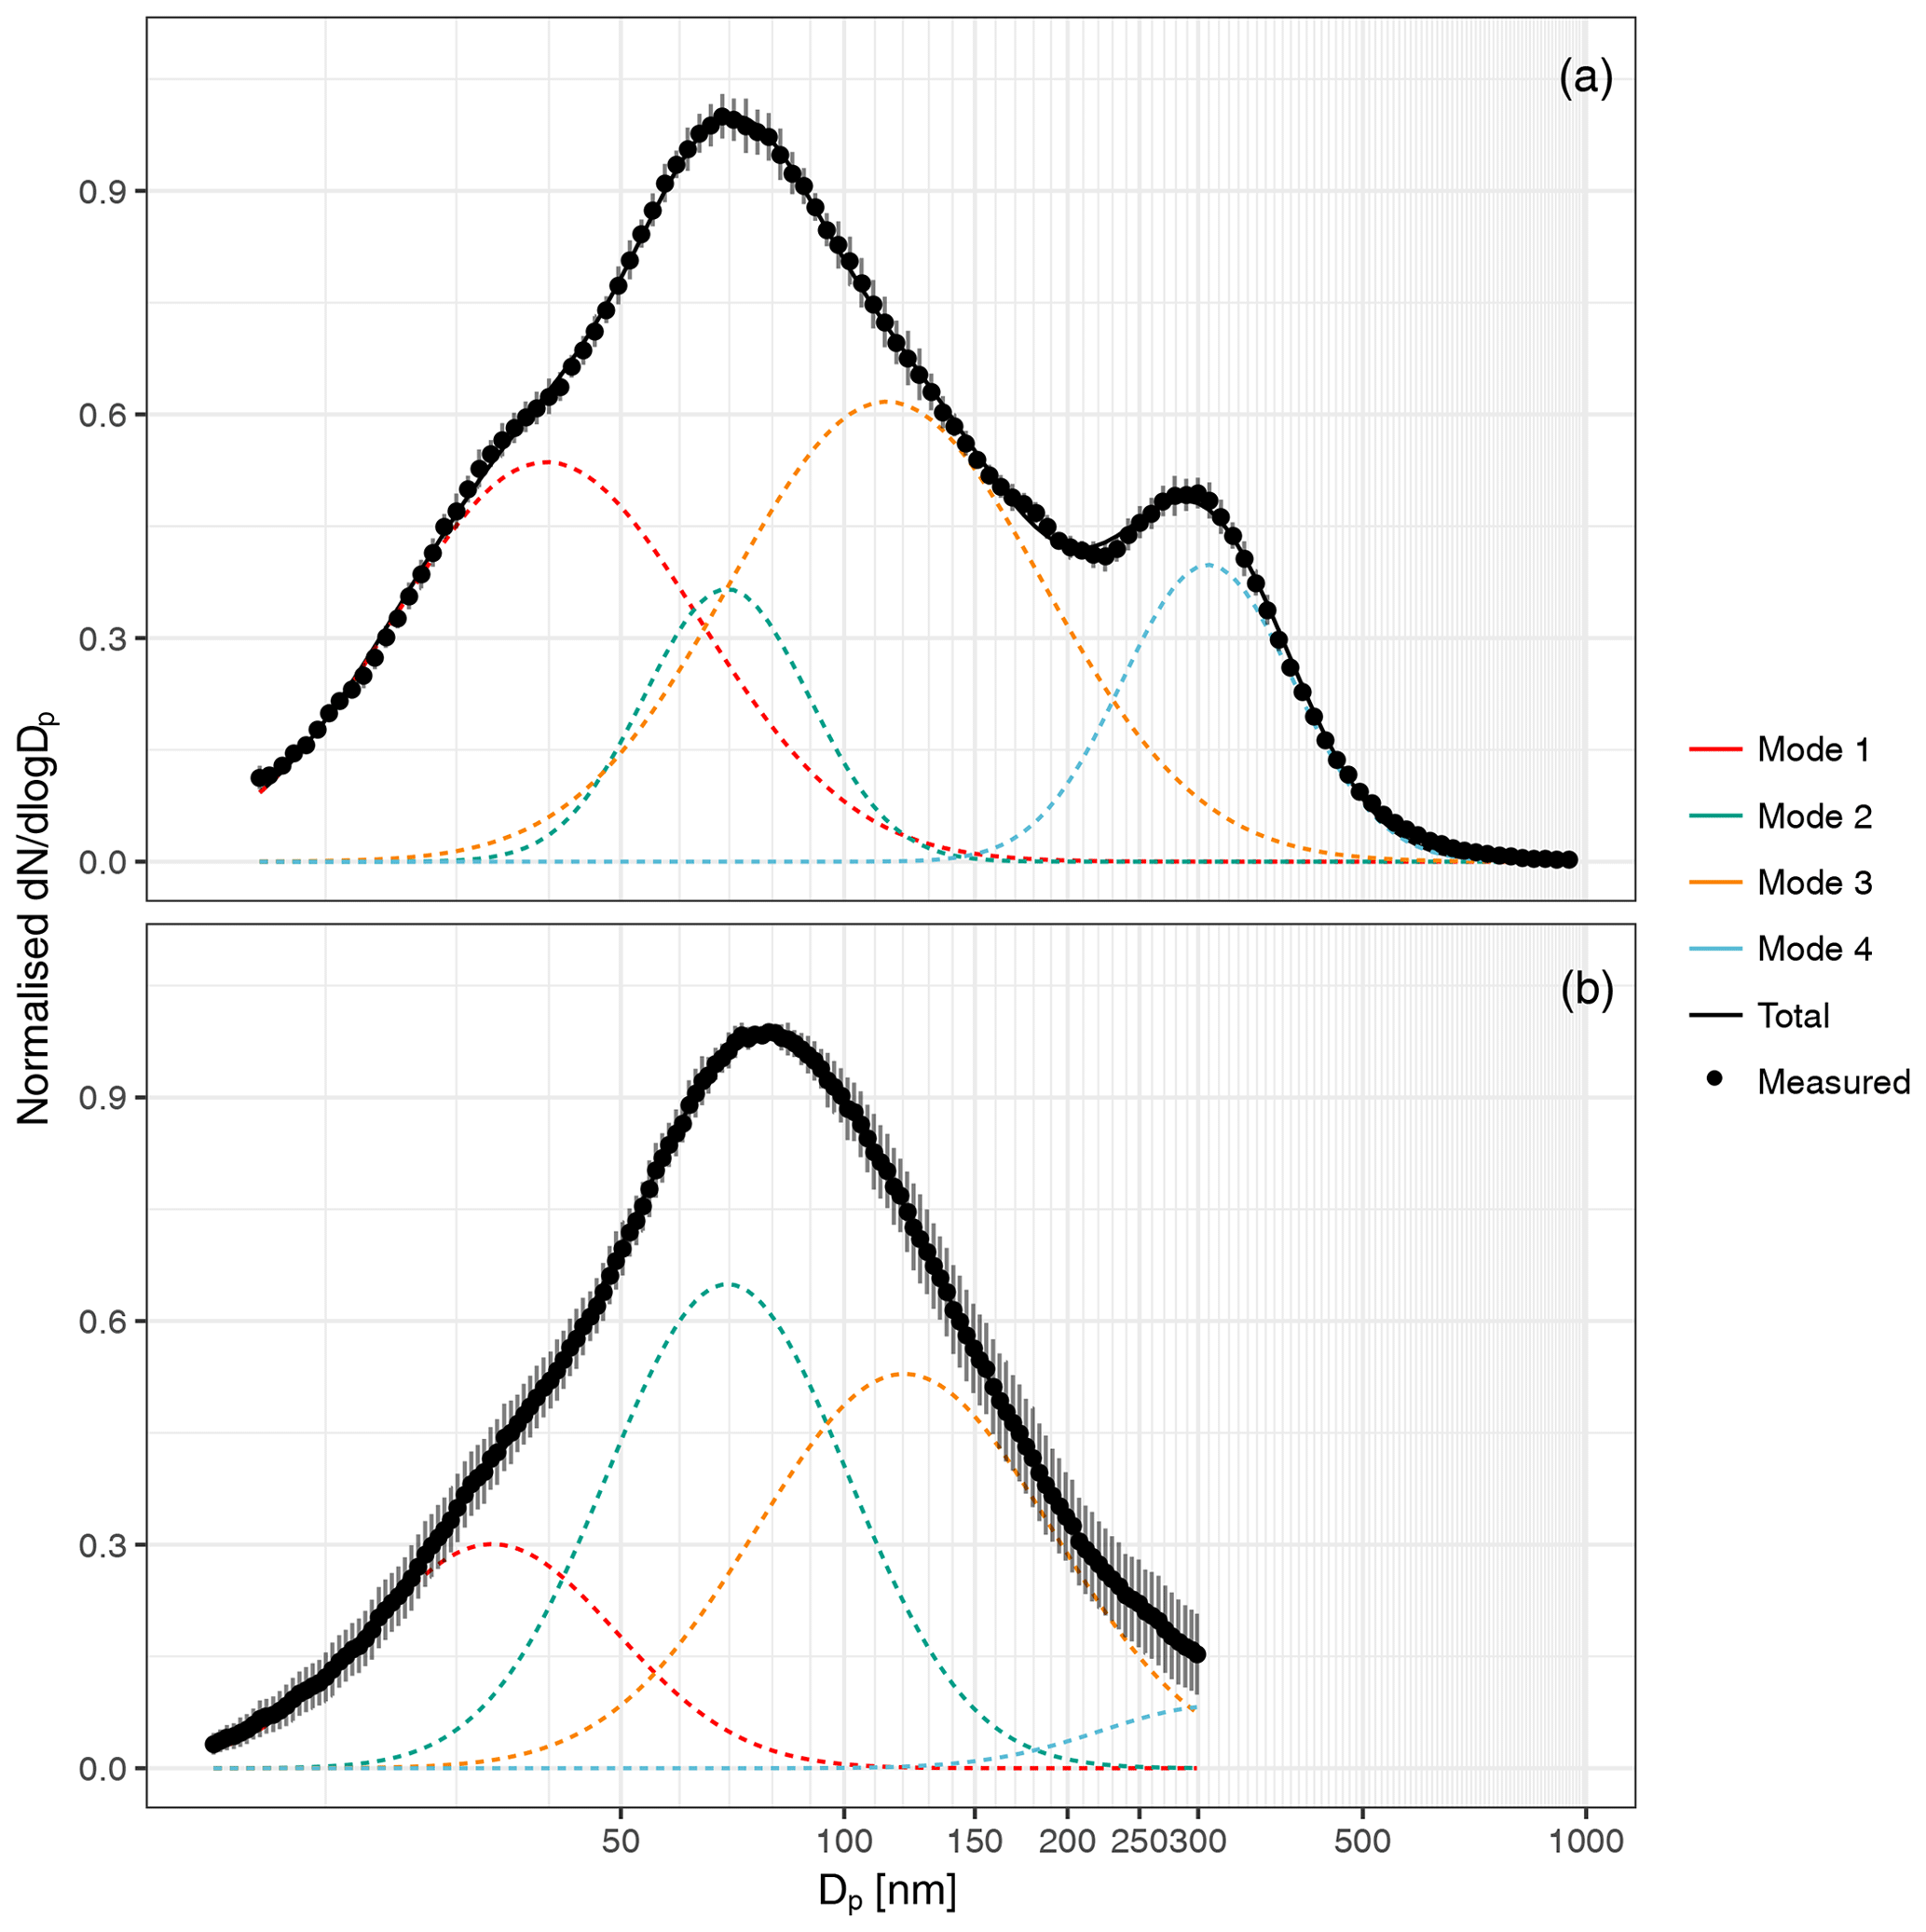
Figure 4Nascent SSA size distributions from laboratory sea salt measurements (a) and natural seawater measurements (b). Seawater size distributions are an average of all water samples. Lines represent the fitted modes (dotted) and total fitted distribution (solid), black dots represent measured values, and grey bars indicate the standard deviation in dN∕dlog Dp.
The shape of the nascent SSA size distribution was broadly similar to nascent SSA size distributions observed in previous studies which also used sintered glass filters but shifted to slightly larger mean diameters. For example Fuentes et al. (2010) fitted log-normal modes with mean mobility diameters of 20, 41, 87 and 250 nm to laboratory sea salt generated using glass sintered filters, as well as modes with mean mobility diameters of 14, 48, 124 and 334 nm for plunging-water-generated sea salt. SSA produced from sintered glass filters does not perfectly represent real-world bubble bursting from wave breaking (Collins et al., 2014; Prather et al., 2013), but the use of four glass filters with different pore sizes resulted in a broader distribution than other measurements of nascent SSA using glass filters (Collins et al., 2014; Fuentes et al., 2010; Keene et al., 2007; Mallet et al., 2016). For example, the normalised number contributions from mode 1 and mode 4 were 3 times greater than that observed by Fuentes et al. (2010). Observations have shown organic enrichment (King et al., 2013) and also externally mixed organics (Collins et al., 2014) for Aitken- and accumulation-mode SSA using sintered glass techniques, with slightly higher organic enrichment than that observed using plunging-water or wave-breaking methods. Despite the limitations, the use of sintered glass filters allowed an examination of the components of seawater that contribute to SSA organic enrichment.
3.3 SSA composition
Volatility measurements using the VH-TDMA indicated that the SSA volatile organic fraction made up a relatively consistent proportion of the 50 nm SSA, with a OVFSV of 0.10±0.04 (mean ± SD), as shown in Fig. 5. SSA compositional results are also tabulated in the Supplement. The low-volatility organic fraction, however, made up a much more variable proportion, with an average OVFLV of 0.13±0.20. The 50 nm OVF was highest during bloom 1 (generally greater than 0.4 and as high as 0.85), which is coincident with seawater samples enriched in organics, during which time low-volatility organics dominated. A dominant low-volatility organic SSA fraction has been observed for nascent SSA measurements in the North Pacific and North Atlantic oceans (less than 15 % volatilised at below 230 ∘C), as well as in the Great Barrier Reef (Bates et al., 2012; Mallet et al., 2016; Quinn et al., 2014); our observations are broadly consistent with these results. It should be noted that a low-volatility SSA fraction is not universally observed (Modini et al., 2010a; O'Dowd et al., 2004; Ovadnevaite et al., 2011b). Organic mass fractions measured using FTIR and ion beam analysis of filter samples averaged 0.12±0.6 and were elevated during bloom 1 with surface water samples displaying PM1 OMFs of approximately 0.2. The values observed here fit within the broad range of observed PM1 OMFs for nascent SSA; for example at Mace Head summertime SSA organic mass fractions of up to 0.8 have been observed (Facchini et al., 2008; O'Dowd et al., 2004), while summertime OMFs of 3 %–7 % have been observed for the North Atlantic and North Pacific oceans (Bates et al., 2012; Quinn et al., 2014).
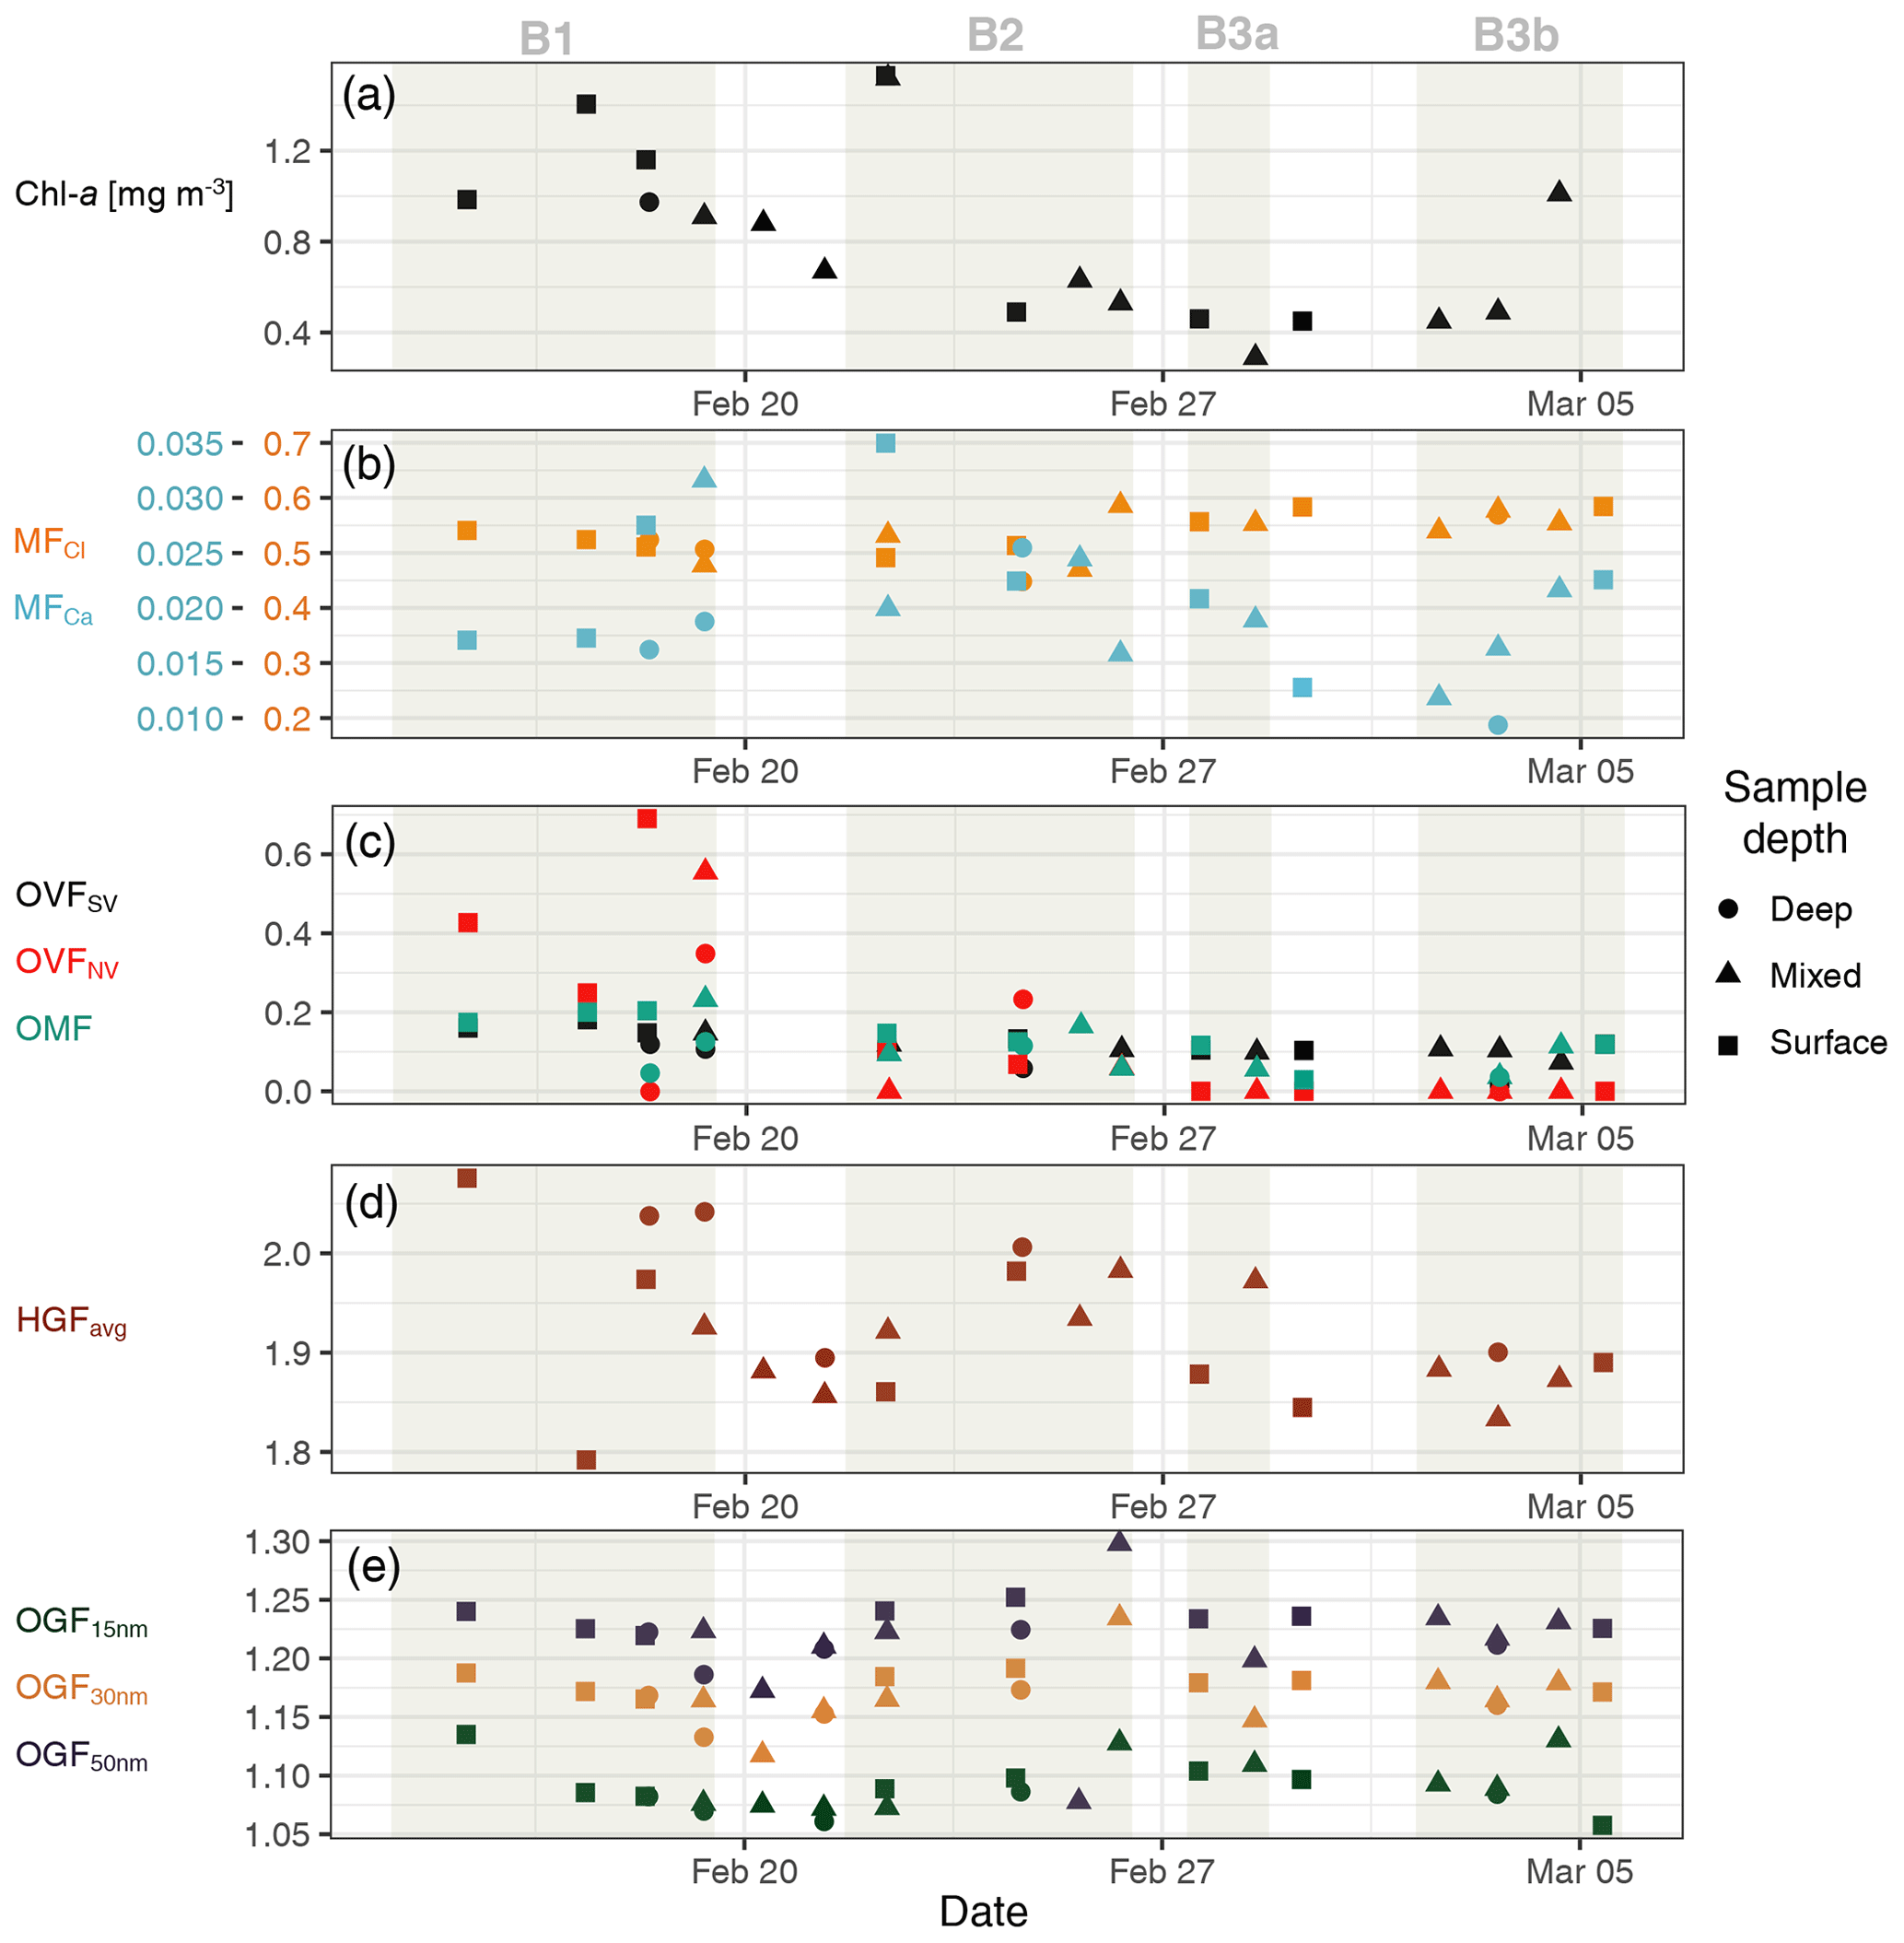
Figure 5Summary of nascent SSA properties. Chl a time series included for context on phytoplankton bloom conditions (a). Mass fractions (MF) of Cl− and Ca2+ (multiplied by 20) relative to total inorganic mass concentrations measured using IBA on filter samples (b). VH-TDMA OVFSV, OVFLV and FTIR/IBA-derived PM1 OMF from filter samples (c). HGF measured using VH-TDMA (d); organic growth factor measured using UFO-TDMA (bottom panel).
Figure 6 shows that the organic volume fraction inferred using volatility techniques and the mass fraction measured using FTIR/IBA of the filter samples correlate reasonably well. No information on the organic fraction of the log-normal modes shown in Fig. 4 is available; therefore, a direct comparison of PM1 OMF is not shown here. It is worth noting that the presence of inorganic species, such as Ca2+, complexed with the organics is included in organic estimates from volatility but not from filter analyses.
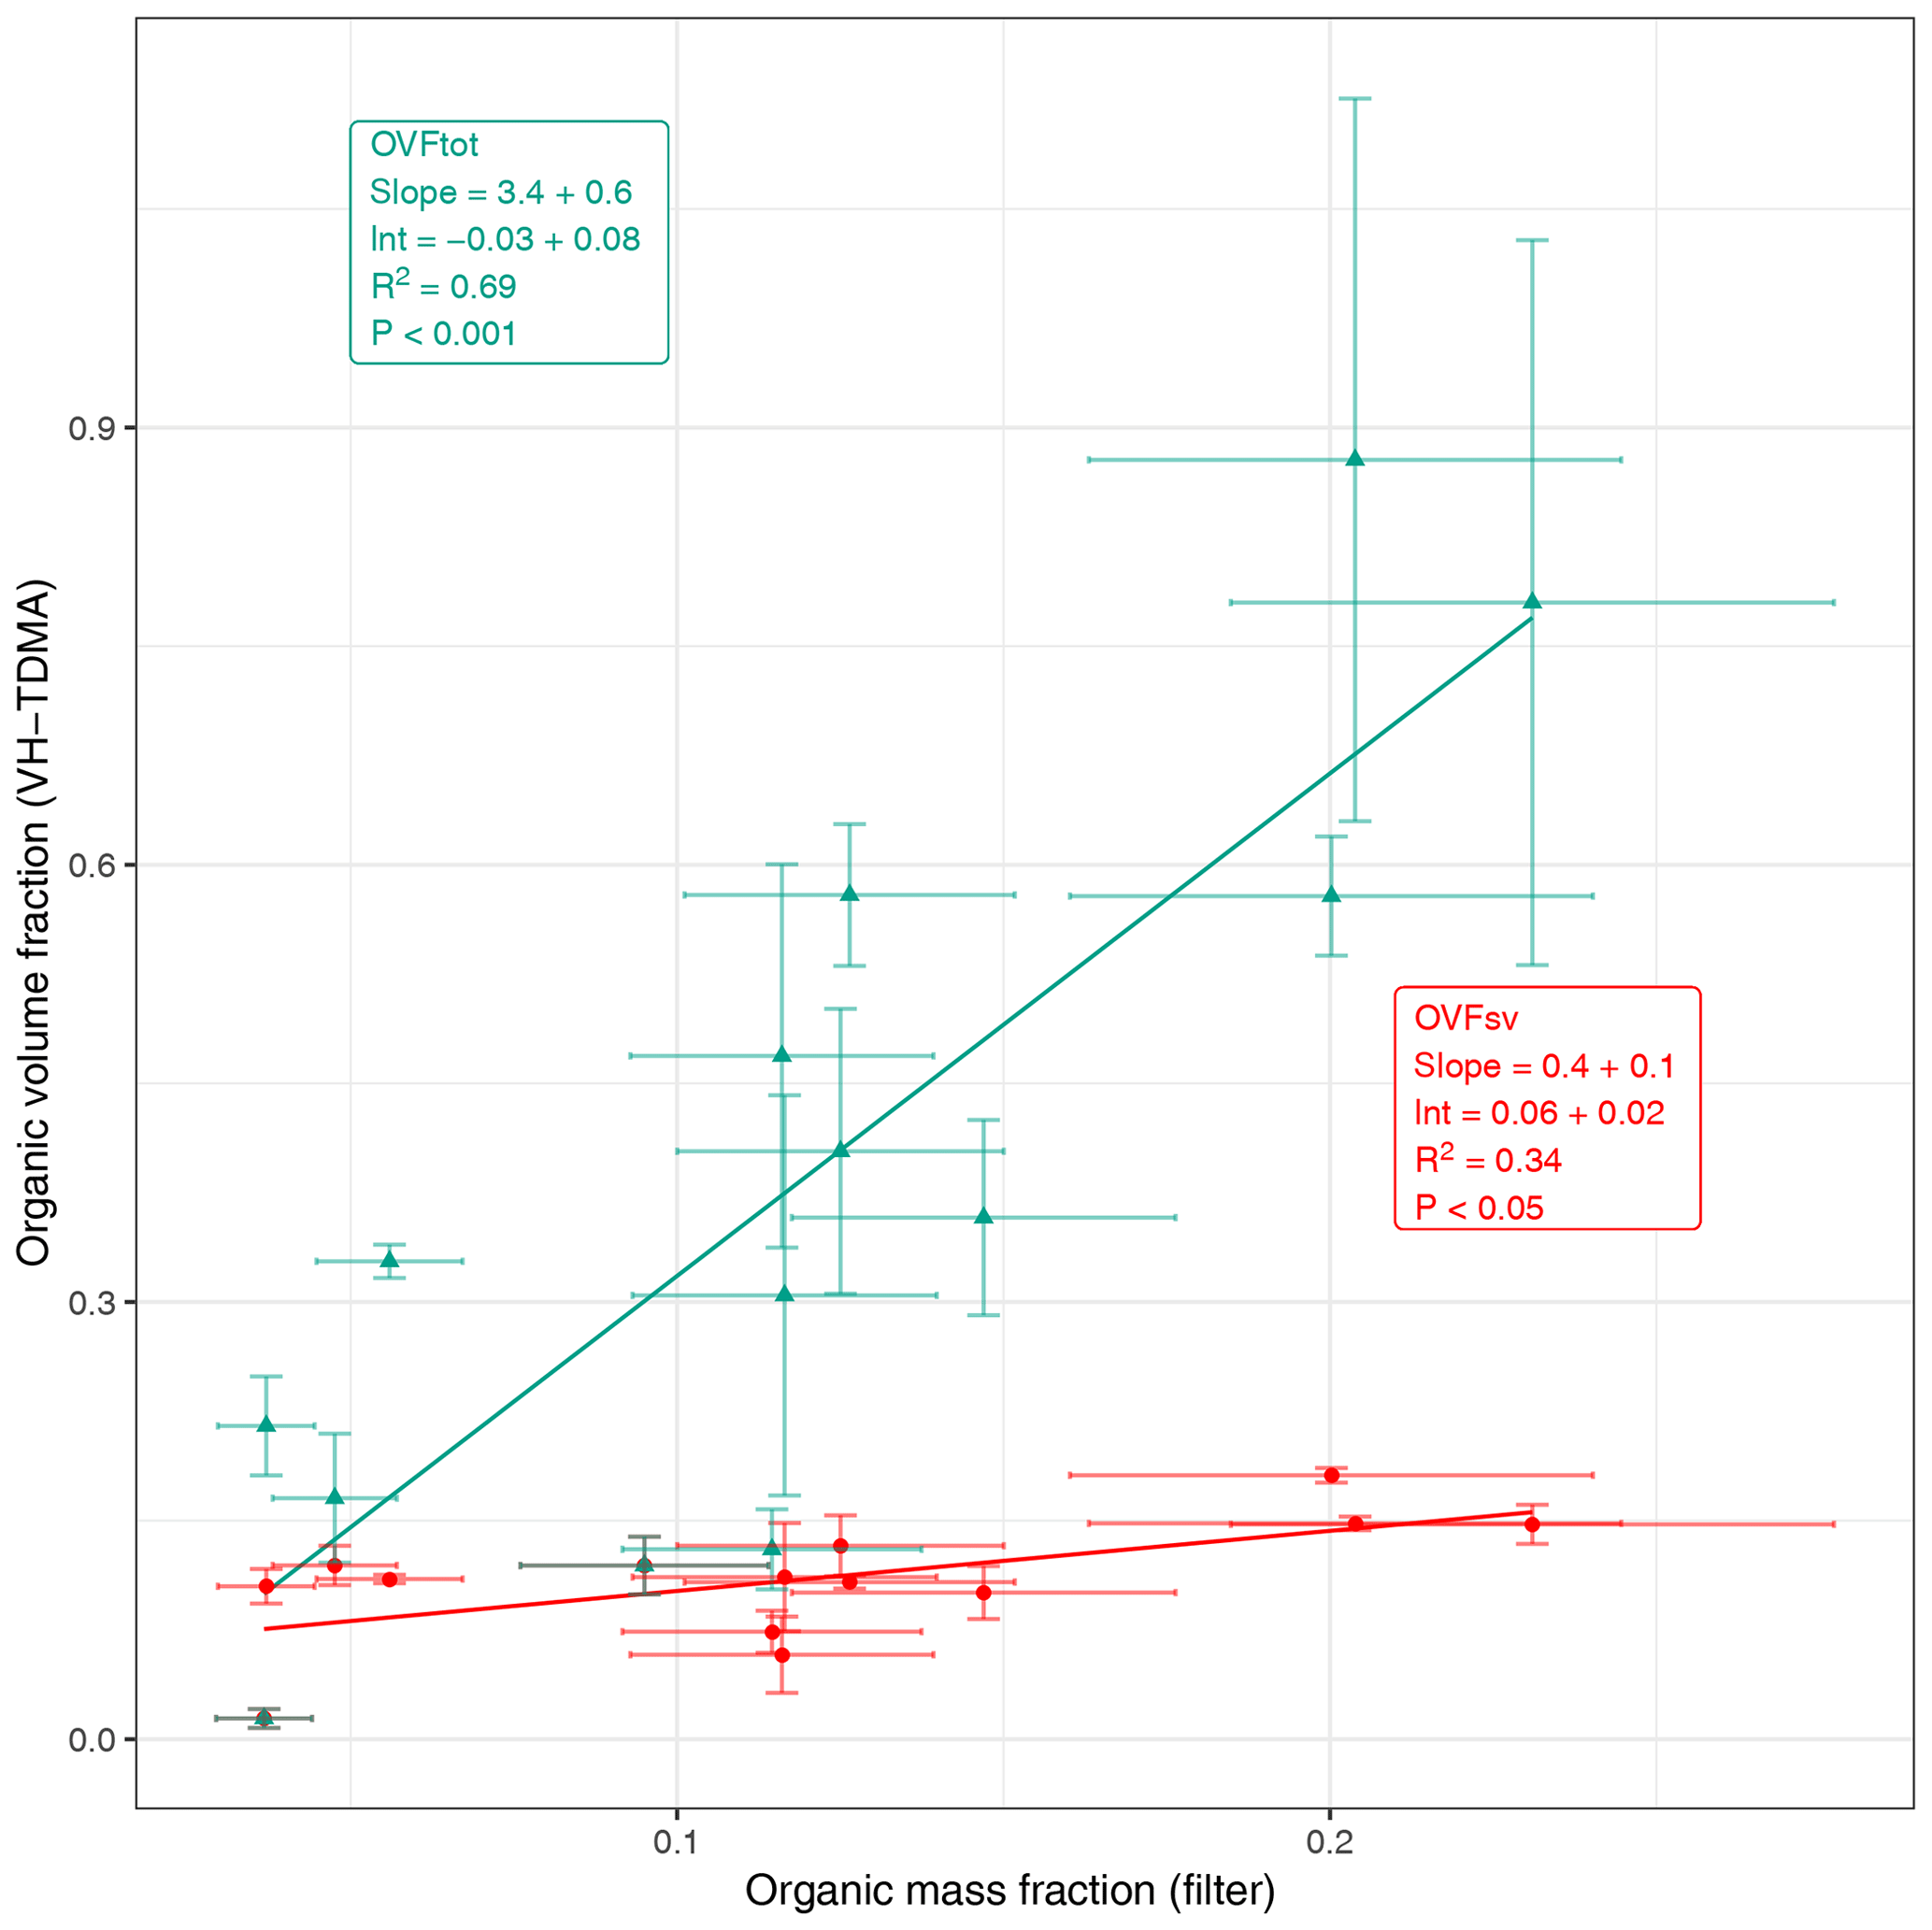
Figure 6Comparison of the 50 nm organic volume fraction calculated from volatility measurements (using VH-TDMA) and the PM1 OMF measured using FTIR/IBA on filter samples. Volatile fractions are shown in red; total organic fractions are shown in green.
Correlations of both the semi-volatile organic volume fraction (OVFSV) and the low-volatility organic volume fraction (OVFLV) with seawater high-molecular-weight proteins were observed (R2 of 0.46 and 0.63, p value < 0.01, and slope of and (mg m−3)−1, respectively). Similarly for high-molecular-weight carbohydrates (OVFSV R2 of 0.44, p value < 0.01 and slope of (mg m−3)−1; OVFLV R2 of 0.88, p value < 0.01 and slope of (mg m−3)−1). In addition the semi-volatile OVF correlated with total alkanes (R2 of 0.45, p value < 0.01, and slope of ) and polyunsaturated fatty acids (R2 of 0.33, p value < 0.05 and slope of (mg m−3)−1). The correlations suggest that the fractional contributions to the volatile and low-volatility OVFs from the different seawater organic components measured in this study were similar, but the semi-volatile OVF displayed a higher contribution from aliphatic, lipid-like species. The correlation between semi-volatile OVF and seawater alkanes was significant for all carbon numbers between C16 and C26. The strongest correlations were observed for lower carbon numbers; for C16 the R2 was 0.55, the p value was < 0.001 and the slope was 0.07±0.02; and for C26 the R2 was 0.28, the p value was <0.05 and the slope was 0.17±0.07. Concentrations were largely below the detection limit for carbon number greater than C26.
The mass fraction of inorganic species in SSA during SOAP was observed to vary from that of salts in seawater; in particular an enrichment factor of 1.7±0.6 relative to the composition of laboratory seawater was observed for Ca2+ and 0.4±0.2 for Mg2+ (Fig. 7). Enrichment factors (EFs) observed from TEM-EDX analysis of laboratory sea salt samples were 0.8±0.3 for Ca2+ and 1.0±0.1 for Mg2+ (mean ± SD), suggesting sea salt fractions similar to seawater. It should be noted that TEM-EDX EFs were based on a modest number of measurements (25 particles). Ca2+ inorganic mass fraction and EFs were observed to increase with PM1 OMF, while the Cl− inorganic mass fraction and EFs decreased with increasing PM1 OMF. The mass ratio of Cl− to Na+ was 1.6±0.2, which is slightly lower than the seawater ratio of 1.8 (Seinfeld and Pandis, 2006). It is also worth noting that the mass ratio of Cl− to Na+ from sea salt TEM-EDX measurements was much lower than that for seawater, 1.3±1; however, the uncertainty was very large. Cl− depletion is commonly observed for ambient SSA and is largely attributed to atmospheric ageing processes. Cl−-depleted nascent SSA, as observed here, has also previously been reported to indicate that chloride is fractionated in seawater depending on the seawater composition or that Cl is evaporated during SSA production (Schwier et al., 2017). Wave chamber experiments identified an externally mixed C and O containing particle type, which contained inorganic elements such as S, Na, Mg, Ca and K but not Cl (Ault et al., 2013a), and the presence of this particle type could decrease the overall Cl contribution. Enrichment of Ca2+ is consistent with other nascent SSA chamber experiments; a proposed explanation for this is the complexing of Ca2+ with carbonate ions. The presence of carbonate would potentially be detected in the OVFLV from TDMA measurements and could therefore provide an explanation for the over-prediction observed in Fig. 6. Alternatively Ca2+ could be in a complex with organics; Salter et al. (2016) concluded that if this were the case it would be with a minor amount of organic material.
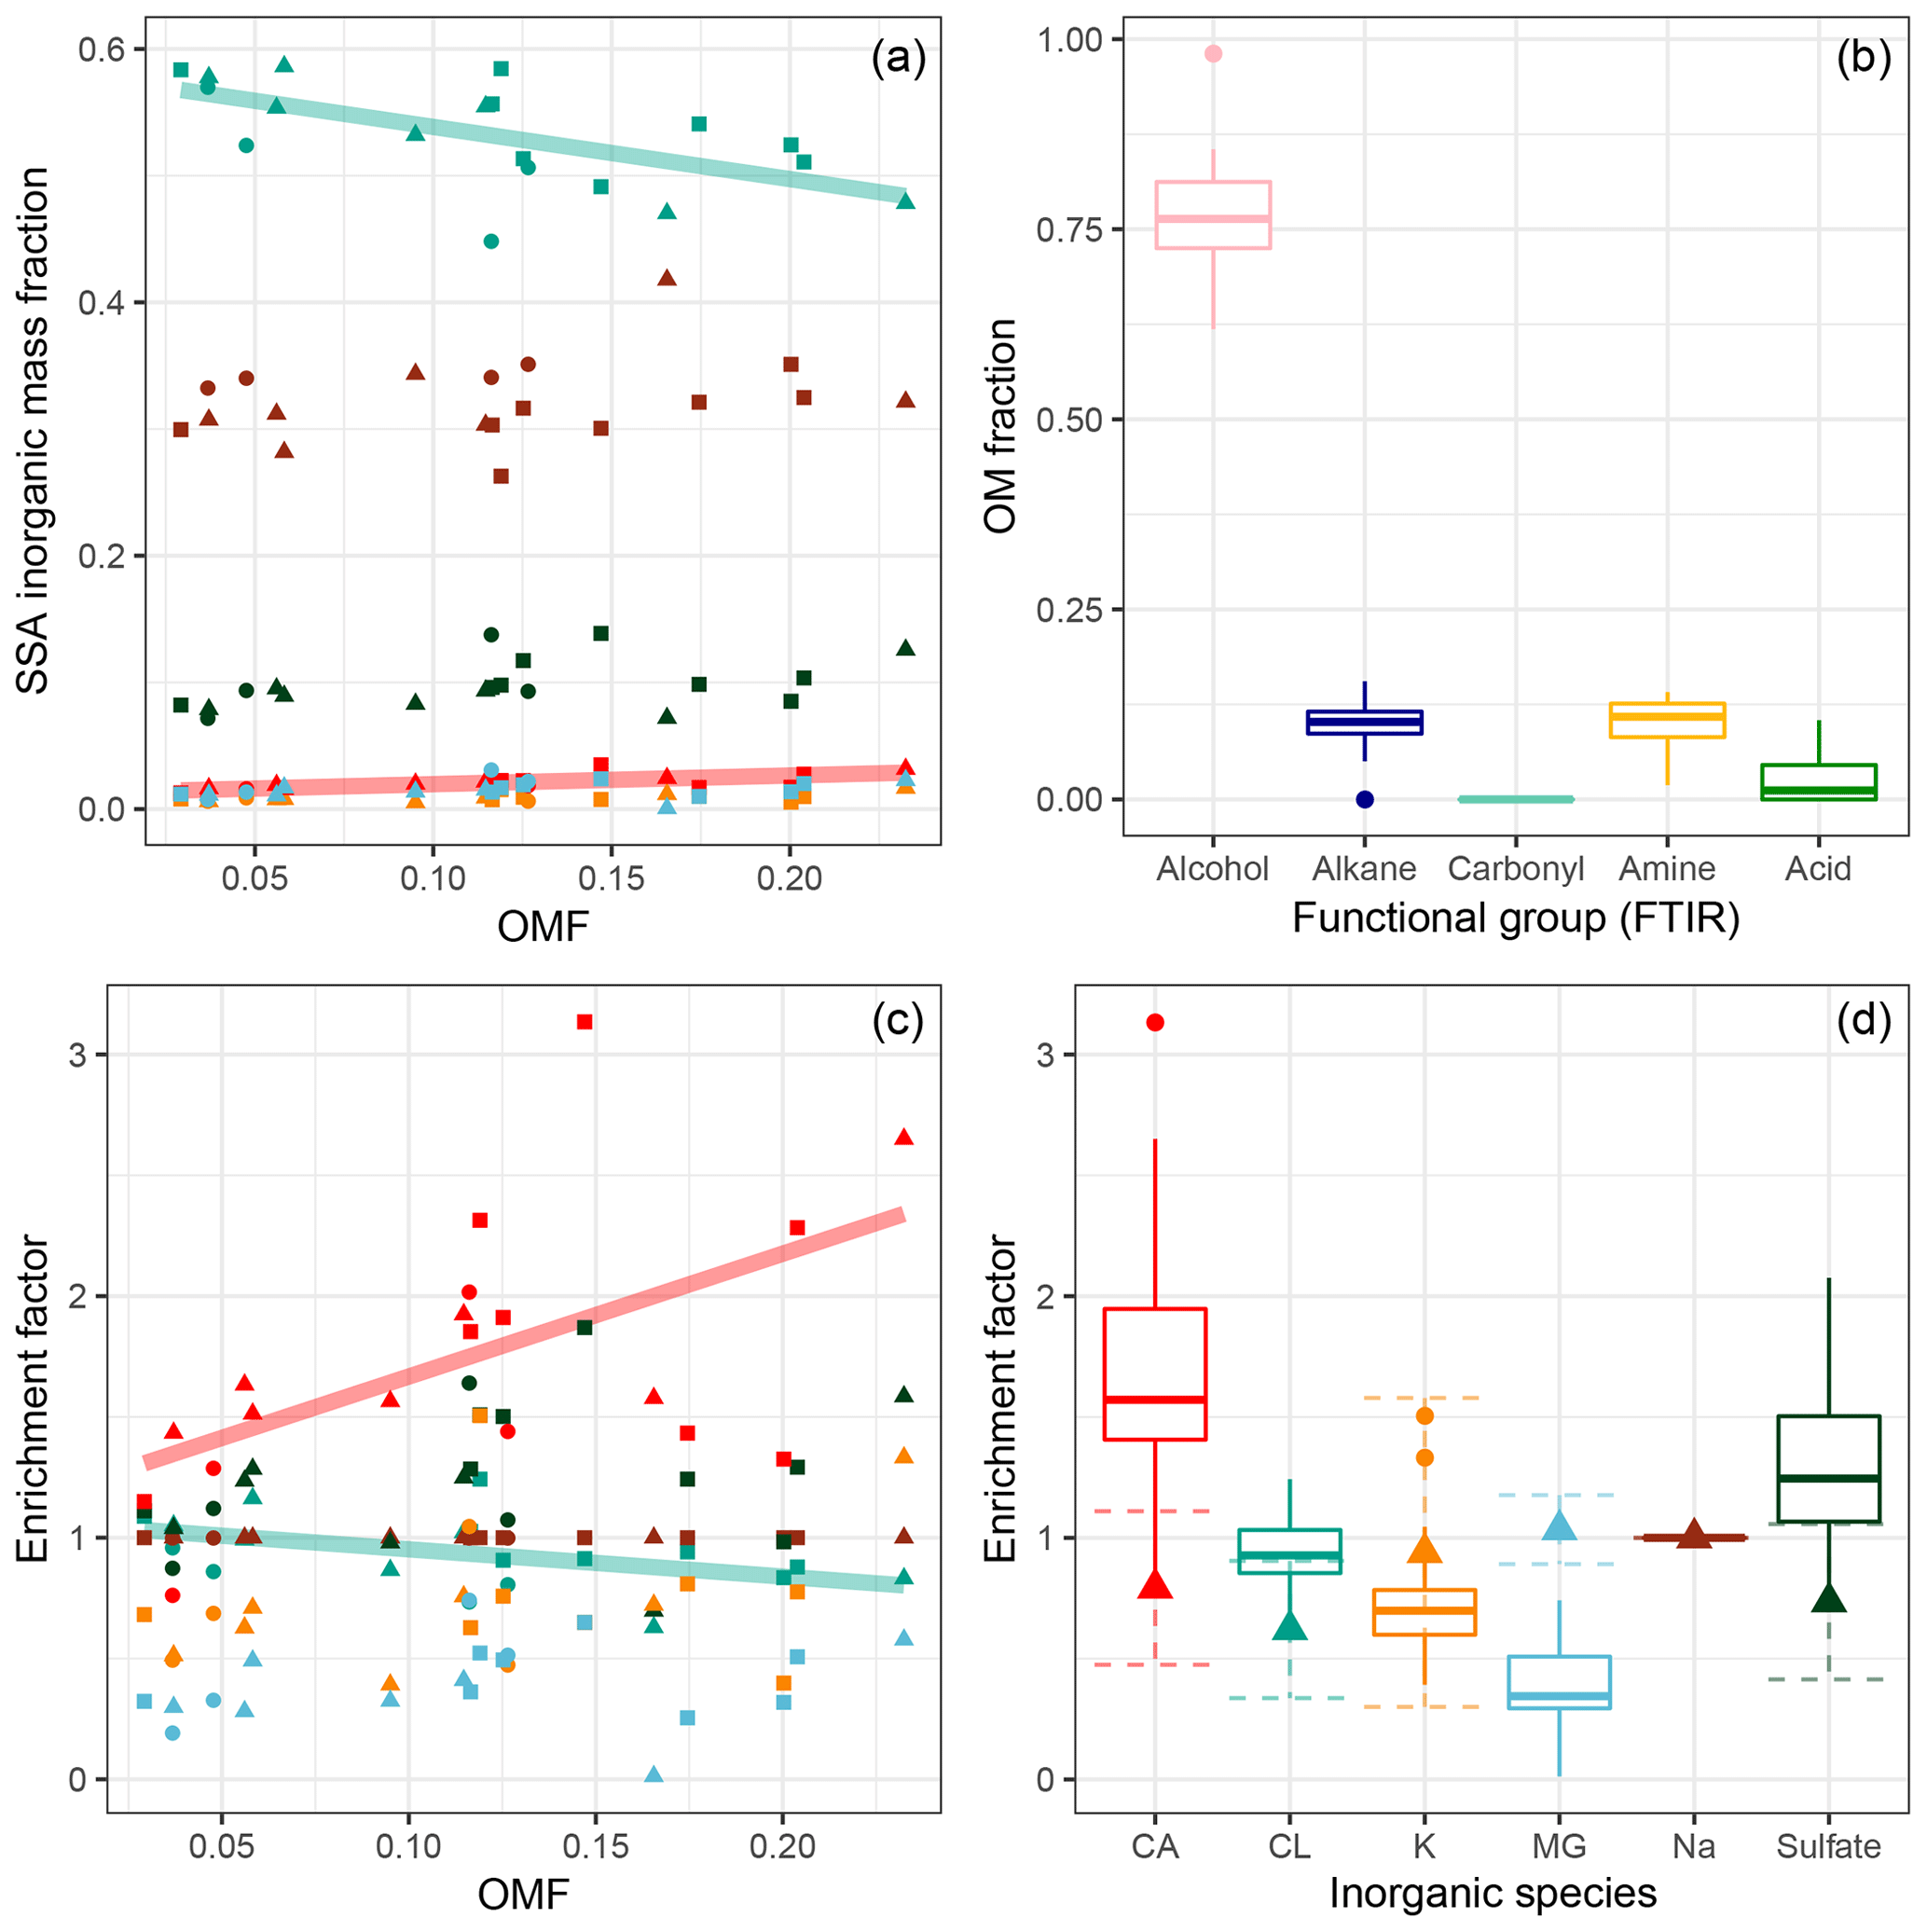
Figure 7Inorganic mass fraction (a) and enrichment factor (c, d) versus organic mass fraction (c) measured from IBA and FTIR analysis of filter samples. Enrichment factors of inorganic species are with respect to laboratory-prepared seawater and presented with respect to Na+. Panels (a) and (c) show linear trends for species with statistically significant correlations (Cl fraction displayed R2 of 0.34, p value < 0.01 and slope of , and Ca fraction displayed R2 of 0.42, p value < 0.01 and slope of 7±2). Shapes indicate water sample depth. Colours in (a) and (c) correspond to inorganic species indicated in (d). Triangles in (d) represent the mean EFs from TEM-EDX measurements of SSA generated from laboratory seawater; dotted error bars show standard deviation in the mean. Contribution to organic mass from functional groups measured by FTIR shown in (b). In panels (b) and (d) boxes extend from the 25th to the 75th percentile, with the line showing the median; circles show measurements outside of the 95 % confidence interval in the median.
Alcohol functional groups contributed 77±8 % of the PM1 SSA organic mass (OM), alkanes 10±4 %, amines 10±3 % and carboxylic acid groups 3±3 % (mean ± SD). The make-up of organics across the samples was relatively constant, as depicted by the ranges shown in Fig. 7. The ratio of alkane to hydroxyl (alcohol) functional groups indicates whether the organic fraction is aliphatic/lipid-like (high ratio) or more oxidised/carbohydrate-like (low ratio). The nascent SSA generated during SOAP had alkane-to-hydroxyl ratios ranging from 0.06 to 0.25, with a mean of 0.14, which are very low values for non-oligotrophic waters, suggesting that the SSA was enriched in carbohydrates. For some context Frossard et al. (2014) reported average ratios of 0.34±0.21 for non-productive waters and 0.93±0.41 for productive waters. Chlorophyll-a concentrations for productive waters reported in Frossard et al. (2014) extend to 10 µg L−1, far above those observed in this study. It is also worth noting that the alkane-to-hydroxyl ratios were lowest during blooms 1 and 3, 0.12±0.04 and 0.11±0.04, respectively, and highest outside of phytoplankton blooms 0.2±0.05. These results suggest that the SSA from phytoplankton blooms is enriched in carbohydrate-like organics, more so than the less biologically active regions.
Ethanol growth factors measured using the UFO-TDMA for preselected 50 nm diameter SSA were 1.22±0.02 (mean ± SD) and were largely invariable for all of the water samples examined. The ZSR assumption was used with an organic growth factor of 1.5 and a sea salt growth factor of 1, based on UFO-TDMA measurements of oxidised organics (tartaric, benzoic and citric acid) and sodium chloride, respectively (Vaattovaara et al., 2005; Joutsensaari et al., 2001). The measured ethanol growth factors correspond to moderately oxidised organic volume fractions averaging 35±5 %, when the two-component ZSR model above is applied. The ethanol growth factor for species commonly observed in SSA, such as polysaccharides, proteins and lipids, is not known, and therefore the representativeness of the ZSR model for primary marine aerosol is highly uncertain. For example some of the fatty acids and alkanes with the highest concentrations in the seawater are soluble (myristic and palmitic acid, eicosane, and docosane) or very soluble (lauric acid) in ethanol and could potentially display high ethanol growth factors (Haynes, 2018). Chlorophyll a is also very soluble in ethanol (Haynes, 2018). If the ethanol growth factor of the SSA organic component is larger than 1.5, as assumed in the ZSR assumption, then the computed OVF will be overestimated. The variabilities due to SSA diameter in the ethanol growth factors measured at 15 to 50 nm were all within experimental error once a correction for the Kelvin effect was applied. There were no significant correlations with the 50 nm ethanol growth factor and the organic volume fraction calculated from volatility and PM1 organic mass fractions. The species responsible for the observed ethanol growth cannot be determined without further reference measurements for sea spray. The ethanol growth factor of volatilised SSA (for sample U7520) was 1.03±0.03 at 200 ∘C, and averaged 1.01±0.03 between 250 and 400 ∘C, suggesting that the component contributing to ethanol growth was largely semi-volatile. The component that contributed to ethanol growth was more constant than the OVFSV measured using the VH-TDMA, suggesting that it could have been a subset of the total volatile organic component. The high UFO-TDMA OVF relative to the VH-TDMA OVF could suggest that the computed OVF from the UFO-TDMA is overestimated.
3.4 SSA water uptake
The HGFs observed for SSA generated from both laboratory sea salt and natural seawater samples showed up to three externally mixed HGF modes (Fig. S6). The first natural seawater SSA HGF mode averaged 1.89±0.07 and contributed a number fraction of 0.8±0.12 for 50 nm diameter SSA. The second mode displayed an average HGF of 2.04±0.09 and contributed a number fraction of 0.2±0.1. The third HGF mode was sporadically observed during SOAP measurements at 50 and 100 nm diameters (observed during four samples) but when present contributed a number fraction of 0.01 to 0.06 and displayed an average HGF of 2.25±0.02. The fraction of the second HGF mode at 50 nm correlated with the proportion of log-normal mode 3 (R2 of 0.39, p value < 0.01 and slope of 0.87±0.3). This suggests that the log-normal modes may have different composition and/or morphology, which has previously been observed for nascent SSA (Collins et al., 2013); however, in the absence of size-resolved compositional measurements, further conclusions are not possible.

Figure 8Ambient HGF (a), heated HGF (b) and PM1 OMF (c) by bloom. HGFs measured using VH-TDMA, OMF measured from FTIR and IBA analysis of filter samples. Note that NA refers to measurements taken outside of an identified bloom.
The shape-corrected 50 nm ambient nascent SSA HGF averaged 1.94±0.08 (mean ± SD) across all samples, with individual samples ranging from 1.79±0.05 to 2.08±0.06 as shown in Fig. 5. Heated 50 nm HGFs averaged 2.02±0.05 across all samples, with individual samples ranging from 1.91±0.06 to 2.09±0.06. Particularly interesting is the distribution of HGFs throughout the voyage as shown in Fig. 8; both nascent SSA HGFs and PM1 OMFs were highest for bloom 1 on average and decreased for subsequent blooms. The SSA HGF after heating is approximately 0.1 higher than that from the ambient HGF, which is a similar change in HGF as observed for laboratory sea salt samples, and is likely to be largely due to the evaporation of hydrates. The relationship between HGF and OVF or OMF observed here is not consistent with that expected from the ZSR assumption, i.e. full solubility of organic components. Conventional ZSR mixing would suggest the organic fraction and water uptake would be inversely proportional to each other, because of the presence of a less-hygroscopic organic component. Even when a HGF of 1.6 is assumed for the organic component, the trend in HGF is not consistent between measured and ZSR-modelled HGFs (Fig. 9). Deviations between the ZSR model and the measured data begin to become pronounced at OVFs greater than 0.4. It should also be noted that the measured HGFs show a large sample-to-sample variability.
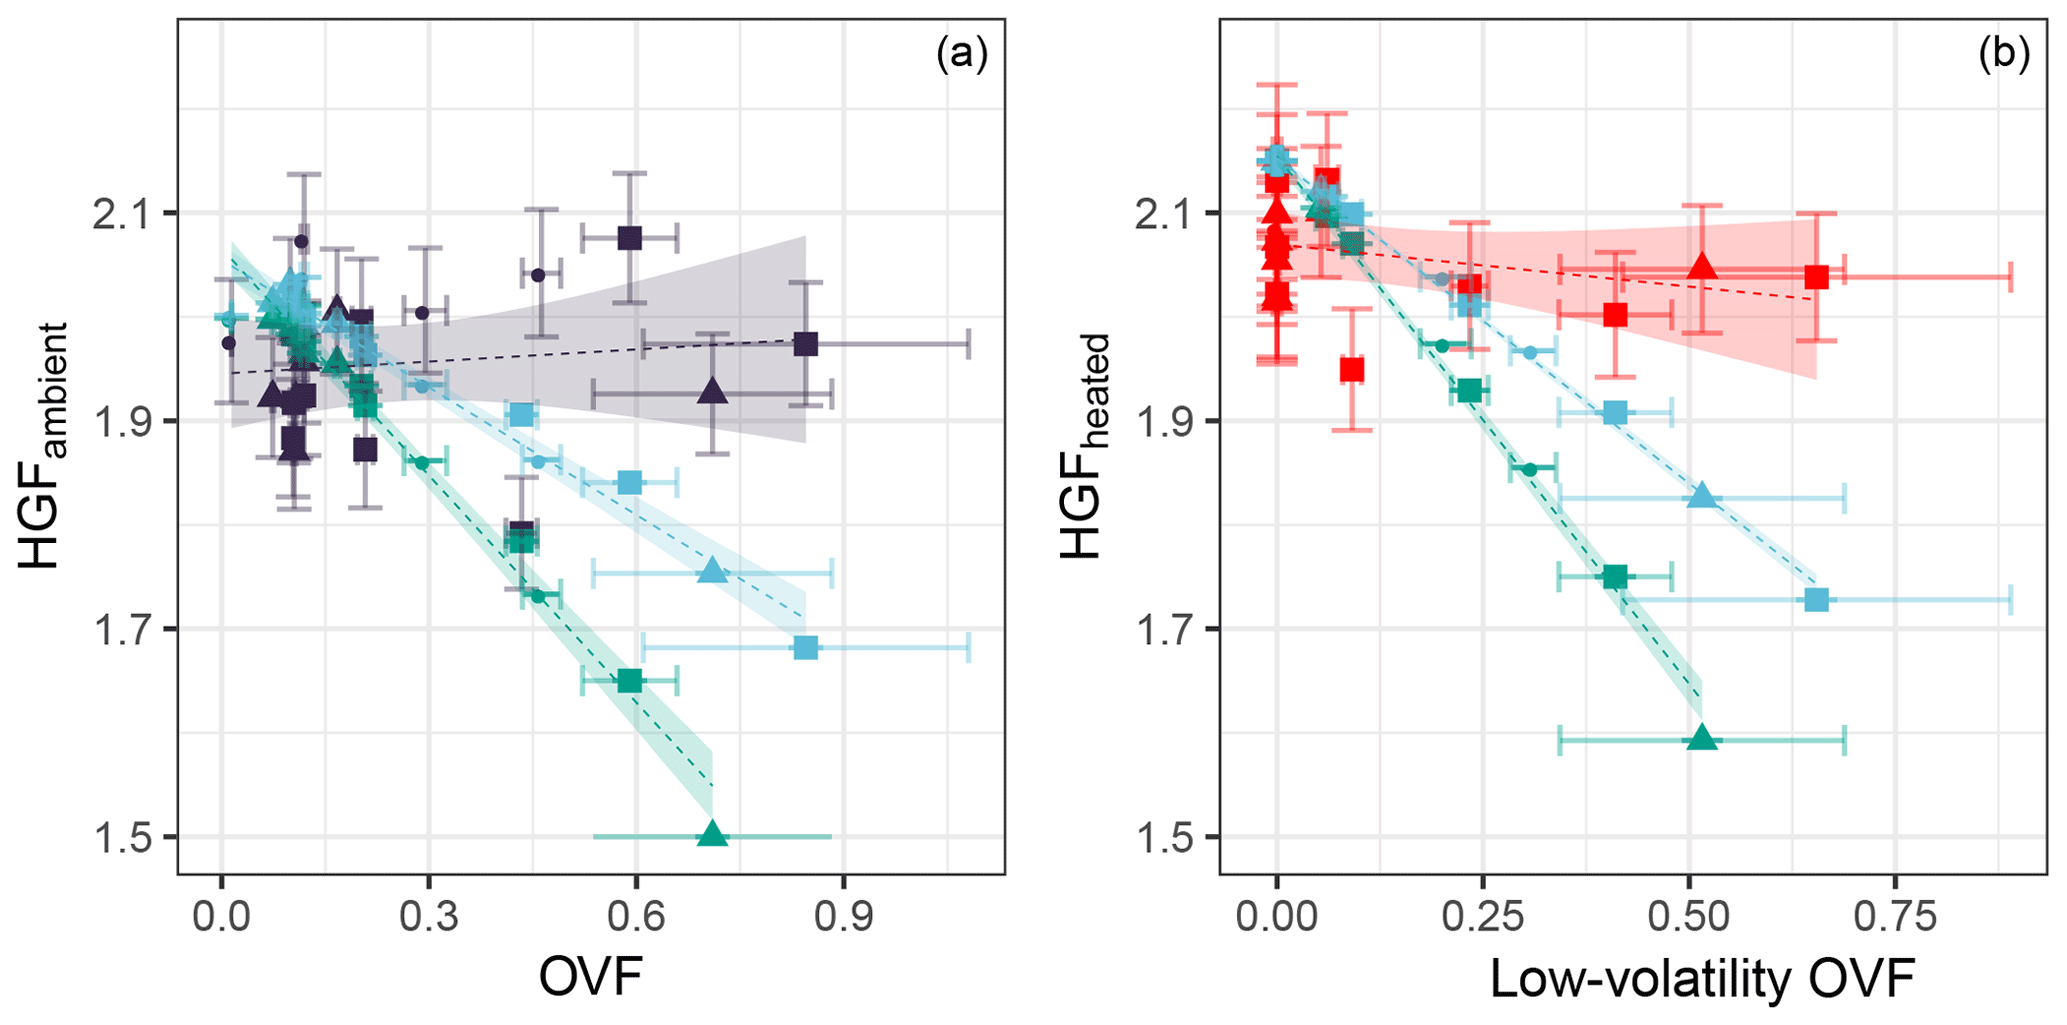
Figure 9The measured HGF of 50 nm diameter SSA at ambient temperature (a) and heated to 255–400 ∘C (b) as a function of the total OVF and low-volatility OVF, respectively. HGF modelled using ZSR assumption is shown assuming an organic HGF of 1 (green) and an organic HGF of 1.6 (blue) shown alongside measured HGFs (ambient in dark blue, heated in red). Linear fit to the measured and modelled data is indicated by the dashed line; shading represents the 95 % confident interval in the linear fit.
A buffered response of SSA hygroscopicity under supersaturated conditions to OVF has been previously reported (Ovadnevaite et al., 2011a; Collins et al., 2016; Forestieri et al., 2018b) and is thought to be linked to surface-active organics (e.g. fatty acids). It should be noted that these observations were made in supersaturated conditions, and therefore the applicability to observations in this study is not clear. Given the observed combination of a low alkane-to-hydroxyl ratio and an apparent non-soluble organic component, lipopolysaccharides (LPSs) could present a reasonable candidate for the composition of the organic component. LPSs have previously been identified as an important component in primary marine aerosol (Cochran et al., 2017; Estillore et al., 2017; Facchini et al., 2008; Bikkina et al., 2019).
The 50 nm deliquescence relative humidity was measured for the Workboat 9 seawater sample at 69 % RH (Fig. 10), notably lower than that observed for NaCl/sea salt, ∼73.5 % (Zieger et al., 2017). SSA generated from Workboat 9 seawater displayed an ambient 50 nm HGF of 1.84±0.06, a heated 50 nm HGF of 1.94±0.06, an organic volume fraction of approximately 21 % at 50 nm and a PM1 organic mass fraction of approximately 3 %. The PM1 alkane-to-hydroxyl ratio was 0.14. The DRH observed here is consistent with observed organic sea salt mixtures in the literature; for example a 2 : 1 mass ratio mixture of NaCl to glucose resulted in a 100 nm DRH of 69.2±1.5 %, and the mixture had a hygroscopicity (κ) of 0.8 (Estillore et al., 2017).
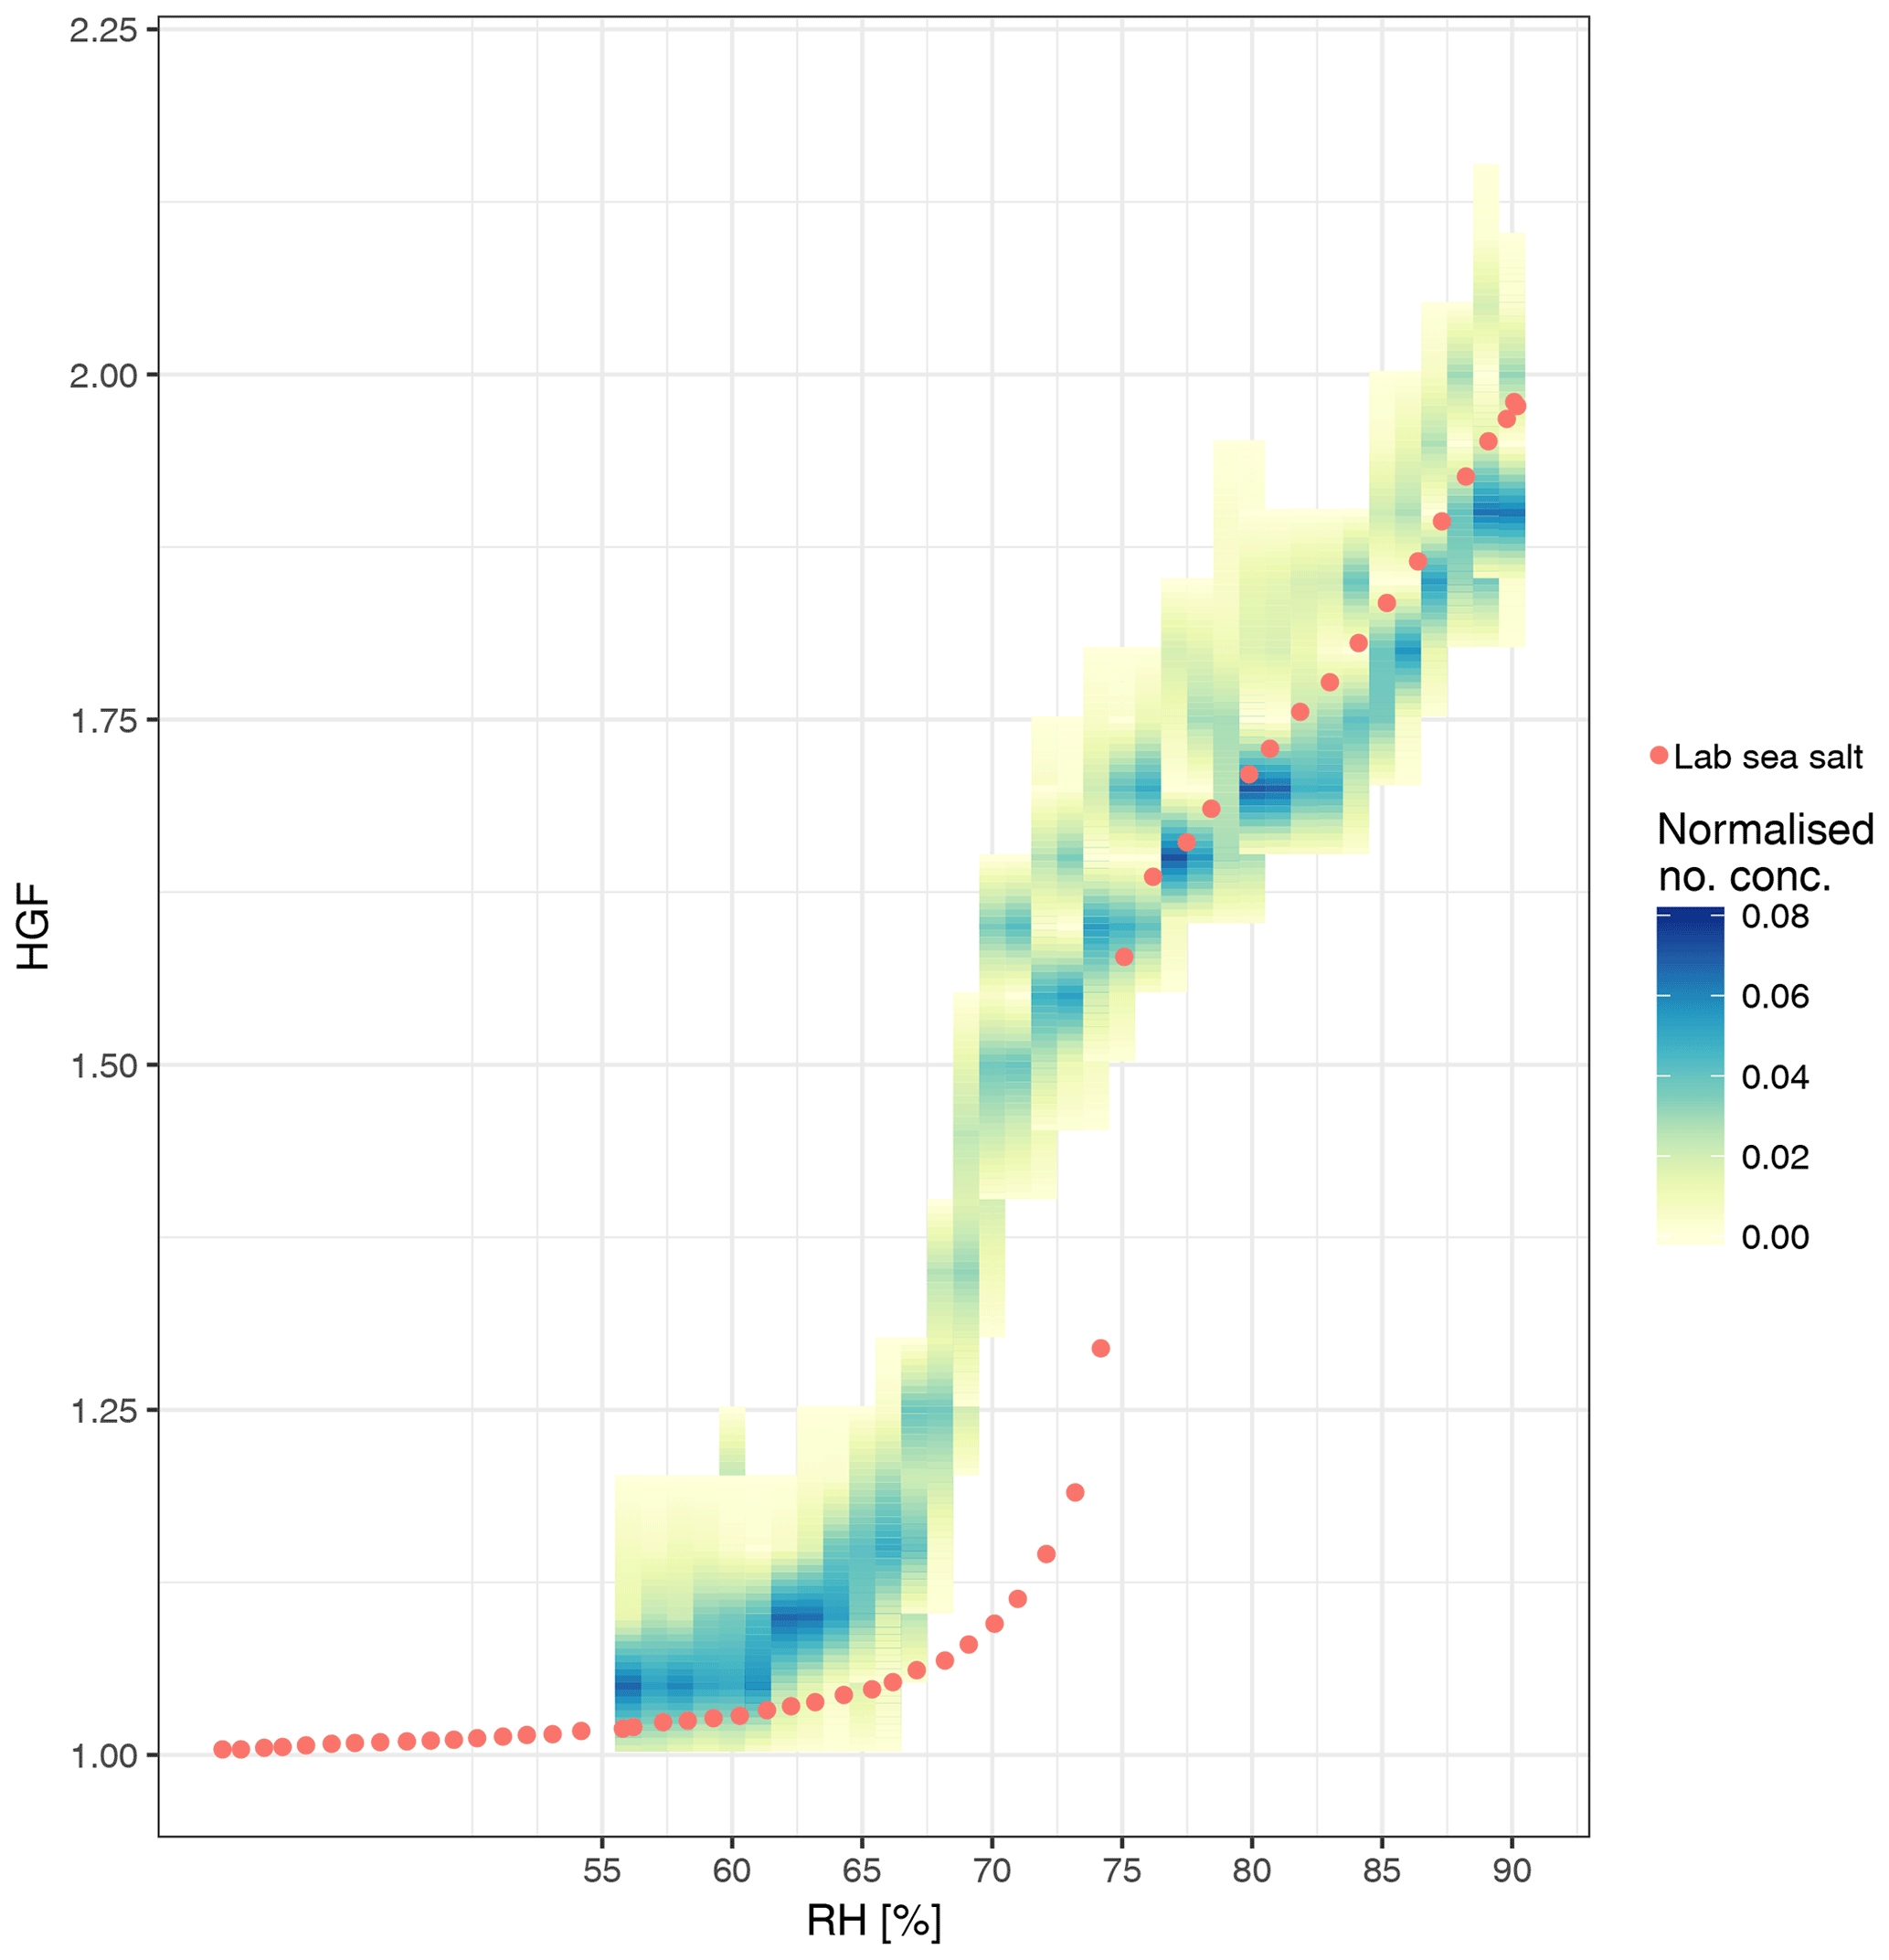
Figure 10Deliquescence of 50 nm SSA generated from the SOAP seawater sample (Workboat 9) shown in yellow to blue colour scale. The laboratory sea salt deliquescence curve is shown with circles.
4.1 SSA organic enrichment
The organic enrichment of SSA was examined using the Chl a-based emissions scheme suggested by Gantt et al. (2011), the OCEANFILMS-1 emissions scheme (Burrows et al., 2014) and the OCEANFILMS-2 emissions scheme which allows for the co-adsorption of polysaccharides (Burrows et al., 2016). The relationship between SSA PM1 OMF estimated using Chl a (Gantt et al., 2011) and the measured SSA PM1 OMF is quite scattered (R2 of 0.17), as shown in Fig. 11. The nature of the sampling method used in this study, 23 spot samples taken over an 18 d period, was not favourable for the use of Chl a as a marker for SSA organics. The enrichment of SSA is not just a product of phytoplankton biomass, which is largely what is measured by Chl a, but more likely due to the demise of phytoplankton communities and the resulting release of a range of organic material, some of which is available for transfer into the aerosol phase. Chl a is best used as marker over much longer timescales, of the order of weeks to months, for example to describe the seasonality in SSA organic enrichment. The OCEANFILMS-1 model improves on the scatter of modelled organic fraction compared to the Chl a model (R2 of 0.3); however, the magnitude of the modelled PM1 OMF is low, which is likely due to the under-representation of more-soluble DOC, such as polysaccharides. OCEANFILMS-2 includes the co-adsorption of polysaccharides and reproduces the SSA PM1 OMF reasonably well (R2 of 0.44). It is worth noting that both OCEANFILMS models over-predict when the organic fraction is low (OMF < 0.05). The bias at low OMF could be due to the choice of bubble thickness. The use of a single thickness value is a simplification as it is likely to depend on the seawater surface composition and surface tension (Modini et al., 2013).
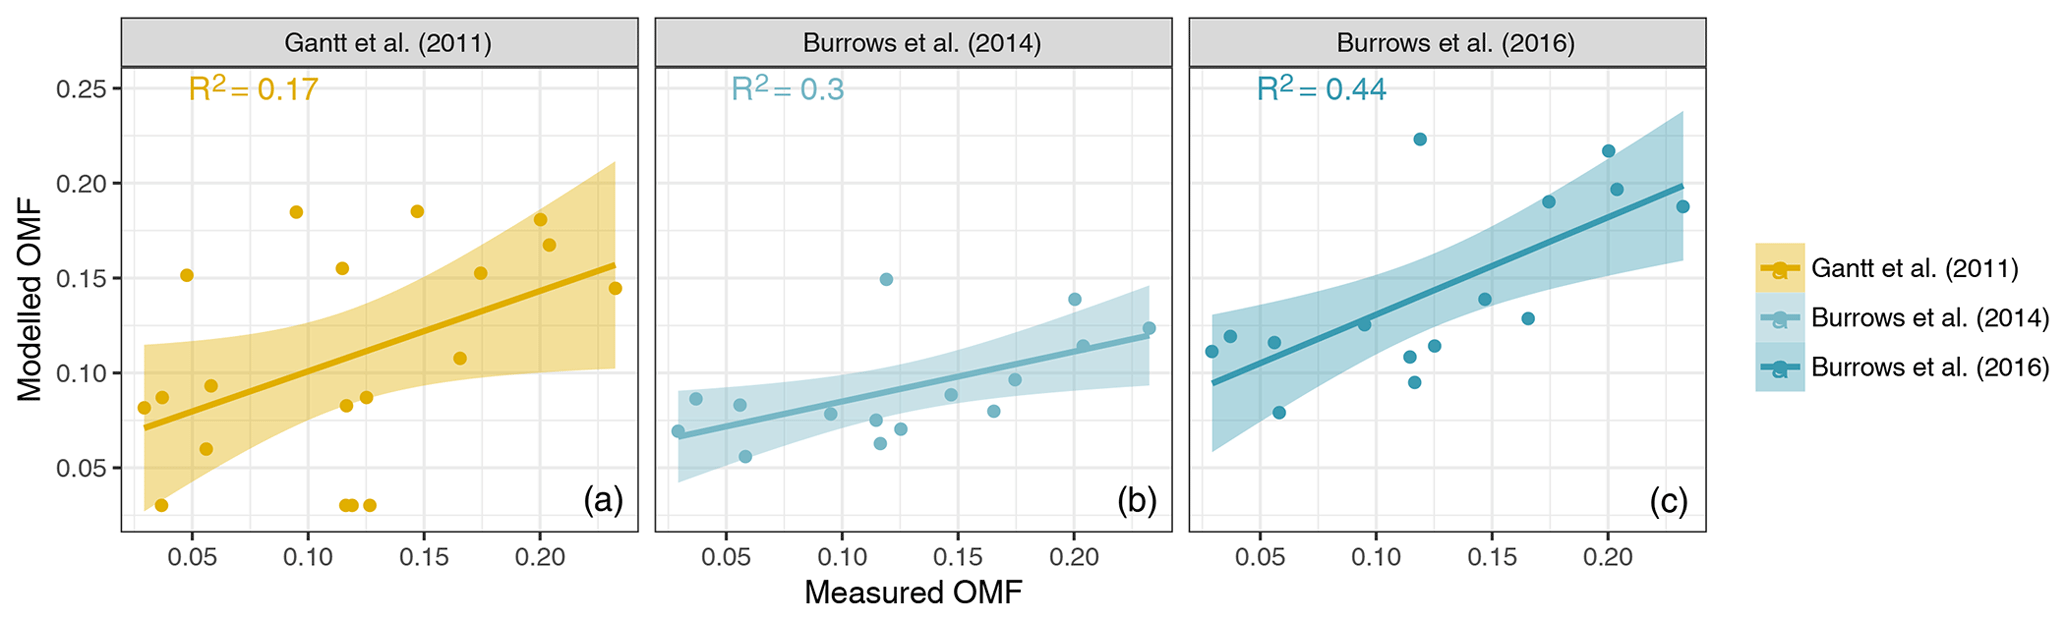
Figure 11PM1 OMF modelled using parameterisation from Gantt et al. (2011) (a), OCEANFILMS-1 (b) and OCEANFILMS-2 (c) compared to that measured in this study. Lines show the linear fit between modelled and measured OMF; shading shows the 95 % confidence interval in the linear model. Fit parameters for Gantt et al. (2011): R2 of 0.17, p value < 0.05 and slope of 0.4±0.2. Fit parameters for OCEANFILMS-1: R2 of 0.3, p value < 0.05 and slope of 0.3±0.1. Fit parameters for OCEANFILMS-2: R2 of 0.44, p value < 0.01 and slope of 0.5±0.1.
The organic macromolecular classes associated with the SSA were determined from the functional group composition using the conversions outlined in Burrows et al. (2014), which relates the concentration of each molecular class to a weighted sum of the functional group concentrations. The high proportion of alcohol functional groups from observations resulted in a similarly high contribution from the polysaccharide-like molecular class, with an average contribution of 0.72±0.06 to the total PM1 OMF. The conversion between functional groups and macromolecular classes is based on the properties of characteristic molecules, for example cholesterol and simple sugars, and is therefore not a perfect representation of the marine environment. There was no apparent change in the distribution of molecular classes/functional groups with the organic mass fraction, as shown in Fig. 12, despite an increase in seawater polysaccharides and proteins for samples with higher PM1 OMF (see Fig. S2). These results might suggest that the SSA organics were bound in a similar molecule or complex, which was uniform regardless of the organic mass fraction. As expected, OCEANFILMS-1 underestimated the proportion of polysaccharides and overestimated the proportion of lipids, as shown in Fig. 12. OCEANFILMS-2 displayed an improved representation of polysaccharides; however, the proportion was still underestimated with an average contribution of 0.39±0.06 to the total PM1 OMF. It is worth noting that the processed molecular class was not computed from FTIR measurements because the functional group composition is so similar to the polysaccharide-like class. The contribution of the processed class to the SSA organic fraction from both OCEANFILMS models was very low (Fig. 12).
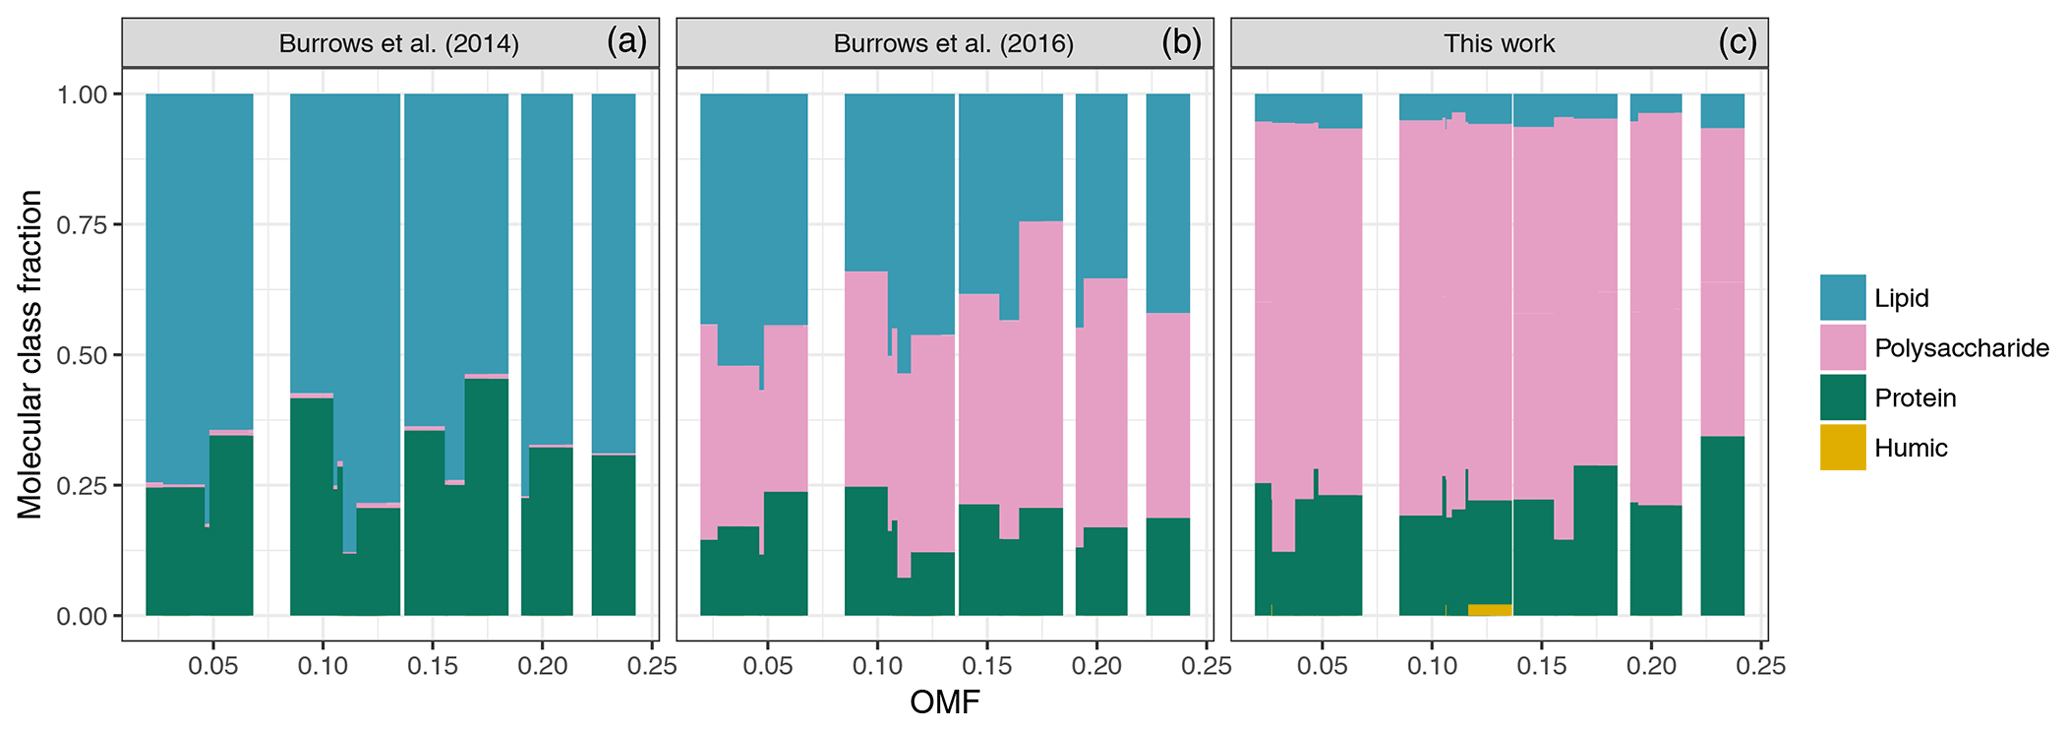
Figure 12Measured organic composition inferred from functional groups (c) and modelled organic composition from OCEANFILMS (OCEANFILMS-1, a; OCEANFILMS-2, b).
Over-prediction of alkane-to-hydroxyl ratios for particularly clean marine measurements is a known issue for OCEANFILMS-2, and broadening the model to different saccharides with varying molecular weights has been identified for future research (Burrows et al., 2016). Particularly of interest here is research into the interaction of surfactants with divalent cations, which have been observed to impact the orientation of surfactant head groups, and thus the surface pressure, for modelled surfactant salt systems (Adams et al., 2016; Casillas-Ituarte et al., 2010; Casper et al., 2016). In particular Ca2+ has been observed to form particularly stable complexes, bridging neighbouring surfactant molecules, and having a condensation effect on the monolayer (Casper et al., 2016). The enhanced enrichment of Ca2+ with higher OMF observed herein may therefore be associated with the complexation with surfactants, in which case the enrichment of Ca2+ could influence the organic enrichment and the SSA water uptake.
OCEANFILMS does improve the prediction of organic enrichment from seawater parameters, relative to Chl a-based models. Limitations remain in the implementation of OCEANFILMS, which requires the availability of surface water concentrations for the five macromolecular classes, which are generally generated using biogeochemical modelling. In addition there are remaining uncertainties as to the global applicability of the model organics applied in OCEANFILMS, in regions with different phytoplankton populations for example. Further broadening and/or refining the organics of interest in OCEANFILMS is likely to hinder its application. Similar issues of global applicability are also present for Chl a-based estimates of OMF. Chl a is, however, globally observed at a daily timescale via satellite and is extremely important for large-scale simulations of SSA organic enrichment. Measurements over the sparsely observed southern and South Pacific oceans, such as those reported herein, are important to constrain emission schemes developed in other parts of the world, particularly given the importance of SSA in this region.
4.2 SSA water uptake
The sea spray hydrate volume fraction ranged from 0.05 to 0.16 and is associated with the inorganic sea salt component of SSA. The hydrates make up a larger proportion of the SSA at low OVFs. The inclusion of the hydrates in the ZSR model lowered the HGF by approximately 0.15 at low OVFs and by approximately 0.05 at high OVFs, and it therefore lowers the dependence of SSA HGF on OVF. Reasonable agreement between the modelled and measured HGFs at low OVFs is reached with the ZSR model including hydrates; however, there are still large discrepancies at high OVFs as shown in Fig. 9.
The compressed film model was run to examine the potential impact of organic surface partitioning on SSA water uptake. The proportion of SSA organics at the particle surface was tested assuming that partitioning occurs on the basis of the organic molecular classes as computed from the distribution of functional groups or from the OCEANFILMS-2 model. Four cases were tested assuming the following molecular classes partitioned to the surface:
-
lipids,
-
lipids and proteins,
-
lipids and polysaccharides,
-
all organics.
The resulting error in the HGF given by the compressed film model is shown in Figs. 13 and S5. The most notable feature is that for both ambient (Fig. 13) and heated measurements (Fig. S5) the error at high organic volume fractions is large. At high organic volume fractions the compressed film model performed best (at the assumed molecular volume and molecular area) when the lipids and proteins were allowed to partition to the surface. At low OVFs the predicted HGF is very similar regardless of which components were allowed to partition to the surface. At low OVFs the volume of organics is not sufficient for the formation of a monolayer, and therefore the surface tension remains equal to the surface tension of water, as shown in Fig. S8. The difference between the use of the functional group measurements or the OCEANFILMS-2 model for the functional group concentrations is distinguishable for the case in which only the lipids are allowed to partition to the SSA surface. In this case the higher lipid fraction predicted by OCEANFILMS-2 results in the formation of a monolayer at OVFs greater than 0.4 (greater than 0.5 for heated samples, Fig. S5), resulting in slightly lower error in the modelled HGFs. The monolayer is never formed for the lipid-only case when the functional group measurements are applied, as indicated in Fig. S8.
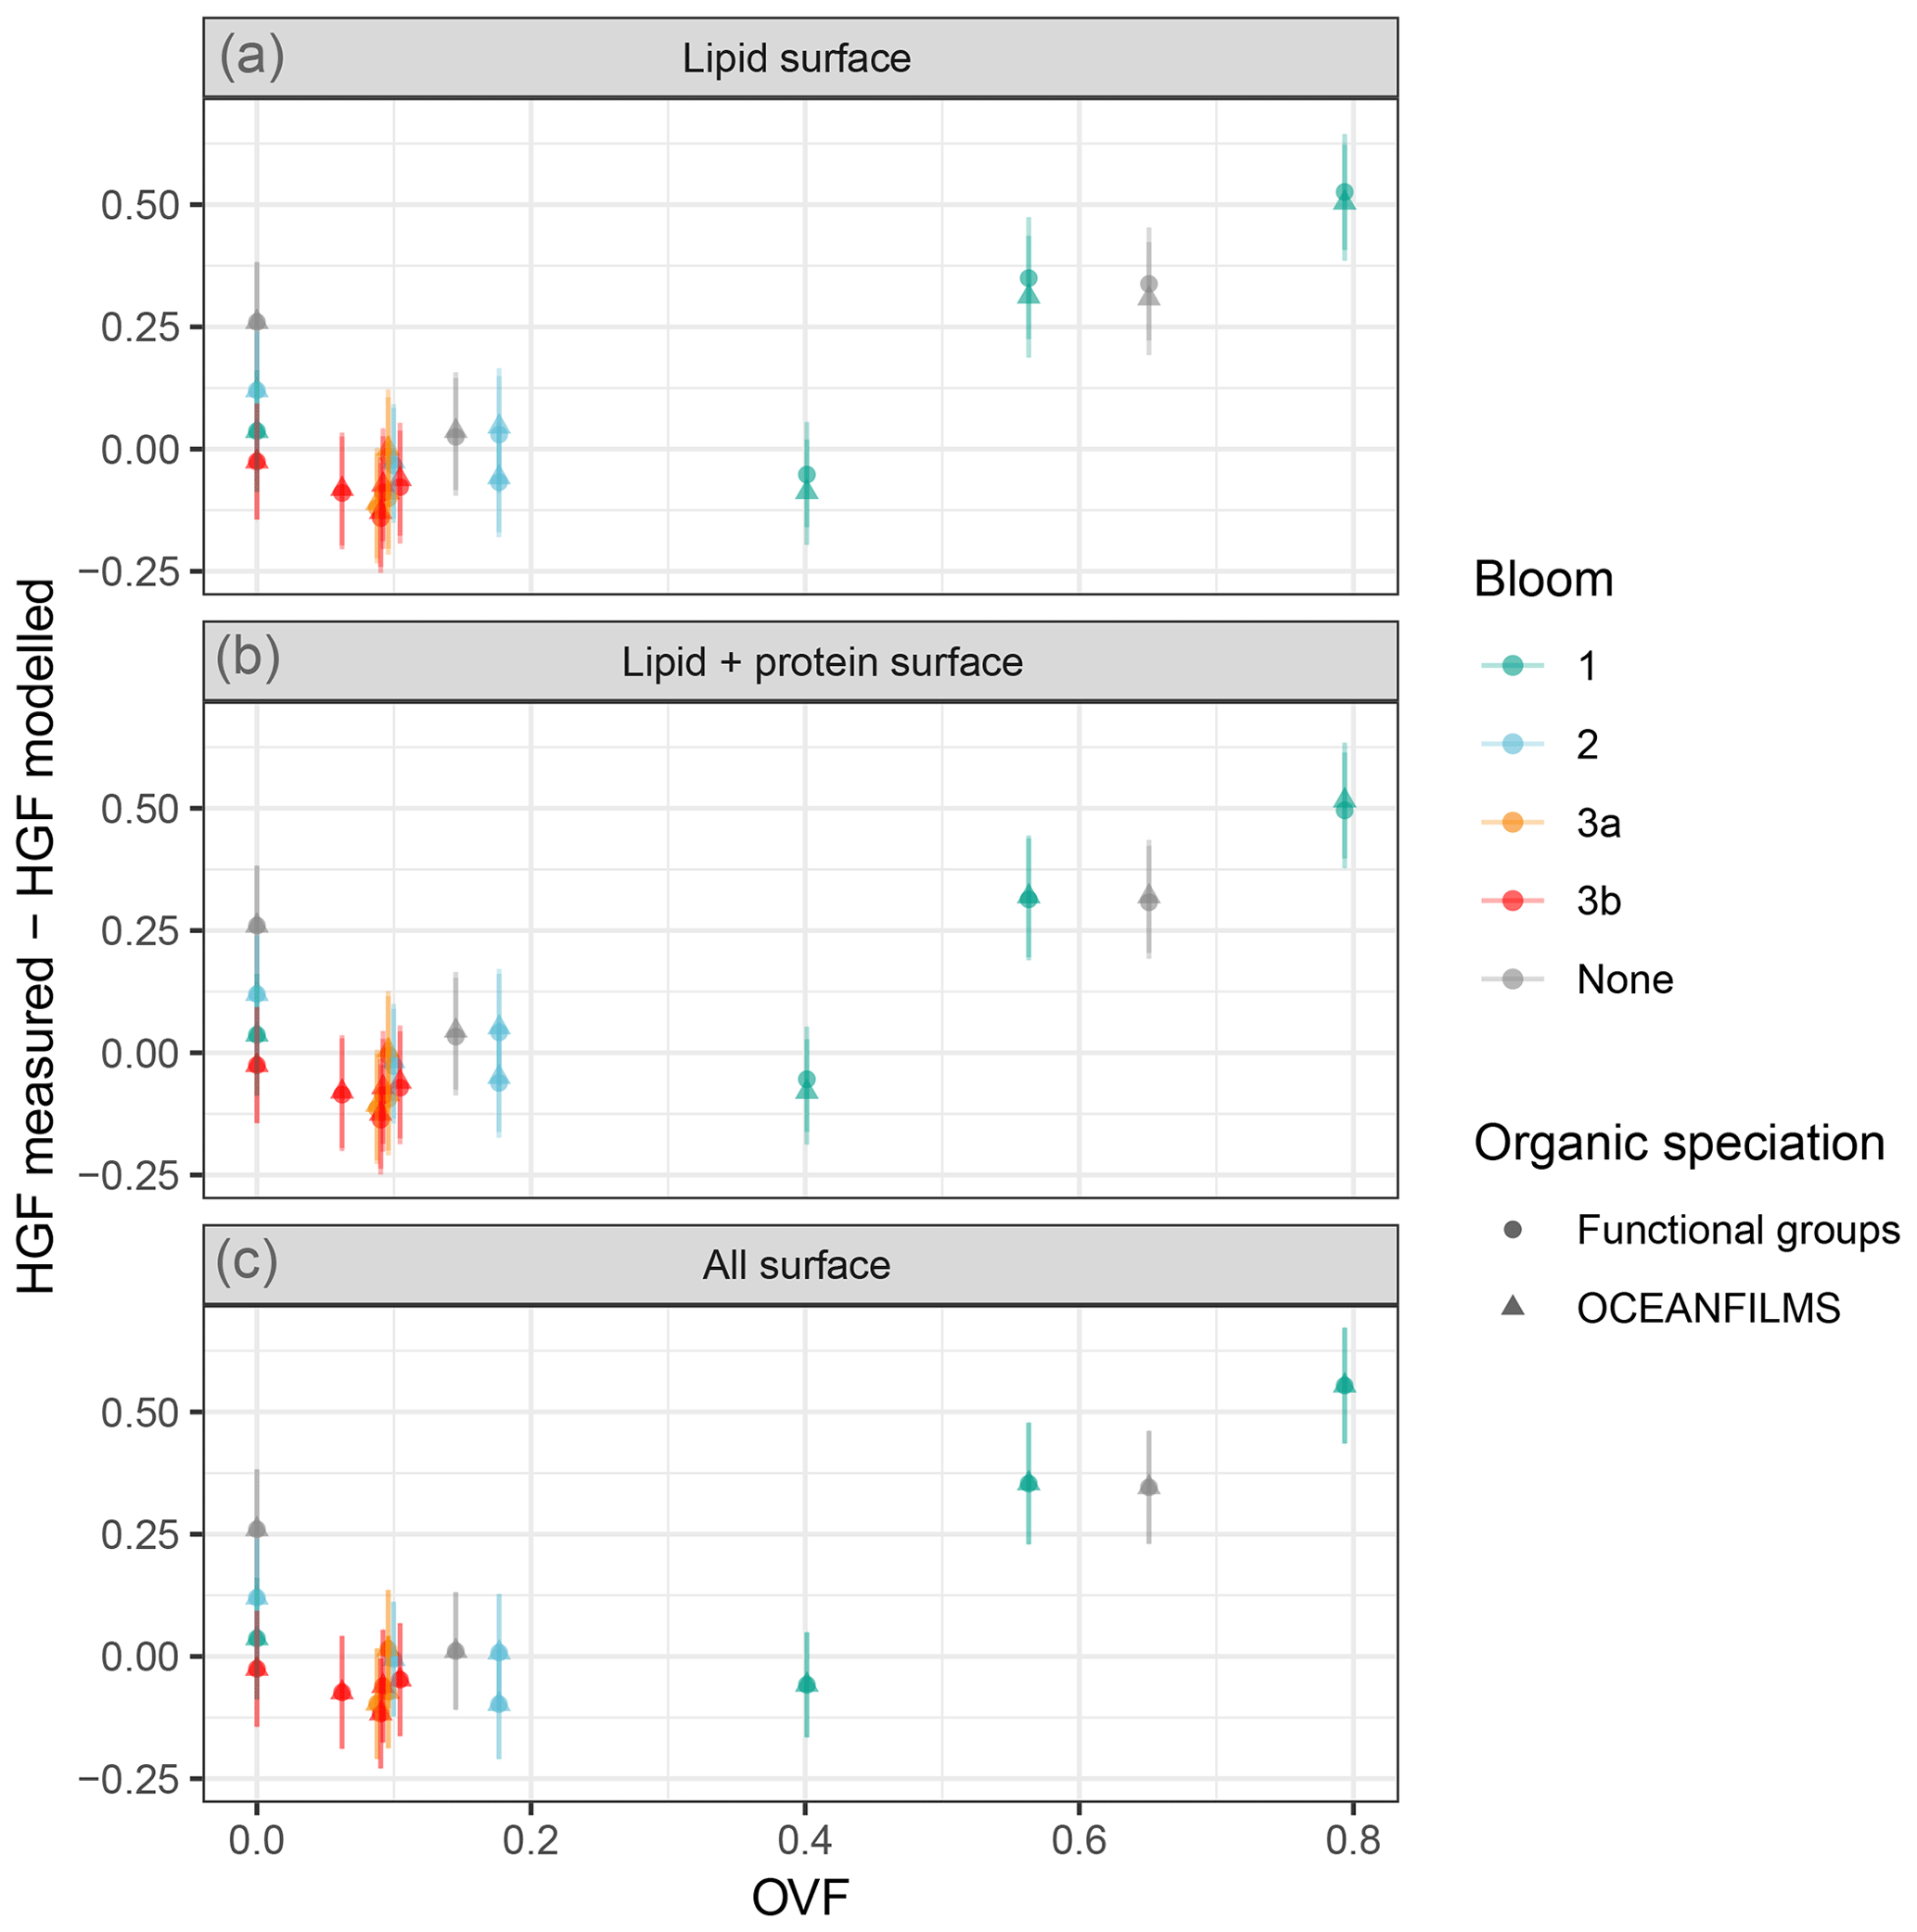
Figure 13Ambient HGF measured minus compressed-film-modelled HGF for lipids partitioned to the surface (a), lipids and proteins partitioned to the surface (b), and all organics partitioned to the surface (c). Organic speciation derived from FTIR measurements (circles) and from OCEANFILMS model (triangles).
A comparison of the HGFs modelled using the compressed film model and those modelled using the ZSR assumption is shown in Fig. 14. The compressed film model is shown for the case when the lipids and proteins are allowed to partition to the surface. The compressed-film-modelled HGFs at high organic volume fractions are up to 0.03 greater; however, this does not account for the reduction in HGF predicted by the ZSR assumption, i.e. by Raoult's law. The modest impact of decreased surface tension on HGF is consistent with previous studies on subsaturated water uptake (Ruehl et al., 2016; Moore et al., 2008). Despite the inclusion of the surface tension effect (via the compressed film model) there was still a significant discrepancy between the observed and modelled HGFs, even when the relatively large uncertainty in the OVF is considered. Applying the ZSR assumption to the observed HGFs, assuming an organic HGF of 1.15, yields organic volume fractions for bloom 1 of 0.12±0.2 (mean ± SD); the OVFs computed using volatility measurements for bloom 1 were 0.5±0.3. It is also worth noting that the ZSR OVF for bloom 1 includes an outlier (Workboat 4), for which the ZSR approximation is consistent with the OVF from volatility measurements. OVFs inferred in studies using water uptake techniques, using the ZSR assumption (Fuentes et al., 2011; Modini et al., 2010a), have often been lower than those measured using more direct analyses of SSA chemical composition (Keene et al., 2007; Facchini et al., 2008; Prather et al., 2013). SSA with hygroscopic growth factors inconsistent with the ZSR mixing rule, as presented here, could contribute to this apparent discrepancy.
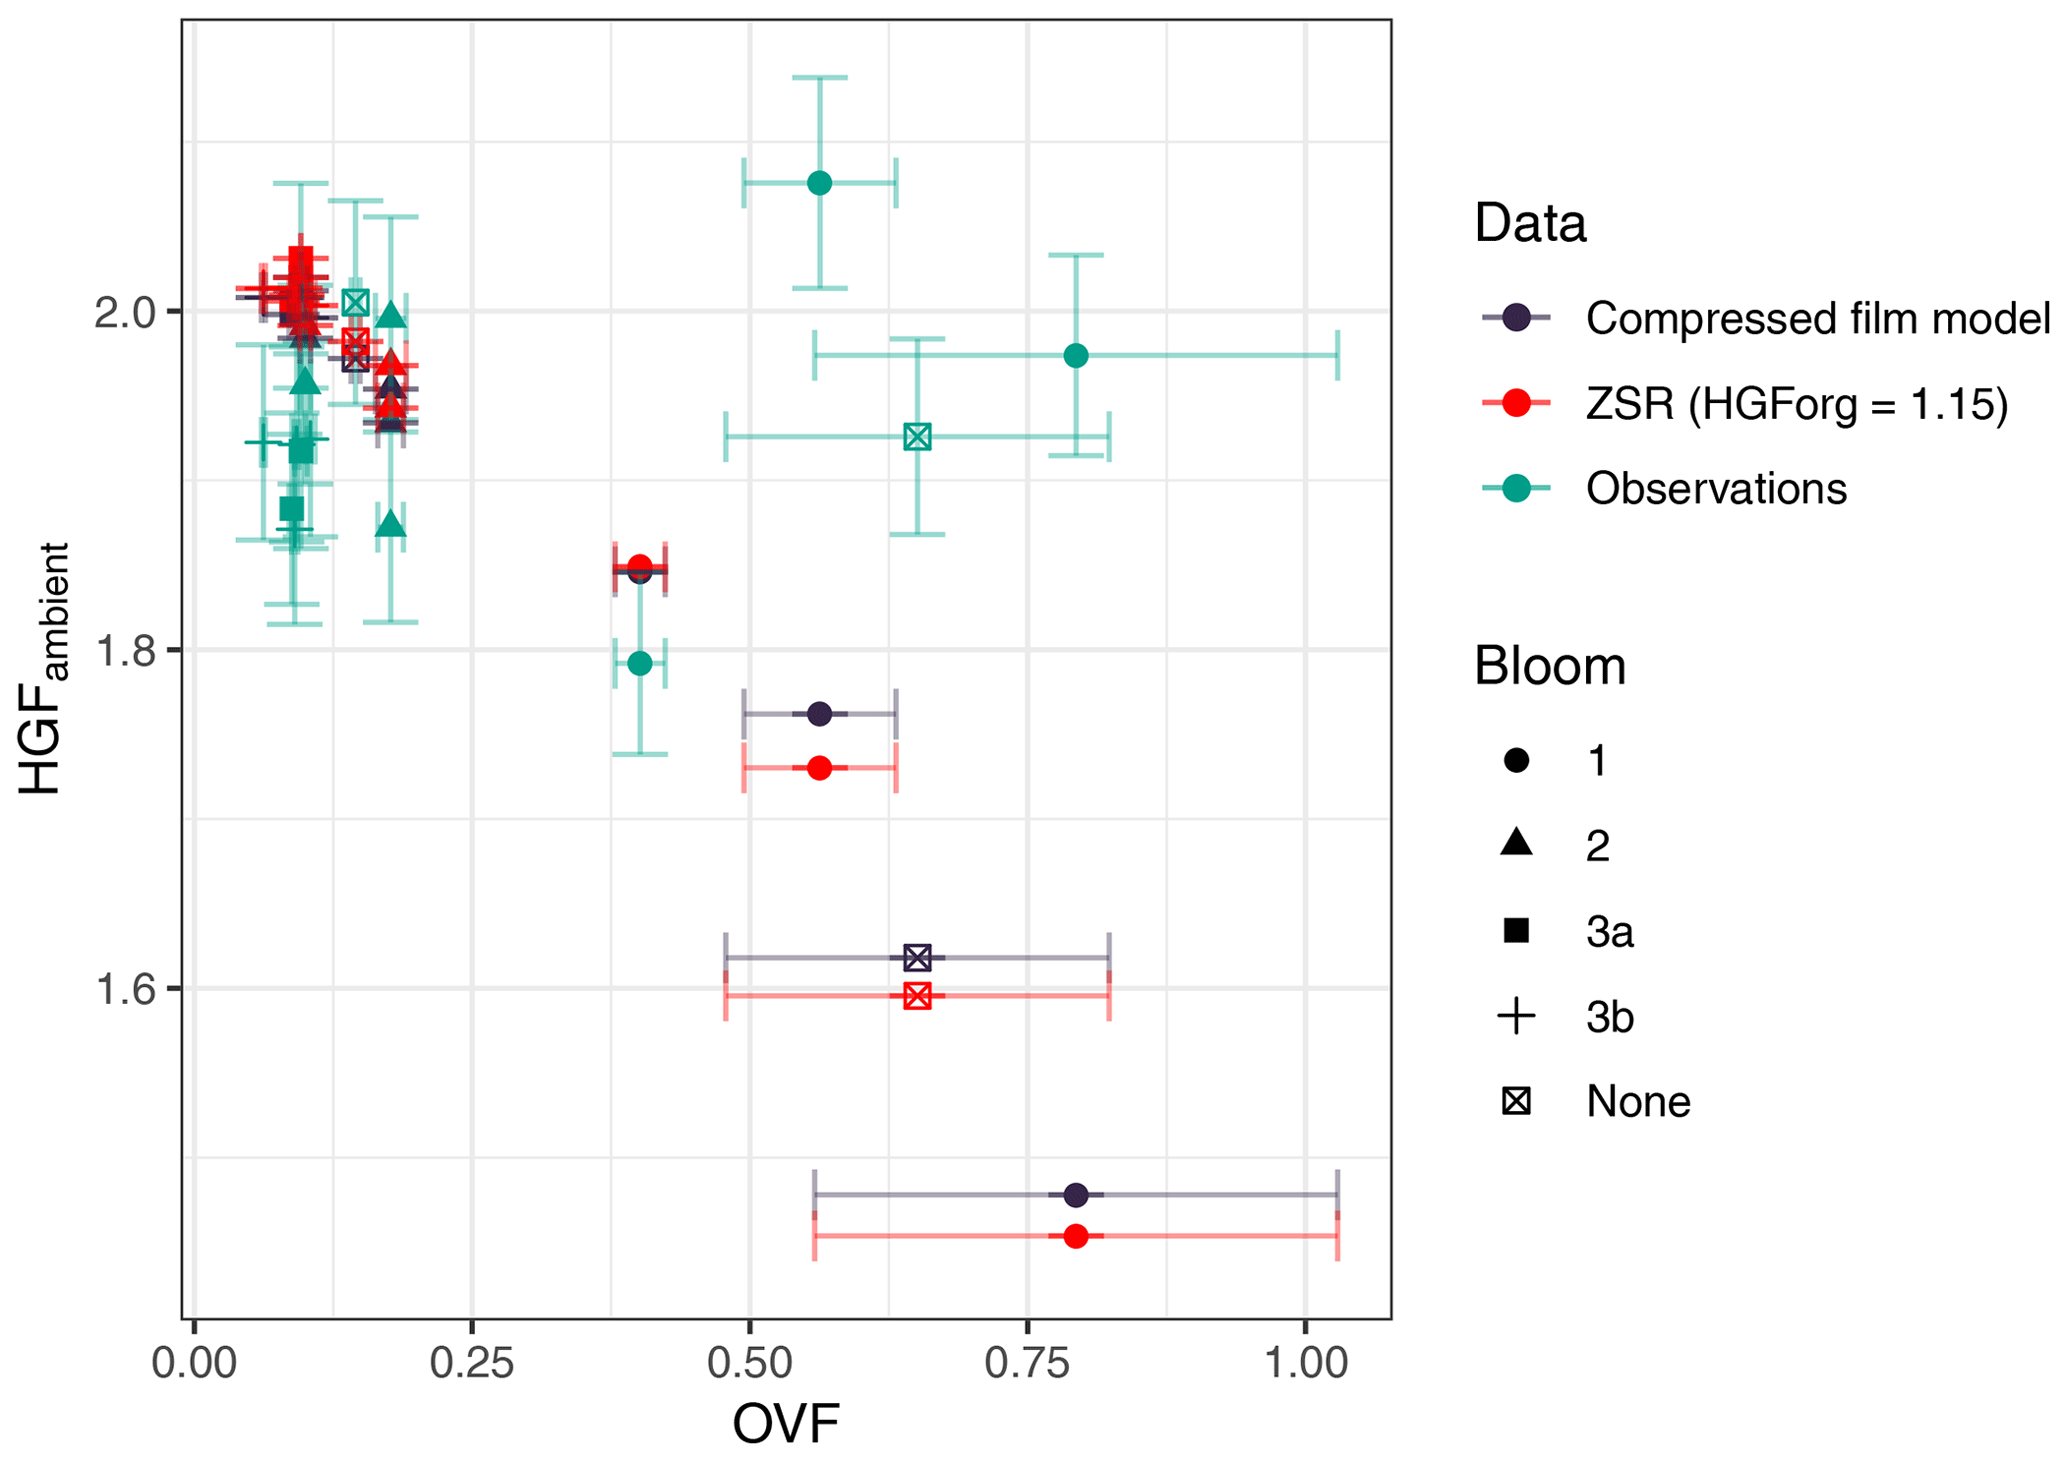
Figure 14Ambient HGF modelled using the compressed film model (green) as a function of OVF, modelled using the ZSR assumption (light blue) and observed (dark blue). Compressed film model output is for the case where lipid and protein fraction (computed from functional group measurements) can partition to the particle surface. The ZSR model used an organic HGF of 1.15.
The discrepancy between observed and modelled HGFs was particularly apparent for samples with OVFs collected during bloom 1, the most productive phytoplankton bloom. The drivers of the HGF discrepancy are unknown but could potentially relate to short-lived seawater components associated with strong phytoplankton blooms and the interaction between these components. For example, mixtures of surface-active membranes and monolayers (DPPC in particular) with inorganic (Casper et al., 2016) and organic (Edholm and Nagle, 2005) components have shown condensing effects, with associated impacts on the molecular area and volume. Modifications to the molecular volume have potential impacts on the hygroscopicity through Raoult's law (Petters et al., 2009) and through changes in surface tension. The weak influence of seawater biology on aerosol hygroscopicity in the supersaturated regime during intense phytoplankton blooms has previously been reported (Collins et al., 2016) and hypothesised to be associated with a decrease in surface tension at high organic volume fractions. Decreased surface tension does not explain the observed HGFs at high organic volume fractions in this study; the processes controlling the HGFs we observed may be relevant to these supersaturated observations. It should be pointed out that it is unknown whether these processes persist as the droplet grows and the solutes become more dilute; therefore, the impact on CCN concentration is unknown. Further observation of subsaturated and supersaturated water uptake and composition of SSA from intense phytoplankton blooms is required to understand the importance of water uptake deviations from the ZSR assumptions. Our results support previous studies which indicate a preference for examining the water uptake properties of SSA using realistic seawater, with complex composition (Prather et al., 2013), rather than models with a small number of components.
Chamber measurements of primary marine aerosol generated from 23 seawater samples collected across three phytoplankton blooms tracked during the 23 d SOAP voyage over the Chatham Rise (east of New Zealand) are examined in this study. The SSA was an internal mixture of sea salt and organics. Volatility measurements at a preselected particle mobility diameter of 50 nm indicated that the SSA had an organic volume fraction of up to 0.79, with an average of 0.24±0.22. Filter measurements of PM for diameters less than approximately 1 µm were analysed for the concentration of organic functional groups using FTIR, and the concentration of inorganic species was determined using IBA. The organic mass fractions ranged from 0.03 to 0.23 and had a large proportion of hydroxyl functional groups which, along with very low alkane-to-hydroxyl ratios, suggests a polysaccharide-rich, less-aliphatic organic species. Ca2+ was observed to be 1.7 times higher in the aerosol phase than in seawater, which is consistent with other primary marine aerosol studies. A possible explanation for this is that Ca2+ complexes with organics in the SML, which is supported by the correlation of the Ca2+ enrichment factor with SSA PM1 OMF.
The SSA organic fraction displayed a scattered correlation with chlorophyll a, consistent with previous studies which show that chlorophyll a is best used to correlate SSA organic enrichment over larger spatial scales and at temporal scales of the order of months. The OCEANFILMS model provided an improved representation of the SSA organic fraction observed in this study, in particular when the co-adsorption of polysaccharides was included, i.e. when OCEANFILMS-2 was applied. High hydroxyl to PM1 OMF fractions were observed from FTIR measurements, which translated to large estimated contributions from the polysaccharide-like molecular class of 0.72±0.06. OCEANFILMS-2 underestimated the contribution from the polysaccharide-like molecular class (0.39±0.06). Further work on representing the adsorption of polysaccharide species is required.
Water uptake measurements revealed that the SSA hygroscopicity was largely invariable with the organic mass fraction, with HGFs averaging 1.93±0.08. The observed HGFs deviated from the regularly used water uptake mixing rule, the ZSR assumption, particularly during B1 when organic volume fractions were above 0.4. At low OVFs the inclusion of the sea salt hydrate component in the ZSR model improved the agreement with measurements. The representation of hygroscopicity was only marginally improved at high OVFs when the compressed film model was applied. Despite the inclusion of the surface tension effect there was still a significant discrepancy between the observed and modelled HGFs at high OVFs. The processes driving the high HGFs observed at high OVFs are uncertain; further observations of SSA composition, subsaturated and supersaturated water uptake during intense phytoplankton blooms are required.
The SSA organics showed consistently low alkane-to-hydroxyl ratios, even in relatively productive waters with high SSA organic fractions, and surface tension effects. These results could indicate that the source and structure of the SSA organics was largely consistent throughout the voyage, for example made up of lipopolysaccharides, which have previously been identified as an important component in primary marine aerosols. These measurements provide valuable comparison with observations for models of SSA organic enrichment and water uptake. Constraints on emissions and process models for this region are of particular importance because existing measurements are sparse and it is a region for which SSA has been observed to make up a large contribution to CCN.
The data are available through the World Data Centre PANGAEA. VH-TDMA data are available at https://doi.org/10.1594/PANGAEA.919801 (Cravigan et al., 2020a) and https://doi.org/10.1594/PANGAEA.919793 (Cravigan et al., 2020b), FTIR data are available at https://doi.org/10.1594/PANGAEA.919809 (Cravigan et al., 2020c), and IBA data are available at https://doi.org/10.1594/PANGAEA.919790 (Cravigan et al., 2020d). The nascent SSA composition, water uptake and volatility data are available in the Supplement. Further data and information are available by request to the corresponding author or the voyage leader Cliff S. Law (cliff.law@niwa.co.nz).
The supplement related to this article is available online at: https://doi.org/10.5194/acp-20-7955-2020-supplement.
The SOAP campaign was led and coordinated by CSL and MJH. CSL led the ocean biogeochemistry work programme and MJH led the atmospheric work programme. LTC, MDM, PV, MJH and CSL made measurements during the SOAP voyage. GO developed fatty acids and alkane techniques and analysed samples. KS collected workboat samples, conducted Chl a sampling and optical microscopy on phytoplankton species. TJB sampled and analysed high-molecular-weight sugars and proteins. RLM and LMR performed FTIR analysis on SSA filter samples. ES and LTC performed IBA analysis on filter samples. LTC led analysis and interpretation of data, with input from all authors (ZR in particular), and the manuscript production, with input from all authors.
The authors declare that they have no conflict of interest.
This article is part of the special issue “Surface Ocean Aerosol Production (SOAP) (ACP/OS inter-journal SI)”. It is not associated with a conference.
We acknowledge the invaluable assistance of the captain, officers and crew of the R/V Tangaroa. We thank Gus Olivares and Nick Talbot for collection and analysis of samples. VOC and CCN measurements were supported by CSIRO's Capability Development Fund. Some of the data reported in this paper were obtained at the Central Analytical Research Facility (CARF) operated by the Institute for Future Environments (QUT). Access to CARF is supported by generous funding from the Science and Engineering Faculty (QUT).
This research has been supported by the Australian Institute of Nuclear Science and Engineering (grant no. ALNGRA13048), the Australian Research Council (grant no. DP150101649), the National Institute of Water and Atmospheric Research (Climate and Atmosphere Research Programme 3 – Role of the oceans, grant no. 2015/16 SCI), the National Science Foundation (grant no. AGS-1013423), the Academy of Finland (grant no. 136841), and the European Cooperation in Science and Technology (Action 735).
This paper was edited by Markus Petters and reviewed by Christopher Oxford and one anonymous referee.
Adams, E. M., Casper, C. B., and Allen, H. C.: Effect of cation enrichment on dipalmitoylphosphatidylcholine (DPPC) monolayers at the air-water interface, J. Colloid Interf. Sci., 478, 353–364, 2016. a
Alroe, J., Cravigan, L. T., Mallet, M. D., Ristovski, Z. D., Miljevic, B., Osuagwu, C. G., and Johnson, G. R.: Determining the link between hygroscopicity and composition for semi-volatile aerosol species, Atmos. Meas. Tech., 11, 4361–4372, https://doi.org/10.5194/amt-11-4361-2018, 2018. a
Ault, A. P., Moffet, R. C., Baltrusaitis, J., Collins, D. B., Ruppel, M. J., Cuadra-Rodriguez, L. A., Zhao, D., Guasco, T. L., Ebben, C. J., Geiger, F. M., Bertram, T. H., Prather, K. A., and Grassian, V. H.: Size-dependent changes in sea spray aerosol composition and properties with different seawater conditions, Environ. Sci. Technol., 47, 5603–5612, https://doi.org/10.1021/es400416g, 2013a. a, b, c, d, e
Ault, A. P., Zhao, D., Ebben, C. J., Tauber, M. J., Geiger, F. M., Prather, K. A., and Grassian, V. H.: Raman microspectroscopy and vibrational sum frequency generation spectroscopy as probes of the bulk and surface compositions of size-resolved sea spray aerosol particles, Phys. Chem. Chem. Phys., 15, 6206, https://doi.org/10.1039/c3cp43899f, 2013b. a
Bates, T. S., Quinn, P. K., Frossard, A. A., Russell, L. M., Hakala, J., Petäjä, T., Kulmala, M., Covert, D. S., Cappa, C. D., Li, S. M., Hayden, K. L., Nuaaman, I., McLaren, R., Massoli, P., Canagaratna, M. R., Onasch, T. B., Sueper, D., Worsnop, D. R., and Keene, W. C.: Measurements of ocean derived aerosol off the coast of California, J. Geophys. Res., 117, D00V15, https://doi.org/10.1029/2012JD017588, 2012. a, b, c, d
Bikkina, P., Kawamura, K., Bikkina, S., Kunwar, B., Tanaka, K., and Suzuki, K.: Hydroxy Fatty Acids in Remote Marine Aerosols over the Pacific Ocean: Impact of Biological Activity and Wind Speed, ACS Earth Space Chem., 3, 366–379, 2019. a
Bodas-Salcedo, A., Williams, K. D., Field, P. R., and Lock, A. P.: The surface downwelling solar radiation surplus over the southern ocean in the met office model: The role of midlatitude cyclone clouds, J. Climate, 25, 7467–7486, 2012. a
Burrows, S. M., Ogunro, O., Frossard, A. A., Russell, L. M., Rasch, P. J., and Elliott, S. M.: A physically based framework for modeling the organic fractionation of sea spray aerosol from bubble film Langmuir equilibria, Atmos. Chem. Phys., 14, 13601–13629, https://doi.org/10.5194/acp-14-13601-2014, 2014. a, b, c, d, e, f, g, h
Burrows, S. M., Gobrogge, E., Fu, L., Link, K., Elliott, S. M., Wang, H., and Walker, R.: OCEANFILMS-2: Representing coadsorption of saccharides in marine films and potential impacts on modeled marine aerosol chemistry, Geophys. Res. Lett., 43, 8306–8313, https://doi.org/10.1002/2016GL069070, 2016. a, b, c, d, e
Casillas-Ituarte, N. N., Callahan, K. M., Tang, C. Y., Chen, X., Roeselová, M., Tobias, D. J., and Allen, H. C.: Surface organization of aqueous MgCl2 and application to atmospheric marine aerosol chemistry, P. Natl. Acad. Sci. USA, 107, 6616–6621, https://doi.org/10.1073/pnas.0912322107, 2010. a
Casper, C. B., Verreault, D., Adams, E. M., Hua, W., and Allen, H. C.: Surface Potential of DPPC Monolayers on Concentrated Aqueous Salt Solutions, J. Phys. Chem. B, 120, 2043–2052, https://doi.org/10.1021/acs.jpcb.5b10483, 2016. a, b, c
Ceburnis, D., O'Dowd, C. D., Jennings, G. S., Facchini, M. C., Emblico, L., Decesari, S., Fuzzi, S., and Sakalys, J.: Marine aerosol chemistry gradients: Elucidating primary and secondary processes and fluxes, Geophys. Res. Lett., 35, L07804, https://doi.org/10.1029/2008GL033462, 2008. a
Claeys, M., Wang, W., Vermeylen, R., Kourtchev, I., Chi, X., Farhat, Y., Surratt, J. D., Gómez-González, Y., Sciare, J., and Maenhaut, W.: Chemical characterisation of marine aerosol at Amsterdam Island during the austral summer of 2006–2007, J. Aerosol Sci., 41, 13–22, 2010. a
Cochran, R. E., Laskina, O., Trueblood, J. V., Estillore, A. D., Morris, H. S., Jayarathne, T., Sultana, C. M., Lee, C., Lin, P., Laskin, J., Laskin, A., Dowling, J. A., Qin, Z., Cappa, C. D., Bertram, T. H., Tivanski, A. V., Stone, E. A., Prather, K. A., and Grassian, V. H.: Molecular Diversity of Sea Spray Aerosol Particles: Impact of Ocean Biology on Particle Composition and Hygroscopicity, Chem, 2, 655–667, https://doi.org/10.1016/j.chempr.2017.03.007, 2017. a
Cohen, D. D., Stelcer, E., Hawas, O., and Garton, D.: IBA methods for characterisation of fine particulate atmospheric pollution: a local, regional and global research problem, The 13th International Conference on Particle Induced X-ray Emission (PIXE 2013), 219–220, 145–152, 2004. a
Collins, D. B., Ault, A. P., Moffet, R. C., Ruppel, M. J., Cuadra-Rodriguez, L. A., Guasco, T. L., Corrigan, C. E., Pedler, B. E., Azam, F., Aluwihare, L. I., Bertram, T. H., Roberts, G. C., Grassian, V. H., and Prather, K. A.: Impact of marine biogeochemistry on the chemical mixing state and cloud forming ability of nascent sea spray aerosol, J. Geophys. Res.-Atmos., 118, 8553–8565, https://doi.org/10.1002/jgrd.50598, 2013. a, b
Collins, D. B., Zhao, D. F., Ruppel, M. J., Laskina, O., Grandquist, J. R., Modini, R. L., Stokes, M. D., Russell, L. M., Bertram, T. H., Grassian, V. H., Deane, G. B., and Prather, K. A.: Direct aerosol chemical composition measurements to evaluate the physicochemical differences between controlled sea spray aerosol generation schemes, Atmos. Meas. Tech., 7, 3667–3683, https://doi.org/10.5194/amt-7-3667-2014, 2014. a, b, c, d
Collins, D. B., Bertram, T. H., Sultana, C. M., Lee, C., Axson, J. L., and Prather, K. A.: Phytoplankton blooms weakly influence the cloud forming ability of sea spray aerosol, Geophys. Res. Lett., 43, 9975–9983, https://doi.org/10.1002/2016GL069922, 2016. a, b, c, d
Cravigan, L. T.: Sources and composition of sub-200 nm sea spray aerosol inferred from volatility and hygroscopicity, Queensland University of Technology, Brisbane, available at: https://eprints.qut.edu.au/80835/ (last access: 17 October 2019), 2015. a, b
Cravigan, L. T., Ristovski, Z., Modini, R. L., Keywood, M. D., and Gras, J. L.: Observation of sea-salt fraction in sub-100 nm diameter particles at Cape Grim, J. Geophys. Res.-Atmos., 120, 1848–1864, https://doi.org/10.1002/2014JD022601, 2015. a, b, c
Cravigan, L. T., Mallet, M. D., Ristovski, Z., Modini, R. L., Russell, L. M., Stelcer, E., Cohen, D. D., Harvey, M. J., and Law, C. S.: Organic volume fraction and hygroscopic growth factor of nascent Sea Spray Aerosol (SSA) measured using VH-TDMA during the Surface Ocean Aerosol Production (SOAP) study to the Chatham Rise (east of New Zealand) onboard the RV Tangaroa in 2012, PANGAEA, https://doi.org/10.1594/PANGAEA.919801, 2020a. a
Cravigan, L. T., Mallet, M. D., Ristovski, Z., Modini, R. L., Russell, L. M., Stelcer, E., Cohen, D. D., Harvey, M. J., and Law, C. S.: Deliquescence of nascent Sea Spray Aerosol (SSA) measured using VH-TDMA during the Surface Ocean Aerosol Production (SOAP) study to the Chatham Rise onboard the RV Tangaroa in 2012, PANGAEA, https://doi.org/10.1594/PANGAEA.919793, 2020b. a
Cravigan, L. T., Mallet, M. D., Ristovski, Z., Modini, R. L., Russell, L. M., Stelcer, E., Cohen, D. D., Harvey, M. J., and Law, C. S.: Fourier Transform Infra-Red spectroscopy (FTIR) of submicron nascent Sea Spray Aerosol (SSA) measured during the Surface Ocean Aerosol Production (SOAP) study to the Chatham Rise (east of New Zealand) onboard the RV Tangaroa in 2012, PANGAEA, https://doi.org/10.1594/PANGAEA.919809, 2020c. a
Cravigan, L. T., Mallet, M. D., Ristovski, Z., Modini, R. L., Russell, L. M., Stelcer, E., Cohen, D. D., Harvey, M. J., and Law, C. S.: Ion Beam Analysis (IBA) of submicron nascent Sea Spray Aerosol (SSA) measured during the Surface Ocean Aerosol Production (SOAP) study to the Chatham Rise (east of New Zealand) onboard the RV Tangaroa in 2012, PANGAEA, https://doi.org/10.1594/PANGAEA.919790, 2020d. a
Edholm, O. and Nagle, J. F.: Areas of Molecules in Membranes Consisting of Mixtures, Biophys. J., 89, 1827–1832, https://doi.org/10.1529/biophysj.105.064329, 2005. a
Estillore, A. D., Hettiyadura, A. P. S., Qin, Z., Leckrone, E., Wombacher, B., Humphry, T., Stone, E. A., and Grassian, V. H.: Water Uptake and Hygroscopic Growth of Organosulfate Aerosol, Environ. Sci. Technol., 50, 4259–4268, https://doi.org/10.1021/acs.est.5b05014, 2016. a
Estillore, A. D., Morris, H. S., Or, V. W., Lee, H. D., Alves, M. R., Marciano, M. A., Laskina, O., Qin, Z., Tivanski, A. V., and Grassian, V. H.: Linking hygroscopicity and the surface microstructure of model inorganic salts, simple and complex carbohydrates, and authentic sea spray aerosol particles, Phys. Chem. Chem. Phys., 19, 21101–21111, https://doi.org/10.1039/C7CP04051B, 2017. a, b, c
Facchini, M. C., Rinaldi, M., Decesari, S., Carbone, C., Finessi, E., Mircea, M., Fuzzi, S., Ceburnis, D., Flanagan, R., Nilsson, E. D., Leeuw, G. d., Martino, M., Woeltjen, J., and O'Dowd, C. D.: Primary submicron marine aerosol dominated by insoluble organic colloids and aggregates, Geophys. Res. Lett., 35, L17814, https://doi.org/10.1029/2008GL034210, 2008. a, b, c, d, e, f, g
Forestieri, S. D., Moore, K. A., Borrero, R. M., Wang, A., Stokes, M. D., and Cappa, C. D.: Temperature and Composition Dependence of Sea Spray Aerosol Production, Geophys. Res. Lett., 45, 7218–7225, https://doi.org/10.1029/2018gl078193, 2018a. a
Forestieri, S. D., Staudt, S. M., Kuborn, T. M., Faber, K., Ruehl, C. R., Bertram, T. H., and Cappa, C. D.: Establishing the impact of model surfactants on cloud condensation nuclei activity of sea spray aerosol mimics, Atmos. Chem. Phys., 18, 10985–11005, https://doi.org/10.5194/acp-18-10985-2018, 2018b. a, b, c, d, e
Fossum, K. N., Ovadnevaite, J., Ceburnis, D., Dall'Osto, M., Marullo, S., Bellacicco, M., Simó, R., Liu, D., Flynn, M., Zuend, A., and O'Dowd, C.: Summertime Primary and Secondary Contributions to Southern Ocean Cloud Condensation Nuclei, Sci. Rep.-UK, 8, 13844, https://doi.org/10.1038/s41598-018-32047-4, 2018. a
Frossard, A. A. and Russell, L. M.: Removal of Sea Salt Hydrate Water from Seawater-Derived Samples by Dehydration, Environ. Sci. Technol., 46, 13326–13333, https://doi.org/10.1021/es3032083, 2012. a
Frossard, A. A., Russell, L. M., Burrows, S. M., Elliott, S. M., Bates, T. S., and Quinn, P. K.: Sources and composition of submicron organic mass in marine aerosol particles, J. Geophys. Res.-Atmos., 119, 12977–13003, https://doi.org/10.1002/2014JD021913, 2014. a, b, c, d, e
Fuentes, E., Coe, H., Green, D., de Leeuw, G., and McFiggans, G.: Laboratory-generated primary marine aerosol via bubble-bursting and atomization, Atmos. Meas. Tech., 3, 141–162, https://doi.org/10.5194/amt-3-141-2010, 2010. a, b, c, d, e
Fuentes, E., Coe, H., Green, D., and McFiggans, G.: On the impacts of phytoplankton-derived organic matter on the properties of the primary marine aerosol – Part 2: Composition, hygroscopicity and cloud condensation activity, Atmos. Chem. Phys., 11, 2585–2602, https://doi.org/10.5194/acp-11-2585-2011, 2011. a, b, c, d, e, f
Gantt, B., Meskhidze, N., Facchini, M. C., Rinaldi, M., Ceburnis, D., and O'Dowd, C. D.: Wind speed dependent size-resolved parameterization for the organic mass fraction of sea spray aerosol, Atmos. Chem. Phys., 11, 8777–8790, https://doi.org/10.5194/acp-11-8777-2011, 2011. a, b, c, d
Gras, J. L. and Keywood, M.: Cloud condensation nuclei over the Southern Ocean: wind dependence and seasonal cycles, Atmos. Chem. Phys., 17, 4419–4432, https://doi.org/10.5194/acp-17-4419-2017, 2017. a
Gysel, M., McFiggans, G. B., and Coe, H.: Inversion of tandem differential mobility analyser (TDMA) measurements, J. Aerosol Sci., 40, 134–151, https://doi.org/10.1016/j.jaerosci.2008.07.013, 2009. a
Haynes, W. M.: CRC Handbook of Chemistry and Physics, 99th (internet version 2018) Edn., CRC Press/Taylor & Francis, Boca Raton, Florida, 2018. a, b
Johnson, G. R., Ristovski, Z., and Morawska, L.: Method for measuring the hygroscopic behaviour of lower volatility fractions in an internally mixed aerosol, J. Aerosol Sci., 35, 443–455, https://doi.org/10.1016/j.jaerosci.2003.10.008, 2004. a, b
Johnson, G. R., Fletcher, C., Meyer, N., Modini, R., and Ristovski, Z. D.: A robust, portable H-TDMA for field use, J. Aerosol Sci., 39, 850–861, https://doi.org/10.1016/j.jaerosci.2008.05.005, 2008. a
Joutsensaari, J., Vaattovaara, P., Vesterinen, M., Hämeri, K., and Laaksonen, A.: A novel tandem differential mobility analyzer with organic vapor treatment of aerosol particles, Atmos. Chem. Phys., 1, 51–60, https://doi.org/10.5194/acp-1-51-2001, 2001. a, b, c
Keene, W. C., Maring, H., Maben, J. R., Kieber, D. J., Pszenny, A. A. P., Dahl, E. E., Izaguirre, M. A., Davis, A. J., Long, M. S., Zhou, X., Smoydzin, L., and Sander, R.: Chemical and physical characteristics of nascent aerosols produced by bursting bubbles at a model air‐sea interface, J. Geophys. Res., 112, D21202, https://doi.org/10.1029/2007JD008464, 2007. a, b, c, d, e, f
King, S. M., Butcher, A. C., Rosenoern, T., Coz, E., Lieke, K. I., de Leeuw, G., Nilsson, E. D., and Bilde, M.: Investigating Primary Marine Aerosol Properties: CCN Activity of Sea Salt and Mixed Inorganic–Organic Particles, Environ. Sci. Technol., 46, 10405–10412, https://doi.org/10.1021/es300574u, 2013. a
Laskin, A., Moffet, R. C., Gilles, M. K., Fast, J. D., Zaveri, R. A., Wang, B., Nigge, P., and Shutthanandan, J.: Tropospheric chemistry of internally mixed sea salt and organic particles: Surprising reactivity of NaCl with weak organic acids, J. Geophys. Res., 117, D15302, https://doi.org/10.1029/2012JD017743, 2012. a, b
Law, C. S., Smith, M. J., Harvey, M. J., Bell, T. G., Cravigan, L. T., Elliott, F. C., Lawson, S. J., Lizotte, M., Marriner, A., McGregor, J., Ristovski, Z., Safi, K. A., Saltzman, E. S., Vaattovaara, P., and Walker, C. F.: Overview and preliminary results of the Surface Ocean Aerosol Production (SOAP) campaign, Atmos. Chem. Phys., 17, 13645–13667, https://doi.org/10.5194/acp-17-13645-2017, 2017. a, b, c, d
Leck, C. and Svensson, E.: Importance of aerosol composition and mixing state for cloud droplet activation over the Arctic pack ice in summer, Atmos. Chem. Phys., 15, 2545–2568, https://doi.org/10.5194/acp-15-2545-2015, 2015. a, b
Mallet, M., Cravigan, L., Miljevic, B., Vaattovaara, P., Deschaseaux, E., Swan, H., Jones, G., and Ristovski, Z.: Sea spray aerosol in the Great Barrier Reef and the presence of nonvolatile organics, J. Geophys. Res.-Atmos., 121, 7088–7099, https://doi.org/10.1002/2016JD024966, 2016. a, b, c, d, e
Maria, S. F., Russell, L. M., Turpin, B. J., Porcja, R. J., Campos, T. L., Weber, R. J., and Huebert, B. J.: Source signatures of carbon monoxide and organic functional groups in Asian Pacific Regional Aerosol Characterization Experiment (ACE‐Asia) submicron aerosol types, J. Geophys. Res., 108, 8637, https://doi.org/10.1029/2003JD003703, 2003. a
McCoy, D. T., Burrows, S. M., Wood, R., Grosvenor, D. P., Elliott, S. M., Ma, P. L., Rasch, P. J., and Hartmann, D. L.: Natural aerosols explain seasonal and spatial patterns of Southern Ocean cloud albedo, Sci. Adv., 1, e1500157, https://doi.org/10.1126/sciadv.1500157, 2015. a
Miyazaki, Y., Kawamura, K., and Sawano, M.: Size distributions and chemical characterization of water-soluble organic aerosols over the western North Pacific in summer, J. Geophys. Res., 115, D23210, https://doi.org/10.1029/2010JD014439, 2010. a
Modini, R. L., Harris, B., and Ristovski, Z. D.: The organic fraction of bubble-generated, accumulation mode Sea Spray Aerosol (SSA), Atmos. Chem. Phys., 10, 2867–2877, https://doi.org/10.5194/acp-10-2867-2010, 2010a. a, b, c, d, e, f, g, h, i, j, k
Modini, R. L., Johnson, G. R., He, C., and Ristovski, Z. D.: Observation of the suppression of water uptake by marine particles, Atmos. Res., 98, 219–228, 2010b. a
Modini, R. L., Russell, L. M., Deane, G. B., and Stokes, M. D.: Effect of soluble surfactant on bubble persistence and bubble-produced aerosol particles, J. Geophys. Res.-Atmos., 118, 1388–1400, https://doi.org/10.1002/jgrd.50186, 2013. a, b
Moore, R. H., Ingall, E. D., Sorooshian, A., and Nenes, A.: Molar mass, surface tension, and droplet growth kinetics of marine organics from measurements of CCN activity, Geophys. Res. Lett., 35, L07801, https://doi.org/10.1029/2008gl033350, 2008. a, b
Myhre, G., Shindell, D., Bréon, F. M., and Collins, W.: Anthropogenic and natural radiative forcing, 41, 2623–2630, https://doi.org/10.1002/2013GL059099, 2013. a
Niedermeier, D., Wex, H., Voigtländer, J., Stratmann, F., Brüggemann, E., Kiselev, A., Henk, H., and Heintzenberg, J.: LACIS-measurements and parameterization of sea-salt particle hygroscopic growth and activation, Atmos. Chem. Phys., 8, 579–590, https://doi.org/10.5194/acp-8-579-2008, 2008. a
O'Dowd, C., Ceburnis, D., Ovadnevaite, J., Bialek, J., Stengel, D. B., Zacharias, M., Nitschke, U., Connan, S., Rinaldi, M., Fuzzi, S., Decesari, S., Facchini, M. C., Marullo, S., Santoleri, R., Dell’Anno, A., Corinaldesi, C., Tangherlini, M., and Danovaro, R.: Connecting marine productivity to sea-spray via nanoscale biological processes: Phytoplankton Dance or Death Disco?, Sci. Rep.-UK, 5, 14883, https://doi.org/10.1038/srep14883, 2015. a, b, c, d
O'Dowd, C. D., Facchini, M. C., Cavalli, F., Ceburnis, D., Mircea, M., Decesari, S., Fuzzi, S., Yoon, Y. J., and Putaud, J.-P.: Biogenically driven organic contribution to marine aerosol, Nature, 431, 676–680, https://doi.org/10.1038/nature02959, 2004. a, b
Ovadnevaite, J., Ceburnis, D., Martucci, G., Bialek, J., Monahan, C., Rinaldi, M., Facchini, M. C., Berresheim, H., Worsnop, D. R., and O'Dowd, C.: Primary marine organic aerosol: A dichotomy of low hygroscopicity and high CCN activity, Geophys. Res. Lett., 38, L21806, https://doi.org/10.1029/2011GL048869, 2011a. a, b
Ovadnevaite, J., O'Dowd, C., Dall'Osto, M., Ceburnis, D., Worsnop, D. R., and Berresheim, H.: Detecting high contributions of primary organic matter to marine aerosol: A case study, Geophys. Res. Lett., 38, L02807, https://doi.org/10.1029/2010GL046083, 2011b. a
Ovadnevaite, J., Zuend, A., Laaksonen, A., Sanchez, K. J., Roberts, G., Ceburnis, D., Decesari, S., Rinaldi, M., Hodas, N., Facchini, M. C., Seinfeld, J. H., and O'Dowd, C.: Surface tension prevails over solute effect in organic-influenced cloud droplet activation, Nature, 546, 637–641, https://doi.org/10.1038/nature22806, 2017. a
Petters, M. D., Kreidenweis, S. M., Prenni, A. J., Sullivan, R. C., Carrico, C. M., Koehler, K. A., and Ziemann, P. J.: Role of molecular size in cloud droplet activation, Geophys. Res. Lett., 36, L22801, https://doi.org/10.1029/2009gl040131, 2009. a, b
Petters, S. S. and Petters, M. D.: Surfactant effect on cloud condensation nuclei for two-component internally mixed aerosols, J. Geophys. Res.-Atmos., 121, 1878–1895, https://doi.org/10.1002/2015JD024090, 2016. a
Prather, K. A., Bertram, T. H., Grassian, V. H., Deane, G. B., Stokes, M. D., DeMott, P. J., Aluwihare, L. I., Palenik, B. P., Azam, F., Seinfeld, J. H., Moffet, R. C., Molina, M. J., Cappa, C. D., Geiger, F. M., Roberts, G. C., Russell, L. M., Ault, A. P., Baltrusaitis, J., Collins, D. B., Corrigan, C. E., Cuadra-Rodriguez, L. A., Ebben, C. J., Forestieri, S. D., Guasco, T. L., Hersey, S. P., Kim, M. J., Lambert, W. F., Modini, R. L., Mui, W., Pedler, B. E., Ruppel, M. J., Ryder, O. S., Schoepp, N. G., Sullivan, R. C., and Zhao, D.: Bringing the ocean into the laboratory to probe the chemical complexity of sea spray aerosol, P. Natl. Acad. Sci. USA, 110, 7550–7555, 2013. a, b, c, d, e, f, g
Prisle, N. L., Raatikainen, T., Laaksonen, A., and Bilde, M.: Surfactants in cloud droplet activation: mixed organic-inorganic particles, Atmos. Chem. Phys., 10, 5663–5683, https://doi.org/10.5194/acp-10-5663-2010, 2010. a
Protat, A., Schulz, E., Rikus, L., Sun, Z., Xiao, Y., and Keywood, M.: Shipborne observations of the radiative effect of Southern Ocean clouds, J. Geophys. Res.-Atmos., 122, 318–328, https://doi.org/10.1002/2016JD026061, 2017. a
Quinn, P. K., Bates, T. S., Schulz, K. S., Coffman, D. J., Frossard, A. A., Russell, L. M., Keene, W. C., and Kieber, D. J.: Contribution of sea surface carbon pool to organic matter enrichment in sea spray aerosol, Nat. Geosci., 7, 228–232, https://doi.org/10.1038/ngeo2092, 2014. a, b, c, d, e, f, g, h
Quinn, P. K., Collins, D. B., Grassian, V. H., Prather, K. A., and Bates, T. S.: Chemistry and Related Properties of Freshly Emitted Sea Spray Aerosol, Chem. Rev., 115, 4383–4399, https://doi.org/10.1021/cr500713g, 2015. a
Quinn, P. K., Coffman, D. J., Johnson, J. E., Upchurch, L. M., and Bates, T. S.: Small fraction of marine cloud condensation nuclei made up of sea spray aerosol, Nat. Geosci., 30, 869, https://doi.org/10.1038/ngeo3003, 2017. a
Rasmussen, B. B., Nguyen, Q. T., Kristensen, K., Nielsen, L. S., and Bilde, M.: What controls volatility of sea spray aerosol? Results from laboratory studies using artificial and real seawater samples, J. Aerosol Sci., 107, 134–141, https://doi.org/10.1016/j.jaerosci.2017.02.002, 2017. a, b
Rinaldi, M., Fuzzi, S., Decesari, S., Marullo, S., Santoleri, R., Provenzale, A., Hardenberg, J. v., Ceburnis, D., Vaishya, A., O'Dowd, C. D., and Facchini, M. C.: Is chlorophyll-a the best surrogate for organic matter enrichment in submicron primary marine aerosol?, J. Geophys. Res.-Atmos., 118, 4964–4973, https://doi.org/10.1002/jgrd.50417, 2013. a, b
Ruehl, C. R. and Wilson, K. R.: Surface Organic Monolayers Control the Hygroscopic Growth of Submicrometer Particles at High Relative Humidity, J. Phys. Chem. A, 118, 3952–3966, https://doi.org/10.1021/jp502844g, 2014. a
Ruehl, C. R., Davies, J. F., and Wilson, K. R.: An interfacial mechanism for cloud droplet formation on organic aerosols, Science, 351, 1447–1450, https://doi.org/10.1126/science.aad4889, 2016. a, b, c, d
Russell, L. M.: Aerosol Organic-Mass-to-Organic-Carbon Ratio Measurements, Environ. Sci. Technol., 37, 2982–2987, https://doi.org/10.1021/es026123w, 2003. a
Russell, L. M., Hawkins, L. N., Frossard, A. A., Quinn, P. K., and Bates, T. S.: Carbohydrate-like composition of submicron atmospheric particles and their production from ocean bubble bursting, P. Natl. Acad. Sci. USA, 107, 6652–6657, 2010. a, b, c, d
Russell, L. M., Bahadur, R., and Ziemann, P. J.: Identifying organic aerosol sources by comparing functional group composition in chamber and atmospheric particles, P. Natl. Acad. Sci. USA, 108, 3516–3521, https://doi.org/10.1073/pnas.1006461108, 2011. a
Sakamoto, Y., Ishiguro, M., and Kitagawa, G.: Akaike information criterion statistics, KTK Scientific Publishers, Tokyo, translation by: Tokeigaku, J., D. Reidel, Dordrecht, Boston, Hingham, MA, Kluwer Academic Publishers, 1986. a
Salter, M. E., Hamacher-Barth, E., Leck, C., Werner, J., Johnson, C. M., Riipinen, I., Nilsson, E. D., and Zieger, P.: Calcium enrichment in sea spray aerosol particles, Geophys. Res. Lett., 43, 8277–8285, https://doi.org/10.1002/2016GL070275, 2016. a, b, c, d, e, f, g, h
Schwartz, S. E. and Lewis, E. R.: Sea salt aerosol production: mechanisms, methods, measurements and models: a critical review, American Geophysical Union, Washington, DC, 2004. a
Schwier, A. N., Rose, C., Asmi, E., Ebling, A. M., Landing, W. M., Marro, S., Pedrotti, M.-L., Sallon, A., Iuculano, F., Agusti, S., Tsiola, A., Pitta, P., Louis, J., Guieu, C., Gazeau, F., and Sellegri, K.: Primary marine aerosol emissions from the Mediterranean Sea during pre-bloom and oligotrophic conditions: correlations to seawater chlorophyll a from a mesocosm study, Atmos. Chem. Phys., 15, 7961–7976, https://doi.org/10.5194/acp-15-7961-2015, 2015. a, b
Schwier, A. N., Sellegri, K., Mas, S., Charrière, B., Pey, J., Rose, C., Temime-Roussel, B., Jaffrezo, J.-L., Parin, D., Picard, D., Ribeiro, M., Roberts, G., Sempéré, R., Marchand, N., and D'Anna, B.: Primary marine aerosol physical flux and chemical composition during a nutrient enrichment experiment in mesocosms in the Mediterranean Sea, Atmos. Chem. Phys., 17, 14645–14660, https://doi.org/10.5194/acp-17-14645-2017, 2017. a, b, c, d, e, f, g, h, i
Sciare, J., Favez, O., Sarda-Esteve, R., Oikonomou, K., Cachier, H., and Kazan, V.: Long-term observations of carbonaceous aerosols in the Austral Ocean atmosphere: Evidence of a biogenic marine organic source, J. Geophys. Res., 114, D15302, https://doi.org/10.1029/2009JD011998, 2009. a
Seinfeld, J. H. and Pandis, S. N.: Atmospheric chemistry and physics: from air pollution to climate change, 2nd Edn., Wiley, New York, 2006. a
Shank, L. M., Howell, S., Clarke, A. D., Freitag, S., Brekhovskikh, V., Kapustin, V., McNaughton, C., Campos, T., and Wood, R.: Organic matter and non-refractory aerosol over the remote Southeast Pacific: oceanic and combustion sources, Atmos. Chem. Phys., 12, 557–576, https://doi.org/10.5194/acp-12-557-2012, 2012. a
Sievering, H., Cainey, J., Harvey, M., McGregor, J., Nichol, S., and Quinn, P.: Aerosol non-sea-salt sulfate in the remote marine boundary layer under clear-sky and normal cloudiness conditions: Ocean-derived biogenic alkalinity enhances sea-salt sulfate production by ozone oxidation, J. Geophys. Res., 109, D19317, https://doi.org/10.1029/2003JD004315, 2004. a
Stokes, R. H. and Robinson, R. A.: Interactions in Aqueous Nonelectrolyte Solutions. I. Solute-Solvent Equilibria, J. Phys. Chem., 70, 2126–2131, https://doi.org/10.1021/j100879a010, 1966. a
Vaattovaara, P., Räsänen, M., Kühn, T., Joutsensaari, J., and Laaksonen, A.: A method for detecting the presence of organic fraction in nucleation mode sized particles, Atmos. Chem. Phys., 5, 3277–3287, https://doi.org/10.5194/acp-5-3277-2005, 2005. a, b, c
Zábori, J., Matisāns, M., Krejci, R., Nilsson, E. D., and Ström, J.: Artificial primary marine aerosol production: a laboratory study with varying water temperature, salinity, and succinic acid concentration, Atmos. Chem. Phys., 12, 10709–10724, https://doi.org/10.5194/acp-12-10709-2012, 2012. a
Zelenyuk, A., Imre, D., Cuadra-Rodriguez, L. A., and Ellison, B.: Measurements and interpretation of the effect of a soluble organic surfactant on the density, shape and water uptake of hygroscopic particles, J. Aerosol Sci., 38, 903–923, https://doi.org/10.1016/j.jaerosci.2007.06.006, 2007. a
Zieger, P., Väisänen, O., Corbin, J. C., Partridge, D. G., Bastelberger, S., Mousavi-Fard, M., Rosati, B., Gysel, M., Krieger, U. K., Leck, C., Nenes, A., Riipinen, I., Virtanen, A., and Salter, M. E.: Revising the hygroscopicity of inorganic sea salt particles, Nat. Commun., 8, 15883, https://doi.org/10.1038/ncomms15883, 2017. a, b, c