the Creative Commons Attribution 4.0 License.
the Creative Commons Attribution 4.0 License.
 | 08 Jul 2020
Source apportionment of atmospheric mercury in the remote marine atmosphere: Mace Head GAW station, Irish western coast
Danilo Custodio
Ralf Ebinghaus
T. Gerard Spain
Johannes Bieser
We examined recent atmospheric mercury concentrations measured with a high temporal resolution of 15 min at Mace Head, a GAW station on the western coast of Ireland. We attributed a direct contribution of 34 % (0.44 ng m−3) to primary sources. Additionally, a steep decline (0.05 ng yr−1) in mercury concentrations was observed between 2013 and 2018.
Using a stereo algorithm we reconstructed 99.9 % of the atmospheric mercury. A conservative analysis demonstrated no decrease in total gaseous mercury (TGM) associated with atmospheric species typically used as tracers for oceanic emissions. The results show that the atmospheric mercury mass is mainly loaded in a baseline factor with an ongoing decline. Moreover, we exploit temporal variation and wind pattern effects in the measured atmospheric species; the results show that the diurnal variation and seasonality in TGM observed in Mace Head are closely related to other species linked to primary sources and can be explained by transport from continental areas.
- Article
(2018 KB) -
Supplement
(675 KB) - BibTeX
- EndNote


Atmospheric mercury is a bioaccumulative, toxic pollutant with the potential to be transported over large distances, which presents a significant public health and environmental problem (WHO, 2007).
Despite efforts by governments and international agencies as well as the private sector to reduce mercury release into the environment, current environmental levels are often still of concern. Atmospheric mercury is emitted from both natural and anthropogenic sources as well as through recycling of past emissions. Natural sources are comprised of release from volcanoes, weathering of rocks, forest fires, and oceanic emissions. Anthropogenic sources are related to fossil fuel combustion, cement production, industrial activities, mining, and municipal or medical waste incineration. Mercury is also reintroduced into the atmosphere through natural processes such as oceanic evaporation after reduction of inorganic oxidized Hg in anaerobic environments, which leads to global cycling of this element (Corbitt et al., 2011; Streets et al., 2011). The source contribution as well as the lifetime of atmospheric mercury are only roughly estimated.
The 2018 Global Mercury Assessment (UN, 2018) reveals that primary anthropogenic mercury emissions into the air are 2220 t yr−1, also indicating an increase of 20 % from such sources in recent years. The 2018 UNEP Report (AMAP/UNEP, 2018) presents an inventory for the year 2015, which indicates that the greatest atmospheric mercury emissions resulted from combustion of fossils fuels, mainly coal. While mercury in the atmosphere is chemically inert, once released into this environment, all sources are of concern.
To compile a global assessment based on inventories requires a number of assumptions and generalizations (AMAP/UNEP, 2018). Several discrepancies are observed in the mass balance-based estimation: there can be large differences between estimates, and it is important to recognize that there are sources of error in all methods for estimating mercury emissions.
Here we report concentrations of atmospheric mercury (TGM: total gaseous mercury) measured from January 2013 to March 2018 at Mace Head. Mace Head station is located within the central north-eastern Atlantic region, and based on a GEOS-Chem simulation it is one of the regions most influenced by a decreasing mercury trend in ocean surface water, according to Soerensen et al. (2012).
Using the relationship between mercury and other chemical atmospheric trace species (O3, CFC-12, CCl4, N2O, CH4, CHCl3, CO, and H2) and meteorological data (wind speed and direction), we performed a mass balance to reconstruct atmospheric mercury. Solved by positive matrix factorization, the total mercury mass was distributed into four different factors, classified as baseline, combustion, oceanic, and a fourth factor, and then each of them was assessed for source trends.
Time series analysis of atmospheric mercury concentrations at Mace Head were already reported by Weigelt et al. (2015) and Ebinghaus et al. (2011).
In this work we apply a new approach for source apportionment and extend the time series analysis up to March 2018.
2.1 Sampling site and analytical methods
Mace Head atmospheric research station is located on the western coast of Ireland at 53.33∘ N and 9.54∘ W, 55 km from Galway (80 000 inhabitants), the nearest city with significant industrial activity. It is a GAW baseline station, exposed to the North Atlantic Ocean, and is an ideal location to study both natural and anthropogenic trace constituents in marine and continental air masses (Stanley et al., 2018).
In addition to atmospheric mercury, meteorological parameters are routinely monitored (https://www.met.ie/, last access: January 2020). Atmospheric CFC-11, CFC-12, CHCl3, CCl4, N2O, CH4, CO, and H2 are measured (Fig. S1 in the Supplement) as part of the AGAGE project (https://agage.mit.edu/, last access: January 2020).
TGM is monitored by an automated dual-channel, single-amalgamation, cold vapour atomic fluorescence analyser (Tekran Analyzer Model 2537B, Tekran Inc., Toronto, Canada) described by Ebinghaus et al. (2011). At some level, instrument failure is inevitable: they are susceptible to malfunctions that can result in lost or poor-quality data. Some data quality control steps are taken to minimize the risk of loss and to improve the overall quality of data. Validation process: in order to ensure data reliability and comparability of Mace Head mercury data, the GMOS-Data Quality Management (G-DQM) protocol described by D`Amore et al. (2015) is followed through a human check at Helmholtz-Zentrum Geesthacht.
The air-sampling inlet is located on a tower at 10 (18 ) with a rain shield only. Air is sampled at a flow rate of 1 L min−1 through unheated PTFE tubing ( O.D.) to the instrument, which is located in an air-conditioned laboratory. As reported by Weigelt (2015), a PTFE pre-filter (pore size 0.2 mm) at the inlet of the instrument protects the sampling cartridges from contamination by particles. The device is operated with a temporal resolution of 15 min, calibrated every 25 h using an internal mercury permeation source. The device has a detection limit of ∼0.1 ng m−3 (Weigelt et al., 2015).
The wind streamlines for near-surface-level conditions were assessed from https://earth.nullschool.net/ (last access: February 2020) and long-range transport of air pollutants was calculated using the HYSPLIT model (Draxler and Rolph, 2003) from NOAA (National Oceanic and Atmospheric Administration).
2.2 Source assessment/probability mass function
Apportionment of atmospheric species is often performed by receptor models that are based on the mass conservation principle.
The inclusion of the potential rotated infinity matrices transformation produces factors that appear to be closer to realistic chemical profiles of sources:
where xij is the concentration of the species j in the ith sample, gik is the contribution of the factor (associated with a source) kin in the ith sample, and fjk is the concentration of the species j in factor k as presented by Paatero and Hopke (2003) and described by Comero et al. (2009). This equation can be solved by the probability mass function in positive matrix factorization (PMF) (Paatero and Tapper, 1994) with the Multilinear Engine (ME-2) developed by Paatero (1999) and implemented in Version 5 of the US EPA PMF (https://www.epa.gov/air-research/positive-matrix-factorization-model-environmental-data-analyses, last access: January 2020).
PMF is a stereo algorithm where analytical data sets are combined to create fingerprints and the profile is used to assess the contribution of each source based on the mass load, also providing a robust uncertainty estimation and source diagnostics. In this study, PMF was applied to the Mace Head data set with an hourly time resolution for the period 2013 to 2018. The results were constrained to provide positive factor contribution. The uncertainty input in the matrix was estimated based on the analytical accuracy of each individual species reported in Stanley et al. (2018) and Weigelt et al. (2013).
The method provides better qualitative solutions and time resolution of sources than principal component analysis (PCA) (Huang et al., 1999) or chemical mass balance (CMB) since PMF can generate source profiles (“learning algorithm”) and allow input of uncertainties which allow individual treatment of matrix elements.

Figure 1TGM hourly variations measured at Mace Head, from 2013 to 2018 (c), time series of mercury attributed to each factor (b), and time series of sea and combustion only (a).
In the PMF the weighted factorization regression analysis is based on positive rotatable factorization of a non-singular matrix T:
where the new rotated factors are and as reported by Comore et al. (2009); then, the factors are non-negatively constrained.
Factor contributions are chosen on the basis of a matching strength score by using a form of discrete correlation. At the first interaction any matches which have the highest matching strength for primitive mass reconstruction that formed them are immediately chosen as reconstructed. Then, in accordance with the uniqueness constraint, all other matches associated with the primitives that have been formed for each chosen match are eliminated from further consideration. This allows further matches that were either not previously accepted or eliminated to propagate the process of PMF to a satisfactory solution if the propagation converges.
Time series of TGM concentrations composed of 48 914 h of measurements covering the period from January 2013 to March 2018 are given in Fig. 1. Concentrations range from 0.9 to 3.3 ng m−3, displaying a central tendency of 1.3 ± 0.2 ng m−3. TGM concentrations in the Northern Hemisphere have been decreasing in recent decades (Ebinghaus et al., 2011; Slemr et al., 2003). For instance, Ebinghaus et al. (2011) reported a declining trend of 0.028 ± 0.01 from 1996 to 2009. In more recent years (1996 to 2018, March), this decline continued with approximately 0.025 ± 0.04 , Fig. 2. This observation could reflect a trend in global emissions, as mercury, roughly, has an atmospheric lifetime of 0.5 to 1 year (Holmes et al., 2006; Lindberg et al., 2007; Si and Ariya 2018). The increasing improvement of manufacturing processes involving mercury and regulations limiting the emissions from coal-fired power plants since the 1980s (Hylander and Meili, 2003; Pirrone et al., 2009) could be a possible reason for this observed decline at Mace Head. Jiskra et al. (2018) report the Hg0 uptake by vegetation as an alternative mechanism for driving mercury depletion in the Northern Hemisphere atmosphere over the past 20 years.
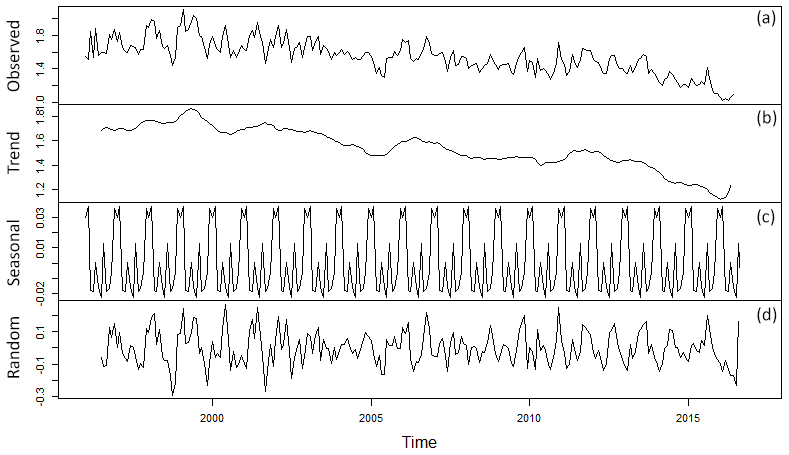
Figure 2Time series decomposition of TGM (monthly averages) measured at Mace Head from 1996 to February 2018. From top to bottom are presented the monthly time series followed by the patterns of deconstructed components, trend, seasonality, and radon. * TGM in ng m−3.
However, this decreasing trend is inconsistent with the increased emissions from 1990 to 2015, as indicated by anthropogenic Hg emission inventories (e.g. UN, 2018, and AMAP/UNEP, 2018). This conundrum related to increasing global emissions on the one hand and measured declines in atmospheric mercury is discussed by Zhang et al. (2016). They state that the inventories do not account for the decline in the atmospheric release of Hg from commercial products and do not properly account for the change in Hg0∕HgII speciation of emissions from coal-fired utilities after implementation of gas emission controls.
3.1 Temporal and wind pattern effects in mercury concentrations
Plots of TGM as a function of wind speed and direction can be seen in Fig. 3 as well as the polar frequency plot of wind direction. Concentrations of mercury are higher when winds come from the east (continental air masses) and lower for winds from the west and north-west (Atlantic air masses). The higher concentrations to the east are likely to be influenced by urban agglomerations, such as in Galway, Dublin, or even the UK and continental Europe. These higher levels observed to the east are associated with relatively strong wind speeds of 15 ms−1, which could indicate a relatively distant source. Furthermore, an increase in TGM with strong winds of 20 ms−1 was observed, indicating sources at further distances in air masses coming from westerly and south-westerly directions; 96 h back trajectories show that these high TGM concentrations at Mace Head were affected by air mass transport from the Iberian Peninsula and long-range transport from North America.
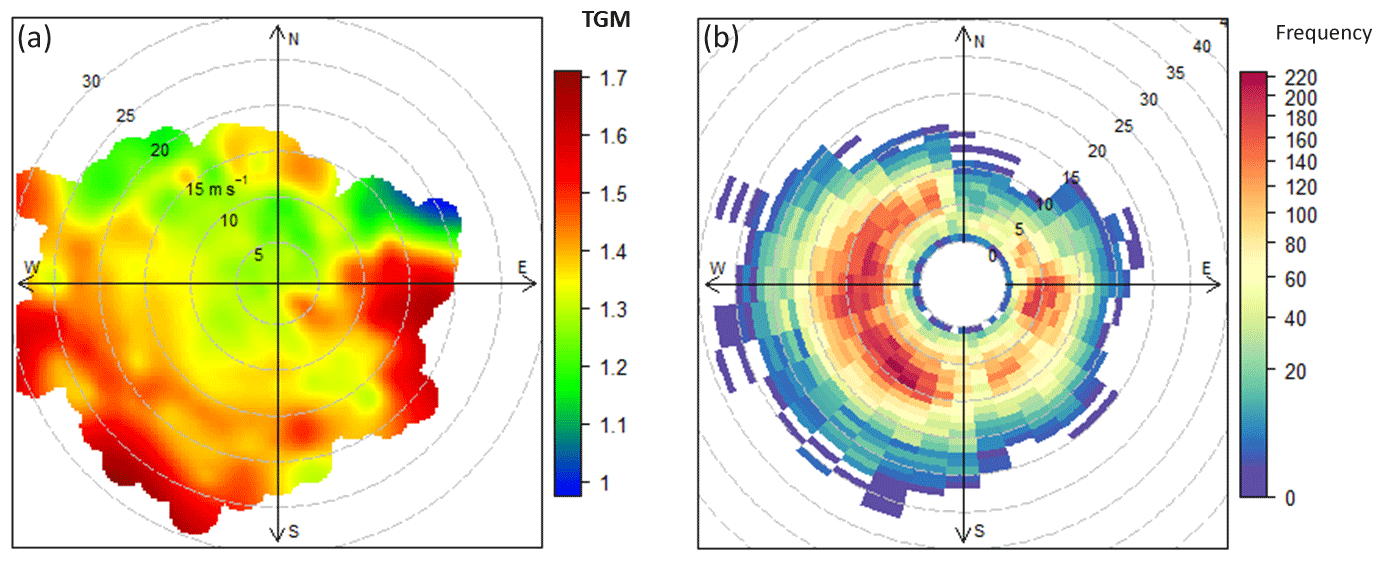
Figure 3Polar plots for TGM (a) and polar wind frequency (b) at Mace Head. * TGM in ng m−3 and wind speed in ms−1.
Higher mercury concentrations under the influence of easterly and strong westerly/south-westerly winds closely resemble those of other pollutants that are also closely linked to anthropogenic emissions, such as carbon monoxide, and suggest TGM enrichment from continental air masses.
The polar plot shows low concentrations of mercury associated with strong and weak winds coming from the North Sea and nearby land air masses, with potential sources to the north-west in <10 m s−1.
The diurnal cycle of elemental mercury (Hg0) has been discussed extensively (Laurier et al., 2003; Weiss-Penzias et al., 2003; Laurier and Mason, 2007; Xia et al., 2010; Obrist et al., 2011; Moore et al., 2013; Wang et al., 2014, 2017; Ci et al., 2015; Castagna et al., 2018; Jiskra et al., 2018). Kalinchuk et al. (2019) reported solar radiation-driven increase and decrease in mercury concentrations in the Sea of Japan and in the Sea of Okhotsk, respectively. They assumed that the decrease in Hg0 concentrations in the marine boundary layer during daytime is mainly caused by its oxidation, catalysed by active halogen species (mainly by atomic bromine radicals), which are released from sea salt aerosols as Br2 and could be transformed into reactive forms as a result of photolysis (Holmes et al., 2009; Sprovieri et al., 2010; Mao and Talbot, 2012; Moore et al., 2013; Si and Ariya, 2018). However, the absence of a diurnal cycle for mercury is reported in several studies, and more research should be done to confirm the catalytic photolysis oxidation, as large uncertainties exist in the gas-phase reaction of mercury (Si and Ariya, 2018).
With a standard electrode potential (E0) of +0.85 V and a kinetic coefficient of reactivity of < 9.8 × 10⁻¹³ to 2.1 × 10⁻¹² at 1 atm and 298 K (Khalizov et al., 2003; Shepler et al., 2007; Subir et al., 2011; Sun et al., 2016), Hg0 is chemically relatively inert towards gas-phase oxidation, and a significant daily mass depletion by photooxidation is very unlikely.
Seasonality and diurnal patterns for mercury concentrations at Mace Head have been detected, but similar patterns were observed for CO. As presented in Fig. 4, wind direction was a driving factor for diurnal cycling of TGM at Mace Head as well as for CO and CHCl3. Winds from the east (land breezes) showed sharp increases in TGM, CO, CFC-12, and CCl4 (Fig. 3 and Fig. S3 in the Supplement). Conversely, an increase in CHCl3 in offshore winds (sea breezes) was observed.
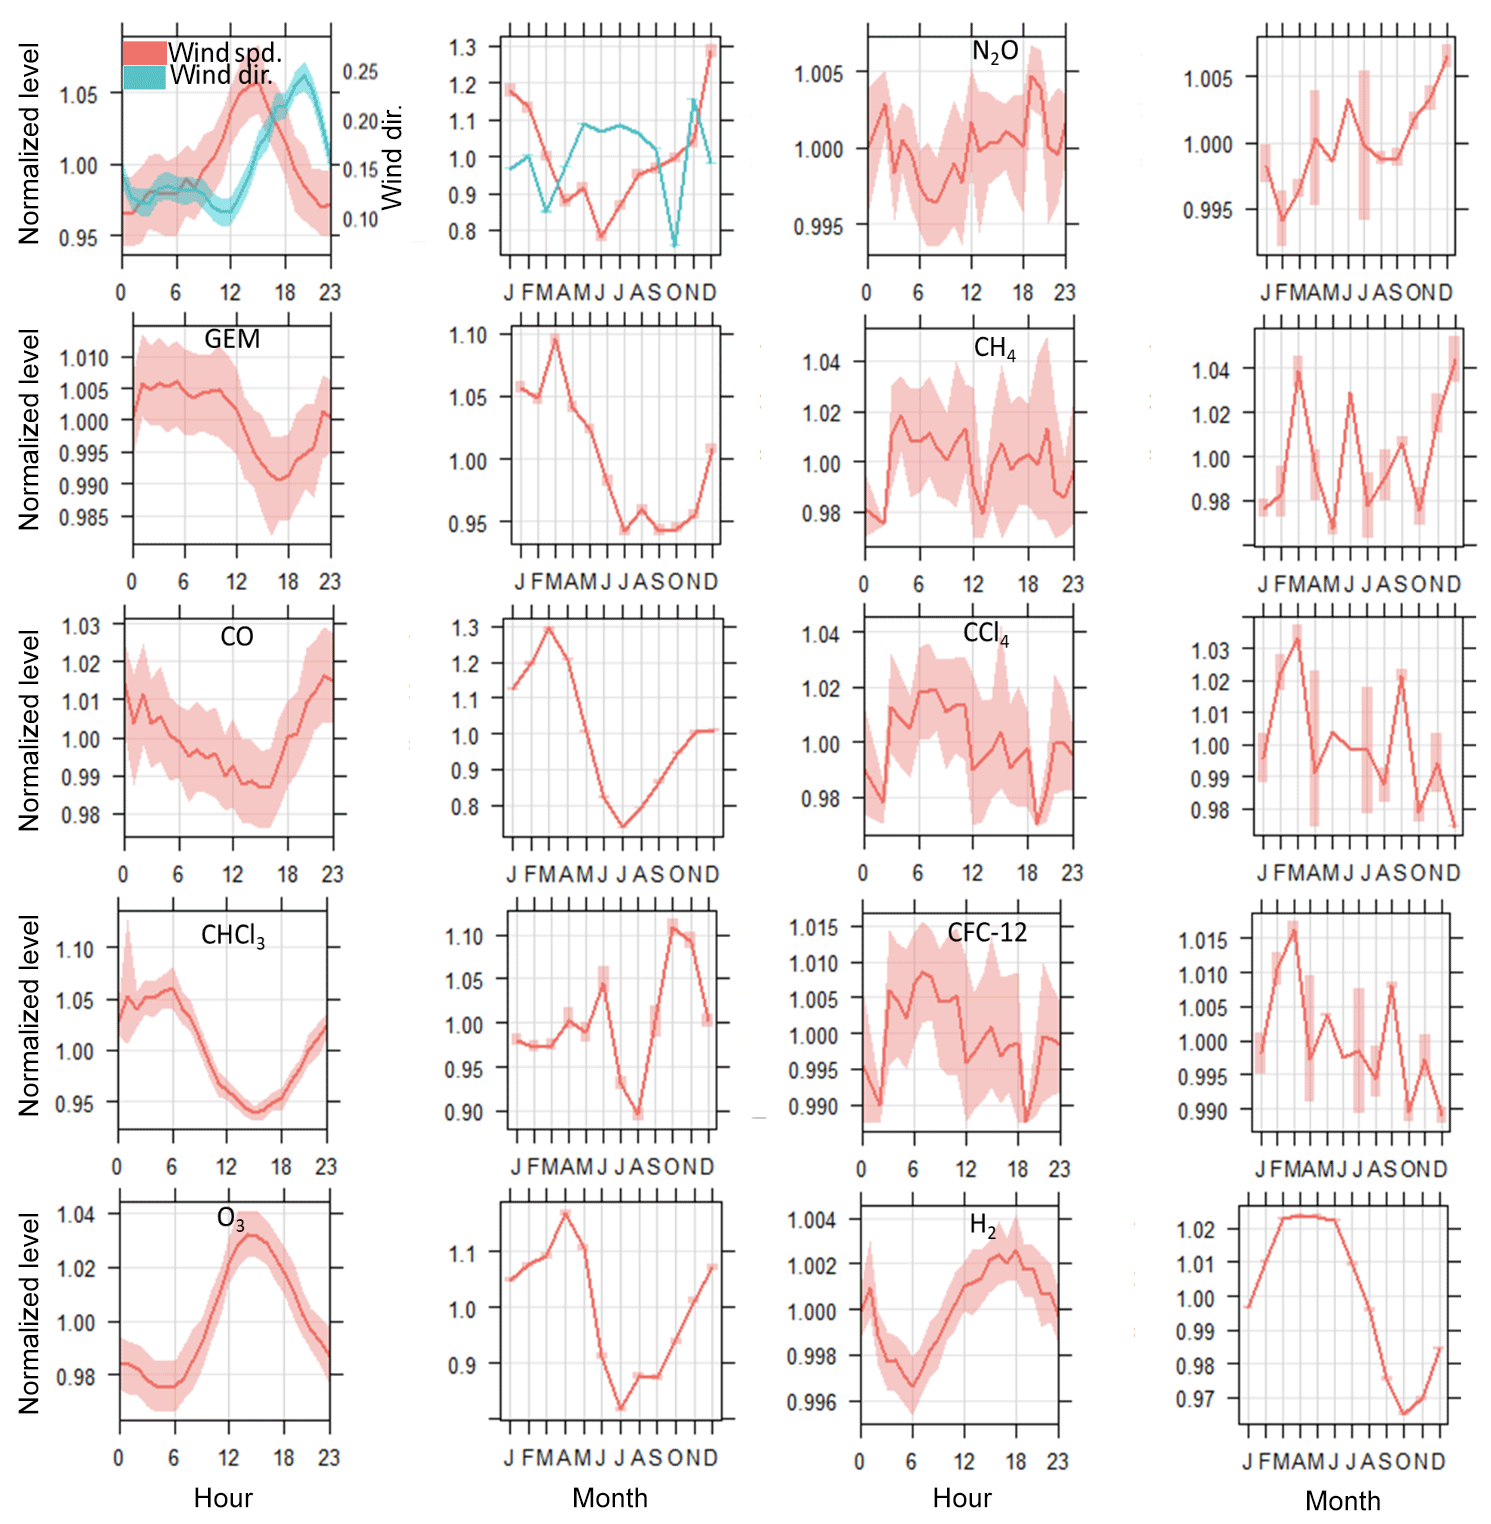
Figure 4Diurnal cycle and seasonal cycle of mercury and species loaded in the PMF matrix. The shaded areas are the 95 % confidence intervals in the mean. * Wind direction is normalized with west 90∘ as −1 and east (270∘) as 1.
Mace Head is mostly influenced by air masses from the Atlantic Ocean, however, as a coastal site can be affected by on-shore breezes blowing from land to the North Atlantic. Daily fluctuations of wind speed and direction in coastal areas are a result of differences in air pressure created by the different heat capacities of water and dry land (Yan, 2005).
Decrease in atmospheric mercury concentrations during warm periods has often been linked to increased Hg2+ by catalytic mercury oxidation in the surface layer of the sea due to several chemical and biological processes, mainly controlled by solar radiation (Kalinchuk et al., 2019, and references therein). Si and Ariya (2018) and references therein reported maximum oxidation of mercury in summer based on several atmospheric models, but failed to reconstruct observed summer depletion of atmospheric mercury at monitoring sites in North America and Europe. Furthermore, deposition models could not predict the observed large seasonal variability of either Hg oxidation or wet deposition flux (Travnikov et al., 2017).
Figure 4 shows that the decrease in TGM during summer is closely related to CO depletion in this season.
In addition, similarity was observed between TGM depletion during summer, enhancement during autumn, and seasonality of chloroform (CHCl3). Decreased emissions of CHCl3 from seawater or more intense depletion by photooxidation during summer may be possible explanations. It should be noted that any photochemical pattern of those species must be considered with caution because CHCl3 is a shorter-lived species (lifetime ∼0.5 years), mainly produced in the ocean by biological processes that follow a different oxidation pathway than mercury (Khalil and Rasmussen, 1999). It should also be noted that wind pattern differences were observed within 1 year for Mace Head: strong winds during winter predominately come from the sea, and relatively calm winds during summer (Fig. S2 in the Supplement). This should also be reflected in the observed seasonality of TGM concentrations.
Figures 3, 4, and S3 show that the seasonality in TGM observed in Mace Head is closely related to other species linked to primary sources and can be explained by transport from continental areas.
3.2 Source apportionment
Figure 1 shows the set of four factors reconstructing atmospheric mercury concentrations obtained from the PMF solution. As reported by Henry (1991), the first set of natural physical constraints of the system to be considered in any approach for identifying and quantifying source mass contributions must be the reconstruction of the original data set by the algorithm – that is, the solution must explain the observations. Figure 5 shows that the sum of the predicted elemental mass contributions for all sources is almost the same as the TGM measured. Lower reconstruction performance was observed in particular for concentrations higher than 2 ng m−3, which make up 0.44 % of the observations. One factor with a high load of O3 and CO was found by the PMF solution, which appeared to be irrelevant for the mercury mass balance, as its load was just 0.003 ng m−3 (∼0 %). However, for atmospheric mercury concentrations higher than 2 ng m−3 this factor had a load of 0.57 ng m−3 and was labelled the fourth factor.

Figure 5Correlation among total elemental mercury measured and mercury reconstructed by the PMF solution and conditional quantile plot showing the difference between PMF solution and observation. The observations are split up into bins according to the correspondent reconstructed value. The median prediction line together with the 25th/75th and 10th/90th quantile values are plotted together with a line showing a “perfect model”. Also shown is a histogram of reconstructed values (shaded grey) and a histogram of observed values (shown as a blue line).
The first factor with a loading of 66 % of TGM mass (0.88 ng m−3) was labelled baseline because it does not show any wind pattern and carries high loads of long-lived species such as CFCs and low loads of CO or sea-borne trace gas species. The PMF results show a statistically significant decrease in the baseline factor that could explain almost all of the trend changes in atmospheric mercury. This suggests a major decrease in anthropogenic inputs on a global scale. Slemr et al. (2011) reported a worldwide trend of atmospheric mercury, showing an equally strong decrease in the Northern Hemisphere and Southern Hemisphere, which supports the argument of baseline-driven TGM decline.
According to Streets et al. (2011), anthropogenic Hg emissions in the USA and Europe decreased by 20 % and 40 %, respectively, from 1990 to 2008. However, emissions on a global scale, particularly from East Asia, are poorly reported (UN, 2018), even despite the growing concern and recognition of related environmental risks and human health concerning such pollutants. Moreover, the total emissions from small-scale artisanal gold mining are highly uncertain estimates.
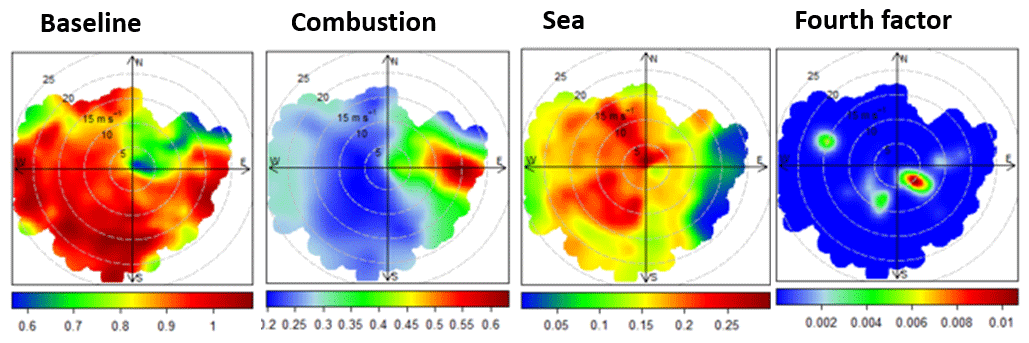
Figure 6Polar plots for the factors obtained in the PMF solution. The plots show variations of mercury (ng m−3) loaded in each factor as a function of wind direction (∘) and speed (ms−1).
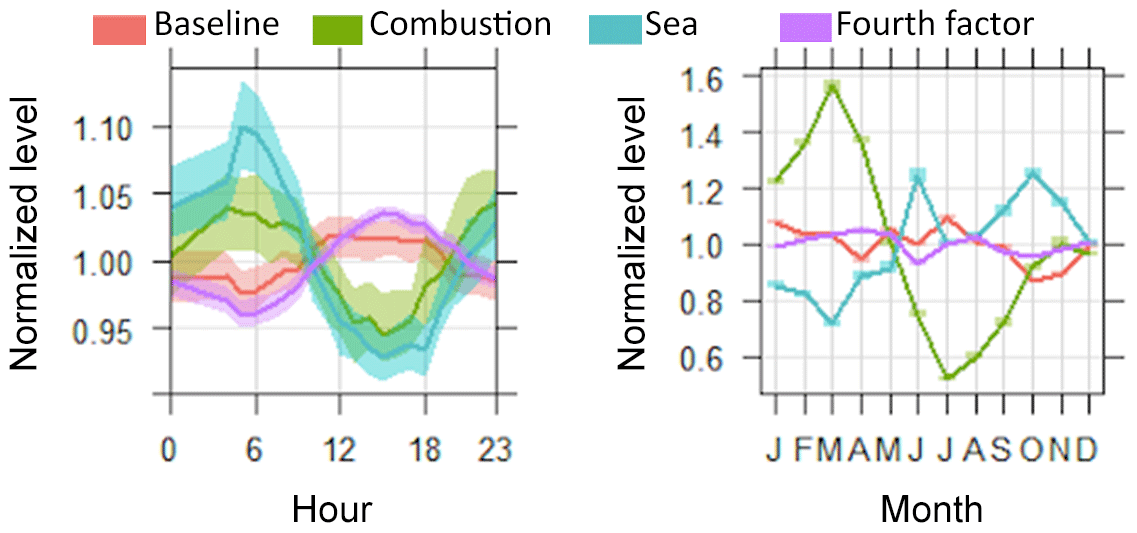
Figure 7Mean and 95 % confidence interval in mean of diurnal and seasonal cycles of four PMF factors.
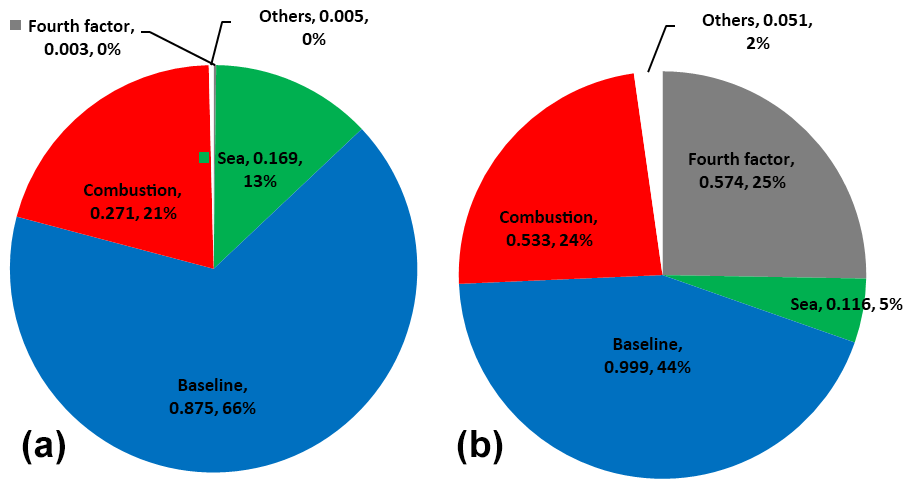
Figure 8Average contribution (ng m−3 and %) of Hg0 factors for Mace Head from 2013 to 2018 (a) and mass closure for mercury concentration greater than 2 ng m−3 (b).
Another possible explanation for the declining trend may be the Hg0 atmospheric life-cycling reduction due to atmospheric acidification caused by CO2 increase and its potential (E0) to force elemental mercury oxidation. As reported by Slemr et al. (2011) and references therein, an increase in the atmospheric reactivity can induce large decreasing trends in the concentration of many long-lived substances. Clerbaux and Cunnold (2007) did not observe lifetime changes for halogenated and other greenhouse gases; however, changes in oxidation rates of elemental mercury in the atmosphere could follow different kinetics. Furthermore, the increasing UV radiation and the shifting solar radiation to shorter wavelengths could also intensify the oxidation of elemental mercury into Hg2+ (IPCC, 2007; Qureshi et al., 2010). Based on a global box model of mercury biogeochemical cycling Streets et al. (2011) present a trend of atmosphere mercury from 1850 to 2008 showing the increase in Hg2+ in the atmosphere in recent decades. Jiskra et al. (2018), on the other hand, hypothesize that increased vegetation uptake could be a reason for decreasing atmospheric mercury concentrations in recent years.
A second factor, which contributes to mercury with 0.27 ± 0.13 ng m−3 (21 %) and is characterized by a high load of CO, is labelled combustion. The load of mercury in the combustion factor increases to 0.53 ng m−3 for mercury concentrations higher than 2 ng m−3, being twice as high as for concentrations below 2 ng m−3 in this sector (Fig. 8). A decreasing trend was observed in this factor, but this is a more complex case because a higher load of Hg in the combustion factor could be strongly influenced by wind direction, as shown in Fig. 6. Moreover, seasonality observed in the factors fingerprinted by CHCl3 and CO (Fig. 7) should, however, be considered with caution because those short-lived species (CHCl3 4–5 months and CO 1–3 months) have lifetimes that vary by season, which can dampen mercury load into its factor during summer.
For the potential seasonality, significant trends are also difficult to establish due to the relatively short time series. The Global Mercury Assessment inventory (UN, 2018) estimates the contribution of combustion sources to atmospheric mercury at 24 %.
The wind patterns for the baseline, combustion, and sea factors (discussed below) as displayed in the polar plot of Fig. 6 indicate an interpretation of the PMF profile, with “combustion” being mostly associated with easterly transport and “sea” being linked to north-westerly and south-westerly winds. The “baseline” factor does not correlate with any significant wind patterns.
On the other hand, no seasonality was observed for the baseline factor, linking lower concentrations of mercury in the warm season mainly to transport or evasion patterns and less to deposition by oxidation. For instance, no evidence of photooxidation increase in the growing season was reported by Weigelt et al. (2013), which shows no significant seasonality in gaseous elemental mercury and gaseous oxidized mercury in a remote rural environment in Germany.
Human activity has substantially increased the ocean mercury reservoirs and consequently the fluxes between the ocean and atmosphere (Strode et al., 2007; Smith-Downey et al., 2010).
The residence time of mercury in the ocean is substantially longer than in the atmosphere, ranging from years to decades or millennia (Strode et al., 2007; Primeau and Holzer, 2006). Acidification of oceans, climate change, excess nutrient inputs, and pollution are fundamentally changing the ocean's biogeochemistry (Doney, 2010) and will certainly also influence mercury ocean–air fluxes (Slemr et al., 2011). The extent, however, and even the direction of the change are unknown.
Mason et al. (2012) estimate global oceanic Hg0 evasion to be comparable to anthropogenic emissions, and Sunderland and Mason (2007) attributed the mercury emitted from seawater in the North Atlantic to the legacy of 20th century anthropogenic sources in Europe and North America.
This study shows an oceanic contribution (based on an ocean factor solved by PMF) of 13 % (0.17 ± 0.07 ng m−3) to atmospheric TGM at Mace Head station. Based on atmospheric mercury concentration trends in the subsurface seawater Soerensen et al. (2012) predicted a decrease of approximately 0.045 of oceanic mercury emissions into the air over the North Atlantic. They also argued, based on cruise data, that the decrease in oceanic emissions is forcing the atmospheric trend down. In this study, based on the PMF solution, we found no evidence of a decreasing mercury load in the oceanic factor, which could be traced by CHCl3 and CH4 concentrations.
Moreover, we find from the PMF solution that the decrease in atmospheric mercury is linked less to oceanic emissions and is explained mainly by a baseline factor with a low load of short-lived species with significant anthropogenic sources, such as CO and O3, as well as a low load of sea trace species, such as CHCl3 and CH4.
A decrease in mercury is observed in the factor with higher loading of long-lived species such as CFCs. However, the presented solution for apportionment of atmospheric mercury has restrictions and requires further consideration, as the mercury sources are complex and numerous, and merely a few source tracers were used in this study.
This study presents a comprehensive source assessment of atmospheric mercury measured at Mace Head, a baseline station with a long-term decreasing trend of TGM. Positive matrix factorization was applied to a set of atmospheric mercury data from 2013 to 2018 with high temporal resolution. The profiles of source factor contributions indicate that baseline (0.86 ng m−3, 66 %) and combustion processes (0.27 ng m−3, 21 %) are the controlling factors of mercury in the atmosphere at this remote coastal measurement location. The high load of mercury in the baseline factor reflects the relatively long lifetime of this species in the atmosphere.
Biogenic activities in the ocean were identified as another primary source, contributing 13 % (0.17 ng m−3).
Therefore, based on the analysis of temporal changes in the sources, no decrease in the oceanic factor in the period of this study could be detected. The decrease in atmospheric mercury concentrations was linked to the baseline factor. Source contributions by wind sector were also exploited, based on directional wind dependence of source loadings from the PMF analysis. The patterns are also consistent with the location of the sources: oceanic sources coming from the west (Atlantic) and anthropogenic sources coming from east (Europe) of Mace Head. Furthermore, more extensive and detailed descriptions concerning mercury sources are needed to confirm and evaluate the reported trends, which then can have great relevance for policy and regulations in light of the Minamata convention.
All data of atmospheric trace species exploited and evaluated in this paper are available at https://agage.mit.edu/data/agage-data (AGAGE, 2020), http://sdi.iia.cnr.it/geoint/publicpage/GMOS/gmos_monitor.zul (GMOS, 2020), and meteorological data are available at https://www.met.ie/climate/available-data/historical-data (MET, 2020). Any further information and data provision can be addressed to the authors.
The supplement related to this article is available online at: https://doi.org/10.5194/acp-20-7929-2020-supplement.
DC processed the data, performed the PMF analysis, and proposed the manuscript. RE developed the manuscript strategy and advised discussion. TGS was responsible for the experimental data accuracy of species inputted in the PMF and participated in the manuscript discussion. JB evaluated the manuscript results and their interpretation.
The authors declare that they have no conflict of interest.
This article is part of the special issue “Research results from the 14th International Conference on Mercury as a Global Pollutant (ICMGP 2019), MercOx project, and iGOSP and iCUPE projects of ERA-PLANET in support of the Minamata Convention on Mercury (ACP/AMT inter-journal SI)”. It is not associated with a conference.
This work was funded by the iGOSP ERA-PLANET and E-SHAPE “EUROGEOSS” Showcase projects. The authors are grateful to the Mace Head Observatory for all data provision. The authors are grateful to the NOAA Air Resources Laboratory (ARL) for the provision of the HYSPLIT transport and dispersion model and READY website (http://www.ready.noaa.gov, last access: January 2020). We would like to thank the associate editor and the two anonymous reviewers, whose critical evaluation of our manuscript helped us strengthen our results.
This research has been supported by the iGOSP ERA-PLANET and E-SHAPE “EUROGEOSS” Showcase projects (grant no. LK14401).
The article processing charges for this open-access
publication were covered by a Research
Centre of the Helmholtz Association.
This paper was edited by Aurélien Dommergue and reviewed by two anonymous referees.
AMAP/UNEP: Technical Background Report for the Global Mercury Assessment 2018, United Nations Environment Programme (UNEP), 2018.
AGAGE: Advanced Global Atmospheric Gases Experiment, available at: https://agage.mit.edu/data/agage-data, last access: 2 July 2020.
Castagna, J., Bencardino, M., D'Amore, F., Esposito, G., Pirrone, N., and Sprovieri, F.: Atmospheric mercury species measurements across the Western Mediterranean region: Behaviour and variability during a 2015 research cruise campaign, Atmos. Environ., 173, 108e126, https://doi.org/10.1016/J.ATMOSENV.2017.10.045, 2018.
Ci, Z., Wang, C., Wang, Z., and Zhang, X.: Elemental mercury (Hg0) in air and surface waters of the Yellow Sea during late spring and late fall 2012: Concentration, spatial-temporal distribution and air/sea flux, Chemosphere, 119, 199e208, https://doi.org/10.1016/j.chemosphere.2014.05.064, 2015.
Clerbaux, C. and Cunnold, D. M.: Long-lived compounds, in: “Scientific Assessment of Ozone Depletion: 2006”, WMO, Geneva, 2007.
Comero, S., Capitani, L., and Gawlik, B. M.: Positive Matrix Factorisation (PMF): An introduction to the chemometric evaluation of environmental monitoring data using PMF, European Commission, EUR 23946 EN, ISBN 978-92-79-12954-4 ISSN 1018-5593, https://doi.org/10.2788/2497, 2009.
Corbitt, E. S., Jacob, D. J., Holmes, C. D., Streets, D. G., and Sunderland, E. M.: Global source receptor relationships for mercury deposition under present-day and 2050 emissions scenarios, Environ. Sci. Technol., 45, 10477–10484, https://doi.org/10.1021/es202496y, 2011.
D'Amore, F., Bencardino, M., Sergio Cinnirella, S., Sprovieria, F., and Pirrone, N.: Data quality through a web-based QA/QC system: implementation for atmospheric mercury data from the Global Mercury Observation System, Environmental Science Processes Impacts, 17, 1482–1491, https://doi.org/10.1039/c5em00205b, 2015.
Doney, S. C.: The growing human footprint on coastal and openocean biogeochemistry, Science, 328, 1512–1516, 2010.
Draxler, R. R. and Rolph, G. D.: HYSPLIT (HYbrid Single-ParticleLagrangian Integrated Trajectory) Model access via NOAA ARLREADY Website, NOAA Air Resour. Lab., Silver Spring, Md., available at: http://www.arl.noaa.gov/ready/hysplit4.html (last access: 15 February 2020), 2003.
Ebinghaus, R., Jennings, S. G., Kock, H. H., Derwent, R. G., Manning, A. J., and Spain, T. G.: Decreasing trend in total gaseous mercury observations in baseline air at Mace Head, Ireland, from 1996 to 2009, Atmos. Environ., 45, 668–679, https://doi.org/10.1016/j.chemosphere.2019.02.185, 2011.
GMOS: Global Mercury Observation System, available at: http://sdi.iia.cnr.it/geoint/publicpage/GMOS/gmos_monitor.zul, last access: 2 July 2020.
Henry, R. C.: Multivariate Receptor Models, in: Receptor Modeling for Air Quality Management, edited by: Hopke, P. K., Elsevier Science Publishers, Amsterdam, 117–147, 1991.
Holmes, C. D., Jacob, D. J., and Yang, X.: Global lifetime of elemental mercury against oxidation by atomic bromine in the free troposphere, Geophys. Res. Lett., 33, L20808, https://doi.org/10.1029/2006GL027176, 2006.
Holmes, C. D., Jacob, D. J., Mason, R. P., and Jaffe, D. A.: Sources and deposition of reactive gaseous mercury in the marine atmosphere, Atmos. Environ., 43, 2278e2285, https://doi.org/10.1016/J.ATMOSENV.2009.01.051, 2009.
Huang, S., Rahn, K. A., and Arimoto, R.: Testing and Optimizing Two Facot-Analysis Techniques on Aerosol at Narragansett, Rhode Island, Atmos. Environ., 33, 2169–2185, 1999.
IPCC: Climate Change 2007: Synthesis Report, Geneva, Switzerland, 2007.
Hylander, L. D. and Meili, M.: 500 years of mercury production: global annual inventory by region until 2000 and associated emissions, Sci. Total Environ., 304, 13–27, 2003.
Kalinchuk, V., Aksentov, K., and Karnaukh, V.: Gaseous elemental mercury (Hg(0)) in the surface air over the Sea of Japan, the Sea of Okhotsk and the Kuril-Kamchatka sector of the Pacific Ocean in August–September 2017, Chemosphere, 224, 668e679, https://doi.org/10.1016/S1352-2310(98)00233-7, 2019.
Khalil, M. A. K. and Rasmussen, R. A.: Atmospheric chloroform, Atmos. Environ., 7, 1151–1158, 1999.
Khalizov, A. F., Viswanathan, B., Larregaray, P., and Ariya, P. A.: Theoretical Study on the Reactions of Hg with Halogens: Atmospheric Implications, J. Phys. Chem. A, 107, 6360–6365, 2003.
Jiskra, M., Sonke, J. E., Obrist, D., Bieser, J., Ebinghaus, R., Myhre, C. L., Pfaffhuber, K. A., Wängberg, I., Kyllönen, K., Worthy, D., Martin, L. G., Labuschagne, C., Mkololo, T., Ramonet, M., Magand, O., and Dommergue, A.: A vegetation control on seasonal variations in global atmospheric mercury concentrations, Nat. Geosci., 11, 244–250, 2018.
Laurier, F. and Mason, R.: Mercury concentration and speciation in the coastal and open ocean boundary layer, J. Geophys. Res., 112, D06302, https://doi.org/10.1029/2006JD007320, 2007.
Laurier, F. J. G., Mason, R. P., and Whalin, L.: Reactive gaseous mercury formation in the North Pacific Ocean's marine boundary layer: A potential role of halogen, J. Geophys. Res.-Atmos., 108, 4529, https://doi.org/10.1029/2003JD003625, 2003.
Lindberg, S., Bullock, R., Ebinghaus, R., Engstrom, D., Feng, X., Fitzgerald, W., Pirrone, N., Prestbo, E., and Seigneur, C.: A synthesis of progress and uncertainties in attributing the sources of mercury in deposition, Ambio, 36, 19–32, 2007.
Mao, H. and Talbot, R.: Speciated mercury at marine, coastal, and inland sites in New England – Part 1: Temporal variability, Atmos. Chem. Phys., 12, 5099–5112, https://doi.org/10.5194/acp-12-5099-2012, 2012.
Mason, R. P., Choi, A. L., Fitzgerald, W. F., Hammerschmidt, C. R., Lamborg, C. H., Soerensen, A. L., and Sunderland, E. M.: Mercury bio-geochemical cycling in the ocean and policy implication, Environ. Res., 119, 101–117, https://doi.org/10.1016/j.envres.2012.03.013, 2012.
MET: The Irish Meteorological Service, available at: https://www.met.ie/climate/available-data/historical-data, last access: 2 July 2020.
Moore, C. W., Obrist, D., and Luria, M.: Atmospheric mercury depletion events at the Dead Sea: Spatial and temporal aspects, Atmos. Environ., 69, 231e239, https://doi.org/10.1016/J.ATMOSENV.2012.12.020, 2013.
Obrist, D., Tas, E., Peleg, M., Matveev, V., Faïn, X., Asaf, D., and Luria, M.: Bromineinduced oxidation of mercury in the mid-latitude atmosphere, Nat. Geosci., 4, 22e26, https://doi.org/10.1038/ngeo1018, 2011.
Paatero, P.: The multilinear engine – a table-driven least squaresprogram for solving multilinear problems, including the n-wayparallel factor analysis model, J. Comput. Graph. Stat., 8, 854–888, 1999.
Paatero, P. and Hopke, P. K.: Discarding or downweighting highnoise variables in factor analytic models, Anal. Chim. Acta, 490, 277–289, 2003.
Paatero, P. and Tapper, U.: Positive matrix factorization: A non-negative factor model with optimal utilization of error estimates of data values, Environmetrics, 5, 111–126, 1994.
Pirrone, N., Cinnirella, S., Feng, X., Finkelman, R. B., Friedli, H. R., Leaner, J., Mason, R., Mukherjee, A. B., Stracher, G., Streets, D. G., and Telmer, K.: G lobal mercury emissions to the atmosphere from natural and anthropogenic sources, in: Mercury Fate and Transport in the Global Atmosphere, edited by: Pirrone, N. and Mason, R., Springer, Dordrecht, 3–49, 2009.
Primeau, F. W. and Holzer, M.: The ocean's memory of the atmosphere: Residence-time and ventilation-rate distributions of water masses, J. Phys. Oceanogr., 36, 1439–1456, 2006.
Qureshi, A., O'Driscoll, N. J., MacLeod, M., Neuhold, Y.-M., and Hungerbuhler, K.: Photoreactions of mercury in surface ocean water: Gross reaction kinetics and possible pathways, Environ. Sci. Techol., 44, 644–649, 2010.
Smith-Downey, N. V., Sunderland, E. M., and Jacob, D. J.: Anthropogenic impacts on global storage and emissions of mercury from terrestrial soils: Insights from a new global model, J. Geophys. Res., 115, G03008, https://doi.org/10.1029/2009JG001124, 2010.
Shepler, B. C., Balabanov, N. B., and Peterson, K. A.: Hg + Br → HgBr recombination and collision induced dissociation dynamics, J. Chem. Phys., 127, 164–304, 2007.
Si, L. and Ariya, P. A.: Recent Advances in Atmospheric Chemistry of Mercury, Atmosphere (Basel), 9, 76, https://doi.org/10.3390/atmos9020076, 2018.
Slemr, F., Brunke, E.-G., Ebinghaus, R., and Kuss, J.: Worldwide trend of atmospheric mercury since 1995, Atmos. Chem. Phys., 11, 4779–4787, https://doi.org/10.5194/acp-11-4779-2011, 2011.
Slemr, F., Brunke, E.-G., Ebinghaus, R., Temme, C., Munthe, J., Wängberg, I., Schroeder, W., Steffen, A., and Berg, T.: Worldwide trend of atmospheric mercury since 1977, Geophys. Res. Lett., 30, 1516, https://doi.org/10.1029/2003GL016954, 2003.
Soerensen, A. L., Jacob, D. J., Streets, D. G., Witt, M. L. I., Ebinghaus, R., Mason, R. P., Andersson, M., and Sunderland, E. M.: Multi-decadal decline of mercury in the North Atlantic atmosphere explained by changing subsurface seawater concentrations, Geophys. Res. Lett., 39, L21810, https://doi.org/10.1029/2012GL053736, 2012.
Sprovieri, F., Hedgecock, I. M., and Pirrone, N.: An investigation of the origins of reactive gaseous mercury in the Mediterranean marine boundary layer, Atmos. Chem. Phys., 10, 3985–3997, https://doi.org/10.5194/acp-10-3985-2010, 2010.
Stanley, K. M., Grant, A., O'Doherty, S., Young, D., Manning, A. J., Stavert, A. R., Spain, T. G., Salameh, P. K., Harth, C. M., Simmonds, P. G., Sturges, W. T., Oram, D. E., and Derwent, R. G.: Greenhouse gas measurements from a UK network of tall towers: technical description and first results, Atmos. Meas. Tech., 11, 1437–1458, https://doi.org/10.5194/amt-11-1437-2018, 2018.
Subir, M., Ariya, P. A., and Dastoor, A. P.: A review of uncertainties in atmospheric modeling of mercury chemistry I. Uncertainties in existing kinetic parameters – Fundamental limitations and the importance of heterogeneous chemistry, Atmos. Environ., 45, 5664–5676, 2011.
Sun, G., Sommar, J., Feng, X., Lin, C.-J., Ge, M., Wang, W., Yin, R., Fu, X., and Shang, L.: Mass-dependent and -independent fractionation of mercury isotope during gas-phase oxidation of elemental mercury vapor by atomic Cl and Br, Environ. Sci. Technol., 50, 9232–9241, 2016.
Sunderland, E. M. and Mason, R. P.: Human impacts on open ocean mercury concentrations, Global Biogeochem. Cy., 21, GB4022, https://doi.org/10.1029/2006GB002876, 2007.
Streets, D. G., Devane, M. K., Lu, Z., Bond, T. C., Sunderland, E. M., and Jacob, D. J.: All-time releases of mercury to the atmosphere from human activities, Environ. Sci. Technol., 45, 10485–10491, https://doi.org/10.1021/es202765m, 2011.
Travnikov, O., Angot, H., Artaxo, P., Bencardino, M., Bieser, J., D'Amore, F., Dastoor, A., De Simone, F., Diéguez, M. D. C., Dommergue, A., Ebinghaus, R., Feng, X. B., Gencarelli, C. N., Hedgecock, I. M., Magand, O., Martin, L., Matthias, V., Mashyanov, N., Pirrone, N., Ramachandran, R., Read, K. A., Ryjkov, A., Selin, N. E., Sena, F., Song, S., Sprovieri, F., Wip, D., Wängberg, I., and Yang, X.: Multi-model study of mercury dispersion in the atmosphere: atmospheric processes and model evaluation, Atmos. Chem. Phys., 17, 5271–5295, https://doi.org/10.5194/acp-17-5271-2017, 2017.
Strode, S. A., Jaeglé, L., Selin, N. E., Jacob, D. J., Park, R. J., Yantoska, R. M., Mason, R. P., and Slemr, F.: Air-sea exchange in the global mercury cycle, Global Biogeochem. Cy., 21, GB1017, https://doi.org/10.1029/2006GB002766, 2007.
UN, Global Mercury Assessment: Environment Programme, Chemicals and Health Branch, Geneva, Switzerland, ISBN: 978-92-807-3744-8, 2018.
UN, Minamata Convention on Mercury: United Nation Environmental Program, http://www.mercuryconvention.org/Countries/Parties/tabid/3428/language/en-US/Default.aspx (last access: May 2020), 2019.
Wang, Y., Liu, R., Li, Y., Cui, X., Zhou, J., Liu, S., and Zhang, Y.: GEM in the marine atmosphere and air-sea exchange of Hg during late autumn and winter cruise campaigns over the marginal seas of China, Atmos. Res., 191, 84e93, https://doi.org/10.1016/j.atmosres.2017.03.004, 2017.
Wang, F., Saiz-Lopez, A., Mahajan, A. S., Gómez Martín, J. C., Armstrong, D., Lemes, M., Hay, T., and Prados-Roman, C.: Enhanced production of oxidised mercury over the tropical Pacific Ocean: a key missing oxidation pathway, Atmos. Chem. Phys., 14, 1323–1335, https://doi.org/10.5194/acp-14-1323-2014, 2014.
Weiss Penzias, P., Jaffe, D. A., McClintick, A., Prestbo, E. M., and Landis, M. S.: Gaseous Elemental Mercury in the Marine Boundary Layer: Evidence for Rapid Removal in Anthropogenic Pollution, Environ. Sci. Technol., 37, 3755–3763, https://doi.org/10.1021/es0341081, 2003.
Weigelt, A., Temme, C., Bieber, E., Schwerin, A., Schuetze, M., Ebinghaus, R., and Kock, H. H.: Measurements of atmospheric mercury species at a German rural background site from 2009 to 2011 – methods and results, Environ. Chem., 10, 102–110, 2013.
Weigelt, A., Ebinghaus, R., Manning, A. J., Derwent, R. G., Simmonds, P., Spain, T. G., Jennings, S. G., and Slemr, F.: Analysis and interpretation of 18 years of mercury observations since 1996 at Mace Head, Ireland, Atmos. Environ., 100, 85–93, 2015.
Wilson, S., Munthe, J., Sundseth, K., Kindbom, K., Maxson, P., Pacyna, P., and Steenhuisen, F.: Updating historical global inventories of anthropogenic mercury emissions to air, AMAP Tech. Rep. 3, 14 pp., Arct. Monit. and Assess. Programme, Oslo, 2010.
WHO – World Health Organization: Exposure to mercury: A major public health concern, 20 Avenue Appia, CH-1211 Geneva-27, Switzerland (document available online), 2007.
Xia, C., Xie, Z., and Sun, L.: Atmospheric mercury in the marine boundary layer along a cruise path from Shanghai, China to Prydz Bay, Antarctica, Atmos. Environ., 44, 1815e1821, https://doi.org/10.1016/J.ATMOSENV.2009.12.039, 2010.
Yan, Y. Y.: Land and Sea Breezes, in: Encyclopedia of World Climatology. Encyclopedia of Earth Sciences Series, edited by: Oliver J. E., Springer, Dordrecht, 2005.
Zhang, Y., Jacob, D. J., Horowitz, H. M., Chen, L., Amos, H. M., Krabbenhoft, D. P., Slemr, F., St. Louis, V. L., and Sunderland, E. M.: Observed decrease in atmospheric mercury explained by global declining anthropogenic emissions, P. Natl. Acad. Sci. USA, 113, 526–531, 2016.