the Creative Commons Attribution 4.0 License.
the Creative Commons Attribution 4.0 License.
 | 01 Jul 2020
Characterization of submicron particles by time-of-flight aerosol chemical speciation monitor (ToF-ACSM) during wintertime: aerosol composition, sources, and chemical processes in Guangzhou, China
Junchen Guo
Shengzhen Zhou
Mingfu Cai
Wei Song
Weixiong Zhao
Weiwei Hu
Yao He
Chengqiang Yang
Xuezhe Xu
Zhisheng Zhang
Peng Cheng
Qi Fan
Jian Hang
Shaojia Fan
Xinming Wang
Xuemei Wang
Particulate matter (PM) pollution in China is an emerging environmental issue which policy makers and the public have increasingly paid attention to. In order to investigate the characteristics, sources, and chemical processes of PM pollution in Guangzhou, field measurements were conducted from 20 November 2017 to 5 January 2018, with a time-of-flight aerosol chemical speciation monitor (ToF-ACSM) and other collocated instruments. Mass concentrations of non-refractory submicron particulate matter (NR-PM1) measured by the ToF-ACSM correlated well with those of PM2.5 or PM1.1 measured by filter-based methods. The organic mass fraction increased from 45 % to 53 % when the air switched from non-pollution periods to pollution episodes (EPs), indicating significant roles of organic aerosols (OAs) during the whole study. Based on the mass spectra measured by the ToF-ACSM, positive matrix factorization (PMF) with the multilinear engine (ME-2) algorithm was performed to deconvolve OA into four factors, including hydrocarbon-like OA (HOA, 12 %), cooking OA (COA, 18 %), semi-volatile oxygenated OA (SVOOA, 30 %), and low-volatility oxygenated OA (LVOOA, 40 %). Furthermore, we found that SVOOA and nitrate were significantly contributed from local traffic emissions while sulfate and LVOOA were mostly attributed to regional pollutants. Comparisons between this work and other previous studies in China show that secondary organic aerosol (SOA) fraction in total OA increases spatially across China from the north to the south.
Two distinctly opposite trends for NR-PM1 formation were observed during non-pollution periods and pollution EPs. The ratio of secondary PM (SPM = SVOOA + LVOOA + sulfate + nitrate + ammonium) to primary PM (PPM = HOA + COA + chloride), together with peroxy radicals and ozone, increased with increasing NR-PM1 concentration during non-pollution periods, while an opposite trend of these three quantities was observed during pollution EPs. Furthermore, oxidation degrees of both OA and SOA were investigated using the f44∕f43 space and the results show that at least two OOA factors are needed to cover a large range of f44 and f43 in Guangzhou. Comparisons between our results and other laboratory studies imply that volatile organic compounds (VOCs) from traffic emissions, in particular from diesel combustion and aromatic compounds, are the most likely SOA precursors in Guangzhou. Peroxy radical was used as a tracer for SOA formed through gas-phase oxidation. For non-pollution periods, SOA concentration was reasonably correlated with concentration during both daytime and nighttime, suggesting that gas-phase oxidation was primarily responsible for SOA formation. However, there was no correlation between SOA and in pollution EPs, suggesting a dramatically changed mechanism for SOA formation. This conclusion can also be supported by different features of SOA in a van Krevelen diagram between non-pollution periods and pollution EPs. Furthermore, for pollution EPs, when NR-PM1 mass concentration was divided into six segments, in each segment except for the lowest one SOA concentration was correlated moderately with concentration, suggesting that gas-phase oxidation still plays important roles in SOA formation. The intercepts of the above linear regressions, which likely correspond to the extent of other mechanisms (i.e., heterogeneous and multiphase reactions), increase with increasing NR-PM1 mass concentration. Our results suggest that while gas-phase oxidation contributes predominantly to SOA formation during non-pollution periods, other mechanisms such as heterogeneous and multiphase reactions play more important roles in SOA formation during pollution EPs than gas-phase oxidation.
- Article
(5710 KB) -
Supplement
(2510 KB) - BibTeX
- EndNote


With rapid development of human civilization, more attention is paid to air quality by the public, government, and scientists, especially in developing countries like China. In recent years, particulate matter (PM) pollution has become one of the most concerning environmental issues because of its significant effects on both climate change (IPCC, 2013) and human health (Pope and Dockery, 2006). Atmospheric aerosols exert radiative forcing directly through scattering or absorbing solar radiation or indirectly through cloud formation. In addition, previous studies in the last decade have shown that respiratory and cardiovascular diseases are highly related to fine particles, revealing significant deleterious effects of ambient aerosols on human health (Kreyling et al., 2006). Thus, knowledge of chemical composition, formation mechanisms, and potential sources of fine particles is essential for both the academic community and the public, since it is still currently very limited even through decades of investigation. In recent decades, most studies have focused on PM2.5 and made significant progresses while less attention was paid to submicron particles (i.e., PM1). For instance, although the China National Ambient Air Quality Standard (CNAAQS) for PM2.5 was established in 2012, the corresponding national standard for submicron particles such as PM1 has not yet been set up. In fact, it has been shown that PM1 particles may cause much more damage to human health than PM2.5 due to their smaller sizes which give them more easy access to human bodies (Ibald-Mulli et al., 2002; Kreyling et al., 2006). Therefore, more extensive and in-depth studies should be conducted for submicron particles besides PM2.5 to obtain a comprehensive understanding on health and climate impacts of fine particles.
Field measurements of aerosol chemical composition mainly employ filter-based offline and online mass spectrometric technologies. Although traditional filter-based methods which are still widely used contribute substantially to understanding of bulk aerosol chemical composition, its obvious shortcomings, which include low time resolution from hours to days and evaporative loss, limit the capacity of this technology in aerosol measurements. In comparison, online mass spectrometric methods have higher time resolutions varying from seconds to hours and are therefore proven to be an efficient way to measure aerosol mass concentration and chemical composition (Aiken et al., 2009; Zhang et al., 2011; Sun et al., 2013, 2014; Crippa et al., 2013; Lee et al., 2015; Hu et al., 2017). For example, the aerosol mass spectrometer (AMS) is one such instrument that is widely employed in aerosol chemical composition measurements for its reliable data quality and relatively high mass resolution. However, the full version of an AMS tends to be costly and time-consuming in terms of its operation and maintenance. As a simplified version of an AMS, the aerosol chemical speciation monitor (ACSM) has been widely adopted in recent years among research institutions and environmental monitoring stations for its relatively simple operation, robustness, low cost, and sufficient time resolution for field observations spanning months or longer (Allan et al., 2010; Ng et al., 2011b; Sun et al., 2013, 2014; Y. Sun et al., 2016; Fröhlich et al., 2013). Certainly, this simplified design will inevitably cause a few disadvantages for the ACSM. Compared with all types of AMS, the ACSM gives up the ability of measuring particle size distribution, which makes users lose a robust tool to characterize ambient particulate matter and identify potential sources (Ge et al., 2012; Lee et al., 2017). Besides, limited by relatively poorer resolution, mass spectra collected by the ACSM cannot execute high-resolution peak fitting (Timonen et al., 2016). This incapability prevents users from obtaining some further information such as elemental ratio in particulate matter, which is essential to our knowledge about climate effects or toxicity of aerosols (Aiken et al., 2007; Chhabra et al., 2011; Canagaratna et al., 2015). The simplification of fragmentation table for the ACSM, based on ambient AMS data, also likely leads to some small deviations and makes this instrument unsuitable for laboratory studies requiring high precision (Jimenez et al., 2003; Allan et al., 2004; De Haan et al., 2009).
Numerous studies were conducted to investigate chemical composition, sources, and secondary processes of PM through an AMS or ACSM. It has been shown that organics generally account for a large proportion of PM (Zhang et al., 2007; Aiken et al., 2009; Allan et al., 2010; DeCarlo et al., 2010; Sun et al., 2013; Lee et al., 2015; Bressi et al., 2016; H. Li et al., 2017). In previous studies, mass spectral signals were input into the positive matrix factorization (PMF) to explore source information of organic aerosols (Zhang et al., 2011). Generally, OA can be deconvolved into primary organic aerosols (POAs), which can be further classified according to different markers of primary emissions (e.g., HOA, COA, and biomass burning aerosol – BBOA), and oxygenated organic aerosols (OOA) which can be further resolved based on oxidation degree (e.g., SVOOA and LVOOA). However, detailed source features are diverse at different regions. For example, Aiken et al. (2009) identified industry-induced local nitrogen-containing OA (LOA), which was barely reported in other cities such as Beijing (Sun et al., 2018), London (Allan et al., 2010), or Paris (Crippa et al., 2013). Similarly, biomass burning OA (BBOA) which was clearly identified at some sites such as those in Hebei (Huang et al., 2019), Mexico (Aiken et al., 2009), or Fresno (Ge et al., 2012) was missing in other locations (during the same seasons) such as Hong Kong (C. Sun et al., 2016) or Beijing (Sun et al., 2013). Although OA sources have obvious spatial distinction, Jimenez et al. (2009) found a common trend that the fraction of OOA (especially LVOOA) increases from urban to rural areas.
Physical and chemical characteristics and secondary processes of PM were investigated in previous studies (Liggio and Li, 2006; Shilling et al., 2009; Marais et al., 2016). Photochemistry which highly depends on daytime solar radiation is commonly believed to play a dominant role in the formation of secondary PM (SPM = ammonium + nitrate + sulfate + OOA). However, recent studies showed that the contribution from aqueous reactions or heterogeneous reactions cannot be ignored. For instance, it has been found that the heterogeneous hydrolysis of N2O5 on the surface of deliquescent aerosols is a significant pathway for nitrate formation during nighttime (Wang et al., 2018; Wen et al., 2018). Sun et al. (2013) proposed that the mass concentration of sulfate substantially increased through fog processes. In addition, numerous studies have suggested that the amount of SOA from reactive uptake of water-soluble VOCs is comparable to that from gas-phase oxidation (Ervens et al., 2011; McNeill, 2015; Herrmann et al., 2015; Marais et al., 2016).
Meanwhile, secondary organic aerosols, the most significant OA composition in China, have not been sufficiently investigated, especially in field measurements. In general, the odd oxygen () was proven to be a robust indicator of photochemical intensity and was therefore adopted in previous measurements to discuss SOA formation (Herndon et al., 2008; Zhou et al., 2014). However, these studies employing Ox only focused on daytime SOA formation while the nocturnal SOA formation was generally ignored due to the limitation of Ox. Meanwhile, interference from directly emitted NO2 also leads to some uncertainties.
According to the traditional theory, oxidation of atmospheric VOCs, a significant path for SOA growth, is initiated by important oxidants (e.g., OH, O3, or NO3) to form alkyl radicals (R•) which are subsequently oxidized to form peroxy organic radicals () and alkoxy radicals (RO•) (Kroll and Seinfeld, 2008; Ziemann and Atkinson, 2012). The simplest (), HO2, is formed in the atmosphere via three pathways: (1) from reactions of OH radicals with ozone or CO; (2) from oxidation of VOCs; (3) from photolysis of formaldehyde (Levy, 1971; Ziemann and Atkinson, 2012; Sheehy et al., 2010; Stone et al., 2012; Griffith et al., 2013; Wang et al., 2014). During daytime, radicals are mainly photochemical products since their formation depends highly on solar radiation or OH radical (Sheehy et al., 2010; Stone et al., 2012; Griffith et al., 2013; Wang et al., 2014). During nighttime, however, oxidation of VOCs initiated by ozone or nitrate radicals dominates formation of radicals, especially in urban areas, which has been proven in Volkamer et al. (2010) and Stone et al. (2014). Thus can serve as a tracer for photochemically induced SOA formation during daytime and SOA formation induced by nocturnal gas-phase oxidation of VOCs during nighttime.
Results from previous studies suggested that primary emissions, secondary chemical processes, meteorological conditions, and regional transport are possible major factors that determine local PM concentration but significantly vary with seasons and locations (Sun et al., 2013; Y. Sun et al., 2016; Lee et al., 2015; Bressi et al., 2016; Gani et al., 2019). Therefore, it is essential to conduct continuous field measurements at various locations to investigate the PM formation mechanisms, as well as the temporal and spatial evolution. Guangzhou, a highly developed city in the Pearl River Delta (PRD) region, is considered to be one of the most densely populated cities in China. However, previous studies on local PM characteristics in Guangzhou were mainly conducted by filter-based methods with low time resolutions (Tan et al., 2009; Zhang et al., 2010; Tao et al., 2012), and therefore knowledge of detailed PM characteristics is still lacking. It is hence urged to perform field measurements with high time resolutions in the city.
In this study, we employed a time-of-flight aerosol chemical speciation monitor (ToF-ACSM) to measure chemical composition and mass concentrations of submicron particles at an urban site in Guangzhou which is located at the Guangzhou Institute of Geochemistry, Chinese Academy of Sciences. The following sections present measurement techniques for peroxy radicals, followed by the methodology for data analyses. In the Results and discussion section, temporal variations in chemical composition and mass concentration for NR-PM1 are illustrated, followed by the source apportionment for OA and the diurnal profiles for NR-PM1. Possible mechanisms for wintertime SOA formation were explored through introducing as a proxy for the intensity of VOC gas-phase oxidation during both daytime and nighttime.
2.1 Measurement site and techniques
Chemical compositions of NR-PM1 consisting of Cl−, , , , and organics were measured from 20 November 2017 to 5 January 2018 by a ToF-ACSM at an urban air quality monitoring site locating at the Guangzhou Institute of Geochemistry, Chinese Academy of Sciences (GIG). Detailed descriptions of ToF-ACSM can be found elsewhere (Fröhlich et al., 2013) and the methodology for data analysis is presented in the next section. The site is surrounded by three major traffic roads including Guangyuan road, Huanan road, and Keyun road. Several university campuses are located to the north and west of the site while commercial buildings, restaurants, and residential areas are next to its east and south. In addition to aerosol measurements by the ToF-ACSM, ambient gas species such as NOx and O3 were measured at the same site by various gas analyzers (Thermo Scientific, USA) while filter samples were collected by an Anderson nine-stage sampler. Meteorological data (wind speed and direction, relative humidity, temperature, and pressure) and PM2.5 concentrations were measured about 2 and 4 km away from the sample site by the South China Institute of Environmental Science and Guangzhou Environmental Monitoring Center, respectively. The concentrations of the total peroxy radicals were measured with a dual-channel PERCA (peroxy radical chemical amplification) instrument (Yang et al., 2018, 2019). In this instrument, ambient mixing ratios of radicals were converted to a larger amount of NO2 by reacting with NO and CO. The amplified NO2 concentrations were then measured with a portable broadband cavity-enhanced spectrometer (BBCES) with a precision of 40 pptv (1σ, with 21 s data acquisition time) (Fang, et al., 2017). The total uncertainty of the PERCA instrument was about 10 % with a precision of about 0.4 pptv (1σ, 21 s).
2.2 ACSM data analysis
The final mass concentrations and mass spectra were processed from the raw ToF-ACSM data by a standard ACSM data analysis software (Tofware, version 2.5.13) based on Igor Pro (version 6.37), with the widely applied procedures described in Ng et al. (2011b) and Sun et al. (2012). Based on the on-site calibrations, a relative ionization efficiency (RIE) value of 1.2 and 3.3 was obtained for sulfate and ammonium, respectively. RIE values of 1.1, 1.3, and 1.4 were, respectively, adopted for nitrate, chloride, and organics according to literature (Takegawa et al., 2005; Canagaratna et al., 2007). Collection efficiency (CE), compensating for losses of the particles during their collection, is considered to be another extremely important parameter for quantification of the ACSM data. This quantity varies with acidity, chemical composition, and water content of the particles (Matthew et al., 2008). Here we consider the effects of acidity and water content to be negligible based on the fact that the relative humidity (RH) in the sample line was kept below 30 % through a Nafion dryer and the aerosols were approximately neutralized in Guangzhou (). Thus, only chemical composition was considered to affect CE in this work and we adopted a composition-dependent CE formulated by Middlebrook et al. (2012) (i.e., (0.45, ), where ANMF is the mass fraction of ammonium nitrate in NR-PM1) instead of a widely used empirical value of 0.5. The results showed that only about 1 % of samples (78 of 6623) had CE values larger than 0.45 (others are 0.45), with the largest value being 0.578. Hence the influence induced by fluctuation of the CE values is negligible and we chose a CE value of 0.45 for the ACSM measurements in this study.
3.1 Mass concentrations and chemical composition
Figure 1 shows the time series of meteorological conditions (relative humidity, temperature, pressure, wind speed, and wind direction), NR-PM1 and PM2.5 mass concentrations, and NR-PM1 composition (, , , Cl−, and organics) from 20 November 2017 to 5 January 2018. Overall, the 10 min averaged mass concentration of NR-PM1 ranged from 2.4 to 130 µg m−3. The averaged concentration during the measurement period was 35.3±22.3 µg m−3, among which about half (17.5 µg m−3) was organics, followed by sulfate (7.0 µg m−3), nitrate (6.0 µg m−3), ammonium (4.6 µg m−3), and chloride (0.5 µg m−3). The NR-PM1 concentration (from the ToF-ACSM) was correlated well with concentrations of both PM2.5 (Pearson correlation coefficient (Rp) =0.83, from BAM-1020) and PM1.1 (Rp=0.86, from the Anderson nine-stage sampler). Comparisons between ToF-ACSM and other instruments are detailed in Fig. S1 in the Supplement. Overall, high NR-PM1 mass concentration was observed after 22 December 2017 when the air was more stagnant according to the wind speed (Fig. 1).
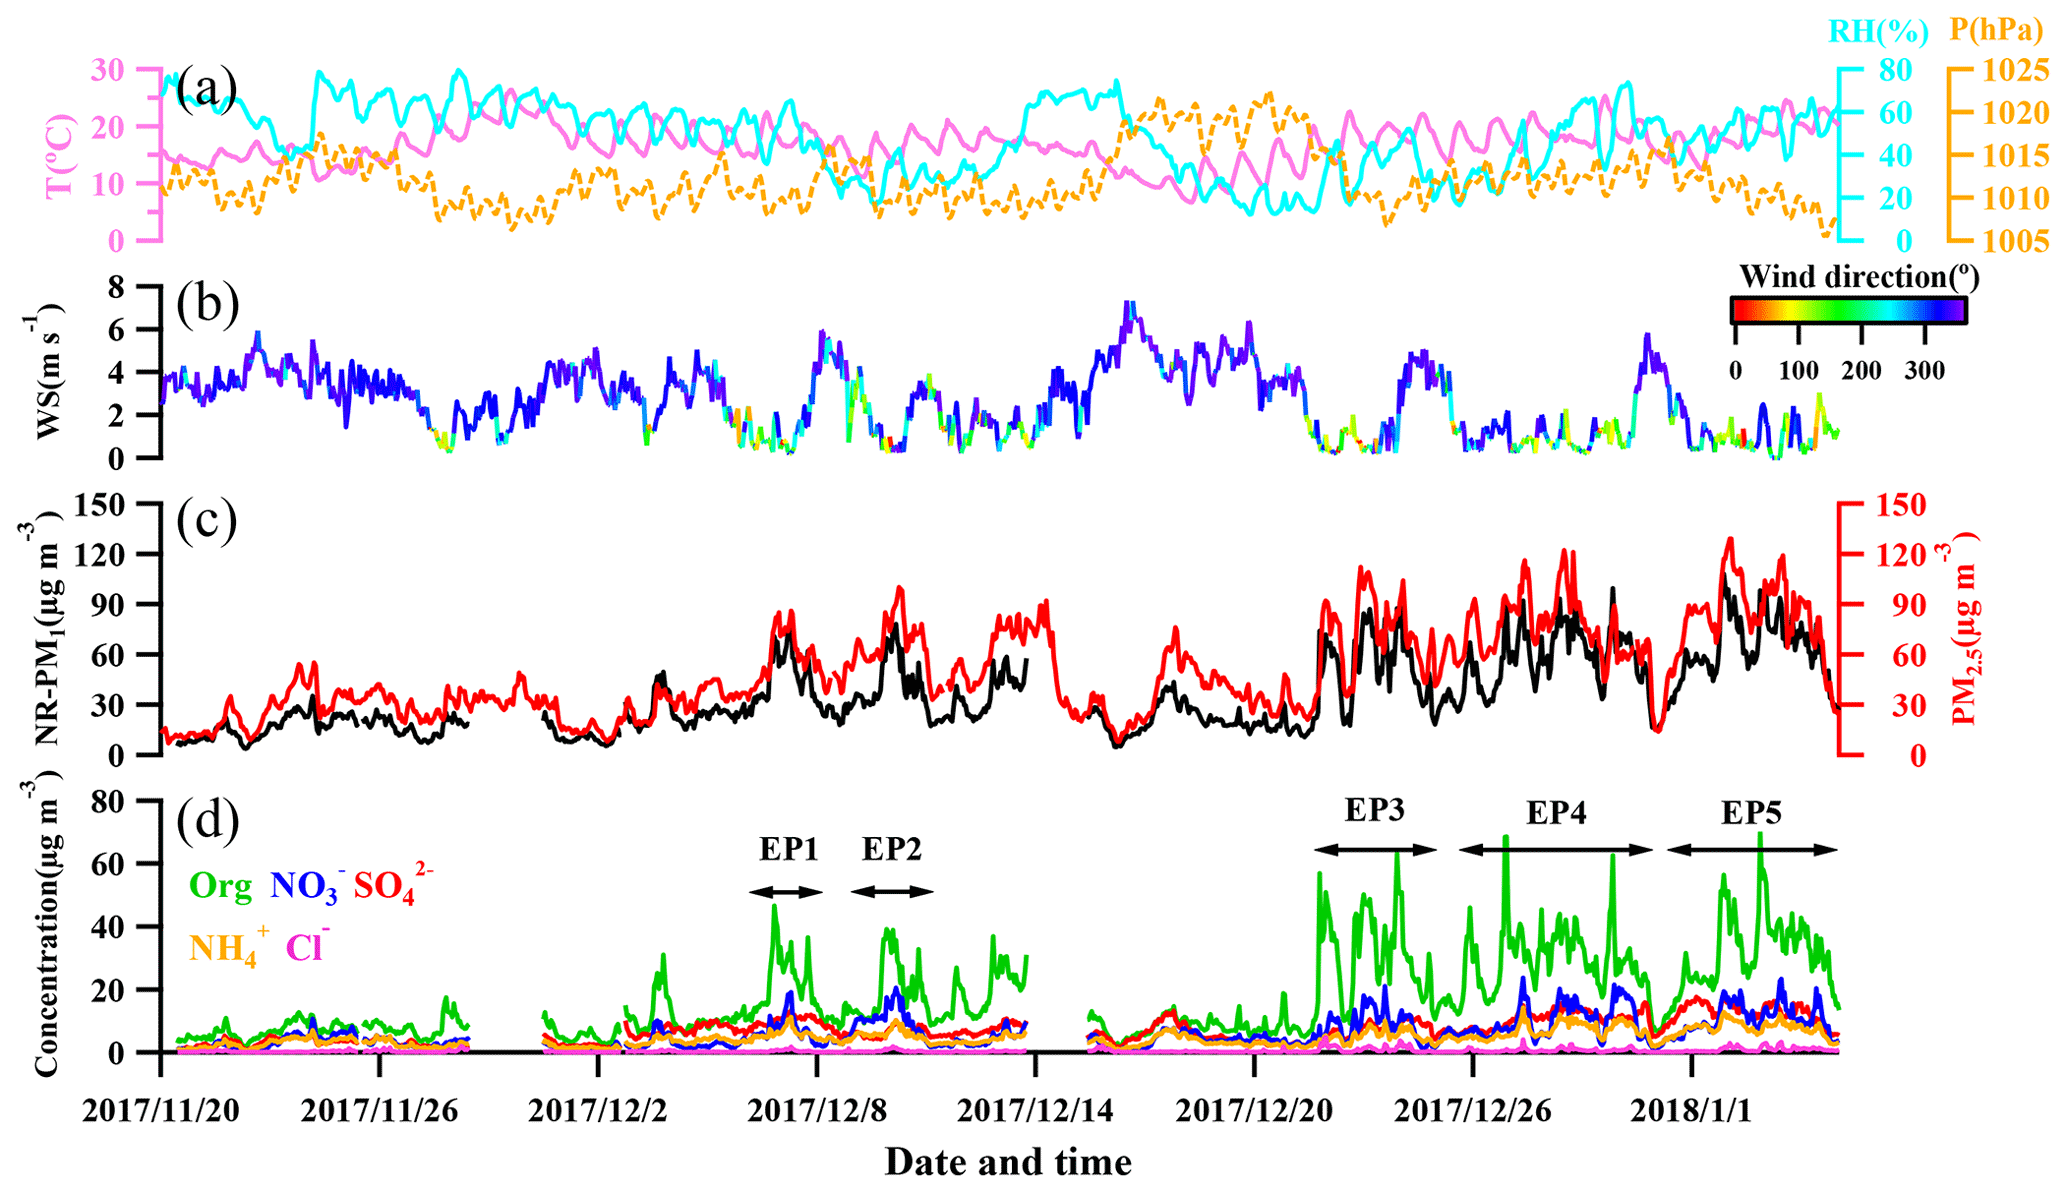
Figure 1Temporal variation in (a) relative humidity, temperature, and pressure; (b) wind speed and direction (color-contoured); (c) total NR-PM1 and PM2.5; and (d) speciated concentrations of NR-PM1. EP1–EP5 are classified as pollution episodes (EP1: 6–8 December; EP2: 9–13 December; EP3: 21–23 December; EP4: 25–30 December; EP5: 31 December–5 January); see text for details.
Moderate to severe pollution events were observed during the measurement period, and we classified five pollution episodes (EP1–EP5) alongside other periods defined as non-pollution based upon the NR-PM1 mass concentrations in order to better understand the intrinsic mechanisms in the PM evolution. Each pollution episode was defined as a period that the NR-PM1 mass concentration continually increased from less than 20 µg m−3 (10th percentile) to greater than 75 µg m−3 (90th percentile) and then fell below 20 µg m−3 again (Fig. 1d). For the entire study, organics and sulfate (Fig. 2) dominated NR-PM1 mass concentration, consistent with previous studies conducted in the PRD region during autumn and winter (He et al., 2011; Huang et al., 2011; Qin et al., 2017). Fractions of 20 % and 49 %, respectively, for sulfate and organics were similar to those in Panyu (25 % and 50 % for sulfate and organics, respectively) and Shenzhen (28 % and 46 % for sulfate and organics, respectively) but quite different from those in Kaiping (both 36 %). This comparison reflects that the sulfate fraction increased and the organic fraction simultaneously decreased from urban to rural areas (Table S1), which could be likely attributed to different sources and chemical aging processes between urban and rural areas in the PRD region. The obvious facts are that heavy industry sections, such as power plants and oil refineries which emit a tremendous amount of sulfur dioxide, the primary precursor of sulfate, are mainly located in non-urban areas. Similar urban-to-rural evolution of PM chemical composition was reported in previous studies (Jimenez et al., 2009; Zhang et al., 2011; Y. J. Li et al., 2017), providing further rationale for performing field measurements under different source environments to investigate the chemical evolution of PM.
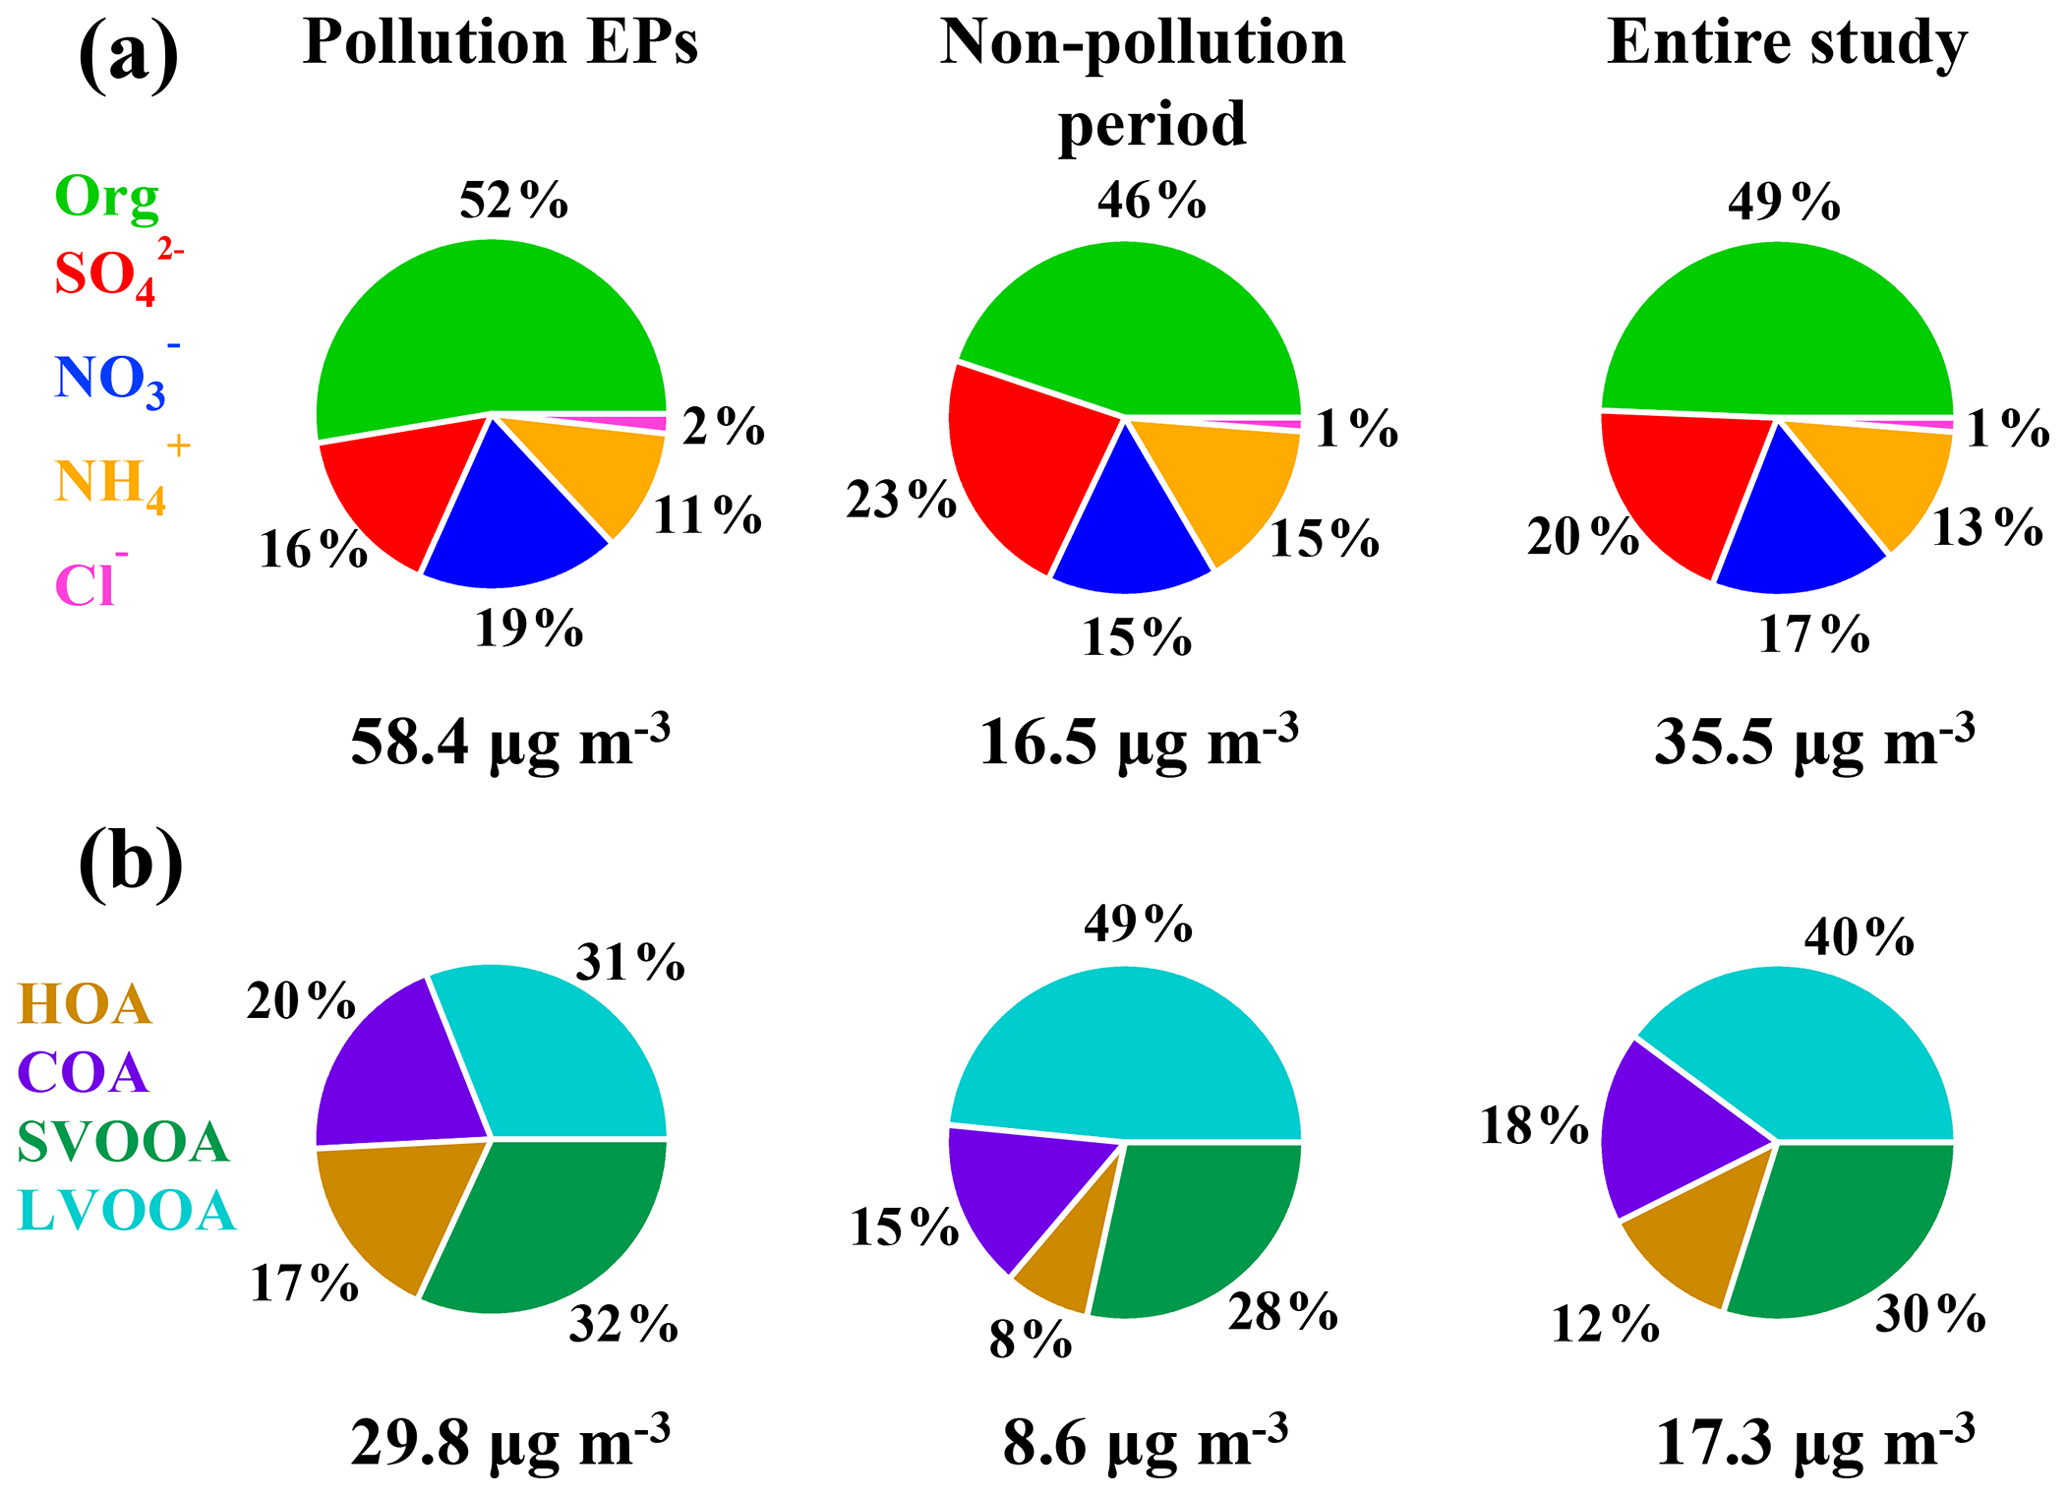
Figure 2The average fraction of each chemical composition of (a) NR-PM1 (OA, nitrate, sulfate, ammonium, and chloride) and (b) organic aerosols (LVOOA, SVOOA, HOA, and COA).
Table 1Summary of published NR-PM1 measurements in China.
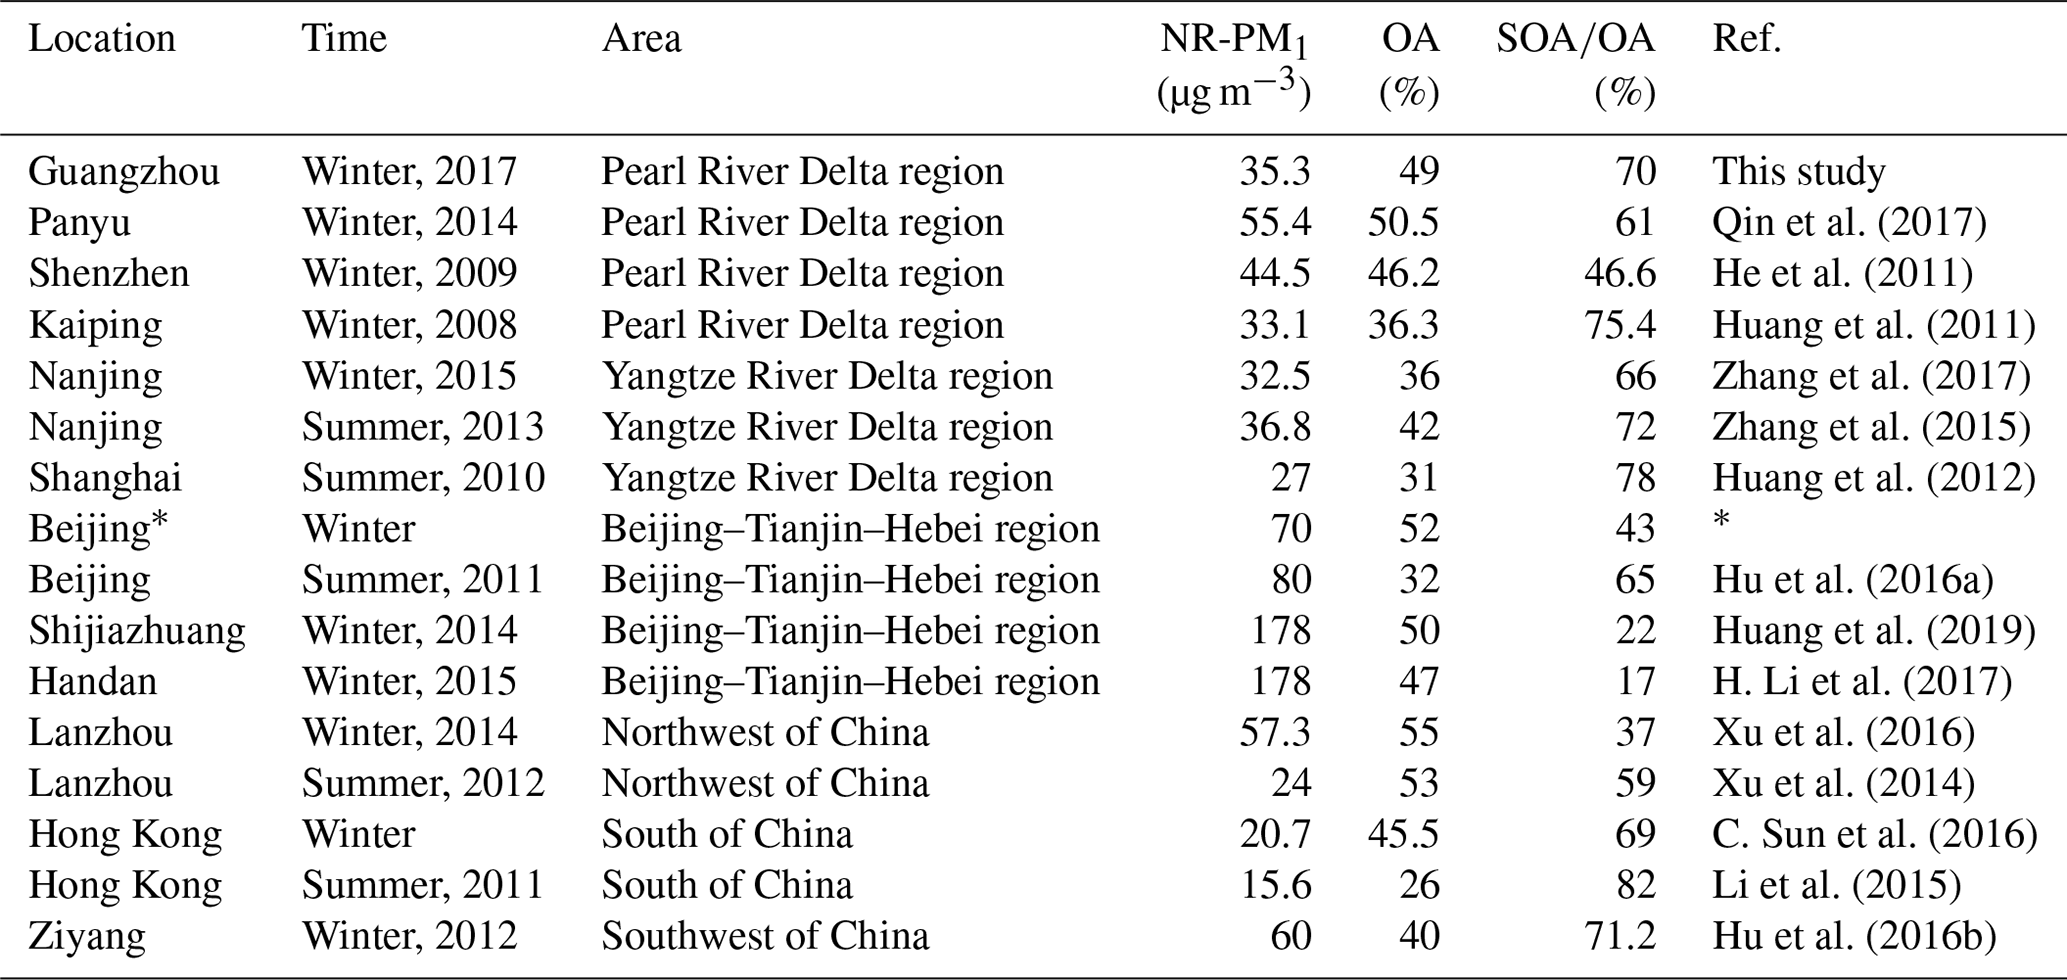
∗ The three quantities for winter Beijing are the averages of six studies (Y. Sun et al., 2013, 2014, 2016; Jiang et al., 2015; Wang et al., 2015; Hu et al., 2016a).
Figure 3 shows a comparison of NR-PM1 characteristics among our work in the PRD region and previous wintertime studies conducted in several other Chinese megacities (Beijing, Nanjing, Shijiazhuang, Lanzhou, Hong Kong) beyond the PRD region. Compared to other locations, the averaged mass concentration of NR-PM1 in Guangzhou was much lower (35.5 µg m−3), indicating that the air of the PRD region was relatively clean in terms of fine PM. The concentrations of NR-PM1 in the abovementioned cities were all composed of a large fraction of OA, with a substantial variation (37 %–58 %), indicating the significant contribution of OA to fine particle mass loading over China. In addition, a remarkable distinction on the fraction of secondary OA (SOA) in OA between southern and northern China was found; that is, SOA dominated OA in southern China (A SOA-to-OA ratio of 0.66 in Nanjing, 0.58 in Hong Kong, and 0.7 in Guangzhou), compared to a lower ratio of SOA to OA in northern China (0.43 in Beijing, 0.37 in Lanzhou, and 0.22 in Shijiazhuang). The increasing ratio of SOA to OA from the north to the south is probably due to more favorable meteorological conditions such as solar radiation and temperature for secondary chemical processes in southern China and more significant contribution of coal combustion in northern China during wintertime (Sun et al., 2013, 2014, 2018). Furthermore, Table 1 shows that the SOA fraction is generally enhanced from winter to summer for a specific site in China. In addition, Table 1 also revealed that SOA formation is significantly influenced under different underlying surfaces (urban, suburban, and country).
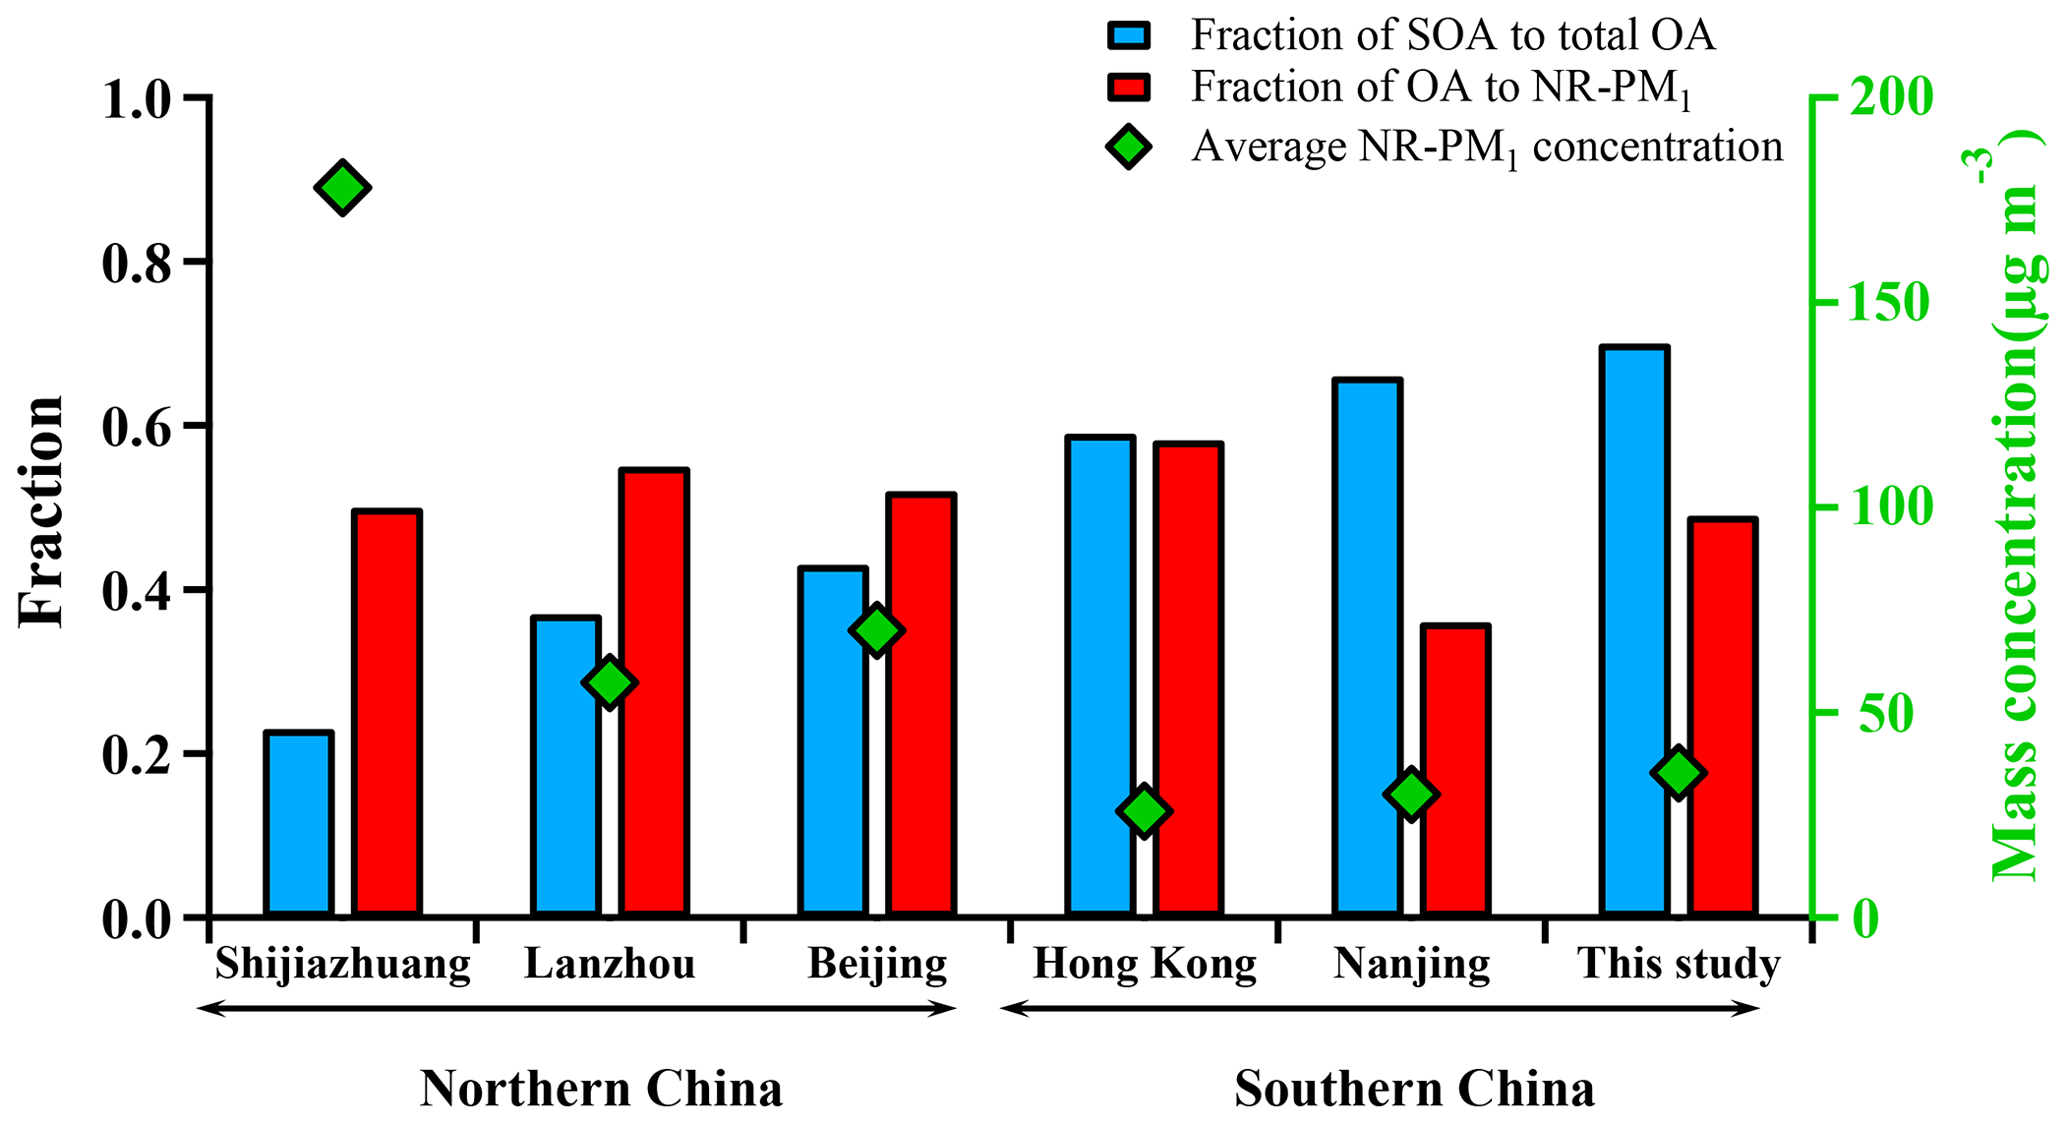
Figure 3Comparison of submicron aerosols among several megacities in China during winter including Guangzhou (this study) and five other cities. Red bars represent the fraction of OA to NR-PM1 and blue bars represent the fraction of SOA to OA. Green diamonds represent the average concentration of NR-PM1 in each city.
3.2 OA apportionment
Positive matrix factorization with ME-2 engine algorithm was employed to deconvolve OA into four factors, including two primary OA components (HOA and COA) and two OOA components (SVOOA and LVOOA) which are usually treated as SOA. The mass spectra and corresponding time series are depicted in Fig. 4.
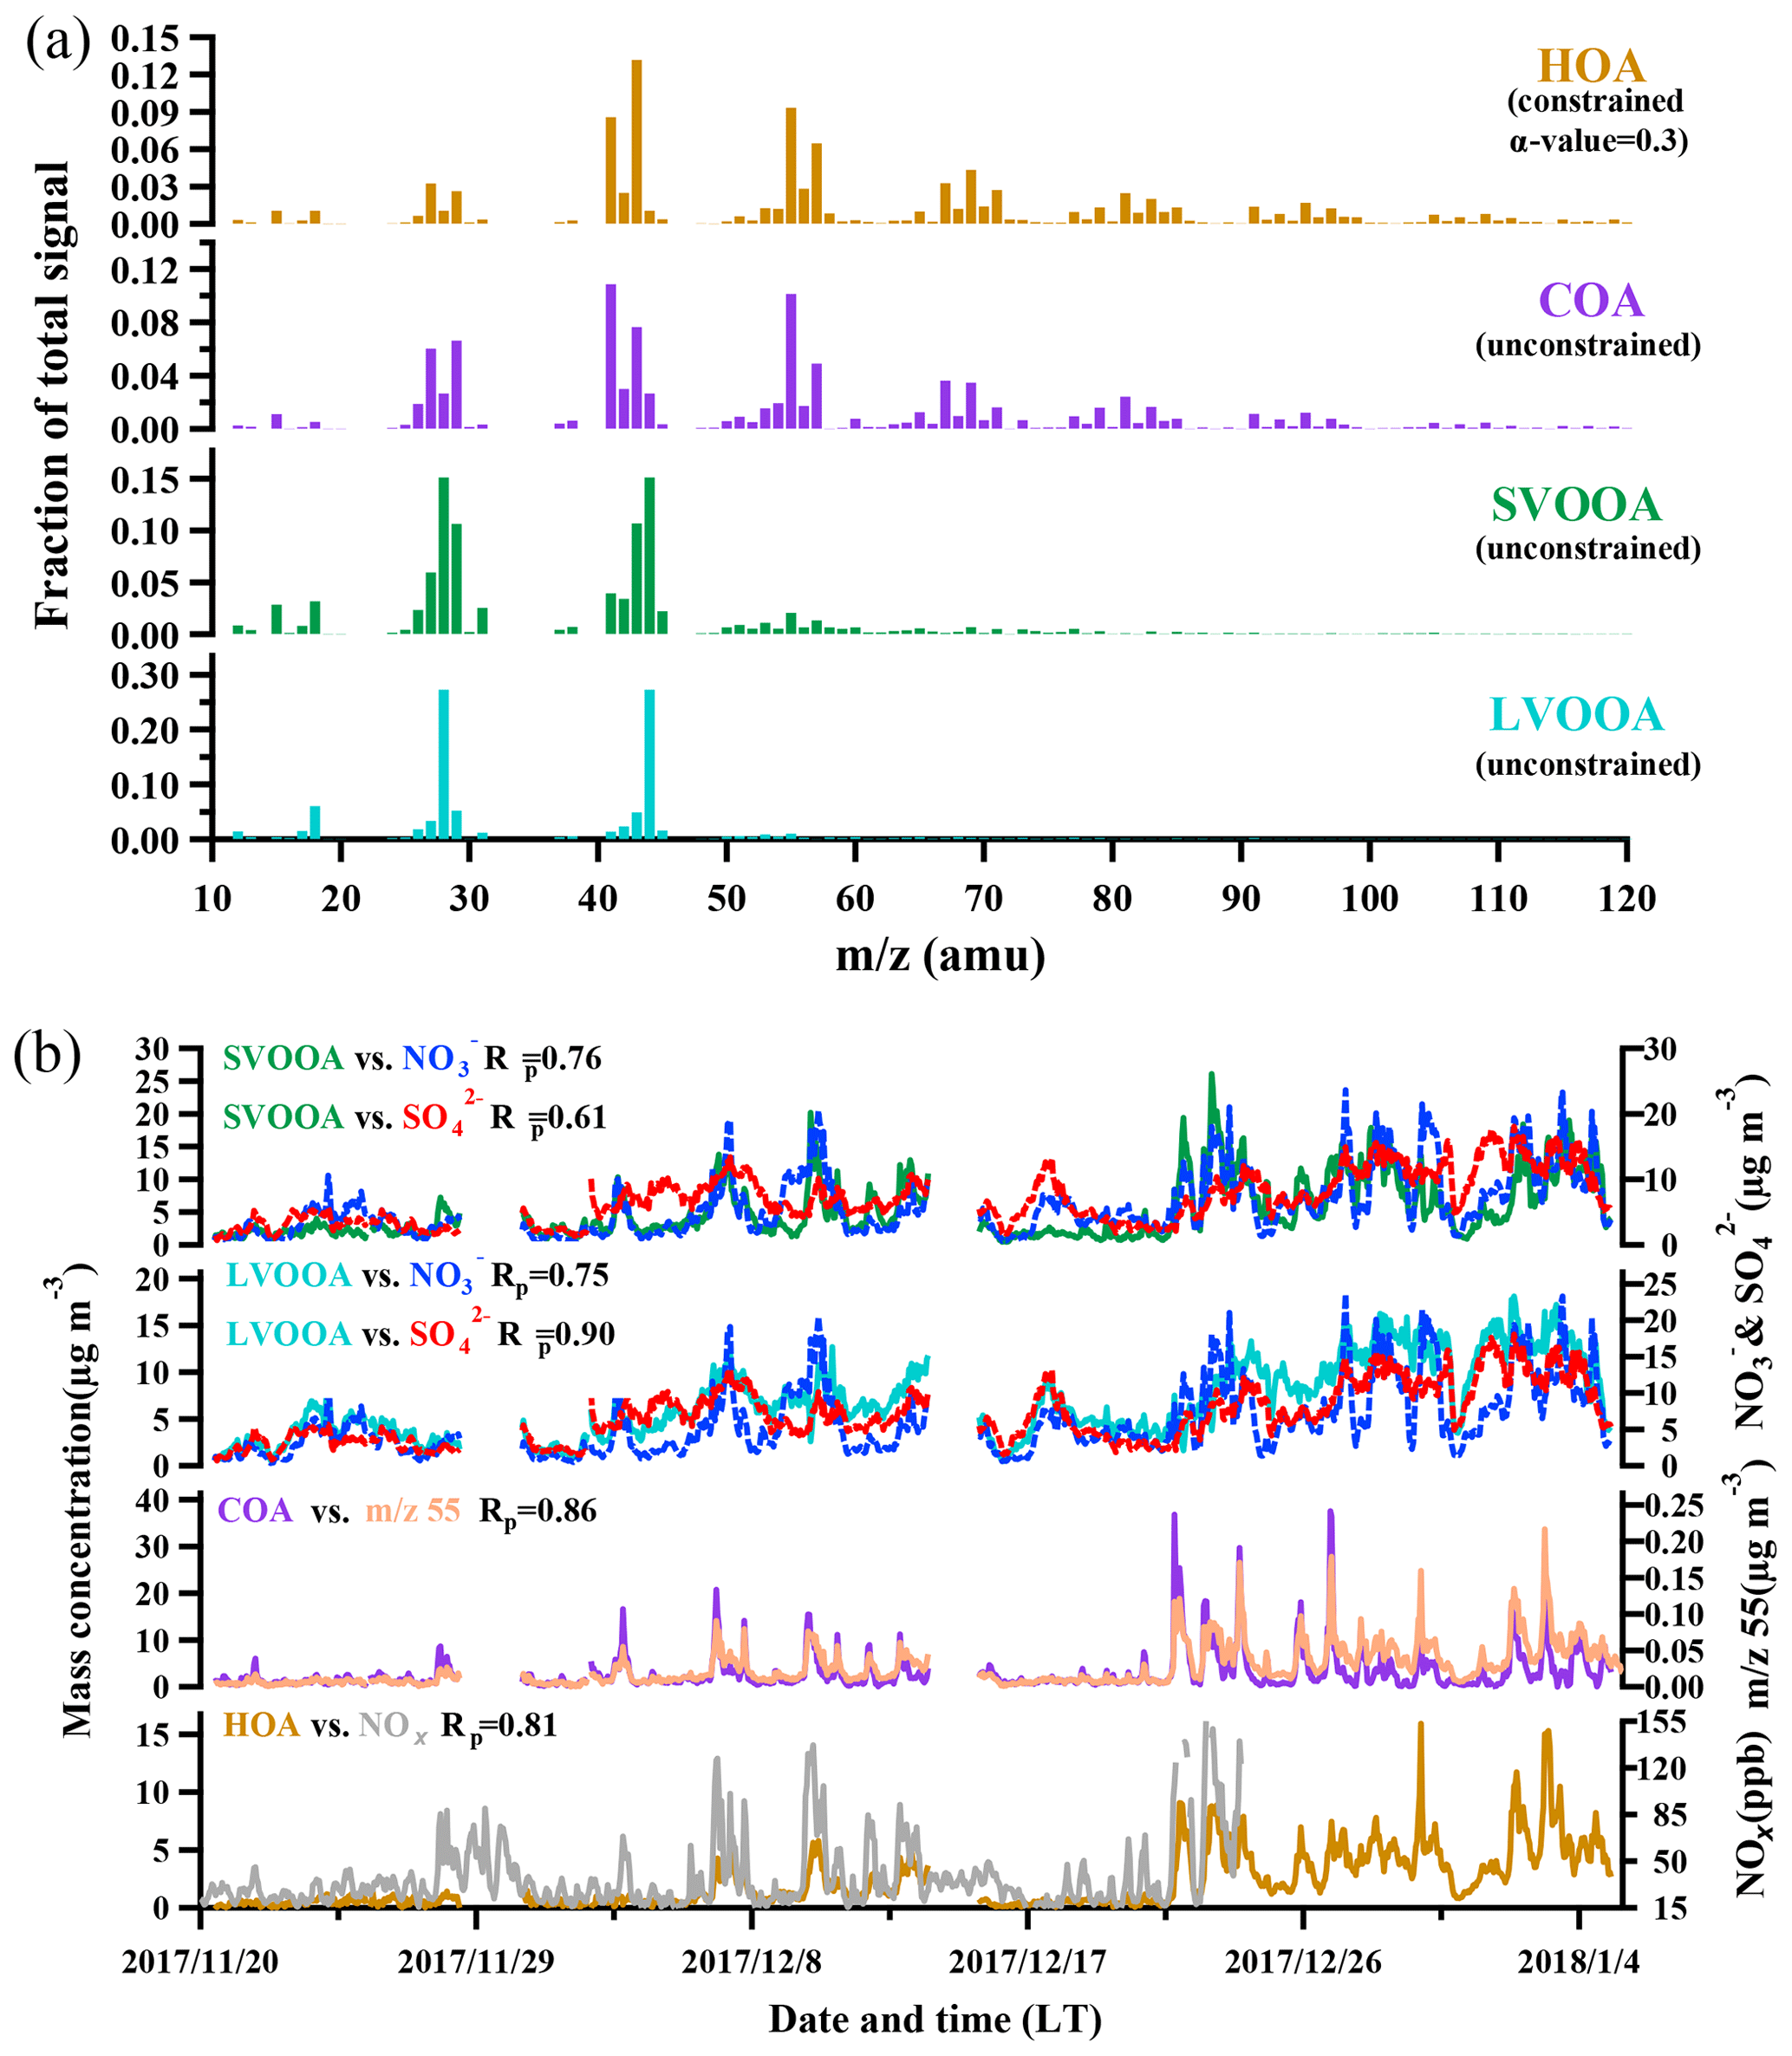
Figure 4The mass spectra and time series of the four OA components (HOA, COA, SVOOA, and LVOOA).
3.2.1 Hydrocarbon-like OA (HOA)
A widely referred-to standard mass spectrum of HOA (Sun et al., 2013; C. Sun et al., 2016; Huang et al., 2019) derived by Ng et al. (2011c) was introduced as an external constraint in this work, with an a value of 0.3 being chosen to derive the final solution. The detailed selection of the α-value can be found in the Supplement (method section). The final mass spectrum of HOA was identified by the ion series representing (, 41, 55, 69, 83, 97, typical tracers of cycloalkanes or unsaturated hydrocarbon) and (, 43, 57, 71, 85, 99, typical tracers of alkanes). As shown in Fig. 4b, the concentration of HOA was well correlated with that of NOx during the measurement period when both concentrations were available, indicating considerable influences of traffic emissions on the HOA mass loading. Diurnal variations in HOA concentration for both pollution EPs and non-pollution periods are depicted in Fig. 5. The variations for mass concentrations of both HOA and NOx were pronounced for pollution EPs (much higher concentrations at night), which can be attributed to human activities (e.g., traffic emission during rush hour). The averaged HOA concentration for pollution EPs ranged diurnally from 2.8 to 5.2 µg m−3 with the maximum value (about 16 % of total OA) found around midnight and the minimum value (12 % of total OA) at noon (13:00 LT, UTC+8). Meanwhile, the HOA concentration in pollution EPs increased rapidly from 3.1 µg m−3 at LT to 5.2 µg m−3 at around midnight and remained high afterward. Nocturnal rush hour corresponded to HOA concentration peak around 20:00 LT but could not account for the continuously high HOA concentration afterward. These consistently high concentrations were likely attributed to emissions of heavy-duty vehicles (HDVs) which are only allowed to drive through the city after 22:00 until 06:00 LT the next day according to the traffic regulation enforced in Guangzhou. The pronounced impact of HDVs on the concentrations of both HOA and NOx agrees with the previous study conducted in Panyu district, Guangzhou (Qin et al., 2017). Other possible reasons for high nocturnal HOA mass loading included lower boundary layer and a frequent thermal inversion layer formed at night during winter. Besides, effects of emissions from heavy-duty vehicles and the rapidly rising boundary layer after 07:00 LT would also account for the insignificant peak of HOA during the morning rush hour. In comparison, the HOA concentration showed almost no variations during non-pollution periods (even during rush hour), which likely arose from its extremely low value (<1 µg m−3 which was close to an estimated detection limit of 0.7 µg m−3 for OA with the ToF-ACSM).
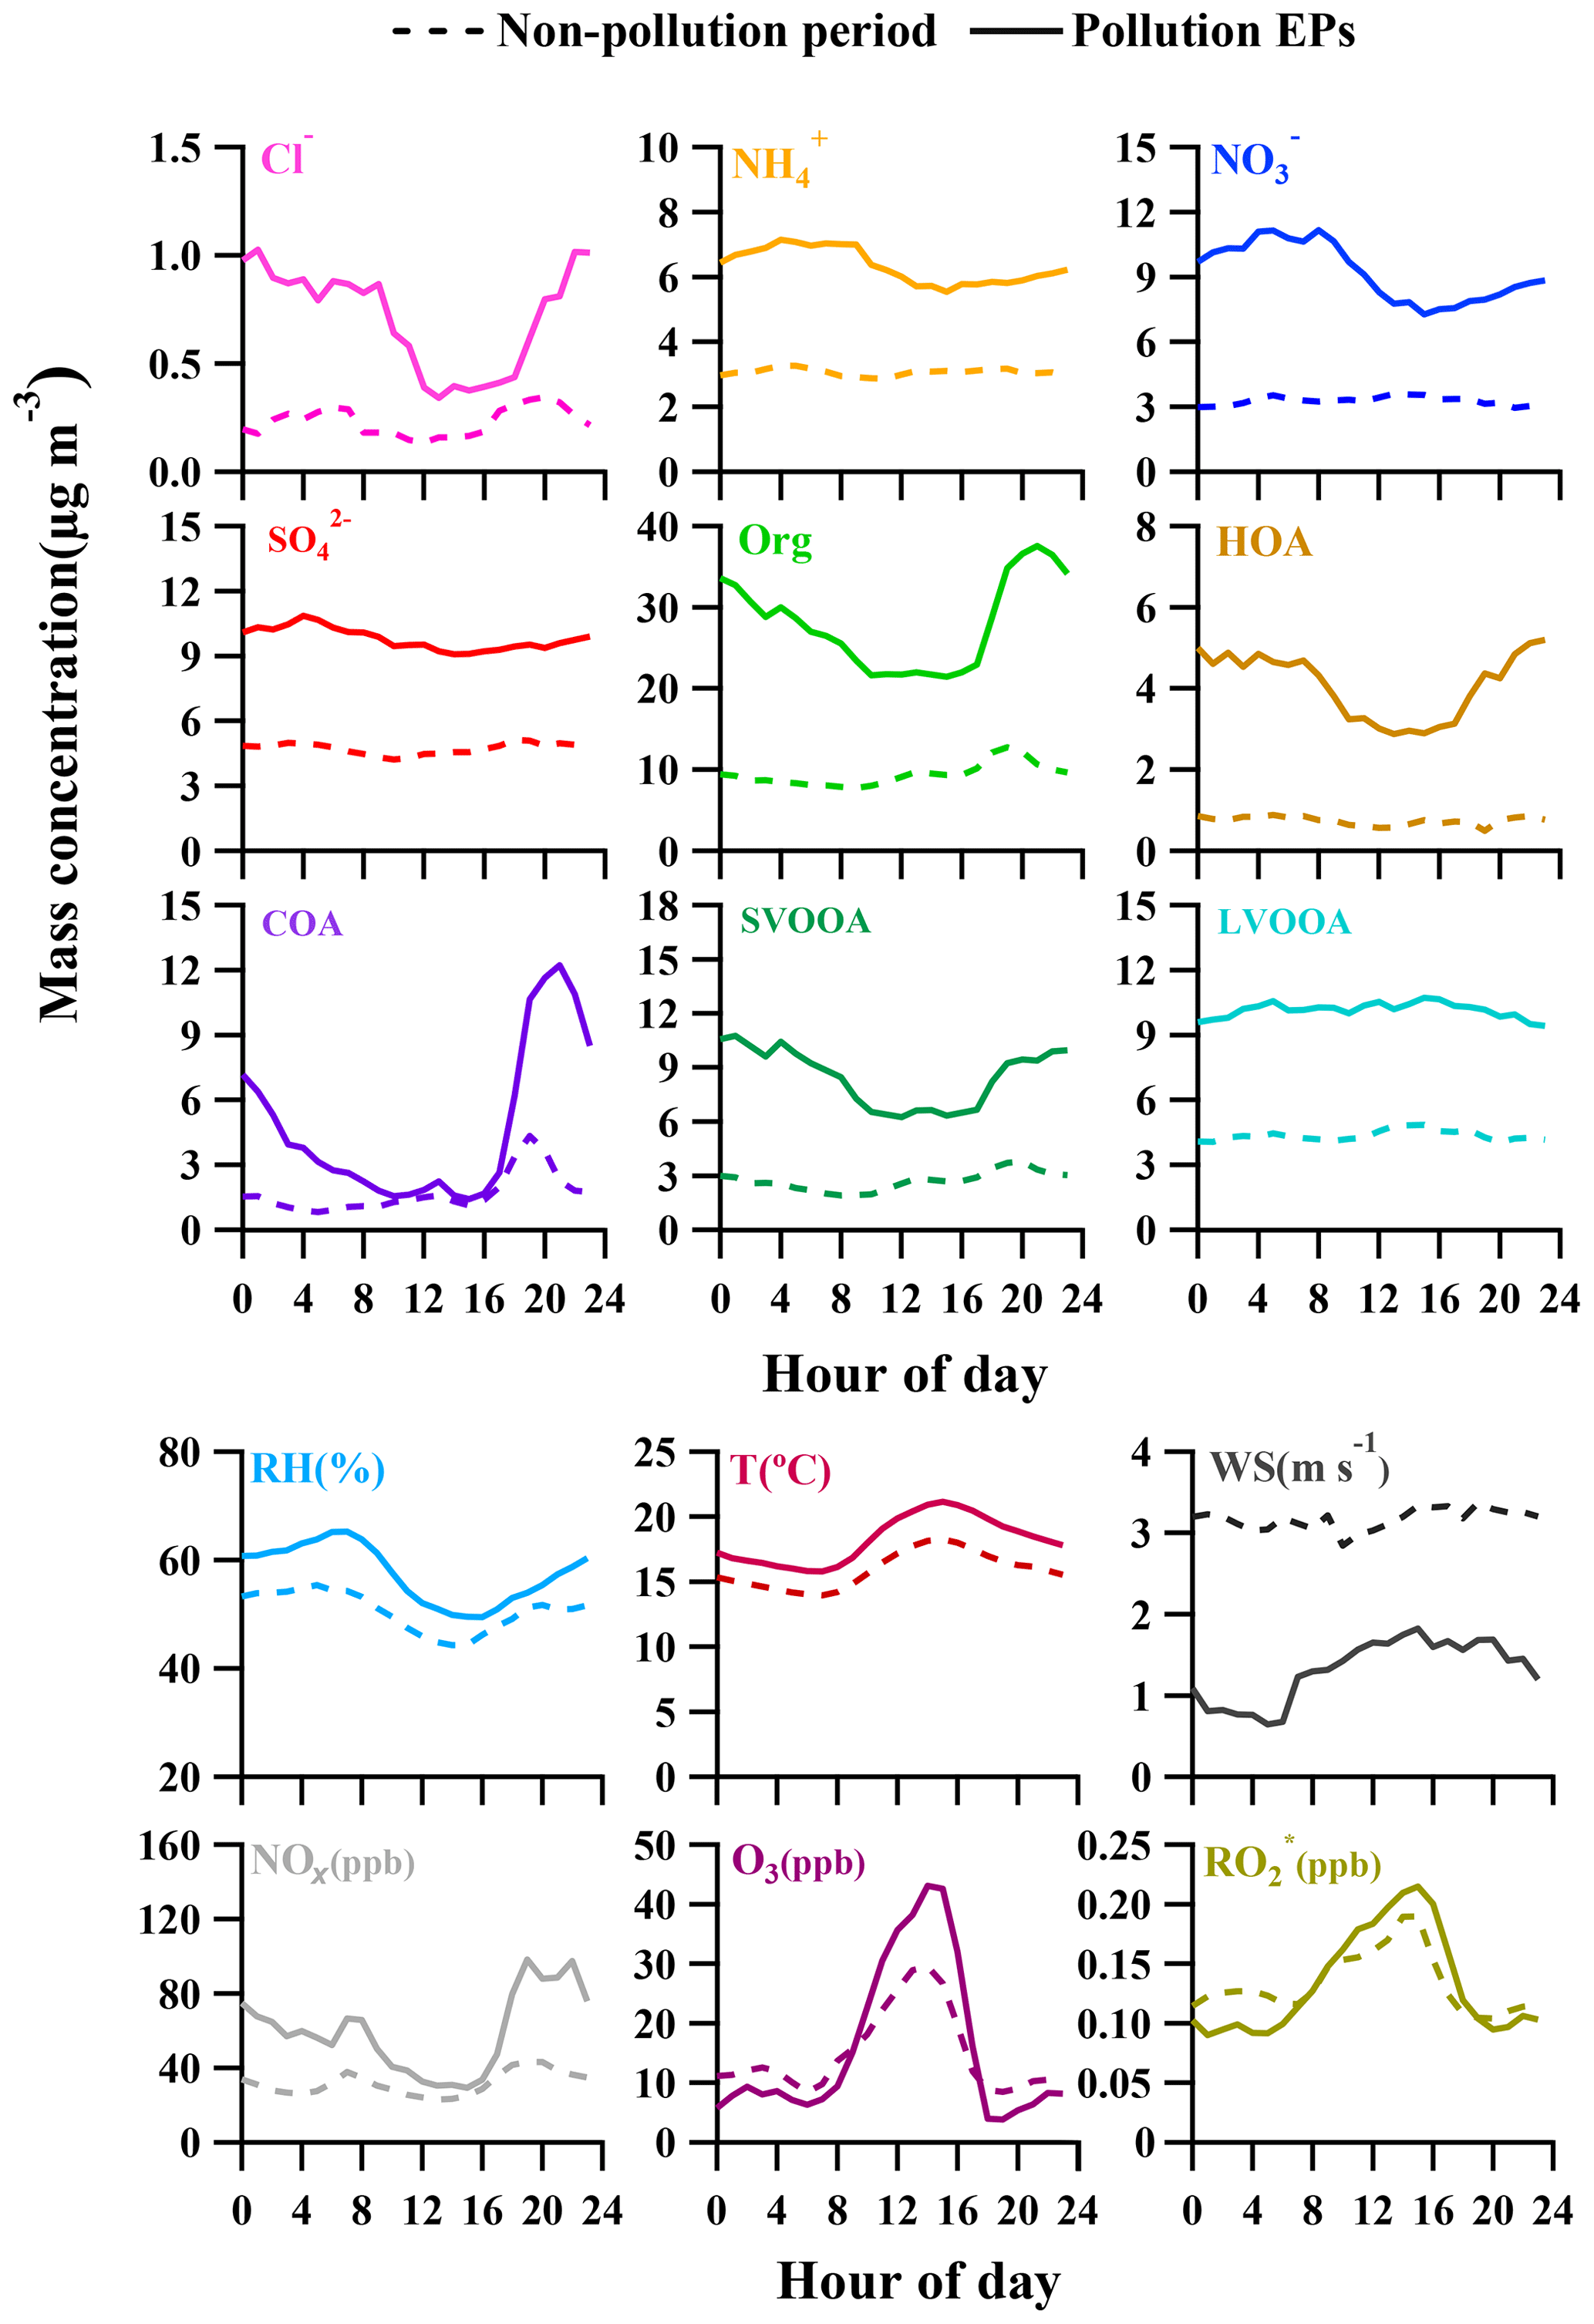
Figure 5Diurnal profiles of NR-PM1 species, trace gases, radicals, and meteorological conditions. Dashed lines and solid lines represent the averaged values during non-pollution periods and pollution EPs.
3.2.2 Cooking OA (COA)
Through factorization using PMF or the ME-2 engine, COA was frequently deconvolved as a common OA component in urban areas (Sun et al., 2013; Y. Sun et al., 2016; Lee et al., 2015; Qin et al., 2017). The mass spectrum of COA deconvolved in this work was very similar to that of HOA except a higher m∕z 55-to-57 ratio of 2.1 which is very close to the range of 2.2–2.8 reported from real cooking source measurements (Mohr et al., 2012). The concentration of COA was correlated reasonably well (Rp=0.86) with m∕z 55. As shown in Fig. 5, the diurnal profile of COA for non-pollution periods showed a typical bimodal pattern with a noon peak concentration of 1.6 µg m−3 (16 % of OA) at 13:00 LT during lunch time and a night peak concentration of 4.3 µg m−3 (33 % of OA) at 19:00 LT during dinnertime. A similar bimodal pattern of COA diurnal profile for pollution EPs was found, with a much higher ratio of night concentration peak (12.2 µg m−3) to noon concentration peak (2.5 µg m−3) than that for non-pollution periods (5 vs. 2.7). In addition, compared to non-pollution periods, the remarkably enhanced night concentration peak of COA for pollution EPs was delayed from 19:00 to 21:00 LT. Here the much higher peak concentration at night than at noon for COA are attributed to three causes: (1) more intensive cooking activities at night than at noon in the Chinese cooking routine; (2) more adverse diffusion conditions caused by a lower boundary layer and a frequent thermal inversion layer at night; (3) the lower temperature at night which facilitates semi-volatile compounds from cooking emissions to partition into particles. Furthermore, pollution EPs with remarkably enhanced and delayed night COA concentration peaks corresponded to several important holidays such as the winter solstice festival (EP3), Christmas (EP4), and New Year's Day (EP5), implying that festival-induced emissions have significant impacts on local air pollution.
3.2.3 Oxygenated OA (OOA)
OOA, the generally accepted surrogate of SOA (Jimenez et al., 2009), characterized by a high peak at m∕z 44 () in the mass spectra, was almost exclusively contributed by electron ionization of ketones, aldehydes, esters, and carboxylic acids. Furthermore, OOA could be further deconvolved into two subcomponents, SVOOA and LVOOA, based on different degrees of oxidation. SVOOA was distinguished from LVOOA by a higher ratio of f43 to f44 (0.7 for SVOOA and 0.18 for LVOOA).
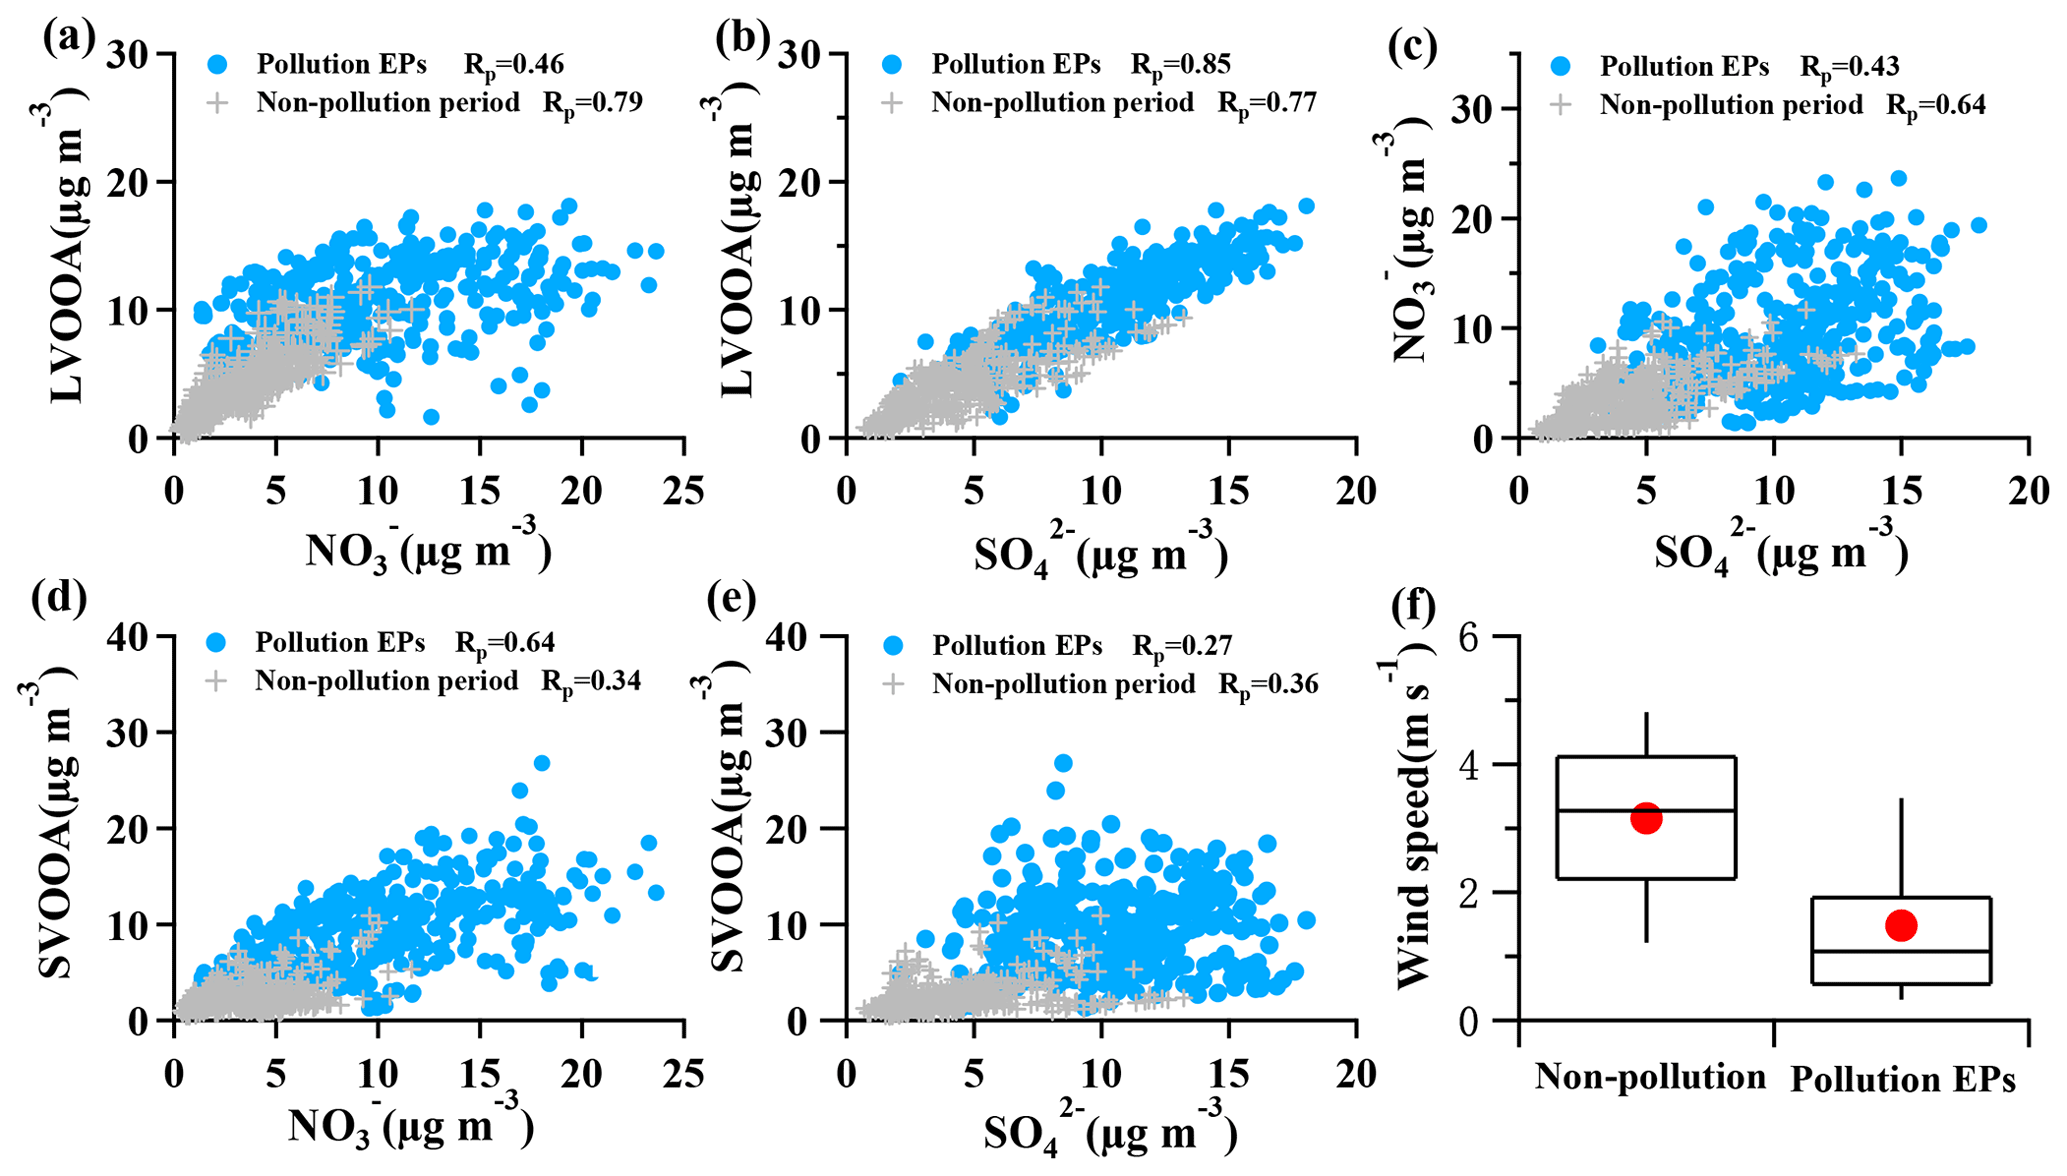
Figure 6Correlations between OOA and SIA, along with correlation between nitrate and sulfate, and the wind speed during pollution EPs and non-pollution periods. (a) LVOOA vs. ; (b) LVOOA vs. ; (c) vs. ; (d) SVOOA vs. ; (e) SVOOA vs. . Blue circles represent pollution EPs while gray crosses represent non-pollution periods. (f) Box plot of wind speed in non-pollution periods and pollution EPs. Whiskers are the 10th and 90th percentiles; the top, median, and bottom lines of the box represent 75th, 50th, and 25th percentiles, respectively. Red dots are the averaged wind speed for each scenario.
A high similarity between SVOOA and secondary inorganic aerosols (nitrate and sulfate) in terms of time series was observed for the entire study (Fig. 4). It was found that Pearson correlation coefficient (Rp) between SVOOA and nitrate (0.76) was higher than that between SVOOA and sulfate (0.61), consistent with the trend reported by previous studies which attributed it to analogous semi-volatility and gas–particle partitioning between SVOOA and nitrate (Aiken et al., 2009; DeCarlo et al., 2010; Zhang et al., 2011). Interestingly, we found that the correlation between SVOOA and nitrate was much better for pollution EPs than for non-pollution periods (Rp=0.64 vs. 0.34, Fig. 6d), which cannot be simply attributed to similar volatility and photochemistry. Meanwhile, concentration of neither nitrate nor SVOOA was obviously dependent on temperature in this study. Furthermore, we found that the air during all pollution EPs was much more stagnant, supported by much lower wind speed, than that during non-pollution periods (Fig. 6f), implying that most nitrate and SVOOA were locally formed during pollution EPs, while they likely originated from regional transport during non-pollution periods. Since traffic emissions contribute largely to NOx and VOCs, a higher correlation between SVOOA and nitrate during pollution EPs than during non-pollution periods likely stemmed from shared sources of precursors for the two aerosol components and implies that traffic emissions could significantly influence SVOOA and nitrate mass loading under stagnant meteorological conditions. These are further confirmed by the fact that in general much higher correlations between SVOOA (or nitrate) and the traffic trace species (CO, HOA, and NOx) were found during pollution EPs than during non-pollution period (Table 2). As mentioned above, non-pollution periods were always associated with high wind speeds which would induce strong air advection and make local emissions hardly accumulate, leading to a large fraction of PM1 contributed from regional transport. These regionally transported nitrate and SVOOA were usually less correlated with traffic tracers because of more complicated sources for SVOOA and nitrate outside urban Guangzhou and different influences of secondary processes on these species through transport. A previous laboratory study suggested that photooxidation of traffic-related emissions leads to substantial amounts of SOA (Weitkamp et al., 2007) which in our case are likely locally formed SVOOA. The diurnal profiles of SVOOA for non-pollution periods and pollution EPs showed explicit distinctions. During pollution EPs, the concentration of SVOOA showed a pronounced diurnal variation which in general formed a flat trough around noon and reached the maximum value around midnight. In comparison, the diurnal profile of SVOOA concentration for non-pollution periods, however, was much flatter, with two weak peaks likely reflecting photochemical oxidation and local anthropogenic emissions. These two different diurnal patterns of SVOOA concentration suggest accumulation of local anthropogenic emissions under stagnant air conditions during pollution EPs could largely influence mass loading of SVOOA.
Table 2Pearson correlations between traffic tracers (CO, HOA, and NOx) and SVOOA (nitrate and sulfate) during different periods.
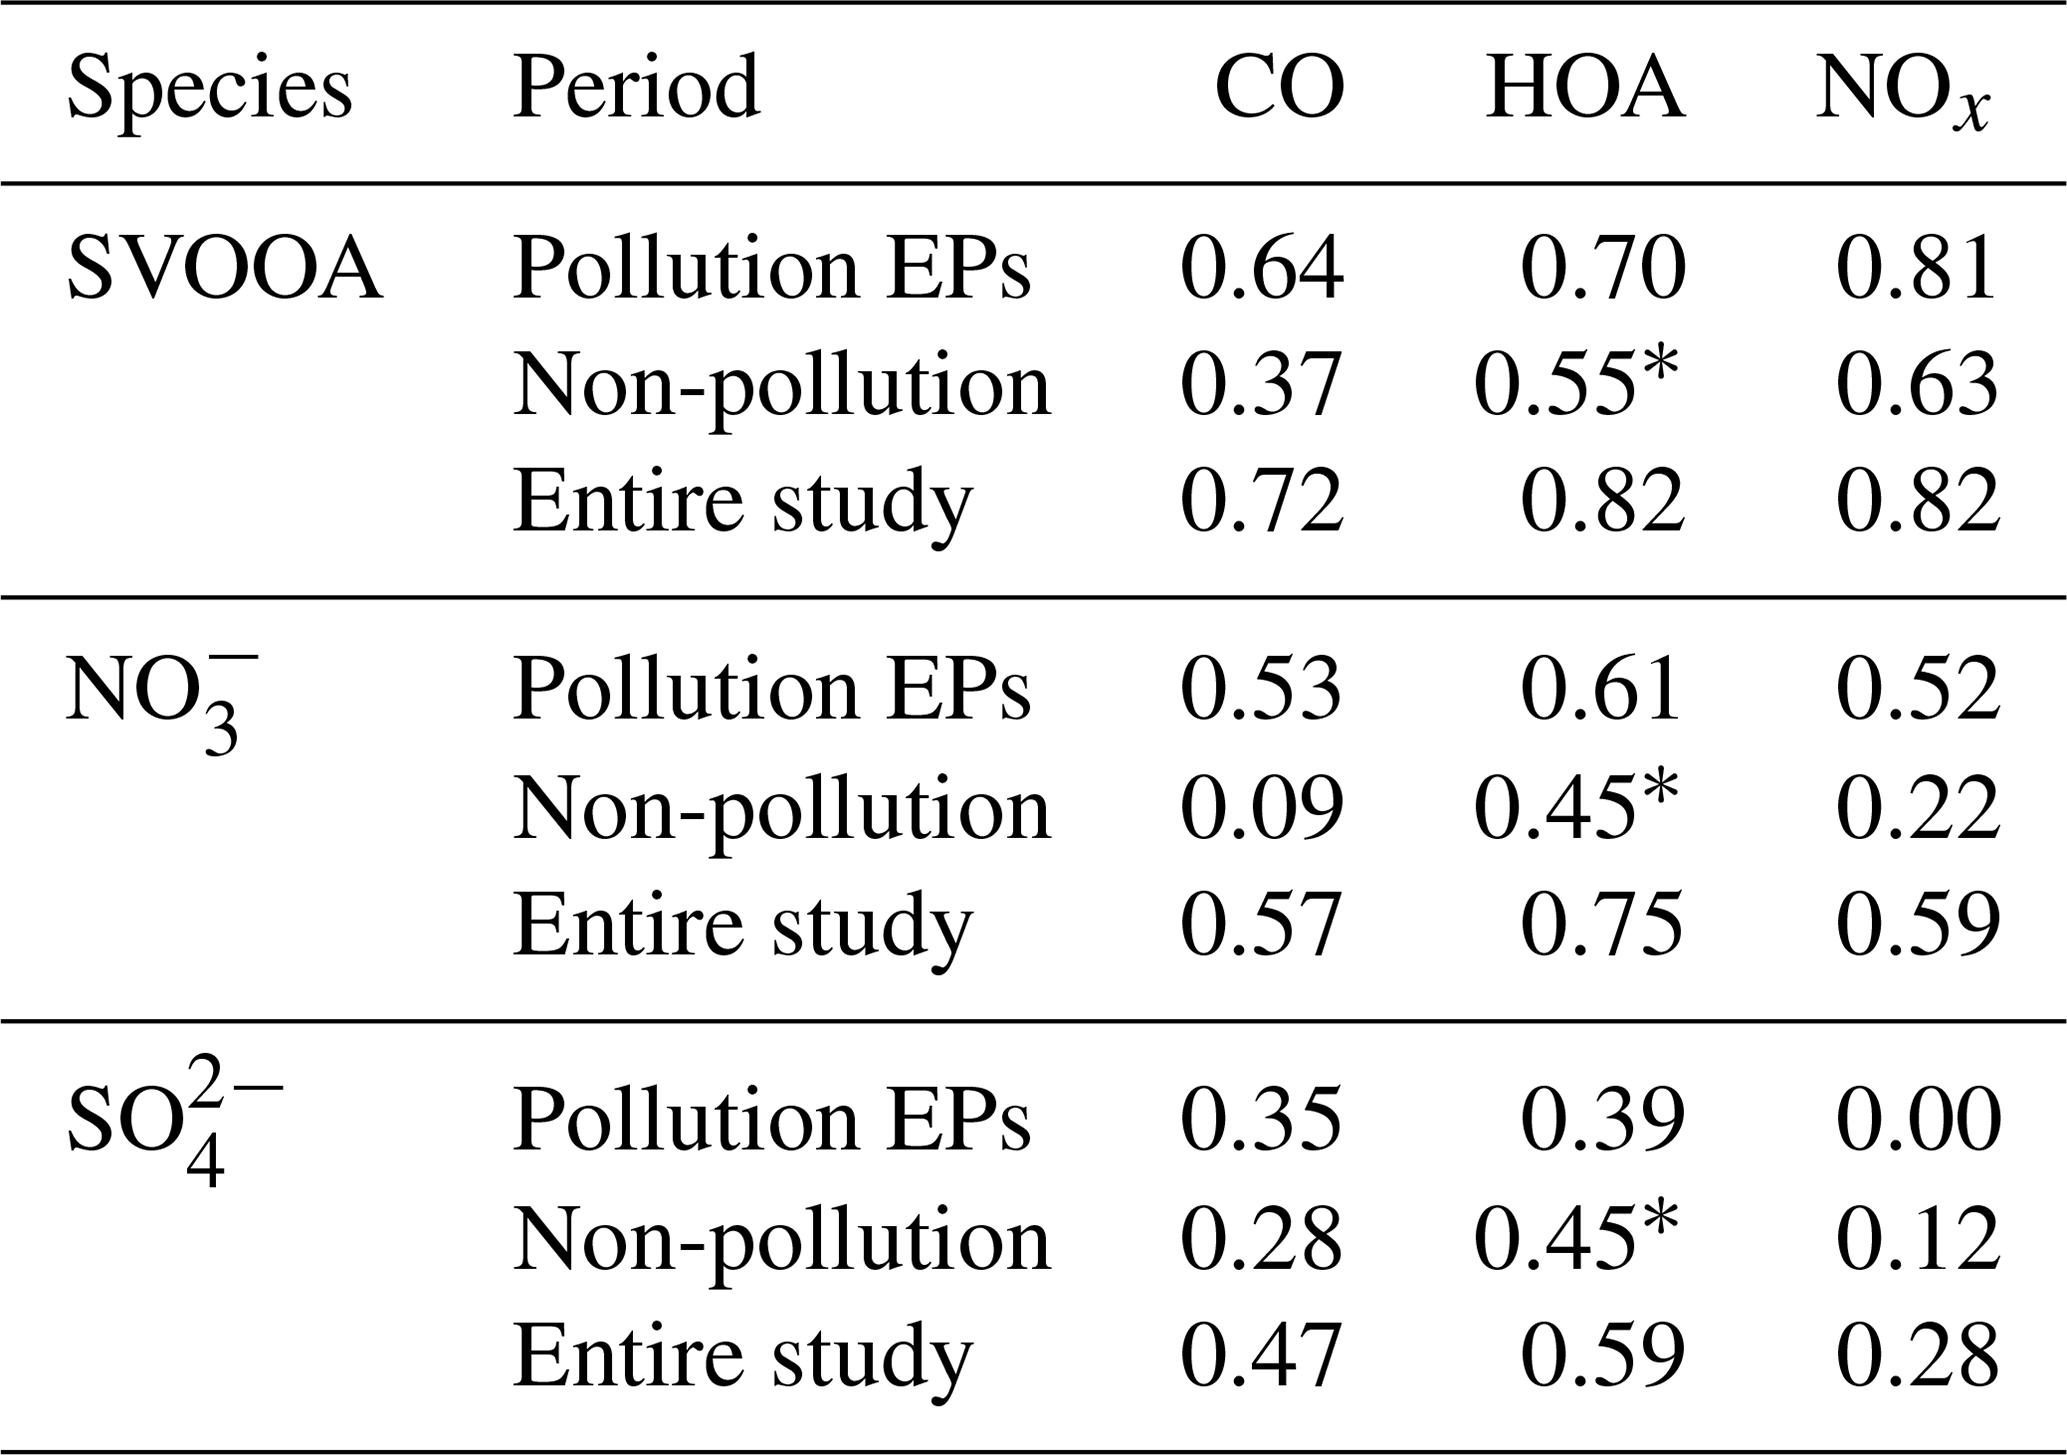
∗ Pearson correlations involving HOA for non-pollution periods may have non-negligible uncertainty since HOA concentration in non-pollution periods is near the method detection limit (MDL) of the ToF-ACSM for OA.
In contrast to SVOOA, the concentration of LVOOA showed a better correlation with that of sulfate (Rp=0.85) than with nitrate (Rp=0.77), which is likely attributed to similarly low volatility of both LVOOA and sulfate. Diurnal profile of LVOOA concentration showed roughly no variation with slightly elevated values during the afternoon for both pollution EPs and non-pollution periods, demonstrating that LVOOA was not significantly influenced by local emissions but by aging processes, in particular photochemistry. Prolonged aging of SOA leads to the high oxidation degree of LVOOA, which should be considered as a kind of regional pollutant or background aerosol (Li et al., 2013, 2015; C. Sun et al., 2016; Qin et al., 2017), while freshly formed SOA from local emissions remains a lower oxidation state which more readily becomes the SVOOA component as is discussed in this section.
3.3 Diurnal profiles
In the previous section, we have discussed diurnal variations in the four deconvolved OA components, and here important variations in other species and meteorological conditions are detailed to better understand evolution of NR-PM1 species and pollution characteristics in Guangzhou (Fig. 5). Similar to SVOOA, remarkably different diurnal profiles of nitrate concentration between pollution EPs and non-pollution periods were observed. For non-pollution periods, diurnal nitrate concentration varied little with a slight maximum occurring at 13:00 LT, implying the influence of photochemistry on nitrate formation. For pollution EPs, however, nitrate concentration showed a much more pronounced diurnal variation; that is, nitrate mass loading stayed low around noon to afternoon and then increased steadily during the night until it reached the maximum at 09:00 LT in the next day. Note that nitrate concentration increased from dusk to early morning with similarly increasing RH and oppositely decreasing temperature. Meanwhile, the nocturnal NOx concentration was 67 % more than that during the daytime (Table 3). Thus, higher RH, more abundant NOx, and lower temperature during nighttime facilitate aqueous reactions and gas-to-particle partitioning between gas-phase nitric acid and ammonium nitrate, which played important roles in nocturnal nitrate formation during pollution EPs, consistent with the previous study (Xue et al., 2014). In addition, the morning nitrate peak at 09:00 LT can be attributed to a synergy of high NOx emissions during rush hour and the most favorable conditions for ammonium nitrate formation during 08:00–09:00 LT (i.e., low temperature, high RH). Our results strongly demonstrate the importance of local anthropogenic emissions and aqueous reactions in nitrate accumulation under stagnant air conditions during pollution EPs.
Table 3Overview of meteorological conditions, trace gases, peroxy radical, and NR-PM1 components during day and night.
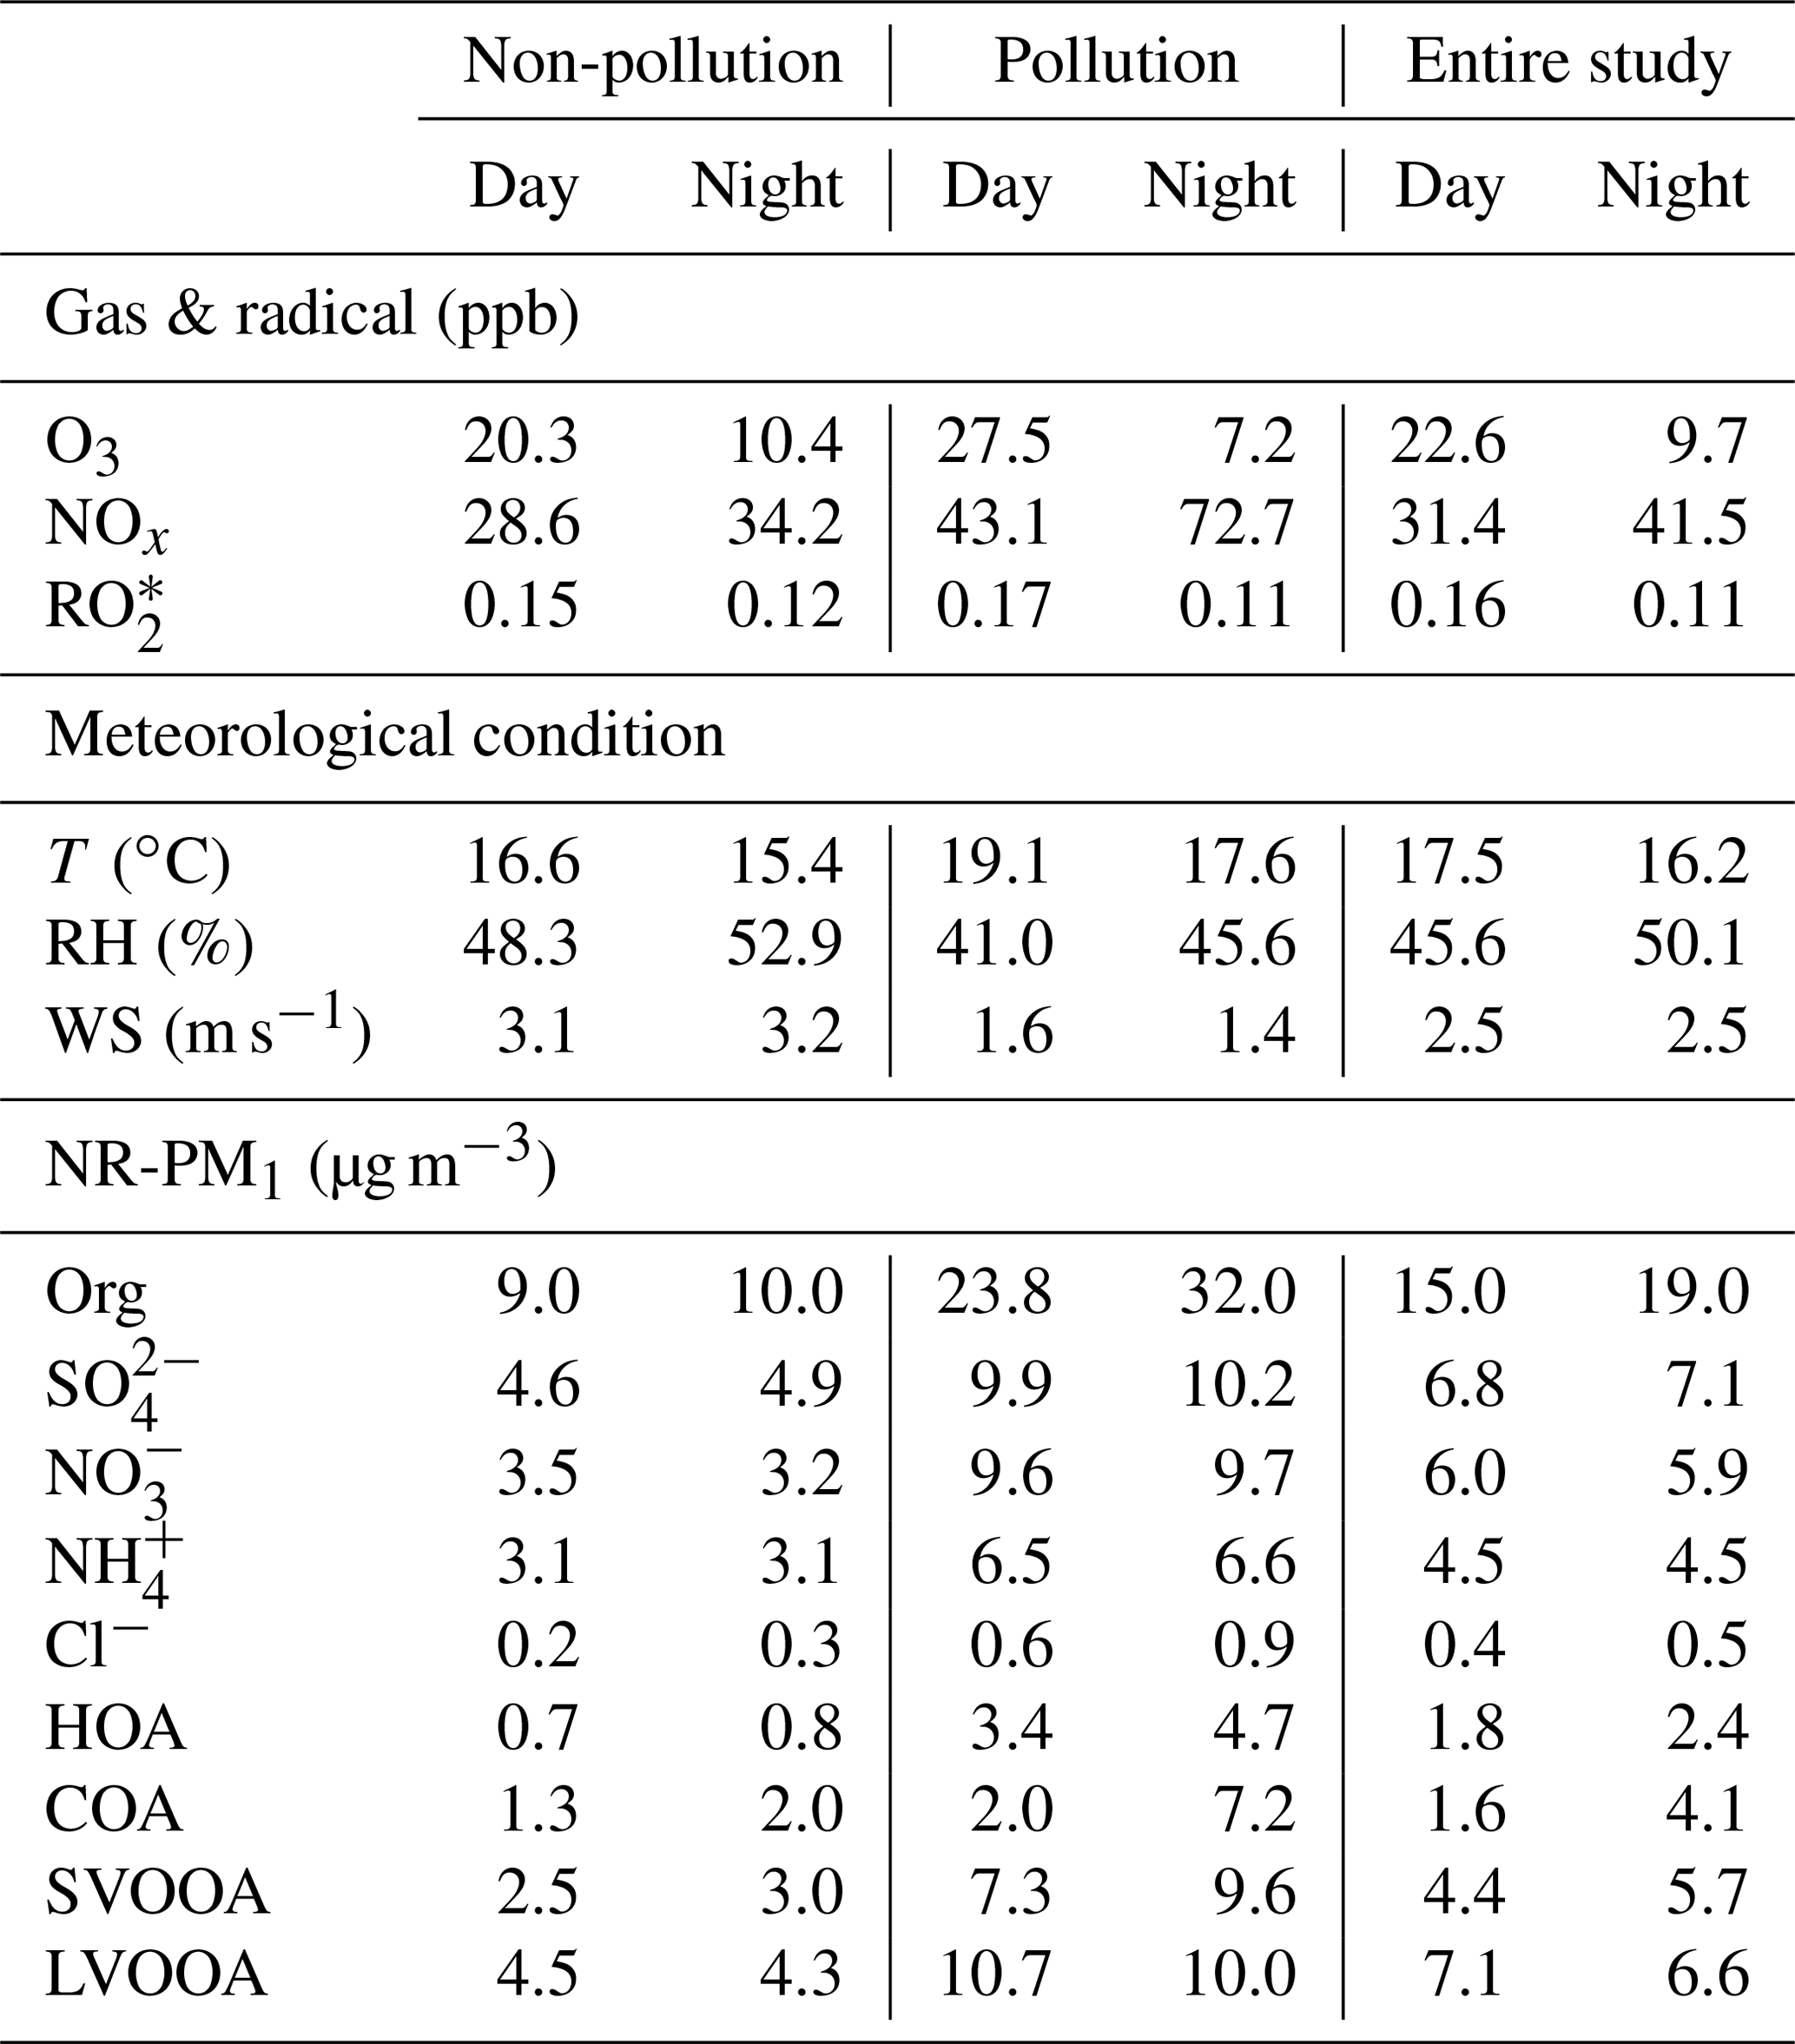
The diurnal concentration of sulfate showed very slight variation for both pollution EPs and non-pollution periods, with the averaged daytime concentration being almost the same as that at night. This indicates that the sulfate concentration was always less influenced by local anthropogenic emissions due to the fact that power plants, the most important source of sulfur dioxide (SO2), are rarely located in urban Guangzhou (Bian et al., 2019). Thus, the sulfate concentration in this study should be largely determined by regional transport during both pollution EPs and non-pollution periods, which can also be supported by similar diurnal profiles of SO2 (Fig. S2). Interestingly, the diurnal variations in O3 and () for pollution EPs and non-pollution periods showed a distinct daytime-to-nighttime pattern. The daytime concentrations of the two species during pollution EPs were higher than those during non-pollution periods while the nighttime concentrations during pollution EPs were lower than those during non-pollution periods. This variation pattern differed from all other NR-PM1 species which always showed higher concentrations during pollution EPs than those during the non-pollution period within a day. The lower nighttime concentrations of O3 and during pollution EPs were probably attributed to the enhanced consumption of O3 and due to elevated NOx and VOCs concentrations at night. Our results suggest that O3 and were important nocturnal oxidants during pollution events.
3.4 Chemical evolution
Figure 7 depicts the dependence of mass concentrations and fractions of NR-PM1 components on NR-PM1 mass loading. The mass concentrations of all the NR-PM1 components increased almost linearly with increase in the NR-PM1 mass concentration. However, various trends were detected for the fractions of different NR-PM1 components. For example, organics were the dominant component of NR-PM1 with an increasing fraction from 44 % to 57 % as the NR-PM1 mass concentration increased up to >90 µg m−3 (Fig. 7b). The fractions of HOA and COA, considered primary OA, varied in a similar way; that is, both fractions increased up to 11 % for HOA and 15 % for COA as NR-PM1 mass concentration increased from ∼35 to >90 µg m−3. The variations in the fractions of SOA species and secondary inorganic aerosol (SIA) species with NR-PM1 mass loading were much more complicated. To get an overall insight into chemical evolution of the aerosols, we compare dependences of the ratio of secondary particulate matter (SPM = SVOOA + LVOOA + sulfate + nitrate + ammonium) to primary particulate matter (PPM = HOA + COA + chloride) and the concentration of and O3 on NR-PM1 mass concentration (Fig. 8). For the whole period, all three quantities followed consistent and clear trends that they all initially increased with increase in NR-PM1 mass concentration until all reached peak values at a NR-PM1 concentration of ∼35 µg m−3, and subsequently decreased with increase in the NR-PM1 mass loading. Interestingly, the trends for the three quantities during non-pollution periods were consistent with the initial monotonic increase when NR-PM1 mass concentration was below 35 µg m−3 (Fig. 8b), a concentration value that was rarely exceeded during this period. Meanwhile only if pollution EPs were considered did the trends monotonically decrease with NR-PM1 mass concentration up to ∼95 µg m−3 (Fig. 8c). During non-pollution periods when strong advection induced by high wind speed facilitated dilution and diffusion of local primary pollutants, the SPM∕PPM ratio increased with increasing concentrations of photochemical products (i.e., O3 and ) and NR-PM1, strongly suggesting that secondary processes, especially photochemistry, were the main drivers for NR-PM1 accumulation during this period. Under this circumstance, interestingly, the overall increase in SPM fraction (or SPM∕PPM) with increase in NR-PM1 mass concentration was consistent with increasing mass fractions of LVOOA and nitrate, yet opposite from decrease in SVOOA fraction (Figs. 7b and S3). The decrease in SVOOA fraction with increase in NR-PM1 mass concentration corresponded to increase in LVOOA fraction, implying progressive conversion of SVOOA to LVOOA during the aerosol aging processes. During pollution EPs when stagnant air conditions supported by low wind speeds facilitated accumulation of local primary pollutants, the SPM∕PPM ratio together with concentration of O3 and were observed to drop with increasing mass concentration of NR-PM1, indicating that production of NR-PM1 was more driven by primary emissions rather than secondary processes under this circumstance. Thus, our results indicate totally different intrinsic mechanisms responsible for NR-PM1 accumulation between pollution EPs and non-pollution periods.

Figure 7Dependences of (a) mass concentration and (b) mass fraction of NR-PM1 components on NR-PM1 mass loading. The data are plotted in an interval of 10 µg m−3 of NR-PM1. The error bars are standard deviations of each NR-PM1 species.
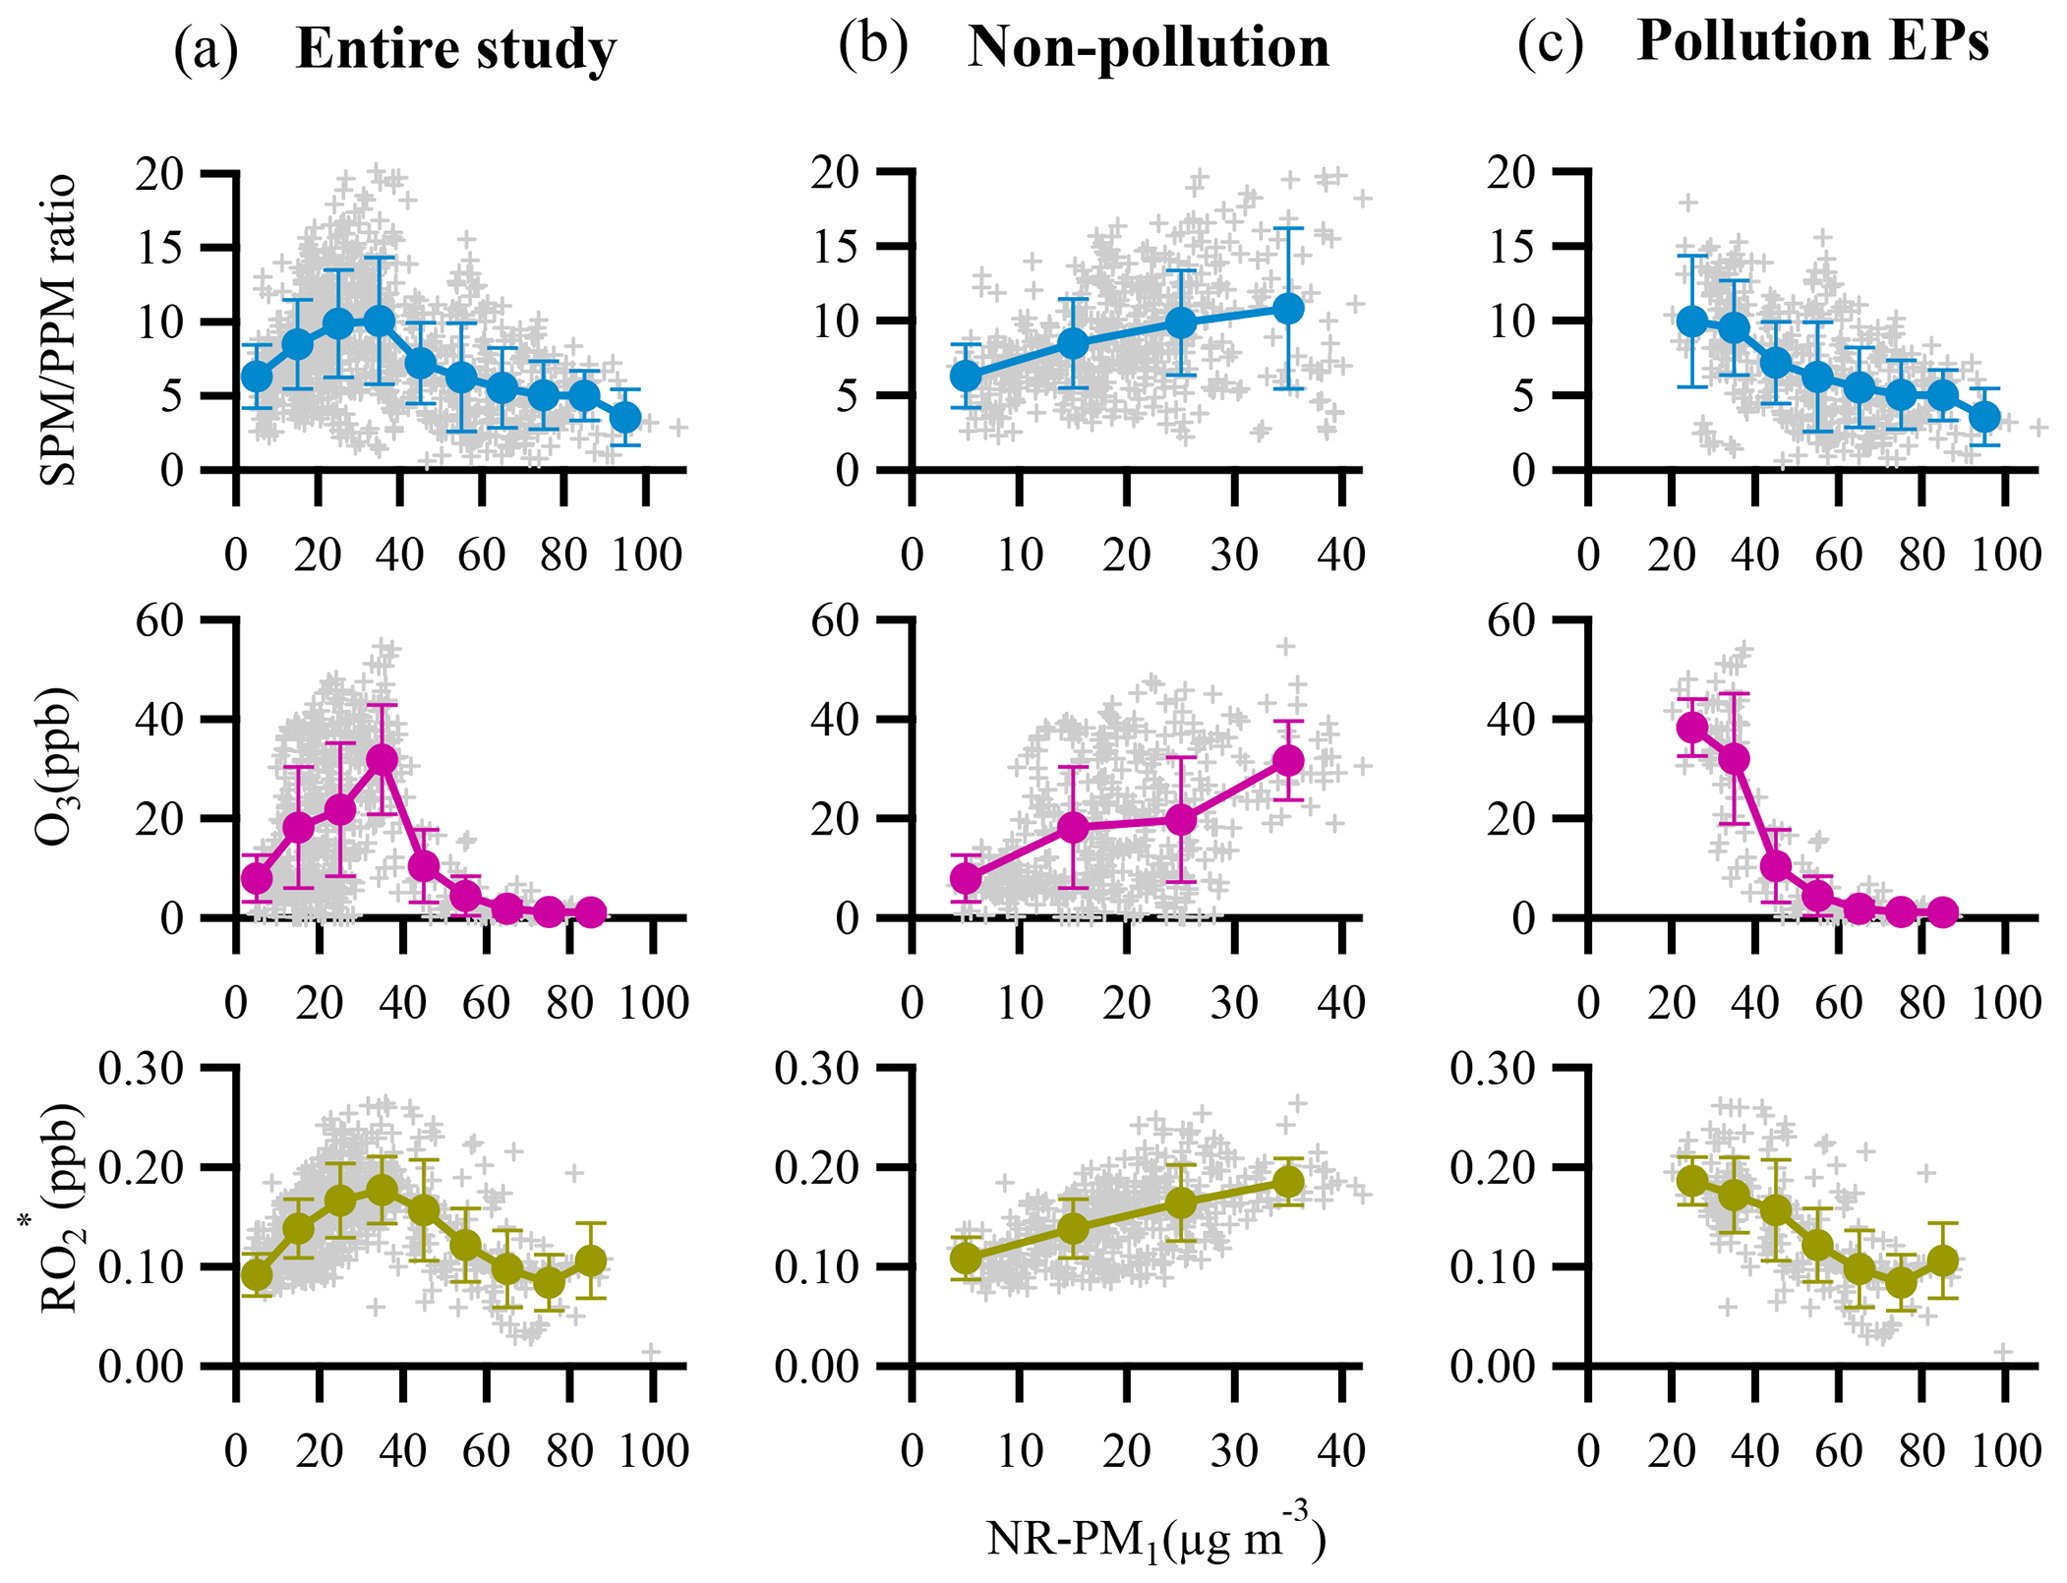
Figure 8Dependences of SPM∕PPM ratio, concentrations of the atmospheric oxidants (O3 and ) on NR-PM1 mass loading for (a) entire study, (b) non-pollution period, and (c) pollution EPs. The binned data are also presented as solid circles with an interval of 10 µg m−3 NR-PM1. The error bars are standard deviations.
3.5 Oxidation degree and peroxy radical tracer
3.5.1 Oxidation degree
Oxidation degree represents the extent to which aerosols (OA and SOA) are oxidized. Figure 9 depicts locations of both OA and SOA from this study in f44∕f43 space. The triangle area (enclosed by two black dashed lines and the f43 axis) for ambient OOA (SOA) was defined by Ng et al. (2010), and results from several laboratory studies with or without aerosol seeds (Bahreini et al., 2005; Liggio et al., 2005; Liggio and Li, 2006; Weitkamp et al., 2007) are also shown for comparison. The f44 and f43 for each SOA point were calculated through an algorithm reported in Canonaco et al. (2015). Most of OA samples in this study were located inside the triangle area, indicating that OA is mainly composed of SOA, which was consistent with the finding from ME-2 analyses; that is, SOA contributes about 70 % to total OA. Interestingly, SOA points in f44∕f43 space showed a strong linear trend that f44 increased with decreasing f43, leading to a large span of f44 and f43 in SOA which then requires more than one SOA factor to explain such a large variation. This result quite differs from some other studies in northern China where usually only one SOA factor was deconvolved (Sun et al., 2012, 2013; Huang et al., 2019). The substantial differences in SOA factorization between Guangzhou and other cities in northern China can be likely attributed to a much higher oxidative atmosphere in Guangzhou. In fact, a previous study has shown that the second highest OH concentration was observed in the PRD region around the world (Rohrer et al., 2014). In addition, the majority of SOA points were well distributed around the connection line of SVOOA and LVOOA (unimodal residual), indicating that SOA points were well captured by the ME-2 engine in our study (Canonaco et al., 2015). Thus, the deconvolution of SVOOA and LVOOA in this study well represented the observed large variation in f44 and f43 for SOA in Guangzhou.
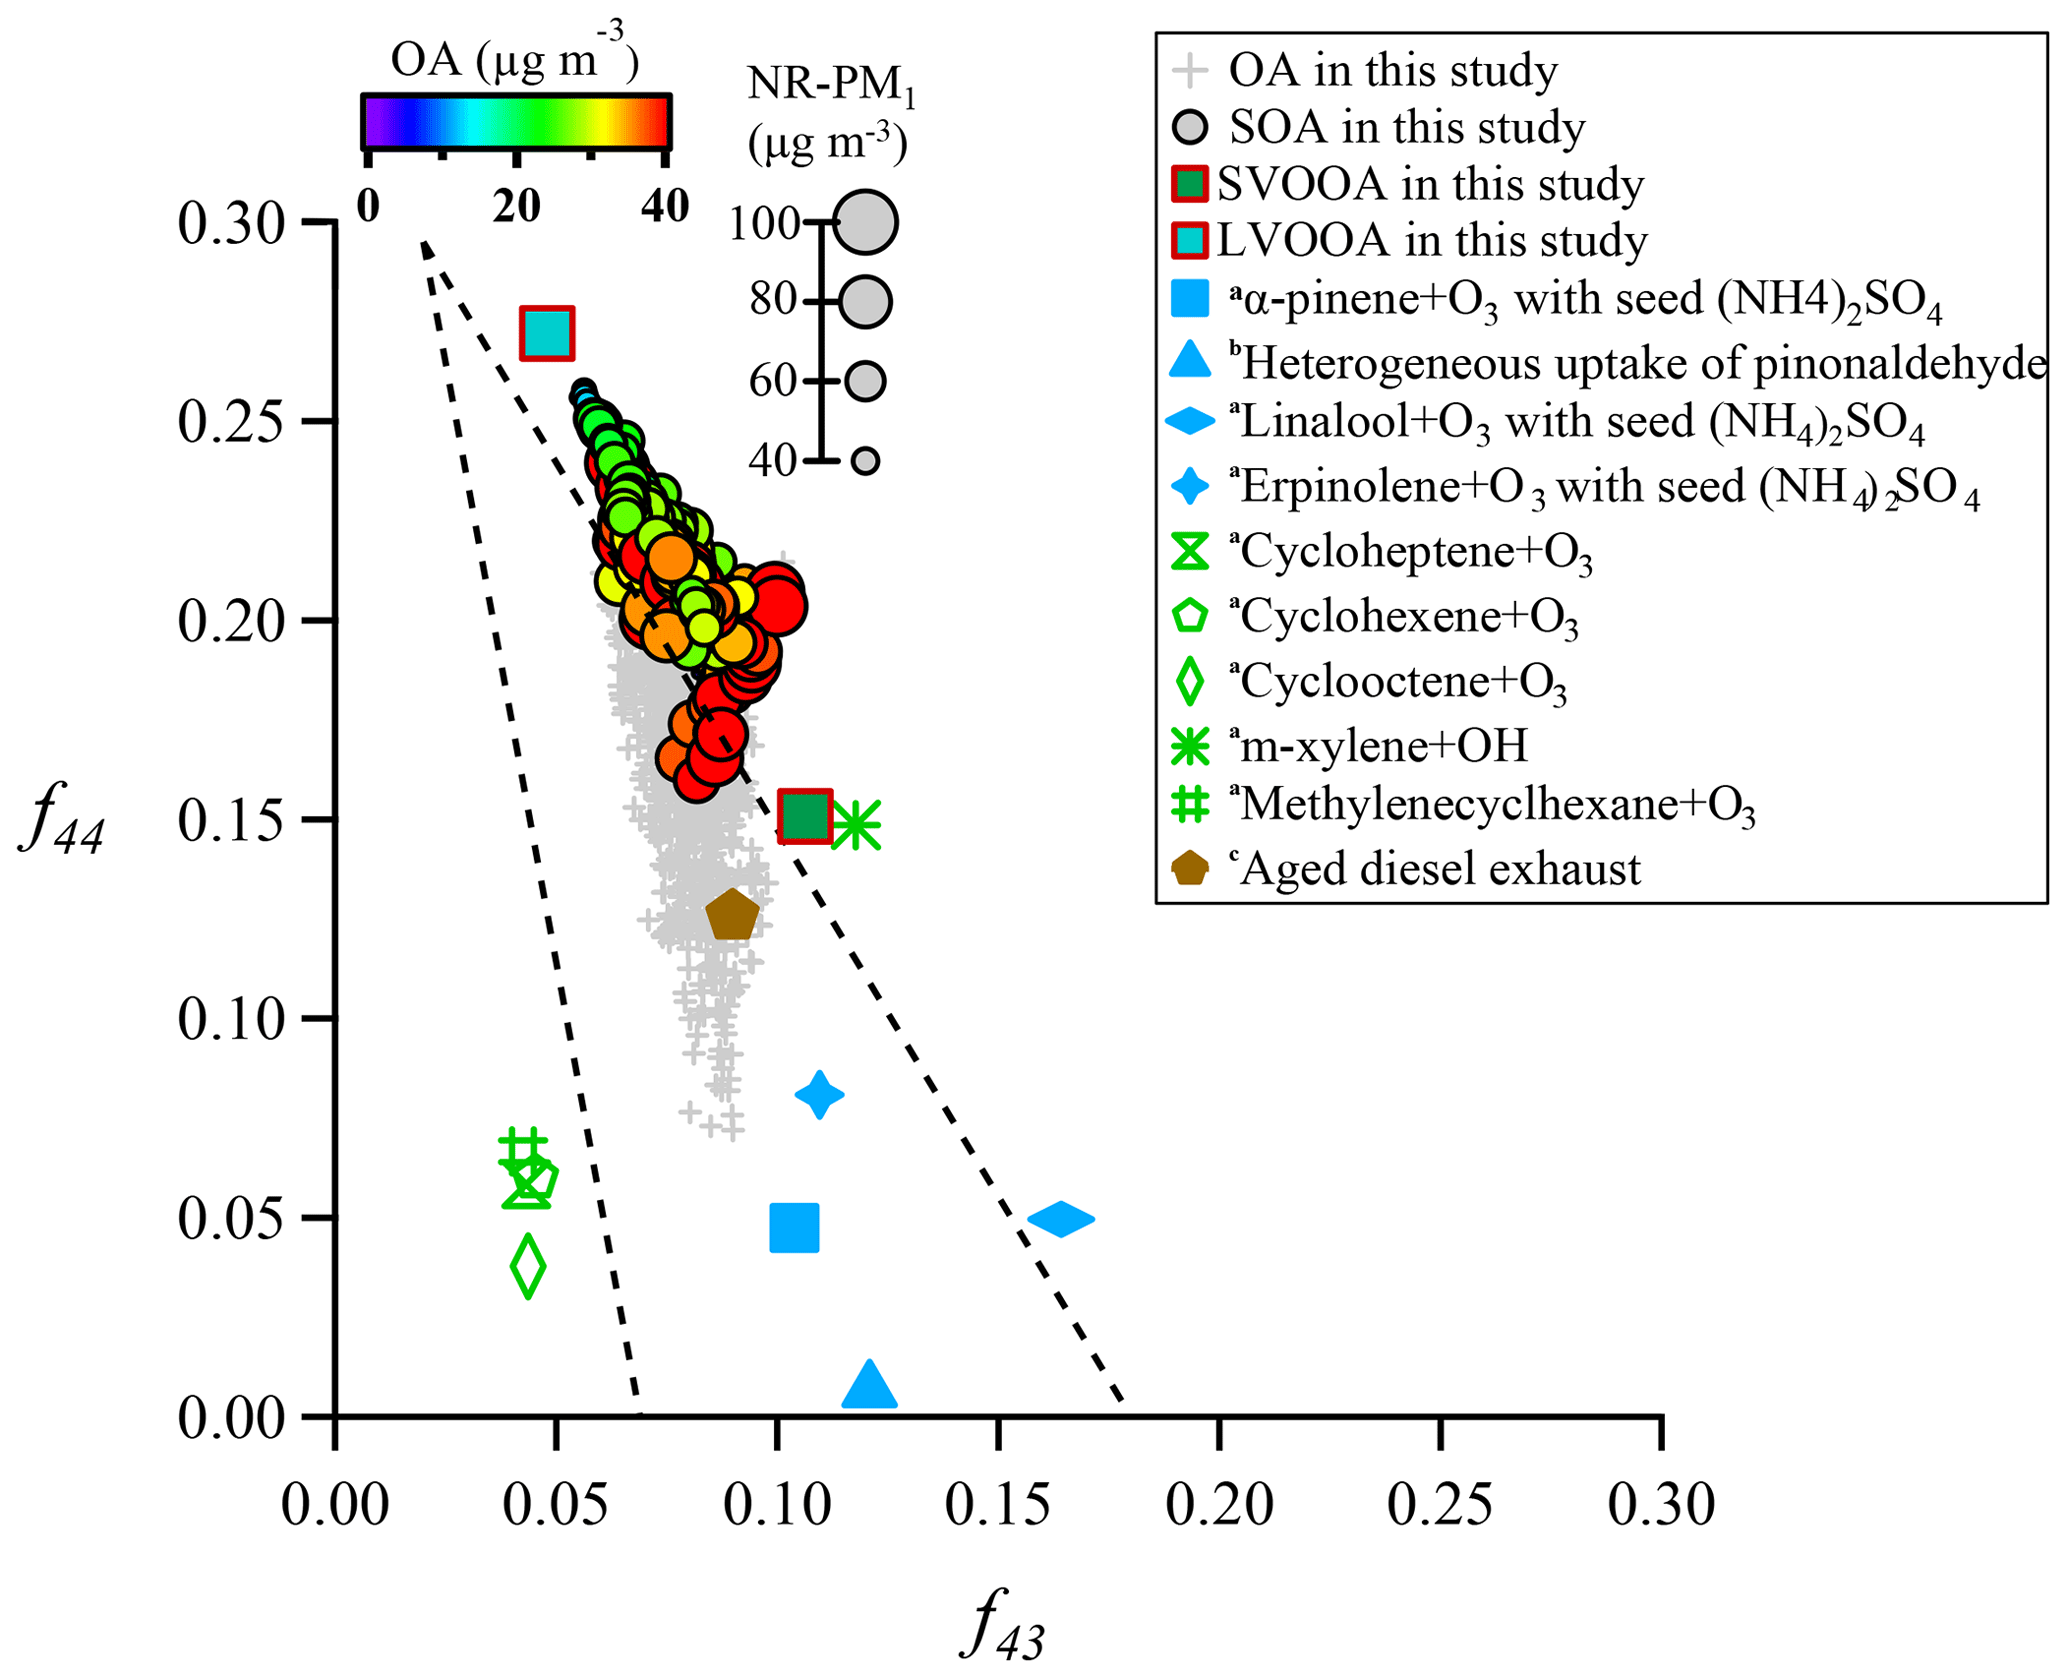
Figure 9Plot of f44 vs. f43 for this study, along with several laboratory studies (a Bahreini et al., 2005; b Liggio et al., 2005; c Weitkamp et al., 2007). SOA is color-coded by OA mass concentration, and the size of a circle is proportional to the corresponding NR-PM1 mass concentration. The triangle area (enclosed by two black dashed lines and the f43 axis) for ambient OOA (SOA) was defined by Ng et al. (2010).
Most SOA points were located close to the right side of the triangle, which was quite different from the OA points. Interestingly, the shape of SOA points in f44∕f43 space formed roughly a tilted triangle, which means both average values and variation ranges of f43 remarkably decreased with increasing f44.The triangle suggests that aging processes result in substantially similar OOA components regardless of their original precursors (Ng et al., 2010). The f44 values of SOA in this study were much higher than those of SOA generated in a laboratory, which should be attributed to limited residence time in the chamber or much higher mass loadings of laboratory-produced aerosols which facilitate gas-to-particle partitioning of semi-volatile organic compounds (SVOCs) and heterogeneous reactions (Liggio and Li, 2006; Shilling et al., 2009; Ng et al., 2010; Ziemann and Atkinson, 2012). Figure 9 also shows that the f44 and f43 values of SOA generated from laboratory m-xylene oxidation and from aged diesel exhaust were closest to those of the SOA and modeled SVOOA from this study, implying that traffic emissions (in particular from diesel combustion) and aromatic compounds are likely precursors for SOA in Guangzhou. This result also agrees with numerous studies conducted in urban areas (Lee et al., 2015; C. Sun et al., 2016; Qin et al., 2017).
3.5.2 Peroxy radical tracer
Here we introduce the total peroxy radicals as a reference tracer to discuss both daytime and nocturnal SOA formation (Fig. 10). Figure 10 shows the variations in SOA concentration with concentration under different scenarios (non-pollution daytime period, pollution daytime EPs, non-pollution nighttime period, and pollution nighttime EPs). The SOA concentration increased with the concentration for both non-pollution daytime and nighttime periods with both moderate correlation coefficients (R2=0.41), indicating that formation and growth of SOA could be attributed to photochemical oxidation during non-pollution daytime while nocturnal gas-phase oxidation of VOCs led to SOA accumulation during non-pollution nighttime. Thus, it can be concluded that gas-phase oxidation was responsible for SOA formation during non-pollution periods. Meanwhile, SOA oxidation degree, represented by f44 in SOA, increased in general with increasing SOA concentration during non-pollution periods, implying that a higher oxidative condition simultaneously led to generation of SOA and conversion of SVOOA to LVOOA (Fig. 7b). In contrast to the good correlations between SOA and concentrations during non-pollution periods, such correlations were not seen during the pollution EPs for both daytime and nighttime scenarios (Fig. 10); instead, an opposite trend that f44 in SOA decreased with an increase in SOA concentration was observed (Fig. 10c–d). These results imply that other mechanisms besides gas-phase oxidation were responsible for the formation of SOA that is less oxidized during pollution EPs. In addition, correlations between SVOOA (LVOOA) and RO2 were explored by plotting dependence of SVOOA (LVOOA) concentrations on concentration during non-pollution periods and pollution periods (Fig. S15). The results show better correlations and larger slope for LVOOA vs. than for SVOOA vs. during non-pollution periods. In contrast, neither LVOOA nor SVOOA was correlated to during pollution EPs.

Figure 10SOA concentration as a function of concentration during different scenarios (non-pollution daytime period, pollution daytime EPs, non-pollution nighttime period, and pollution nighttime EPs). SOA concentrations are color-coded by f44 in SOA. All the regressions are orthogonally linear.
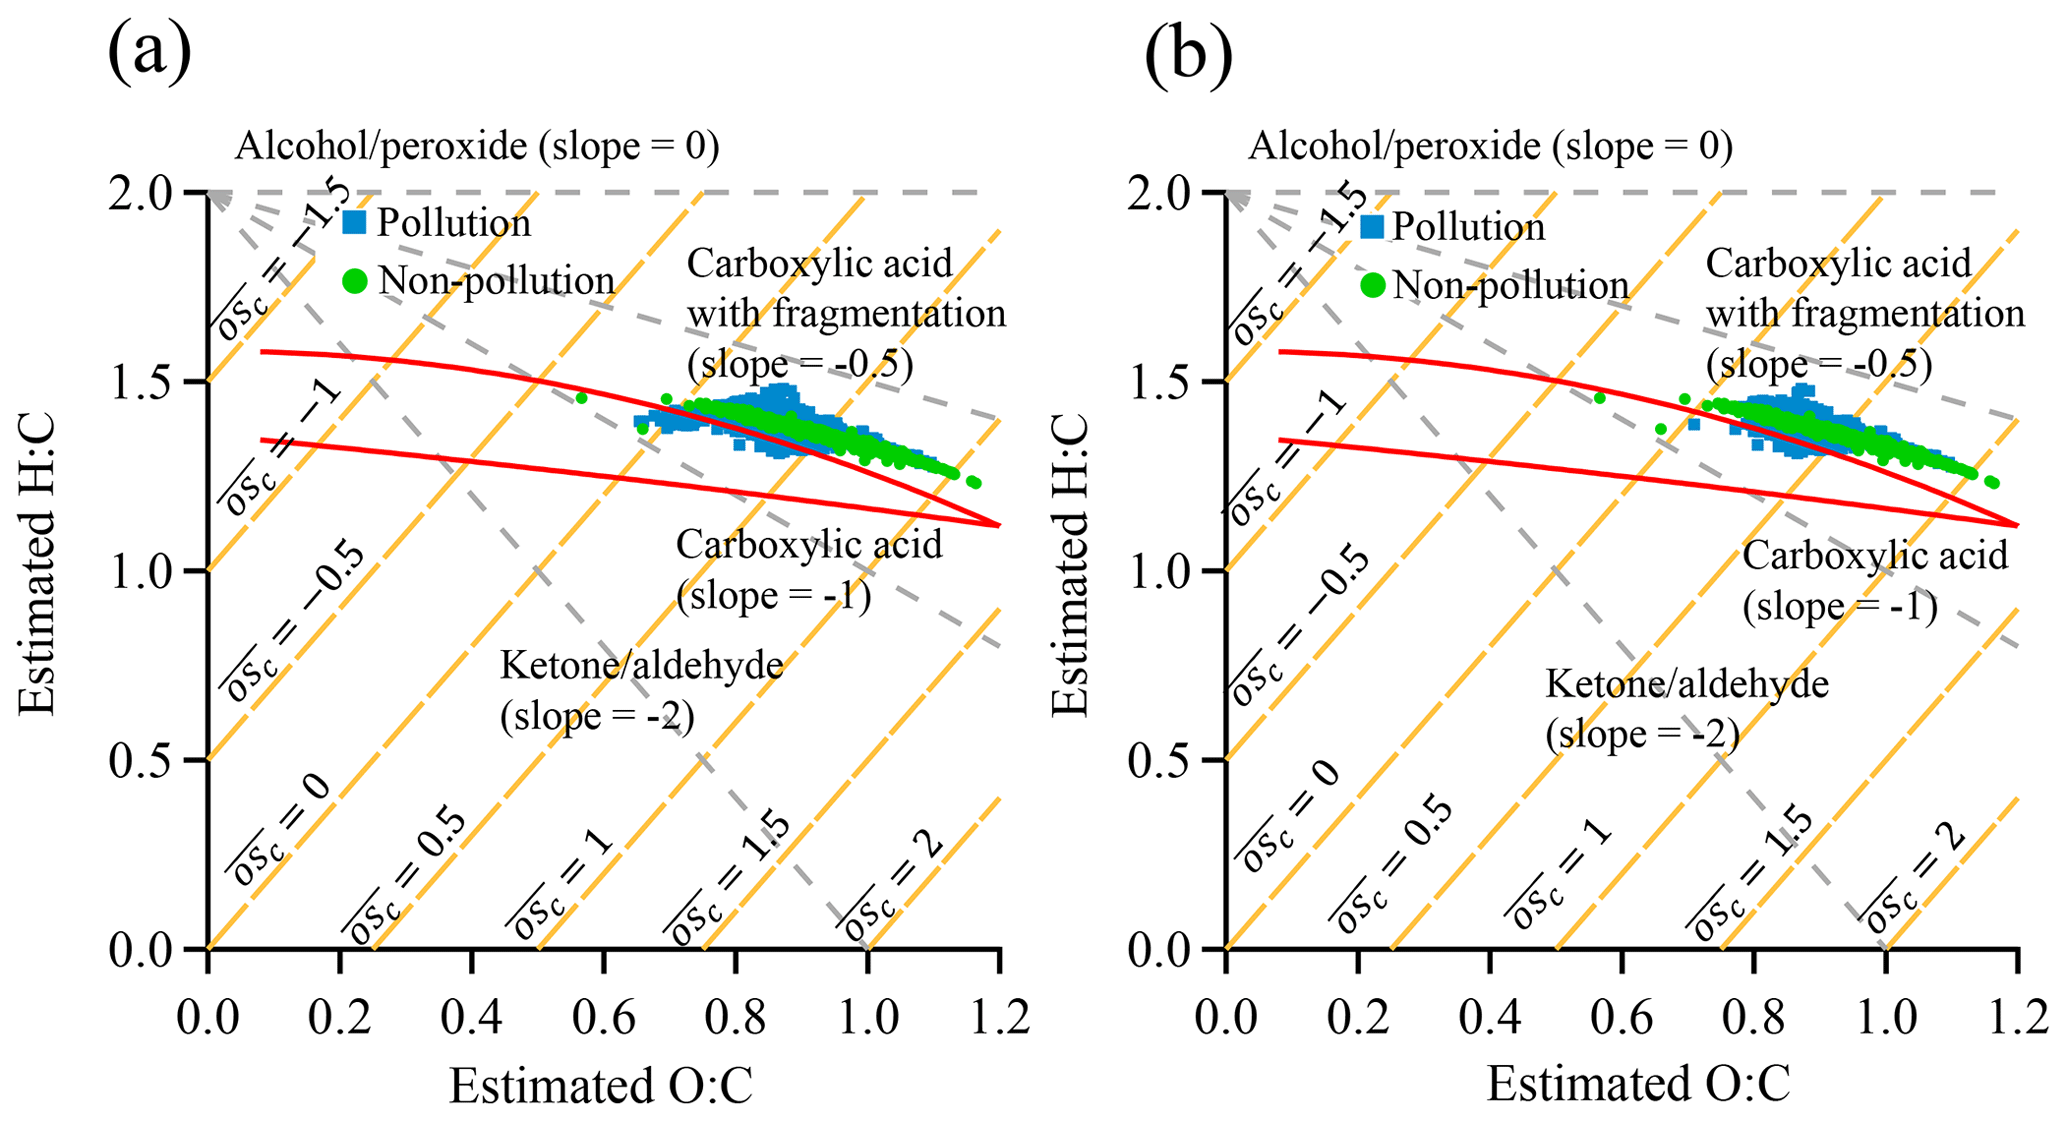
Figure 11Plot of estimated H∕C ratio as a function of estimated O∕C ratio for SOA in the van Krevelen diagram: (a) non-pollution vs. pollution EPs; (b) non-pollution vs. pollution EPs with an overlapped NOx concentration range during the two periods. The area enclosed by the two red boundary lines was defined for ambient OOA components in Ng et al. (2011a).
We further investigate the distinctly different mechanisms for SOA formation between non-pollution and pollution EPs by plotting the estimated H∕C ratio as a function of O∕C ratio in the van Krevelen diagram (Fig. 11). The O∕C and H∕C ratios were estimated from f43 and f44, which were proposed by Aiken et al. (2008) and Ng et al. (2011a), respectively. Similar diagrams based on ACSM unit mass resolution data were reported in previous studies (Brito et al., 2014; Reece et al., 2017; Saha et al., 2018). The area enclosed by the two red boundary lines was defined for ambient OOA components in Ng et al. (2011a). Our data points were slightly outside of this area and were further shifted to the upper right corner of the plot. Similar differences from other ambient or laboratory measurements were also reported in previous studies (Budisulistiorini et al., 2018; Saha et al., 2018), which were attributed to different precursors emitted or aging processes. As shown in Fig. 11a, the H∕C ratio is linearly correlated with the O∕C ratio and is confined into a narrow belt during non-pollution periods, indicating the precursors, mechanism, and chemical components of SOA are likely similar (Ng et al., 2010, 2011a). Although the H∕C ratio follows similar trends with O∕C ratio during pollution periods, the shape is much broader with respect to the H∕C ratio, especially in the middle portion of the O∕C ratio, strongly indicating that more diverse components in SOA are present surrounding the measurement site in Guangzhou. A wider range of H∕C ratio during pollution EPs implies more diverse precursor sources and (or) different mechanisms which lead to formation of SOA components with highly variable H∕C ratios (Ng et al., 2010, 2011a). Although we cannot totally rule out the possibility of dramatic changes in the emission sources, it is unlikely for those changes to occur within a month of the measurement period. Hence it is more likely that the formation mechanisms during non-pollution and pollution periods are distinctly different. Here we propose the two most possible different mechanisms of SOA formation during pollution EPs: (1) gas-phase oxidation under enhanced NOx concentration which leads to dramatically different SOA components from these under lower NOx concentration (Ziemann and Atkinson, 2012); (2) other mechanisms such as additional heterogeneous/multiphase reactions from dramatic increases in PM mass loading and hence more available particle surfaces or volumes for reactions. We replot estimated H∕C ratio vs. estimated O∕C ratio in the van Krevelen diagram with an overlapped NOx concentration range during the two periods to remove the enhanced NOx effects (Fig. 11b). Similar patterns were obtained, highlighting the possibility of significant heterogeneous/multiphase reactions in the pollution EPs.
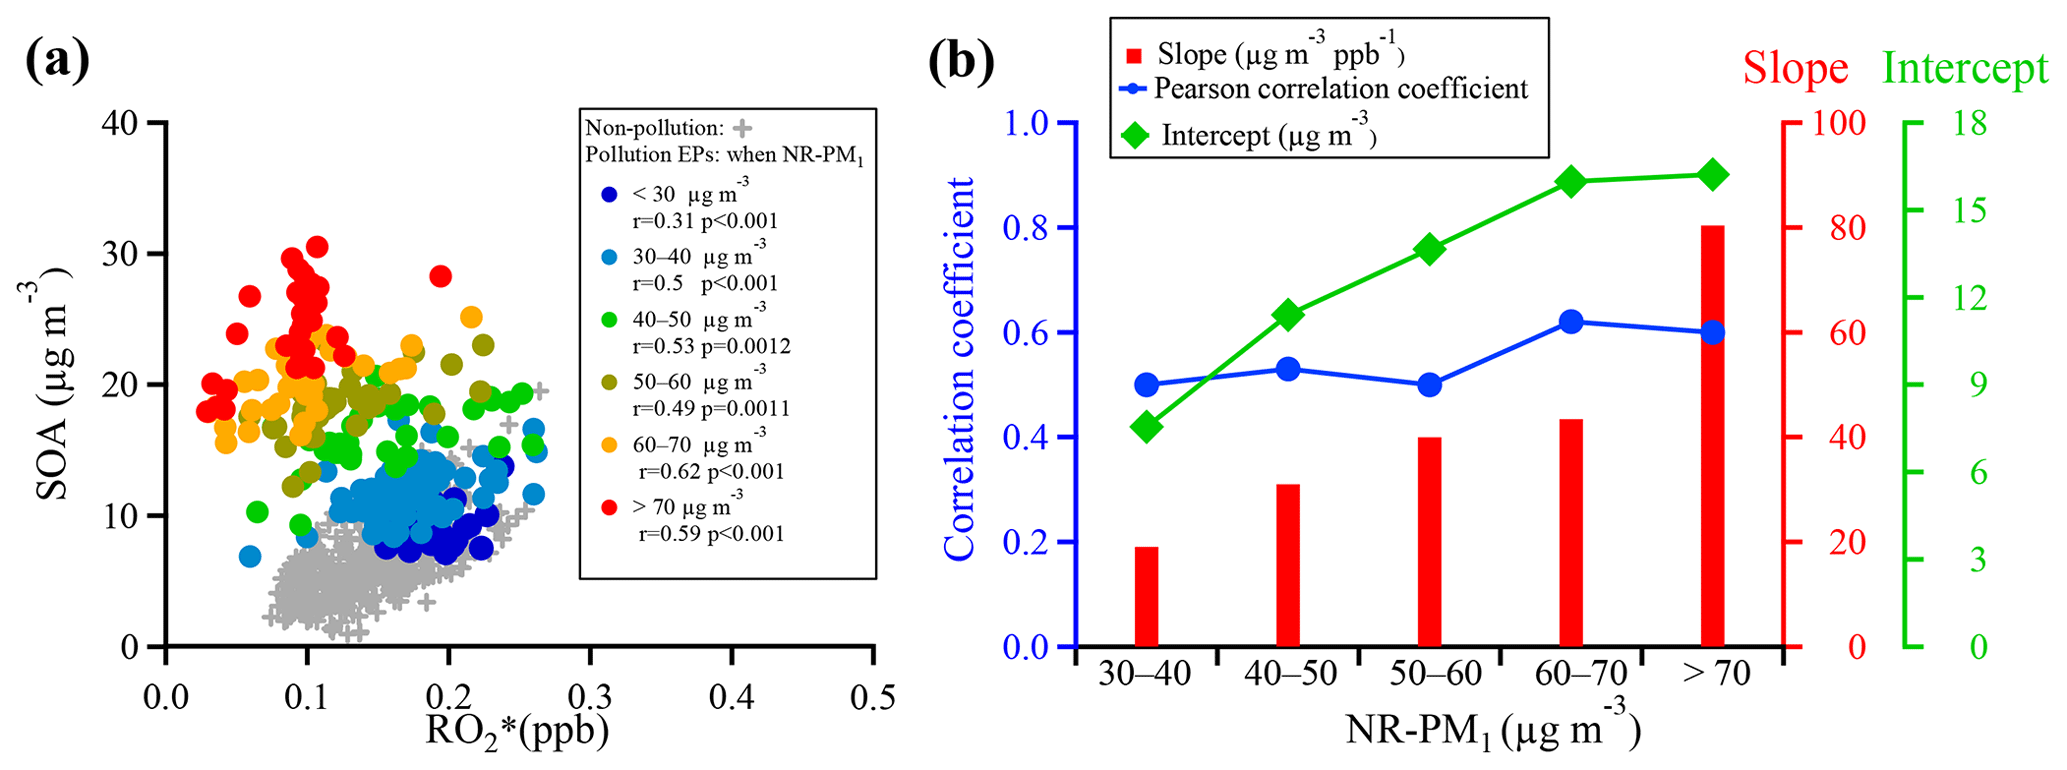
Figure 12(a) Scatter plots of SOA and during pollution EPs at different NR-PM1 mass concentration segments, and (b) correlation coefficients, slopes, and intercepts of linear regressions between SOA and for NR-PM1 mass concentration segments ranging from 30–40 to >70 µg m−3. The regressions are orthogonally linear, and all correlations of the concentration segments were statistically significant (p value <0.01; see detailed statistical information in Table S3).
To further explore mechanisms that can explain SOA formation during pollution EPs, a plot of SOA concentration as a function of concentration for segmental NR-PM1 mass concentrations is shown in Fig. 12. A total of six segments of concentrations were set, with concentrations smaller than 30 and larger than 70 up to about 110 µg m−3 being the lowest and highest segments, respectively and with an interval of 10 µg m−3 between 30 and 70 µg m−3 (Fig. 12a). For comparison, dependence of SOA concentration on concentration during non-pollution periods is also included in Fig. 12. As discussed above, the overall correlation between SOA and concentrations was poor without a clear trend between the two quantities (Fig. 10c–d). However, they were reasonably correlated and showed the reasonable trend that SOA concentration increased with increasing concentration in all segments except for the lowest one, suggesting that gas-phase oxidation still played an important role in SOA formation. Poor correlation between SOA and concentrations in the lowest segment might be due in part to substantial scattering of the data. Under the same concentration, interestingly, more SOA was formed with increasing NR-PM1 concentration. Here, for simplicity, we define that the slope and intercept of linear regression between SOA and concentrations in each segment when NR-PM1 ranged from 30–40 to >70 µg m−3 represented, respectively, SOA formed due to and SOA contributed from other pathways. It is found that substantial intercept values were obtained from the linear regressions during pollution EPs, while they approached almost zero during non-pollution periods. Meanwhile, these intercepts increased from 7.5 to 16.2 µg m−3 when NR-PM1 mass loading increased from 30–40 to >70 µg m−3. Thus, the exact pathways implied by these significant intercepts could not be identified from this study due to obviously insufficient measurement data. They are most likely attributed to heterogeneous and/or multiphase reactions on particle surfaces or inside particles.
A field campaign employing a ToF-ACSM for measurements of NR-PM1 chemical composition was conducted from 20 November 2017 to 5 January 2018 at an urban site in Guangzhou, China. The reliability of the ToF-ACSM was confirmed by the good correlation between mass concentrations of NR-PM1 measured by this instrument and those of PM2.5 and PM1.1 measured from other filter-based methods. Chemical composition of NR-PM1 at this site was dominated by organics, followed by sulfate, nitrate, and ammonium, and only an insignificant fraction (1 %–2 %) of chlorine was measured. We classified five pollution episodes (EPs) according to mass concentration of NR-PM1. Mass fraction of organics was higher during pollution EPs than during non-pollution periods, corresponding to a decrease and an increase in sulfate fraction, respectively, for the two periods. Our results together with other previous studies show increasing SOA∕OA mass concentration ratio across China from the north to the south.
Positive matrix factorization (PMF) with the multilinear engine (ME-2) algorithm was employed to deconvolve OA into four factors including hydrocarbon-like OA (HOA, 12 %), cooking OA (COA, 18 %), semi-volatile oxygenated OA (SVOOA, 30 %), and low-volatility oxygenated OA (LVOOA, 40 %) according to the mass spectra acquired by the ToF-ACSM during the study. One primary OA, HOA, was found to originate from heavy-duty vehicle (HDV) emissions after midnight when those vehicles are allowed to enter urban Guangzhou according to the traffic regulation. Another primary OA, COA, was found to be significantly contributed by nocturnal cooking activities during pollution EPs. Those activities were extended during festival celebrations, leading to an obviously delayed peak concentration for COA. Both cooking and traffic emissions contributed significantly to nocturnal PM accumulation because they emitted not only primary aerosols (COA and HOA) but also substantial amounts of precursors for SOA or nitrate. Concentrations of SVOOA and nitrate were correlated well with traffic tracers (i.e., CO, HOA, and NOx) during the pollution EPs, suggesting that SVOOA and nitrate were significantly contributed from local traffic emissions under stagnant meteorological conditions and that they originated from shared precursor sources.
Concentrations of HOA, COA, nitrate, and SVOOA showed much more pronounced diurnal variation during pollution EPs since all four species were largely influenced by local anthropogenic emission under stagnant conditions. For comparison, both sulfate and LVOOA showed little diurnal variations during both non-pollution periods and pollution EPs as they were contributed by regional pollutants and were barely influenced by local anthropogenic emissions. In addition, nocturnal concentrations of both O3 and during pollution EPs were lower than those during non-pollution periods, implying that both O3 and could serve as important nocturnal oxidants during pollution EPs. Chemical evolution of NR-PM1 suggests that different intrinsic mechanisms were responsible for NR-PM1 accumulation between pollution EPs and non-pollution periods. During non-pollution periods, the SPM∕PPM ratio increased with increasing concentrations of photochemical products (i.e., O3 and ) and NR-PM1 concentration, strongly suggesting that secondary processes, especially photochemistry, were the main mechanism for NR-PM1 accumulation. During pollution EPs, the SPM∕PPM ratio, together with concentration of O3 and , was observed to drop with increasing NR-PM1 mass concentration, indicating that production of NR-PM1 was more driven by primary emissions rather than secondary processes. The f44∕f43 space, proposed by Ng et al. (2010), was employed to investigate oxidation degree of OA and SOA, and the results suggested that two OOA factors were needed to cover a wide range of f44 and f43 in SOA in Guangzhou. Furthermore, we conclude that traffic-emitted VOCs and aromatic compounds were most likely SOA precursors in Guangzhou by comparing SOA from our measurements with those from other laboratory studies.
Peroxy radicals were measured in this study and were used as a tracer for gas-phase oxidation to explore SOA formation during both daytime and nighttime, an advantage over Ox which can only be used as an indicator of daytime photochemistry in addition to significant interference by directly emitted NO2, especially in urban areas. During non-pollution periods, SOA concentration increased with concentration for both daytime and nighttime and we conclude that formation and growth of SOA could be attributed to photochemical oxidation during daytime while nocturnal gas-phase oxidation of VOCs led to SOA accumulation during nighttime. We also found that SOA oxidation degree increased in general with increasing SOA concentrations, implying that a higher oxidation condition simultaneously led to generation of SOA and conversion of SVOOA to LVOOA. During pollution EPs, however, an overall opposite trend was observed; that is, f44 in SOA decreased with an increase in SOA concentration. In addition, the overall correlations between SOA and concentrations were poor for both daytime and nighttime. The reasons for the above poor correlations are attributed to other mechanisms besides gas-phase oxidation which are responsible for SOA formation during pollution EPs. Possible mechanisms were explored by dividing PM1 mass loadings into six segments, and a linear regression in each segment was made between SOA and concentrations. The results showed that individual correlations were reasonably good except for the lowest segment due to data scattering, indicating that gas-phase oxidation still plays an important role. Values of slopes from linear regressions of those reasonable correlations were then found to increase with increasing NR-PM1 mass loading, suggesting that more gas-phase oxidation products of VOCs were partitioned into particles under high PM mass loading. Furthermore, substantial intercept values were found from the above linear regressions in contrast to almost zero intercept for the non-pollution period, strongly suggesting that other mechanisms besides gas-phase oxidation contributed significantly to SOA formation. We speculate that those other mechanisms are most likely heterogeneous and/or multiphase reactions.
All the data presented are available from the corresponding author upon reasonable request.
The supplement related to this article is available online at: https://doi.org/10.5194/acp-20-7595-2020-supplement.
SZ and XuW designed this study. SZ, JG, MC, WZ, CY, XX, and WS conducted the experiments. JG, SZ, and JZ wrote the paper. YS, WH, YH, ZZ, PC, QF, JH, SF, and XiW were involved in the data analysis and scientific discussions of the paper.
The authors declare that they have no conflict of interest.
This article is part of the special issue “Multiphase chemistry of secondary aerosol formation under severe haze”. It is not associated with a conference.
This work was funded by the National Key Research and Development Program of China (grant nos. 2016YFC0202205, 2017YFC0210104), the National Natural Science Foundation of China (grant nos. 41875152, 91644225, 21577177), Science and Technology Program of Guangdong Province (Science and Technology Innovation Platform Category, grant no. 2019B121201002), and the National Natural Science Foundation as a key project (grant nos. 41530641, 41630422). Jun Zhao acknowledges funding support from the “111 plan” project of China (grant no. B17049), Scientific and Technological Innovation Team Project of Guangzhou Joint Research Center of Atmospheric Sciences, China Meteorological Administration (grant no. 201704). The authors thank Xinhui Bi and Jingjing Feng for their support in the field study.
This research has been supported by the National Key Research and Development Program of China (grant nos. 2016YFC0202205, 2017YFC0210104), the National Natural Science Foundation of China (grant nos. 41875152, 91644225, 21577177), the Science and Technology Program of Guangdong Province (Science and Technology Innovation Platform Category, no. 2019B121201002), the National Science Fund for Distinguished Young Scholars (grant no. 4142502), the National Natural Science Foundation as a key project (grant nos. 41530641, 41630422), the “111 plan” project of China (grant no. B17049), and the Scientific and Technological Innovation Team Project of Guangzhou Joint Research Center of Atmospheric Sciences, China Meteorological Administration (grant no. 201704).
This paper was edited by Jian Wang and reviewed by two anonymous referees.
Aiken, A. C., DeCarlo, P. F., and Jimenez, J. L.: Elemental Analysis of Organic Species with Electron Ionization High-Resolution Mass Spectrometry, Anal. Chem., 79, 8350–8358, https://doi.org/10.1021/ac071150w, 2007.
Aiken, A. C., DeCarlo, P. F., Kroll, J. H., Worsnop, D. R., Huffman, J. A., Docherty, K. S., Ulbrich, I. M., Mohr, C., Kimmel, J. R., Sueper, D., Sun, Y., Zhang, Q., Trimborn, A., Northway, M., Ziemann, P. J., Canagaratna, M. R., Onasch, T. B., Alfarra, M. R., Prevot, A. S. H., Dommen, J., Duplissy, J., Metzger, A., Baltensperger, U., and Jimenez, J. L.: O∕C and OM/OC ratios of primary, secondary, and ambient organic aerosols with high-resolution time-of-flight aerosol mass spectrometry, Environ. Sci. Technol., 42, 4478–4485, 2008.
Aiken, A. C., Salcedo, D., Cubison, M. J., Huffman, J. A., DeCarlo, P. F., Ulbrich, I. M., Docherty, K. S., Sueper, D., Kimmel, J. R., Worsnop, D. R., Trimborn, A., Northway, M., Stone, E. A., Schauer, J. J., Volkamer, R. M., Fortner, E., de Foy, B., Wang, J., Laskin, A., Shutthanandan, V., Zheng, J., Zhang, R., Gaffney, J., Marley, N. A., Paredes-Miranda, G., Arnott, W. P., Molina, L. T., Sosa, G., and Jimenez, J. L.: Mexico City aerosol analysis during MILAGRO using high resolution aerosol mass spectrometry at the urban supersite (T0) – Part 1: Fine particle composition and organic source apportionment, Atmos. Chem. Phys., 9, 6633–6653, https://doi.org/10.5194/acp-9-6633-2009, 2009.
Allan, J. D., Delia, A. E., Coe, H., Bower, K. N., Alfarra, M. R., Jimenez, J. L., Middlebrook, A. M., Drewnick, F., Onasch, T. B., Canagaratna, M. R., Jayne, J. T., and Worsnop, D. R.: A generalised method for the extraction of chemically resolved mass spectra from Aerodyne aerosol mass spectrometer data, J. Aerosol. Sci., 35, 909–922, https://doi.org/10.1016/j.jaerosci.2004.02.007, 2004.
Allan, J. D., Williams, P. I., Morgan, W. T., Martin, C. L., Flynn, M. J., Lee, J., Nemitz, E., Phillips, G. J., Gallagher, M. W., and Coe, H.: Contributions from transport, solid fuel burning and cooking to primary organic aerosols in two UK cities, Atmos. Chem. Phys., 10, 647–668, https://doi.org/10.5194/acp-10-647-2010, 2010.
Bahreini, R., Keywood, M. D., Ng, N. L., Varutbangkul, V., Gao, S., Flagan, R. C., Seinfeld, J. H., Worsnop, D. R., and Jimenez, J. L.: Measurements of Secondary Organic Aerosol from Oxidation of Cycloalkenes, Terpenes, and m-Xylene Using an Aerodyne Aerosol Mass Spectrometer, Environ. Sci. Technol., 39, 5674–5688, https://doi.org/10.1021/es048061a, 2005.
Bian, Y., Huang, Z., Ou, J., Zhong, Z., Xu, Y., Zhang, Z., Xiao, X., Ye, X., Wu, Y., Yin, X., Li, C., Chen, L., Shao, M., and Zheng, J.: Evolution of anthropogenic air pollutant emissions in Guangdong Province, China, from 2006 to 2015, Atmos. Chem. Phys., 19, 11701–11719, https://doi.org/10.5194/acp-19-11701-2019, 2019.
Bressi, M., Cavalli, F., Belis, C. A., Putaud, J.-P., Fröhlich, R., Martins dos Santos, S., Petralia, E., Prévôt, A. S. H., Berico, M., Malaguti, A., and Canonaco, F.: Variations in the chemical composition of the submicron aerosol and in the sources of the organic fraction at a regional background site of the Po Valley (Italy), Atmos. Chem. Phys., 16, 12875–12896, https://doi.org/10.5194/acp-16-12875-2016, 2016.
Brito, J., Rizzo, L. V., Morgan, W. T., Coe, H., Johnson, B., Haywood, J., Longo, K., Freitas, S., Andreae, M. O., and Artaxo, P.: Ground-based aerosol characterization during the South American Biomass Burning Analysis (SAMBBA) field experiment, Atmos. Chem. Phys., 14, 12069–12083, https://doi.org/10.5194/acp-14-12069-2014, 2014.
Budisulistiorini, S. H., Riva, M., Williams, M., Miyakawa, T., Chen, J., Itoh, M., Surratt, J. D., and Kuwata, M.: Dominant contribution of oxygenated organic aerosol to haze particles from real-time observation in Singapore during an Indonesian wildfire event in 2015, Atmos. Chem. Phys., 18, 16481–16498, https://doi.org/10.5194/acp-18-16481-2018, 2018.
Canagaratna, M. R., Jayne, J. T., Jimenez, J. L., Allan, J. D., Alfarra, M. R., Zhang, Q., Onasch, T. B., Drewnick, F., Coe, H., Middlebrook, A., Delia, A., Williams, L. R., Trimborn, A. M., Northway, M. J., DeCarlo, P. F., Kolb, C. E., Davidovits, P., and Worsnop, D. R.: Chemical and microphysical characterization of ambient aerosols with the aerodyne aerosol mass spectrometer, Mass Spectrom. Rev., 26, 185–222, https://doi.org/10.1002/mas.20115, 2007.
Canagaratna, M. R., Jimenez, J. L., Kroll, J. H., Chen, Q., Kessler, S. H., Massoli, P., Hildebrandt Ruiz, L., Fortner, E., Williams, L. R., Wilson, K. R., Surratt, J. D., Donahue, N. M., Jayne, J. T., and Worsnop, D. R.: Elemental ratio measurements of organic compounds using aerosol mass spectrometry: characterization, improved calibration, and implications, Atmos. Chem. Phys., 15, 253–272, https://doi.org/10.5194/acp-15-253-2015, 2015.
Canonaco, F., Slowik, J. G., Baltensperger, U., and Prévôt, A. S. H.: Seasonal differences in oxygenated organic aerosol composition: implications for emissions sources and factor analysis, Atmos. Chem. Phys., 15, 6993–7002, https://doi.org/10.5194/acp-15-6993-2015, 2015.
Chhabra, P. S., Ng, N. L., Canagaratna, M. R., Corrigan, A. L., Russell, L. M., Worsnop, D. R., Flagan, R. C., and Seinfeld, J. H.: Elemental composition and oxidation of chamber organic aerosol, Atmos. Chem. Phys., 11, 8827–8845, https://doi.org/10.5194/acp-11-8827-2011, 2011.
Crippa, M., DeCarlo, P. F., Slowik, J. G., Mohr, C., Heringa, M. F., Chirico, R., Poulain, L., Freutel, F., Sciare, J., Cozic, J., Di Marco, C. F., Elsasser, M., Nicolas, J. B., Marchand, N., Abidi, E., Wiedensohler, A., Drewnick, F., Schneider, J., Borrmann, S., Nemitz, E., Zimmermann, R., Jaffrezo, J.-L., Prévôt, A. S. H., and Baltensperger, U.: Wintertime aerosol chemical composition and source apportionment of the organic fraction in the metropolitan area of Paris, Atmos. Chem. Phys., 13, 961–981, https://doi.org/10.5194/acp-13-961-2013, 2013.
DeCarlo, P. F., Ulbrich, I. M., Crounse, J., de Foy, B., Dunlea, E. J., Aiken, A. C., Knapp, D., Weinheimer, A. J., Campos, T., Wennberg, P. O., and Jimenez, J. L.: Investigation of the sources and processing of organic aerosol over the Central Mexican Plateau from aircraft measurements during MILAGRO, Atmos. Chem. Phys., 10, 5257–5280, https://doi.org/10.5194/acp-10-5257-2010, 2010.
De Haan, D. O., Corrigan, A. L., Tolbert, M. A., Jimenez, J. L., Wood, S. E., and Turley, J. J.: Secondary organic aerosol formation by self-reactions of methylglyoxal and glyoxal in evaporating droplets, Environ. Sci. Technol., 43, 8184–8190, 2009.
Ervens, B., Turpin, B. J., and Weber, R. J.: Secondary organic aerosol formation in cloud droplets and aqueous particles (aqSOA): a review of laboratory, field and model studies, Atmos. Chem. Phys., 11, 11069–11102, https://doi.org/10.5194/acp-11-11069-2011, 2011.
Fang, B., Zhao, W. X., Xu, X. Z., Zhou, J. C., Ma, X., Wang, S., Zhang, W. J., Venables, D. S., and Chen, W. D.: Portable broadband cavity-enhanced spectrometer utilizing Kalman filtering: application to real-time, in situ monitoring of glyoxal and nitrogen dioxide, Opt. Express, 25, 26910–26922, https://doi.org/10.1364/OE.25.026910, 2017.
Fröhlich, R., Cubison, M. J., Slowik, J. G., Bukowiecki, N., Prévôt, A. S. H., Baltensperger, U., Schneider, J., Kimmel, J. R., Gonin, M., Rohner, U., Worsnop, D. R., and Jayne, J. T.: The ToF-ACSM: a portable aerosol chemical speciation monitor with TOFMS detection, Atmos. Meas. Tech., 6, 3225–3241, https://doi.org/10.5194/amt-6-3225-2013, 2013.
Gani, S., Bhandari, S., Seraj, S., Wang, D. S., Patel, K., Soni, P., Arub, Z., Habib, G., Hildebrandt Ruiz, L., and Apte, J. S.: Submicron aerosol composition in the world's most polluted megacity: the Delhi Aerosol Supersite study, Atmos. Chem. Phys., 19, 6843–6859, https://doi.org/10.5194/acp-19-6843-2019, 2019.
Ge, X., Setyan, A., Sun, Y., and Zhang, Q.: Primary and secondary organic aerosols in Fresno, California during wintertime: Results from high resolution aerosol mass spectrometry, J. Geophys. Res., 117, D19301, https://doi.org/10.1029/2012jd018026, 2012.
Griffith, S. M., Hansen, R. F., Dusanter, S., Stevens, P. S., Alaghmand, M., Bertman, S. B., Carroll, M. A., Erickson, M., Galloway, M., Grossberg, N., Hottle, J., Hou, J., Jobson, B. T., Kammrath, A., Keutsch, F. N., Lefer, B. L., Mielke, L. H., O'Brien, A., Shepson, P. B., Thurlow, M., Wallace, W., Zhang, N., and Zhou, X. L.: OH and HO2 radical chemistry during PROPHET 2008 and CABINEX 2009 – Part 1: Measurements and model comparison, Atmos. Chem. Phys., 13, 5403–5423, https://doi.org/10.5194/acp-13-5403-2013, 2013.
He, L. Y., Huang, X. F., Xue, L., Hu, M., Lin, Y., Zheng, J., Zhang, R., and Zhang, Y. H.: Submicron aerosol analysis and organic source apportionment in an urban atmosphere in Pearl River Delta of China using high-resolution aerosol mass spectrometry, J. Geophys. Res., 116, D12304, https://doi.org/10.1029/2010jd014566, 2011.
Herndon, S. C., Onasch, T. B., Wood, E. C., Kroll, J. H., Canagaratna, M. R., Jayne, J. T., Zavala, M. A., Knighton, W. B., Mazzoleni, C., Dubey, M. K., Ulbrich, I. M., Jimenez, J. L., Seila, R., de Gouw, J. A., de Foy, B., Fast, J., Molina, L. T., Kolb, C. E., and Worsnop, D. R.: Correlation of secondary organic aerosol with odd oxygen in Mexico City, Geophys. Res. Lett., 35, L15804, https://doi.org/10.1029/2008gl034058, 2008.
Herrmann, H., Schaefer, T., Tilgner, A., Styler, S. A., Weller, C., Teich, M., and Otto, T.: Tropospheric aqueous-phase chemistry: kinetics, mechanisms, and its coupling to a changing gas phase, Chem. Rev., 115, 4259–4334, https://doi.org/10.1021/cr500447k, 2015.
Hu, W., Hu, M., Hu, W., Jimenez, J. L., Yuan, B., Chen, W., Wang, M., Wu, Y., Chen, C., Wang, Z., Peng, J., Zeng, L., and Shao, M.: Chemical composition, sources and aging process of submicron aerosols in Beijing: contrast between summer and winter, J. Geophys. Res., 121, 1955–1977, https://doi.org/10.1002/2015JD024020, 2016a.
Hu, W., Hu, M., Hu, W.-W., Niu, H., Zheng, J., Wu, Y., Chen, W., Chen, C., Li, L., Shao, M., Xie, S., and Zhang, Y.: Characterization of submicron aerosols influenced by biomass burning at a site in the Sichuan Basin, southwestern China, Atmos. Chem. Phys., 16, 13213–13230, https://doi.org/10.5194/acp-16-13213-2016, 2016b.
Hu, W., Campuzano-Jost, P., Day, D. A., Croteau, P., Canagaratna, M. R., Jayne, J. T., Worsnop, D. R., and Jimenez, J. L.: Evaluation of the new capture vaporizer for aerosol mass spectrometers (AMS) through field studies of inorganic species, Aerosol Sci. Tech., 51, 735–754, https://doi.org/10.1080/02786826.2017.1296104, 2017.
Huang, R.-J., Wang, Y., Cao, J., Lin, C., Duan, J., Chen, Q., Li, Y., Gu, Y., Yan, J., Xu, W., Fröhlich, R., Canonaco, F., Bozzetti, C., Ovadnevaite, J., Ceburnis, D., Canagaratna, M. R., Jayne, J., Worsnop, D. R., El-Haddad, I., Prévôt, A. S. H., and O'Dowd, C. D.: Primary emissions versus secondary formation of fine particulate matter in the most polluted city (Shijiazhuang) in North China, Atmos. Chem. Phys., 19, 2283–2298, https://doi.org/10.5194/acp-19-2283-2019, 2019.
Huang, X.-F., He, L.-Y., Hu, M., Canagaratna, M. R., Kroll, J. H., Ng, N. L., Zhang, Y.-H., Lin, Y., Xue, L., Sun, T.-L., Liu, X.-G., Shao, M., Jayne, J. T., and Worsnop, D. R.: Characterization of submicron aerosols at a rural site in Pearl River Delta of China using an Aerodyne High-Resolution Aerosol Mass Spectrometer, Atmos. Chem. Phys., 11, 1865–1877, https://doi.org/10.5194/acp-11-1865-2011, 2011.
Huang, X.-F., He, L.-Y., Xue, L., Sun, T.-L., Zeng, L.-W., Gong, Z.-H., Hu, M., and Zhu, T.: Highly time-resolved chemical characterization of atmospheric fine particles during 2010 Shanghai World Expo, Atmos. Chem. Phys., 12, 4897–4907, https://doi.org/10.5194/acp-12-4897-2012, 2012.
Ibald-Mulli, A., Wichmann, H. E., Kreyling, W., and Peters, A.: Epidemiological evidence on health effects of ultrafine particles, J. Aerosol Med., 15, 189–201, 2002.
IPCC: Climate Change 2013 – The Physical Science Basis. Working Group I Contribution to the Fifth Assessment Report of the IPCC, edited by: Stocker, T. F., Qin, D., Plattner, G.-K., Tignor, M., Allen, S. K., Boschung, J., Nauels, A., Xia, Y., Bex, V., and Midgley, P. M., Cambridge University Press, Cambridge, UK, 2013.
Jiang, Q., Sun, Y. L., Wang, Z., and Yin, Y.: Aerosol composition and sources during the Chinese Spring Festival: fireworks, secondary aerosol, and holiday effects, Atmos. Chem. Phys., 15, 6023–6034, https://doi.org/10.5194/acp-15-6023-2015, 2015.
Jimenez, J. L., Jayne, J. T., Shi, Q., Kolb, C. E., Worsnop, D. R., Yourshaw, I., Seinfeld, J. H., Flagan, R. C., Zhang, X., and Smith, K. A.: Ambient aerosol sampling using the aerodyne aerosol mass spectrometer, J. Geophys. Res.-Atmos., 108, 8425, https://doi.org/10.1029/2001JD001213, 2003.
Jimenez, J. L., Canagaratna, M. R., Donahue, N. M., Prevot, A. S. H., Zhang, Q., Kroll, J. H., DeCarlo, P. F., Allan, J. D., Coe, H., Ng, N. L., Aiken, A. C., Docherty, K. S., Ulbrich, I. M., Grieshop, A. P., Robinson, A. L., Duplissy, J., Smith, J. D., Wilson, K. R., Lanz, V. A., Hueglin, C., Sun, Y. L., Tian, J., Laaksonen, A., Raatikainen, T., Rautiainen, J., Vaattovaara, P., Ehn, M., Kulmala, M., Tomlinson, J. M., Collins, D. R., Cubison, M. J., Dunlea, J., Huffman, J. A., Onasch, T. B., Alfarra, M. R., Williams, P. I., Bower, K., Kondo, Y., Schneider, J., Drewnick, F., Borrmann, S., Weimer, S., Demerjian, K., Salcedo, D., Cottrell, L., Griffin, R., Takami, A., Miyoshi, T., Hatakeyama, S., Shimono, A., Sun, J. Y., Zhang, Y. M., Dzepina, K., Kimmel, J. R., Sueper, D., Jayne, J. T., Herndon, S. C., Trimborn, A. M., Williams, L. R., Wood, E. C., Middlebrook, A. M., Kolb, C. E., Baltensperger, U., and Worsnop, D. R.: Evolution of Organic Aerosols in the Atmosphere, Science, 326, 1525, https://doi.org/10.1126/science.1180353, 2009.
Kreyling, W. G., Semmler-Behnke, M., and Möller, W.: Ultrafine particle–lung interactions: does size matter?, J. Aerosol Med., 19, 74–83, 2006.
Kroll, J. H. and Seinfeld, J. H.: Chemistry of secondary organic aerosol: Formation and evolution of low-volatility organics in the atmosphere, Atmos. Environ., 42, 3593–3624, https://doi.org/10.1016/j.atmosenv.2008.01.003, 2008.
Lee, B. P., Li, Y. J., Yu, J. Z., Louie, P. K. K., and Chan, C. K.: Characteristics of submicron particulate matter at the urban roadside in downtown Hong Kong-Overview of 4 months of continuous high-resolution aerosol mass spectrometer measurements, J. Geophys. Res., 120, 7040–7058, https://doi.org/10.1002/2015jd023311, 2015.
Lee, B. P., Wang, H., and Chan, C. K.: Diurnal and day-to-day characteristics of ambient particle mass size distributions from HR-ToF-AMS measurements at an urban site and a suburban site in Hong Kong, Atmos. Chem. Phys., 17, 13605–13624, https://doi.org/10.5194/acp-17-13605-2017, 2017.
Levy, H.: Normal Atmosphere: Large Radical and Formaldehyde Concentrations Predicted, Science, 173, 141–143, https://doi.org/10.1126/science.173.3992.141, 1971.
Li, H., Zhang, Q., Zhang, Q., Chen, C., Wang, L., Wei, Z., Zhou, S., Parworth, C., Zheng, B., Canonaco, F., Prévôt, A. S. H., Chen, P., Zhang, H., Wallington, T. J., and He, K.: Wintertime aerosol chemistry and haze evolution in an extremely polluted city of the North China Plain: significant contribution from coal and biomass combustion, Atmos. Chem. Phys., 17, 4751–4768, https://doi.org/10.5194/acp-17-4751-2017, 2017.
Li, Y. J., Lee, B. Y. L., Yu, J. Z., Ng, N. L., and Chan, C. K.: Evaluating the degree of oxygenation of organic aerosol during foggy and hazy days in Hong Kong using high-resolution time-of-flight aerosol mass spectrometry (HR-ToF-AMS), Atmos. Chem. Phys., 13, 8739–8753, https://doi.org/10.5194/acp-13-8739-2013, 2013.
Li, Y. J., Lee, B. P., Su, L., Fung, J. C. H., and Chan, C. K.: Seasonal characteristics of fine particulate matter (PM) based on high-resolution time-of-flight aerosol mass spectrometric (HR-ToF-AMS) measurements at the HKUST Supersite in Hong Kong, Atmos. Chem. Phys., 15, 37–53, https://doi.org/10.5194/acp-15-37-2015, 2015.
Li, Y. J., Sun, Y., Zhang, Q., Li, X., Li, M., Zhou, Z., and Chan, C. K.: Real-time chemical characterization of atmospheric particulate matter in China: A review, Atmos. Environ., 158, 270–304, https://doi.org/10.1016/j.atmosenv.2017.02.027, 2017.
Liggio, J. and Li, S.-M.: Organosulfate formation during the uptake of pinonaldehyde on acidic sulfate aerosols, Geophys. Res. Lett., 33, L13808, https://doi.org/10.1029/2006gl026079, 2006.
Liggio, J., Li, S.-M., and McLaren, R.: Heterogeneous Reactions of Glyoxal on Particulate Matter:? Identification of Acetals and Sulfate Esters, Environ. Sci. Technol., 39, 1532–1541, https://doi.org/10.1021/es048375y, 2005.
Marais, E. A., Jacob, D. J., Jimenez, J. L., Campuzano-Jost, P., Day, D. A., Hu, W., Krechmer, J., Zhu, L., Kim, P. S., Miller, C. C., Fisher, J. A., Travis, K., Yu, K., Hanisco, T. F., Wolfe, G. M., Arkinson, H. L., Pye, H. O. T., Froyd, K. D., Liao, J., and McNeill, V. F.: Aqueous-phase mechanism for secondary organic aerosol formation from isoprene: application to the southeast United States and co-benefit of SO2 emission controls, Atmos. Chem. Phys., 16, 1603–1618, https://doi.org/10.5194/acp-16-1603-2016, 2016.
Matthew, B. M., Middlebrook, A. M., and Onasch, T. B.: Collection Efficiencies in an Aerodyne Aerosol Mass Spectrometer as a Function of Particle Phase for Laboratory Generated Aerosols, Aerosol Sci. Tech., 42, 884–898, https://doi.org/10.1080/02786820802356797, 2008.
McNeill, V. F.: Aqueous organic chemistry in the atmosphere: sources and chemical processing of organic aerosols, Environ. Sci. Technol, 49, 1237–1244, https://doi.org/10.1021/es5043707, 2015.
Middlebrook, A. M., Bahreini, R., Jimenez, J. L., and Canagaratna, M. R.: Evaluation of Composition-Dependent Collection Efficiencies for the Aerodyne Aerosol Mass Spectrometer using Field Data, Aerosol Sci. Tech., 46, 258–271, https://doi.org/10.1080/02786826.2011.620041, 2012.
Mohr, C., DeCarlo, P. F., Heringa, M. F., Chirico, R., Slowik, J. G., Richter, R., Reche, C., Alastuey, A., Querol, X., Seco, R., Peñuelas, J., Jiménez, J. L., Crippa, M., Zimmermann, R., Baltensperger, U., and Prévôt, A. S. H.: Identification and quantification of organic aerosol from cooking and other sources in Barcelona using aerosol mass spectrometer data, Atmos. Chem. Phys., 12, 1649–1665, https://doi.org/10.5194/acp-12-1649-2012, 2012.
Ng, N. L., Canagaratna, M. R., Zhang, Q., Jimenez, J. L., Tian, J., Ulbrich, I. M., Kroll, J. H., Docherty, K. S., Chhabra, P. S., Bahreini, R., Murphy, S. M., Seinfeld, J. H., Hildebrandt, L., Donahue, N. M., DeCarlo, P. F., Lanz, V. A., Prévôt, A. S. H., Dinar, E., Rudich, Y., and Worsnop, D. R.: Organic aerosol components observed in Northern Hemispheric datasets from Aerosol Mass Spectrometry, Atmos. Chem. Phys., 10, 4625–4641, https://doi.org/10.5194/acp-10-4625-2010, 2010.
Ng, N. L., Canagaratna, M. R., Jimenez, J. L., Chhabra, P. S., Seinfeld, J. H., and Worsnop, D. R.: Changes in organic aerosol composition with aging inferred from aerosol mass spectra, Atmos. Chem. Phys., 11, 6465–6474, https://doi.org/10.5194/acp-11-6465-2011, 2011a.
Ng, N. L., Herndon, S. C., Trimborn, A., Canagaratna, M. R., Croteau, P. L., Onasch, T. B., Sueper, D., Worsnop, D. R., Zhang, Q., Sun, Y. L., and Jayne, J. T.: An Aerosol Chemical Speciation Monitor (ACSM) for Routine Monitoring of the Composition and Mass Concentrations of Ambient Aerosol, Aerosol Sci. Tech., 45, 780–794, https://doi.org/10.1080/02786826.2011.560211, 2011b.
Ng, N. L., Canagaratna, M. R., Jimenez, J. L., Zhang, Q., Ulbrich, I. M., and Worsnop, D. R.: Real-Time Methods for Estimating Organic Component Mass Concentrations from Aerosol Mass Spectrometer Data, Environ. Sci. Technol., 45, 910–916, https://doi.org/10.1021/es102951k, 2011c.
Pope III, C. A. and Dockery, D. W.: Health effects of fine particulate air pollution: lines that connect, J. Air Waste Manage., 56, 709–742, 2006.
Qin, Y. M., Tan, H. B., Li, Y. J., Schurman, M. I., Li, F., Canonaco, F., Prévôt, A. S. H., and Chan, C. K.: Impacts of traffic emissions on atmospheric particulate nitrate and organics at a downwind site on the periphery of Guangzhou, China, Atmos. Chem. Phys., 17, 10245–10258, https://doi.org/10.5194/acp-17-10245-2017, 2017.
Reece, S. M., Sinha, A., and Grieshop, A. P.: Primary and Photochemically Aged Aerosol Emissions from Biomass Cookstoves: Chemical and Physical Characterization, Environ. Sci. Technol., 51, 9379–9390, https://doi.org/10.1021/acs.est.7b01881, 2017.
Rohrer, F., Lu, K., Hofzumahaus, A., Bohn, B., Brauers, T., Chang, C.-C., Fuchs, H., Häseler, R., Holland, F., Hu, M., Kita, K., Kondo, Y., Li, X., Lou, S., Oebel, A., Shao, M., Zeng, L., Zhu, T., Zhang, Y., and Wahner, A.: Maximum efficiency in the hydroxyl-radical-based self-cleansing of the troposphere, Nat. Geosci., 7, 559–563, https://doi.org/10.1038/ngeo2199, 2014.
Saha, P. K., Reece, S. M., and Grieshop, A. P.: Seasonally Varying Secondary Organic Aerosol Formation From In-Situ Oxidation of Near-Highway Air, Environ. Sci. Technol., 52, 7192–7202, https://doi.org/10.1021/acs.est.8b01134, 2018.
Sheehy, P. M., Volkamer, R., Molina, L. T., and Molina, M. J.: Oxidative capacity of the Mexico City atmosphere – Part 2: A ROx radical cycling perspective, Atmos. Chem. Phys., 10, 6993–7008, https://doi.org/10.5194/acp-10-6993-2010, 2010.
Shilling, J. E., Chen, Q., King, S. M., Rosenoern, T., Kroll, J. H., Worsnop, D. R., DeCarlo, P. F., Aiken, A. C., Sueper, D., Jimenez, J. L., and Martin, S. T.: Loading-dependent elemental composition of α-pinene SOA particles, Atmos. Chem. Phys., 9, 771–782, https://doi.org/10.5194/acp-9-771-2009, 2009.
Stone, D., Whalley, L. K., and Heard, D. E.: Tropospheric OH and HO2 radicals: field measurements and model comparisons, Chem. Soc. Rev., 41, 6348–6404, https://doi.org/10.1039/c2cs35140d, 2012.
Stone, D., Evans, M. J., Walker, H., Ingham, T., Vaughan, S., Ouyang, B., Kennedy, O. J., McLeod, M. W., Jones, R. L., Hopkins, J., Punjabi, S., Lidster, R., Hamilton, J. F., Lee, J. D., Lewis, A. C., Carpenter, L. J., Forster, G., Oram, D. E., Reeves, C. E., Bauguitte, S., Morgan, W., Coe, H., Aruffo, E., Dari-Salisburgo, C., Giammaria, F., Di Carlo, P., and Heard, D. E.: Radical chemistry at night: comparisons between observed and modelled HOx, NO3 and N2O5 during the RONOCO project, Atmos. Chem. Phys., 14, 1299–1321, https://doi.org/10.5194/acp-14-1299-2014, 2014.
Sun, C., Lee, B. P., Huang, D., Jie Li, Y., Schurman, M. I., Louie, P. K. K., Luk, C., and Chan, C. K.: Continuous measurements at the urban roadside in an Asian megacity by Aerosol Chemical Speciation Monitor (ACSM): particulate matter characteristics during fall and winter seasons in Hong Kong, Atmos. Chem. Phys., 16, 1713–1728, https://doi.org/10.5194/acp-16-1713-2016, 2016.
Sun, Y., Wang, Z., Dong, H., Yang, T., Li, J., Pan, X., Chen, P., and Jayne, J. T.: Characterization of summer organic and inorganic aerosols in Beijing, China with an Aerosol Chemical Speciation Monitor, Atmos. Environ., 51, 250–259, https://doi.org/10.1016/j.atmosenv.2012.01.013, 2012.
Sun, Y. L., Wang, Z. F., Fu, P. Q., Yang, T., Jiang, Q., Dong, H. B., Li, J., and Jia, J. J.: Aerosol composition, sources and processes during wintertime in Beijing, China, Atmos. Chem. Phys., 13, 4577–4592, https://doi.org/10.5194/acp-13-4577-2013, 2013.
Sun, Y. L., Jiang, Q., Wang, Z., Fu, P., Li, J., Yang, T., and Yin, Y.: Investigation of the sources and evolution processes of severe haze pollution in Beijing in January 2013, J. Geophys. Res., 119, 4380–4398, https://doi.org/10.1002/2014JD021641, 2014.
Sun, Y., Du, W., Fu, P., Wang, Q., Li, J., Ge, X., Zhang, Q., Zhu, C., Ren, L., Xu, W., Zhao, J., Han, T., Worsnop, D. R., and Wang, Z.: Primary and secondary aerosols in Beijing in winter: sources, variations and processes, Atmos. Chem. Phys., 16, 8309–8329, https://doi.org/10.5194/acp-16-8309-2016, 2016.
Sun, Y., Xu, W., Zhang, Q., Jiang, Q., Canonaco, F., Prévôt, A. S. H., Fu, P., Li, J., Jayne, J., Worsnop, D. R., and Wang, Z.: Source apportionment of organic aerosol from 2-year highly time-resolved measurements by an aerosol chemical speciation monitor in Beijing, China, Atmos. Chem. Phys., 18, 8469–8489, https://doi.org/10.5194/acp-18-8469-2018, 2018.
Takegawa, N., Miyazaki, Y., Kondo, Y., Komazaki, Y., Miyakawa, T., Jimenez, J. L., Jayne, J. T., Worsnop, D. R., Allan, J. D., and Weber, R. J.: Characterization of an Aerodyne Aerosol Mass Spectrometer (AMS): Intercomparison with Other Aerosol Instruments, Aerosol Sci. Tech., 39, 760–770, https://doi.org/10.1080/02786820500243404, 2005.
Tan, J. H., Duan, J. C., Chen, D. H., Wang, X. H., Guo, S. J., Bi, X. H., Sheng, G. Y., He, K. B., and Fu, J. M.: Chemical characteristics of haze during summer and winter in Guangzhou, Atmos. Res., 94, 238–245, https://doi.org/10.1016/j.atmosres.2009.05.016, 2009.
Tao, J., Shen, Z., Zhu, C., Yue, J., Cao, J., Liu, S., Zhu, L., and Zhang, R.: Seasonal variations and chemical characteristics of sub-micrometer particles (PM1) in Guangzhou, China, Atmos. Res., 118, 222–231, https://doi.org/10.1016/j.atmosres.2012.06.025, 2012.
Timonen, H., Cubison, M., Aurela, M., Brus, D., Lihavainen, H., Hillamo, R., Canagaratna, M., Nekat, B., Weller, R., Worsnop, D., and Saarikoski, S.: Applications and limitations of constrained high-resolution peak fitting on low resolving power mass spectra from the ToF-ACSM, Atmos. Meas. Tech., 9, 3263–3281, https://doi.org/10.5194/amt-9-3263-2016, 2016.
Volkamer, R., Sheehy, P., Molina, L. T., and Molina, M. J.: Oxidative capacity of the Mexico City atmosphere – Part 1: A radical source perspective, Atmos. Chem. Phys., 10, 6969–6991, https://doi.org/10.5194/acp-10-6969-2010, 2010.
Wang, F., An, J., Li, Y., Tang, Y., Lin, J., Qu, Y., Chen, Y., Zhang, B., and Zhai, J.: Impacts of uncertainty in AVOC emissions on the summer ROx budget and ozone production rate in the three most rapidly-developing economic growth regions of China, Adv. Atmos. Sci., 31, 1331–1342, https://doi.org/10.1007/s00376-014-3251-z, 2014
Wang, H., Lu, K., Chen, X., Zhu, Q., Wu, Z., Wu, Y., and Sun, K.: Fast particulate nitrate formation via N2O5 uptake aloft in winter in Beijing, Atmos. Chem. Phys., 18, 10483–10495, https://doi.org/10.5194/acp-18-10483-2018, 2018.
Wang, Q., Sun, Y., Jiang, Q., Du, W., Sun, C., Fu, P., and Wang, Z.: Chemical composition of aerosol particles and light extinction apportionment before and during the heating season in Beijing, China, J. Geophys. Res.-Atmos., 120, 12708–12722, 2015.
Weitkamp, E. A., Sage, A. M., Pierce, J. R., Donahue, N. M., and Robinson, A. L.: Organic Aerosol Formation from Photochemical Oxidation of Diesel Exhaust in a Smog Chamber, Environ. Sci. Technol., 41, 6969–6975, https://doi.org/10.1021/es070193r, 2007.
Wen, L., Xue, L., Wang, X., Xu, C., Chen, T., Yang, L., Wang, T., Zhang, Q., and Wang, W.: Summertime fine particulate nitrate pollution in the North China Plain: increasing trends, formation mechanisms and implications for control policy, Atmos. Chem. Phys., 18, 11261–11275, https://doi.org/10.5194/acp-18-11261-2018, 2018.
Xu, J., Zhang, Q., Chen, M., Ge, X., Ren, J., and Qin, D.: Chemical composition, sources, and processes of urban aerosols during summertime in northwest China: insights from high-resolution aerosol mass spectrometry, Atmos. Chem. Phys., 14, 12593–12611, https://doi.org/10.5194/acp-14-12593-2014, 2014.
Xu, J., Shi, J., Zhang, Q., Ge, X., Canonaco, F., Prévôt, A. S. H., Vonwiller, M., Szidat, S., Ge, J., Ma, J., An, Y., Kang, S., and Qin, D.: Wintertime organic and inorganic aerosols in Lanzhou, China: sources, processes, and comparison with the results during summer, Atmos. Chem. Phys., 16, 14937–14957, https://doi.org/10.5194/acp-16-14937-2016, 2016.
Xue, J., Yuan, Z., Lau, A. K. H., and Yu, J. Z.: Insights into factors affecting nitrate in PM2.5 in a polluted high NOx environment through hourly observations and size distribution measurements, J. Geophys. Res., 119, 4888–4902, https://doi.org/10.1002/2013JD021108, 2014.
Yang, C., Zhao, W., Fang, B., Xu, X., Zhang, Y., Gai, Y., Zhang, W., Venables, D. S., and Chen, W.: Removing Water Vapor Interference in Peroxy Radical Chemical Amplification with a Large Diameter Nafion Dryer, Anal. Chem., 90, 3307–3312, https://doi.org/10.1021/acs.analchem.7b04830, 2018.
Yang, C., Zhao, W., Fang, B., Yu, H., Xu, X., Zhang, Y., Gai, Y., Zhang, W., Chen, W., and Fittschen, C.: Improved Chemical Amplification Instrument by Using a Nafion Dryer as an Amplification Reactor for Quantifying Atmospheric Peroxy Radicals under Ambient Conditions, Anal. Chem., 91, 776–779, https://doi.org/10.1021/acs.analchem.8b04907, 2019.
Zhang, Q., Jimenez, J. L., Canagaratna, M. R., Allan, J. D., Coe, H., Ulbrich, I., Alfarra, M. R., Takami, A., Middlebrook, A. M., Sun, Y. L., Dzepina, K., Dunlea, E., Docherty, K., DeCarlo, P. F., Salcedo, D., Onasch, T., Jayne, J. T., Miyoshi, T., Shimono, A., Hatakeyama, S., Takegawa, N., Kondo, Y., Schneider, J., Drewnick, F., Borrmann, S., Weimer, S., Demerjian, K., Williams, P., Bower, K., Bahreini, R., Cottrell, L., Griffin, R. J., Rautiainen, J., Sun, J. Y., Zhang, Y. M., and Worsnop, D. R.: Ubiquity and dominance of oxygenated species in organic aerosols in anthropogenically-influenced Northern Hemisphere midlatitudes, Geophys. Res. Lett., 34, L13801, https://doi.org/10.1029/2007gl029979, 2007.
Zhang, Q., Jimenez, J. L., Canagaratna, M. R., Ulbrich, I. M., Ng, N. L., Worsnop, D. R., and Sun, Y.: Understanding atmospheric organic aerosols via factor analysis of aerosol mass spectrometry: a review, Anal. Bioanal. Chem., 401, 3045–3067, https://doi.org/10.1007/s00216-011-5355-y, 2011.
Zhang, Y. J., Tang, L. L., Wang, Z., Yu, H. X., Sun, Y. L., Liu, D., Qin, W., Canonaco, F., Prévôt, A. S. H., Zhang, H. L., and Zhou, H. C.: Insights into characteristics, sources, and evolution of submicron aerosols during harvest seasons in the Yangtze River delta region, China, Atmos. Chem. Phys., 15, 1331–1349, https://doi.org/10.5194/acp-15-1331-2015, 2015.
Zhang, Y., Tang, L., Croteau, P. L., Favez, O., Sun, Y., Canagaratna, M. R., Wang, Z., Couvidat, F., Albinet, A., Zhang, H., Sciare, J., Prévôt, A. S. H., Jayne, J. T., and Worsnop, D. R.: Field characterization of the PM2.5 Aerosol Chemical Speciation Monitor: insights into the composition, sources, and processes of fine particles in eastern China, Atmos. Chem. Phys., 17, 14501–14517, https://doi.org/10.5194/acp-17-14501-2017, 2017.
Zhang, Z., Engling, G., Lin, C.-Y., Chou, C. C. K., Lung, S.-C. C., Chang, S.-Y., Fan, S., Chan, C.-Y., and Zhang, Y.-H.: Chemical speciation, transport and contribution of biomass burning smoke to ambient aerosol in Guangzhou, a mega city of China, Atmos. Environ., 44, 3187–3195, https://doi.org/10.1016/j.atmosenv.2010.05.024, 2010.
Zhou, S. Z., Wang, T., Wang, Z., Li, W., Xu, Z., Wang, X., Yuan, C., Poon, C. N., Louie, P. K. K., Luk, C. W. Y., and Wang, W.: Photochemical evolution of organic aerosols observed in urban plumes from Hong Kong and the Pearl River Delta of China, Atmos. Environ., 88, 219–229, https://doi.org/10.1016/j.atmosenv.2014.01.032, 2014.
Ziemann, P. J. and Atkinson, R.: Kinetics, products, and mechanisms of secondary organic aerosol formation, Chem. Soc. Rev., 41, 6582–6605, https://doi.org/10.1039/c2cs35122f, 2012.