the Creative Commons Attribution 4.0 License.
the Creative Commons Attribution 4.0 License.
 | 30 Jun 2020
Identifying a regional aerosol baseline in the eastern North Atlantic using collocated measurements and a mathematical algorithm to mask high-submicron-number-concentration aerosol events
Janek Uin
Stephen Springston
Jian Wang
Guangjie Zheng
Chongai Kuang
Robert Wood
Eduardo B. Azevedo
Allison McComiskey
Adam Theisen
Jenni Kyrouac
High-time-resolution measurements of in situ aerosol and cloud properties provide the ability to study regional atmospheric processes that occur on timescales of minutes to hours. However, one limitation to this approach is that continuous measurements often include periods when the data collected are not representative of the regional aerosol. Even at remote locations, submicron aerosols are pervasive in the ambient atmosphere with many sources. Therefore, periods dominated by local aerosol should be identified before conducting subsequent analyses to understand aerosol regional processes and aerosol–cloud interactions. Here, we present a novel method to validate the identification of regional baseline aerosol data by applying a mathematical algorithm to the data collected at the U.S. Department of Energy's (DOE) Atmospheric Radiation Measurement (ARM) user facility in the eastern North Atlantic (ENA). The ENA central facility (C1) includes an aerosol observing system (AOS) for the measurement of aerosol physical, optical, and chemical properties at time resolutions from seconds to minutes. A second temporary supplementary facility (S1), located ∼0.75 km from C1, was deployed for ∼1 year during the Aerosol and Cloud Experiments (ACE-ENA) campaign in 2017.
First, we investigate the local aerosol at both locations. We associate periods of high submicron number concentration (Ntot) in the fine-mode condensation particle counter (CPC) and size distributions from the Ultra-High Sensitivity Aerosol Spectrometer (UHSAS) as a function of wind direction using a meteorology sensor with local sources. Elevated concentrations of Aitken-mode (< 100 nm diameter) particles were observed in correspondence with the wind directions associated with airport operations. At ENA, the Graciosa Airport and its associated activities were found to be the main sources of high-concentration aerosol events at ENA, causing peaks in 1 min Ntot that exceeded 8000 and 10 000 cm−3 at C1, in summer and winter, respectively, and 5000 cm−3 at S1 in summer. Periods with high Ntot not associated with these wind directions were also observed. As a result, the diverse local sources at ENA yielded a poor relationship between Ntot measurements collected at C1 and S1 (R2=0.03 with a slope ). As a first approach to mask these events, the time periods when the wind direction was associated with the airport operations (west to northwest and southeast to south at C1 and east to south at S1) were applied. The meteorological masks removed 38.9 % of the data at C1 and 43.4 % at S1, and they did not significantly improve the relationship between the two sites (R2=0.18 with a slope ).
Due to the complexity of high-Ntot events observed at ENA, we develop and validate a mathematical ENA Aerosol Mask (ENA-AM) to identify high-Ntot events using 1 min resolution data from the AOS CPC at C1 and S1. After its parameterization and application, ENA-AM generated a high correlation between Ntot in the summer at C1 and S1 (R2=0.87 with a slope ). We identified the regional baseline at ENA to be 428±228 cm−3 in the summer and 346±223 cm−3 in the winter. Lastly, we compared masked measurements from the AOS with the ARM Aerial Facility (AAF) during flights over C1 in the summer to understand submicron aerosol vertical mixing over C1. The high correlation (R2=0.71 with a slope of 1.04±0.01) observed between C1 and the AAF Ntot collected within an area of 10 km surrounding ENA and at altitudes < 500 m indicated that the submicron aerosol at ENA was well mixed within the first 500 m of the marine boundary layer during the month of July during ACE-ENA. Our novel method for determining a regional aerosol baseline at ENA can be applied to other time periods and at other locations with validation by a secondary site or additional collocated measurements.
- Article
(7727 KB) -
Supplement
(1085 KB) - BibTeX
- EndNote


1.1 Aerosol and cloud interactions in the eastern North Atlantic
Ambient aerosols interact with clouds by acting as cloud condensation nuclei and affecting cloud radiative properties, with significant implications for global climate change (Anderson et al., 2003; IPCC, 2014). Currently, climate forcing associated with aerosol–cloud interactions represents one of the largest uncertainties in the climate system (Carslaw et al., 2013) and in future climate projections (Simpkins, 2018). Compounding the effect on climate, regions dominated by clean atmospheric conditions, such as those observed in marine environments with low-lying clouds, are the most susceptible to aerosol perturbations (Rosenfeld et al., 2014). Recently, increases in larger longer-lasting cloud cover and cooling have been correlated with enhanced concentrations of aerosols in ultraclean regimes (Goren and Rosenfeld, 2015).
The eastern North Atlantic (ENA) Ocean is a remote region characterized by a clean marine environment and persistent subtropical marine boundary layer (MBL) clouds (Wood et al., 2015). Throughout the year, transported air masses from North and Central America, Europe, the Arctic, and North Africa (O'Dowd and Smith, 1993; Hamilton et al., 2014; Logan et al., 2014) periodically impact ENA, leading to perturbations in aerosol properties and cloud condensation nuclei concentrations. As a result, ENA is one of the regions in the world with the strongest aerosol indirect forcing and, as a result, has one of the highest associated uncertainties in terms of the aerosol impact on cloud formation, albedo, and lifetime (Carslaw et al., 2013). In the past few decades, major efforts have focused on improving the knowledge of atmospheric processes in the ENA region. Since 1991, several campaigns including the Atlantic Stratocumulus Transition Experiment (ASTEX) (Albrecht et al., 1995), the North Atlantic Regional Experiment (NARE) field mission (Penkett et al., 1998), the International Consortium for Atmospheric Research on Transport and Transformation (ICARTT) (Fehsenfeld et al., 2006), and the BORTAS campaign (Parrington et al., 2012) were conducted in the North Atlantic, studying cloud structure and long-range-transport patterns over the region.
1.2 Ground-based aerosol measurements in the eastern North Atlantic
Starting in 2009, the U.S. Department of Energy's (DOE) Atmospheric Radiation Measurement (ARM) user facility has deployed campaigns at ENA to improve comprehensive long-term measurements of marine boundary layer aerosol and low clouds in high-latitude marine environments. In 2009, the 21-month field campaign (from April 2009 until December 2010) – Clouds, Aerosol, and Precipitation in the Marine Boundary Layer (CAP-MBL) on Graciosa Island (Azores archipelago) – provided the most extensive characterization of MBL clouds in the North Atlantic (Rémillard et al., 2012; Rémillard and Tselioudis, 2015). The observations collected during the 21 months of the deployment also highlighted a strong synoptic meteorological variability associated with seasonal variations of aerosol properties (Logan et al., 2014; Wood et al., 2015; Pennypacker and Wood, 2017; Wood et al., 2017).
Following the outstanding uncertainties identified during CAP-MBL and to continue the research on aerosol–cloud–precipitation interactions on marine stratocumulus clouds, in 2013, ARM established a fixed site, known as the ENA ARM facility (Mather and Voyles, 2013; Dong et al., 2014; Logan et al., 2014; Feingold and McComiskey, 2016). The ENA fixed site is located on the north side of Graciosa Island, which is the northernmost island within the central group of islands in the Azores. Graciosa is the second smallest in size with an area of ∼61 km2 and is one of the least populated islands within the Azores archipelago, with a population of less than 5000 people. These features make Graciosa Island well suited for collecting measurements representative of the open ocean from an inhabited island with power and infrastructure.
The ENA central facility (C1) is equipped with an aerosol observing system (AOS). The AOS provides a unique dataset of high-temporal-resolution measurements of in situ aerosol optical, physical, and chemical properties and their associated meteorological parameters (Uin et al., 2019). Most recently, motivated by the need of a characterization of the horizontal variability and the vertical structure of aerosol and clouds over ENA, ARM deployed the Aerosol and Cloud Experiments in the Eastern North Atlantic (ACE-ENA) field campaign (J. Wang et al., 2019). In July 2017 during ACE-ENA, ARM established a temporary supplementary facility (S1), approximately 0.75 km from the central ENA site (C1), to understand the regional representativeness of the AOS data at the ground level. A subset of AOS instruments was deployed for a period of approximately 1 year to identify the local impacts at C1 and to add additional constraints for the development of algorithms to mask local aerosol influences. During two intensive operating periods (IOPs), in June–July 2017 and January–February 2018, the ARM Aerial Facility (AAF) Gulfstream-159 (G-1) research aircraft flew over ENA, providing high-quality measurements of the marine boundary layer and lower free troposphere (FT) structure, as well as the vertical distribution and horizontal variability of low clouds and aerosol over ENA (J. Wang et al., 2016, 2019). We use the AAF and S1 data to constrain periods of time when the ENA AOS data were regionally representative of aerosol concentrations at the ground level and when they represented aerosol concentrations that were well mixed within the boundary layer.
1.3 Masking local aerosol sources
The impact of local sources on aerosol and trace gas measurements is a common issue for continuous ambient datasets (Drewnick et al., 2012). Even at remote sites such as ENA, local sources can be pervasive and unavoidable. At ENA, the location for C1 was selected by ARM to minimize local aerosol and trace gas sources since they can interfere with regional and large-scale atmospheric aerosol processes. However, competing needs of instruments, logistics, and operations (e.g., requirement of large flat surface areas for the radars, power, and infrastructure to operate the facility) constrained the site selection. As a consequence, episodes of local aerosols are sampled by the AOS and can be observed in the high-time-resolution data. Thus, we identify all known local sources and develop a mask to isolate the regionally representative data (Aiken and Gallo, 2020; Gallo and Aiken, 2020a, b).
One method to estimate the regionally representative concentrations at sites affected by local aerosol is with meteorological filters (Giostra et al., 2011; Gao et al., 2019; Y. Wang et al., 2019). This approach masks all data related to air masses coming from wind directions associated with sources. However, meteorological filters rely upon accurate knowledge of the local sources and the availability of high-quality meteorological data (Giostra et al., 2011). This method has limited use at locations where local sources originate from a wide range of wind directions and vary with time, such as seasonal sources, as well as at locations with complex meteorology, terrain, and high wind speeds.
With high-time-resolution continuous data, it is possible to implement post-data-processing methods using statistics to identify and mask high-concentration aerosol events without removing a large fraction of the data or relying on observational data to identify nearby sources. Smoothing methods based on robust nonlinear data smoothing algorithms have been used historically to improve the signal-to-noise ratio for data that includes occasional high signals due to random noise and other events that can bias the measurements (Beaton and Tukey, 1974; Velleman, 1977; Goring and Nikora, 2002). Smoothing algorithms separate data into a smoothed sequence that can be used to represent the baseline and a residual sequence composed of the noise. Recently, Liu et al. (2018) used a smoothing algorithm based on a 24 h running median to mask short-term local events with an average duration of 0.5±6 min due to nearby road traffic using condensation particle counter (CPC) number concentration data at Ross Island, in Antarctica, during the ARM West Antarctic Radiation Experiment (Lubin et al., 2020). Mathematical algorithms (Giostra et al., 2011; McNabola et al., 2011; Drewnick et al., 2012; Hagler et al., 2012; Ruckstuhl et al., 2012; Brantley et al., 2014; Wang et al., 2015) that evaluate the statistically different behavior of adjacent data points have also been shown to be effective for masking real-time atmospheric data affected by local events in clean environments. The challenge, however, is to identify and mask the time periods impacted by local aerosol sources without masking the regionally representative data that may include periods of long-range transport or other sources with high aerosol number concentrations. Hence, for the successful application of mathematical algorithms, it is important to know how local sources impact the measurements, especially in terms of the signal change and duration of the events, to appropriately configure the algorithm (El Yazidi et al., 2018; Y. Wang et al., 2019). In this context, collocated and/or additional nearby aerosol and trace gas data are useful to understand the origins and pervasiveness of local aerosol and to validate the application of different masking algorithms.
The first aerosol filter applied to ENA AOS data by Zheng et al. (2018) was used to study seasonal aerosol–cloud interactions. The authors used AOS CPC data to mask time periods when the first derivative of the submicron aerosol number concentration exceeded 60 particles cm−3 s−1. With this method, < 20 % of data were masked within each 1 h averaging interval. Other potential methods, which require further development and validation, include the application of machine learning. The External Data Center (XDC) identified periods in ENA AOS data that were impacted by local combustion sources due to planes and runway operations at the Graciosa Airport over a 5 d time period during the winter (Mitchell et al., 2017). Future efforts to develop and apply this code at ENA should be investigated but were beyond the scope of the work presented here.
We present data from two facilities at ENA, C1 and S1, during ACE–ENA to identify the local aerosol sources at ENA and to determine their influence on the AOS data. Submicron aerosol concentrations, size distributions, and meteorological data are presented. We develop a new aerosol mask at ENA using AOS data to identify periods of short-duration high-concentration submicron particle events. Our mathematical algorithm and the determination of a regional baseline for submicron aerosol is validated using the data from C1 and S1. After determining the regional baseline, we compare AOS masked data with the AAF data collected during ACE-ENA flights over C1 to understand the vertical distribution of aerosol at ENA.
2.1 ENA central facility (C1) and aerosol supplementary site (S1)
The ENA central facility (C1) is located on Graciosa Island within the Azores archipelago at 39∘5′28′′ N, 28∘1′36′′ W. C1 is located on the northern part of the island as the area is flat, has access to local power, and is mostly unpopulated (Fig. 1). High-temporal-resolution measurements (seconds to minutes) of aerosol properties at C1 are made with the ENA AOS (McComiskey and Ferrare, 2016; Uin et al., 2019). The AOS at ENA C1 includes instruments for measuring aerosol optical, physical, and chemical properties; trace gases; and meteorological parameters. The AOS is comprised of one container that samples aerosols using instrumentations connected to a central inlet located approximately 10 m above ground level (Bullard et al., 2017; Uin et al., 2019).
The aerosol supplementary site (S1) was deployed at 39∘5′43′′ N, 28∘02′02′′ W, ∼0.75 km from C1 (Fig. 1), in July 2017. S1 was sited within 1 km of C1 to maintain the relevance of S1 data to the AMF measurements at C1. S1 was located at ∼0.2 km from the shore (closer than C1) at ∼50 m a.s.l. Data were collected at S1 until the site was decommissioned in April 2018 after the conclusion of ACE-ENA.
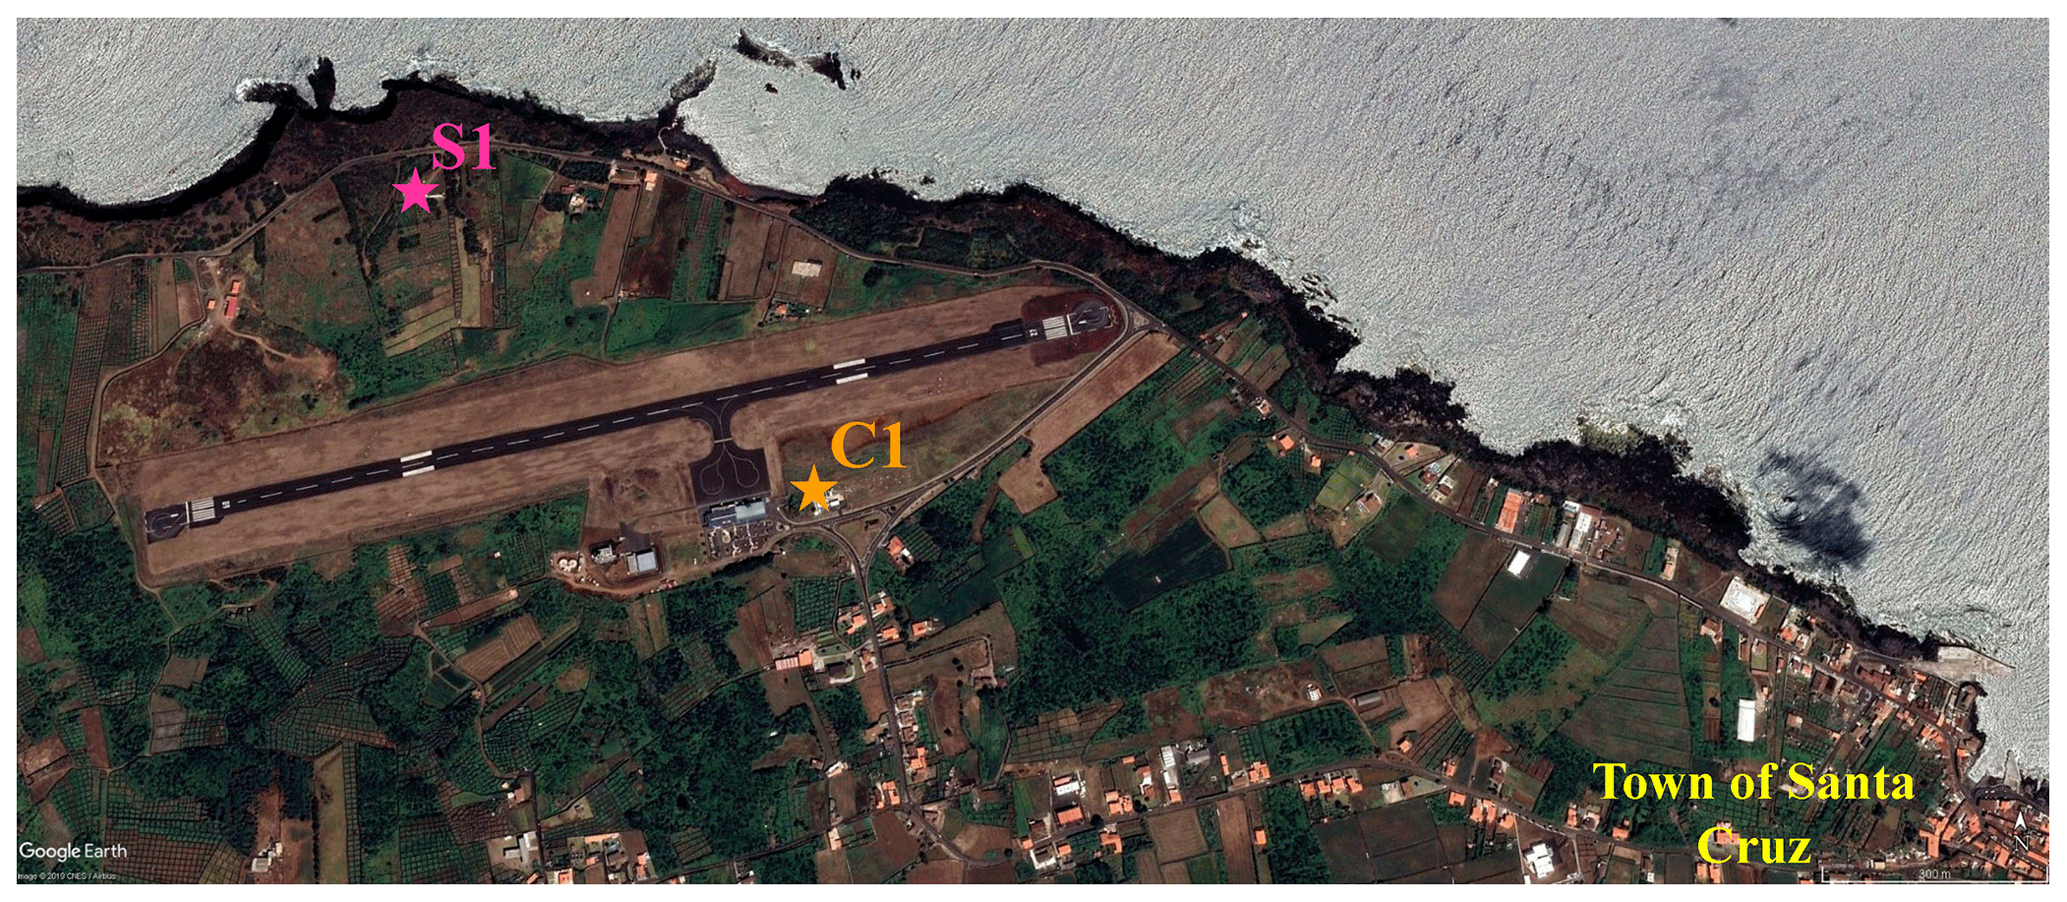
Figure 1Satellite image of ENA C1 and S1 on Graciosa Island, Azores, Portugal (© Google Earth).
Three instruments, duplicate models of those used within the AOS at C1, were deployed at S1. Two aerosol instruments were selected for their ability to measure submicron aerosol concentrations in high time resolution. The third instrument was included to associate the measurements with meteorological parameters as is done in the AOS. The aerosol instruments were powered and located inside a converted garage in an unoccupied house, with the computer for data acquisition. The meteorology sensor was mounted above the inlet at ∼3 m above the roofline. Measurements were designed to duplicate those made within the AOS as best possible without the use of an AOS inlet at S1. Prior to the deployment at S1, the instruments were calibrated at C1 alongside the AOS instruments. Ambient data from the three instruments were compared over a period of 1 week at S1. The S1 inlet flow rate was optimized to minimize submicron particle loss (Bullard et al., 2017).
Briefly, the fine-mode condensation particle counter (CPC) (TSI, Inc., Shoreview, MN, USA; model 3772) measures the submicron number concentration (Ntot) of aerosols from ∼7 nm to 1 µm in particle diameter (Dp). Particles are grown by condensing butanol vapor onto the particles before they are optically counted by illuminating them with a laser beam to count the number of light pulses that are scattered (Kuang, 2016). The Ultra-High Sensitivity Aerosol Spectrometer (UHSAS) (Droplet Measurement Technologies, Inc., Longmont, CO, USA) is an optically scattering, laser-based aerosol spectrometer for sizing particles from ∼60 to 1000 nm Dp. Aerosols scatter the laser light as a function of their optical Dp. The UHSAS detection efficiency is ∼100 % for particles > 100 nm and for concentrations < 3000 cm−3 (Cai et al., 2008). Concentration measurement errors occur for smaller particles that have low scattered light intensities and during periods of higher Ntot due to particle coincidence. Sizing of spherical and irregular particles by the UHSAS is within 10 % of the mobility diameters measured by the scanning mobility particle sizer (SMPS) for particles with Dp > 70 nm (Cai et al., 2008). Therefore, in this study, we use the UHSAS submicron data for particles > 70 nm (Uin, 2016). CPC and UHSAS sample flows are dried using a shared Nafion dryer that reduces the relative humidity of the samples to ≤30 % (Uin et al., 2019). Since submicron data were collected at S1 and compared with the submicron data collected at C1, we make no inferences on supermicron particles. The meteorology sensor (Met) (Vaisala, Finland; WXT520) provides ambient air temperature, relativity humidity, atmospheric pressure, wind speed and direction relative to true north, and precipitation data (rain amount, duration, and intensity) (Kyrouac, 2016).
2.2 ARM Aerial Facility (AAF)
The ARM Aerial Facility (AAF) Gulfstream-159 (G-1) research aircraft flew from Terceira Island (∼90 km from the ENA C1 site) during two IOPs in early summer 2017 (June to July) and winter 2018 (January to February). Flight patterns included spirals to obtain vertical profiles of aerosol and clouds and ascendant and descendent legs at multiple altitudes to provide characterization of the boundary layer and lower-free-troposphere structure. Data were collected up to an altitude of ∼4970 m.
Ntot data collected by the AAF with the CPC (TSI, Inc., Shoreview, MN, USA; model 3772) during the summer were compared to CPC data collected at C1 and S1. The CPC was installed behind an isokinetic inlet to minimize particle loss in aircraft sampling and was operated on the AAF G-1 (Schmid et al., 2014). During the first ACE-ENA IOP there were 20 research flights (RFs). We analyzed data from the seven flights that collected data over C1 at low altitudes between 54 and 500 m.
3.1 C1 and S1 intercomparison
We present and evaluate different strategies to identify periods when the AOS data are impacted by high submicron aerosol concentrations and associate them with nearby potential aerosol sources. The impacts of local aerosol sources at ENA C1 are evaluated by comparing data collected at C1 and S1. We analyzed two 1-month time periods that represent two seasons: summer (22 July–20 August 2017) and winter (1–30 December 2017).
Measurements from the UHSAS and CPC are combined to describe the submicron aerosol size distribution by dividing the data into three optical size modes. Zheng et al. (2018) used lognormal fitting of the submicron aerosol size distributions from the UHSAS to define three modes to study aerosol–cloud interactions at ENA. The lognormal fittings gave three parameters: mode diameter, mode number concentration, and mode σ (standard deviation; Table 2 in Zheng et al., 2018). Number concentrations (N) of the fitted modes were classified by the mode diameter into three bins: (1) NAt, number concentration of Aitken (At) mode aerosol (Dp≤100 nm); (2) NAc, number concentration of accumulation (Ac) mode aerosol (Dp=100–300 nm); and (3) NLA, number concentration of large accumulation (LA) mode aerosol (Dp=300–1000 nm). The NAc- and NLA-mode number concentrations reported here are directly measured by the UHSAS. Since there is not a direct measurement of the full range of At-mode particles, NAt is determined by combining the measurements from the CPC and the UHSAS. NAt is calculated as the difference between the Ntot, as measured by the CPC, and the sum of the UHSAS number concentrations from the two larger modes: (NAc+ NLA). All Dp values referenced in the text refer to aerosol optical diameter unless otherwise stated.
One way to determine statistical outliers in the data is by comparing the difference between the median and the mean. Time periods when the median and mean Ntot differ significantly are used to indicate periods when the data are affected by outlying events, such as high-number-concentration aerosol events. Median values represent the midpoints in the data, which are minimally affected by outlying events. Mean values describe the central tendency of the data and are affected by outlying events. As such, comparison between the two values provides information about the variability within the overall dataset. Erroneous data and their ARM quality assurance/quality control (QA/QC) flags (e.g., negative values and −9999) have been removed prior to the analysis presented here. Significant deviations between the mean and median concentrations, where the mean is biased high, are used to indicate when aerosol Ntot have a statistically relevant higher variability due to the presence of high-concentration aerosol events.
3.2 ENA Aerosol Mask (ENA-AM)
ENA Aerosol Mask (ENA-AM) is a standard deviation algorithm that was parameterized for the ENA Ntot data collected by the CPC. Application of the algorithm requires the statistical differences between adjacent data points to distinguish periods of short-duration high aerosol number concentrations from the baseline measurements. The time resolution of the data has to be shorter than the typical time period of the high-concentration events. The variation within the clean baseline periods also has to be smaller than the variation of Ntot during the high-concentration events. Therefore, the algorithm works best with high-time-resolution data, as is collected by the AOS at time intervals on the order of seconds to minutes, and for identifying local sources that have high temporal variability. An additional requirement is that at least half of the total data points have to be representative of the baseline conditions; otherwise the algorithm is not able to identify the high-Ntot events properly. The flow chart in Fig. 2 describes the requirements and recommended procedures to apply the algorithm to data affected by local aerosol events. A perfect algorithm would identify only the noise and retain all of the natural variability. Since data may include periods when the local sources are less variable than the natural baseline no separation will be perfect. Here, we test and develop an algorithm optimized to balance the separation of the noise from the baseline. The 1 min Ntot data collected at C1 and S1 fulfill these requirements, and we, therefore, developed ENA-AM as described below using two 1-month periods of data collected at ENA (Aiken and Gallo, 2020; Gallo and Aiken, 2020a, b).
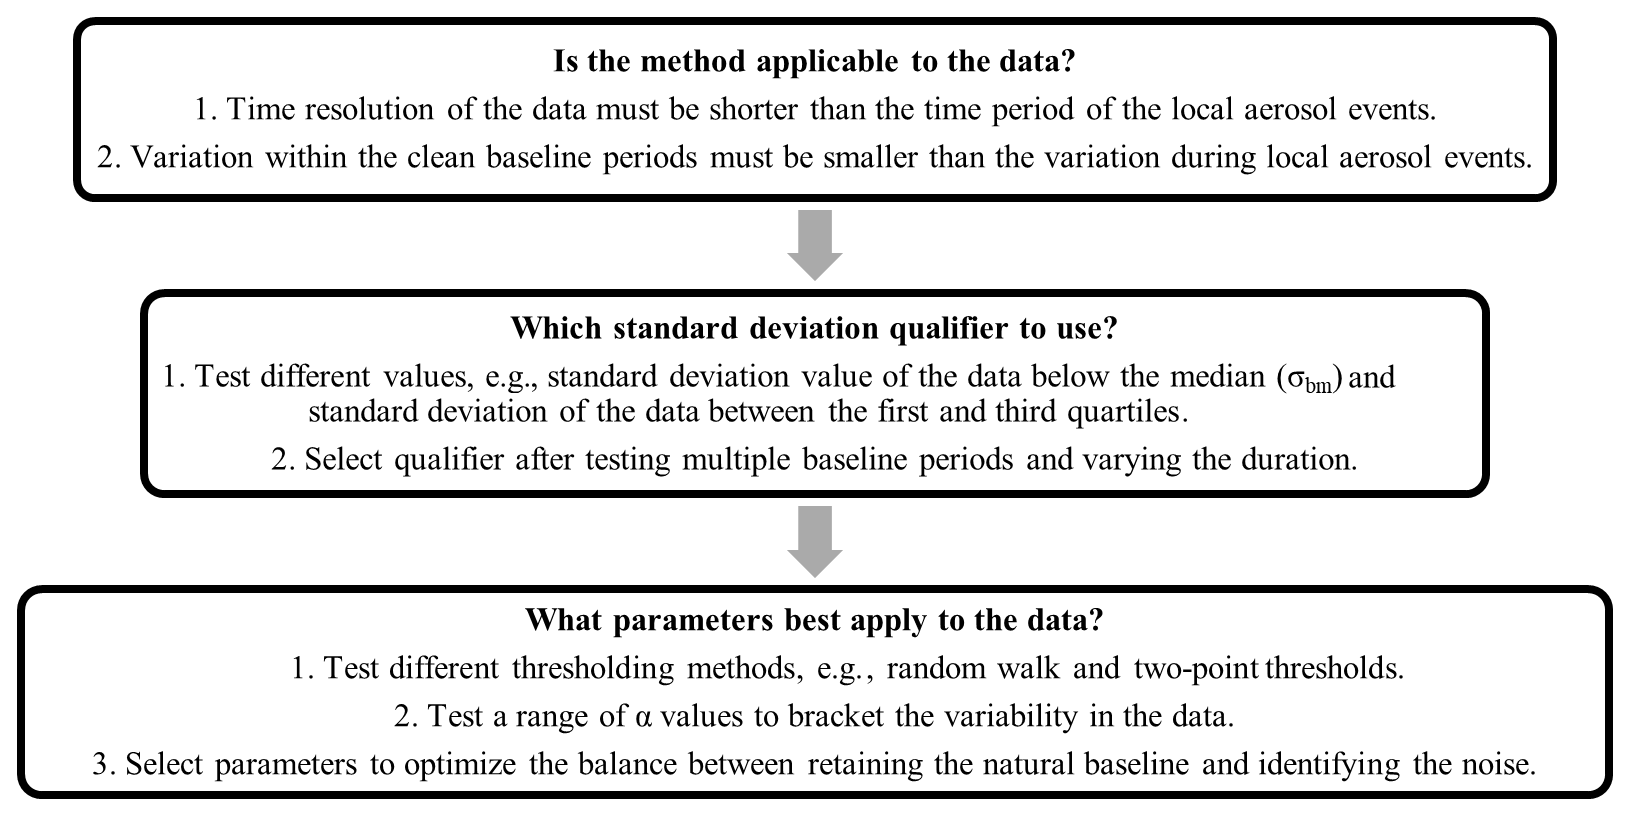
Figure 2Flow chart to apply the standard deviation algorithm to high-time-resolution aerosol data.
We determined the standard deviation of the data below the median (σb) of Ntot for each of the two 1-month periods. Any data point that differs by more than α times the σb from the preceding data points is identified and masked as a high-concentration aerosol event. The retained data points are defined as the baseline. The variable α is used to set the threshold, and its value is defined as a function of the specific dataset and time series variability. The utilization of 1-month time periods was chosen to limit biases in the characterization of the regional baseline after testing a range of periods from 2 weeks to 2 months. At ENA, we observed that when using longer periods of time (> 6 weeks), σb removed the long-term variability associated with seasonal changes. Simultaneously, considering shorter time periods (< 2 weeks), σb was unable to retain periods when ENA was affected by episodes of long-range-transported continental aerosols. An alternative parameterization would be to use the standard deviation between the first and the third quartiles. This approach has been shown to be effective for masking continuous time series of greenhouse gas measurements that present daily and monthly natural fluctuations and positive short-term spikes (seconds to minutes) due to local emissions (El Yazidi et al., 2018). We tested this alternative at ENA and observed similar results for both methods. The data filtered using σb agreed with the data filtered between the first and third quartiles 98.6 % of the time.
Whenever a data point is identified above the threshold, the next point in the time series is evaluated using a random walk method (threshold = () ×α), where n is the number of data points since the last data point that was within the standard variability. In this way, the threshold is slightly increased to account for normal temporal development of the baseline. If the density of the high-concentration particle events is high, the algorithm is not able to identify the baseline variability properly. In such cases, α should be set to a lower value, and the random walk method threshold might be better substituted with a two-point thresholding method. With two-point thresholding, the two data points after each masked point are considered to be part of the event. Thus, the value of α and the thresholding method are dependent on the time series variability as is the selection of the time period over which to apply the algorithm. Selection of both must be optimized for the specific dataset.
We tested six different parameterizations of the algorithm, which included two α values and the two thresholding methods as well as different time lengths. Table 1 presents the combination of α values and thresholding methods used. A sensitivity analysis was conducted to determine the best parameterization of the algorithm for Ntot measurements at ENA. After the parameters for ENA-AM were determined, we compare masked C1 with AAF Ntot measurements.
Table 1Standard deviation algorithm input parameters tested at C1 and S1 in the summer.

4.1 High-concentration aerosol events
Wind directions can be used with aerosol measurements to determine aerosol sources (Zhou et al., 2016; Cirino et al., 2018). To understand the frequency and direction from which local aerosols originate at ENA, we present mean aerosol Ntot and NUHSAS as a function of wind direction. Ntot and NUHSAS are used to understand the directional and temporal influence of observed high aerosol concentrations at C1 and S1 and to evaluate the use of wind direction data to create an aerosol mask at ENA.
In Fig. 3, 1 min Ntot,NUHSAS, and wind measurements were averaged as a function of wind degree direction in the summer and winter. A detailed analysis of wind speeds and wind directions at ENA during summer and winter is presented in the Supplement (Sect. S1). When plotted by wind degree direction, we observed Ntot > 1000 cm−3 at C1 and S1. Mean Ntot values for all directions in the summer were 710 (C1) and 490 cm−3 (S1). NUHSAS mean concentrations were less than half of Ntot during the same time periods: 342 (C1) and 210 cm−3 (S1). The higher Ntot is due to a significant fraction of aerosol below the UHSAS lower detection size limit of 70 nm since the instruments have similar upper limits for counting particles. Without the Ntot that counts particles < 70 nm Dp, the high-concentration aerosol would be harder to identify by wind direction alone due to the lower variability in NUHSAS. For this reason, we continue our analysis by wind direction focusing on Ntot.
The largest mean Ntot plotted by wind degree direction that was observed at C1 was ≥3000 cm−3 (Fig. 3a, c) during summer and winter when the winds were from the west to northwest, wind directions that are associated with the airport (see Fig. 1; Table S1 in the Supplement). These directions were attributed to the utilization of the runway and the airplane parking lot with AOS camera visual validations of aircraft. The next highest Ntot values were observed from the south to southeast at C1. Values of Ntot≥1000 cm−3 were observed in the summer and Ntot≥1600 cm−3 in the winter. These directions are associated with the direction of the road that leads from the airport to the town of Santa Cruz (Figs. 1 and S1 in the Supplement).
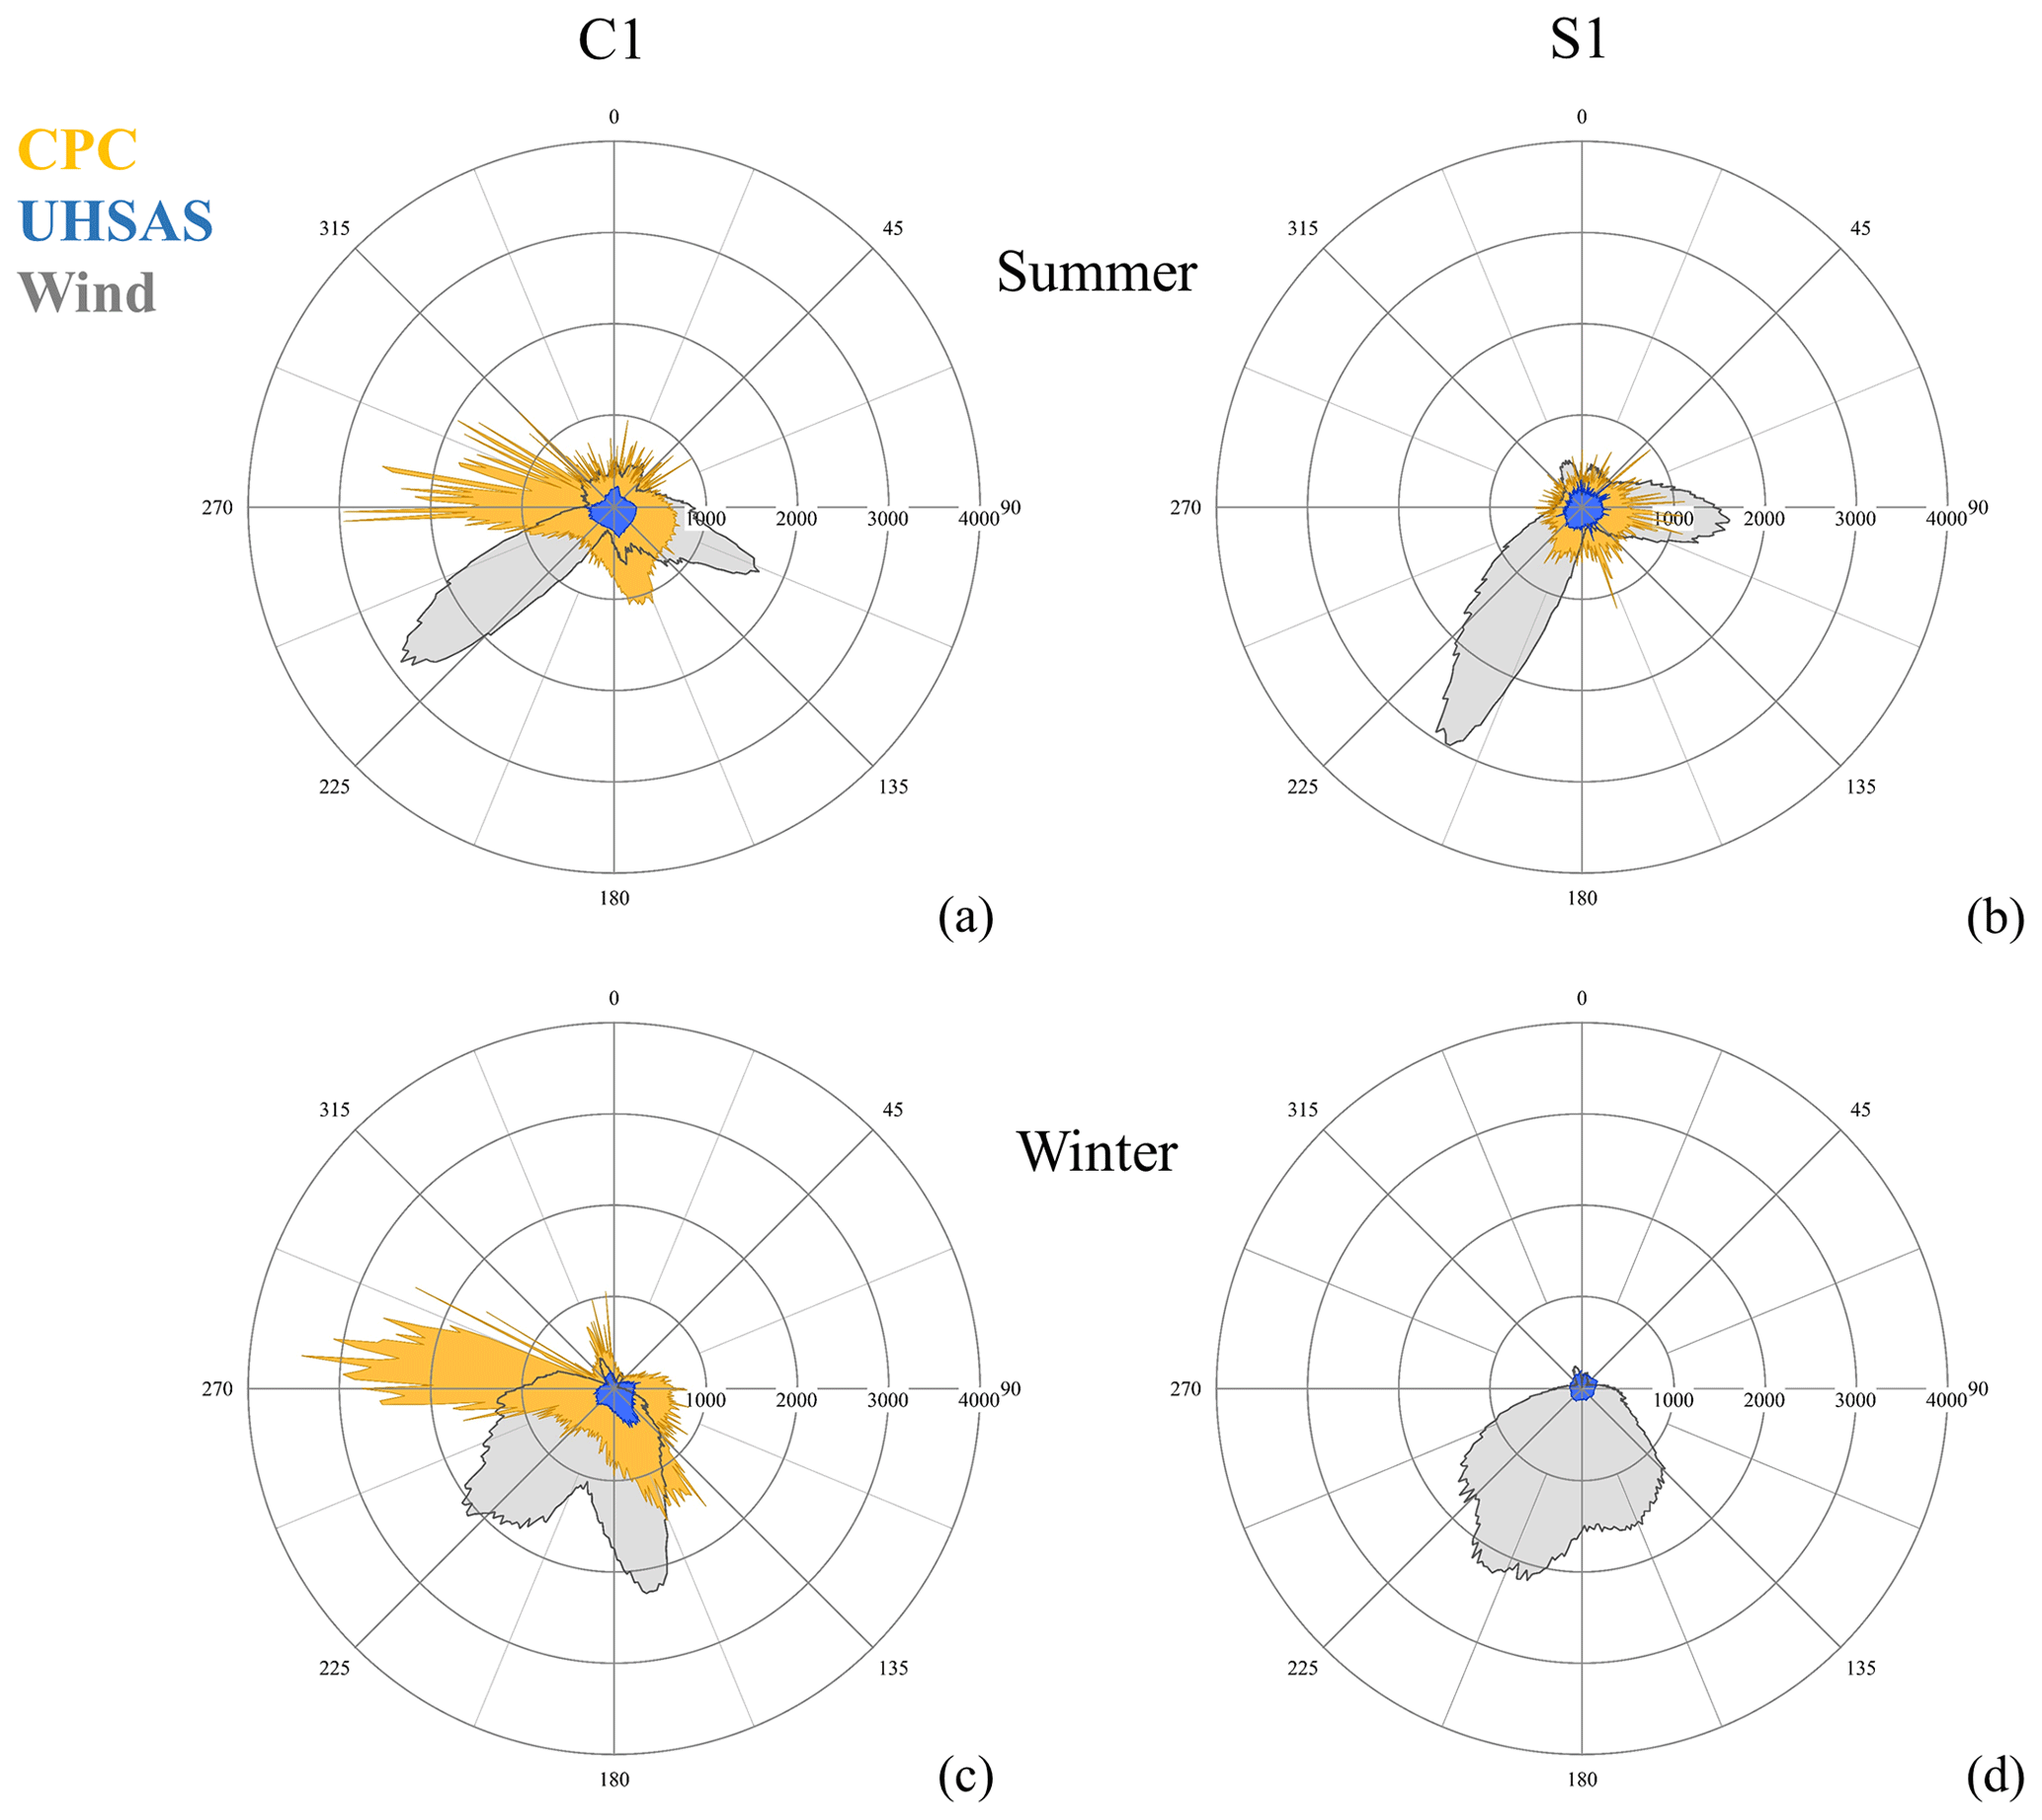
Figure 3Polar graphs of the mean Ntot and NUHSAS as a function of wind direction during summer (a, b) and winter (c, d) at C1 and S1. The 1 min Ntot data from the CPC, in orange (data not available at S1 in the winter), and NUHSAS from the UHSAS, in blue, were averaged as a function of wind degree direction. The frequency of wind direction is in gray.
While mean Ntot values were lower at S1 than C1, S1 also had Ntot > 1000 cm−3 (Fig. 3b). The three highest Ntot values at S1 that exceeded 1000 cm−3 were observed from the south-southeast, east-southeast, and east. The wind directions of the maxima Ntot were associated with the airport runway, rural road, and pasture at S1. Wind directions with Ntot∼1000 cm−3, observed from the northeast, were likely due to the rural road along the shore. Values of Ntot∼500 cm−3 from the southwest were from the direction of the decommissioned landfill that still has active vents as well as the airport runway. Ntot was not available during the winter at S1 to make a comparison with summer.
The results of the wind direction analysis indicate that the main sources of Ntot≥1000 cm−3 at C1 and S1 are most likely associated with airport activities and road traffic due to the proximity and direction of the sources. However, at ENA, other unattributed local sources, not related to airport operations, that are not identified here could also be present. One example of an aerosol source that we could not verify was a potential brick production facility ∼1 km to the south-southeast of C1. Complex meteorological conditions known to exist in the region might also be responsible for high Ntot at C1 and S1 that we were not able attribute to local sources based on wind direction.
4.2 Submicron aerosol modes
Number concentrations from three aerosol modes that we defined in Sect. 3.1 are presented in Fig. 4 from C1 and S1 in the summer and winter. The smallest mode number concentration, NAt, represents the size range most likely impacted by nearby combustion sources (aircrafts and gasoline and diesel vehicles) as discussed in the Sect. S3. NAc is expected to include some of these particles as well, especially for the less efficient combustion sources and operational modes, such as those produced by diesel engines and wood burning sources that may or may not be significant at ENA and are not discussed here due to their unconfirmed use on the island. The third and largest mode number concentration, NLA, is not expected to be significantly impacted by nearby combustion aerosol sources. However, NLA is presented since it includes natural aerosol sources such as sea spray (Burrows et al., 2014; Quinn et al., 2015) and secondary organic aerosol (Jimenez et al., 2009; Shrivastava et al., 2019) that can also be formed in association with combustion sources.
For the three submicron size modes analyzed at C1 and S1, NAt had the largest median and mean number concentrations, equating to 44 % of the median and 31 % of the mean for the total submicron aerosol concentrations, Ntot, when averaged from the different sites and seasons. NAt also had the highest deviation between the mean and median of the three size modes during the summer and winter. Median NAt values at C1 were relatively constant at 245 cm−3 in the summer and 258 cm−3 in the winter. Median NAt at S1 was 78 % of C1 with 190 cm−3 in the summer. While median NAt values were relatively constant for the data shown here at both seasons and sites, mean NAt varied with site and season. Mean NAt values were 540 (C1) and 330 cm−3 (S1) in the summer (Fig. 4a). In the winter at C1, the mean NAt was 800 cm−3, which was 48 % higher than what was observed in the summer (Fig. 4b).
The higher observed mean NAt at C1 during the winter indicated that the influence of nearby aerosol sources was likely to be larger in the winter than in the summer. This result is supported by the earlier results from Ntot (Sect. 4.1: Fig. 3a, c) and the submicron size distributions (Fig. S3b). The reason for the higher fraction of NAt observed in the winter at C1 could have been due to additional seasonal sources that were not attributed here, such as the burning of wood or other fuels to heat homes. Different meteorological conditions experienced in the winter versus the summer could also have contributed to the seasonal differences. For example, higher NAt from the known sources discussed in Sect. S3 might also be due to different winter meteorological conditions, e.g., lower boundary height and higher wind speeds.
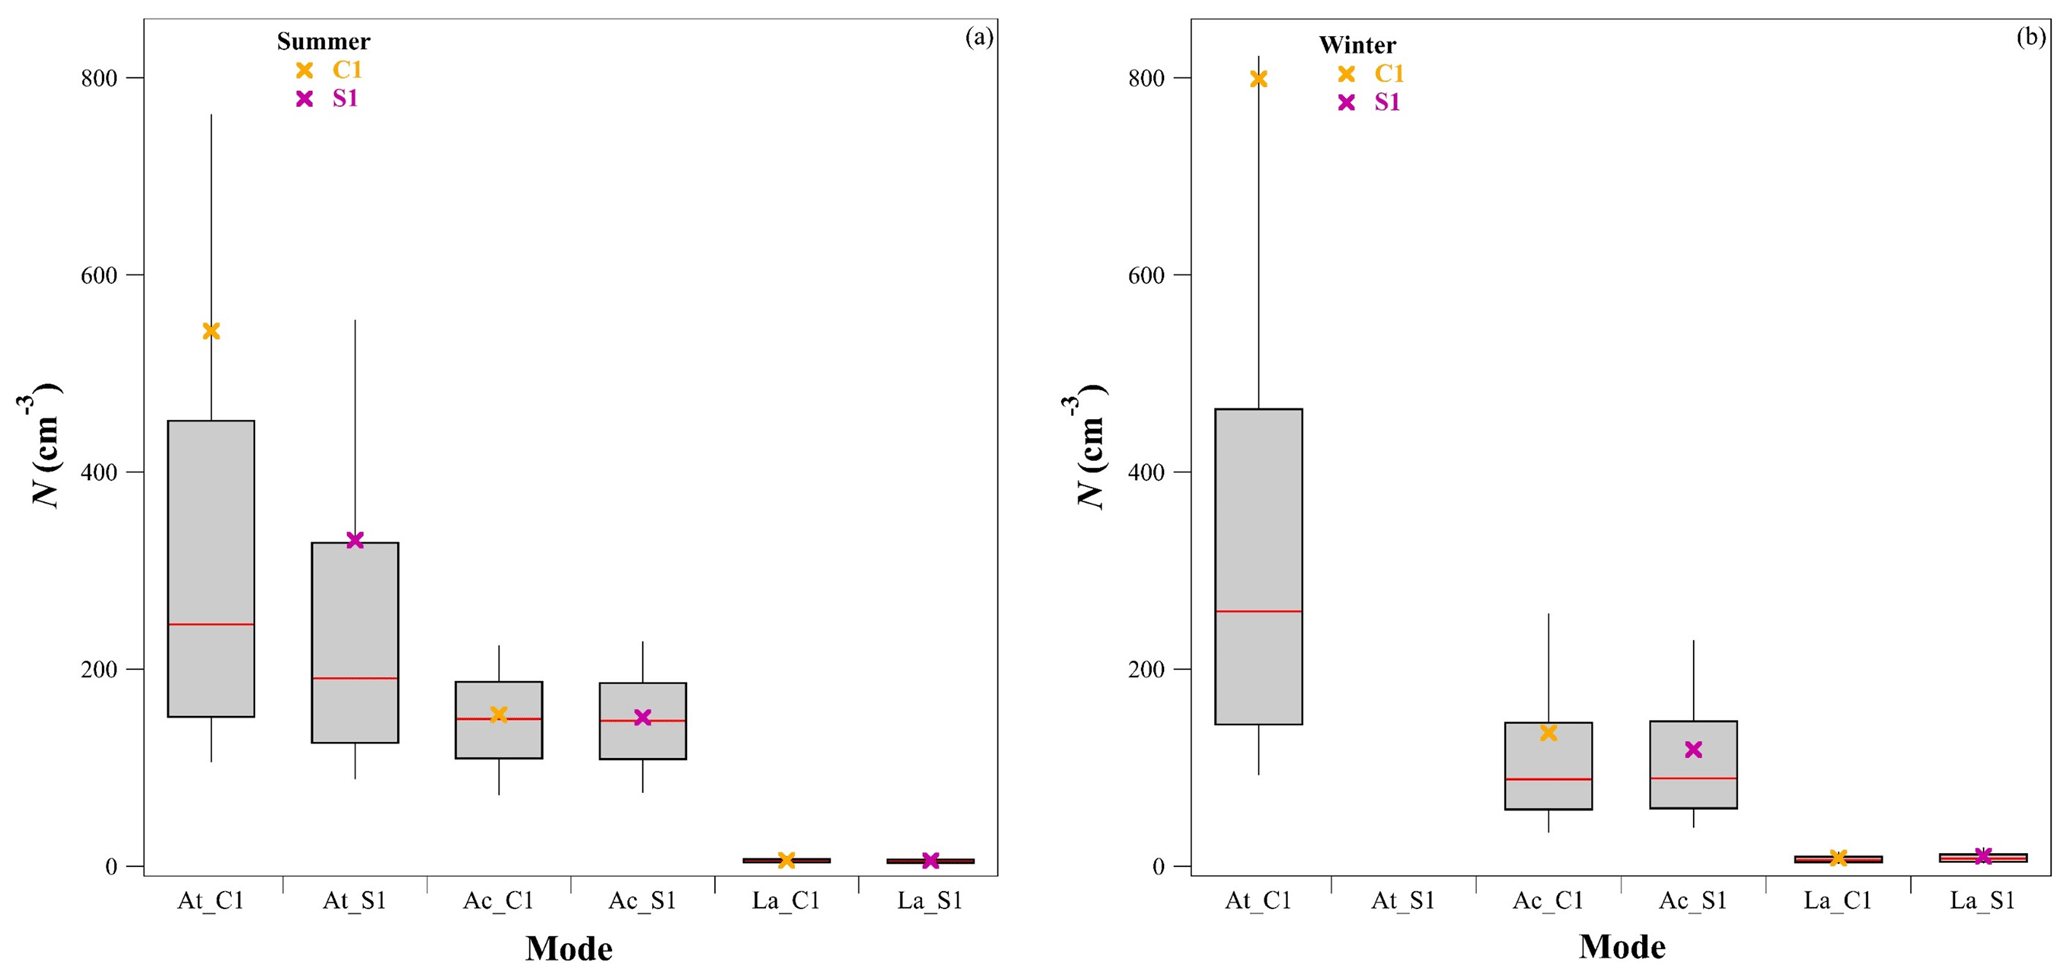
Figure 4Box and whisker plot of At-, Ac- and LA-mode aerosol number concentrations at C1 (orange) and S1 (pink) in the (a) summer and (b) winter. Mean (x) and median (red line). Box bottom at 25 %, box top at 75 %, whisker bottom at 10 %, and whisker top at 90 %. No At-mode data were available at S1 during the winter.
Mean and median NAc were lower than NAt during summer and winter at C1 and S1, yet still represented a significant fraction of Ntot. In the summer, C1 and S1 NAc had similar mean and median values, indicating low variability in the data. Mean NAc values observed were 160 (C1) and 151 cm−3 (S1). Median NAc values were 156 (C1) and 147 cm−3 (S1). The similar values between the mean and median NAc at both sites indicated that the mode was not largely affected by high-concentration aerosol events. In the winter, mean NAc values were 13 % (C1) and 22 % (S1) lower than mean NAc in the summer. Mean NAc values were 140 (C1) and 118 cm−3 (S1). Median NAc values were 91 (C1) and 89 cm−3 (S1). Overall, NAc values at C1 and S1 were more similar than NAt in summer and winter. However, there was a higher variability between the mean and median NAc observed during the winter that was not observed in the summer (see Sects. S3 and S4 for discussion).
NLA did not represent a significant fraction to Ntot at ENA for the data presented here. Mean NLA values during the summer were 6 cm−3 at C1 and S1. Similar NLA values were observed in the winter at 8 cm−3 at C1 and 10 cm−3 at S1. While NLA is important in regard to mass concentrations, scattering properties, and cloud condensation nuclei, all properties measured by the AOS (Uin et al., 2019), NLA values are not generally attributed to local combustion aerosol sources, which is the focus here. Contributions and impacts to NLA due to sea spray aerosol were beyond the scope of this work yet were not considered to be a large contribution at C1 or S1 based on the low NLA observed here.
4.3 High-time-resolution data
Time series of Ntot at C1 and S1 indicated that both locations periodically sample high concentrations over time periods < 4 min. High Ntot such as these are typically the result of local sources due to their high concentrations and short durations which would become less evident at greater distances from the source. Since aircraft idling, taxiing, takeoff, and landing are all potential times when high Ntot could be sampled at C1 and S1, we used the Graciosa Airport flight logs and the AOS camera observations to validate high-time-resolution Ntot data at ENA.
In Fig. 5, we present two 1 d periods sampled at C1 and S1 during the summer. Ntot > 25 000 particles cm−3 were observed on a daily basis at C1 in the raw 1 s data (Fig. 5a). Lower Ntot daily maximum concentrations > 11 000 cm−3 were observed at S1. Winter Ntot daily maximums at C1 were > 20 000 cm−3, with maximum concentrations occasionally ∼80 000 cm−3. Figure 5b shows a time period when the overall trend is the reverse of Fig. 5a when higher Ntot values were observed at S1 in comparison to C1. While this period did not represent the overall trend in Ntot between C1 and S1, it is included to show that C1 and S1 both observed Ntot maximums at different times and that both sites were impacted by high-concentration aerosol events in high time resolution.
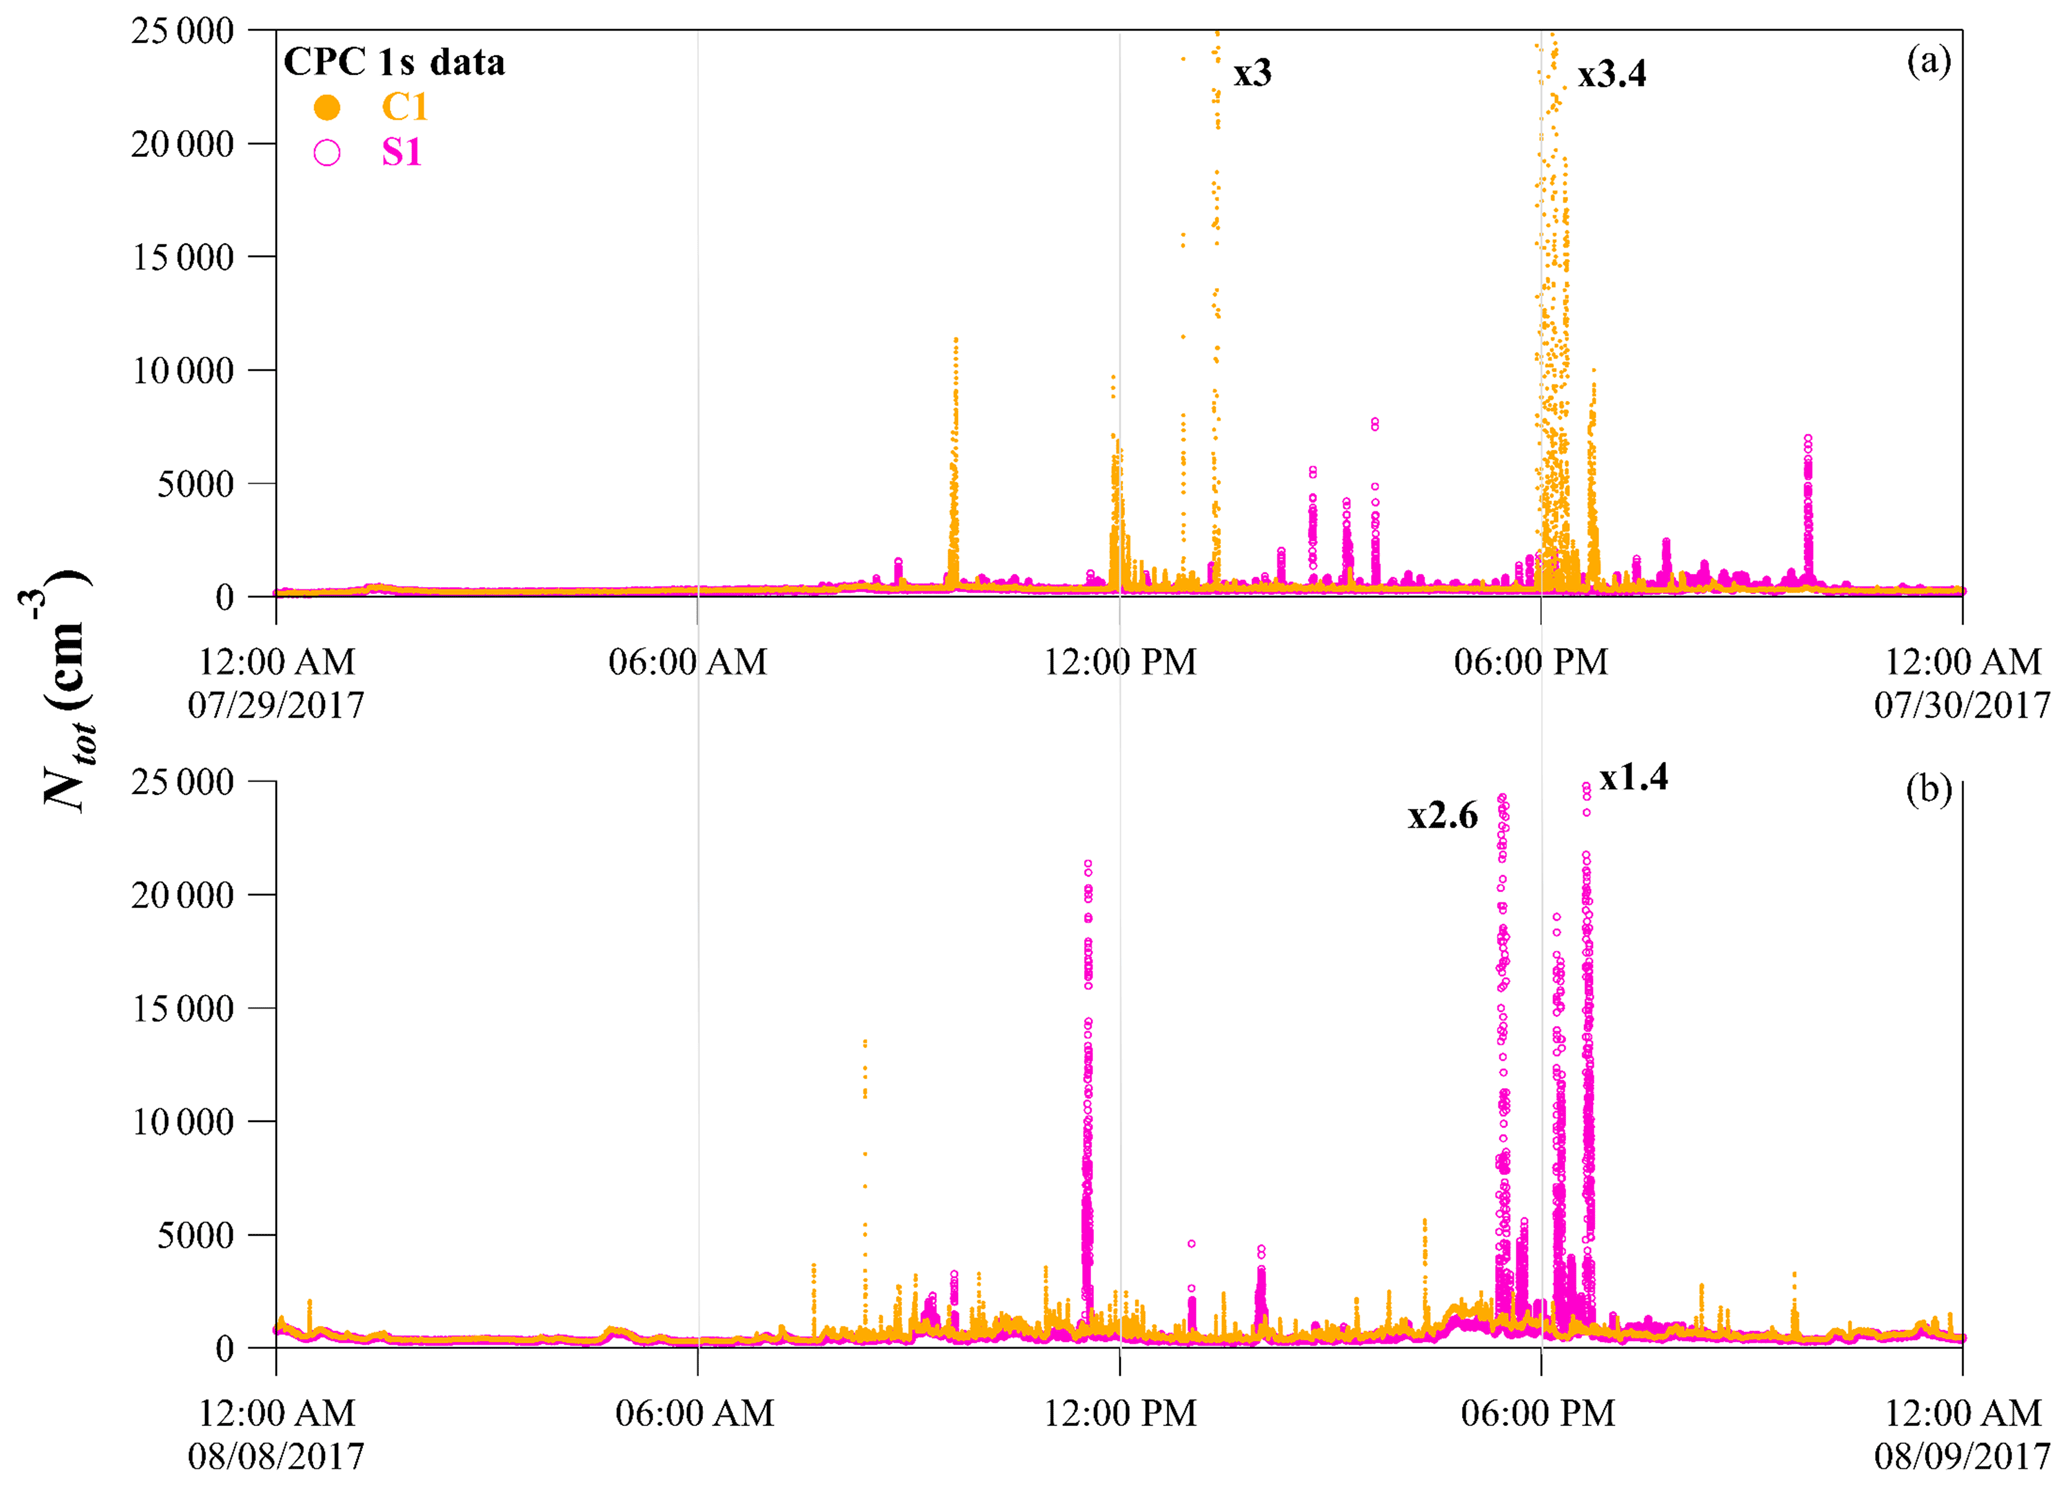
Figure 5The 1 s Ntot data during two 1 d periods at C1 (orange) and S1 (pink) raw in the summer. (a) Typical day when C1 sampled higher Ntot than S1; (b) atypical day when S1 sampled higher Ntot than C1. To highlight the smaller peaks, the four highest peaks are off-scale by the factors indicated in the figure.
Graciosa Airport on average hosts two flights a day, the first typically in the late morning/early afternoon and the second in the late afternoon. The airport time tables for 2017 and 2018 reported that planes landed and took off from Graciosa Island during three distinct time periods throughout the day: ∼17 % of the planes arrive at Graciosa Airport between 08:30 and 11:00 UTC, ∼26 % between 13:00 and 15:00 UTC, and ∼56 % between 17:00 and 20:00 UTC. Taking into account the wind direction, planes typically land from the east and take off from the west. We confirmed that, during the summer, 97 % of the flights occurred in this direction by analyzing the daily video from the AOS cameras at C1. However, due to the runway's limited length, planes often utilize the full length of the runway, which was observed in Ntot at C1 and S1. Such occurrences affected Ntot at C1 the most when the wind direction was between northeast and west, as well as S1 when the wind came from the east to southwest.
To further understand the potential influence of the airport operations on Ntot at C1 and S1, we examined a 1 d time period in detail. In Fig. 6, we present C1 and S1 1 min time resolution Ntot on 3 August 2017. Ntot at S1 was largely unaffected by the short-duration high-concentration aerosol events as Ntot was never > 1000 cm−3. While this is only a 1 d time period and was by no means representative of daily Ntot, we show it as an example of the complexity within Ntot at ENA.
Throughout the day, abrupt changes in wind direction were observed. Winds from the south, southwest, and west dominated until 17:58 UTC. Starting at 18:00 UTC, the dominant wind directions were northwest, north, and east. Analysis of the video from the AOS camera at C1 showed that diesel trucks were on the runway from 09:07 to 09:27 UTC for daily maintenance. At two times during the afternoon, 13:42 to 15:02 and 18:46 to 19:51 UTC, the aircraft was idling near the airport terminal (Fig. 6). During the first part of the day, when the wind directions were from the south and west, Ntot values were greater than 1000 cm−3 at C1 at numerous times. In the Supplement we identify these directions at C1 with the airport terminal, parking lot, and the road to the airport. Later in the day, when the winds were coming from the northwest to east, in the direction of the runway at C1, values of Ntot < 1000 cm−3 at C1 were similar to Ntot at S1.
The high-Ntot events at C1 and S1 were associated with the airport activities and increased road traffic that generally occurred before the arrival and after the departure of the aircraft, based here on visual observations, airport flight logs, and wind degree direction analysis. The aircraft and vehicle impacts were observed by sharp peaks occurring on timescales on the order of minutes when Ntot was an order of magnitude above the baseline signal. In contrast, the airport operations tended to cause periods of elevated Ntot that occurred over longer timescales on the order of hours. Therefore, the impact of the airport, its operation, and associated traffic on the AOS data at ENA could not be constrained to the arrival and departure times of the aircraft since it was also impacted by airport operations that occurred throughout the day and the wind direction in relation to C1 and S1.

Figure 6Ntot and wind direction at C1 (orange) and S1 (pink) on 3 August 2017. Yellow and gray periods indicate when the AOS cameras observed trucks on the runway (yellow) and planes near the terminal building (gray).
While the influence of the airport operations may not be readily apparent from the short-duration high concentrations observed at C1 and S1 (Fig. 5), further information constraining this influence was obtained by looking at the diurnal cycle of mean and median Ntot at C1 (Fig. 7). The three hourly periods with highest mean Ntot were observed during 09:00 to 10:00 UTC at 916 cm−3, 13:00 to 14:00 UTC at 860 cm−3, and 17:00 to 18:00 UTC at 1595 cm−3. These three elevated mean Ntot periods occurred during the three time periods when the airport flight logs on average observed flights. These periods were identified using the airport flight logs and are shown as the black boxes in Fig. 7. Mean Ntot from 07:00 to 08:00 UTC reached a value of 615 cm−3. The highest mean Ntot was observed during the third time period identified by the airport to host on average half of the daily flights, while the two earlier time periods were only associated with ∼25 % of the flights each. Two other high-mean-Ntot periods were observed during the diurnal profile at C1. Mean Ntot values were 615 cm−3 from 07:00 to 08:00 UTC, which occurred during a similar time that the AOS cameras observed the daily maintenance of the runway with diesel trucks from 07:45 and 08:30 UTC. The second period from 20:00 to 21:00 with mean Ntot > 800 cm−3 was attributed to unknown potential aerosol sources at this time.
The diurnal variation observed in the mean Ntot at C1 in the summer was not observed in the median Ntot. Hourly averaged medians exhibited low variability throughout the day with a minimum of 380 cm−3 during the night between 23:00 and 24:00 UTC. A maximum of 506 cm−3 was observed in the late afternoon between 17:00 and 18:00 UTC.
At ENA, the periods with the largest deviation between the median and mean Ntot were the three periods when most of the flights occurred at the airport. A diurnal variation was observed in the mean Ntot yet was not statistically relevant for the median Ntot of the same data at C1 and S1. While not shown here, S1 had a similar trend in the diurnal profile to what was observed at C1 in the summer. The main difference was that the mean Ntot values were all < 1000 cm−3. Winter data at C1 also had the highest mean Ntot values and deviations from the medians during the hours of airport operations. We use the information from the diurnal profiles at ENA to validate the statement that the airport operations and associated activities were the largest sources of high-concentration Ntot observed at ENA.
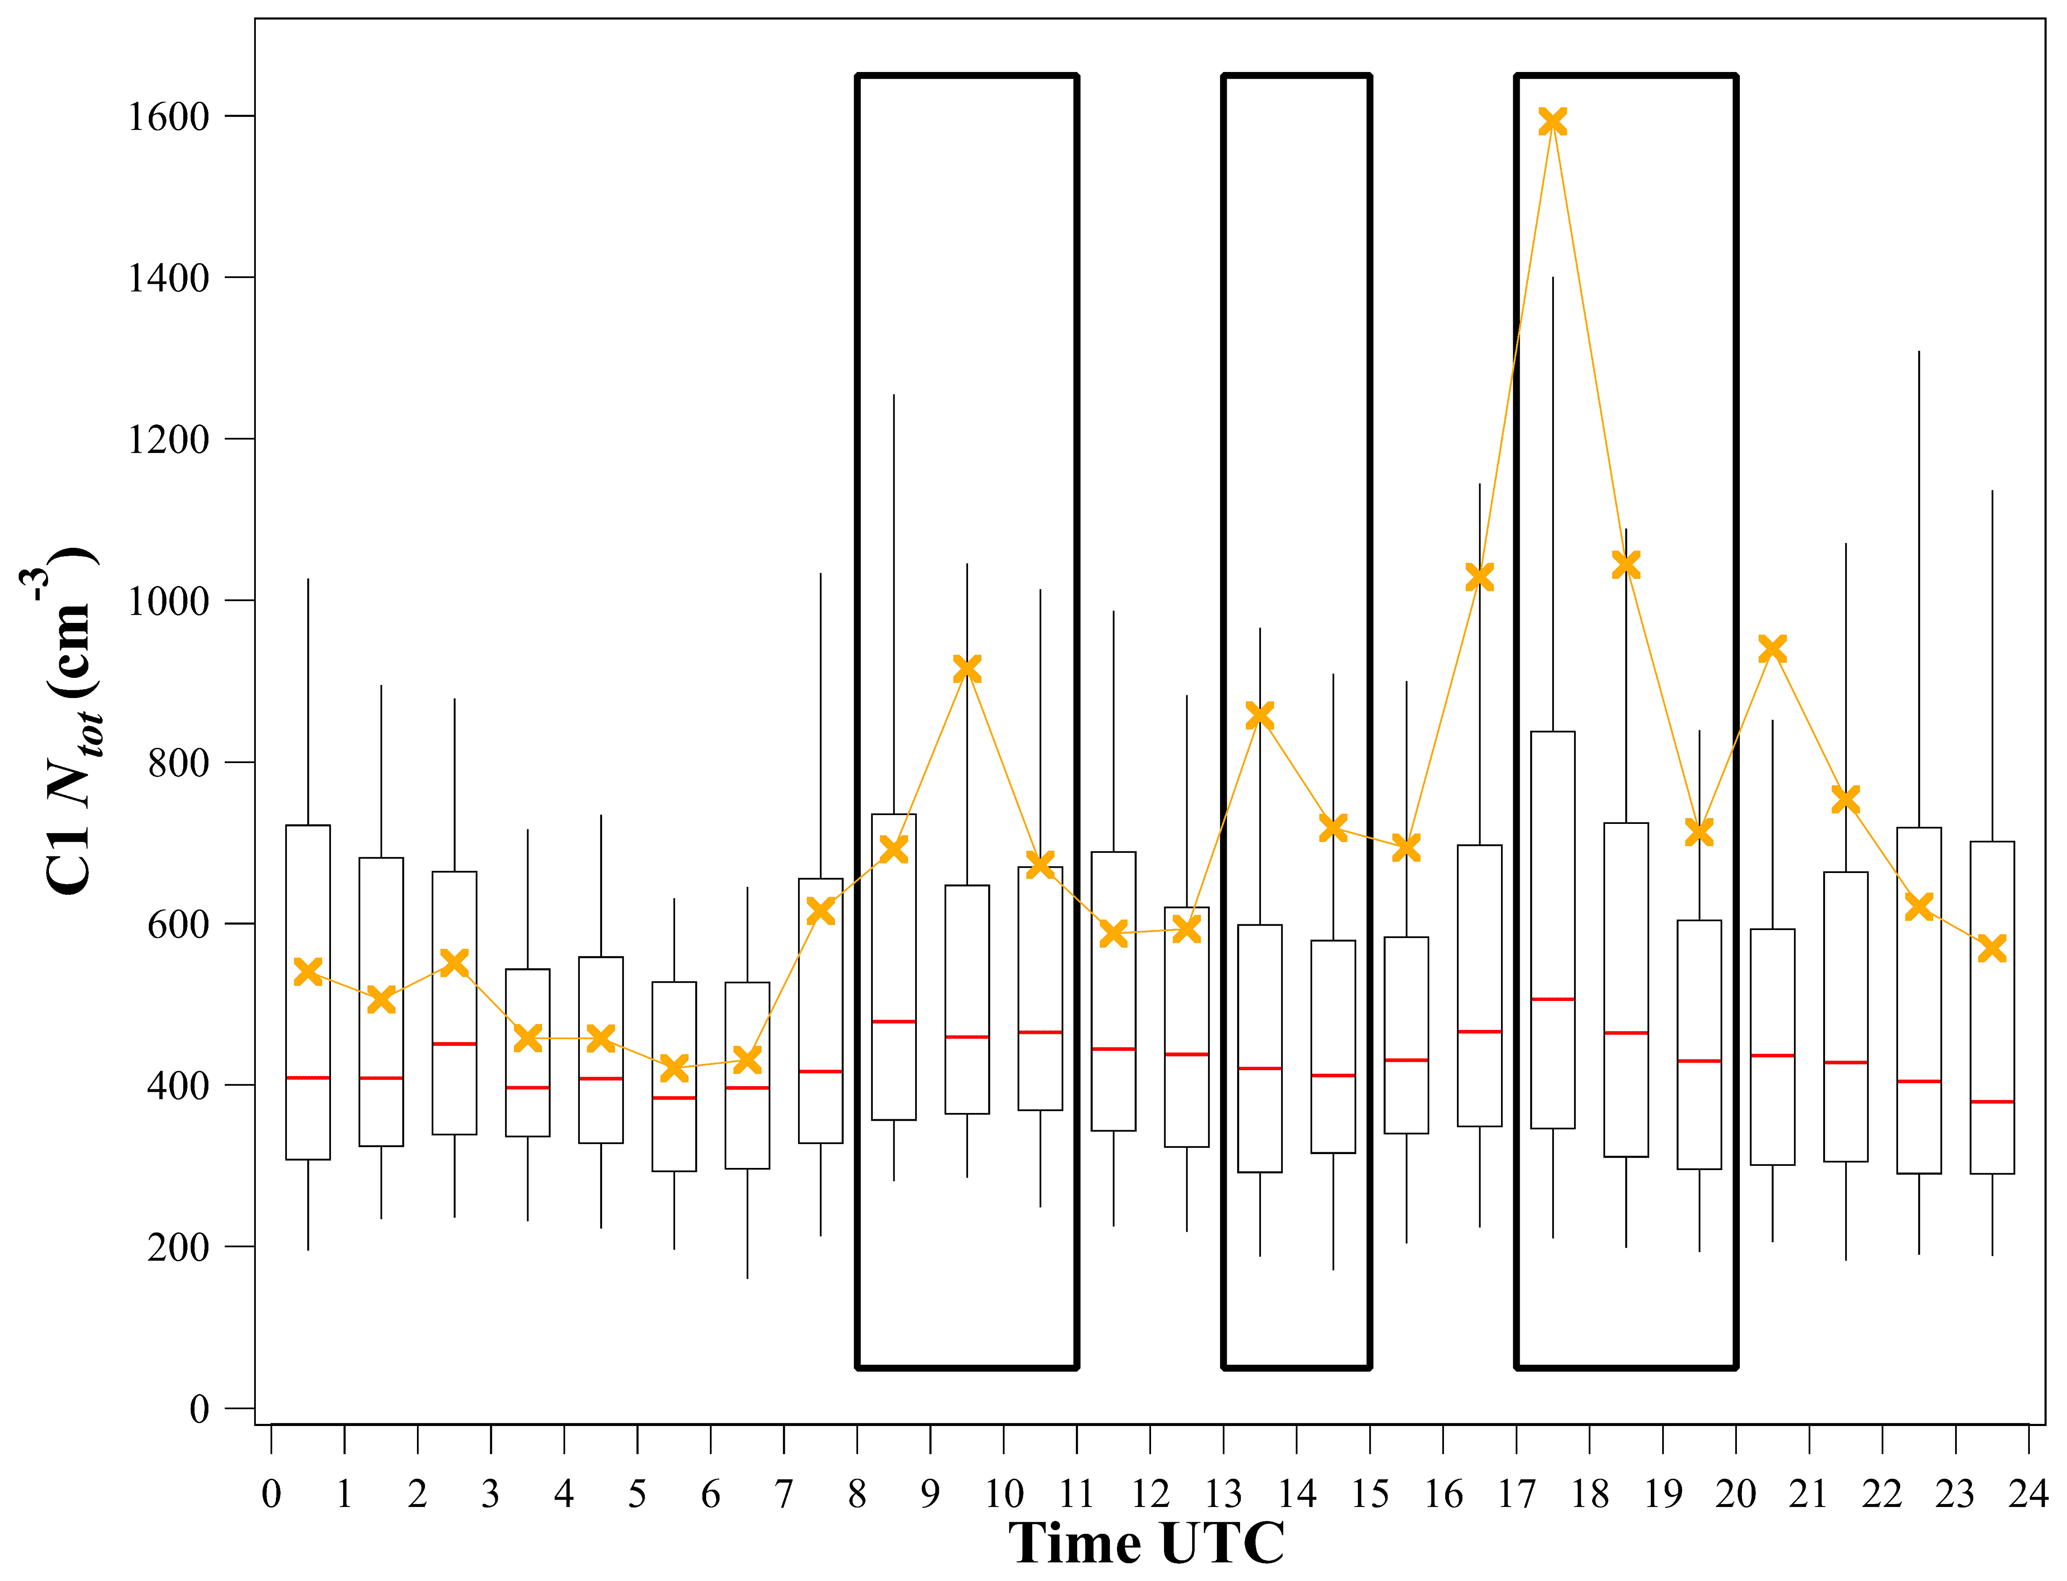
Figure 7Box and whisker diurnal profile of Ntot at C1 during summer. Ntot mean (orange x) and median (red line). Black boxes from 08:00–10:00, 13:00–15:00, and 17:00–20:00 UTC indicate the three daily time periods when aircraft were present at the Graciosa Airport.
4.4 High-number-concentration aerosol event mask
4.4.1 Algorithm parameterization and validation
To apply a mathematical algorithm to mask high-Ntot events at C1 and S1, we first calculated the standard deviation of the data below the median (σb). We found σb values of 298 and 264 cm−3 for C1, respectively in the summer and winter, and σb values of 234 cm−3 for S1 in the summer. Then, we conducted a sensitivity test to select the optimal parameterization of the algorithm to apply to the 1 min resolution Ntot data at ENA using the combination of the α parameter and thresholding method shown in Table 1, Sect. 3.2. First, we analyzed the efficiency of six parameterizations to detect high-Ntot aerosol events that were independently validated using additional collocated measurements at C1 (AOS camera and airport flight logs). Subsequently, we assessed the percentage of data removed and the R2 generated between masked Ntot at C1 and S1. Finally, we evaluated the ability of the best parameterizations to discriminate short-lived high-Ntot events from periods when ENA was affected by long-range-transported continental aerosol. In our analysis, we use 1-month time periods as the utilization of longer periods was found to bias the characterization of the regional baseline due to seasonality, which could accentuate long-term variabilities and confuse the high signal of local events (El Yazidi et al., 2018). Previous studies use the random walk (RW) threshold for aerosol data. Drewnick et al. (2012) proposed using α=3 to remove sharp and short peaks lasting a few seconds in Ntot from CPC and gas-phase CO measurements from a mobile aerosol research laboratory. The authors found that the application of the α3-RW parameterization worked well when the density of the high-concentration events was low. Similarly, El Yazidi et al. (2018) used α1-RW with gas-phase CO2 and CH4 data at four different stations in Europe that were affected by sharp events over time periods of a few minutes. The α1-RW parameterization was able to detect ∼96 % of the events that were visually identified by the station manager. Therefore, we began at ENA by testing three α values with the RW threshold that were used in these two studies.
We present, in Fig. 8, the results from the application of the algorithm over the same 24 h period that we analyzed in Sect. 4.3, Fig. 6. The first three parameterizations selected, α05-RW, α1-RW, and α3-RW, were able to identify the first data points during a high-Ntot event but were not able to identify events that occurred for extended periods of time on the order of hours, as is shown in Fig. 8a for the application of α3-RW at C1. While α05-RW and α1-RW are not included in the figure for simplicity, similar results were produced from these parameterizations. Next, we constrained the threshold more by applying the TP method with the same α values. For both C1 and S1 sites and seasons, the α05-TP (not shown for simplicity) and the α1-TP parameterization were the only parameterizations able to identify longer-duration events that lasted from minutes to hours, as were experienced due to airport operations as shown in Fig. 8b. Results from α3-TP were not included in the figure as the combination of the relaxed α and constrained two-point threshold parameters, α3-TP, yielded similar results to the RW threshold parameterizations tested previously. The α3-TP parameterization was not able to identify the longer-duration high-Ntot events. In conclusion, when high-Ntot events had durations on the order of hours, the difference in the signal between the adjacent points was not high enough to be identified by either the RW threshold or the higher α=3 parameter combinations tested at C1.
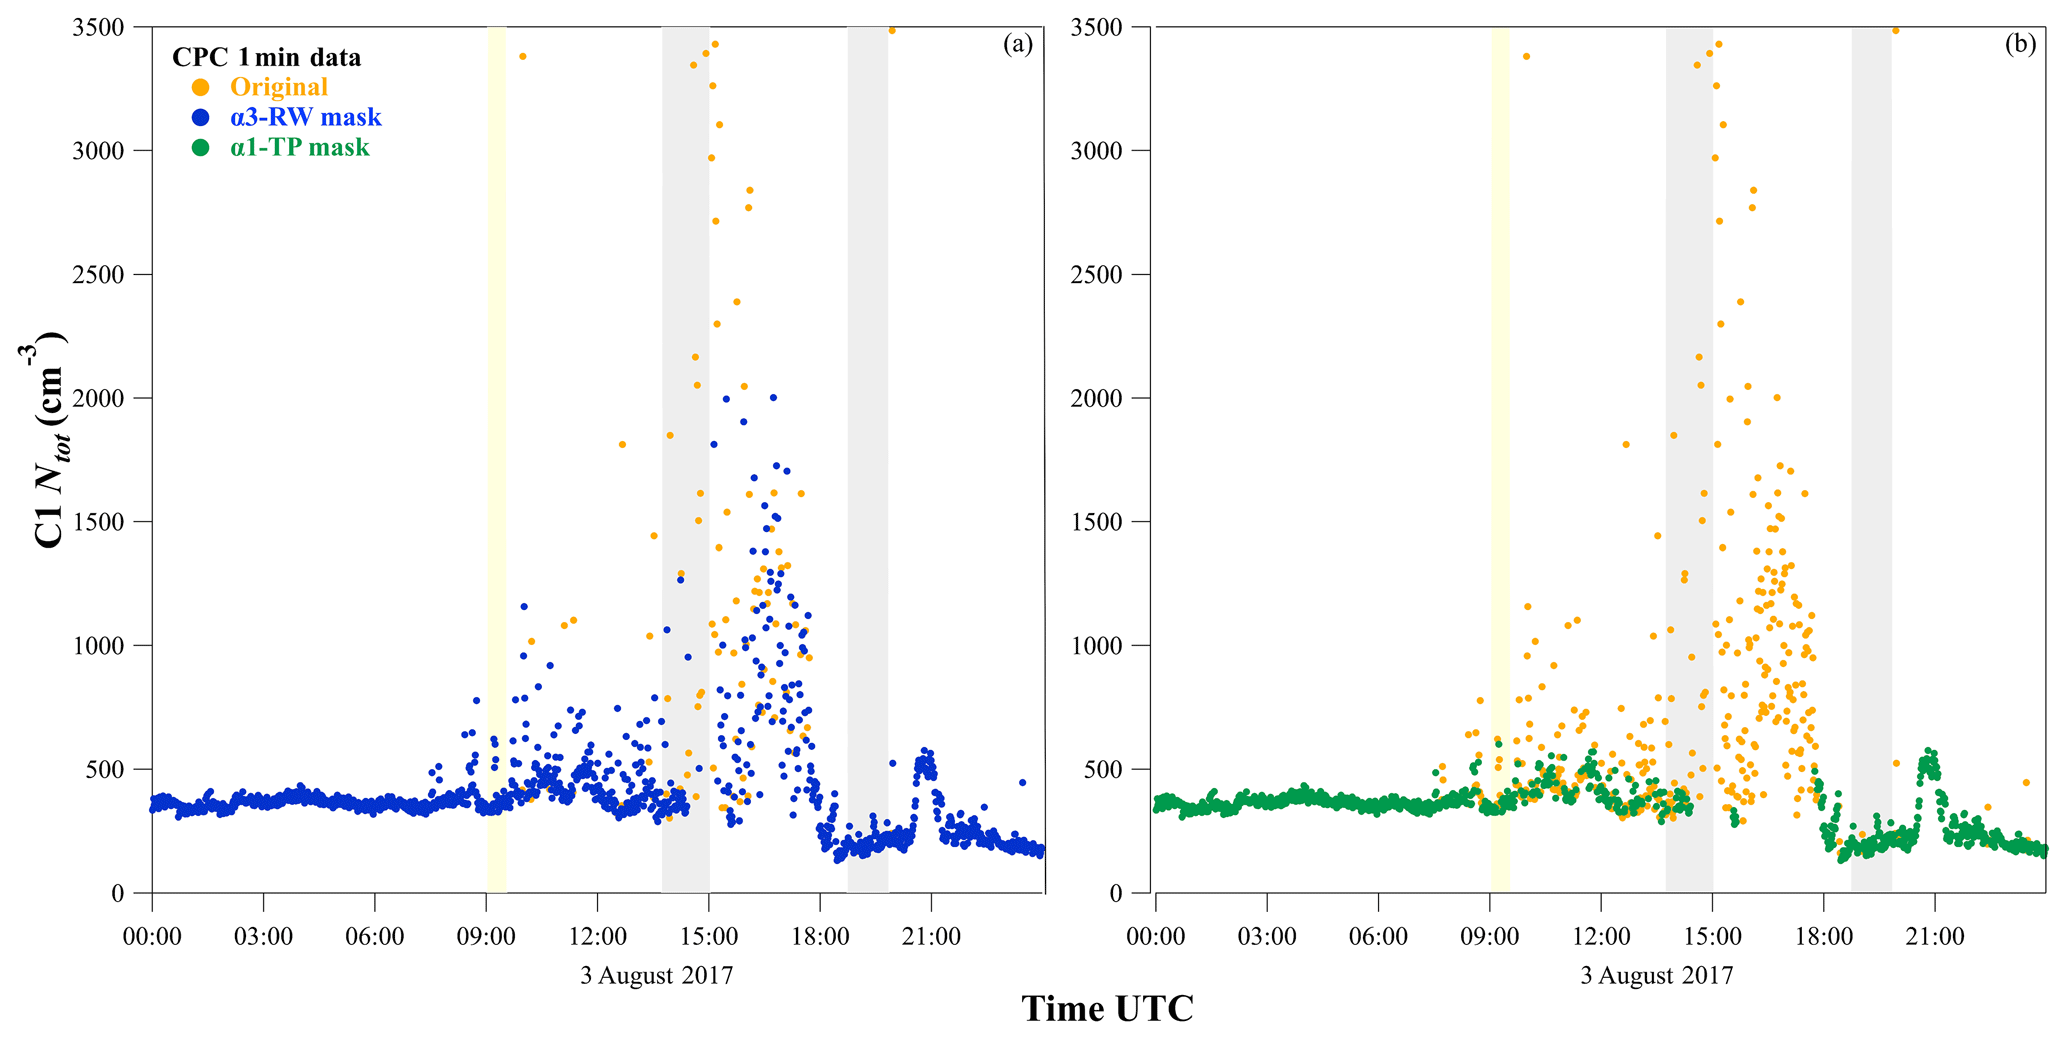
Figure 8Original (orange points) and masked Ntot at C1 using (a) α3-RW (blue points) and (b) α1-TP (green points) parameterizations over a 24 h period on 3 August 2017. Yellow and gray boxes indicate periods when the AOS cameras at C1 detected trucks and planes, respectively, on the runway.
Similar results were obtained when we tested the six parameterizations of the algorithm on Ntot at S1 (not shown). As we observed at C1, the tightest combinations of parameters, α05-RW and α1-TP, were able to most accurately identify all of the high-Ntot events of all the parameterizations tested here. The higher α values and the random walk threshold relaxed the algorithm such that the number of data points identified was likely to underestimate the number and duration of high-Ntot events observed at ENA.
Due to the diverse high-Ntot events and local sources at ENA, the R2 value between Ntot measurements collected at C1 and S1 in the summer was minimal (Fig. 9, R2=0.03, slope ). In Table 2, we show a comparison of the percentage of data that were masked and the R2 values with corresponding slopes after applying the parameterizations of the algorithm.
Table 2R2 values and percentage of masked Ntot data during summer at C1 and S1 using six different combinations of the α parameter and thresholding methods.

Application of the RW threshold generated R2 values ≤0.8 between C1 and S1 independent of α. The highest α value (α=3) with the TP threshold generated similarly low regressions between the two ENA sites (R2=0.79, slope ) confirming that the α3-TP parameterization was not able to detect all of the local aerosol events. After applying the α0.5-TP and the α1-TP parameterizations, the linear regressions and slopes were closer to unity. α0.5-TP generated a R2=0.88 with a slope and α1-TP a R2=0.87 with a slope (data fit through zero by orthogonal distance regression). The percentages of masked data were 35 % (α0.5-TP) and 26 % (α1-TP) at C1 and 23 % (α0.5-TP) and 15 % (α1-TP) at S1. C1 retained a higher Ntot, likely due to incomplete removal of sources discussed in Sects. 4.1 and S4. The variability in the original Ntot due to high-concentration aerosol events was removed, and a regional baseline was able to be identified based on the agreement between the two locations within measurement and mask uncertainties.
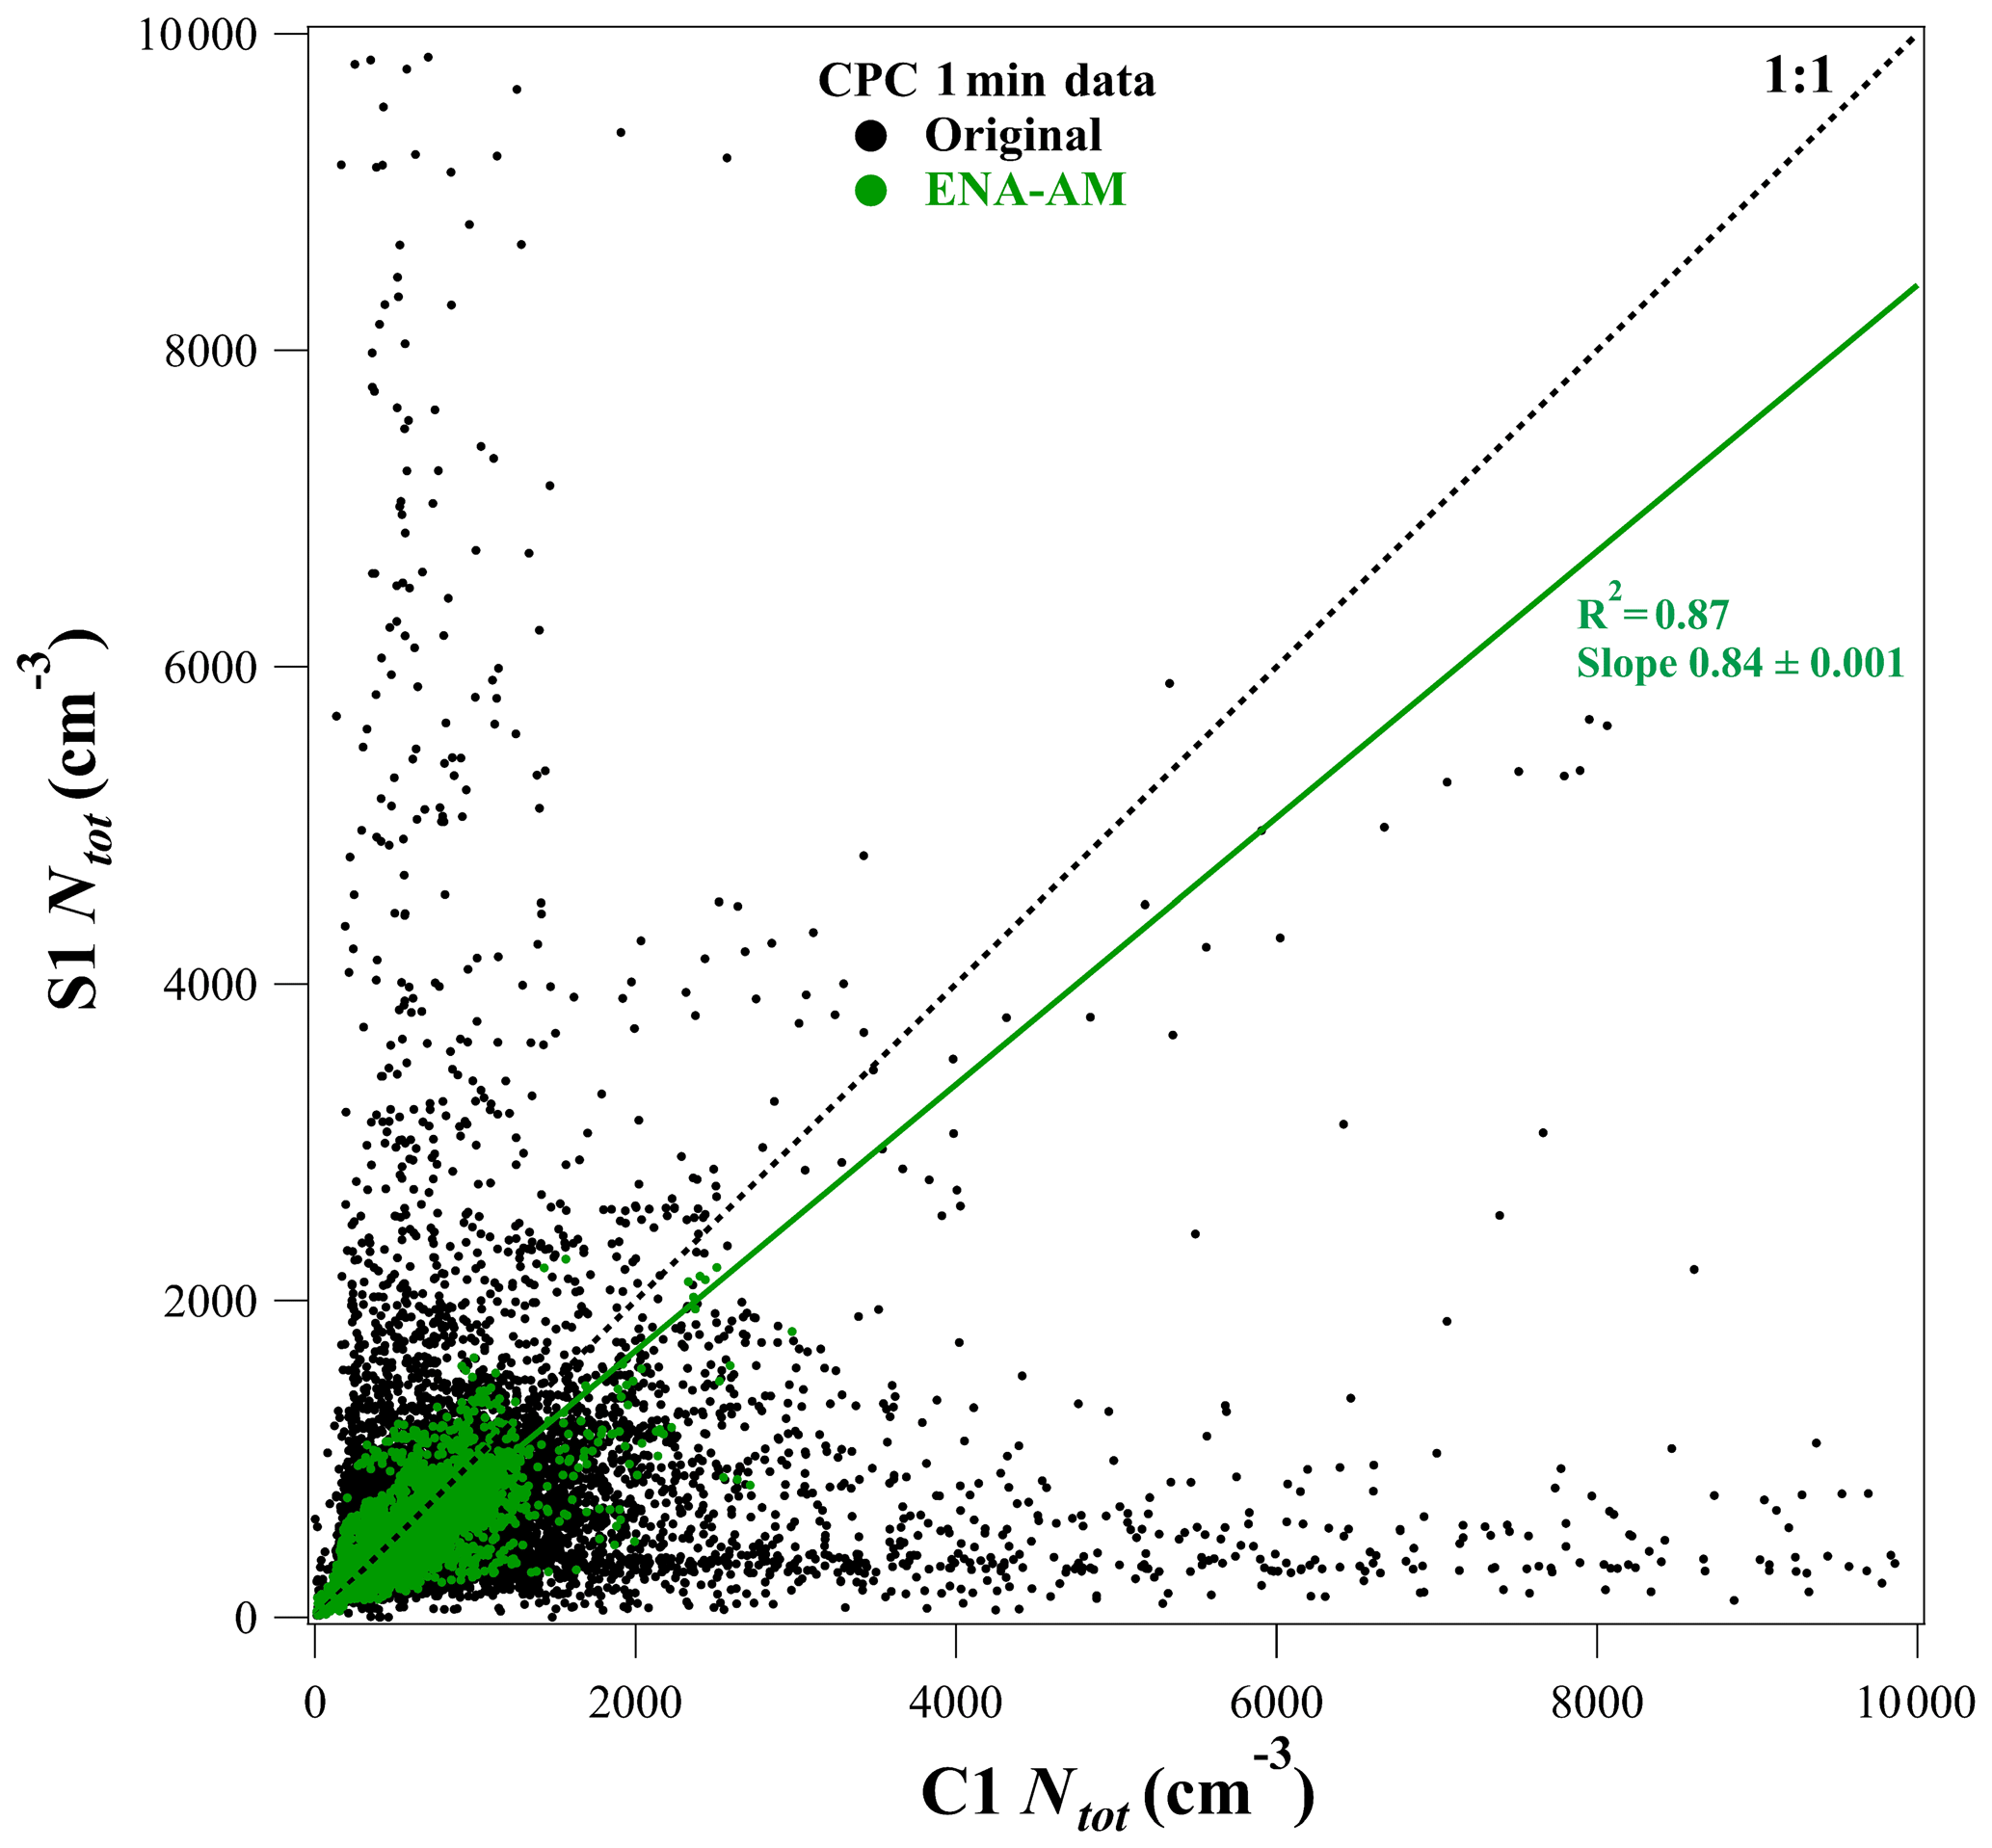
Figure 9Scatter plot of Ntot at C1 and S1 in the summer. Original 1 min data (black) are shown with ENA-AM masked data (green).
Furthermore, we evaluated the ability the α0.5-TP and the α1-TP parameterizations to mask short-lived high-Ntot events during periods when ENA was sampling long-range-transported aerosol. Periods with elevated aerosol concentrations due to long-range-transported continental sources have been observed to occur at ENA for durations on the order of days to weeks (Zheng et al., 2018). Through the analysis of back trajectories and aerosol optical properties, here we identify and present an episode of transported aerosol from Central Africa and the Canary Islands from 7 to 12 January 2017 (Fig. 11a). During this time, Ntot at ENA remained above 700 cm−3. The transported aerosol was likely due to a mixture of mineral dust and carbonaceous aerosol species from biomass burning sources (Logan et al., 2014), as have been observed from other continental sources at ENA. After applying the two parameterizations of the algorithm, we observed that during the long-range-transported aerosol event, at C1, the α05-TP approach removed 47 % versus 29 % of the data with α1-TP. The α05-TP algorithm was not able to discriminate between variations in the baseline due to regional processes, e.g., entrainment of particles from the free troposphere due to long-range-transport events shown in Fig. 10, from weak local aerosol events from unattributed local sources. After applying the α1-TP parameterization to Ntot at C1 we observed that the majority of the data associated with the multiday event were retained with the baseline Ntot. Simultaneously, the short-duration high-Ntot events, attributed to local sources, were also removed (Fig. 10b). We use the results from this case study to further validate the application of ENA-AM using α1-TP with 2 min Ntot data during periods when multiday entrained long-range-transported aerosol was sampled at ENA.
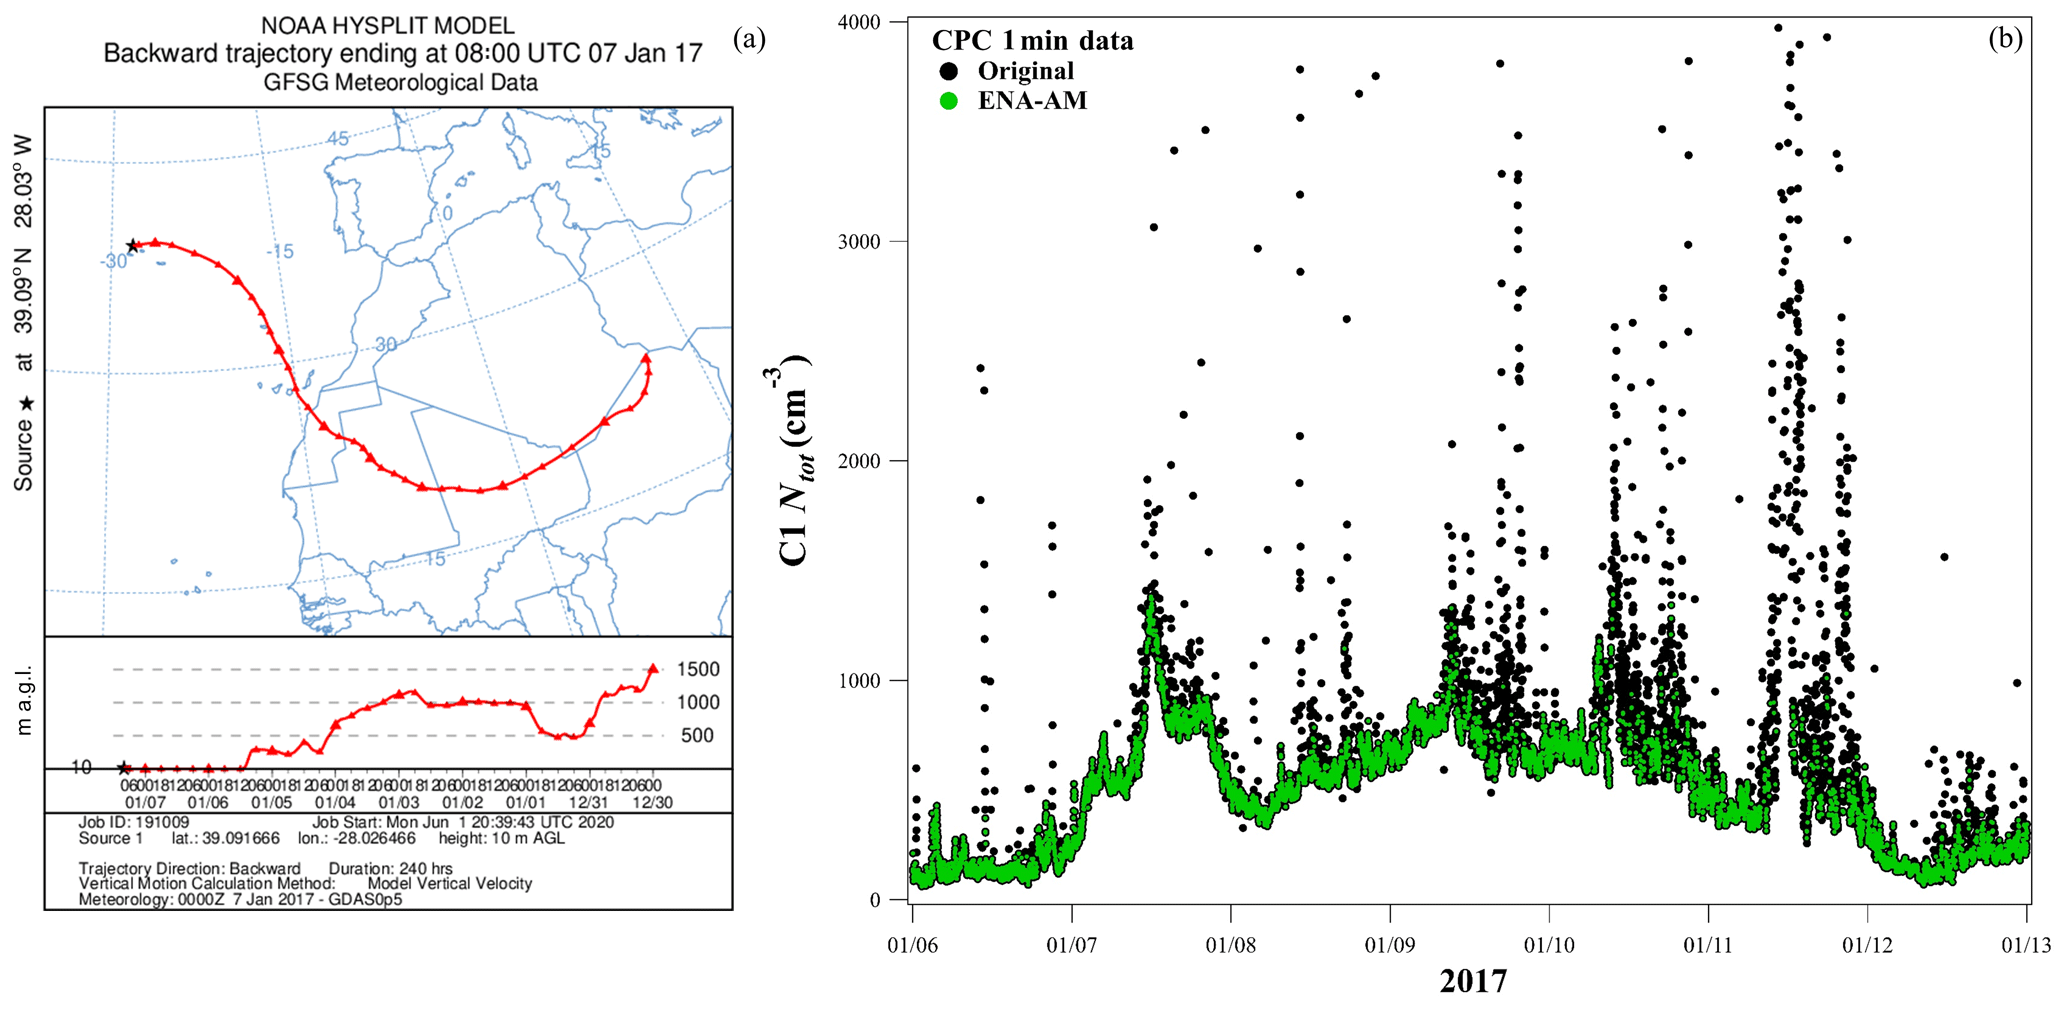
Figure 10An episode of long-range-transported continental aerosol at C1 determined (a) with an 8 d back trajectory arriving at 10 m a.g.l. and (b) elevated Ntot with original (black) and masked (green) data using ENA-AM.
Therefore, we used the α1-TP parameterization to create an aerosol mask at ENA, heretofore referred to as the ENA Aerosol Mask (ENA-AM), using 1 min resolution Ntot. At ENA the 1 min Ntot had sufficient time resolution to mask the high-Ntot events. Application to the higher-time-resolution 1 s Ntot data was not necessary based on the validation of ENA-AM presented here and saves computational time when analyzing continuous data.
4.4.2 Identification of a regional baseline and impact of ENA-AM on Ntot and NAc
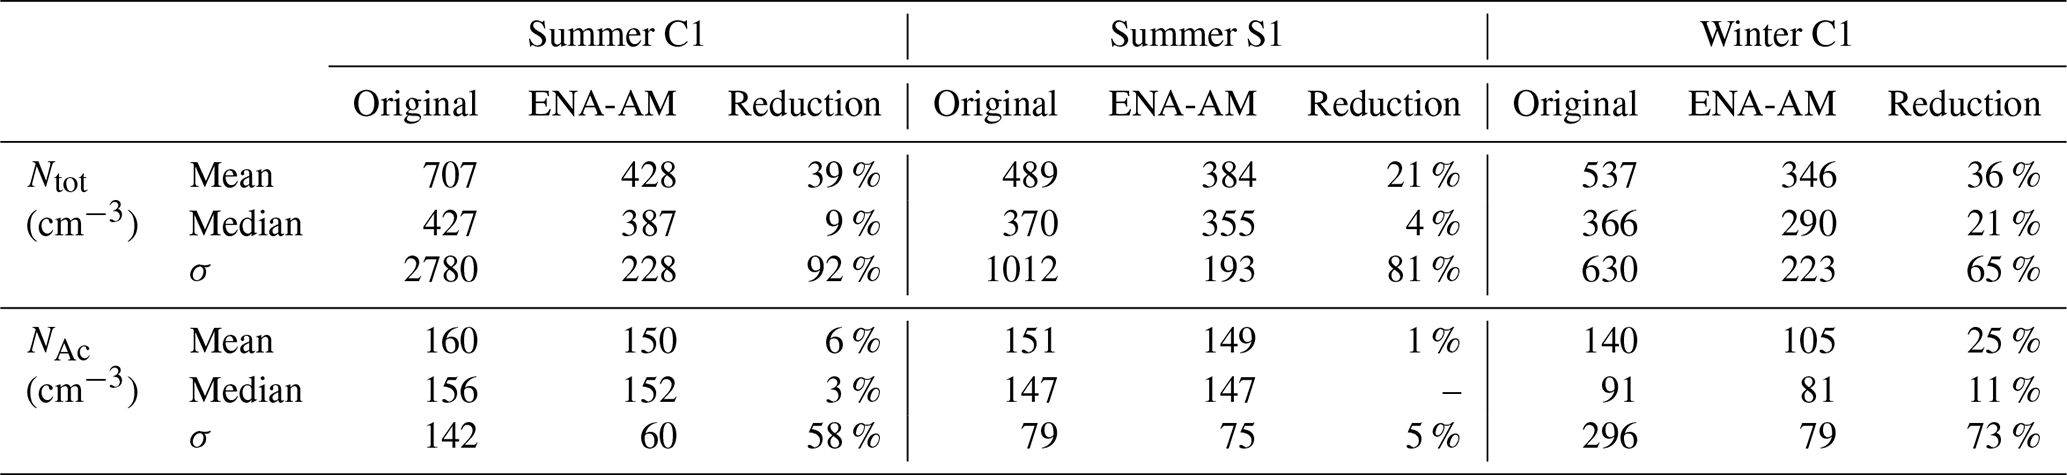
After the application of ENA-AM, we observed that mean, deviation between mean and median, and standard deviation Ntot all experienced reductions. In Table 3 we show mean, median, and standard deviations for the original and ENA-AM masked Ntot and NAc measurements at C1 and S1 in the summer and winter. After applying ENA-AM to C1 Ntot, mean and standard deviation values dropped from 707±2780 to 428±228 cm−3 in the summer and from 537±630 to 347±223 cm−3 in the winter. At S1, the decrease was lower yet still significant, from 489±370 to 384±355 cm−3. In the summer, ENA-AM mean Ntot was 9.1 % higher at C1 than at S1. Satellite images and analysis of local aerosol sources (see Supplement) show that C1 is located ∼1 km closer to urbanized areas and to the town of Santa Cruz than S1. The Ntot generated from these more distant and diffuse sources is likely too weak to be completely masked by ENA-AM as discussed in Sect. 4.5.1.
Contrarily to Ntot, in the summer, NAc mean, median, and the deviation between them remained largely unchanged after the application of ENA-AM. This is in agreement with Sect. 4.3.2, where we showed summer NAc was only minimally affected by local aerosol events. However, in the winter, mean, deviation between mean and median, and standard deviation NAc at C1 experienced a higher reduction when masked with ENA-AM (25 % for the mean, 51 % for the deviation between mean and median, and 73 % for the standard deviation). These results are likely related to the presence of additional sources in the winter (e.g., burning of wood for home heating) which might affect NAc in a way that was not masked completely by ENA-AM.
Table 3Mean, median, and standard deviations (σ) of original and ENA-AM masked 1 min Ntot at C1 and S1 during the summer and winter.
To estimate the influence of local aerosol events on daily Ntot and NAc, we investigated the deviation between the original and ENA-AM masked Ntot and NAc daily means at C1 in the summer and winter in Fig. 11. We observed that after applying ENA-AM, depending on the day, Ntot daily means experienced reductions varying between 7 % and 81 % in the summer and between 2 % and 67 % in the winter. NAc reductions were lower than 27 % in the summer and 40 % in the winter (with the exception of two days, 16 and 22 December, when NAc daily means experienced reductions of 61 % and 80 %). As already observed in Sect. 4.2, at ENA, especially in the summer, local sources are mainly responsible for the emission of small particles in the At mode, while the Ac mode is generally only minimally impacted. Thus, in general, the reduction in NAc after masking the data does not impact the daily mean values as much as it does for Ntot. The higher daily mean reductions observed for Ntot in comparison to NAc after the utilization of ENA-AM demonstrated that the algorithm was able to selectively detect and isolate periods impacted by local aerosol events without having to use size distribution data. The high original Ntot and NAc daily means and the large deviation after application of ENA-AM (80 %) observed on 22 December were exceptions likely related to a poor-efficiency combustion source, a bulldozer, not normally present at C1 that was observed by the AOS cameras. The time series plots highlight NAc up to 11 000 cm−3 between 14:50 and 18:30 UTC. Thus, while Ntot and NAc measurements were impacted, ENA-AM was able to mask the data.
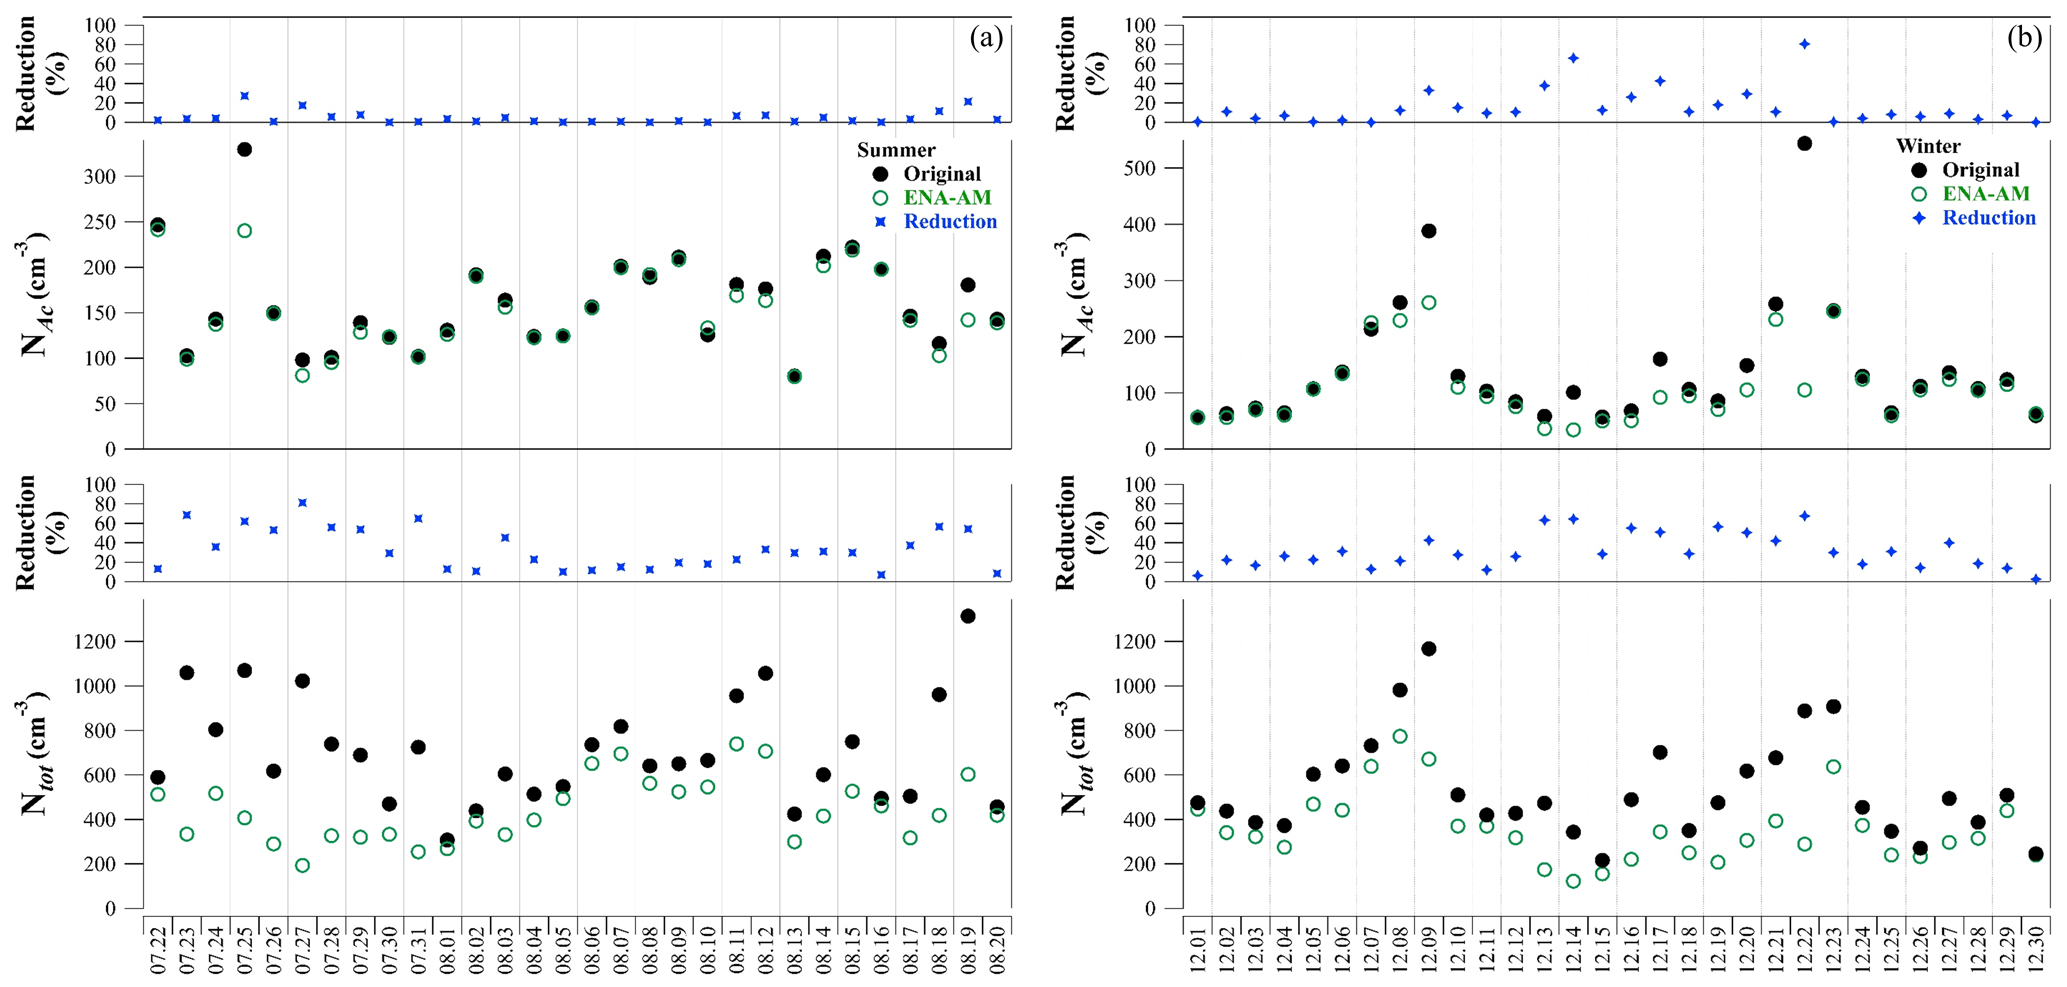
Figure 11Original (black) and ENA-AM masked (green) Ntot and NAc daily means at C1 and corresponding reduction (%) (blue) in the (a) summer and (b) winter.
4.4.3 Comparison of ENA-AM to other masks
We tested using wind direction to mask local aerosols by applying a meteorological mask to remove C1 and S1 Ntot measurements as a function of the wind directions associated with the airport (west to northwest and southeast to south at C1 and east to south at S1). After applying the meteorological mask at C1, 38.9 % in the summer and 62.0 % in the winter of the AOS data were removed. Similarly, at S1 43.4 % of the data in the summer were masked. Only 9.8 % of the C1 and S1 Ntot datasets remained for comparison between C1 and S1, which limited our ability to determine the regional background. The linear regression generated an R2 of 0.18, likely due the paucity of data. Therefore, masking AOS data based on wind direction resulted in the rejection of too much data to define a regional baseline aerosol.
Masking AOS data at ENA utilizing the associated metadata, such as AOS motion-activated cameras and airport flight logs, was not able to identify all of the periods impacted by local aerosol sources. However, analysis of videos and airport flight logs were useful to confirm the presence of the aircraft at the airport to validate the application of an aerosol mask. These observations and metadata were therefore used to validate the application of ENA-AM as discussed in Sect. 3.2.
Application of smoothing algorithms has been shown to be effective in filtering measurements affected by events lasting less than 1 h (Liu et al., 2018) and that are associated with rapid increases in Ntot (up to 8520±36 780 cm−3) and cloud condensation nuclei concentrations > 1000 cm−3. While signals with these characteristics are present at ENA, there are also longer events that last several hours due to the complex sources associated with the local airport operations. When we applied the method at ENA, 98 % of the C1 Ntot data in the summer were masked (see Sect. S5 and Fig. S5 for further information). Further optimization would be required for locations such as ENA as the method is better suited for more remote locations with less pervasive local sources, such as are encountered on a ship or remote island (Goring and Nikora, 2002)
We tested a different mathematical algorithm to filter aerosol data based on previous work by Hagler et al. (2012). The authors applied the coefficient of variation algorithm to ultra-fine-particle concentrations and greenhouse gas data. At ENA, this method masked the dominant fraction of the data, which is 72 % at C1 in the summer. We were not able to validate the additional reductions in comparison to ENA-AM with other observations or collocated measurements. Periods with known long-range-transported aerosol were also removed. Therefore, the application of this method was not pursued further at ENA.
Comparison was also made between ENA-AM and the 1 s time base filter developed by Zheng et al. (2018) at ENA. Conducted at C1 over two 3-month periods in the summer (June to August 2017) and winter (December 2016 to February 2017), the authors found similar baseline values for Ntot measurements (513±314 in the summer and 383±300 cm−3 in the winter). They also reported similar NAc mean and standard deviation values (143±81 in the summer and 92±89 cm−3 in the winter) after the additional step of lognormal fitting the size distributions to what we report here with ENA-AM. We validate the original Zheng et al. (2018) algorithm with the additional supplementary site data using the data from our summer ENA-AM period. We recreated the Zheng et al. (2018) mask on the original 1 s time base and applied it to our summer period at C1. We found that it agreed with ENA-AM 68 % of the time (see Sect. S5). ENA-AM removed less data than the Zheng et al. (2018) method when mapped onto a 1 min time base (26 % versus 41 %). ENA-AM was also developed to operate on a longer time base (1 min versus 1 s) to reduce computational requirements.
4.4.4 Masked AOS data and AAF overflights
After determining the regional baseline for Ntot from the ground AOS measurements at ENA, we compare ENA-AM masked C1 Ntot with AAF Ntot data in Fig. 12. We restricted our comparison of Ntot from the AAF to an area within a 10 km diameter box centered at C1 at altitudes ≤500 m. Before applying ENA-AM, the R2 value obtained from comparing the original C1 Ntot and AAF measurements from seven overflights (data not shown) was poor (R2=0.26). After applying ENA-AM at C1, we obtained an R2 of 0.71 and a slope of 1.04±0.01, which indicated a good agreement between the AOS and AAF data. The largest deviations from the 1:1 line occurred during two flights, on 21 June (RF1) and 29 June (RF6). On 21 June the AAF flew over Graciosa Island at two distinct times (12:00 and 13:30) during the day that we represent as two different periods in Fig. 12. While the AAF and C1 Ntot data fell on the 1:1 line within measurement uncertainties for the first period during RF1, C1 sampled an average of 43 % more Ntot than the AAF during the second flyover. The second flyover might have coincided with a period of time when C1 was affected by local events that ENA-AM was not able to identify and mask, as discussed in the paragraph above. Unfortunately, due to a lack of data at S1 during this time, this could not be verified. The largest deviation from the 1:1 line of all flights was observed on 29 June when higher Ntotwas observed by the AAF. The mean Ntot was 659±17 at C1 and 1141±828 cm−3 at AAF. The flight trajectory indicated that the AAF flew south of C1 over the center of the island and around the town of Santa Cruz and two smaller towns, Guadalupe and Vitoria, on an ascending path. The AAF Ntot measurements might be affected by local aerosol when the AAF flew over these urbanized areas. AAF Ntot measurements might also have been biased by AAF emissions sampled through the aerosol inlet while the aircraft was gaining altitude. The standard deviation of the AAF data was also significantly greater than what was observed at C1, indicating the AAF likely intercepted plumes not observed at C1 during this time. Further analysis of the AAF data from RF6 would be required to determine the source of the discrepancy with the AOS data.
The high R2 obtained from the masked C1 and AAF Ntot demonstrated that aerosol in the summer was well mixed within the first 500 m of the marine boundary layer. This is likely due to the high-sea-level-pressure system and advection in the summer at ENA which might enhance submicron aerosol mixing within the MBL (Davis et al., 1997). Since our focus here was on summer data at ENA due to the deployment of S1 to constrain C1 measurements, the winter season and vertical characterization of the MBL was beyond the scope here. During the winter, aerosol in the MBL is expected to be less well mixed due to a strong polar front activity and low-pressure system (Barbosa et al., 2017). Therefore, we expect less correlation between the AOS data and the AAF in the winter than what was observed in the summer.

Figure 12Scatter plot of ENA-AM masked C1 Ntot and AAF Ntot collected within 10 km from C1 and at altitudes ≤500 m.
High-concentration aerosol events were observed in the AOS data at the ENA central facility. Analysis of the submicron aerosol concentrations and size distributions were used with collocated meteorological data (wind direction) to associate high-concentration aerosol events with potential local aerosol sources. Total submicron and Aitken-mode aerosol were the most affected as determined by wind direction and should be masked before conducting ambient aerosol process studies at ENA. Accumulation-mode aerosol was less impacted, especially in the summer. Ac mode might then be used without applying an aerosol mask as representative of the regional aerosol.
We developed a novel aerosol mask at ENA called ENA-AM and validated its application by using two measurement locations located within 1 km of each other. The temporary supplementary site was deployed to validate the new aerosol mask at the central facility with the AOS. Time periods impacted by high-concentration aerosol events were removed, and we were able to define a regional baseline for the submicron number concentration data at ENA during the summer and winter. The masked submicron aerosol number concentrations from the ground site were compared with the AAF aircraft data during flights over the facility. It was possible to determine a well-mixed regional aerosol within the first 500 m of the marine boundary layer for the data presented here collected during the summer ACE-ENA IOP.
Application of ENA-AM required measurements in which (1) the time resolution of the dataset was shorter than the typical length of the event and (2) the variation within the baseline data was smaller than the variation during the periods containing local aerosol. The CPC 1 min submicron number concentration data satisfied these requirements at ENA. Therefore, we developed an algorithm using the CPC data at ENA that could be applied to the AOS data for studying regional aerosol processes. After the application of ENA-AM, 26 % of the 1 min data at C1 and 15 % at S1 were masked in the summer. ENA-AM masked a lower percentage of the data than the wind direction mask, which masked 39 % of the data at C1 data and 43 % at S1. Compared to the meteorological method, ENA-AM removed approximately half of the data compared to the mask based on wind direction and, more importantly, resulted in a higher R2 between the sites, 0.87 versus 0.18. Minimal deviations between the original median Ntot and ENA-AM mean values at C1, respectively, were 427 and 428 particles cm−3 (summer) and 370 and 384 particles cm−3 (winter). Therefore, it is possible that median values might be used to study longer-term trends in the data without applying an aerosol mask. While useful, for example, to study seasonal trends, this approach would not be suitable for studying short-time-period aerosol variability on the order of minutes to hours as is required in ambient aerosol process research. For this reason, application of an aerosol mask such as ENA-AM is recommended even at remote locations, when studying high-time-resolution submicron aerosol processes, especially those focused on Aitken-mode particles. Application of ENA-AM, or other aerosol masks, is possible at other locations with AOS or similar data. Validation should include comparison with other collocated measurements, observations, and metadata when available.
Data were obtained from the Atmospheric Radiation Measurement (ARM) user facility, a U.S. Department of Energy Office of Science user facility sponsored by the Office of Biological and Environmental Research (available at https://doi.org/10.5439/1581730, Aiken and Gallo, 2020; https://doi.org/10.5439/1095587, ARM user facility, 2014a; https://doi.org/10.5439/1095587, ARM user facility, 2014b; https://doi.org/10.5439/1025153, ARM user facility, 2015a; https://doi.org/10.5439/1025153, ARM user facility, 2015b; https://doi.org/10.5439/1368538, ARM user facility, 2017; https://doi.org/10.5439/1046184, ARM user facility, 2019a; https://doi.org/10.5439/1046184, ARM user facility, 2014b; https://doi.org/10.5439/1579567, Gallo and Aiken, 2020a; https://doi.org/10.5439/1579568, Gallo and Aiken, 2020b).
The supplement related to this article is available online at: https://doi.org/10.5194/acp-20-7553-2020-supplement.
ACA and FG conceptualized the analysis and wrote the manuscript. FG led the analyses with additional input from JU, StS, RW, and FM. ACA was the project administrator. All authors were involved in helpful discussions and contributed to the manuscript.
The authors declare that they have no conflict of interest.
This article is part of the special issue “Marine aerosols, trace gases, and clouds over the North Atlantic (ACP/AMT inter-journal SI)”. It is not associated with a conference.
The work was supported by the Atmospheric Radiation Measurement (ARM) program, funded by the U.S. Department of Energy (DOE), Office of Science, Office of Biological and Environmental Research. We acknowledge the ARM Research Facility, a user facility of the U.S. DOE, Office of Science, sponsored by the Office of Biological and Environmental Research for providing data. We also acknowledge the ENA ARM site manager, Heath Powers; operations manager, Paul Ortega; and site operators, Carlos Sousa, Tercio Silva, and Bruno Cunha.
This research has been supported by the U.S. Department of Energy (Atmospheric Radiation Measurement (ARM) program).
This paper was edited by Lynn M. Russell and reviewed by two anonymous referees.
Aiken, A. C. and Gallo, F.: Eastern North Atlantic Aerosol Mask (ENA-AM) with the Condensation Particle Counter (CPC) at Supplementary Facility (S01), US, N. p., https://doi.org/10.5439/1581730, 2020.
Albrecht, B. A., Bretherton, C. S., Johnson, D., Scubert, W. H., and Frisch, A. S.: The Atlantic Stratocumulus Transition Experiment–STEX, B. Am. Meteorol. Soc., 76, 889–904, https://doi.org/10.1175/1520-0477(1995)076<0889:taste>2.0.co;2, 1995.
Anderson, T. L., Charlson, R. J., Schwartz, S. E., Knutti, R., Boucher, O., Rodhe, H., and Heintzenberg, J.: Climate Forcing by Aerosols–a Hazy Picture, Science, 300, 1103–1104, https://doi.org/10.1126/science.1084777, 2003.
Atmospheric Radiation Measurement (ARM) user facility: 2014, updated hourly. Ultra-High Sensitivity Aerosol Spectrometer (AOSUHSAS). 2017-07-22 to 2017-12-30, Eastern North Atlantic (ENA) Graciosa Island, Azores, Portugal (C1), compiled by: Senum, G., Uin, J., Salwen, C., Uin, J., and Senum, G., ARM Data Center, https://doi.org/10.5439/1095587, 2014a.
Atmospheric Radiation Measurement (ARM) user facility: 2014, updated hourly. Ultra-High Sensitivity Aerosol Spectrometer (AOSUHSAS). 2017-07-22 to 2017-12-30, Eastern North Atlantic (ENA) Graciosa Island, Azores, Portugal; Supplemental Site (S1), compiled by: Senum, G., Uin, J., Salwen, C., Uin, J., and Senum, G., ARM Data Center, https://doi.org/10.5439/1095587, 2014b.
Atmospheric Radiation Measurement (ARM) user facility: 2015, updated hourly. Meteorological Measurements associated with the Aerosol Observing System (AOSMET). 2017-07-22 to 2017-12-30, Eastern North Atlantic (ENA) Graciosa Island, Azores, Portugal (C1), compiled by: Springston, S., Kyrouac, J., and Springston, S., ARM Data Center, Data set accessed 2018-10-22 at https://doi.org/10.5439/1025153, 2015a.
Atmospheric Radiation Measurement (ARM) user facility: 2015, updated hourly. Meteorological Measurements associated with the Aerosol 10 Observing System (AOSMET). 2017-07-22 to 2017-12-30, Eastern North Atlantic (ENA) Graciosa Island, Azores, Portugal; Supplemental Site (S1), compiled by: Springston, S., Kyrouac, J., and Springston, S., ARM Data Center, https://doi.org/10.5439/1025153, 2015b.
Atmospheric Radiation Measurement (ARM) user facility. 2017, updated hourly. Condensation particle counter aboard aircraft 20 (AAFCPCFISO). 2017-06-20 to 2017-07-20, Eastern North Atlantic (ENA) Gulfstream 159 Aircraft (F1), compiled by: Mei, F. and Pekour, M., ARM Data Center, https://doi.org/10.5439/1368538, 2017.
Atmospheric Radiation Measurement (ARM) user facility: 2019, updated hourly. Condensation Particle Counter (AOSCPCF). 2017-07-22 to 2018-01-31, Eastern North Atlantic (ENA) Graciosa Island, Azores, Portugal (C1), compiled by: Wang, J., Andrews, E., Kuang, C., Andrews, E., Salwen, C., and Boyer, M., ARM Data Center, https://doi.org/10.5439/1046184, 2019a.
Atmospheric Radiation Measurement (ARM) user facility: 2019, updated hourly. Condensation Particle Counter (AOSCPCF). 2017-07-22 to 2017-12-30, Eastern North Atlantic (ENA) Graciosa Island, Azores, Portugal; Supplemental Site (S1), compiled by: Wang, J., Andrews, E., Kuang, C., Andrews, E., Salwen, C., and Boyer, M., ARM Data Center, https://doi.org/10.5439/1046184, 2019b.
Barbosa, S. M., Miranda, P., and Azevedo, E. B.: Short-term variability of gamma radiation at the ARM Eastern North Atlantic facility (Azores), J. Environ. Radioactiv., 172, 218–231, https://doi.org/10.1016/j.jenvrad.2017.03.027, 2017.
Beaton, A. E. and Tukey, J. W.: The Fitting of Power Series, Meaning Polynomials, Illustrated on Band-Spectroscopic Data, Technometrics, 16, 147–185, https://doi.org/10.1080/00401706.1974.10489171, 1974.
Brantley, H. L., Hagler, G. S. W., Kimbrough, E. S., Williams, R. W., Mukerjee, S., and Neas, L. M.: Mobile air monitoring data-processing strategies and effects on spatial air pollution trends, Atmos. Meas. Tech., 7, 2169–2183, https://doi.org/10.5194/amt-7-2169-2014, 2014.
Bullard, R. L., Uin, J., Springston, S., Kuang, C., and Smith, S.: Aerosol Inlet Characterization Experiment Report, U.S. Department of Energy, Office of Science, DOE/SC-ARM_TR_191, 2017.
Burrows, S. M., Ogunro, O., Frossard, A. A., Russell, L. M., Rasch, P. J., and Elliott, S. M.: A physically based framework for modeling the organic fractionation of sea spray aerosol from bubble film Langmuir equilibria, Atmos. Chem. Phys., 14, 13601–13629, https://doi.org/10.5194/acp-14-13601-2014, 2014.
Cai, Y., Montague, D. C., Mooiweer-Bryan, W., and Deshler, T.: Performance characteristics of the ultra high sensitivity aerosol spectrometer for particles between 55 and 800nm: Laboratory and field studies, J. Aerosol Sci., 39, 759–769, https://doi.org/10.1016/j.jaerosci.2008.04.007, 2008.
Carslaw, K. S., Lee, L. A., Reddington, C. L., Pringle, K. J., Rap, A., Forster, P. M., Mann, G. W., Spracklen, D. V., Woodhouse, M. T., Regayre, L. A., and Pierce, J. R.: Large contribution of natural aerosols to uncertainty in indirect forcing, Nature, 503, 67–71, https://doi.org/10.1038/nature12674, 2013.
Cirino, G., Brito, J., Barbosa, H. M. J., Rizzo, L. V., Tunved, P., de Sá, S. S., Jimenez, J. L., Palm, B. B., Carbone, S., Lavric, J. V., Souza, R. A. F., Wolff, S., Walter, D., Tota, J., Oliveira, M. B. L., Martin, S. T., and Artaxo, P.: Observations of Manaus urban plume evolution and interaction with biogenic emissions in GoAmazon 2014/5, Atmos. Environ., 191, 513–524, https://doi.org/10.1016/j.atmosenv.2018.08.031, 2018.
Davis, R. E., Hayden, B. P., Gay, D. A., Phillips, W. L., and Jones, G. V.: The North Atlantic Subtropical Anticyclone, J. Climate, 10, 728–744, https://doi.org/10.1175/1520-0442(1997)010<0728:tnasa>2.0.co;2, 1997.
Dong, X., Xi, B., Kennedy, A., Minnis, P., and Wood, R.: A 19-Month Record of Marine Aerosol–Cloud–Radiation Properties Derived from DOE ARM Mobile Facility Deployment at the Azores. Part I: Cloud Fraction and Single-Layered MBL Cloud Properties, J. Climate, 27, 3665–3682, 10.1175/jcli-d-13-00553.1, 2014.
Drewnick, F., Böttger, T., von der Weiden-Reinmüller, S.-L., Zorn, S. R., Klimach, T., Schneider, J., and Borrmann, S.: Design of a mobile aerosol research laboratory and data processing tools for effective stationary and mobile field measurements, Atmos. Meas. Tech., 5, 1443–1457, https://doi.org/10.5194/amt-5-1443-2012, 2012.
El Yazidi, A., Ramonet, M., Ciais, P., Broquet, G., Pison, I., Abbaris, A., Brunner, D., Conil, S., Delmotte, M., Gheusi, F., Guerin, F., Hazan, L., Kachroudi, N., Kouvarakis, G., Mihalopoulos, N., Rivier, L., and Serça, D.: Identification of spikes associated with local sources in continuous time series of atmospheric CO, CO2 and CH4, Atmos. Meas. Tech., 11, 1599–1614, https://doi.org/10.5194/amt-11-1599-2018, 2018.
Fehsenfeld, F. C., Ancellet, G., Bates, T. S., Goldstein, A. H., Hardesty, R. M., Honrath, R., Law, K. S., Lewis, A. C., Leaitch, R., McKeen, S., Meagher, J., Parrish, D. D., Pszenny, A. A. P., Russell, P. B., Schlager, H., Seinfeld, J., Talbot, R., and Zbinden, R.: International Consortium for Atmospheric Research on Transport and Transformation (ICARTT): North America to Europe–Overview of the 2004 summer field study, J. Geophys. Res.-Atmos., 111, D23, https://doi.org/10.1029/2006jd007829, 2006.
Feingold, G. and McComiskey, A.: ARM's Aerosol–Cloud–Precipitation Research (Aerosol Indirect Effects), Meteorol. Monogr., 57, 22.21–22.15, https://doi.org/10.1175/amsmonographs-d-15-0022.1, 2016.
Gallo, F. and Aiken, A. C.: Eastern North Atlantic Aerosol Mask (ENA-AM) with the Condensation Particle Counter (CPC) at Central Facility (C1) during Summer 2017, US, N. p., https://doi.org/10.5439/1579567, 2020a.
Gallo, F. and Aiken, A. C.: Eastern North Atlantic Aerosol Mask (ENA-AM) with the Condensation Particle Counter (CPC) at Central Facility (C1) during Winter 2017, US, N. p., https://doi.org/10.5439/1579568, 2020b.
Gao, S., Cong, Z., Yu, H., Sun, Y., Mao, J., Zhang, H., Ma, Z., Azzi, M., Yang, W., Jiang, Y., Chen, L., and Bai, Z.: Estimation of background concentration of PM in Beijing using a statistical integrated approach, Atmos. Pollut. Res., 10, 858–867, https://doi.org/10.1016/j.apr.2018.12.014, 2019.
Giostra, U., Furlani, F., Arduini, J., Cava, D., Manning, A. J., O'Doherty, S. J., Reimann, S., and Maione, M.: The determination of a “regional” atmospheric background mixing ratio for anthropogenic greenhouse gases: A comparison of two independent methods, Atmos. Environ., 45, 7396–7405, https://doi.org/10.1016/j.atmosenv.2011.06.076, 2011.
Goren, T. and Rosenfeld, D.: Extensive closed cell marine stratocumulus downwind of Europe–A large aerosol cloud mediated radiative effect or forcing?, J. Geophys. Res.-Atmos., 120, 6098–6116, https://doi.org/10.1002/2015jd023176, 2015.
Goring, D. G. and Nikora, V. I.: Despiking Acoustic Doppler Velocimeter Data, J. Hydraul. Eng., 128, 117–126, https://doi.org/10.1061/(ASCE)0733-9429(2002)128:1(117), 2002.
Hagler, G. S., Lin, M. Y., Khlystov, A., Baldauf, R. W., Isakov, V., Faircloth, J., and Jackson, L. E.: Field investigation of roadside vegetative and structural barrier impact on near-road ultrafine particle concentrations under a variety of wind conditions, Sci. Total Environ., 419, 7–15, https://doi.org/10.1016/j.scitotenv.2011.12.002, 2012.
Hamilton, D. S., Lee, L. A., Pringle, K. J., Reddington, C. L., Spracklen, D. V., and Carslaw, K. S.: Occurrence of pristine aerosol environments on a polluted planet, P. Natl. Acad. Sci. USA, 111, 18466–18471, https://doi.org/10.1073/pnas.1415440111, 2014.
IPCC: Climate Change 2014: Synthesis Report. Contribution of Working Groups I, II and III to the Fifth Assessment Report of the Intergovernmental Panel on Climate Change, Core Writing Team, edited by: Pachauri, R. K. and Meyer, L. A., IPCC, Geneva, Switzerland, 151 pp., 2014.
Jimenez, J. L., Canagaratna, M. R., Donahue, N. M., Prevot, A. S. H., Zhang, Q., Kroll, J. H., DeCarlo, P. F., Allan, J. D., Coe, H., Ng, N. L., Aiken, A. C., Docherty, K. S., Ulbrich, I. M., Grieshop, A. P., Robinson, A. L., Duplissy, J., Smith, J. D., Wilson, K. R., Lanz, V. A., Hueglin, C., Sun, Y. L., Tian, J., Laaksonen, A., Raatikainen, T., Rautiainen, J., Vaattovaara, P., Ehn, M., Kulmala, M., Tomlinson, J. M., Collins, D. R., Cubison, M. J., Dunlea, J., Huffman, J. A., Onasch, T. B., Alfarra, M. R., Williams, P. I., Bower, K., Kondo, Y., Schneider, J., Drewnick, F., Borrmann, S., Weimer, S., Demerjian, K., Salcedo, D., Cottrell, L., Griffin, R., Takami, A., Miyoshi, T., Hatakeyama, S., Shimono, A., Sun, J. Y., Zhang, Y. M., Dzepina, K., Kimmel, J. R., Sueper, D., Jayne, J. T., Herndon, S. C., Trimborn, A. M., Williams, L. R., Wood, E. C., Middlebrook, A. M., Kolb, C. E., Baltensperger, U., and Worsnop, D. R.: Evolution of Organic Aerosols in the Atmosphere, Science, 326, 1525–1529, https://doi.org/10.1126/science.1180353, 2009.
Kuang, C.: Condensation Particle Counter (CPC) Instrument Handbook, U.S. Department of Energy, Office of Science, DOE/SC-ARM-TR-145, 2016.
Kyrouac, J.: Aerosol Observing System Surface Meteorology (AOSMET) Instrument Handbook, U.S. Department of Energy, Office of Science, DOE/SC-ARM-TR-184, 2016.
Liu, J., Dedrick, J., Russell, L. M., Senum, G. I., Uin, J., Kuang, C., Springston, S. R., Leaitch, W. R., Aiken, A. C., and Lubin, D.: High summertime aerosol organic functional group concentrations from marine and seabird sources at Ross Island, Antarctica, during AWARE, Atmos. Chem. Phys., 18, 8571–8587, https://doi.org/10.5194/acp-18-8571-2018, 2018.
Logan, T., Baike, X., and Xiquan, D.: Aerosol properties and their influences on marine boundary layer cloud condensation nuclei at the ARM mobile facility over the Azores, J. Geophys. Res.-Atmos., 119, 4859–4872, https://doi.org/10.1002/2013JD021288, 2014.
Lubin, D., Zhang, D., Silber, I., Scott, R. C., Kalogeras, P., Battaglia, A., Bromwich, D. H., Cadeddu, M., Eloranta, E., Fridlind, A., Frossard, A., Hines, K. M., Kneifel, S., Leaitch, W. R., Lin, W., Nicolas, J., Powers, H., Quinn, P. K., Rowe, P., Russell, L. M., Sharma, S., Verlinde, J., and Vogelmann, A. M.: AWARE: The Atmospheric Radiation Measurement (ARM) West Antarctic Radiation Experiment, B. Am. Meteorol. Soc., https://doi.org/10.1175/bams-d-18-0278.1, 2020.
Mather, J. H. and Voyles, J. W.: The Arm Climate Research Facility: A Review of Structure and Capabilities, B. Am. Meteorol. Soc., 94, 377–392, https://doi.org/10.1175/bams-d-11-00218.1, 2013.
McComiskey, A. and Ferrare, R. A.: Aerosol Physical and Optical Properties and Processes in the ARM Program, Meteorol. Monogr., 57, 21.21–21.17, https://doi.org/10.1175/amsmonographs-d-15-0028.1, 2016.
McNabola, A., McCreddin, A., Gill, L. W., and Broderick, B. M.: Analysis of the relationship between urban background air pollution concentrations and the personal exposure of office workers in Dublin, Ireland, using baseline separation techniques, Atmos. Pollut. Res., 2, 80–88, https://doi.org/10.5094/APR.2011.010, 2011.
Mitchell, J., Smith, S., Gregory, L., Madigan, T., McMahon, A., Springston, S., and Wagener, R.: Identifying the Influence of Local Source Emissions on the Regional Representativeness of AOS Measurements Using Machine Learning, ARM/ASR PI Meeting, Washington D.C., 13–17 March 2017.
O'Dowd, C. D. and Smith, M. H.: Physicochemica Properties of Aerosols Over the Northeast Atlantic: Evidencef or Wind-Speed-Related Submicron Sea-Salt Aerosol Production, J. Geophys. Res., 98, 1137–1149, 1993.
Parrington, M., Palmer, P. I., Henze, D. K., Tarasick, D. W., Hyer, E. J., Owen, R. C., Helmig, D., Clerbaux, C., Bowman, K. W., Deeter, M. N., Barratt, E. M., Coheur, P.-F., Hurtmans, D., Jiang, Z., George, M., and Worden, J. R.: The influence of boreal biomass burning emissions on the distribution of tropospheric ozone over North America and the North Atlantic during 2010, Atmos. Chem. Phys., 12, 2077–2098, https://doi.org/10.5194/acp-12-2077-2012, 2012.
Penkett, S. A., Volz-Thomas, A., Parrish, D. D., Honrath, R. E., and Fehsenfeld, F. C.: Preface [to special section on North Atlantic Regional Experiment (NARE II)], J. Geophys. Res.-Atmos., 103, 13353–13355, https://doi.org/10.1029/98jd01286, 1998.
Pennypacker, S. and Wood, R.: A Case Study in Low Aerosol Number Concentrations Over the Eastern North Atlantic: Implications for Pristine Conditions in the Remote Marine Boundary Layer, J. Geophys. Res.-Atmos., 122, 12393–312415, https://doi.org/10.1002/2017jd027493, 2017.
Quinn, P. K., Collins, D. B., Grassian, V. H., Prather, K. A., and Bates, T. S.: Chemistry and related properties of freshly emitted sea spray aerosol, Chem. Rev., 115, 4383–4399, https://doi.org/10.1021/cr500713g, 2015.
Rémillard, J. and Tselioudis, G.: Cloud Regime Variability over the Azores and Its Application to Climate Model Evaluation, J. Climate, 28, 9707–9720, https://doi.org/10.1175/jcli-d-15-0066.1, 2015.
Rémillard, J., Kollias, P., Luke, E., and Wood, R.: Marine Boundary Layer Cloud Observations in the Azores, J. Climate, 25, 7381–7398, https://doi.org/10.1175/jcli-d-11-00610.1, 2012.
Rosenfeld, D., Sherwood, S., Wood, R., and Donner, L.: Climate Effects of Aerosol-Cloud Interactions, Science, 343, 379–380, https://doi.org/10.1126/science.1247490, 2014.
Ruckstuhl, A. F., Henne, S., Reimann, S., Steinbacher, M., Vollmer, M. K., O'Doherty, S., Buchmann, B., and Hueglin, C.: Robust extraction of baseline signal of atmospheric trace species using local regression, Atmos. Meas. Tech., 5, 2613–2624, https://doi.org/10.5194/amt-5-2613-2012, 2012.
Schmid, B., Tomlinson, J. M., Hubbe, J. M., Comstock, J. M., Mei, F., Chand, D., Pekour, M. S., Kluzek, C. D., Andrews, E., Biraud, S. C., and McFarquhar, G. M.: The DOE ARM Aerial Facility, B. Am. Meteorol. Soc., 95, 723–742, https://doi.org/10.1175/bams-d-13-00040.1, 2014.
Shrivastava, M., Andreae, M. O., Artaxo, P., Barbosa, H. M. J., Berg, L. K., Brito, J., Ching, J., Easter, R. C., Fan, J., Fast, J. D., Feng, Z., Fuentes, J. D., Glasius, M., Goldstein, A. H., Alves, E. G., Gomes, H., Gu, D., Guenther, A., Jathar, S. H., Kim, S., Liu, Y., Lou, S., Martin, S. T., McNeill, V. F., Medeiros, A., de Sá, S. S., Shilling, J. E., Springston, S. R., Souza, R. A. F., Thornton, J. A., Isaacman-VanWertz, G., Yee, L. D., Ynoue, R., Zaveri, R. A., Zelenyuk, A., and Zhao, C.: Urban pollution greatly enhances formation of natural aerosols over the Amazon rainforest, Nat. Commun., 10, 1046, https://doi.org/10.1038/s41467-019-08909-4, 2019.
Simpkins, G.: Aerosol–cloud interactions, Nat. Clim. Change, 8, 457–457, https://doi.org/10.1038/s41558-018-0195-9, 2018.
Uin, J.: Ultra-High-Sensitivity Aerosol Spectrometer Instrument Handbook, U.S. Department of Energy, Office of Science, DOE/SC-ARM-TR-163, 2016.
Uin, J., Aiken, A. C., Dubey, M. K., Kuang, C., Pekour, M., Salwen, C., Sedlacek, A. J., Senum, G., Smith, S., Wang, J., Watson, T. B., and Springston, S. R.: Atmospheric Radiation Measurement (ARM) Aerosol Observing Systems (AOS) for Surface-Based In Situ Atmospheric Aerosol and Trace Gas Measurements, J. Atmos. Ocean. Tech., 36, 2429–2447, https://doi.org/10.1175/jtech-d-19-0077.1, 2019.
Velleman, P. F.: Robust nonlinear data smoothers: Definitions and recommendations, P. Natl. Acad. Sci. USA, 74, 434–436, https://doi.org/10.1073/pnas.74.2.434, 1977.
Wang, J., Dong, X., and Wood, R.: Aerosol and Cloud Experiments in Eastern North Atlantic (ACE-ENA) Science Plan, U.S. Department of Energy, Office of Science, DOE/SC-ARM-19-012, 2016.
Wang, J., Wood, R., Jensen, M., Azevedo, E. B., Bretherton, C., Chand, D., Chiu, C., Dong, X., Fast, J., Gettelman, A., Ghan, S., Giangrande, S., Gilles, M., Jefferson, A., Kollias, P., Kuang, C., Laskin, A., Lewis, E., Liu, X., Liu, Y., Luke, E., McComiskey, A., Mei, F., Miller, M., Sedlacek, A., and Shaw, R.: Aerosol and Cloud Experiments in Eastern North Atlantic (ACE-ENA) Field Campaign Report, DOE/SC-ARM-19-012, 2019.
Wang, L., Gong, W., Xia, X., Zhu, J., Li, J., and Zhu, Z.: Long-term observations of aerosol optical properties at Wuhan, an urban site in Central China, Atmos. Environ., 101, 94–102, https://doi.org/10.1016/j.atmosenv.2014.11.021, 2015.
Wang, Y., Zhang, J., Bai, Z., Yang, W., Zhang, H., Mao, J., Sun, Y., Ma, Z., Xiao, J., Gao, S., and Chen, L.: Background concentrations of PMs in Xinjiang, West China: An estimation based on meteorological filter method and Eckhardt algorithm, Atmos. Res., 215, 141–148, https://doi.org/10.1016/j.atmosres.2018.09.008, 2019.
Wood, R., Wyant, M., Bretherton, C. S., Rémillard, J., Kollias, P., Fletcher, J., Stemmler, J., de Szoeke, S., Yuter, S., Miller, M., Mechem, D., Tselioudis, G., Chiu, J. C., Mann, J. A. L., O'Connor, E. J., Hogan, R. J., Dong, X., Miller, M., Ghate, V., Jefferson, A., Min, Q., Minnis, P., Palikonda, R., Albrecht, B., Luke, E., Hannay, C., and Lin, Y.: Clouds, Aerosols, and Precipitation in the Marine Boundary Layer: An Arm Mobile Facility Deployment, B. Am. Meteorol. Soc., 96, 419–440, https://doi.org/10.1175/bams-d-13-00180.1, 2015.
Wood, R., Stemmler, J. D., Rémillard, J., and Jefferson, A.: Low-CCN concentration air masses over the eastern North Atlantic: Seasonality, meteorology, and drivers, J. Geophys. Res.-Atmos., 122, 1203–1223, https://doi.org/10.1002/2016jd025557, 2017.
Zheng, G., Wang, Y., Aiken, A. C., Gallo, F., Jensen, M. P., Kollias, P., Kuang, C., Luke, E., Springston, S., Uin, J., Wood, R., and Wang, J.: Marine boundary layer aerosol in the eastern North Atlantic: seasonal variations and key controlling processes, Atmos. Chem. Phys., 18, 17615–17635, https://doi.org/10.5194/acp-18-17615-2018, 2018.
Zhou, S., Collier, S., Xu, J., Mei, F., Wang, J., Lee, Y.-N., Sedlacek III, A. J., Springston, S. R., Sun, Y., and Zhang, Q.: Influences of upwind emission sources and atmospheric processing on aerosol chemistry and properties at a rural location in the Northeastern U.S, J. Geophys. Res.-Atmos., 121, 6049–6065, https://doi.org/10.1002/2015jd024568, 2016.