the Creative Commons Attribution 4.0 License.
the Creative Commons Attribution 4.0 License.
 | 25 Jun 2020
Cloud condensation nuclei characteristics during the Indian summer monsoon over a rain-shadow region
Venugopalan Nair Jayachandran
Mercy Varghese
Palani Murugavel
Kiran S. Todekar
Shivdas P. Bankar
Neelam Malap
Gurnule Dinesh
Pramod D. Safai
Jaya Rao
Mahen Konwar
Shivsai Dixit
Thara V. Prabha
Continuous aerosol and cloud condensation nuclei (CCN) measurements carried out at the ground observational facility situated in the rain-shadow region of the Indian subcontinent are illustrated. These observations were part of the Cloud Aerosol Interaction Precipitation Enhancement Experiment (CAIPEEX) during the Indian summer monsoon season (June to September) of 2018. Observations are classified as dry–continental (monsoon break) and wet–marine (monsoon active) according to the air mass history. CCN concentrations measured for a range of supersaturations (0.2 %–1.2 %) are parameterized using Twomey's empirical relationship. CCN concentrations at low (0.2 %) supersaturation (SS) were high () during continental conditions and observed together with high black carbon () and columnar aerosol loading. During the marine air mass conditions, CCN concentrations diminished to at 0.3 % SS and low aerosol loading persisted (). High CCN activation fraction (AF) of ≅0.55 (at 0.3 % SS) was observed before the monsoon rainfall, which reduced to ≅0.15 during the marine air mass and enhanced to ≅0.32 after that. There was mostly monomodal aerosol number size distribution (NSD) with a mean geometric mean diameter (GMD) of ≅85 nm, with least (≅9 %) contribution from nucleation mode (<30 nm) particles persisted before the monsoon, while multimode NSD with ≅19 % of nucleation mode particles was found during the marine air mass. Critical activation diameters (dcri) for 0.3 % SS were found to be about 72, 169, and 121 nm prior to, during, and after the marine conditions, respectively. The better association of CCN with aerosol absorption, and the concurrent accumulation mode particles during continental conditions, points to the possibility of aged (oxygenated) carbonaceous aerosols enhancing the CCN activity prior to the marine conditions. An enhancement in CCN concentrations and k values during the daytime along with absorption Ångström exponent was observed during the marine conditions. Best closure obtained using measured critical diameter and ammonium sulfate composition during continental conditions emphasizes the role of aged aerosols contributing to the accumulation mode, enhancing the CCN efficiency. The overestimation of CCN and less hygroscopicity of accumulation mode aerosols during the marine air mass indicate the role of size-dependent aerosol composition in CCN activity during the period.


Atmospheric aerosol particles (APs), emitted from both natural and anthropogenic sources, affect the radiation budget as well as the hydrological cycle of Earth, mainly through its direct and indirect effects. Those APs or condensation nuclei (CN) which act as the cloud condensation nuclei (CCN) at a specific supersaturation (SS) can indirectly affect the climate by altering the cloud microphysical properties. In general, an increase in APs increases the cloud droplet number concentration and decreases the size of droplets (Twomey and Warner, 1967) for a fixed liquid water content, which in turn increases the cloud albedo (Twomey, 1977) and cloud lifetime (Albrecht, 1989). In the real atmosphere, the SS measurements are seldom possible, and the large disagreements between the CCN and cloud droplet number concentration remain elusive (Moore et al., 2013). All these effects eventually modify the precipitation pattern (Lohmann and Feichter, 2005; Rosenfeld et al., 2008). Some of these aerosol indirect effects are moderately understood, while others are not, which contribute to significant uncertainty among all the climate forcing mechanisms (IPCC, 2013). Characterization of the hygroscopic growth of APs, which is generally addressed by the Köhler theory (Köhler, 1936), is the most fundamental aspect in assessing the aerosol–cloud interactions (ACI) for reducing the uncertainties in indirect radiative forcing estimation. However, Köhler theory is modified to accommodate the real atmospheric conditions and applied for both laboratory and field measurements, as well as in the climate models (Shulman et al., 1996; Laaksonen et al., 1998; Raymond and Pandis, 2003; McFiggans et al., 2006; Petters and Kreidenweis, 2007; Rose et al., 2008; Mikhailov et al., 2009). For a given particle, the size and composition determine its CCN activity at a specific SS, while the CCN spectrum (CCN at different SS) depends on the median diameter and standard deviation, number concentration, and the mixing state of the aerosol system (Quinn et al., 2008). In this regard, closure studies are necessary to understand the role of each parameter in the activation of APs as CCN, which may improve the accuracy of climate models to address the ACI (Fountakis and Nenes, 2005).
Large spatial and temporal heterogeneities are found in APs and CCN properties, and thus the regional characterization of CCN in different meteorological settings is imminent. Temporal and spatial heterogeneities of CCN and different mechanisms affecting CCN are investigated in several studies (Hoppel et al., 1973; Hudson and Xie, 1999; Paramonov et al., 2015, Schmale et al., 2018; Nair et al., 2020) over both the continental and marine environments. Over the land mass, significant variability in CCN activation properties are reported due to urban and industrial influences (Sotiropoulou et al., 2007; Asa-Awuku et al., 2011). Carbonaceous combustion APs are produced mostly from urban and industrial activities, contributing more than half of the global CCN concentrations (Spracklen et al., 2011). Though nascent black carbon (BC) APs are insoluble (Weingartner et al., 1997), coating, condensation, and coagulation of organic and inorganic APs can increase their hygroscopicity, thereby acting as CCN (Liu et al., 2013). However, the role of organics, mostly from carbonaceous combustion sources, in determining the CCN activity is still uncertain. Ervens et al. (2005) have reported a broad range (−86 % to 110 %) of changes in cloud droplet number concentration due to the organics. The reduction in surface tension by organic APs can even perturb the first indirect (Twomey) effect (Nenes et al., 2002). The presence of water soluble organic carbon can increase the CCN concentrations, especially in rural and urban settings (Mircea et al., 2002). Recent studies (Singla et al., 2017; Nair et al., 2020) highlight the dominance of organic APs and their significant role in CCN activation over the Indian subcontinent. The increasing trend in aerosol loading (Babu et al., 2013) and the significant contribution of carbonaceous APs from both fossil fuel and biomass burning over the Indian subcontinent (Nair et al., 2007) highlight the necessity of the characterization of CCN and the role of carbonaceous APs over distinct environments in India.
Even though the aerosol properties such as aerosol optical depth (Babu et al., 2013) and BC mass concentration (Manoj et al., 2019) have been studied across the Indian subcontinent through a network of observatories (Moorthy et al., 2013) for decades, only a few CCN studies are available for the last few years over specific regions. Year-round CCN measurements are reported from the high-altitude observatory over the Western Ghats (Leena et al., 2016), Indo-Gangetic Plain (IGP; Patidar et al., 2012), central Himalayas (Gogoi et al., 2015), and eastern Himalayas (Roy et al., 2017). CCN characteristics for a specific season, including closure analysis, were reported by Jayachandran et al. (2017, 2018) at peninsular India and by Bhattu and Tripathi (2015) at IGP. Apart from these studies, Indian Ocean Experiment (INDOEX; Ramanathan et al., 2001), Cloud Aerosol Interaction Precipitation Enhancement Experiment (CAIPEEX, Kulkarni et al., 2012), South-West Asian Aerosol–Monsoon Interaction and Regional Aerosol Warming Experiment (SWAAMI–RAWEX; Jayachandran et al., 2020), and Integrated Campaign for Aerosols, gases and Radiation Budget 2018 (ICARB-2018, Nair et al., 2020) are other major multiplatform campaigns carried out over the subcontinent and nearby marine environment to study the regional ACI. CAIPEEX has conducted both aircraft- and ground-based observations of aerosols, clouds, and planetary boundary layer (PBL) since 2009 in a phased manner. Details of the CAIPEEX are available in Prabha et al. (2011) and Kulkarni et al. (2012). Various studies have addressed the spatiotemporal distribution of APs (Padmakumari et al., 2013; Varghese et al., 2019), cloud microphysics (Prabha et al., 2011, 2012; Padmakumari et al., 2018), rainfall (Maheshkumar et al., 2014) properties, and the relationship between cloud microphysics and thermodynamics (Bera et al., 2019), and ACI (Pandithurai et al., 2012; Prabha et al., 2012; Konwar et al., 2012; Gayatri et al., 2017; Patade et al., 2019) from the unique data obtained from the CAIPEEX. Varghese et al. (2016) investigated the linkages of surface and cloud base CCN spectral characteristics over the rain-shadow region.
The assessment of the effects of APs on clouds and precipitation due to the changes in the atmospheric composition by anthropogenic activities is very significant over India as the agriculture and economy of the region mostly depend on the Indian summer monsoon (ISM) rainfall. The western coast of India, which is the gateway of the ISM, receives almost 2.5 times the long-term monsoon mean rainfall observed all over India (Parthasarathy et al., 1995). The mountain ranges along the western coast of India, known as the Western Ghats (WG) mountains, play a pivotal role in ISM rainfall due to orography (Grossman and Duran, 1984; Sijikumar et al., 2013). A few studies have been carried out to date to understand the aerosol loading (Udayasoorian et al., 2014), CCN characteristics (Leena et al., 2016; Jayachandran et al., 2018) and its influence on the aerosol indirect effects (Anil Kumar et al., 2016) from different locations in the WG. However, the rain-shadow region (leeward side) is prone to drought conditions with predominant continental effects, and the relevant studies are sparse.
CAIPEEX observations were conducted over the rain-shadow region to understand the cloud and precipitation microphysics and AP properties to derive guidelines for the precipitation enhancement over the region. CAIPEEX Phase IV was designed to address the major objectives for the science of weather modification. The background observations of CCN were trivial for the design and validation of the experiment, and the data presented in this study are aimed at understanding the aerosols and its cloud-activation properties near the surface. The present study addresses the first reporting of CCN and its characteristics under different air mass and meteorological conditions throughout the ISM season (June to September) of 2018 over this region. The study focuses on the variations in CCN characteristics within the ISM season, and the possible factors are investigated using the concurrent and collocated aerosol size distribution and BC measurements. Another focus of the study is the CCN closure analysis to assess the role of size and composition at different atmospheric conditions.
2.1 Location, measurements, and database
As part of the ground segment of the CAIPEEX IV campaign, aerosol and PBL measurements have been taken since May 2017 at N.B. Navale Sinhgad College of Engineering in Solapur (17.70∘ N, 75.85∘ E; ≅490 ), which is at the center of the rain-shadow region. The location is marked as a circle in Fig. 1 and is a semiarid region. The college site is 12 km away from Solapur, and the aerosol sampling laboratory is on the top (third) floor of the building, away from all local activities in the rural setting. Even though the sampling site is well isolated from the urban contamination, Solapur consists of numerous sugar and textile industries emissions, apart from the seasonal emissions from agricultural activities.
Details of instrumentation and data used for the present study are illustrated in Table 1. Aerosol sampling was carried out through separate PM2.5 inlets, from about 2 m above the rooftop, connected with conductive tubing. CCN concentrations were measured at every second, using a continuous-flow streamwise temperature gradient CCN counter (CCN-100, DMT; Roberts and Nenes, 2005). Initially (June 2018) CCN were measured at five SSs (0.2 %, 0.4 %, 0.6 %, 0.8 %, and 1.0 %), and in July the CCN counter was calibrated again and the SS was set at 0.3 %, 0.5 %, 0.8 %, and 1.2 %. Calibrations were carried out both before and after the experiments using ammonium sulfate APs following Rose et al. (2008). The instrument was also factory calibrated before the campaign. During the calibration experiments, CCN efficiency spectra were recorded for different ΔT values. The activation diameter corresponding to 50 % CCN efficiency for each spectrum was taken as the critical dry diameter for the CCN activation of ammonium sulfate particles. The corresponding critical supersaturation was calculated with the activity parameterization Köhler model (AP3) mentioned in Rose et al. (2008). The calculated critical supersaturation was taken as the effective supersaturation at the given ΔT value.
Table 1Details of aerosol measurements used in the current study.
The CCN counter uses the fundamental principle of the difference in the diffusion rate of heat and water vapor. A fixed temperature gradient is maintained along the walls of the wetted cylindrical column inside the instrument in which the desired SS is generated depending on the temperature gradient and the flow rate. The APs are fed at a constant sheath to sample flow of (10:1) along the center line of the column, and the total flow rate was maintained at 500 vccm. The details of the working principle of the instrument are available in Roberts and Nenes (2005) and Lance et al. (2006). During June, each SS was maintained for 5 min, except for 0.2 % which was for 10 min. About 2 min of data during the SS transition was discarded to avoid the uncertainty in establishing the required SS during the transition. At 0.2 % SS (lowest set SS), about 4 min of initial data was discarded. Except for June, all the SSs were set for 7 min each, except for 0.3 % SS, which was maintained for 9 min. Here also, the initial 3–4 min of data were discarded to ensure the set SS conditions. Thus, one cycle of the complete set of SS took 30 min, and the cycle was repeated. APs were continuously exposed to the SS inside the column, and those having their critical SS less than that of the set SS inside the column were activated as liquid droplets and counted by the optical particle counter operated by a laser diode at 660 nm at the exit of the column. Since the CCN concentrations have always been less than 6000 cm−3, correction for water vapor depletion inside the column as suggested by Lathem and Nenes (2011) was not applied.
Size-segregated aerosol number concentration (NSD) from about 15 nm to about 685 nm, distributed among 107 size bins, was measured every 3 min using a scanning mobility particle sizer (SMPS; TSI Incorporated, model 3082). The setup consists of an electrostatic classifier, including a long differential mobility analyzer (LDMA; TSI Incorporated, model no. 3081), and a butanol-based condensation particle counter (CPC; TSI Incorporated, model no. 3772). Before entering the LDMA the APs are charged to a known charge distribution by a bipolar charger in the electrostatic classifier, and the charged APs were size segregated according to their electrical mobility (Wiedensohler, 1988; Wang and Flagan, 1990) in the DMA. The APs classified according to their sizes were counted by the CPC. The sheath and sample flow were maintained at 0.3 and 3 L min−1, respectively. Multiple charge corrections and diffusion charge corrections were applied to the aerosol NSD data during the data inversion. APs were passed through a diffusion dryer before the classifier to prevent the high-humidity conditions.
Radiation absorption properties of APs at different wavelengths were measured using a dual-spot Aethalometer (AE33; Magee Scientific) at every minute. The Aethalometer operated at a flow rate of 2 LPM and measured the attenuation of light due to the APs deposited on a filter tape (Hansen et al., 1984) at seven different wavelengths – 370, 470, 520, 590, 660, 880, and 950 nm. From this, the absorption coefficient (σabs) is estimated from the rate of attenuation, filter spot area, and the flow rate (Weingartener et al., 2003). The new-generation AE33 compensates the loading effect and multiple scattering effects (Arnott et al., 2005) associated with the filter-based optical attenuation techniques (Drinovec et al., 2015).
The wavelength dependence of the absorption coefficient of aerosols is parameterized using the following equation:
where β is a constant and αabs is the absorption Ångström exponent. The nature of the carbonaceous sources can be inferred from the value of αabs. Humic-like substance (HULIS) and brown carbon produced from biomass burning have higher absorption at lower wavelength (ultraviolet and blue) regions (Gelencser et al., 2003). Hence, αabs will be higher (∼2) for biomass-dominant sources, while fossil-fuel-dominant sources will have αabs close to unity (Kirchstetter et al., 2004).
Ambient weather parameters such as temperature, pressure, wind speed, wind direction, relative humidity, and rainfall were also used in the present study from the automatic weather station (AWS) measurements located at the site. All the instruments operated during CAIPEEX were calibrated periodically, especially before and after the experiments. The uncertainty associated with all the measurement techniques used in the present study is <10 %. All the measurements having different sampling frequencies were averaged to hourly intervals for analysis and interpretation. Air mass pathways were investigated using Hybrid Single-Particle Lagrangian Integrated Trajectory (HYSPLIT) model (Draxler and Rolph, 2014) available from the NOAA ARL READY website.
2.2 Meteorology
The air mass back trajectories for 5 d reaching 50 m above the site were examined using back-trajectory analysis and found that two distinct air masses reached the site during the observation period (1 June to 30 September 2018). These are classified as (a) continental (dry) and (b) marine (wet) and are shown in Fig. 1. Those days on which air masses were over the landmass and within 1 for minimum 3 d before reaching the site, and hence having a significant continental influence are segregated as continental, while those from the nearby marine atmosphere are classified as the marine and the corresponding period include the monsoon rainfall period over the site. The continental air mass consistently prevailed over the site during the first week of June (denoted as continental-1) and from 15 to 30 September (denoted as continental-2) of 2018. Marine air mass days consist of 8–12 and 15–31 July (denoted as marine-1) and 1–26 and 28–31 August (denoted as marine-2). Thus, the observations and findings throughout this paper are examined on the basis of this classification. From Fig. 1a it can also be seen that the air mass history for the continental classification is mostly within 1 km above the surface, indicating the chances for the influence of local aerosol sources.
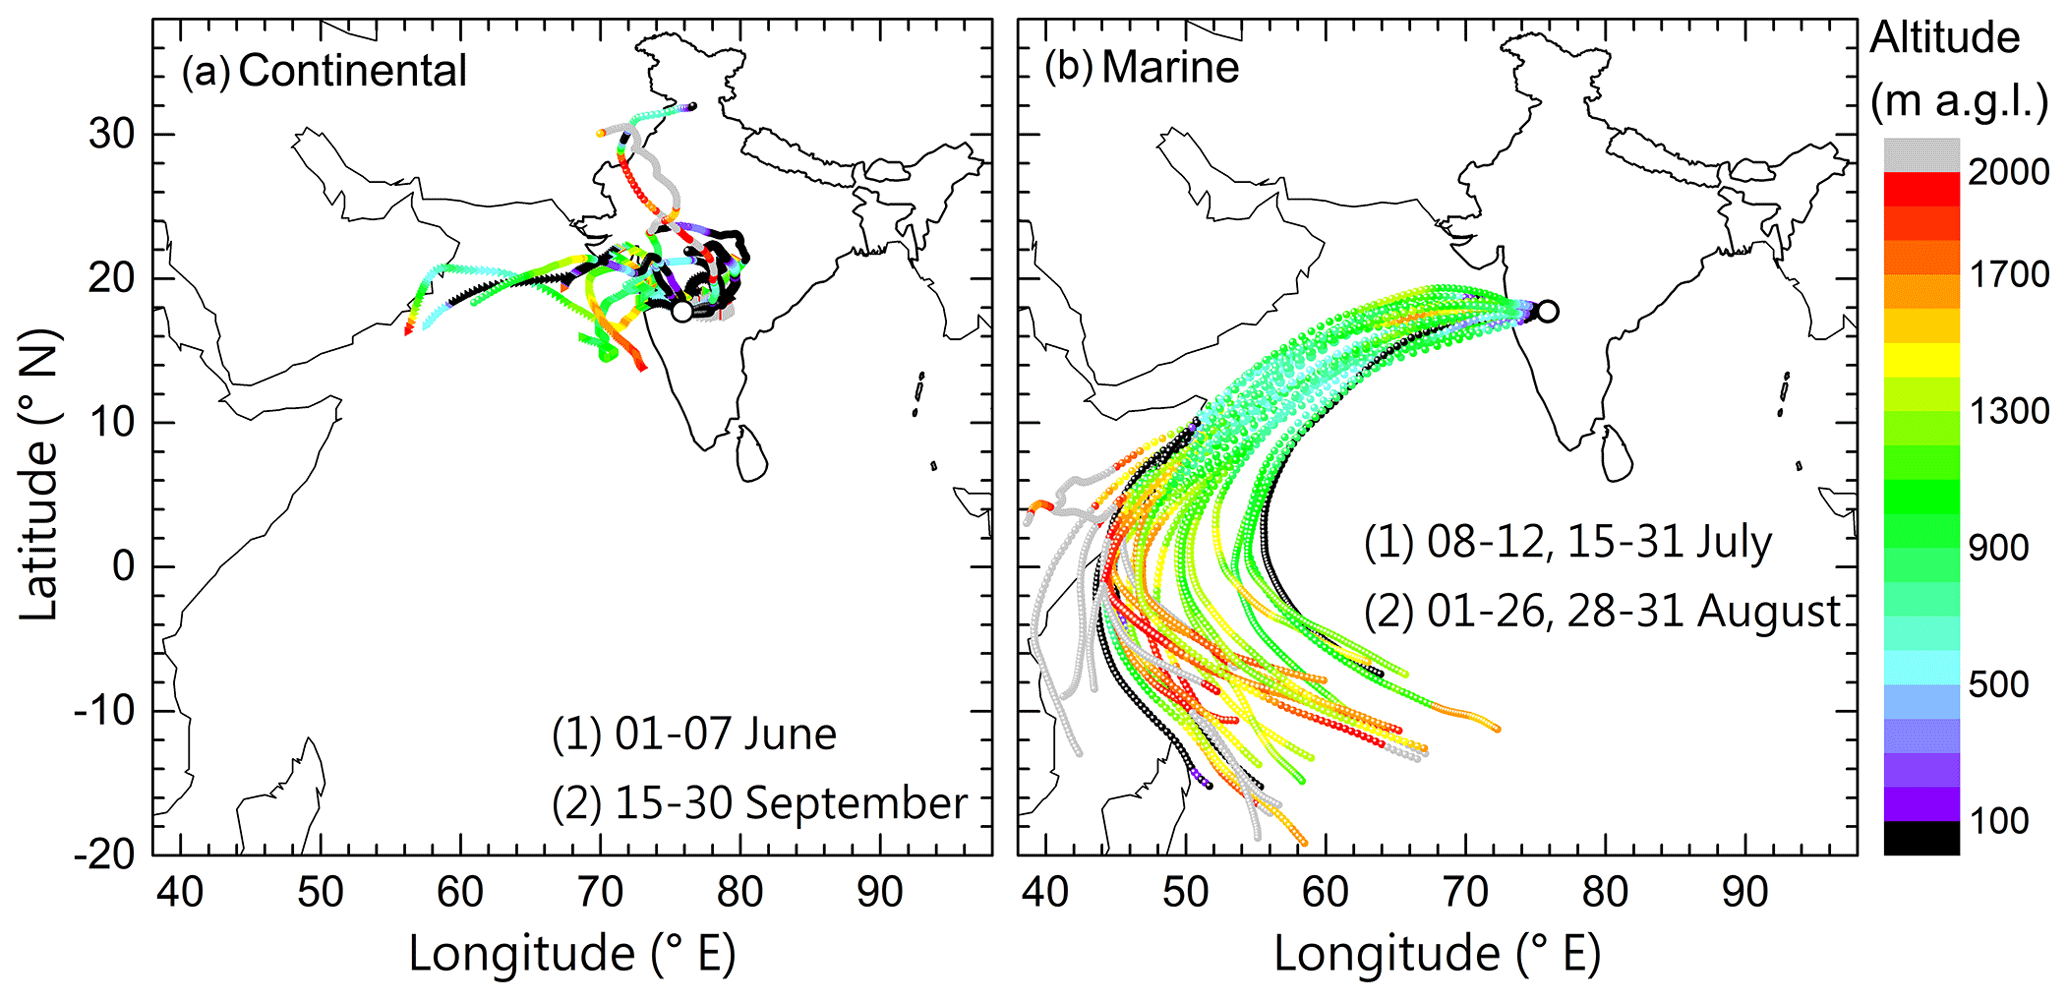
Figure 1Air mass back trajectories with 5 d duration reaching 50 m above the site segregated to (a) continental and (b) marine. The color of the trajectories indicates the altitude of the air mass above ground level (a.g.l.).
The meteorological parameters observed at the site from the AWS measurements during these periods are shown in Fig. 2. Diurnal variation of temperature and relative humidity (RH) are shown in Fig. 2a and b, respectively. The temperature and RH values are distinctively different during continental-1 compared to other periods. Marine-1 and 2 periods experienced low temperatures and high RH throughout the day, while continental-2 had higher temperature and lower RH during noon and afternoon hours. The monthly mean temperature during the study periods of continental-1, marine-1, marine-2, and continental-2 were 29.5±3.6, 25.9±2.6, 25.4±2.8, and , respectively. A dry spell existed during the continental-1 days when the maximum hourly mean temperature recorded was . The maximum temperature at all the periods was observed at 15:00 and 16:00 Indian standard time (IST), and the lowest temperatures were observed before sunrise of the day. Intermittent rainfall happened during July and August, and a few heavy rainfall events occurred during these months. The aerosol–CCN measurements during heavy rainfall are not included in the analysis for interpretation (missing days in Table 1). From the wind rose diagram (Fig. 2c), it can be noted that the strong winds were blowing mostly from the western and southwestern part of the site during continental-1 and, in a few cases, winds were blowing from the northeasterly direction. Westerly and southwesterly winds were present during marine-1 and 2 conditions (Fig. 2d and e), while on the continental-2 days (Fig. 2f) mostly northeasterly winds were observed.
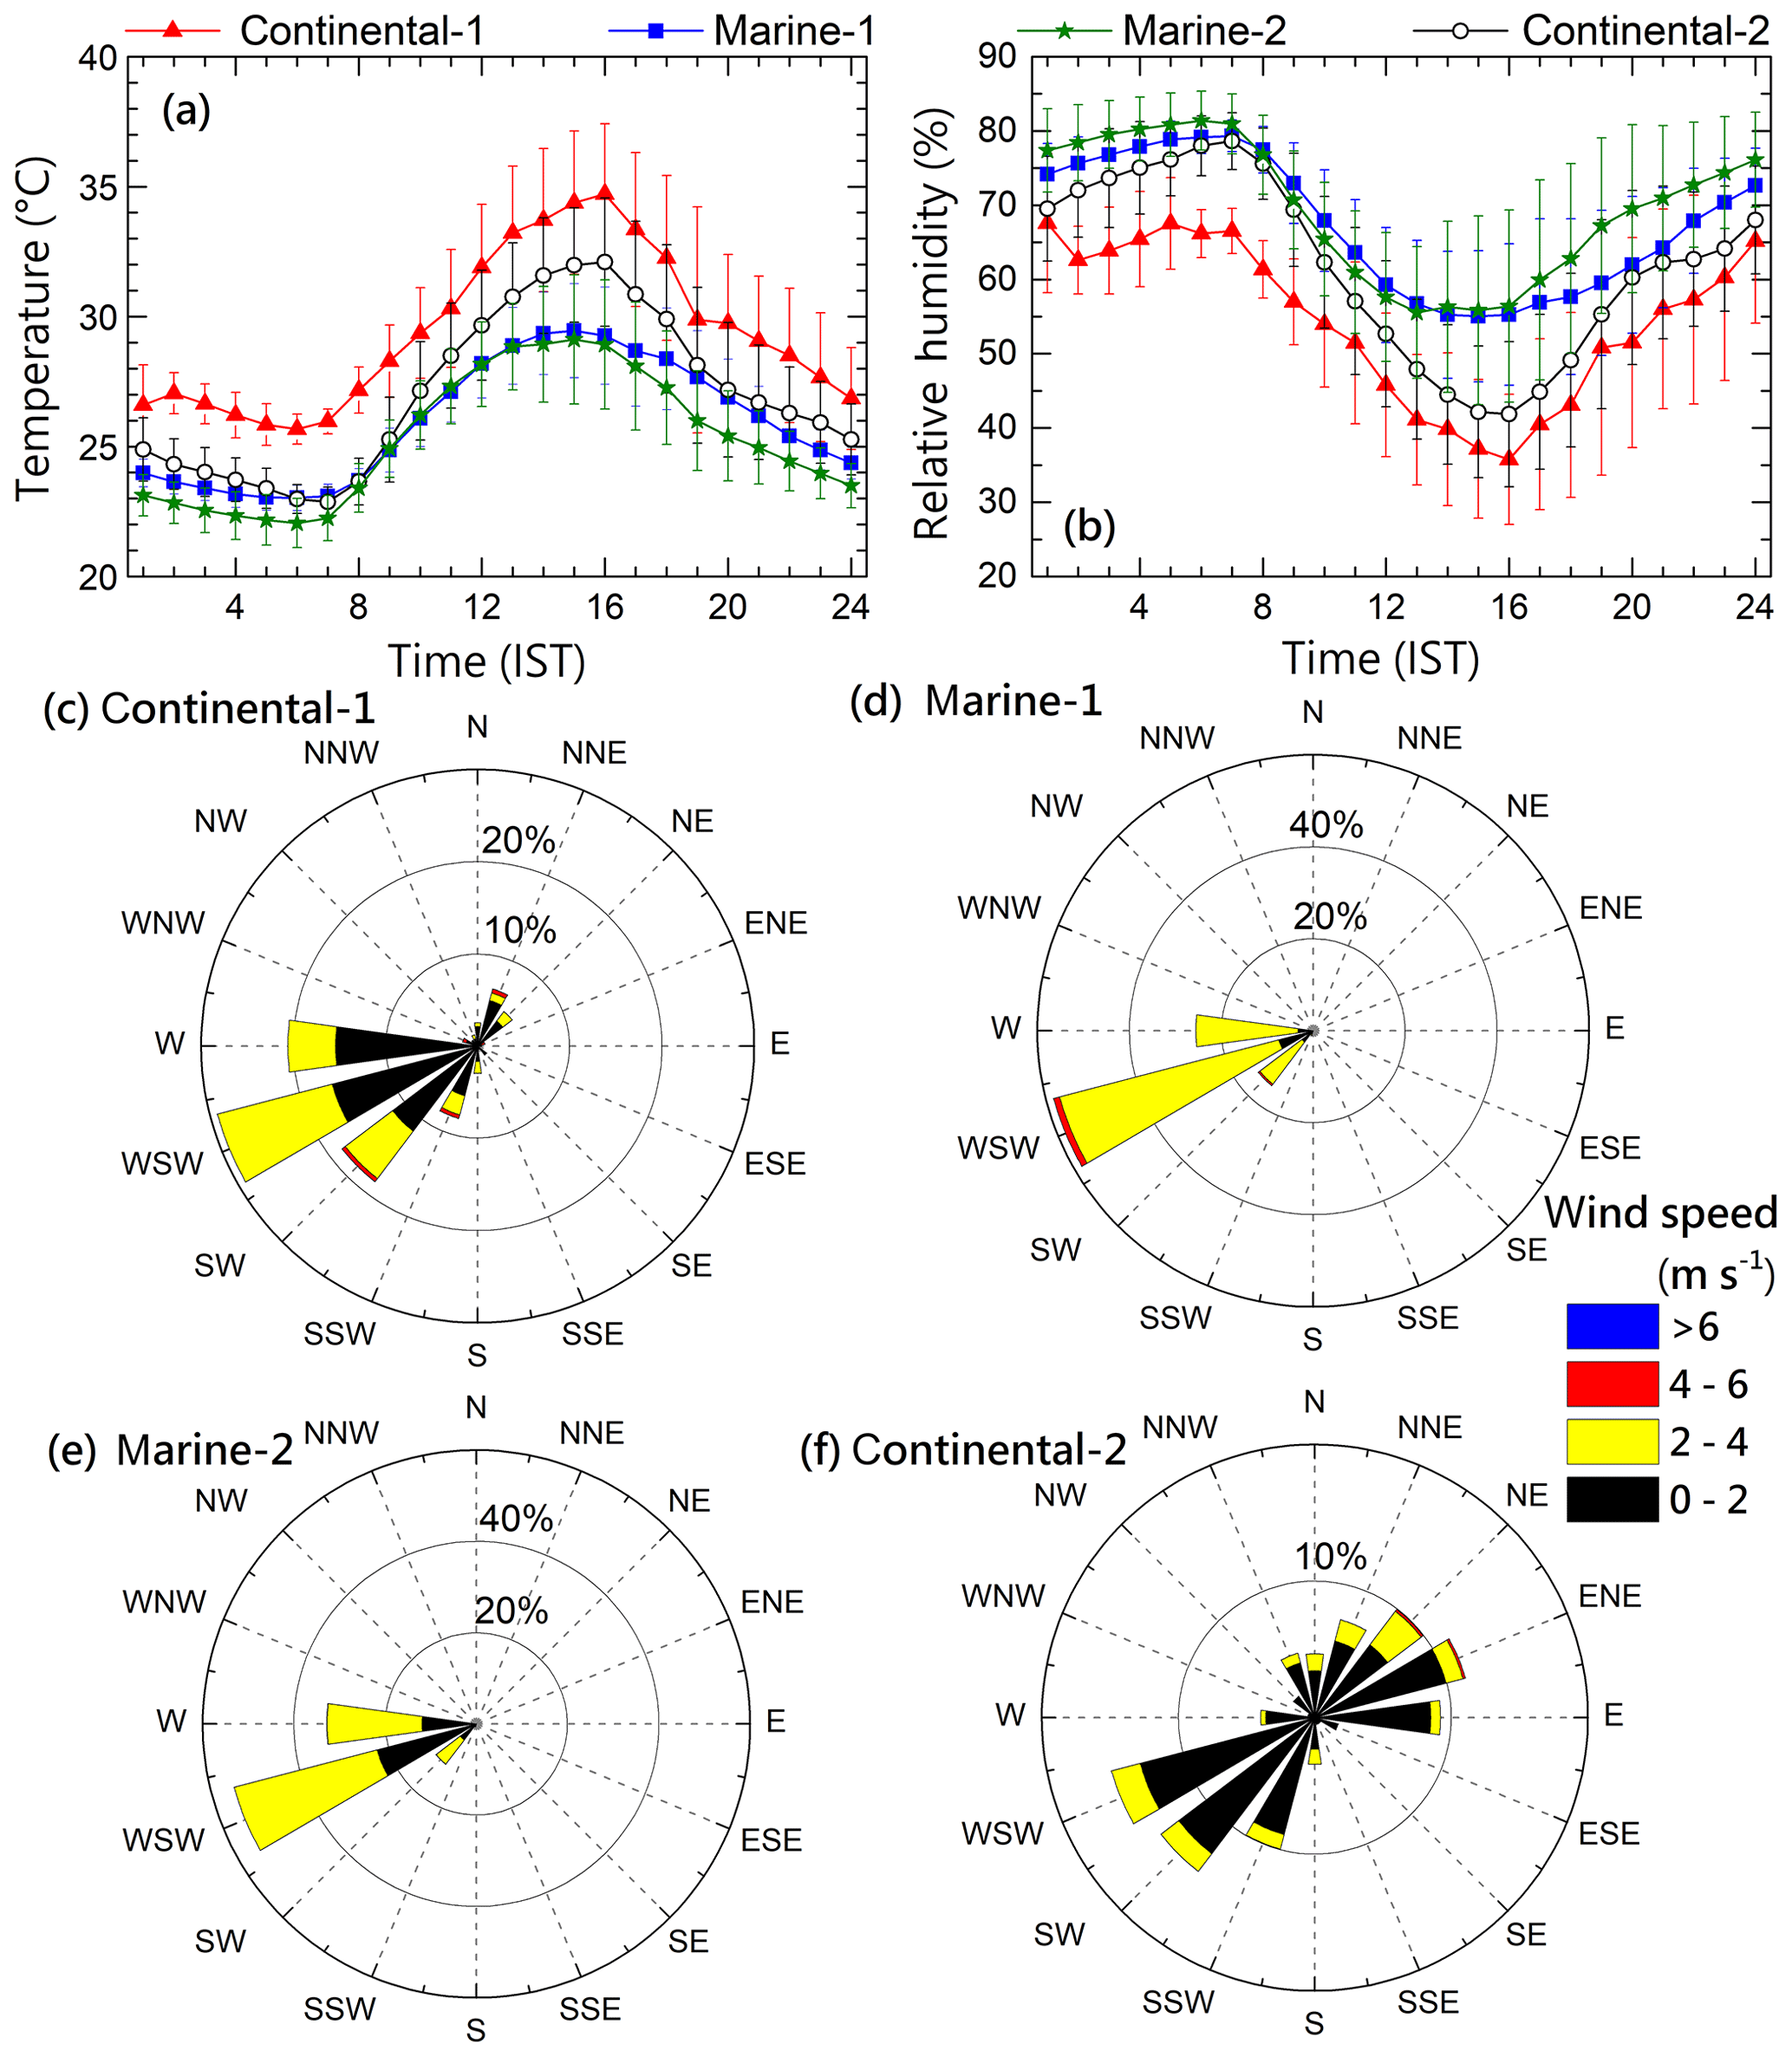
Figure 2Diurnal variation of (a) temperature and (b) relative humidity along with the standard deviation of the mean values. The wind rose diagrams from the co-located AWS measurements for (c) continental-1, (d) marine-1, (e) marine-2, and (f) continental-2 conditions.
CCN characteristics at the site are investigated with aerosol size distribution and BC measurements.
3.1 Overview of aerosol loading
The frequency distribution of BC mass loading and the mean values (and its standard deviation) during the observation days are shown in Fig. 3a with an aim to understand aerosol loading and the influence of anthropogenic activities. The distinct atmospheric conditions and the air mass history are evident in the BC mass loading at the site. Before the onset of monsoon, under the influence of continental air mass, the mean BC values were above 2000 ng m−3, which decreased to very low values (∼746 ng m−3) during the marine conditions. BC concentration was even higher than 4000 ng m−3 during the continental air mass, while in many cases values were almost 100 ng m−3 under marine conditions.
Apart from the near-surface measurements, the columnar aerosol optical depth (AOD) is examined using the Moderate Resolution Imaging Spectroradiometer (MODIS) on board the Aqua satellite at 550 nm. The AOD observed from MODIS during the continental air mass conditions along with the site (white star) is shown in panels (b) and (c) of Fig. 3. It can be seen that heavy aerosol loading (AOD>0.5) persisted around the rain-shadow regions and the Mumbai coast (northwest of the site) in addition to the high loading over the IGP. After the monsoon rainfall, the aerosol loading has reduced all over India as seen in Fig. 3c. Still, high aerosol loading (AOD>0.4) was observed around the observation site, IGP, and the northern part of the east coast.
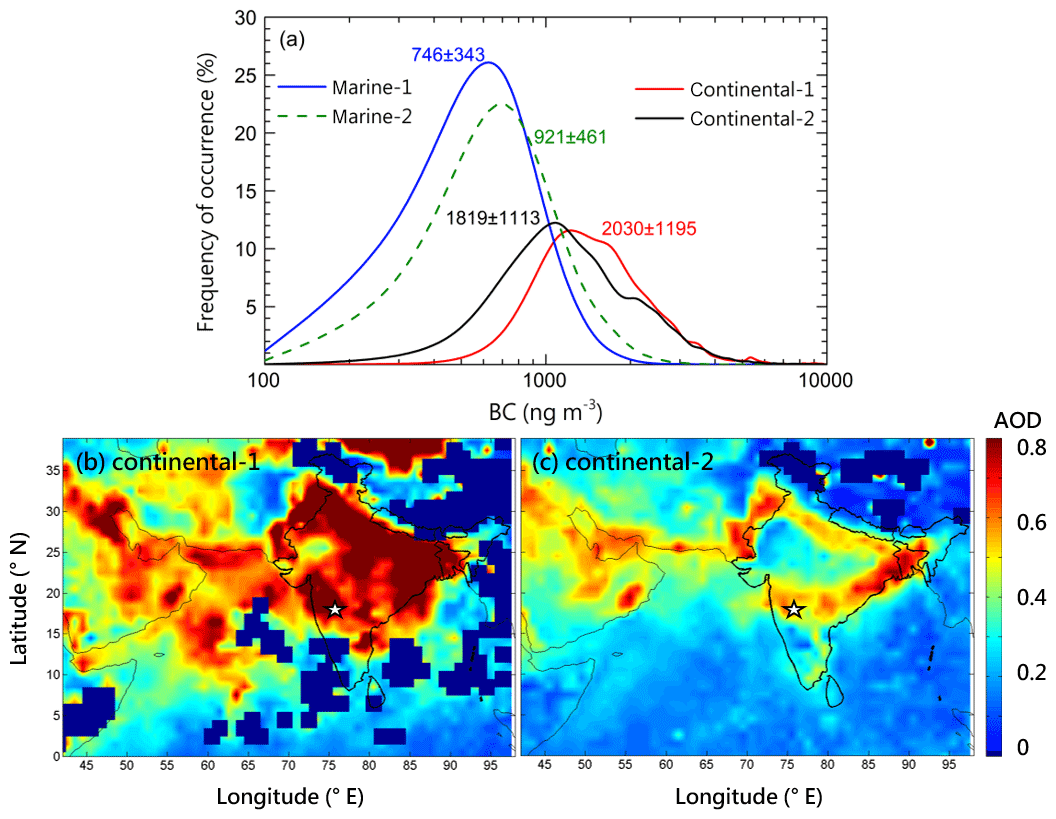
Figure 3(a) Frequency distribution of BC mass concentration and its mean values for marine and continental conditions. Aerosol optical depth (AOD) at 550 nm observed from the Moderate Resolution Imaging Spectroradiometer (MODIS) for the (b) continental-1 and (c) continental-2 conditions. The Solapur site is indicated by the star in the spatial AOD maps.
BC can be considered as a proxy for the anthropogenic activities (Myhre et al., 2013; Lelieveld et al., 2019), and the BC loading over Solapur indicates that the anthropogenic influence is predominant during the continental air mass conditions. This observation is in line with the columnar aerosol observation from MODIS. Apart from fossil fuel combustion, biomass burning may also contribute to the carbonaceous APs that prevailed over the site. The fire counts observed from the MODIS (Collection 6 product obtained from https://earthdata.nasa.gov/firms, last access: 23 July 2019) may support this inference, which is given in the Appendix (Fig. A1). The high aerosol loading locations in Fig. 3 are associated with the numerous fire events which can be seen in Fig. A1. From another site in the rain-shadow region closer to the central part of India, namely Nagpur, Kompalli et al. (2014) reported a BC mass of before the monsoon, which is similar to the present study. From the long-term observations of BC from the northwestern part (Pune) of the current study, Safai et al. (2013) reported a mean BC mass of during the monsoon period. Both the high surface BC and total column aerosol loading observed before the monsoon indicate the significant anthropogenic influence on the total aerosol loading. The low BC values () during the marine conditions at Solapur represent a cleaner atmosphere, while BC was reported from a coastal location in peninsular India (Babu and Moorthy, 2002) during monsoon. About 50 % reduction (∼10 000 to 6000 ng m−3) in BC mass associated with the dominance of fossil fuel sources replacing the biomass during monsoon compared to the premonsoon values was reported by Vaishya et al. (2017) from a heavily polluted IGP site. The low BC loading during the marine conditions over Solapur is due to the wet scavenging of aerosols and the distinct air mass reaching the site, as well as due to the reduced local burning during the active monsoon conditions. The high AOD and BC observations identify Solapur as a polluted continental environment which is cleaner during active monsoon compared to the other periods.
3.2 CCN number concentrations and its variations
The mean CCN concentrations at different SS, known as the CCN–SS spectra, segregated according to the air mass conditions, are shown in Fig. 4. It can be seen that the CCN concentrations at all SS are higher during continental, compared to marine, conditions. The highest CCN concentration is observed during continental-1, which is in line with the surface BC loading and the total columnar aerosol loading. CCN spectra are similar for the marine conditions, except the slight difference at the lowest SS. CCN concentrations before the monsoon ranged from ∼1600 to 3600 cm−3 for 0.2 % to 1.0 % SS. Meanwhile, the CCN concentration was only ∼900 cm−3 during marine air mass – even at 1.2 % SS. Thus, a clear distinction is seen in the CCN concentrations between the marine and continental air mass conditions within the same ISM period.
The CCN concentration varies with SS, and its parameterization is very important for its applicability in climate models (Khvorostyanov and Curry, 2006). The measured CCN spectra are parameterized by Twomey's empirical fit relationship (Twomey, 1959, 1977), which is widely used due to its simplicity (Cohard et al., 1998) and is given as follows:
where C and k are the empirical fit parameters characterizing the spectra. It should be noted that the empirical fit parameter k is different from the effective hygroscopicity parameter-κ discussed by Petters and Kreidenweis (2007).
More than 90 % of cases in the current observations show a high correlation coefficient (R>0.95) with Twomey's empirical fit, except during continental-2 during which about 65 % of the cases only had high (>0.95) correlation coefficient with Twomey's fit. The spectra having a correlation coefficient of more than 0.95 with the empirical fit are only considered in the present study.
Hygroscopic or bigger particles have flat CCN spectra and low k values, while hydrophobic and ultrafine (UF) mode (<100 nm) APs will have steep CCN spectra and high k values (Hegg et al., 1991; Jefferson, 2010) as those particles need higher SS to activate as CCN. Thus, the empirical fit parameter “k” indicates the nature of the aerosol system towards CCN activation, and “C” indicates the CCN concentrations at 1.0 % SS. Generally, high C and k values are reported for the anthropogenic, while low values are reported for the natural/marine APs (Seinfeld and Pandis, 2016; Andreae, 2009). The highest k value (∼0.67) is observed during marine-2 and the minimum (∼0.52) during continental-1. As may be noted, bigger or hygroscopic (or both) particles which are CCN active were abundant during continental-1 compared to the marine conditions when fine or hydrophobic (or both) particles were predominant.

Figure 4Mean CCN concentrations (± SD) for different SS during continental and marine conditions. The power law fit k value of each spectrum is also given.
CCN concentrations and the k values reported during the current study, along with a few other studies, are given in Table 2. Generally, most of the aerosol abundance measurements such as BC mass (Kompalli et al., 2014) and aerosol number concentration (Babu et al., 2016) showed the lowest seasonal mean value during ISM over the Indian region, mainly due to the wet removal of APs. The CCN concentration at semiarid Solapur before the onset of ISM is comparable to the values () observed over the arid northwestern region of India reported by Jayachandran et al. (2020). Interestingly, the CCN concentration at Solapur during the active marine conditions is the lowest among the values reported over the Indian subcontinent. The current values (∼350 cm−3) are comparable to those reported from Ponmudi (∼400 cm−3) at the southern part of the WG, and another site at WG, namely Mahabaleshwar () at 0.2 % SS. From Table 2, very high values of CCN concentrations are reported from polluted urban environments. Very low CCN concentrations ( at 1 % SS) are reported from pristine environments like the Amazon (Pöhlker et al., 2016, 2018) and Alps (Juranyi et al., 2011). The mean CCN values observed at Solapur during ISM are comparable to those classified as “polluted marine” by Andreae (2009).
Table 2CCN and aerosol characteristics reported over various locations along with the present results (at 0.3 % SS). CCN reported for Thumba@ 0.4 and Colorado# 0.36 % SS, respectively.
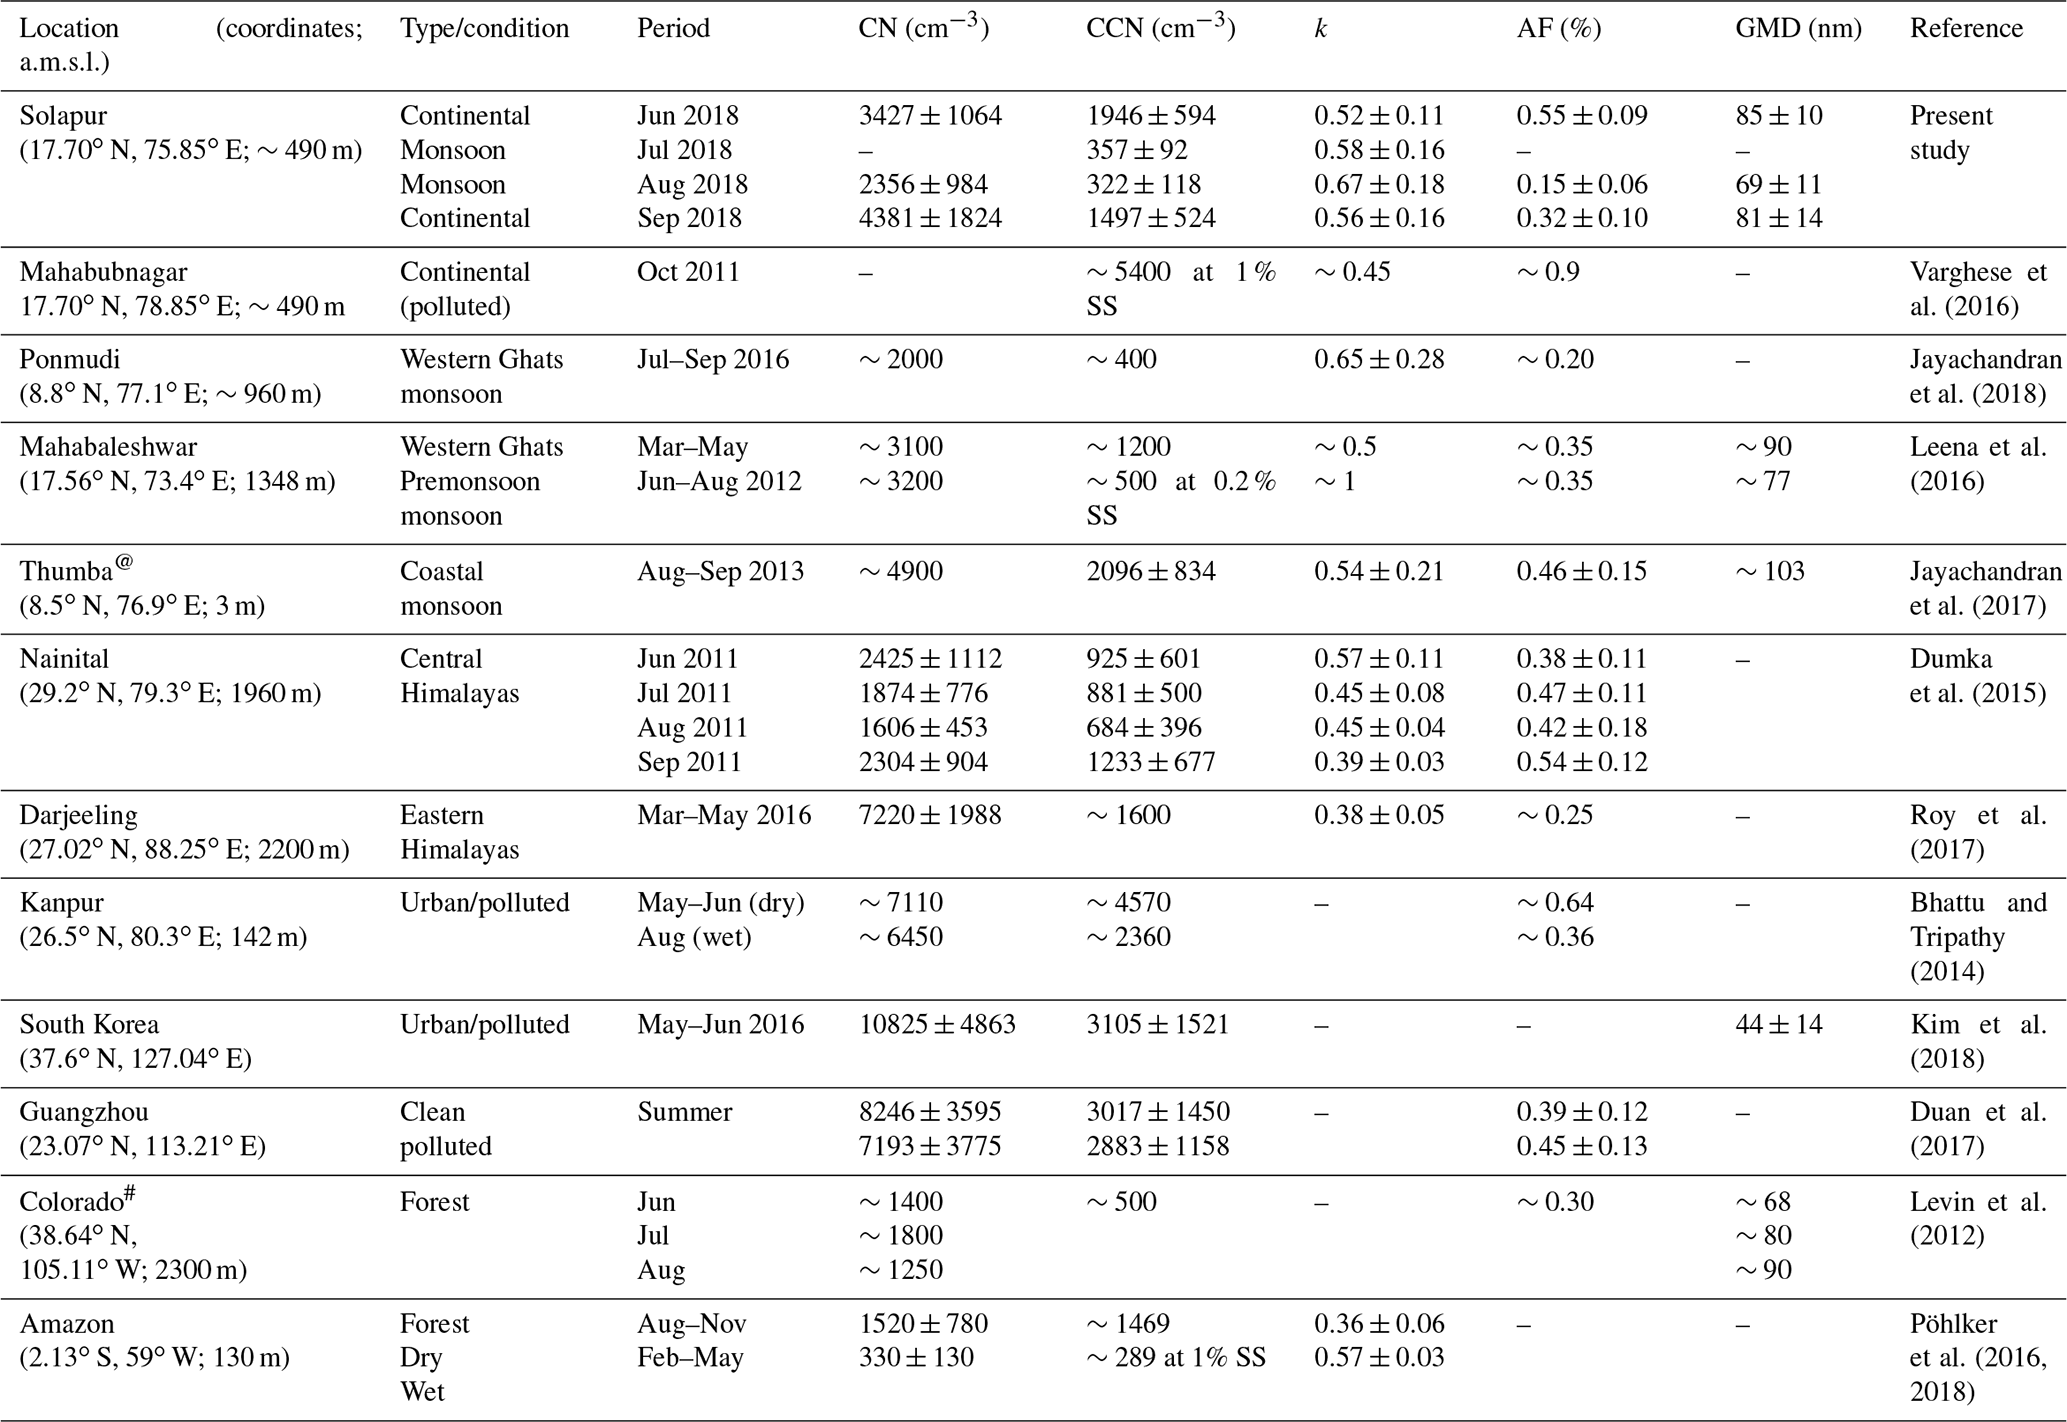
Generally, an enhancement in k values is observed during the monsoon period, which is seen only during the marine-2 conditions in this study. In all other cases, the k values are comparable. Jayachandran et al. (2017, 2018) reported similar results for the monsoon period both at a coastal site and at a hill station in the WG. From the southern tip of India, Jayachandran et al. (2017) have shown the enhancement of k values (∼0.7) associated with wet scavenging and low k values (∼0.55) during no rainfall conditions within the same ISM period. The enhancement in k values (2 times) associated with the monsoon rainfall can be seen from Mahabaleshwar also (Table 2). Thus, the CCN concentrations at different SS at Solapur during ISM are low compared to those reported from other environments in India, while the CCN spectra show common characteristics to those values reported from WG and peninsular India.
Significant diurnal variations are seen in the PBL AP properties over the Indian subcontinent (Nair et al., 2007). Daytime high and nighttime low aerosol abundance characterized by anomalous high values just after sunrise, known as the fumigation peak (Prakash et al., 1992), is generally observed. This diurnal pattern is mostly due to the evolution of the PBL and due to local emissions (Nair et al., 2007; Kumar et al., 2015). As the CCN activation and its properties are highly heterogeneous, it is very important to know its variation in a day. The diurnal variations of CCN concentration at 0.3 % SS, segregated to air mass, are shown in Fig. 5a and b, respectively. The CCN variations in a day are similar during the marine conditions (Fig. 5a), while it differs before and after the monsoon rainfall. In general, CCN concentrations show a slight enhancement (more prominent during clean background–marine air mass) during daytime due to the anthropogenic activities. A rapid increase is seen just after sunrise in all the conditions, though it is weak in continental-2, due to the mixing of the nocturnal residual layer with the evolving PBL (fumigation peak). There is no vivid diurnal variation in CCN during continental-2. The diurnal variations of CN and BC concentrations for different periods are shown in Fig. 6. The diurnal variation of the CN concentration and BC mass concentration is more vivid than that of the CCN concentration. A clear bimodal variation is seen in both CN and BC diurnal variations during marine conditions. A sharp peak is seen in both CN and BC after sunrise (06:00–07:00 IST) and the next peak starts increasing from 15:00 IST and the maximum is at around 20:00 IST. The diurnal variations in CN and BC are less prominent during the marine, compared to those during the continental conditions. In both the conditions a small increase is seen in the CN concentration around the afternoon. The magnitude of the fumigation peak seen in BC during the continental conditions was more than twice the corresponding daytime average values. Another important observation is that the CN values were consistently higher during continental-2 throughout the day than continental-1, while the daytime BC mass was higher during continental-1 than 2. In contrast to the CCN, the BC had well-defined multiple peaks (morning and evening), indicating the contrasting aerosol source characteristics during the diurnal cycle. The well-mixed conditions during the late afternoon hours and the PBL evolution have a well-defined role in the reduction of concentrations during the daytime until new sources of aerosol are injected in to the atmosphere in the evening hours. The nighttime increase in BC could be due to the stable conditions and less vertical mixing. The role of the PBL in modulating regional aerosol characteristics will be dealt with in a separate study.
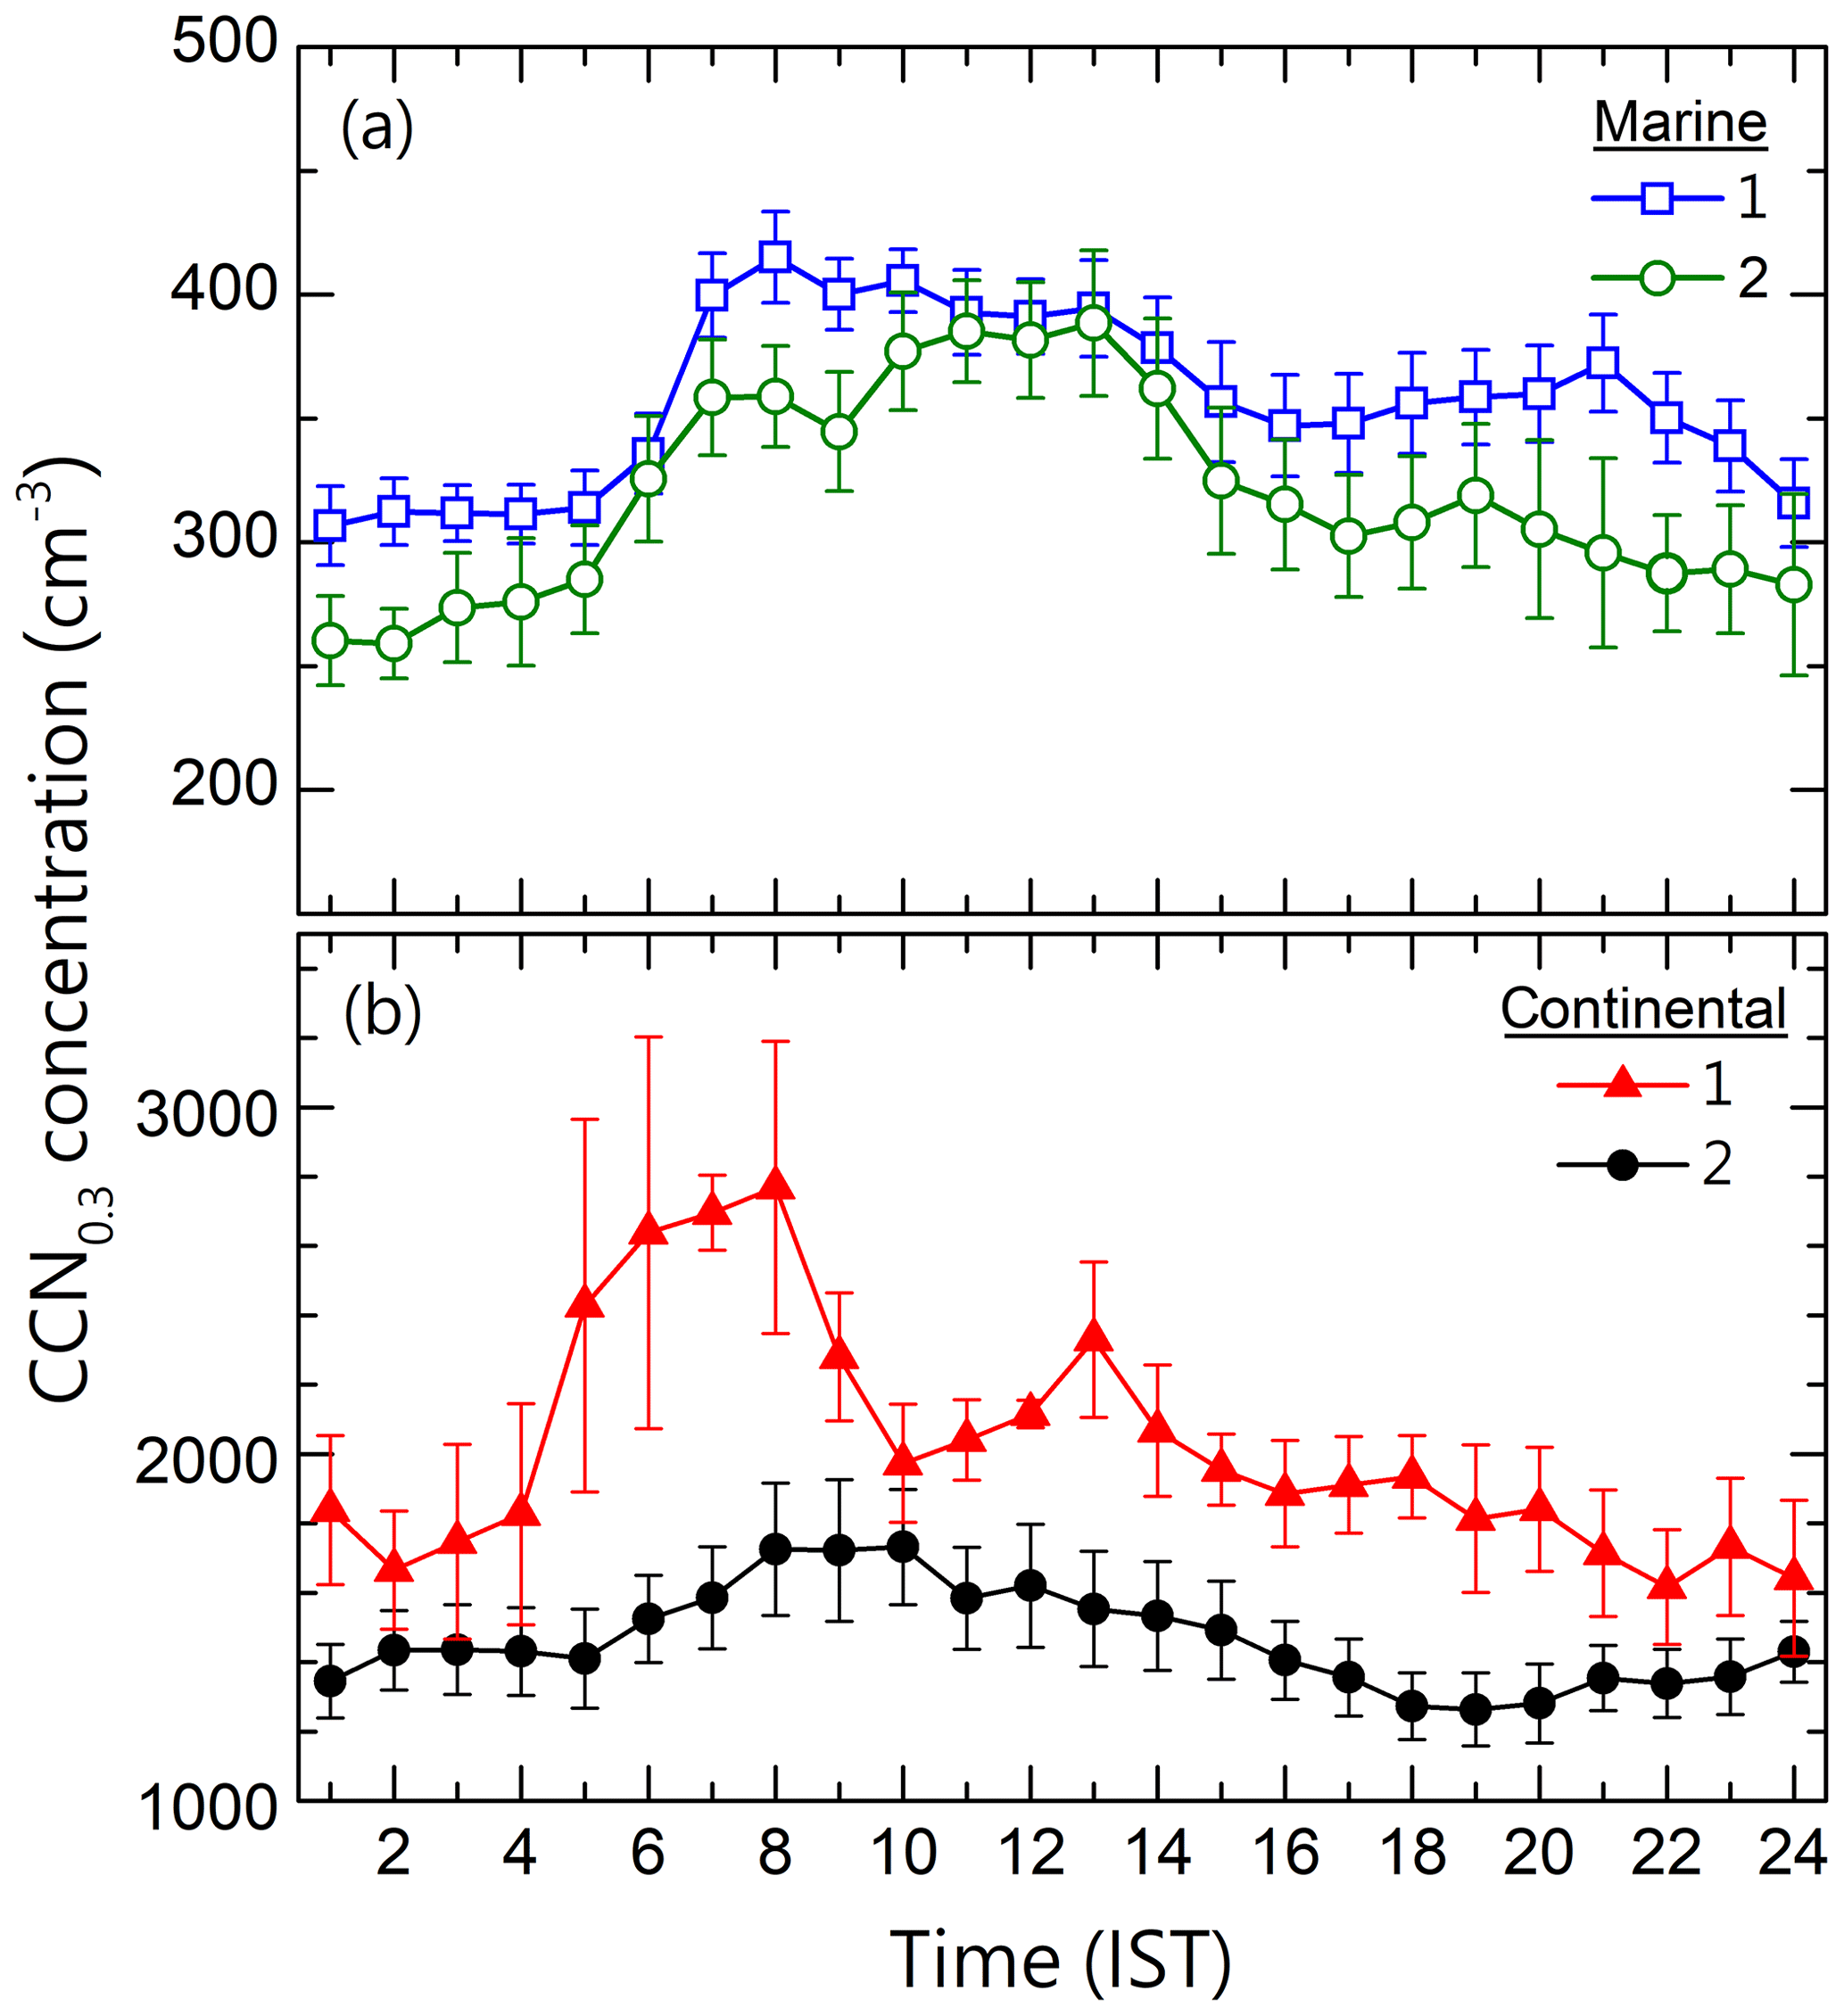
Figure 5Diurnal variation of CCN concentrations at 0.3 % SS during (a) marine and (b) continental conditions.

Figure 6Diurnal variations of (a) CN and (b) BC concentrations during marine and continental conditions.
A few studies reported the diurnal variations in CCN and its properties at coastal (Jayachandran et al., 2017), WG (Leena et al., 2016; Jayachandran et al., 2018), IGP (Patidar et al., 2012), central Himalayan (Gogoi et al., 2015), and eastern Himalayan (Roy et al., 2017) environments of the Indian subcontinent. Weak diurnal variations in CCN concentrations during ISM, similar to the present study but with opposite pattern, were reported from the southern coast by Jayachandran et al. (2017) and from WG by Leena et al., (2016). Day–night variations in the CCN concentrations can be due to the changes in aerosol sources, PBL dynamics, or both. Since the sky has generally been overcast during the ISM and hence a shallow moist PBL (Sandeep et al., 2014) prevails, the observed diurnal variations during marine conditions are mainly due to the diurnal variations in the source and sink processes. The bimodal diurnal pattern seen in BC mass concentration at Solapur is seen similar to the observations reported by Safai et al. (2007) over Pune. Apart from the fumigation process happening during sunrise, vehicular and biomass emissions also have a role in the peaks observed in a day. Thus, both local emissions and PBL dynamics contributed to the diurnal variations observed in the AP characteristics. The diurnal variations during the continental conditions indicate the consistently high AP background conditions. While the diurnal variations during the marine conditions indicate the significant presence of local AP sources.
3.3 CCN–CN association
The association of CCN concentration at 0.3 % SS with the concurrent total AP number concentration, CN (∼15–685 nm), is investigated separately for different conditions and is shown in Fig. 7. CCN concentration at 0.3 % during continental-1 is estimated from the measured CCN spectra. The role of the aerosol NSD is revealed through the color of the scatter which represents the geometrical mean diameter (GMD) of the corresponding AP system. It can be inferred from the figure that the relationship between CCN and CN is different for different conditions. A least-square linear fit forced through origin (as there is no CCN in the absence of CN) is made through the scatter.
The best linear relationship between the CCN at 0.3 % and CN concentrations is seen during continental-1, and the corresponding slope and correlation coefficient (R) of the fit are ∼0.56 and 0.98, respectively. The linear association weakens during the marine condition when the slope and correlation coefficient values of the fit reduce to ∼0.12 and 0.90, respectively. Even though under continental conditions the slope of the linear fit during continental-2 (∼0.28) reduces to the half of that measured during continental-1, the correlation coefficient value (R=0.94) also reduces. The relationship between CCN and CN during marine-2 is weaker than the continental, and only a few APs are activating as CCN. It can be seen that most of the scatter points which lie below the linear fit line and correspond to the higher (than the monthly mean) CN values have GMD less than 50 nm. Even though the number of cases is less, similar observations can be seen during the continental case too. The two points (black circle) corresponding to CN concentrations higher than 13 000 cm−3 have GMD less than 50 nm. These cases which reduce the CCN activation indicate the presence of a UF mode, probably due to the new particle formation (NPF) events. However, the presence of UF particles is not the only reason for less activation of CN as CCN in marine conditions as the scatter and the linear fit excluding the UF particles also have low correlation and slope values.
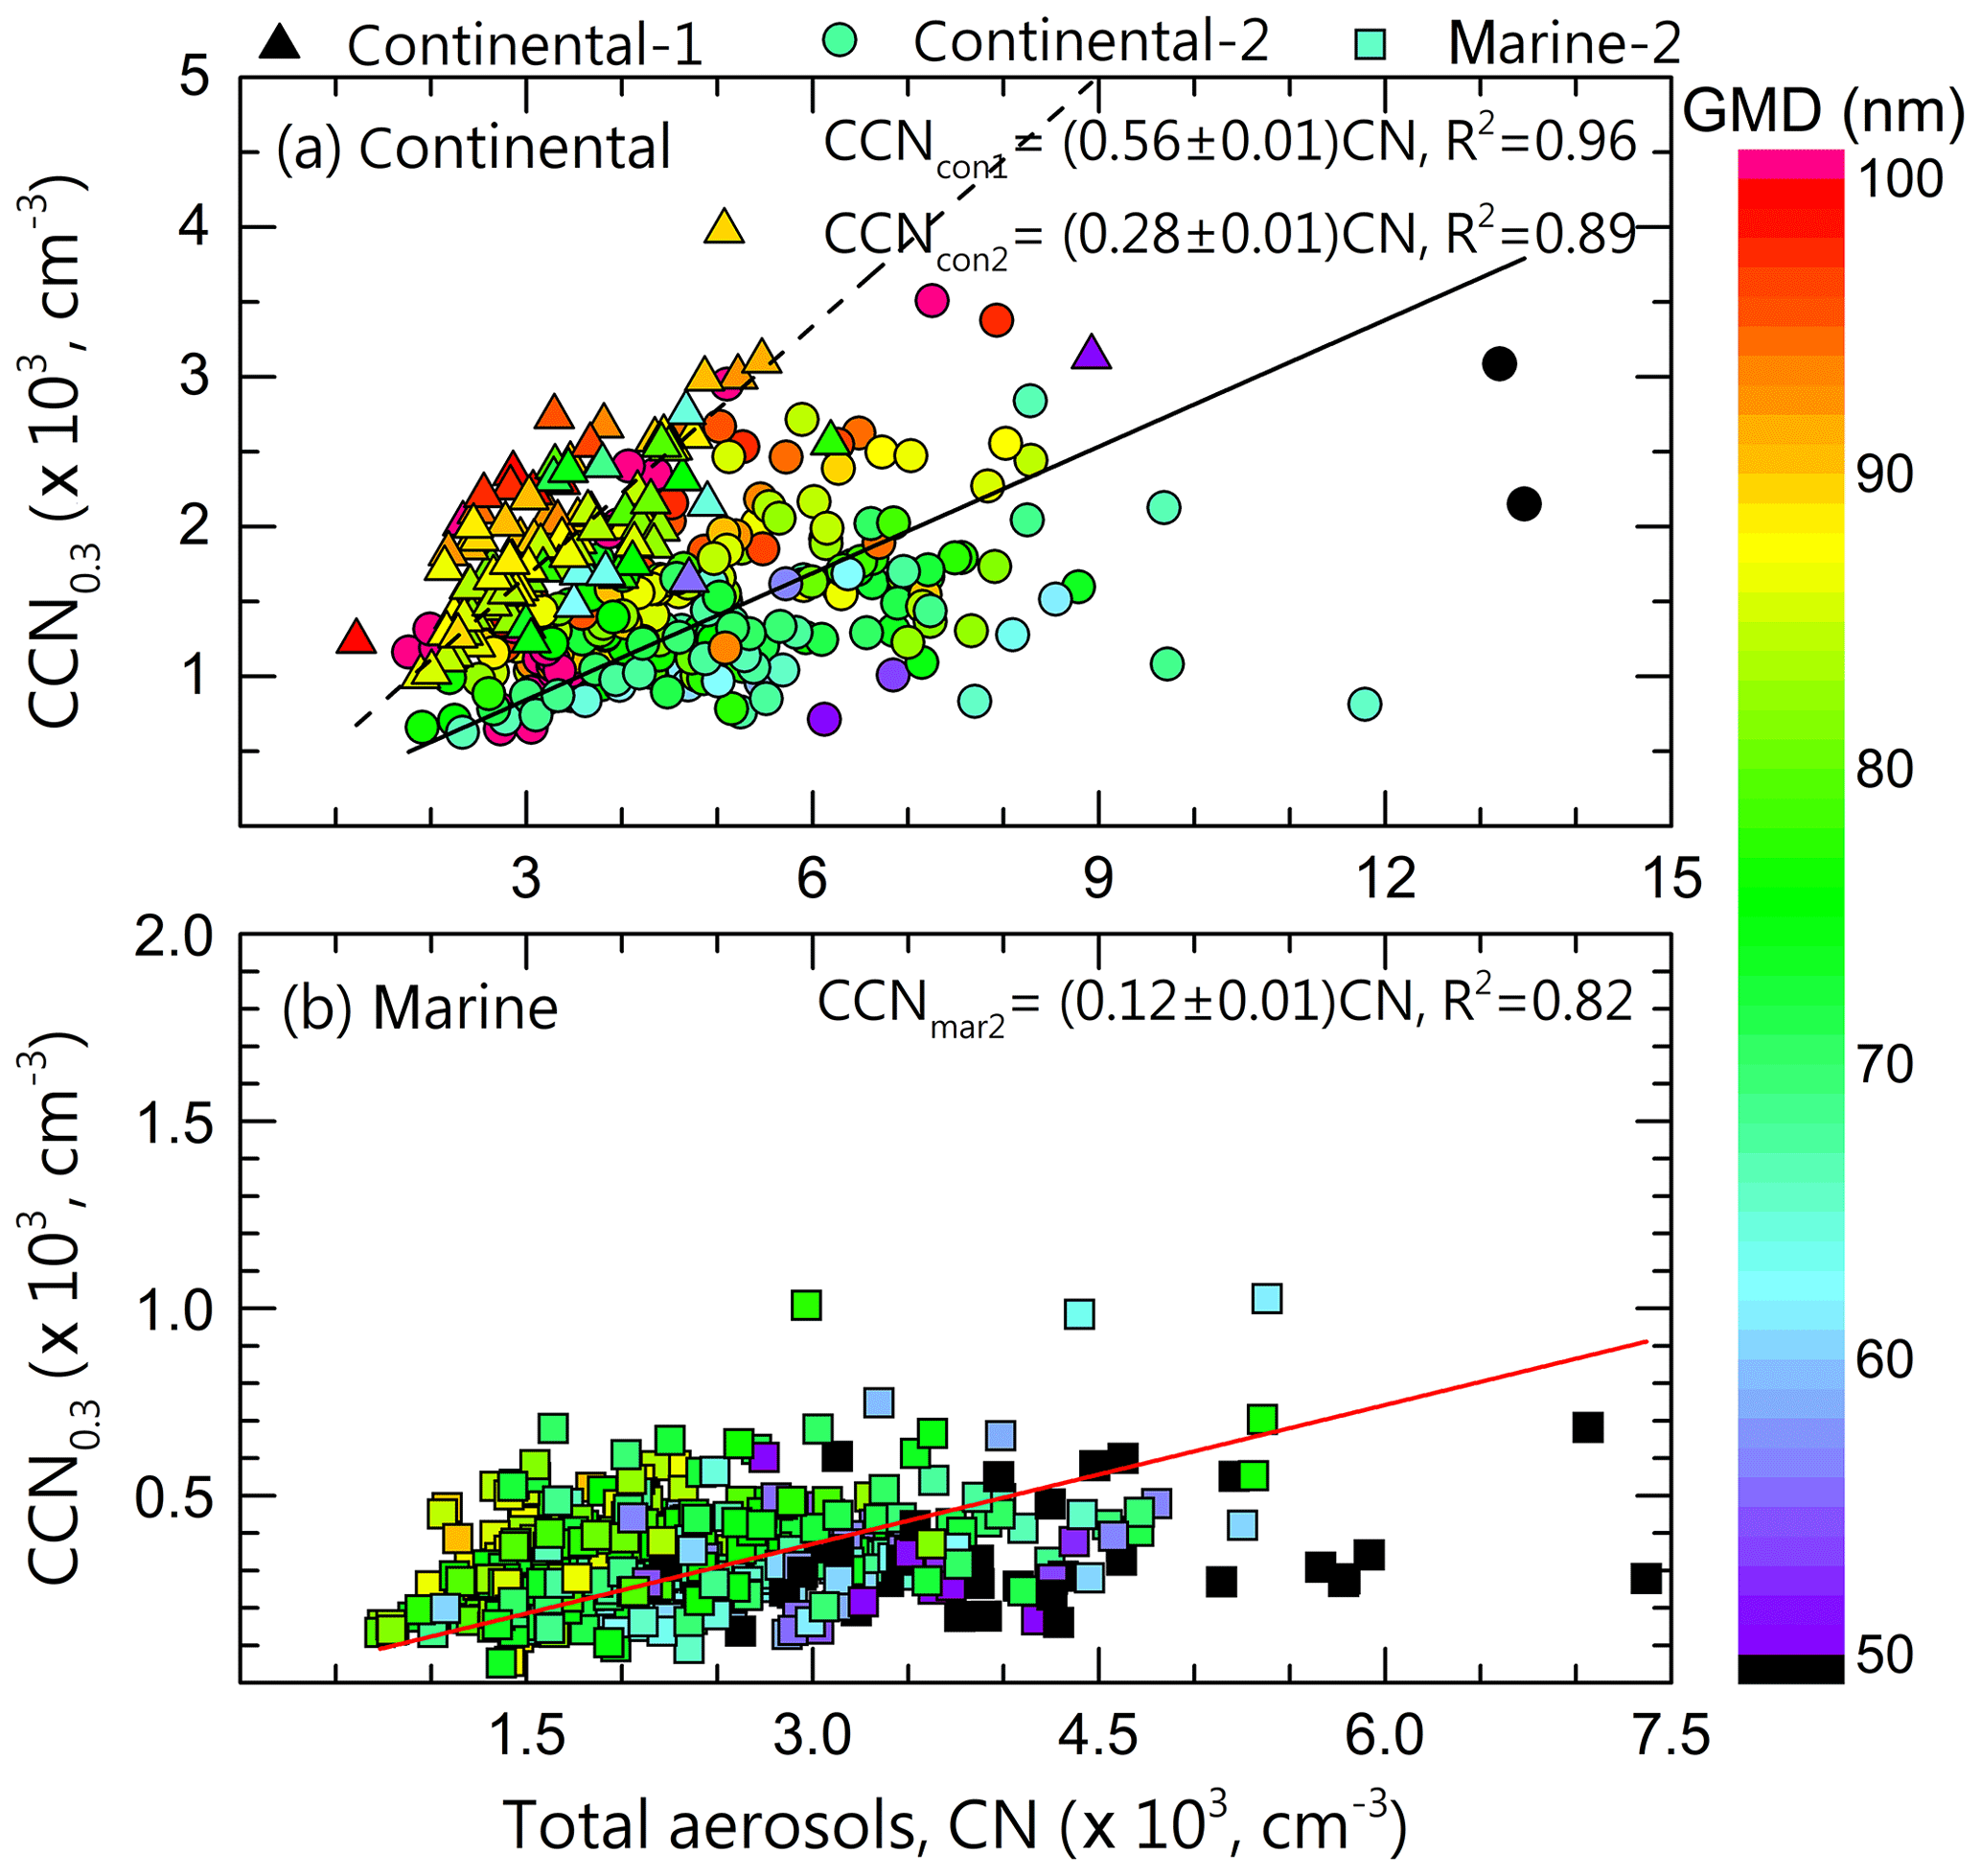
Figure 7Association between CCN (at 0.3 % SS) and CN concentrations segregated to (a) continental and (b) marine conditions. The color of the scatter indicates the concurrent geometrical mean diameter of the aerosol system. The least-square linear fit is also shown along with the fit parameters.
During marine-2 (Fig. 7b), the CCN concentration at 0.3 % was not increasing beyond 600 cm−3 despite CN concentration increasing to . This is indicative of a significant number of UF APs that require high SS for activation. Similar behavior of AP system towards CCN activation is observed at the eastern Himalayas (Roy et al., 2017). The drastic difference in CCN–CN association, similar to the present study, is also reported by Asmi et al. (2012) between winter and summer months at a high-altitude site in France. They have attributed the predominance of accumulation mode particles and fine-mode particles during winter and summer months, respectively, to the distinct CCN–CN association. From the central Himalayas, Dumka et al. (2015) have shown an increase in CCN–CN scatter during ISM due to the change in the aerosol physicochemical properties. The spread of the scatter between CN and CCN increased for polluted conditions (Jayachandran et al., 2020), which was attributed to the associated complex aerosol size distribution and mixing state. Thus, the CCN dependence on the CN population during the ISM shows a complex dependence on the aerosol size and mixing state.
3.4 CCN activation fraction
The fraction of APs acting as CCN at a given SS is known as the CCN activation fraction/ratio (AF) and is an important parameter for characterizing the CCN activity (Dusek et al., 2006; Andreae, 2009; Deng et al., 2013). The CCN AF values for all the SS segregated to different air mass history are shown in Fig. 8. During continental-1, more than 40 % of the APs are being activated as CCN at 0.2 % SS. Nevertheless, during marine-2, about 40 % of the particles only are activating as CCN even at 1.2 % SS, revealing the highly CCN inactive nature of the APs. During continental-2, the CCN AF values at all SS are between those of continental-1 and marine-2.
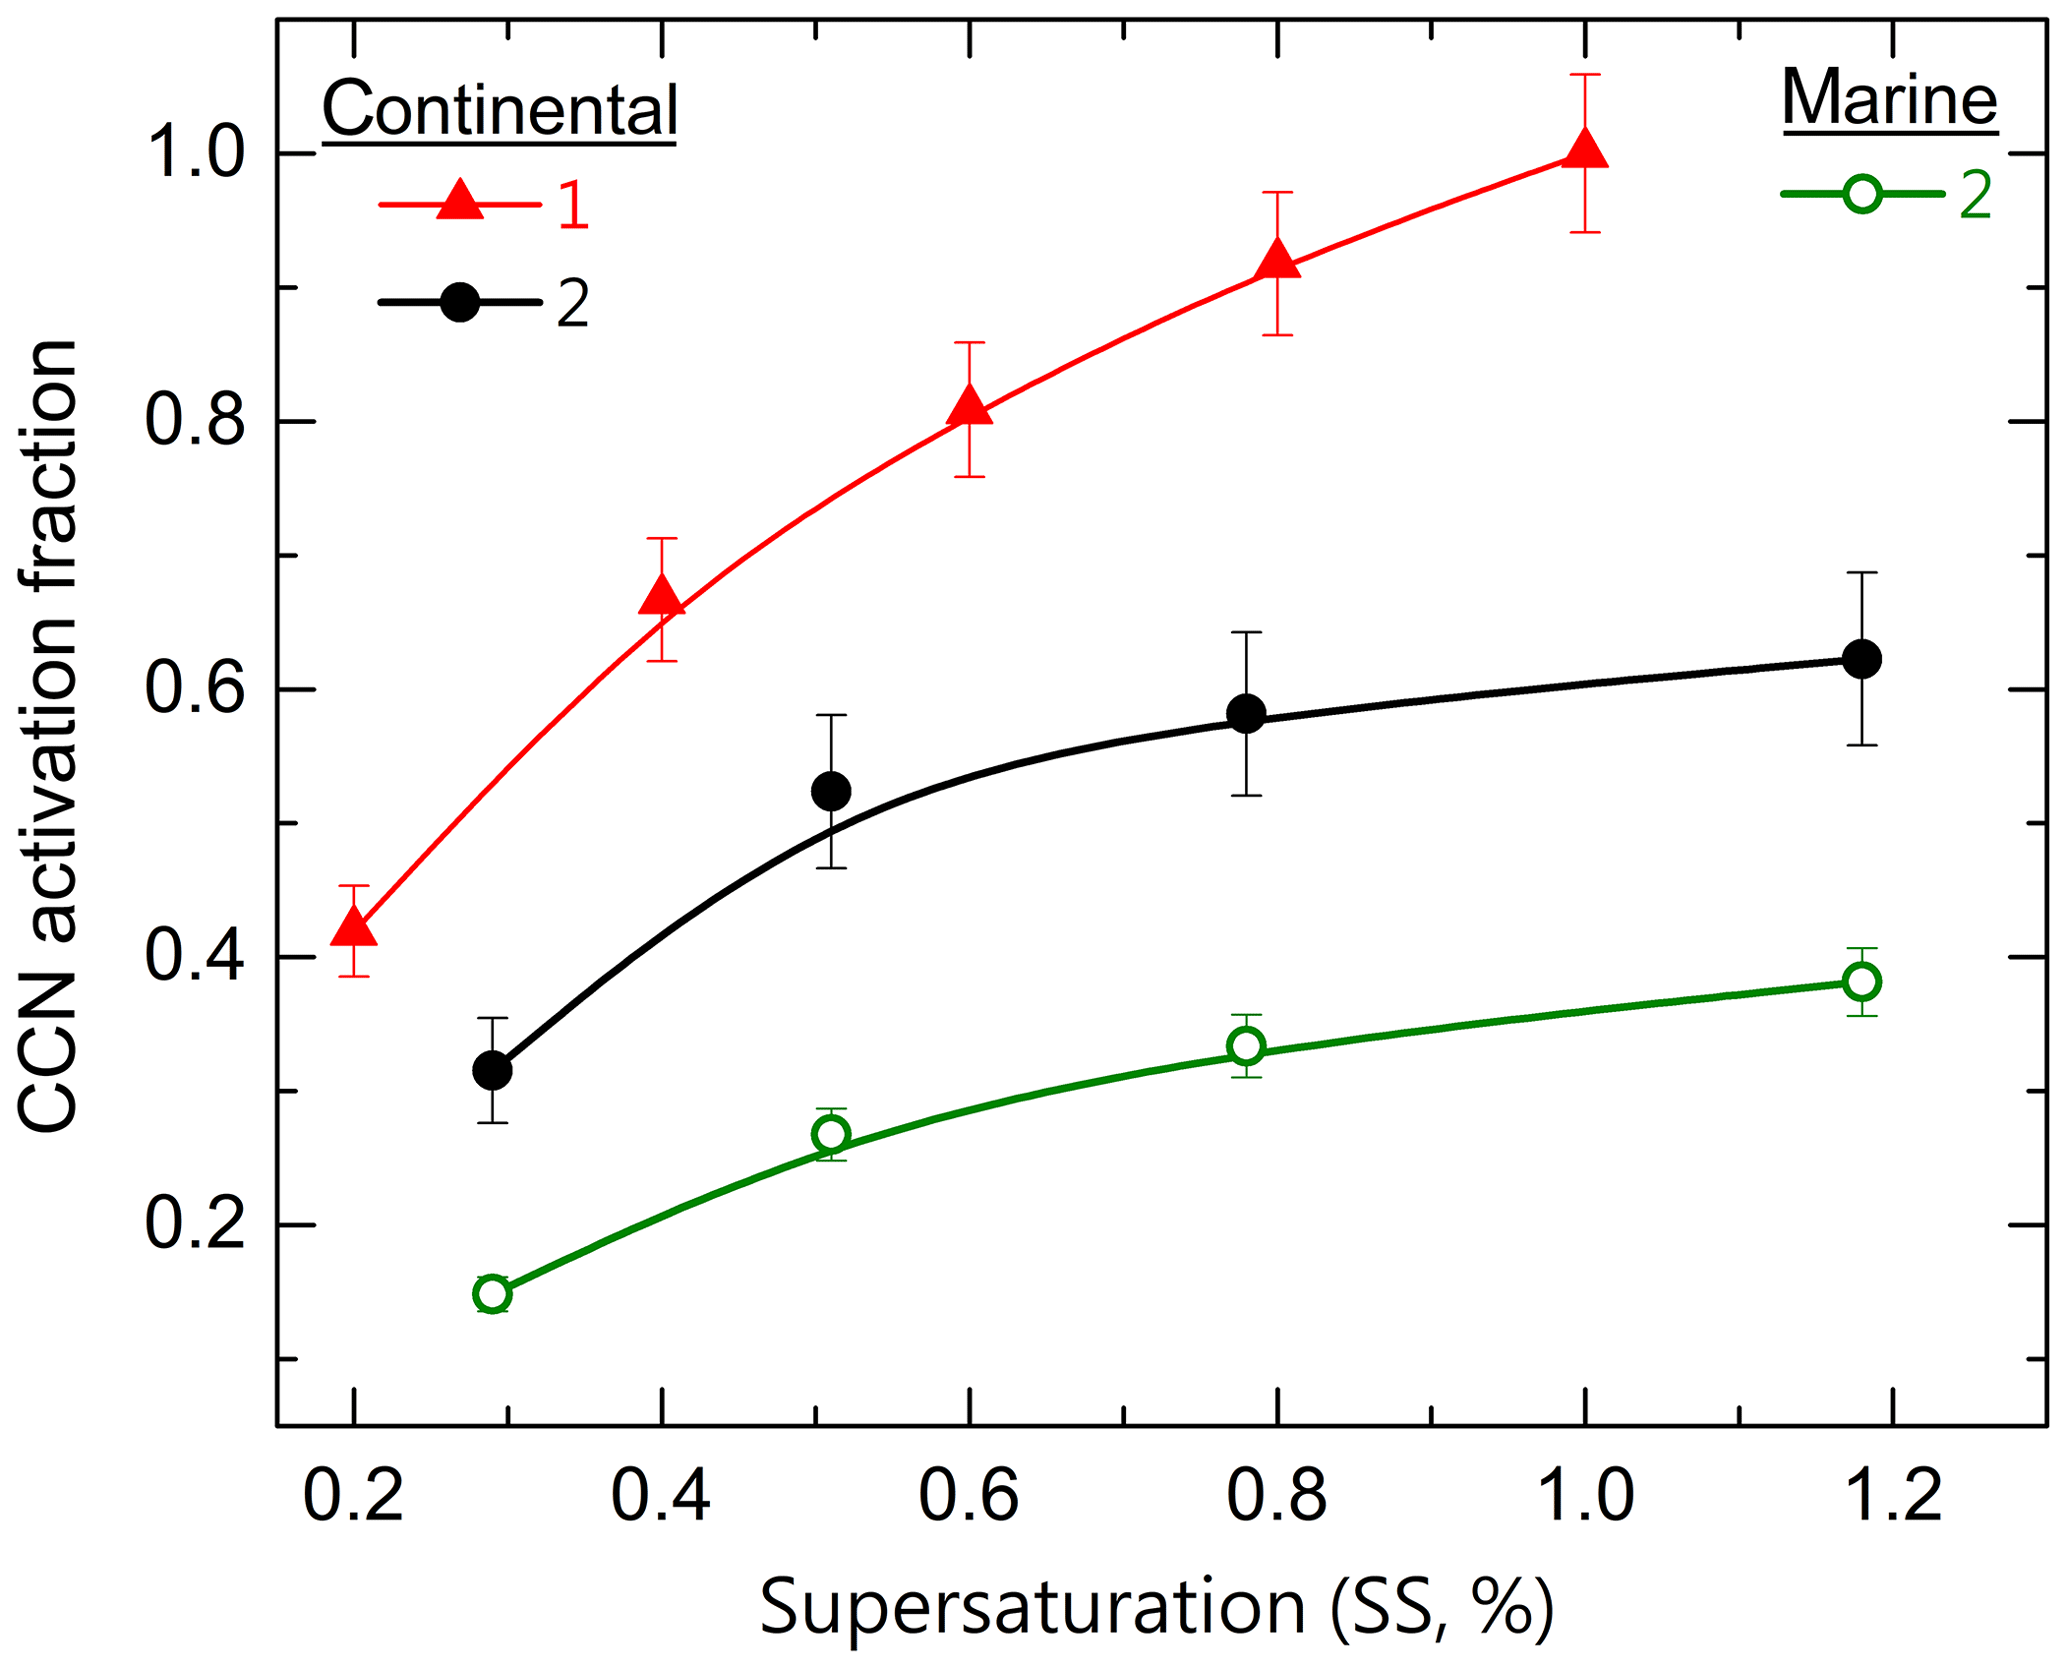
Figure 8Variation of CCN activation fraction at different SS during continental and marine (conditions). Vertical error bars indicate the standard error.
The diurnal variations of k and AF (0.3 % SS) values are shown in Fig. 9. Unlike the continental conditions, the k values show a clear diurnal pattern during the marine conditions, similar to the case of CN and BC concentrations. The k values almost double after sunrise and decrease thereafter to reach the nighttime values by evening hours (16:00 IST) during marine conditions. Again, the k values peak at around 21:00 h IST. The enhancement in CCN and k values during daytime in marine airmass conditions indicates the influence of local anthropogenic aerosol sources in determining the CCN activation. As discussed in Fig. 8, the CCN AF values are very low throughout the day, with a slight increase during noon hours in marine-2 when the k values are low. In contrast, the AF values are consistently high throughout the day during continental-1. During continental-2, an increase in CCN AF (from ∼0.3 to 0.4) can be seen during the daytime.
It is well understood that the CCN characteristics are a function of aerosol size and composition. Hence it will be interesting to know the diurnal variations of the concurrent aerosol size and composition. In the absence of continuous aerosol composition measurements, the absorption Ångström exponent (αabs), which is a proxy to identify the nature of the carbonaceous aerosols, is estimated, and its diurnal variation for different conditions is shown in Fig. 10a and b. The diurnal variation of the GMD for the corresponding periods is shown in Fig. 10c and d. The diurnal variations of αabs are similar for the marine conditions, with the values peaking by sunrise (06:00–09:00 IST) and late evening hours (18:00–20:00 IST). Almost the same pattern is seen during continental-2 also but of different magnitudes. Meanwhile, there are no clear diurnal variations in αabs during continental-1 observations similar to the diurnal variations of k and AF.
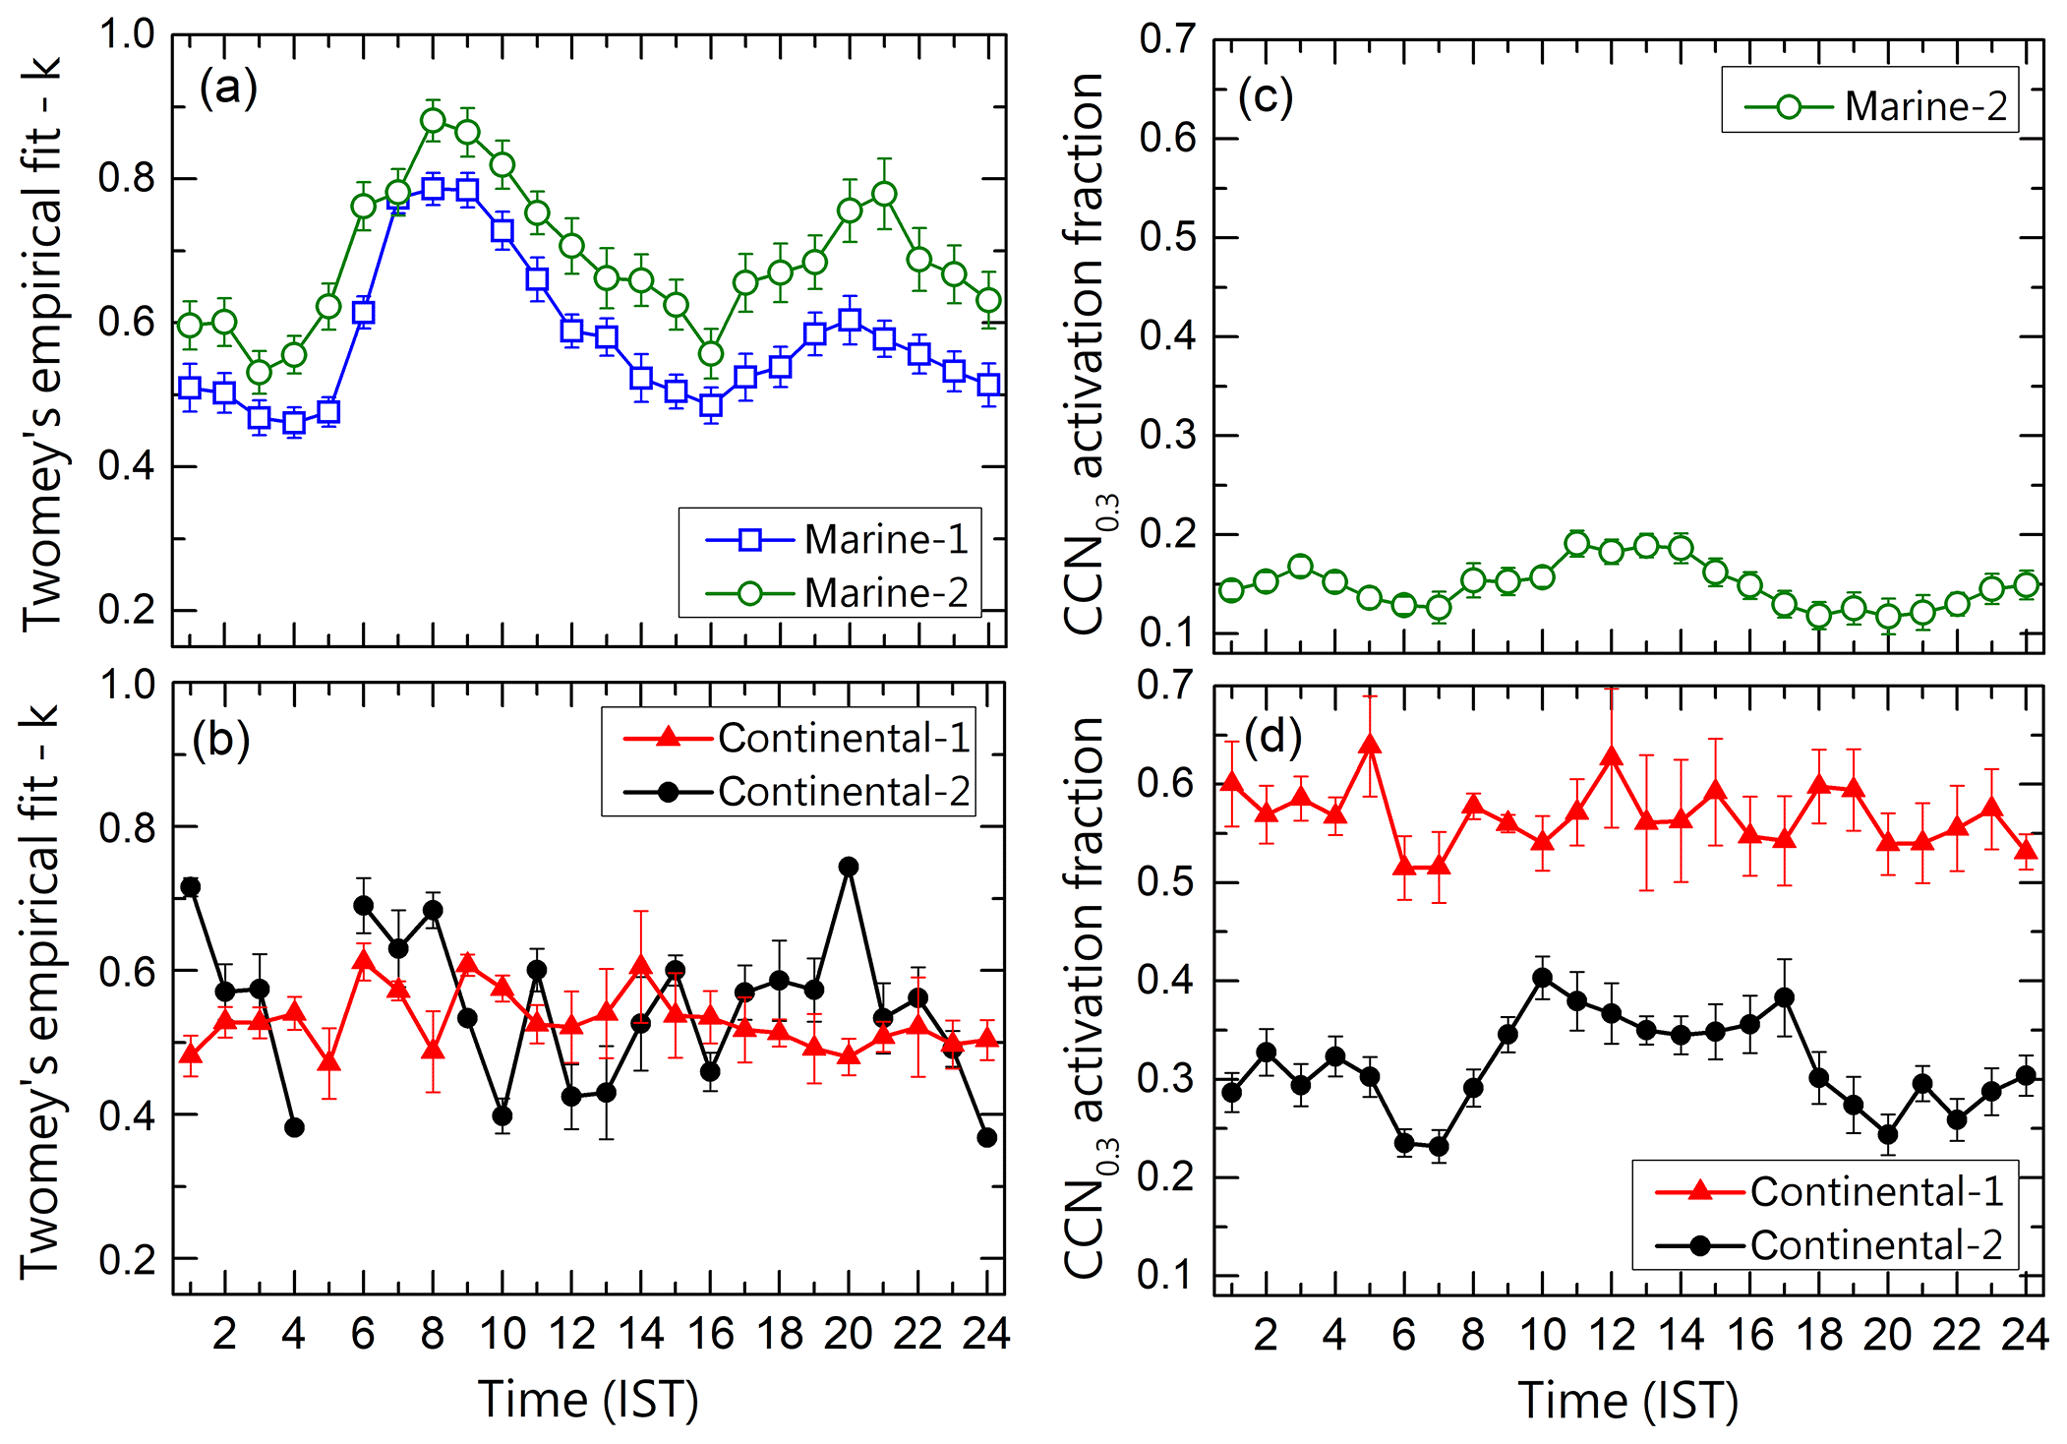
Figure 9Diurnal variations of k values (a and b), and CCN activation fraction (c and d), during marine and continental conditions. Vertical bars indicate the standard error values.
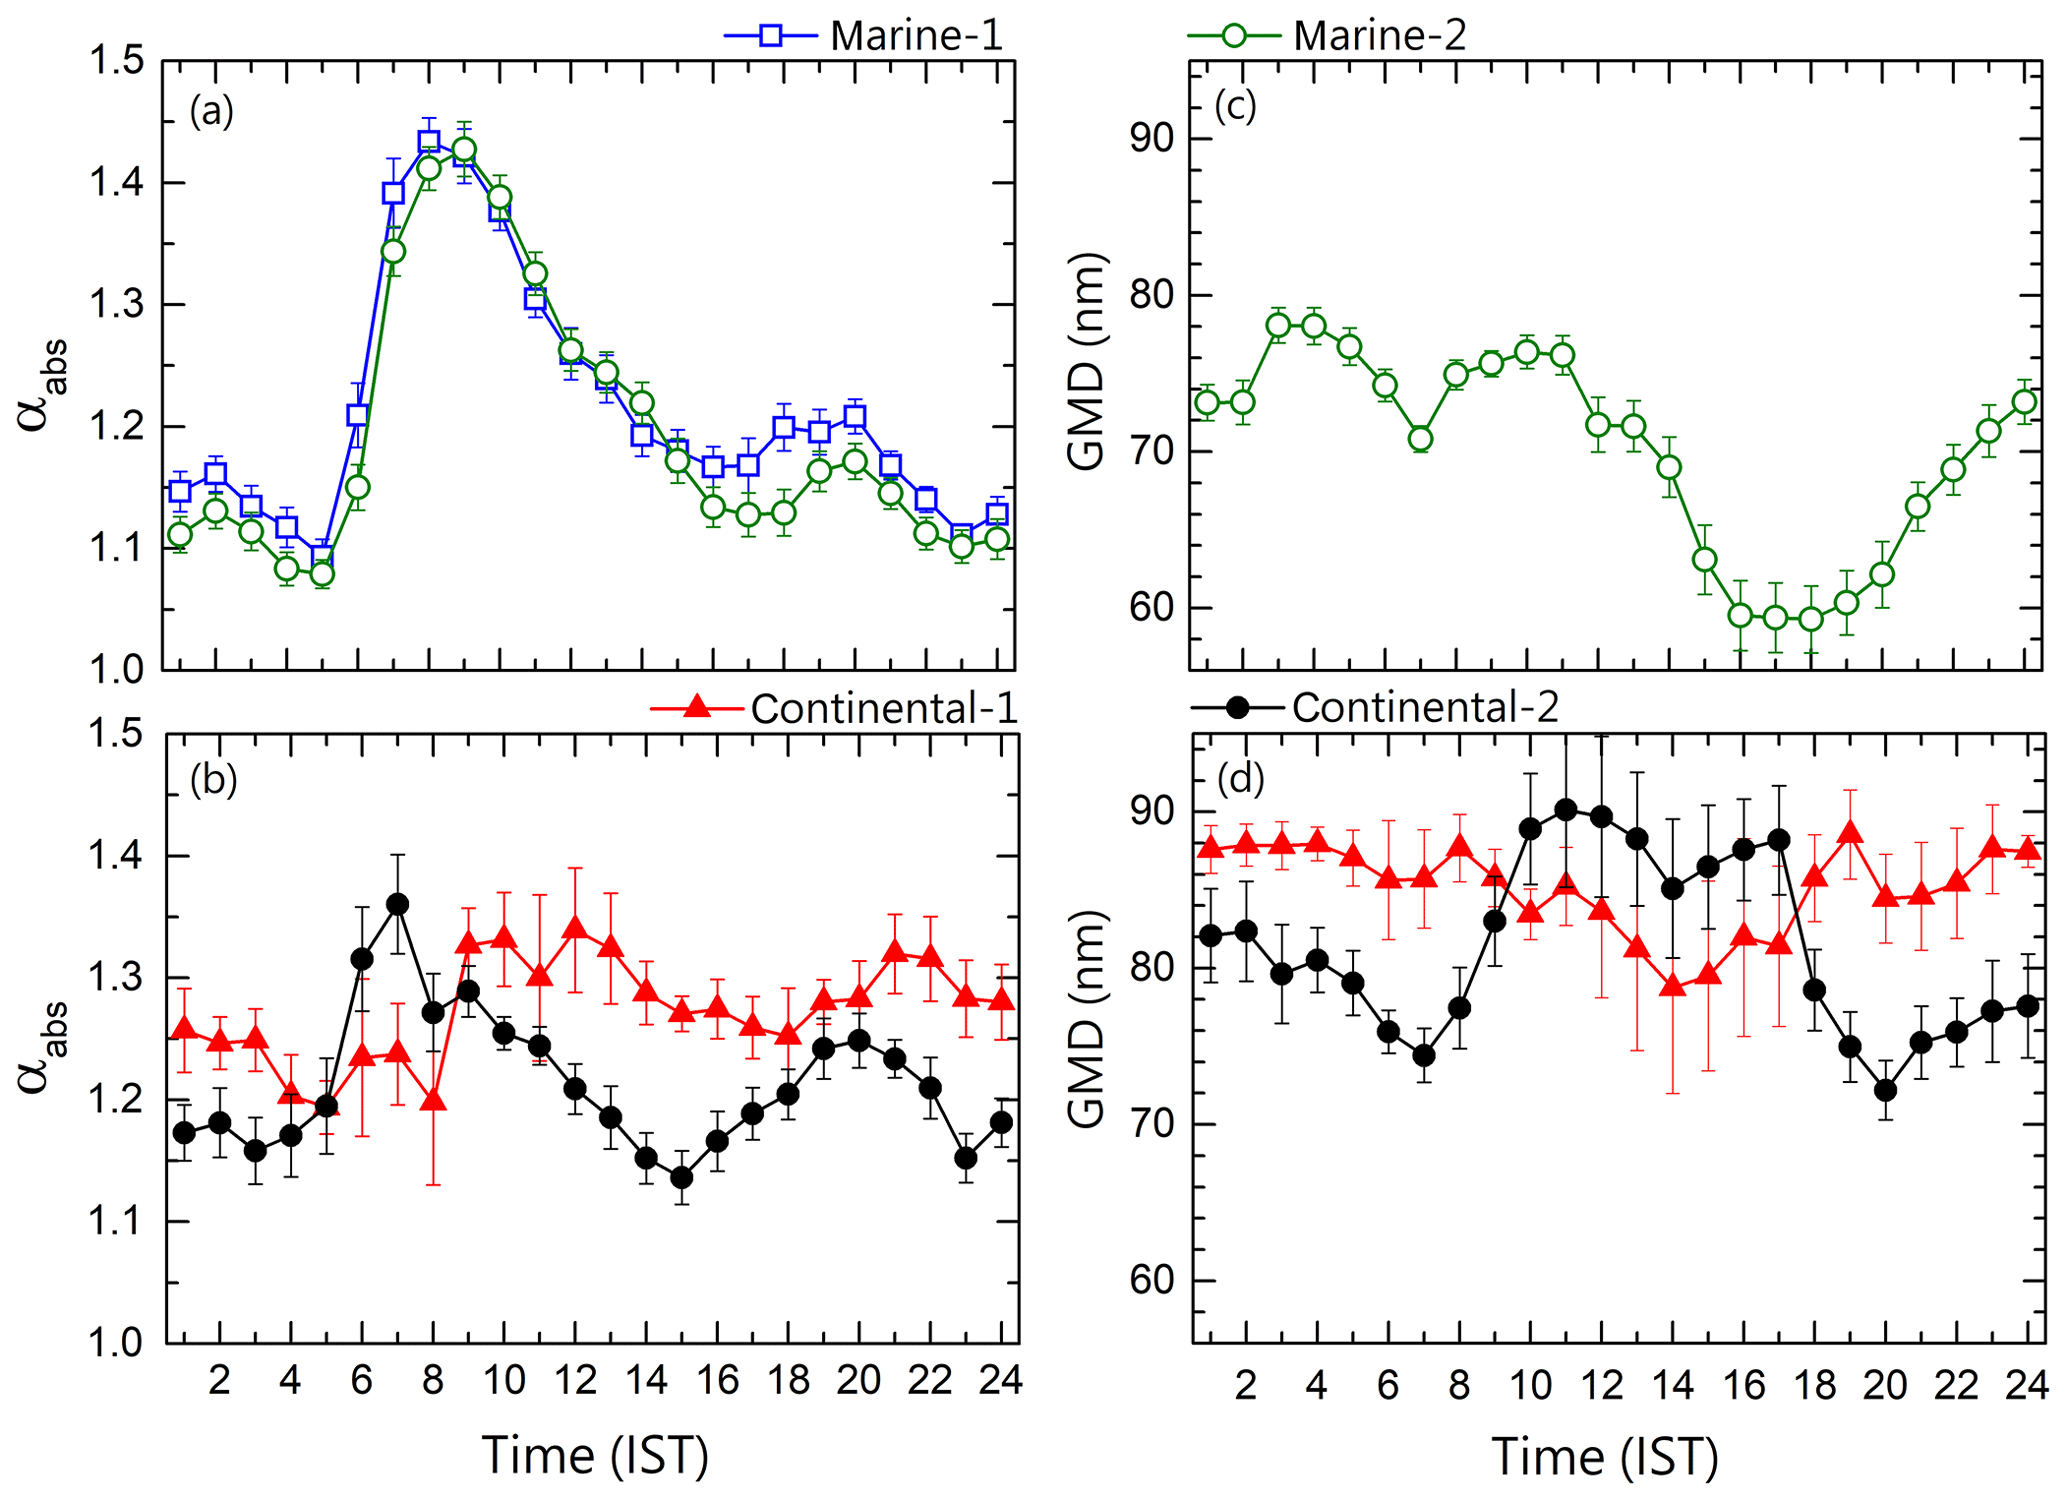
Figure 10Diurnal variation of absorption Ångström exponent (a and b) and geometrical mean diameter (c and d) during continental and marine conditions. Error bars indicate the standard error associated with the mean values.
The mean GMD values during the marine conditions decrease from 12:00 IST onwards and reach the minimum value (<60 nm) from 16:00 to 18:00 IST, which increases back to ∼72 nm by the midnight hours. Interestingly, a small dip in the GMD is observed during the fumigation peak (∼07:00 IST), which is associated with the sharp increase in αabs values. The GMD values were consistently higher throughout the day during continental-1, in that the lowest mean value (∼79 nm) observed at the 14:00 IST is higher than the maximum mean GMD (∼78 nm) observed in a day (03:00 and 04:00 IST) during marine-2. The GMD during continental-2 depicts a clear diurnal variation, which is opposite to that observed during continental-1, with distinct high values during the daytime. Similar to marine-2, GMD decreases during the fumigation peak associated with a sharp increase in the αabs values.
Even though the mean αabs values are almost similar in all periods with comparatively higher (1.29±0.09) during continental-1 and lower during marine-2 (1.19±0.14), the values show diurnal variations systematic with aerosol abundance diurnal variations. The sudden sharp increase in the k values (Fig. 9a) during sunrise hours of marine-2 is associated with a similar enhancement in the αabs values. The high k values (>0.8) during these hours are due to the organic aerosols inferred from αabs values. Chung et al. (2012) have reported αabs values above 1.6 for organic aerosols while Gyawali et al. (2009) have reported αabs values above 1.4 for biomass smoke. The daytime enhancement (∼2 times) in CCN AF during continental-2 is exactly according to the daytime enhancement seen in the aerosol GMD. Interestingly, a similar association is not seen in other periods. Jayachandran et al. (2017) have reported a similar association between CCN AF and aerosol GMD diurnal pattern during ISM from a coastal site in southern peninsular India. Thus, the aerosol composition, especially the organic aerosols inferred from the high αabs values, is playing a role in determining the CCN activation during the marine conditions, while the aerosol size is determining the CCN activation during the continental conditions.
In general, high AF is found for aged background aerosols, while freshly emitted polluted urban aerosols have low CCN efficiency (Andreae and Rosenfeld, 2008). CCN AF values reported from India and some relevant studies reported across the globe are mentioned in Table 2. The similarity seen in CCN concentration and k values is seen in CCN AF also between Solapur and Ponmudi during the ISM. At both the places, only a small fraction (15 %–20 %) of the ambient APs are activating as CCN at 0.3 % SS. As seen in the Table, high AF values are reported from the coastal location and the central Himalayas. The high CCN AF during the continental conditions at Solapur is similar to those reported during dry conditions in Nainital (Gogoi et al., 2015), where the high CCN AF was attributed to biomass burning. The low CCN AF observed at Solapur during marine conditions resulting from the wet scavenging is consistent with the values reported over the subcontinent during similar conditions, while the high CCN AF before and after monsoon rainfall is observed by several studies to resemble a biomass-burning-dominant polluted environment (Andreae, 2009).
As mentioned earlier and reported by several studies (Dusek et al., 2006; McFiggans et al., 2006), aerosol size plays a major role in determining the CCN activation ability of aerosols. It has been found that the UF particles were present during the monsoon conditions when CCN AF was very low (Fig. 8). Meanwhile, the presence of bigger particles is enhancing the CCN activation in other cases. To investigate the role of aerosol size in the observed CCN activity, the aerosol NSD during each condition is examined in detail.
3.5 Aerosol size distribution and critical activation diameter
The simultaneous and co-located aerosol size distribution observations and critical diameter are examined. The fraction of particles in the nucleation mode, Aitken mode, and accumulation mode is estimated and shown (in %) in Fig. 11a. Nucleation mode particles are those observed below 30 nm, Aitken mode particles are those from 30 to 100 nm, and accumulation mode particles are those beyond 100 nm (Ueda et al., 2016; Willis et al., 2016). The corresponding mean NSDs of APs along with the standard deviations for the study period are shown in panels (b), (c), and (d) of Fig. 11. The frequency of occurrence of the GMD for each period, along with the mean GMD values, is shown in Fig. 11e. As seen in the CCN characteristics, aerosol NSD also depicts distinct features prior to the marine (Fig. 11b), during marine (Fig. 11c), and after the marine air mass (Fig. 11d).
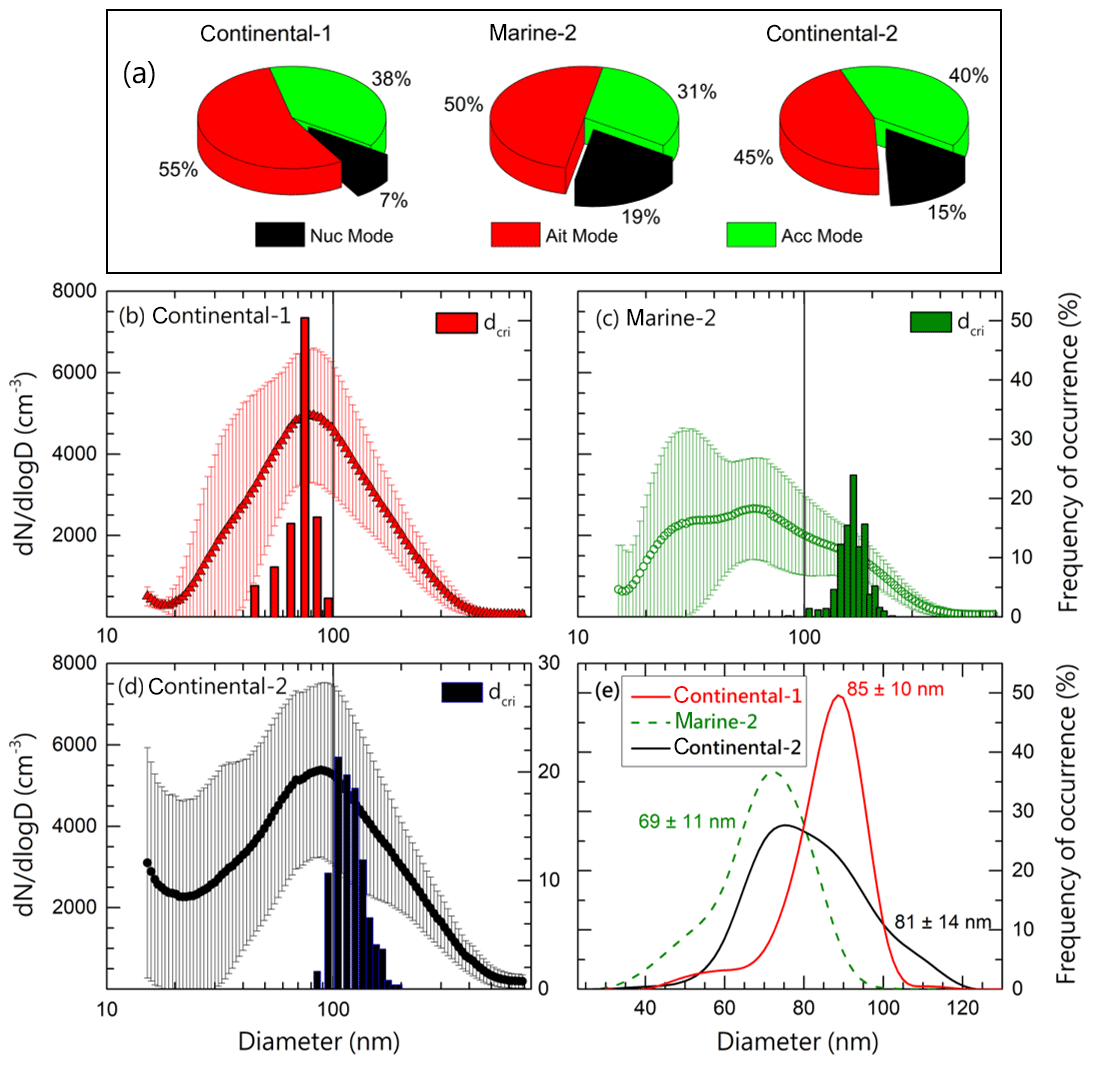
Figure 11(a) Fraction (in %) of nucleation mode, Aitken mode, and accumulation mode particles during the observation periods. Aerosol mean number size distribution (with standard deviations) during (b) continental-1, (c) marine-2, and (d) continental-2 conditions. The bars in the same plots indicate the frequency distribution of critical activation diameters at 0.3 % SS of the corresponding conditions (right axis). (e) Frequency distribution of the geometric mean diameter of the aerosol system during the observation periods.
During continental-1, most of the distributions are monomodal, peaking around 80 nm, and the mean GMD during this period is ∼85 nm. In this period, the majority (∼55 %) of the APs were present in the Aitken mode and least (∼7 %) in the nucleation mode. During the continental-2 air mass conditions, a prominent presence of nucleation mode particles (15 %) was also seen (Fig. 11d). The consistent presence of such particles is seen as the spread of the distribution of the GMD in Fig. 11e. Unlike the continental air mass conditions, the aerosol size distributions are entirely different during the marine air mass under the monsoon rainfall as seen in Fig. 11c. Three modes are distinctly observed in Fig. 11c with two peaks below 100 nm. The mean GMD during this period is ∼69 nm with the frequency distribution spreading towards the lower size range. About 19 % of the total aerosols were found in the nucleation mode (<30 nm) during marine-2, and this feature continues in continental-2 also – even though the air mass history changes. The accumulation mode (30–100 nm) AP concentration diminished (only 31 %) during the marine air mass.
For a given aerosol NSD, the critical activation diameter (dcri) serves as an important parameter for representing the CCN activity, along with the CCN activation fraction and the empirical fit parameter, namely k values. Assuming homogeneous composition, dcri for a specific SS can be estimated by integrating the aerosol NSD from the higher to lower size until the integration becomes equal to the measured CCN number concentration at that SS (Furutani et al., 2008; Kammermann et al., 2010; Deng et al., 2011; Fang et al., 2016). The lower limit of the integration can be considered as the “apparent” critical activation diameter, as the ambient aerosol system can have both internal and external mixing states, and size-dependent composition. Comparing the dcri for different conditions, the values were always less than 100 nm during continental-1; in contrast, the values were always greater than 100 nm during marine-2. The dcri values were around 100 nm during continental-2. The mean (± SD) values of dcri were 72±12 nm, 169±38 nm, and 121±20 nm for continental-1, marine-2, and continental-2 conditions, respectively.
Different factors such as heterogeneous sources (Kim et al., 2002; Morawska, 2002), local meteorology (Wehner and Wiedensohler, 2003; Du et al., 2018), long-range transport (Birmili et al., 2001), and cloud processing (Noble and Hudson, 2019) can influence and modify the NSD. The predominant (69 %) fine-particle (<100 nm) size distribution (bimodal) during marine air mass is similar to the two modes observed in the fine size range at the urban site, Kanpur (Bhattu and Tripathy, 2014), during the ISM. The GMD values and the corresponding CCN properties from the present study and other relevant studies are listed in Table 2. Lower AP concentration with low GMD (74 nm) was observed during the monsoon at an urban site by Kanawade et al. (2014) and at a background Himalayan site (86 nm) by Kompulla et al. (2009) over the Indian subcontinent. Similar to the present study, GMD was high before and after the monsoon period in both studies. From a high-altitude site in WG, Leena et al. (2016) have reported the lowest seasonal mean GMD of ∼77 nm during ISM. The enhancement of the smaller particles in the total aerosol system, causing the reduction of the GMD especially during monsoon as seen in the present study, is consistent with the previous studies (Babu et al., 2016). The mean GMD value observed over Solapur during ISM is the lowest (69 nm) reported value during a similar period over the Indian region.
Similar to the present observations, comparable accumulation and Aitken modes and a dominant accumulation mode were reported over the Amazon for wet and dry months, respectively by Pöhlker et al. (2016). The accumulation mode particles are associated with either aged biomass burning particles (Kalvitis et al., 2015) or condensation or coagulation of secondary organics and inorganic particles (Seinfeld and Pandis, 2016). Interestingly, low aerosol GMD values (<70 nm), similar to the present observations during marine air mass, were consistently observed near anthropogenic sources by Quinn et al. (2008). In the same study, they found bigger APs (GMD>70 nm) for observations carried out away from anthropogenic sources, which is similar to the present observations during the continental conditions. From the concurrent aerosol mass spectrometer measurements, they found that hydrocarbon-like organic aerosols (HOA) having mass spectrum characteristic of long-chain hydrocarbons from fresh diesel exhausts were responsible for the fine mode, while oxygenated organic aerosols and sulfates are responsible for the higher GMD. Hence the presence of freshly produced local fossil fuel combustion aerosols in the UF mode can be a reason for the low CCN activity during marine-2 in the present study. During the marine condition, most of the bigger APs, which are potential CCN, are either washed out by wet scavenging or already activated as cloud droplets. Hence the measured APs are devoid of CCN active particles which are clearly seen from the aerosol NSD during the relevant period (Fig. 11). Thus, the low CCN activation fraction during the marine conditions is due to those CCN active particles missing near the surface.
Since the CCN activity depends mainly on the aerosol size and chemical composition (Dusek et al., 2006; McFiggans et al., 2006), dcri estimated from concurrent aerosol NSD and CCN measurements can be considered as a proxy for the variations in the chemical composition of the aerosol system. As the aerosol size distribution and chemical composition are intrinsically associated with each other, any shift in the physical size distribution is mostly associated with the change in the aerosol composition arising mainly due to the change in the sources or due to different processes such as aging, coating, or scavenging, except for externally mixed systems (Crosbie et al., 2015). Quinn et al. (2008) have correlated the dcri with the HOA mass and found that HOA can explain about 40 % of the variance in the dcri. They have reported 70–90 nm and higher values (>90 nm) as the dcri for marine and inland regions, respectively, at 0.44 % SS. For anthropogenic and marine environments, Furutani et al. (2008) have reported dcri values of 70–110 and 50–60 nm, respectively, at 0.6 % SS. The dcri values observed during continental conditions at Solapur are similar to the values observed at a tropical monsoon climate region by Fang et al. (2016) under urban influence. The dcri values during marine-2 are higher than the corresponding values reported from the polluted North China Plain by Deng et al. (2011). From an urban site, Burkart et al. (2011) have reported an average value of ∼169 nm for dcri at 0.5 % SS. Freshly emitted carbonaceous combustion particles can have large dcri values up to ∼350 nm, even at a high SS (0.7 %; Hitzenberger et al., 2003). The dcri can exhibit much lower values than theoretically estimated ones in the presence of partially or fully soluble particles as their slight presence can greatly enhance the CCN activity of insoluble particles such as BC and dust (Dusek et al., 2006; Begue et al., 2015). The sharp distinction in the dcri values and aerosol NSD between different atmospheric/air mass conditions within the same season in the present study indicates the difference in the aerosol composition.
3.6 Relationship between aerosol absorption and CCN properties
The aerosol composition plays an important role associated with the changes in the aerosol NSD due to the meteorological processes and active source and sink mechanisms prevailing during the monsoon conditions. The significant influence of aerosol composition in determining the CCN activity at lower SS which is more probable in the real atmosphere is demonstrated in many studies (Cubison et al., 2008; Kammermann et al., 2010; Bhattu et al., 2015; Jayachandran et al., 2017). In this aspect, the role of carbonaceous aerosols in determining the CCN activation is investigated.
The association of CCN concentration at 0.3 % SS and absorption coefficient at 550 nm, segregated for different periods, is shown in Fig. 12. The association between aerosol absorption and CCN concentration is generally low but moderate during the continental air mass and very weak during the marine air mass. The better association between the CCN concentration and absorption properties may be due to (i) absorbing APs acting as CCN or (ii) aerosol species co-emitted with the absorbing APs activating as CCN. The higher slope and better association observed during continental-1 indicate that the low k, high AF values, and the high association between CCN and CN during the period are due to the major contribution of carbonaceous aerosols towards CCN activation. It can be due to the co-emitted organics enhancing the CCN efficiency of the aerosol system, due to the aged carbonaceous aerosols activating as CCN, or due to the combination of both. The enhancement in the accumulation mode aerosols supports this observation as oxygenated organic aerosols and sulfates are found in the accumulation mode (O'Dowd et al., 1997; Quinn et al., 2008). During marine air mass, there is no clear association between aerosol absorption and CCN and fewer APs are activated as CCN. It indicates that there is a change in the source/sink and nature of CCN during marine/wet and continental/dry conditions.
Carbonaceous aerosols form a major source of CCN concentration and thereby contribute to the indirect effect of aerosols (Novakov and Penner, 1993). Anthropogenic carbonaceous aerosols cause an indirect effect of −0.9 W m−2, while sulfates cause only −0.4 W m−2 (Lohmann et al., 2000). Spracklen et al. (2011) have shown through simulations that about 60 % of the global CCN concentration is from carbonaceous sources. Various processes such as aging, coating, and mixing can enhance the water activity of BC (Lammel and Novakov, 1995; Kuwata et al., 2009), which is hydrophobic when freshly emitted. Mixing with hydrophilic substances like inorganic salts can also enhance the CCN activity of carbonaceous aerosols (Dusek et al., 2006). Thus, the better correlation observed between CCN and aerosol absorption and the associated high CCN efficiency during the continental conditions indicates the significant role of carbonaceous aerosols in CCN activation at Solapur. Jayachandran et al. (2018) illustrated the close association of CCN with aerosol absorption properties (better than the present study) from WG and the lack of association between the parameters at a coastal site during the monsoon conditions. Enhancement in CCN concentration along with an increase in the aerosol absorption coefficient was observed at the central Himalayas (Gogoi et al., 2015). In general, carbonaceous aerosols have a significant role in CCN concentration during continental conditions.
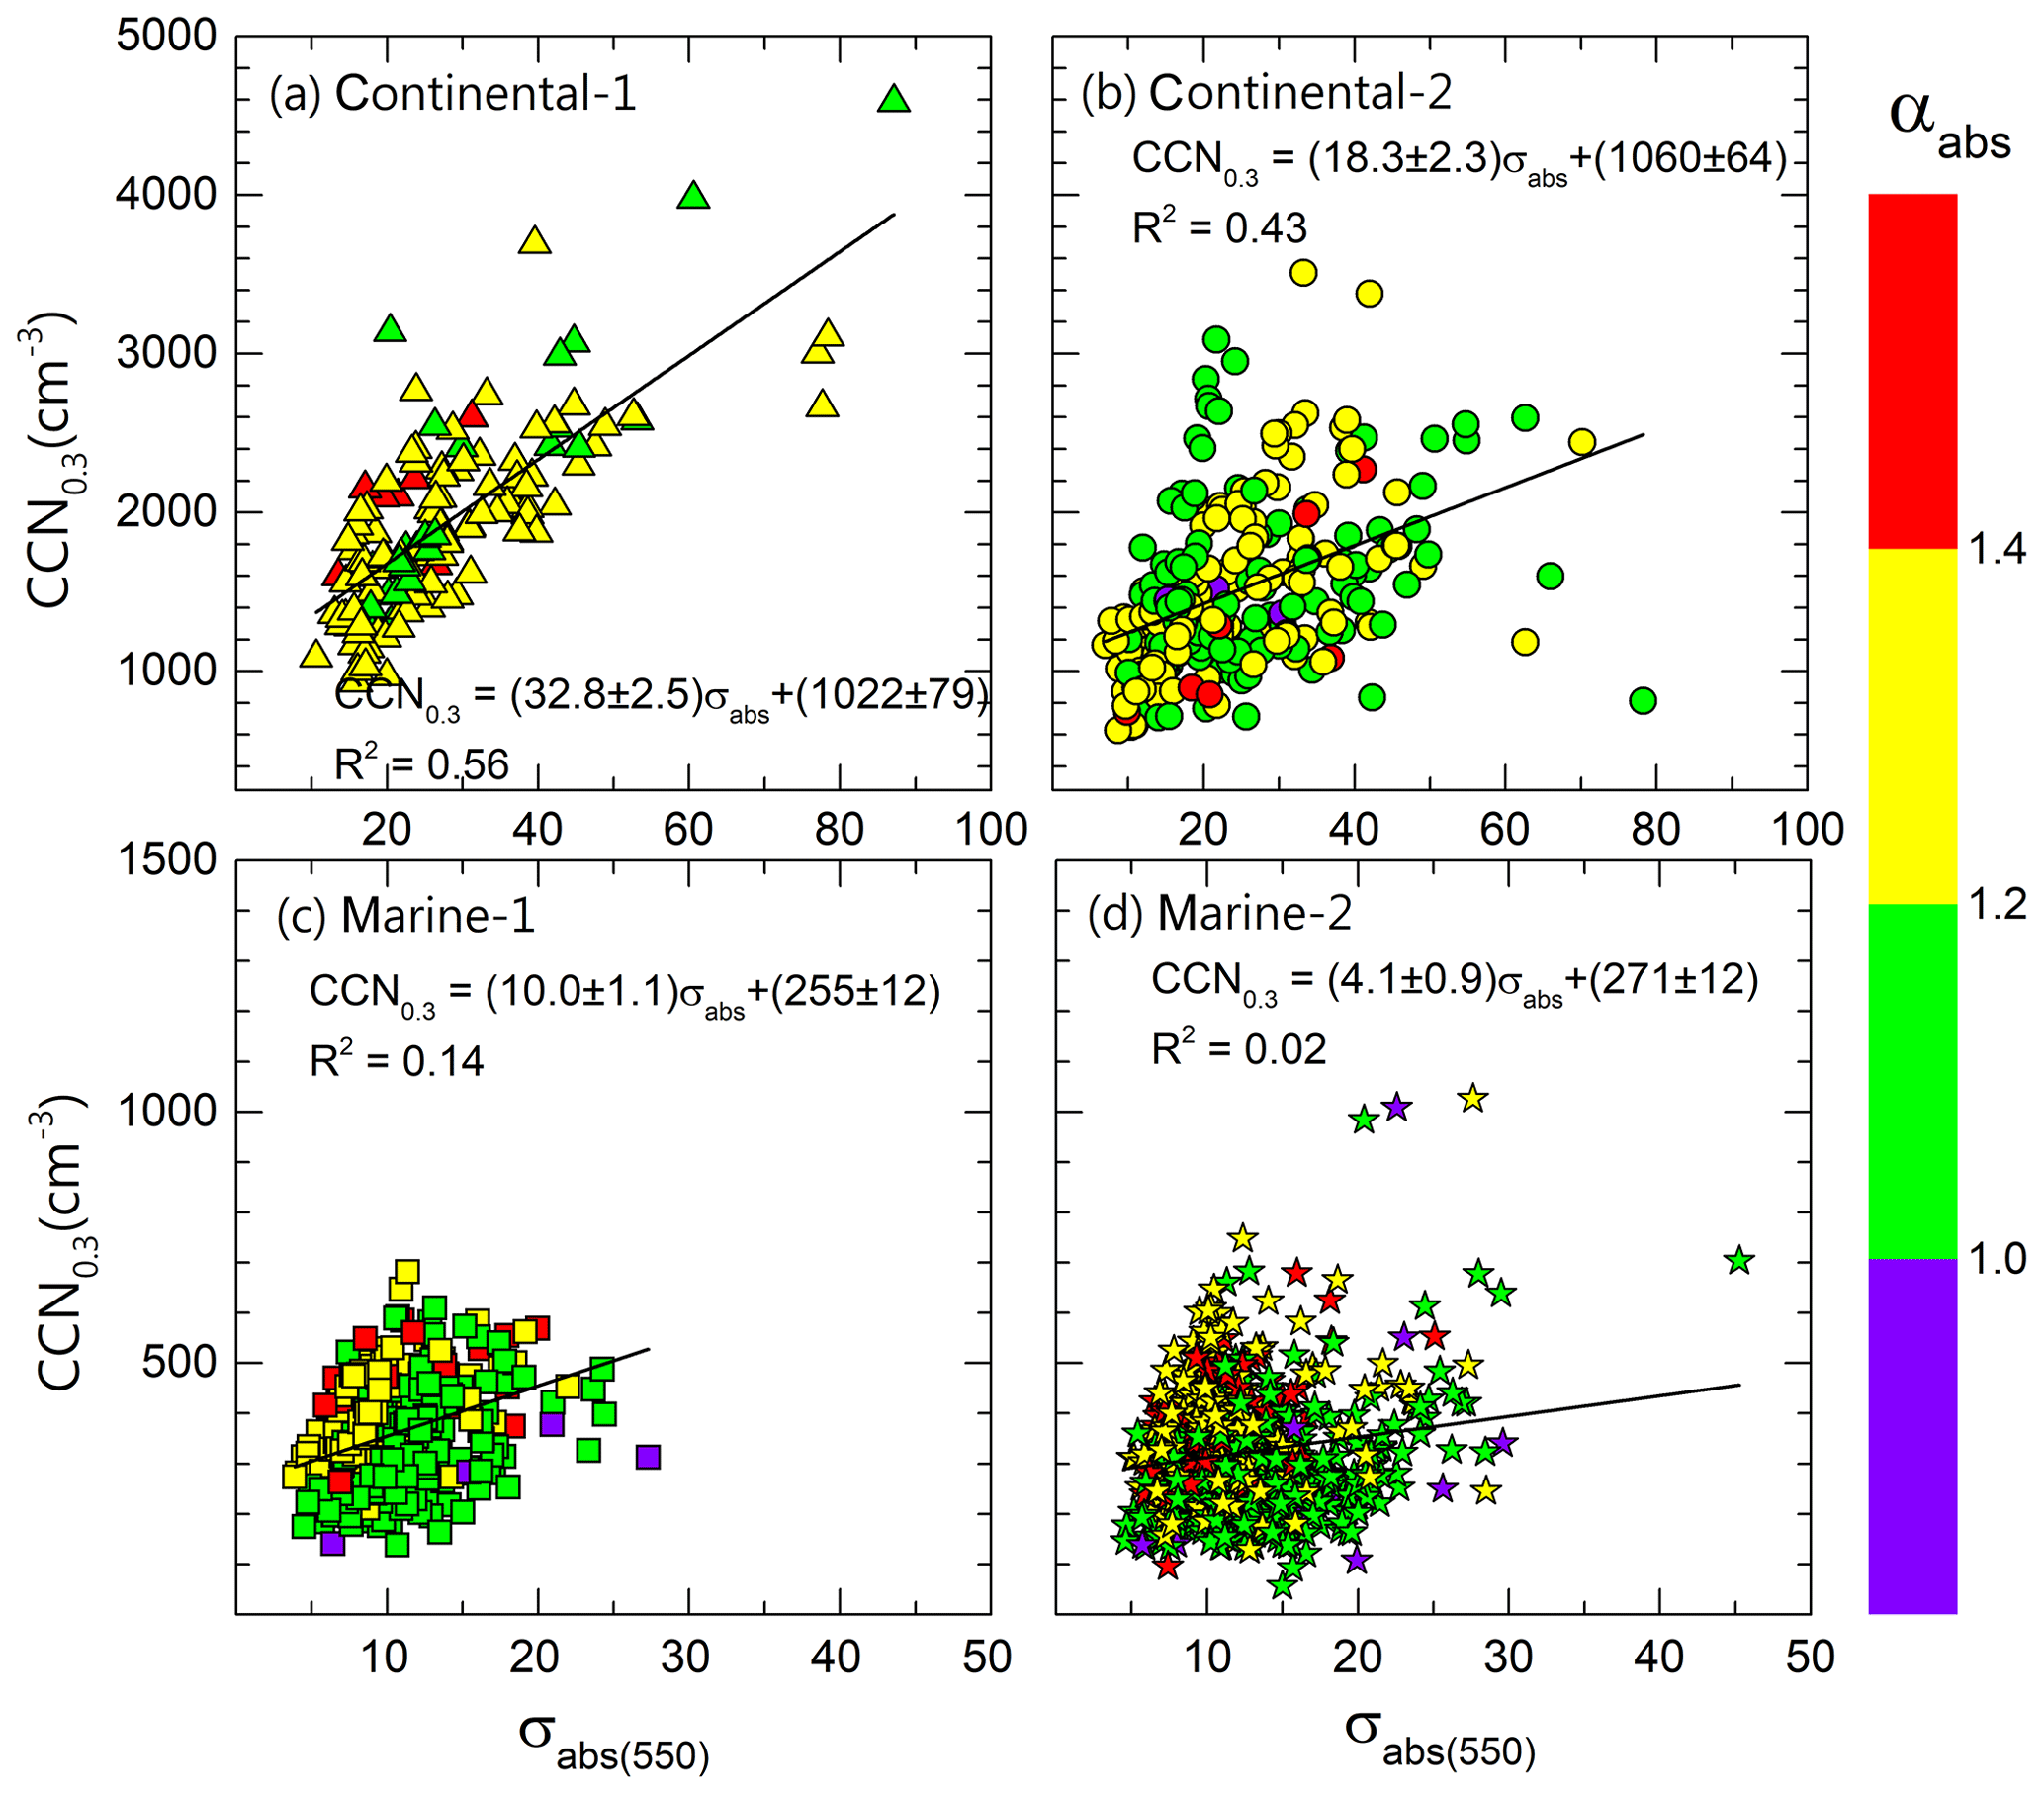
Figure 12Association between CCN (at 0.3 % SS) and absorption coefficient (at 550 nm) for (a) continental-1 (b) continental-2, (c) marine-1, and (d) marine-2 conditions. The color of the scatter indicates the concurrent absorption Ångström exponent values. The least-square linear fit is also shown along with the fit parameters.
As the very low AF is observed along with the enhancement in the nucleation mode particles and depletion of Aitken particles after the onset of ISM over the study region, the chemical characteristics of Aitken, and accumulation mode particles, are investigated. Most of the studies from different parts of the globe have reported about the high hygroscopicity of accumulation mode particles and lower hygroscopicity for the Aitken mode particles (Paramonov et al., 2013, 2015). From the long-term observations from the Amazon, Pöhlker et al. (2016) have concluded that organics predominantly present in the Aitken mode reduce the hygroscopicity, while the dominance of inorganics in the accumulation mode enhances the aerosol hygroscopicity – which was in line with other studies (Gunthe et al., 2009; Pöhlker et al., 2012).
Table 3The linear fit parameters between BC mass and Aitken/accumulation mode particle concentration under different loading and air mass conditions.

The CCN concentration exhibited an association with the absorption coefficient during the continental air mass compared with the marine air mass conditions. The reduced CCN efficiency due to the presence of Aitken or UF mode has already been discussed. To ascertain the contribution of the carbonaceous APs to the NSD, the association of BC with Aitken mode particles and accumulation mode particles are examined under high and low aerosol loading conditions and shown in Fig. 13. Since the BC loading was mostly (>99 % cases) less than 2500 ng m−3 during marine-2, cases above this value are taken as polluted (p, high loading) in the continental air mass. A least-square linear fit is also made and the corresponding parameters are shown in Table 3. Under similar BC loading (low), Aitken mode APs are better associated with BC with a higher slope (m=0.68) during marine-2, while the accumulation mode APs showed a similar correlation with BC during low loading and the lowest slope during marine-2. The Aitken mode APs showed better association with BC during continental-2 under the high BC loading conditions. Except during continental-2, the accumulation mode APs were more associated with BC compared to Aitken mode APs. These all indicate that BC or the co-emitted APs from carbonaceous combustion sources were predominant in Aitken mode during marine-2 and polluted continental-2 conditions. In all other cases, the carbonaceous combustion APs contributed to the accumulation mode.

Figure 13Association of BC mass concentration with Aitken (a, b) and accumulation (c, d) mode particles segregated for different air mass and loading conditions. The least-square linear fit lines are also shown.
The association of BC with the accumulation mode particles and the association of CCN with absorption coefficients during continental-1 along with high CCN AF indicate that the aged, large hygroscopic particles from carbonaceous combustion sources were present prior to the monsoon at the location. The strong convective conditions existing during this period over the region can take the APs to high altitudes where they can absorb radiation and may lead to semidirect effects. The association of BC with accumulation mode APs during continental conditions suggests that the carbonaceous APs existing in this size range can act as CCN. From the eastern coast of India, Kompalli et al. (2020) have reported highly coated larger BC particles (>110 nm) in dry conditions under the continental influence, while nascent BC particles (∼80 nm) with less coating were found during ISM due to wet scavenging. This finding is in line with the current marine-2 observations. The enhanced fine-particle concentration having better association with BC mass concentration during continental-2 underlines the possibility of freshly emitted carbonaceous aerosols reducing the CCN AF. The association of BC mass and accumulation mode aerosol number concentration also points to the possibility of inorganic aerosols like sulfate, co-emitted along with BC from carbonaceous combustion sources, enhancing the CCN activity of APs in continental conditions. Hence, the role of carbonaceous APs in modulating both cloud microphysics and dynamics needs to be investigated in detail. However, the current investigation could not address these probable aspects.
3.7 CCN closure
To understand the role of the size and composition of aerosols in CCN activity, CCN closure studies have been carried out by many investigators (Brokehuizen et al., 2006; Lance et al., 2009; Juranyi et al., 2011; Bhattu and Tripathy, 2015; Crosbie et al., 2015; Jayachandran et al., 2017) at different environments, leading to the better understanding of the CCN activation from APs. CCN concentration at the rain-shadow region under different air mass conditions is estimated and validated with the measured CCN concentrations. The CCN concentrations are estimated by (i) assuming accumulation mode aerosols are activating as CCN, (ii) applying the mean “apparent” critical diameter, and (iii) assuming the aerosol composition as ammonium sulfate ((NH4)2SO4) and comparing with the observations. The scatter between the CCN concentration at 0.3 % SS estimated and the corresponding measured CCN concentrations segregated according to marine and continental conditions are shown in Fig. 14.
CCN are generally approximated as APs above 100 nm (accumulation mode) in many studies when there are no concurrent CCN measurements (e.g., Andreae, 2009). Still, it is a rough approximation due to the nonlinear dependence of CCN activation of APs, and this assumption is examined in Fig. 14a and b. The variations in accumulation mode APs are correlated well (R>0.95) with the CCN concentration in all the conditions. Interestingly, under the same conditions (continental) the accumulation mode APs have different CCN activation efficiency and are underestimated (m=0.64) during continental-1 and overestimated (m=1.26) during continental-2. But during marine-2 the linear fit of the scatter shows that the estimated CCN concentration is almost twice that of the measured concentration when the accumulation mode particles are considered to be CCN active.
Rather than taking an assumed value (100 nm) as the critical activation diameter, the mean of the measured critical diameter (dcri) is used to estimate the CCN concentration and is shown in panels (c) and (d) of Fig. 14. The mean dcri for 0.3% SS of ∼70, ∼165, and ∼120 nm is used for estimating CCN during continental-1, marine-2, and continental-2 conditions, respectively. The estimated and the measured CCN concentration correlate well during the continental conditions with a high correlation coefficient (R=0.97) and almost unit slope. From Fig. 14c, it can be seen that most of the points lie along the diagonal 1:1 line irrespective of the number concentrations and GMD values.
The CCN concentration at 0.3 % SS at different conditions is estimated (Fig. 14e and f) by assuming an inorganic composition of (NH4)2SO4 as an ideal scenario. The methodology used for the estimation is given in the Appendix. In all the conditions, CCN concentrations were overestimated by this approach, indicating that the ambient aerosol system has a lesser hygroscopicity (κ) than that of (NH4)2SO4. The highest overestimation (m=3.38) is observed during marine-2. During continental-1, the maximum correlation coefficient (R=0.98) is obtained, and the slope is also nearer to the unity (m=1.13). However, for the continental-2 conditions, the CCN concentrations are overestimated (almost twice) when (NH4)2SO4 composition is assumed. These observations confirm that the nearly monomodal aerosol NSD observed during continental-1 is more similar to an aged continental aerosol system that has similar hygroscopicity to sulfate aerosols. This observation has to be considered along with the association of BC with accumulation mode aerosols (Fig. 13c). The AP system observed during marine conditions is much less hygroscopic, and the multiple size modes observed in the smaller size range indicate a heterogeneous composition in a complex mixing state during the wet conditions.
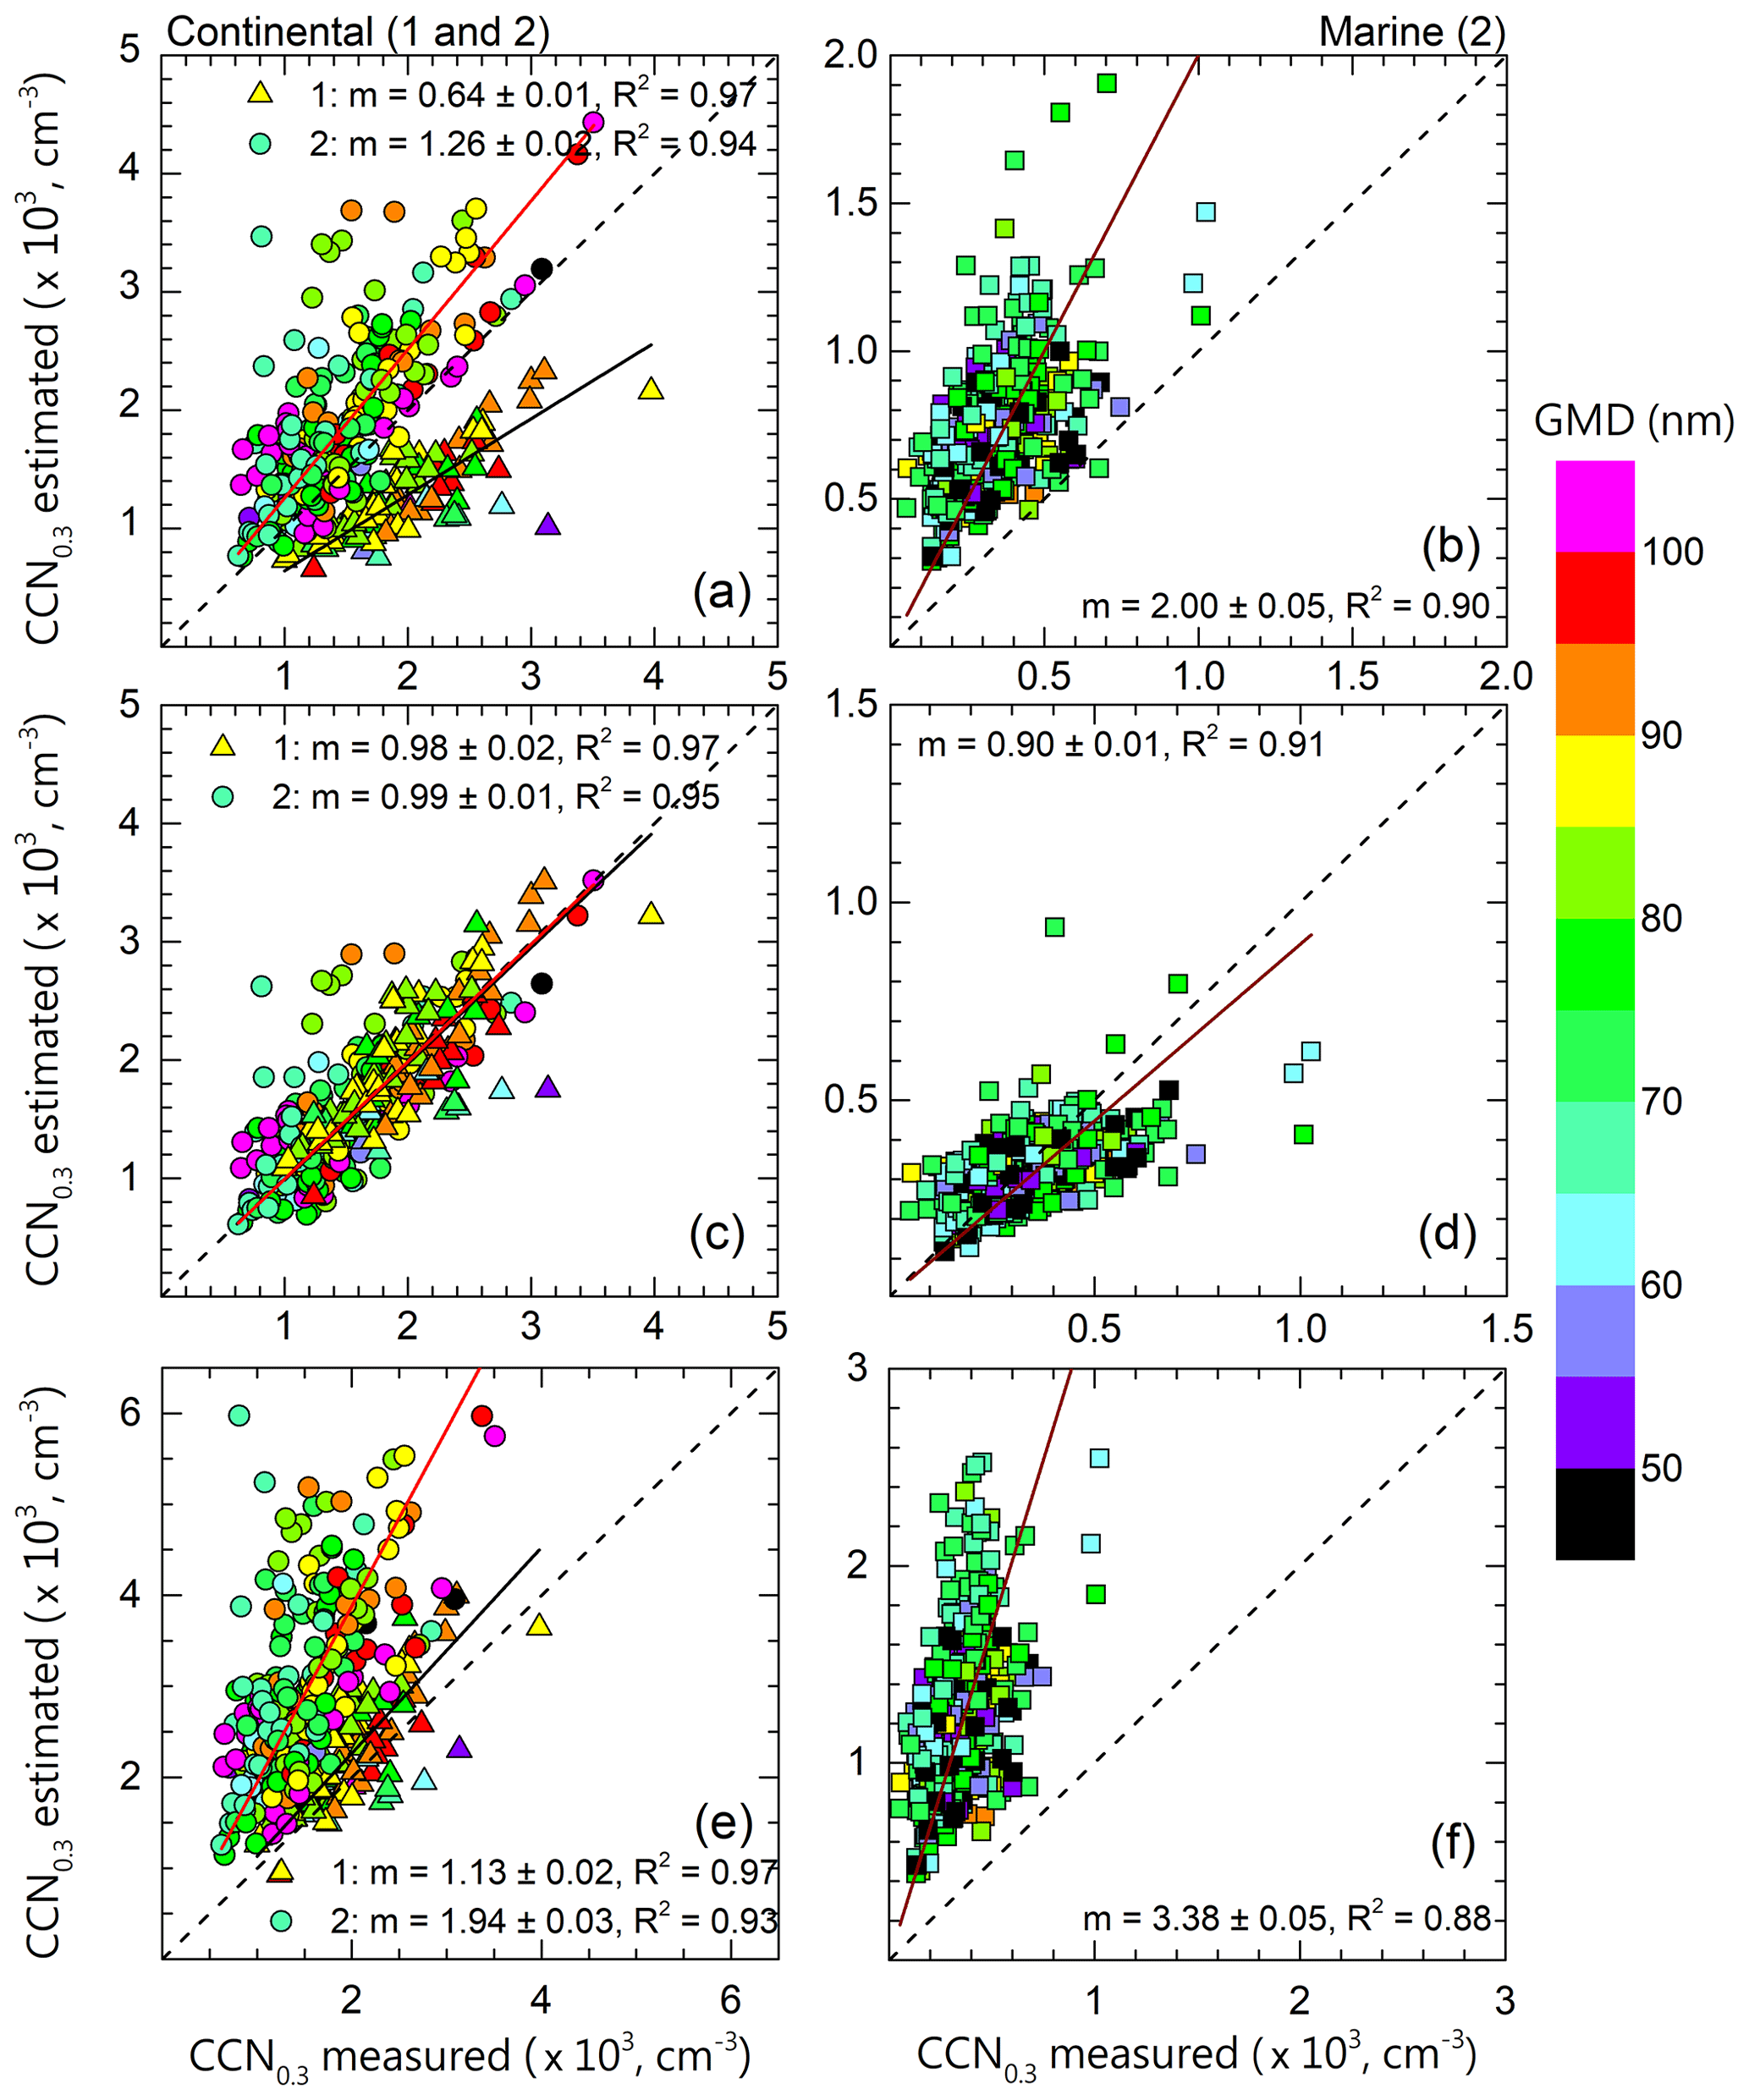
Figure 14Scatter between estimated and measured CCN concentration at 0.3 % SS for continental and marine conditions with the color indicating the GMD. CCN estimated (a, b) as particles above 100 nm, (c, d) from critical activation diameter, and (e, f) using aerosol NSD and ammonium sulfate composition. Linear fit and the parameters are also shown. The broken lines indicate the unit slope (m=1) line.
Comparing the three approaches used to estimate the CCN concentrations, using a sharp size cut for estimating CCN concentrations, suits all the cases well. However, there is a variation in the AP composition in the continental air mass before and after the monsoon rainfall that is reflected in the distinct CCN efficiency of the accumulation mode between these periods. The aged aerosol system prior to the monsoon resembles a sulfate aerosol composition with a very high CCN activation efficiency and low k values. During continental-2, all the accumulation mode APs are not participating in the CCN activation (Fig. 14a), and the assumption of (NH4)2SO4 composition nearly doubles the estimated CCN concentrations. When comparing the aerosol NSD in continental conditions, there is a depletion of Aitken mode particles and an enhancement in nucleation mode particles during continental-2. Similar to the different AF between continental 1 and 2, Pöhlker et al. (2016) have shown high CCN AF in the absence of nucleation mode.
This study is similar to the CCN closure reported by Crosbie et al. (2015) for North American monsoon conditions. The complex meteorological pattern, including the monsoon showers and regional aerosol production (both primary and secondary), causes large variability in the aerosol NSD as seen in Fig. 11. The lower hygroscopicity of the accumulation mode aerosols during the marine air mass is revealed in Fig. 14b. The least closure is obtained while assuming a uniform internal mixture of hygroscopic inorganic composition. These all point to the highly complex mixture of the size-dependent composition of the prevailing aerosol system during monsoon conditions. Studies (Cubison et al., 2008; Ervens et al., 2010) have highlighted the need for size-resolved composition information for estimating the CCN concentration for freshly emitted APs near to the sources. Thus even though the nucleation mode APs present during the period hinder the CCN activity, the presence of bigger particles in the same period is not supporting the CCN activation. It indicates that, apart from the size of the aerosols, the composition/mixing state of the aerosol system during marine-2 also influences the CCN efficiency. From the aerosol optical properties (Fig. 10a), it is seen that the low CCN AF and high k value is associated with the enhancement of the organics at the site. These organics observed after sunrise hours during marine conditions may be limiting the CCN activation of the aerosols. The quantification and classification of these species are essential for addressing the effect of aerosols on clouds in the rain-shadow region, especially during the monsoon.
CCN characteristics at a rain-shadow region during the Indian summer monsoon (ISM) are studied with respect to the different air mass and meteorological conditions that prevailed over the region. It is found that the polluted-continental conditions transform into a polluted marine condition by the onset of the ISM with a significant change in aerosol size distribution and composition affecting the cloud nucleating properties. The important findings are listed below.
-
Comparatively high BC () loading and AOD (>0.5) prevailed over Solapur before and after the marine air mass, which reduced to very low values () during the marine clean-background conditions.
-
The lowest CCN concentrations at any SS ( at 1.2 % SS) are observed at Solapur, compared to the values reported during the ISM over the Indian subcontinent. However, the k values (∼0.6) during ISM are high and similar to those reported over the Western Ghats (WG) and peninsular India under similar conditions.
-
A slight daytime enhancement in CCN is seen due to the influence of anthropogenic activities, while a significant enhancement in k values (2 times) was observed during the daytime of the monsoon period with concurrent high absorption Ångström exponent values.
-
Significant diurnal variations in CN, BC concentrations, and properties like “k”, CCN AF, and αabs during the marine air mass indicate the dominant presence of local aerosol sources, while the weak diurnal variations of the same parameters during the continental air mass indicate the consistent polluted background conditions at Solapur.
-
The aerosol system prior to the onset of ISM that has a monomodal number size distribution (NSD) with a geometrical mean diameter (GMD) of 85±10 nm depicted high CCN activation fraction (AF) of ∼55 % at 0.3 % SS. During the marine air mass, multiple modes were observed in aerosol NSD with a predominant nucleation mode fraction (∼19 %) resulting in the lowest CCN AF of ∼15 %. Just after the monsoon rainfall, aerosols were significantly present both in nucleation (∼15 %) and accumulation mode (∼40 %) and the CCN AF enhanced to ∼32 % only even though the corresponding aerosol GMD was 81±14 nm.
-
The mean critical activation diameters (dcri) estimated for 0.3 % SS from concurrent CCN and aerosol NSD measurements were highest during the marine air mass (∼165 nm) and lowest just prior to (∼70 nm) and in between both after (∼120 nm) the marine conditions.
-
Better association of absorbing-type aerosols with CCN and accumulation mode aerosols during continental air mass conditions indicate the aged, bigger particles from carbonaceous combustion sources possibly enhanced the CCN activity prior to the marine air mass. Aerosol absorption correlated well with Aitken mode particles during and after the marine air mass, which resulted in low CCN activation.
-
The closure study indicates the size dependency of CCN activation, especially during the dry–continental conditions. Most of the CCN-active APs were removed from the atmosphere by activation or wet removal, and the remaining particles were inherently CCN inactive as seen in the aerosol NSD during the marine air mass. However, the CCN activation efficiency of the accumulation mode particles reduced during and after the marine air mass.
The very low aerosol loading (towards an aerosol limited regime) with low CCN efficiency during the ISM rainfall adds the significance of CCN in cloud droplet concentrations. The regional CCN concentration can be estimated from the aerosol size distribution alone, indicating the size dependency of CCN activation during the continental airmass conditions. But the distinct aerosol NSD and CCN properties during the monsoon, due to the change in the aerosol source and sink mechanisms, suggest the dependence of CCN activation on the composition of Aitken mode aerosols and their mixing state. However, the predominance of ultrafine particles in the boundary layer and the corresponding very low CCN efficiency demand further studies using the simultaneous cloud base observations to understand the ACI affecting the precipitation pattern over the rain-shadow region against the backdrop of cold-phase invigoration (Rosenfeld et al., 2008; Gayatri et al., 2017) and condensational heating (Fan et al., 2018) mechanisms of tropical convective clouds.
The saturation ratio is given as follows:
and
where aw is the water activity of the solution droplet and σ is the surface tension of the solution. Mw and ρw are the molecular mass and density of water. R is the universal gas constant and Dp is the size (Seinfeld and Pandis, 1998). The critical diameter for a given aerosol system can be estimated from the Köhler theory based on its size distribution, chemical composition, and hygroscopic growth information. The critical diameter derived from the Köhler equation is as follows (Lance et al., 2009):
where ρs, Ms, and ϵ denote density, molecular mass, and volume fraction of the solute, respectively. ϑ is the effective van 't Hoff factor.
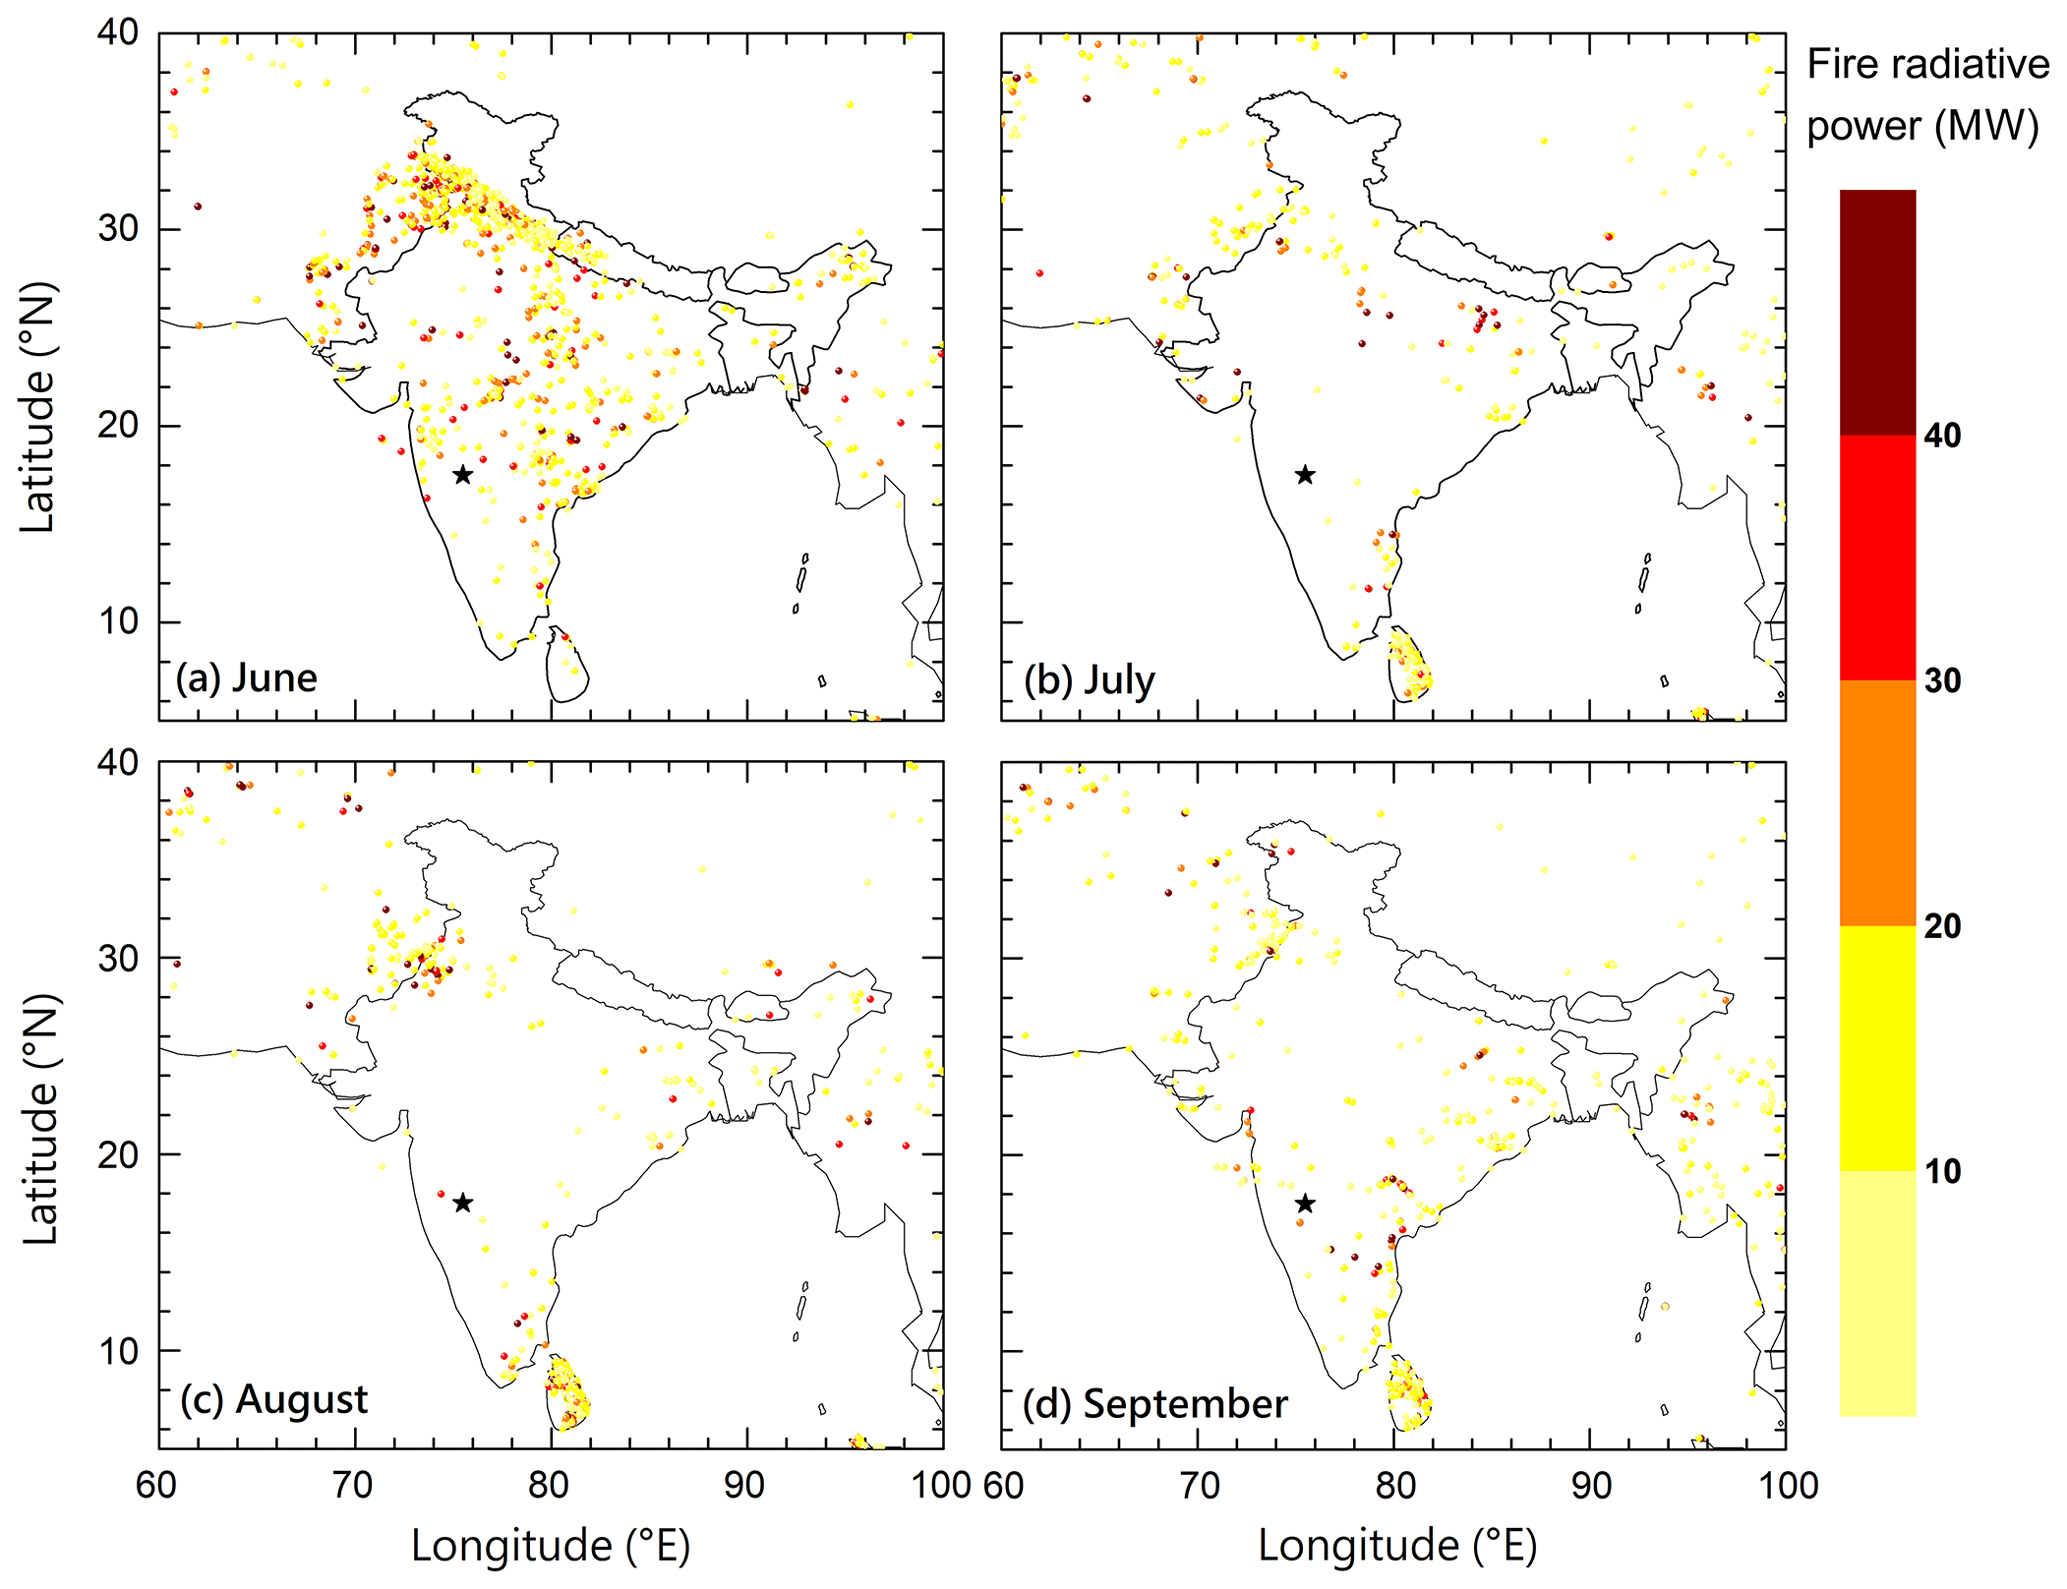
Figure A1Spatial distribution of the Moderate Resolution Imaging Spectroradiometer (MODIS) fire radiative power (Collection 6 product obtained from https://earthdata.nasa.gov/firms, last access: 23 July 2019) for the measurement periods, along with the observation site marked as a black star. Data points having confidence values higher than 30, which come under the classification of “nominal” and “high”, are only used.
Assuming a pure internally mixed aerosol system with uniform composition, CCN concentration can be predicted using the following equation based on the measured aerosol NSD and estimated critical diameter (Juranyi et al., 2011):
In the present study, the aerosol composition is assumed to be of ammonium sulfate as an ideal case (Covert et al., 1998) in order to examine the deviation of CCN activation from the ideal scenario. Hence the insoluble fraction was taken as zero. The density of (NH4)2SO4 is taken as 1.76 g cm−3 (Hinds, 1999).
Data used in the present study can be obtained by making a request through http://www.tropmet.res.in/~caipeex/registrationform.php (last access: 17 June 2020) or contacting Thara V. Prabha (thara@tropmet.res.in).
TVP conceptualized the experiment. TVP and VNJ designed the study. TVP, PM, KST, SPB, GD, NM, JR, MK, SD, MV, and PDS were responsible for conducting the campaign and data collection. VNJ carried out the scientific analysis of the data and drafted the paper. TVP carried out the review and editing of the paper.
The authors declare that they have no conflict of interest.
This article is part of the special issue “Interactions between aerosols and the South West Asian monsoon”. It is not associated with a conference.
The CAIPEEX project is funded by the Ministry of Earth Sciences (MoES), government of India. The authors acknowledge the team effort and dedication of all CAIPEEX team members at the ground observatory. The authors are thankful to the Director and Principal of N.B. Navale Sinhgad College of Engineering for his support. Venugopalan Jayachandran acknowledges AVM (Rtd) K. Suresh Babu for the scientific discussions. We acknowledge NOAA ARL for the providing the Hybrid Single-Particle Lagrangian Integrated Trajectory (HYSPLIT) transport and dispersion model used in this study. We are thankful to the MODIS team for making AOD data freely available. The authors acknowledge the use of data from LANCE/FIRMS operated by NASA's Earth Science Data and Information System (ESDIS) with funding provided by NASA Headquarters (http://earthdata.nasa.gov/firms).
This paper was edited by Armin Sorooshian and reviewed by two anonymous referees.
Albrecht, B. A.: Aerosols, cloud microphysics, and fractional cloudiness, Science, 245, 1227–1230, 1989.
Andreae, M. O.: Correlation between cloud condensation nuclei concentration and aerosol optical thickness in remote and polluted regions, Atmos. Chem. Phys., 9, 543–556, https://doi.org/10.5194/acp-9-543-2009, 2009.
Andreae, M. O. and Rosenfeld, D.: Aerosol–cloud–precipitation interactions. Part 1. The nature and sources of cloud-active aerosols, Earth-Sci. Rev., 89, 13–41, 2008.
Anil Kumar, V., Pandithurai, G., Leena, P. P., Dani, K. K., Murugavel, P., Sonbawne, S. M., Patil, R. D., and Maheskumar, R. S.: Investigation of aerosol indirect effects on monsoon clouds using ground-based measurements over a high-altitude site in Western Ghats, Atmos. Chem. Phys., 16, 8423–8430, https://doi.org/10.5194/acp-16-8423-2016, 2016.
Arnott, W. P., Hamasha, K., Moosmüller, H., Sheridan, P. J., and Ogren, J. A.: Towards aerosol light-absorption measurements with a 7-wavelength aethalometer: Evaluation with a photoacoustic instrument and 3-wavelength nephelometer, Aerosol Sci. Technol., 39, 17–29, 2005.
Asa-Awuku, A., Moore, R. H., Nenes, A., Bahreini, R., Holloway, J. S., Brock, C. A., Middlebrook, A. M., Ryerson, T., Jimenez, J., DeCarlo, P., Hecobian, A., Weber, R., Stickel, R., Tanner, D. J., and Huey, L. G.: Airborne cloud condensation nuclei measurements during the 2006 Texas Air Quality Study, J. Geophys. Res., 116, D11201, https://doi.org/10.1029/2010JD014874, 2011.
Asmi, E., Freney, E., Hervo, M., Picard, D., Rose, C., Colomb, A., and Sellegri, K.: Aerosol cloud activation in summer and winter at puy-de-Dôme high altitude site in France, Atmos. Chem. Phys., 12, 11589–11607, https://doi.org/10.5194/acp-12-11589-2012, 2012.
Babu, S. S. and Moorthy, K. K.: Aerosol black carbon over a tropical coastal station in India, Geophys. Res. Lett., 29, 2098, https://doi.org/10.1029/2002GL015662, 2002.
Babu, S. S., Manoj, M. R., Moorthy, K. K., Gogoi, M. M., Nair, V. S., Kompalli, S. K., Satheesh, S. K., Niranjan, K., Ramagopal, K., Bhuyan, P. K., and Singh, D.: Trends in aerosol optical depth over Indian region: Potential causes and impact indicators, J. Geophys. Res.-Atmos., 118, 11794–11806, https://doi.org/10.1002/2013JD020507, 2013.
Babu, S. S., Kompalli, S. K., and Moorthy, K. K.: Aerosol number size distributions over a coastal semi urban location: seasonal changes and ultrafine particle bursts, Sci. Total Environ., 563, 351–365, 2016.
Bègue, N., Tulet, P., Pelon, J., Aouizerats, B., Berger, A., and Schwarzenboeck, A.: Aerosol processing and CCN formation of an intense Saharan dust plume during the EUCAARI 2008 campaign, Atmos. Chem. Phys., 15, 3497–3516, https://doi.org/10.5194/acp-15-3497-2015, 2015.
Bera, S. and Prabha, T. V.: Parameterization of Entrainment Rate and Mass Flux in Continental Cumulus Clouds: Inference From Large Eddy Simulation, J. Geophys. Res. Atmos., 124, 13127–13139, https://doi.org/10.1029/2018JD031078, 2019.
Bhattu, D. and Tripathi, S. N.: Inter-seasonal variability in size-resolved CCN properties at Kanpur, India, Atmos. Environ., 85, 161–168, 2014.
Bhattu, D. and Tripathi, S. N.: CCN closure study: Effects of aerosol chemical composition and mixing state, J. Geophys. Res.-Atmos., 120, 766–783, 2015.
Birmili, W., Wiedensohler, A., Heintzenberg, J., and Lehmann, K.: Atmospheric particle number size distribution in central Europe: Statistical relations to air masses and meteorology, J. Geophys. Res.-Atmos., 106, 32005–32018, 2001.
Broekhuizen, K., Chang, R. Y.-W., Leaitch, W. R., Li, S.-M., and Abbatt, J. P. D.: Closure between measured and modeled cloud condensation nuclei (CCN) using size-resolved aerosol compositions in downtown Toronto, Atmos. Chem. Phys., 6, 2513–2524, https://doi.org/10.5194/acp-6-2513-2006, 2006.
Burkart, J., Steiner, G., Reischl, G., and Hitzenberger, R.: Longterm study of cloud condensation nuclei (CCN) activation of the atmospheric aerosol in Vienna, Atmos. Environ., 45, 5751–5759, https://doi.org/10.1016/j.atmosenv.2011.07.022, 2011.
Chung, C. E., Kim, S.-W., Lee, M., Yoon, S.-C., and Lee, S.: Carbonaceous aerosol AAE inferred from in-situ aerosol measurements at the Gosan ABC super site, and the implications for brown carbon aerosol, Atmos. Chem. Phys., 12, 6173–6184, https://doi.org/10.5194/acp-12-6173-2012, 2012.
Cohard, J.-M., Pinty, J.-P., and Bedos, C.: Extending Twomey's analytical estimate of nucleated cloud droplet concentrations from CCN spectra, J. Atmos. Sci., 55, 3348–3357, 1998.
Crosbie, E., Youn, J.-S., Balch, B., Wonaschütz, A., Shingler, T., Wang, Z., Conant, W. C., Betterton, E. A., and Sorooshian, A.: On the competition among aerosol number, size and composition in predicting CCN variability: a multi-annual field study in an urbanized desert, Atmos. Chem. Phys., 15, 6943–6958, https://doi.org/10.5194/acp-15-6943-2015, 2015.
Cubison, M. J., Ervens, B., Feingold, G., Docherty, K. S., Ulbrich, I. M., Shields, L., Prather, K., Hering, S., and Jimenez, J. L.: The influence of chemical composition and mixing state of Los Angeles urban aerosol on CCN number and cloud properties, Atmos. Chem. Phys., 8, 5649–5667, https://doi.org/10.5194/acp-8-5649-2008, 2008.
Deng, Z. Z., Zhao, C. S., Ma, N., Liu, P. F., Ran, L., Xu, W. Y., Chen, J., Liang, Z., Liang, S., Huang, M. Y., Ma, X. C., Zhang, Q., Quan, J. N., Yan, P., Henning, S., Mildenberger, K., Sommerhage, E., Schäfer, M., Stratmann, F., and Wiedensohler, A.: Size-resolved and bulk activation properties of aerosols in the North China Plain, Atmos. Chem. Phys., 11, 3835–3846, https://doi.org/10.5194/acp-11-3835-2011, 2011.
Deng, Z. Z., Zhao, C. S., Ma, N., Ran, L., Zhou, G. Q., Lu, D. R., and Zhou, X. J.: An examination of parameterizations for the CCN number concentration based on in situ measurements of aerosol activation properties in the North China Plain, Atmos. Chem. Phys., 13, 6227–6237, https://doi.org/10.5194/acp-13-6227-2013, 2013.
Draxler, R. R. and Rolph, G. D.: HYSPLIT (HYbrid single-particle Lagrangian Integrated Trajectory) model via NOAA ARL READY, NOAA Air Resources Laboratory: Silver Spring, MD, available at: http://www.arl.noaa.gov/ready/hysplit4.html (last access: 2 June 2019), 2014.
Drinovec, L., Močnik, G., Zotter, P., Prévôt, A. S. H., Ruckstuhl, C., Coz, E., Rupakheti, M., Sciare, J., Müller, T., Wiedensohler, A., and Hansen, A. D. A.: The “dual-spot” Aethalometer: an improved measurement of aerosol black carbon with real-time loading compensation, Atmos. Meas. Tech., 8, 1965–1979, https://doi.org/10.5194/amt-8-1965-2015, 2015.
Du, Z., Hu, M., Peng, J., Zhang, W., Zheng, J., Gu, F., Qin, Y., Yang, Y., Li, M., Wu, Y., Shao, M., and Shuai, S.: Comparison of primary aerosol emission and secondary aerosol formation from gasoline direct injection and port fuel injection vehicles, Atmos. Chem. Phys., 18, 9011–9023, https://doi.org/10.5194/acp-18-9011-2018, 2018.
Dumka, U. C., Bhattu, D., Tripathi, S. N., Kaskaoutis, D. G., and Madhavan, B. L.: Seasonal inhomogeneity in cloud precursors over Gangetic Himalayan region during GVAX campaign, Atmos. Res., 155, 158–175, 2015.
Dusek, U., Frank, G. P., Hildebrandt, L., Curtius, J., Schneider, J., Walter, S., Chand, D., Drewnick, F., Hings, S., Jung, D., Borrmann, S., and Andreae, M. O.: Size Matters More Than Chemistry for Cloud-Nucleating Ability of Aerosol Particles, Science, 312, 1375–1378, https://doi.org/10.1126/science.1125261, 2006.
Ervens, B., Feingold, G., and Kreidenweis, S. M.: Influence of water-soluble organic carbon on cloud drop number concentration, J. Geophys. Res.-Atmos., 110, D18211, https://doi.org/10.1029/2004JD005634, 2005.
Ervens, B., Cubison, M. J., Andrews, E., Feingold, G., Ogren, J. A., Jimenez, J. L., Quinn, P. K., Bates, T. S., Wang, J., Zhang, Q., Coe, H., Flynn, M., and Allan, J. D.: CCN predictions using simplified assumptions of organic aerosol composition and mixing state: a synthesis from six different locations, Atmos. Chem. Phys., 10, 4795–4807, https://doi.org/10.5194/acp-10-4795-2010, 2010.
Fan, J., Rosenfeld, D., Zhang, Y., Giangrande, S. E., Li, Z., Machado, L. A., Martin, S. T., Yang, Y., Wang, J., Artaxo, P., and Barbosa, H. M.: Substantial convection and precipitation enhancements by ultrafine aerosol particles, Science, 359, 411–418, 2018.
Fang, S., Han, Y., Chen, K., Lu, C., Yin, Y., Tan, H., Wang, J.: Parameterization and comparative evaluation of the CCN number concentration on Mt. Huang, China, Atmos. Res., 181, 300–311, 2016.
Fountoukis, C. and Nenes, A.: Continued development of a cloud droplet formation parameterization for global climate models, J. Geophys. Res., 110, D11212, https://doi.org/10.1029/2004JD005591, 2005.
Furutani, H., Dall'osto, M., Roberts, G. C., and Prather, K. A.:Assessment of the relative importance of atmospheric aging on CCN activity derived from field observations, Atmos. Environ., 42, 3130–3142, 2008.
Gayatri, K., Patade, S., and Prabha, T. V.: Aerosol–Cloud interaction in deep convective clouds over the Indian Peninsula using spectral (bin) microphysics, J. Atmos. Sci., 74, 3145–3166, 2017.
Gelencser, A., Hoffer, A., Kiss, G., Tombacz, E., Kurdi, R., and Bencze, L.: In-situ formation of light-absorbing organic matter in cloud water, J. Atmos. Chem., 45, 25–33, 2003.
Gogoi, M. M., Babu, S. S., Jayachandran, V., Moorthy, K. K., Satheesh, S. K., Naja, M., and Kotamarthi, V. R.: Optical properties and CCN activity of aerosols in a high-altitude Himalayan environment: Results from RAWEX-GVAX, J. Geophys. Res.-Atmos., 120, 2453–2469, 2015.
Grossman, R. L. and Durran, D. R.: Interaction of low-level flow with the western Ghat Mountains and offshore convection in the summer monsoon, Mon. Weather Rev., 112, 652–672, 1984.
Gunthe, S. S., King, S. M., Rose, D., Chen, Q., Roldin, P., Farmer, D. K., Jimenez, J. L., Artaxo, P., Andreae, M. O., Martin, S. T., and Pöschl, U.: Cloud condensation nuclei in pristine tropical rainforest air of Amazonia: size-resolved measurements and modeling of atmospheric aerosol composition and CCN activity, Atmos. Chem. Phys., 9, 7551–7575, https://doi.org/10.5194/acp-9-7551-2009, 2009.
Gyawali, M., Arnott, W. P., Lewis, K., and Moosmüller, H.: In situ aerosol optics in Reno, NV, USA during and after the summer 2008 California wildfires and the influence of absorbing and non-absorbing organic coatings on spectral light absorption, Atmos. Chem. Phys., 9, 8007–8015, https://doi.org/10.5194/acp-9-8007-2009, 2009.
Hansen, A. D. A., Rosen, H., and Novakov, T.: The aethalometer – an instrument for the real-time measurement of optical absorption by aerosol particles, Sci. Total Env. 36, 191–196, 1984.
Hegg, D. A., Ferek, R. J., Hobbs, P. V., and Radke, L. F.:. Dimethyl sulfide and cloud condensation nucleus correlations in the northeast Pacific Ocean, J. Geophys. Res.-Atmos., 96, 13189–13191. 1991.
Hitzenberger, R., Giebl, H., Petzold, A., Gysel, M., Nyeki, S., Weingartner, E., Baltensperger, U., and Wilson, C. W.: Properties of jet engine combustion particles during the PartEmis experiment. Hygroscopic growth at supersaturated conditions, Geophys. Res. Lett., 30, 1779, https://doi.org/10.1029/2003GL017294, 2003.
Hoppel, W. A., Dinger, J. E., and Ruskin, R. E.: Vertical profiles of CCN at various geographical locations, J. Atmos. Sci., 30, 1410–1420, 1973.
Hudson, J. G. and Xie, Y.: Vertical distributions of cloud condensation nuclei spectra over the summertime northeast Pacific and Atlantic Oceans, J. Geophys. Res.-Atmos., 104, 30219–30229, 1999.
IPCC: Climate Change 2013: The Physical Science Basis, in: Contribution of Working Group I to the Fifth Assessment Report of the Intergovernmental Panel on Climate Change, Cambridge University Press, Cambridge, UK and New York, NY, USA, 2013.
Jayachandran, V., Nair, V. S., and Babu, S. S.: CCN characteristics over a tropical coastal station during south-west monsoon: observations and closure studies, Atmos. Environ., 164, 299–308, 2017.
Jayachandran, V., Nair, V. S., and Babu, S. S.: CCN activation properties at a tropical hill station in Western Ghats during south-west summer monsoon: Vertical heterogeneity, Atmos. Res., 214, 36–45, 2018.
Jayachandran, V. N., Suresh Babu, S. N., Vaishya, A., Gogoi, M. M., Nair, V. S., Satheesh, S. K., and Krishna Moorthy, K.: Altitude profiles of cloud condensation nuclei characteristics across the Indo-Gangetic Plain prior to the onset of the Indian summer monsoon, Atmos. Chem. Phys., 20, 561–576, https://doi.org/10.5194/acp-20-561-2020, 2020.
Jefferson, A.: Empirical estimates of CCN from aerosol optical properties at four remote sites, Atmos. Chem. Phys., 10, 6855–6861, https://doi.org/10.5194/acp-10-6855-2010, 2010.
Jurányi, Z., Gysel, M., Weingartner, E., Bukowiecki, N., Kammermann, L. and Baltensperger, U.: A 17 month climatology of the cloud condensation nuclei number concentration at the high alpine site Jungfraujoch, J. Geophys. Res.-Atmos., 116, D10204, https://doi.org/10.1029/2010JD015199, 2011.
Kalivitis, N., Kerminen, V.-M., Kouvarakis, G., Stavroulas, I., Bougiatioti, A., Nenes, A., Manninen, H. E., Petäjä, T., Kulmala, M., and Mihalopoulos, N.: Atmospheric new particle formation as a source of CCN in the eastern Mediterranean marine boundary layer, Atmos. Chem. Phys., 15, 9203–9215, https://doi.org/10.5194/acp-15-9203-2015, 2015.
Kammermann, L., Gysel, M., Weingartner, E., Herich, H., Cziczo, D. J., Holst, T., Svenningsson, B., Arneth, A., and Baltensperger, U.: Subarctic atmospheric aerosol composition: 3. Measured and modeled properties of cloud condensation nuclei, J. Geophys. Res.-Atmos., 115, D04202, https://doi.org/10.1029/2009JD012447, 2010.
Kanawade, V. P., Shika, S., Pöhlker, C., Rose, D., Suman, M. N. S., Gadhavi, H., Kumar, A., Nagendra, S. S., Ravikrishna, R., Yu, H., and Sahu, L. K.: Infrequent occurrence of new particle formation at a semi-rural location, Gadanki, in tropical Southern India, Atmos. Environ., 94, 264–273, 2014.
Khvorostyanov, V. I. and Curry, J. A.: Aerosol size spectra and CCN activity spectra: Reconciling the lognormal, algebraic, and power laws, J. Geophys. Res., 111, D12202, https://doi.org/10.1029/2005JD006532, 2006
Kim, S., Shen, S., Sioutas, C., Zhu, Y., and Hinds, W. C.: Size distribution and diurnal and seasonal trends of ultrafine particles in source and receptor sites of the Los Angeles basin, J. Air Waste Manag. Assoc., 52, 297–307, 2002.
Kirchstetter, T. W., Novakov, T., and Hobbs, P. V.: Evidence that the spectral dependence of light absorption by aerosols is affected by organic carbon, J. Geophys. Res.-Atmos., 109, 208, https://doi.org/10.1029/2004JD004999, 2004.
Köhler, H.: The nucleus in and the growth of hygroscopic droplets, Trans. Faraday Soc., 32, 1152–1161, 1936.
Kompalli, S. K., Babu, S. S., Moorthy, K. K., Manoj, M. R., Kumar, N. K., Shaeb, K. H. B., and Joshi, A. K.: Aerosol black carbon characteristics over Central India: Temporal variation and its dependence on mixed layer height, Atmos. Res., 147, 27–37, 2014.
Kompalli, S. K., Suresh Babu, S. N., Satheesh, S. K., Krishna Moorthy, K., Das, T., Boopathy, R., Liu, D., Darbyshire, E., Allan, J. D., Brooks, J., Flynn, M. J., and Coe, H.: Seasonal contrast in size distributions and mixing state of black carbon and its association with PM1.0 chemical composition from the eastern coast of India, Atmos. Chem. Phys., 20, 3965–3985, https://doi.org/10.5194/acp-20-3965-2020, 2020.
Komppula, M., Lihavainen, H., Hyvärinen, A. P., Kerminen, V. M., Panwar, T. S., Sharma, V. P., and Viisanen, Y.: Physical properties of aerosol particles at a Himalayan background site in India, J. Geophys. Res.-Atmos., 114, D12202, https://doi.org/10.1029/2008JD011007, 2009.
Konwar, M., Maheskumar, R. S., Kulkarni, J. R., Freud, E., Goswami, B. N., and Rosenfeld, D.: Aerosol control on depth of warm rain in convective clouds, J. Geophys. Res.-Atmos., 117, D13204, https://doi.org/10.1029/2012JD017585, 2012.
Kulkarni, J. R., Maheskumar, R. S., Morwal, S. B., Padmakumari, B., Konwar, M., Deshpande, C. G., Joshi, R. R., Bhalwankar, R. V., Pandithurai, G., Safai, P. D., and Narkhedkar, S. G.: The cloud aerosol interactions and precipitation enhancement experiment (CAIPEEX): overview and preliminary results, Curr. Sci., 102, 413–425, 2012.
Kumar, R., Barth, M. C., Pfister, G. G., Nair, V. S., Ghude, S. D., and Ojha, N.: What controls the seasonal cycle of black carbon aerosols in India?, J. Geophys. Res.-Atmos., 120, 7788–7812, https://doi.org/10.1002/2015JD023298, 2015.
Kuwata, M., Kondo, Y., and Takegawa, N.: Critical condensed mass for activation of black carbon as cloud condensation nuclei in Tokyo, J. Geophys. Res.-Atmos., 114, D20202, https://doi.org/10.1029/2009JD012086, 2009.
Laaksonen, A., Korhonen, P., Kulmala, M., and Charlson, R. J.: Modification of the Köhler equation to include soluble trace gases and slightly soluble substances, J. Atmos. Sci., 55, 853–862, 1998.
Lammel, G. and Novakov, T.: Water nucleation properties of carbon black and diesel soot particles, Atmos. Environ., 29, 813–823, 1995.
Lance, S., Medina, J., Smith, J. N., and Nenes, A.: Mapping the Operation of the DMT Continuous Flow CCN Counter, Aeros. Sci. Tech., 40, 242–254, https://doi.org/10.1080/02786820500543290, 2006.
Lance, S., Nenes, A., Mazzoleni, C., Dubey, M. K., Gates, H., Varutbangkul, V., Rissman, T. A., Murphy, S. M., Sorooshian, A., Flagan, R. C., and Seinfeld, J. H.: Cloud condensation nuclei activity, closure, and droplet growth kinetics of Houston aerosol during the Gulf of Mexico Atmospheric Composition and Climate Study (GoMACCS), J. Geophys. Res.-Atmos., 114, D00F15, https://doi.org/10.1029/2008JD011699, 2009.
Lathem, T. L. and Nenes, A.: Water vapor depletion in the DMT continuous-flow CCN chamber: Effects on supersaturation and droplet growth, Aerosol Sci. Technol., 45, 604–615, 2011.
Leena, P. P., Pandithurai, G., Anilkumar, V., Murugavel, P., Sonbawne, S. M., and Dani, K. K.: Seasonal variability in aerosol, CCN and their relationship observed at a high altitude site in Western Ghats, Meteorol. Atmos. Phys., 128, 143–153, 2016.
Lelieveld, J., Klingmüller, K., Pozzer, A., Burnett, R. T., Haines, A., and Ramanathan, V.: Effects of fossil fuel and total anthropogenic emission removal on public health and climate, P. Natl. Acad. Sci. USA, 116, 7192–7197, https://doi.org/10.1073/pnas.1819989116, 2019.
Liu, D., Allan, J., Whitehead, J., Young, D., Flynn, M., Coe, H., McFiggans, G., Fleming, Z. L., and Bandy, B.: Ambient black carbon particle hygroscopic properties controlled by mixing state and composition, Atmos. Chem. Phys., 13, 2015–2029, https://doi.org/10.5194/acp-13-2015-2013, 2013.
Lohmann, U. and Feichter, J.: Global indirect aerosol effects: a review, Atmos. Chem. Phys., 5, 715–737, https://doi.org/10.5194/acp-5-715-2005, 2005.
Lohmann, U., Feichter, J., Penner, J. E., and Leaitch, W. R.: Indirect effect of sulfate and carbonaceous aerosols: A mechanistic treatment, J. Geophys. Res., 105, 12193–12206, 2000.
Maheskumar, R. S., Narkhedkar, S. G., Morwal, S. B., Padmakumari, B., Kothawale, D. R., Joshi, R. R., Deshpande, C. G., Bhalwankar, R. V., and Kulkarni, J. R.: Mechanism of high rainfall over the Indian west coast region during the monsoon season, Clim. Dynam., 43, 1513–1529, 2014.
Manoj, M. R., Satheesh, S. K., Moorthy, K. K., Gogoi, M. M., and Babu, S. S.: Decreasing Trend in Black Carbon Aerosols Over the Indian Region, Geophys. Res. Lett., 46, 2903–2910, 2019.
McFiggans, G., Artaxo, P., Baltensperger, U., Coe, H., Facchini, M. C., Feingold, G., Fuzzi, S., Gysel, M., Laaksonen, A., Lohmann, U., Mentel, T. F., Murphy, D. M., O'Dowd, C. D., Snider, J. R., and Weingartner, E.: The effect of physical and chemical aerosol properties on warm cloud droplet activation, Atmos. Chem. Phys., 6, 2593–2649, https://doi.org/10.5194/acp-6-2593-2006, 2006.
Mikhailov, E., Vlasenko, S., Martin, S. T., Koop, T., and Pöschl, U.: Amorphous and crystalline aerosol particles interacting with water vapor: conceptual framework and experimental evidence for restructuring, phase transitions and kinetic limitations, Atmos. Chem. Phys., 9, 9491–9522, https://doi.org/10.5194/acp-9-9491-2009, 2009.
Mircea, M., Facchini, M. C., Decesari, S., Fuzzi, S., and Charlson, R. J.: The influence of the organic aerosol component on CCN supersaturation spectra for different aerosol types, Tellus B, 54, 74–81, 2002.
Morawska, L., Jayaratne, E. R., Mengersen, K., Jamriska, M., and Thomas, S.: Differences in airborne particle and gaseous concentrations in urban air between weekdays and weekends, Atmos. Environ., 36, 4375–4383, 2002.
Moore, R. H., Karydis, V. A., Capps, S. L., Lathem, T. L., and Nenes, A.: Droplet number uncertainties associated with CCN: an assessment using observations and a global model adjoint, Atmos. Chem. Phys., 13, 4235–4251, https://doi.org/10.5194/acp-13-4235-2013, 2013.
Moorthy, K. K., Babu, S. S., Manoj, M. R., and Satheesh, S. K.: Buildup of aerosols over the Indian Region, Geophys. Res. Lett., 40, 1011–1014, https://doi.org/10.1002/grl.50165, 2013.
Myhre, G., Samset, B. H., Schulz, M., Balkanski, Y., Bauer, S., Berntsen, T. K., Bian, H., Bellouin, N., Chin, M., Diehl, T., Easter, R. C., Feichter, J., Ghan, S. J., Hauglustaine, D., Iversen, T., Kinne, S., Kirkevåg, A., Lamarque, J.-F., Lin, G., Liu, X., Lund, M. T., Luo, G., Ma, X., van Noije, T., Penner, J. E., Rasch, P. J., Ruiz, A., Seland, Ø., Skeie, R. B., Stier, P., Takemura, T., Tsigaridis, K., Wang, P., Wang, Z., Xu, L., Yu, H., Yu, F., Yoon, J.-H., Zhang, K., Zhang, H., and Zhou, C.: Radiative forcing of the direct aerosol effect from AeroCom Phase II simulations, Atmos. Chem. Phys., 13, 1853–1877, https://doi.org/10.5194/acp-13-1853-2013, 2013.
Nair, V. S., Moorthy, K. K., Alappattu, D. P., Kunhikrishnan, P. K., George, S., Nair, P. R., Babu, S. S., Abish, B., Satheesh, S. K., Tripathi, S. N., and Niranjan, K.: Wintertime aerosol characteristics over the Indo-Gangetic Plain (IGP): Impacts of local boundary layer processes and long-range transport, J. Geophys. Res.-Atmos., 112, D13205, https://doi.org/10.1029/2006jd008099, 2007.
Nair, V. S., Jayachandran, V. N., Kompalli, S. K., Gogoi, M. M., and Babu, S. S.: Cloud condensation nuclei properties of South Asian outflow over the northern Indian Ocean during winter, Atmos. Chem. Phys., 20, 3135–3149, https://doi.org/10.5194/acp-20-3135-2020, 2020.
Nenes, A., Charlson, R. J., Facchini, M. C., Kulmala, M., Laaksonen, A., and Seinfeld, J. H.: Can chemical effects on cloud droplet number rival the first indirect effect?, Geophys. Res. Lett., 29, 1848, https://doi.org/10.1029/2002GL015295, 2002.
Noble, S. R. and Hudson, J. G.: Effects of Continental Clouds on Surface Aitken and Accumulation Modes, J. Geophys. Res.-Atmos., 124, 5479–5502, https://doi.org/10.1029/2019JD030297, 2019.
Novakov, T. and Penner, J. E.: Large contribution of organic aerosols to cloud-condensation-nuclei concentrations, Nature, 365, 823–826, 1993.
O'Dowd, C. D., Smith, M. H., Consterdine, I. E., and Lowe, J. A.: Marine aerosol, sea-salt, and the marine sulphur cycle: A short review, Atmos. Environ., 31, 73–80, 1997.
Padmakumari, B., Maheskumar, R. S., Harikishan, G., Morwal, S. B., Prabha, T. V., and Kulkarni, J. R.: In situ measurements of aerosol vertical and spatial distributions over continental India during the major drought year 2009, Atmos. Environ., 80, 107–121, 2013.
Padmakumari, B., Maheskumar, R. S., Harikishan, G., Morwal, S. B., and Kulkarni, J. R.: Rain-shadow: An area harboring “Gray Ocean” clouds, Atmos. Res., 205, 70–79, 2018.
Pandithurai, G., Dipu, S., Prabha, T. V., Maheskumar, R. S., Kulkarni, J. R., and Goswami, B. N.: Aerosol effect on droplet spectral dispersion in warm continental cumuli, J. Geophys. Res.-Atmos., 117, D16202, https://doi.org/10.1029/2011JD016532, 2012.
Paramonov, M., Aalto, P. P., Asmi, A., Prisle, N., Kerminen, V.-M., Kulmala, M., and Petäjä, T.: The analysis of size-segregated cloud condensation nuclei counter (CCNC) data and its implications for cloud droplet activation, Atmos. Chem. Phys., 13, 10285–10301, https://doi.org/10.5194/acp-13-10285-2013, 2013.
Paramonov, M., Kerminen, V.-M., Gysel, M., Aalto, P. P., Andreae, M. O., Asmi, E., Baltensperger, U., Bougiatioti, A., Brus, D., Frank, G. P., Good, N., Gunthe, S. S., Hao, L., Irwin, M., Jaatinen, A., Jurányi, Z., King, S. M., Kortelainen, A., Kristensson, A., Lihavainen, H., Kulmala, M., Lohmann, U., Martin, S. T., McFiggans, G., Mihalopoulos, N., Nenes, A., O'Dowd, C. D., Ovadnevaite, J., Petäjä, T., Pöschl, U., Roberts, G. C., Rose, D., Svenningsson, B., Swietlicki, E., Weingartner, E., Whitehead, J., Wiedensohler, A., Wittbom, C., and Sierau, B.: A synthesis of cloud condensation nuclei counter (CCNC) measurements within the EUCAARI network, Atmos. Chem. Phys., 15, 12211–12229, https://doi.org/10.5194/acp-15-12211-2015, 2015.
Parthasarathy, B. and Yang, S.: Relationships between regional Indian summer monsoon rainfall and Eurasian snow cover, Adv. Atmos. Sci., 12, 143–150, 1995.
Patade, S., Kulkarni, G., Patade, S., Deshmukh, A., Dangat, P., Axisa, D., Fan, J., Pradeepkumar, P., and Prabha, T. V.:. Role of liquid phase in the development of ice phase in monsoon clouds: Aircraft observations and numerical simulations, Atmos. Res., 229, 157–174, 2019.
Patidar, V., Tripathi, S. N., Bharti, P. K., and Gupta, T.: First surface measurement of cloud condensation nuclei over Kanpur, IGP: role of long range transport, Aerosol Sci. Technol., 46, 973–982, 2012.
Pöhlker, C., Wiedemann, K. T., Sinha, B., Shiraiwa, M., Gunthe, S. S., Smith, M., Su, H., Artaxo, P., Chen, Q., Cheng, Y., and Elbert, W.: Biogenic potassium salt particles as seeds for secondary organic aerosol in the Amazon, Science, 337, 1075–1078, 2012.
Pöhlker, M. L., Pöhlker, C., Ditas, F., Klimach, T., Hrabe de Angelis, I., Araújo, A., Brito, J., Carbone, S., Cheng, Y., Chi, X., Ditz, R., Gunthe, S. S., Kesselmeier, J., Könemann, T., Lavrič, J. V., Martin, S. T., Mikhailov, E., Moran-Zuloaga, D., Rose, D., Saturno, J., Su, H., Thalman, R., Walter, D., Wang, J., Wolff, S., Barbosa, H. M. J., Artaxo, P., Andreae, M. O., and Pöschl, U.: Long-term observations of cloud condensation nuclei in the Amazon rain forest – Part 1: Aerosol size distribution, hygroscopicity, and new model parametrizations for CCN prediction, Atmos. Chem. Phys., 16, 15709–15740, https://doi.org/10.5194/acp-16-15709-2016, 2016.
Pöhlker, M. L., Ditas, F., Saturno, J., Klimach, T., Hrabě de Angelis, I., Araùjo, A. C., Brito, J., Carbone, S., Cheng, Y., Chi, X., Ditz, R., Gunthe, S. S., Holanda, B. A., Kandler, K., Kesselmeier, J., Könemann, T., Krüger, O. O., Lavrič, J. V., Martin, S. T., Mikhailov, E., Moran-Zuloaga, D., Rizzo, L. V., Rose, D., Su, H., Thalman, R., Walter, D., Wang, J., Wolff, S., Barbosa, H. M. J., Artaxo, P., Andreae, M. O., Pöschl, U., and Pöhlker, C.: Long-term observations of cloud condensation nuclei over the Amazon rain forest – Part 2: Variability and characteristics of biomass burning, long-range transport, and pristine rain forest aerosols, Atmos. Chem. Phys., 18, 10289–10331, https://doi.org/10.5194/acp-18-10289-2018, 2018.
Prabha, T. V., Khain, A., Maheshkumar, R. S., Pandithurai, G., Kulkarni, J. R., Konwar, M., and Goswami, B. N.:. Microphysics of premonsoon and monsoon clouds as seen from in situ measurements during the Cloud Aerosol Interaction and Precipitation Enhancement Experiment (CAIPEEX), J. Atmos. Sci., 68, 1882–1901, 2011.
Prabha, T. V., Patade, S., Pandithurai, G., Khain, A., Axisa, D., Pradeep-Kumar, P., Maheshkumar, R. S., Kulkarni, J. R., and Goswami, B. N.: Spectral width of premonsoon and monsoon clouds over Indo-Gangetic valley, J. Geophys. Res.-Atmos., 117, D20205, https://doi.org/10.1029/2011JD016837, 2012.
Prakash, J. W. J., Ramachandran, R., Nair, K. N., Gupta, K. S., and Kunhikrishnan, P. K.: On the structure of sea-breeze fronts observed near the coastline of Thumba, India, Bound.-Layer Meteorol., 59, 111–124, 1992.
Quinn, P. K., Bates, T. S., Coffman, D. J., and Covert, D. S.: Influence of particle size and chemistry on the cloud nucleating properties of aerosols, Atmos. Chem. Phys., 8, 1029–1042, https://doi.org/10.5194/acp-8-1029-2008, 2008.
Ramanathan, V., Crutzen, P. J., Lelieveld, J., Mitra, A. P., Althausen, D., Anderson, J., Andreae, M. O., Cantrell, W., Cass, G. R., Chung, C. E., and Clarke, A. D.: Indian Ocean Experiment: An integrated analysis of the climate forcing and effects of the great Indo-Asian haze, J. Geophys. Res.-Atmos., 106, 28371–28398, 2001.
Raymond, T. M. and Pandis, S. N.: Formation of cloud droplets by multicomponent organic particles, J. Geophys. Res., 108, 4469–4476, 2003.
Roberts, G. C. and Nenes, A.: A continuous-flow streamwise thermal-gradient CCN chamber for atmospheric measurements, Aerosol Sci. Technol., 39, 206–221, 2005.
Rose, D., Gunthe, S. S., Mikhailov, E., Frank, G. P., Dusek, U., Andreae, M. O., and Pöschl, U.: Calibration and measurement uncertainties of a continuous-flow cloud condensation nuclei counter (DMT-CCNC): CCN activation of ammonium sulfate and sodium chloride aerosol particles in theory and experiment, Atmos. Chem. Phys., 8, 1153–1179, https://doi.org/10.5194/acp-8-1153-2008, 2008.
Rosenfeld, D., Lohmann, U., Raga, G. B., O'Dowd, C. D., Kulmala, M., Fuzzi, S., Reissell, A., and Andreae, M. O.: Flood or drought: how do aerosols affect precipitation?, Science, 321, 1309–1313, 2008.
Roy, A., Chatterjee, A., Sarkar, C., Das, S. K., Ghosh, S. K., and Raha, S.: A study on aerosol-cloud condensation nuclei (CCN) activation over eastern Himalaya in India, Atmos. Res., 189, 69–81, 2017.
Safai, P., Kewat, S., Praveen, P., Rao, P., Momin, G., Ali, K., and Devara, P.: Seasonal variation of black carbon aerosols over a tropical urbanbcity of Pune, India, Atmos. Environ., 41, 2699–2709, https://doi.org/10.1016/j.atmosenv.2006.11.044, 2007.
Safai, P. D., Raju, M. P., Budhavant, K. B., Rao, P. S. P., and Devara, P. C. S.: Long term studies on characteristics of black carbon aerosols over a tropical urban station Pune, India, Atmos. Res., 132, 173–184, 2013.
Sandeep, A., Narayana Rao, T., Ramkiran, C. N., and Rao, S. V. B.: Differences in atmospheric boundary-layer characteristics between wet and dry episodes of the Indian summer monsoon, Bound.-Layer Meteorol., 153, 217–236, 2014.
Schmale, J., Henning, S., Decesari, S., Henzing, B., Keskinen, H., Sellegri, K., Ovadnevaite, J., Pöhlker, M. L., Brito, J., Bougiatioti, A., Kristensson, A., Kalivitis, N., Stavroulas, I., Carbone, S., Jefferson, A., Park, M., Schlag, P., Iwamoto, Y., Aalto, P., Äijälä, M., Bukowiecki, N., Ehn, M., Frank, G., Fröhlich, R., Frumau, A., Herrmann, E., Herrmann, H., Holzinger, R., Kos, G., Kulmala, M., Mihalopoulos, N., Nenes, A., O'Dowd, C., Petäjä, T., Picard, D., Pöhlker, C., Pöschl, U., Poulain, L., Prévôt, A. S. H., Swietlicki, E., Andreae, M. O., Artaxo, P., Wiedensohler, A., Ogren, J., Matsuki, A., Yum, S. S., Stratmann, F., Baltensperger, U., and Gysel, M.: Long-term cloud condensation nuclei number concentration, particle number size distribution and chemical composition measurements at regionally representative observatories, Atmos. Chem. Phys., 18, 2853–2881, https://doi.org/10.5194/acp-18-2853-2018, 2018.
Seinfeld, J. H. and Pandis, S. N.: Atmospheric chemistry and physics: from air pollution to climate change, John Wiley & Sons, New York, 2016.
Shulman, M. L., Jacobson, M. C., Carlson, R. J., Synovec, R. E., and Young, T. E.: Dissolution behavior and surface tension effects of organic compounds in nucleating cloud droplets, Geophys. Res. Lett., 23, 277–280, 1996.
Sijikumar, S., John, L., and Manjusha, K.: Sensitivity study on the role of Western Ghats in simulating the Asian summer monsoon characteristics, Meteorol. Atmos. Phys., 120, 53–60, 2013.
Singla, V., Mukherjee, S., Safai, P., Meena, G., Dani, K., and Pandithurai, G.: Role of organic aerosols in CCN activation and closure over a rural background site in Western Ghats, India, Atmos. Environ., 158, 148–159, 2017.
Sotiropoulou, R.-E. P., Nenes, A., Adams, P. J., and Seinfeld, J. H.: Cloud condensation nuclei prediction error from application of Kohler theory: Importance for the aerosol indirect effect, J. Geophys. Res., 112, D12202, https://doi.org/10.1029/2006JD007834, 2007.
Spracklen, D. V., Carslaw, K. S., Pöschl, U., Rap, A., and Forster, P. M.: Global cloud condensation nuclei influenced by carbonaceous combustion aerosol, Atmos. Chem. Phys., 11, 9067–9087, https://doi.org/10.5194/acp-11-9067-2011, 2011.
Twomey, S.: The nuclei of natural cloud formation part II: The supersaturation in natural clouds and the variation of cloud droplet concentration, Geofis. Pura Appl., 43, 243–249, 1959.
Twomey, S. A.: The influence of pollution on the shortwave albedo of clouds, J. Atmos. Sci., 34, 1149–1152, 1977.
Twomey, S. and Warner, J.: Comparison of measurements of cloud droplets and cloud nuclei, J. Atmos. Sci., 24, 702–703, 1967.
Udayasoorian, C., Jayabalakrishnan, R. M., Suguna, A. R., Gogoi, M. M., and Suresh Babu, S.: Aerosol black carbon characteristics over a high-altitude Western Ghats location in Southern India, Ann. Geophys., 32, 1361–1371, https://doi.org/10.5194/angeo-32-1361-2014, 2014.
Ueda, S., Miura, K., Kawata, R., Furutani, H., Uematsu, M., Omori, Y., and Tanimoto, H.: Number-size distribution of aerosol particles and new particle formation events in tropical and subtropical Pacific Oceans, Atmos. Environ., 142, 324–339, 2016.
Vaishya, A., Singh, P., Rastogi, S., and Babu, S. S.: Aerosol black carbon quantification in the central Indo-Gangetic Plain: Seasonal heterogeneity and source apportionment, Atmos. Res., 185, 13–21, 2017.
Varghese, M., Prabha, T. V., Malap, N., Resmi, E. A., Murugavel, P., Safai, P. D., Axisa, D., Pandithurai, G., and Dani, K.: Airborne and ground based CCN spectral characteristics: Inferences from CAIPEEX–2011, Atmos. Environ., 125, 324–336, 2016.
Varghese, M., Prabha, T. V., Murugavel, P., Anu, A. S., Resmi, E. A., Dinesh, G., Rao, Y. J., Nagare, B., Safai, P. D., Nair, S., and Nandakumar, K.: Aerosol and cloud droplet characteristics over Ganges Valley during break phase of monsoon: A case study, Atmos. Res., 220, 125–140, 2019.
Wang, S. C. and Flagan, R. C.: Scanning electrical mobility spectrometer, Aerosol Sci. Technol. 13, 2230–2240, https://doi.org/10.1080/02786829008959441, 1990.
Wehner, B. and Wiedensohler, A.: Long term measurements of submicrometer urban aerosols: statistical analysis for correlations with meteorological conditions and trace gases, Atmos. Chem. Phys., 3, 867–879, https://doi.org/10.5194/acp-3-867-2003, 2003.
Weingartner, E., Saathoff, H., Schnaiter, M., Streit, N., Bitnar, B., and Baltensperger, U.: Absorption of light by soot particles: determination of the absorption coefficient by means of aethalometers, J. Aerosol Sci., 34, 1445–1463, 2003.
Wiedensohler, A.: An approximation of the bipolar charge distribution for particles in the submicron size range, J. Aerosol Sci., 19, 387–389, 1988.
Willis, M. D., Burkart, J., Thomas, J. L., Köllner, F., Schneider, J., Bozem, H., Hoor, P. M., Aliabadi, A. A., Schulz, H., Herber, A. B., Leaitch, W. R., and Abbatt, J. P. D.: Growth of nucleation mode particles in the summertime Arctic: a case study, Atmos. Chem. Phys., 16, 7663–7679, https://doi.org/10.5194/acp-16-7663-2016, 2016.