the Creative Commons Attribution 4.0 License.
the Creative Commons Attribution 4.0 License.
 | 15 Jun 2020
Decreasing trends of particle number and black carbon mass concentrations at 16 observational sites in Germany from 2009 to 2018
Jia Sun
Wolfram Birmili
Markus Hermann
Thomas Tuch
Kay Weinhold
Maik Merkel
Fabian Rasch
Thomas Müller
Alexander Schladitz
Susanne Bastian
Gunter Löschau
Josef Cyrys
Jianwei Gu
Harald Flentje
Björn Briel
Christoph Asbach
Heinz Kaminski
Ludwig Ries
Ralf Sohmer
Holger Gerwig
Klaus Wirtz
Frank Meinhardt
Andreas Schwerin
Olaf Bath
Nan Ma
Alfred Wiedensohler
Anthropogenic emissions are dominant contributors to air pollution. Consequently, mitigation policies have been attempted since the 1990s in Europe to reduce pollution by anthropogenic emissions. To evaluate the effectiveness of these mitigation policies, the German Ultrafine Aerosol Network (GUAN) was established in 2008, focusing on black carbon (BC) and sub-micrometre aerosol particles. In this study, long-term trends of atmospheric particle number concentrations (PNCs) and equivalent BC (eBC) mass concentration over a 10-year period (2009–2018) were determined for 16 GUAN sites ranging from roadside to high Alpine environments. Overall, statistically significant decreasing trends are found for most of these parameters and environments in Germany. The annual relative slope of eBC mass concentration varies between −13.1 % and −1.7 % per year. The slopes of the PNCs vary from −17.2 % to −1.7 %, −7.8 % to −1.1 %, and −11.1 % to −1.2 % per year for 10–30, 30–200, and 200–800 nm size ranges, respectively. The reductions in various anthropogenic emissions are found to be the dominant factors responsible for the decreasing trends of eBC mass concentration and PNCs. The diurnal and seasonal variations in the trends clearly show the effects of the mitigation policies for road transport and residential emissions. The influences of other factors such as air masses, precipitation, and temperature were also examined and found to be less important or negligible. This study proves that a combination of emission mitigation policies can effectively improve the air quality on large spatial scales. It also suggests that a long-term aerosol measurement network at multi-type sites is an efficient and necessary tool for evaluating emission mitigation policies.
- Article
(4149 KB) -
Supplement
(342 KB) - BibTeX
- EndNote


Epidemiological studies have shown that increased particulate air pollution due to anthropogenic emissions leads to adverse health effects (Seaton et al., 1995) and increases global disease burden (Cohen et al., 2017). Among the ambient sub-micrometre aerosol particles (diameter <1 µm), ultrafine particles (UFPs, diameter <100 nm) share the largest number fraction. The UFPs can penetrate deep into lungs and translocate to other organs such as the brain, causing health problems such as respiratory and cardiovascular diseases (Kreyling et al., 2006; Schmid and Stoeger, 2016). In urban areas, black carbon (BC) produced by incomplete combustion of fossil fuel and biomass accounts for a significant fraction of UFP mass (Chen et al., 2014; Cheng et al., 2013; Pérez et al., 2010). As BC could operate as a universal carrier of a wide variety of toxins such as polycyclic aromatic hydrocarbons (PAHs) and heavy metals into the human body, exposure to BC could cause acute health effects such as cardiopulmonary morbidity and mortality (Janssen et al., 2012).
The European Union (EU) was one of the earliest regions around the world to implement emission reduction policies to reduce the harmful effects of air pollution. EU emission mitigation legislations are directly formulated based on emission sources. In Europe, the main anthropogenic sources of primary aerosol particles are fuel combustions from industrial installations (power generation, industry, etc.), non-road and road transport, and domestic heating (European Environment Agency, 2017). The member states of the EU were required to draft National Programmes to the Commission (http://ec.europa.eu/environment/air/reduction/implementation.htm, last access: 18 December 2019). In Germany, the Federal Emission Control Regulations (Bundes-Immissionsschutzverordnung, BImSchV) are a part of the German federal law. To reduce the emission from industrial installations, the BImSchV regulates permits for construction and operation of industrial installations. The emission limits for large combustion, such as for that from power plants, are defined as well. For domestic heating emissions, the unsuitable fuels are listed and their emission values are defined. For traffic emission, low-emission zones (LEZs) were set up to limit the emission of nitrogen oxide and aerosol particles from traffic exhaust.
It is important to evaluate the effectiveness of the implemented emission mitigation policies through long-term observations of pollutants such as sub-micrometre particles and BC. There have been many studies on the long-term trends of particle number concentration (PNC) and/or BC mass concentration since the 1990s. These studies have concluded that emission mitigation policies may reduce human exposure to the pollutants, and the results were important for the policymakers (Barmpadimos et al., 2011; Masiol et al., 2018; Kutzner et al., 2018; Putaud et al., 2014). Most of these studies were conducted in roadside or urban backgrounds, which are largely dominated by traffic emissions. Few of them have focused on long-term trends in the regional background setting (Asmi et al., 2013; Barmpadimos et al., 2011; Murphy et al., 2011). Murphy et al. (2011) found that between 1990 and 2004, the elemental carbon (EC) mass concentration decreased in several of the national parks and other remote sites in the US. This result was an indication that the emission control policies were effective in reducing the EC mass concentration in the background air across the US. Asmi et al. (2013) analysed the long-term change of PNC at the regional background and remote sites in Europe, North America, Antarctica, and Pacific Ocean islands during 2001–2010. The results showed that decreased PNCs could likely be explained by the reduction of anthropogenic emissions. Kutzner et al. (2018) evaluated the trend of BC over Germany based on measurements at traffic, urban background, and rural sites for the period of 2005–2014, and they concluded that the observed decreasing trends in BC are likely owing largely to mitigation measures in the traffic sector. However, there is still a lack of a thorough investigation of the connections between the long-term trends of PNCs and BC and the change of different anthropogenic emissions. A better understanding of the influence of the inter-annual variation in meteorological conditions on the observed trends is also needed.
Based on a unique dataset from the German Ultrafine Aerosol Network (GUAN), this study investigates the long-term variation in the regional PNC and BC mass concentration, to understand the effectiveness of the emission mitigation policies in reducing the PNC and BC in Germany. The study was conducted for the period of 2009–2018 with data from 16 observational sites representing different types of environment (roadside, urban background, regional background, low mountain, and high Alpine). The overall, diurnal, and seasonal trends of PNCs and BC are evaluated and the role of potential decisive factors, including not only emission mitigation policies but also other potential drivers (i.e. inter-annual change in meteorological conditions and long-range transport patterns), are discussed.
2.1 The German Ultrafine Aerosol Network (GUAN)
The GUAN is a specialised network in Germany that provides continuous measurements including sub-micrometre particle number size distribution (PNSD) and the equivalent BC (eBC) mass concentration in diverse environments including roadside, urban background, regional background, low mountain range, and high Alpine. The GUAN combines federal and state air quality monitoring stations as well as atmospheric observatories from research institutes, aiming at a better understanding of sub-micrometre PNC and BC with respect to human health and climate impact (Birmili et al., 2016).

Figure 1Map of the 16 atmospheric measurement stations in the GUAN.
Table 1 lists the basic information of the GUAN sites evaluated in this study. The locations of all 16 sites are illustrated in Fig. 1. A summarised description of the sites is given here and more details are available in Birmili et al. (2016). Among the 16 sites, seven are located in the state of Saxony: Leipzig-Mitte (LMI), Leipzig-Eisenbahnstraße (LEI), Leipzig Leibniz Institute for Tropospheric Research (TROPOS) (LTR), Melpitz (MEL), Dresden-Nord (DDN), Dresden-Winckelmannstraße (DDW), and Annaberg-Buchholz (ANA). LMI and LEI are two roadside stations in Leipzig. LMI is located roadside in an open area in the city centre, while LEI is a street canyon station. The traffic volumes at these two sites are 44 000 and 12 000 vehicles per day, respectively. LTR is an atmospheric research station situated on the roof of the main building of TROPOS. Station MEL is located in farmland about 50 km from Leipzig. Previous studies have shown that MEL can represent the regional background atmosphere of central Europe well (Spindler et al., 2013). Two stations are located in the city of Dresden: a roadside site, DDN, with a traffic volume of about 36 000 vehicles per day and an urban background site, DDW, 1.7 km away from the city centre. ANA is an urban background station located in the city of Annaberg-Buchholz in the Ore mountain area about 10 km away from the German–Czech border (Schladitz et al., 2015).
Table 1Basic information on the 16 sites in the German Ultrafine Aerosol Network (GUAN), in alphabetic order.
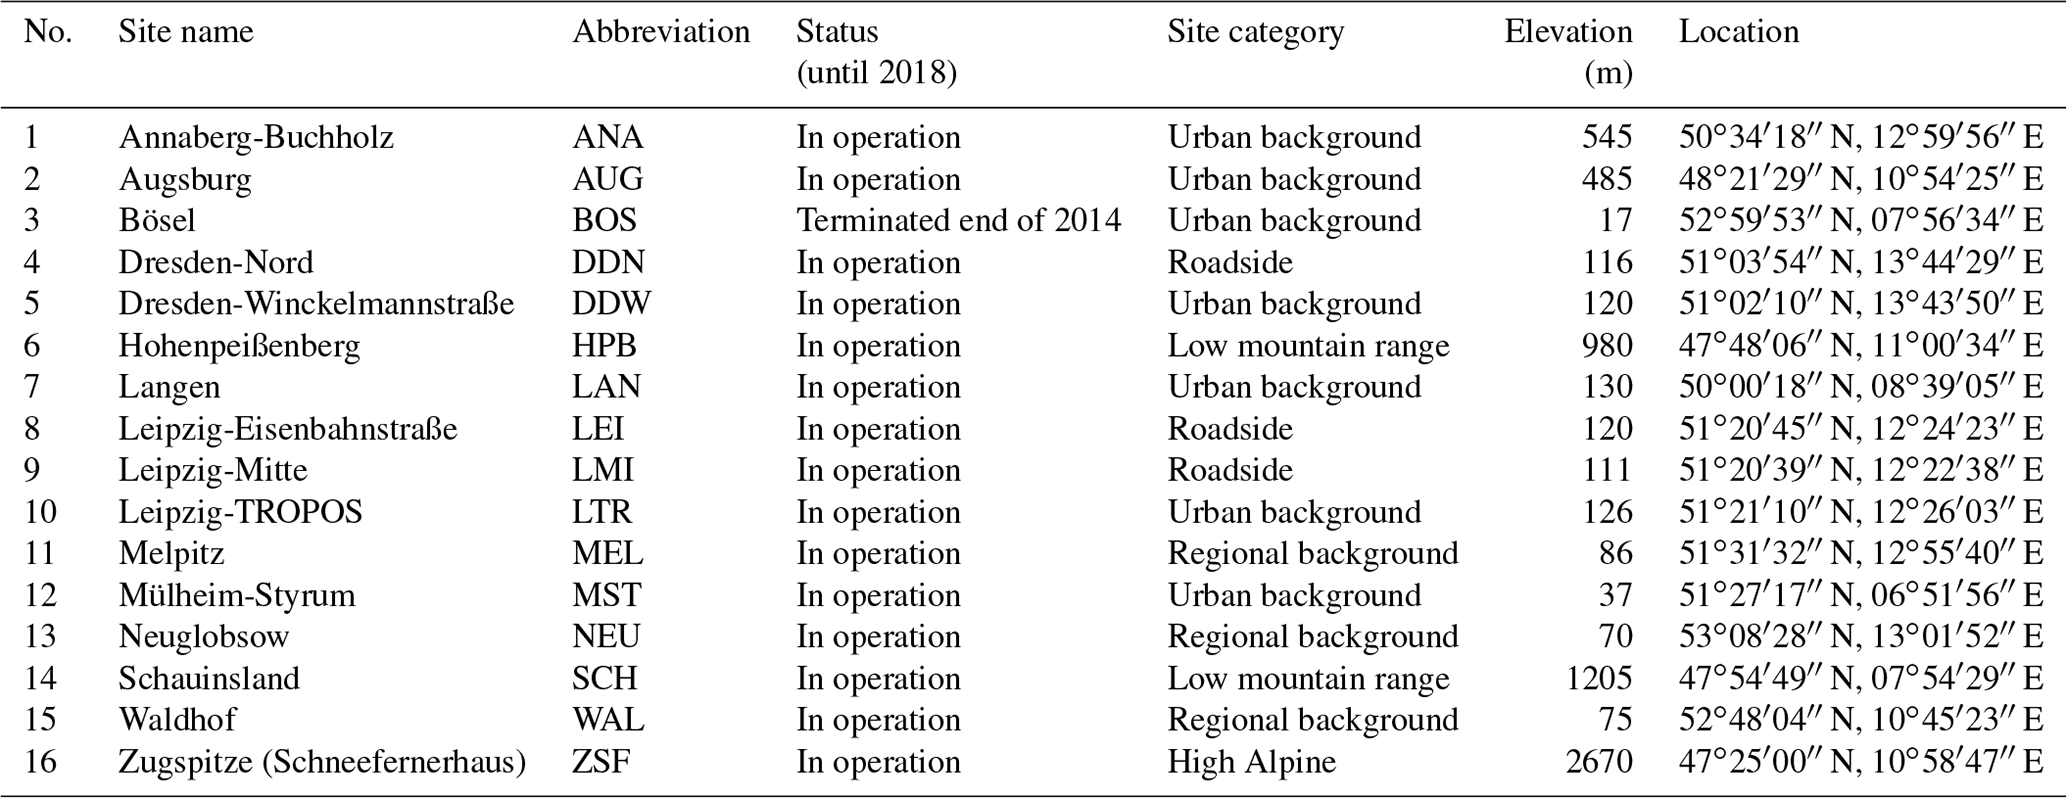
Three stations are located in the lowlands of northern Germany: Bösel (BOS), Neuglobsow (NEU), and Waldhof (WAL). The urban background site BOS is located in the village of Bösel, about 100 km from the North Sea. It is, therefore, partly influenced by maritime air masses. NEU and WAL are located in forests, representing regional background conditions of the northern Germany lowlands.
Two stations, Langen (LAN) and Mülheim-Styrum (MST), are located in the western part of Germany. LAN is an urban background site located in the city of Langen at the edge of a residential area and a forest. Emissions from the Frankfurt am Main airport (about 5 km to the southeast) might sometimes influence the observations at LAN. MST is situated in the western end of the Ruhr area, the largest urban cluster area in Germany.
Four stations are located in the southern part of Germany, including one urban background site Augsburg (AUG), two low mountain range sites Schauinsland (SCH) and Hohenpeißenberg (HPB), and one high Alpine site Zugspitze-Schneefernerhaus (ZSF). AUG is located on the premises of Augsburg's University of Applied Sciences, about 1 km southeast of the Augsburg city centre. The two low mountain range sites SCH and HPB are surrounded mainly by forests and agricultural pastures and are located at the elevations of 1205 and 980 m above sea level (a.s.l.), respectively. The high Alpine site ZSF is located at 2670 m a.s.l. and 300 m below the summit of the Zugspitze, the highest mountain in Germany.
2.2 Instrumentation
The technical details of the PNSD and the eBC mass concentration measurements at each GUAN site are summarised in Table 2. More detailed information on the instrumentation and data processing is provided in Birmili et al. (2016). Depending on the individual set-up, PNSDs are measured either by the mobility particle size spectrometers (MPSSs; Wiedensohler et al., 2012) or by the dual mobility particle size spectrometers (D-MPSSs). Aerosol dryers are used to dry the aerosol sample to a relative humidity below 40 % (Swietlicki et al., 2008). The PNSD is retrieved from the raw mobility distribution using an inversion algorithm (Pfeifer et al., 2014), including the commonly used bipolar charge distribution (Wiedensohler, 1988). The corrections for particle losses in instruments and inlets are made based on Wiedensohler et al. (2012).
Table 2Technical details of the instrumentations of the 16 GUAN sites.
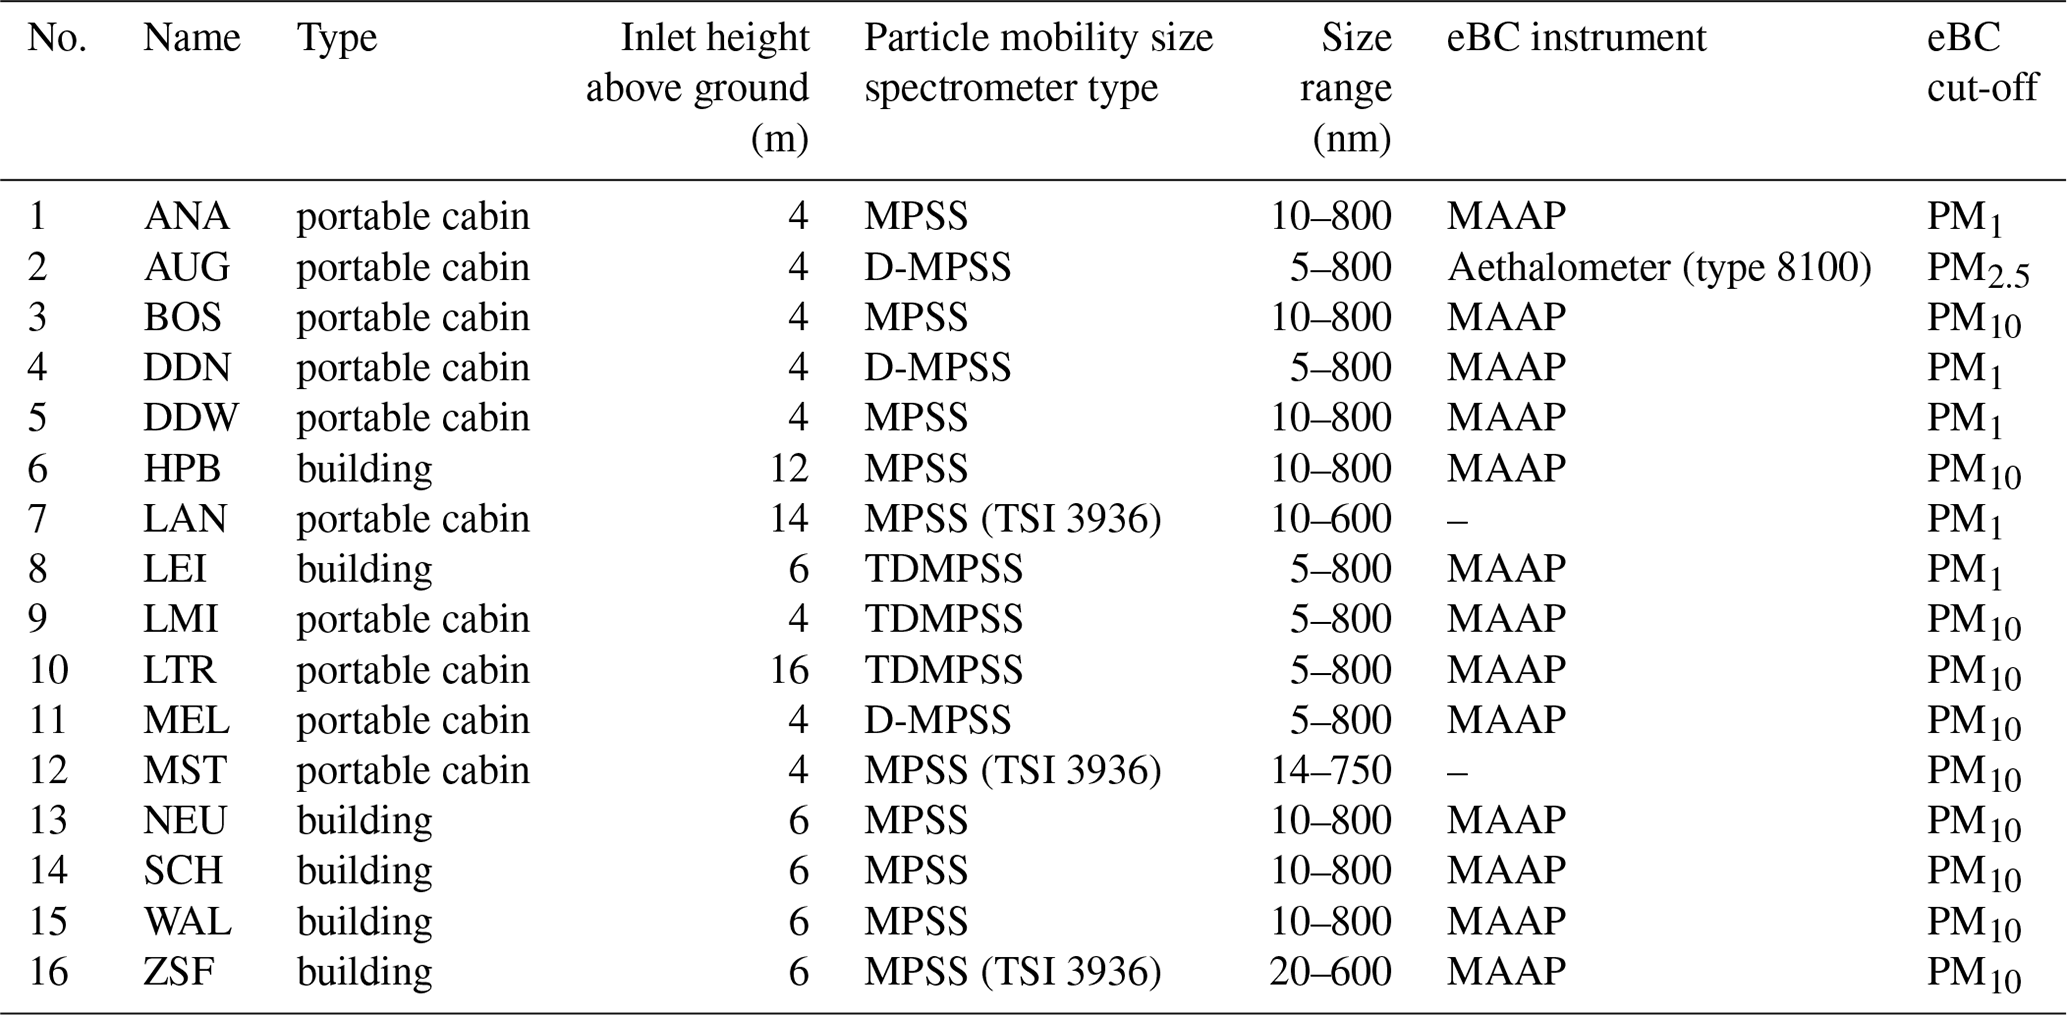
Mass concentrations of eBC are measured using multi-angle absorption photometers (MAAPs, Thermo Scientific, model 5012), except for AUG, where an Aethalometer (type 8100, Thermo Fisher Scientific Inc.) is used. For the MAAP measurement, eBC mass concentration is obtained using a mass absorption cross section of 6.6 m2 g−1 at the wavelength of 637 nm (Petzold and Schönlinner, 2004; Müller et al., 2011). No eBC data are available for LAN and MST.
Quality assurance of PNSD measurements in GUAN is periodically done to ensure that measurements remain stable both instrument to instrument (or site to site) and instrument to standard. Monthly maintenance and on-site and laboratory inter-comparisons with a reference MPSS with a frequency between one and four times per year as recommended by Wiedensohler et al. (2018) are done by the World Calibration Centre for Aerosol Physics (WCCAP, http://www.wmo-gaw-wcc-aerosol-physics.org/, last access: 12 July 2019). These procedures can ensure an accuracy of ±10 % for PNCs over the entire measurement period (Birmili et al., 2016). Although the uncertainty of PNCs is comparable or higher than their annual trends (Sect. 3.1), with the application of periodical quality assurance procedures, there should be no monotonicity change or systematic bias in the measurement uncertainties. Therefore, the influence of the measurement uncertainty on the detection of long-term trends of PNCs is assumed to be negligible.
To condense the information provided by PNSD, three particle size ranges, 10–30, 30–200, and 200–800 nm, are chosen to obtain integrated PNCs. N[10−30] represents the nucleation mode in which particles are freshly formed by homogeneous nucleation from either photochemical processes or downstream of traffic exhausts. N[30−200] represents the Aitken mode in which particles are either directly emitted from incomplete combustion or grown by condensation. N[200−800] represents the accumulation mode in which particles have undergone condensational growth or cloud processing during transport. As the particles below 20 nm are not measured from 2009 to 2018 at ZSF and MST, we use N[20−800] to represent total PNC in this study instead of N[10−800]. Figure 2 illustrates the time span for which data are available at the 16 stations in GUAN during the study period of 2009–2018. As a summary, Table S1 in the Supplement gives the number of stations used in trend analysis.
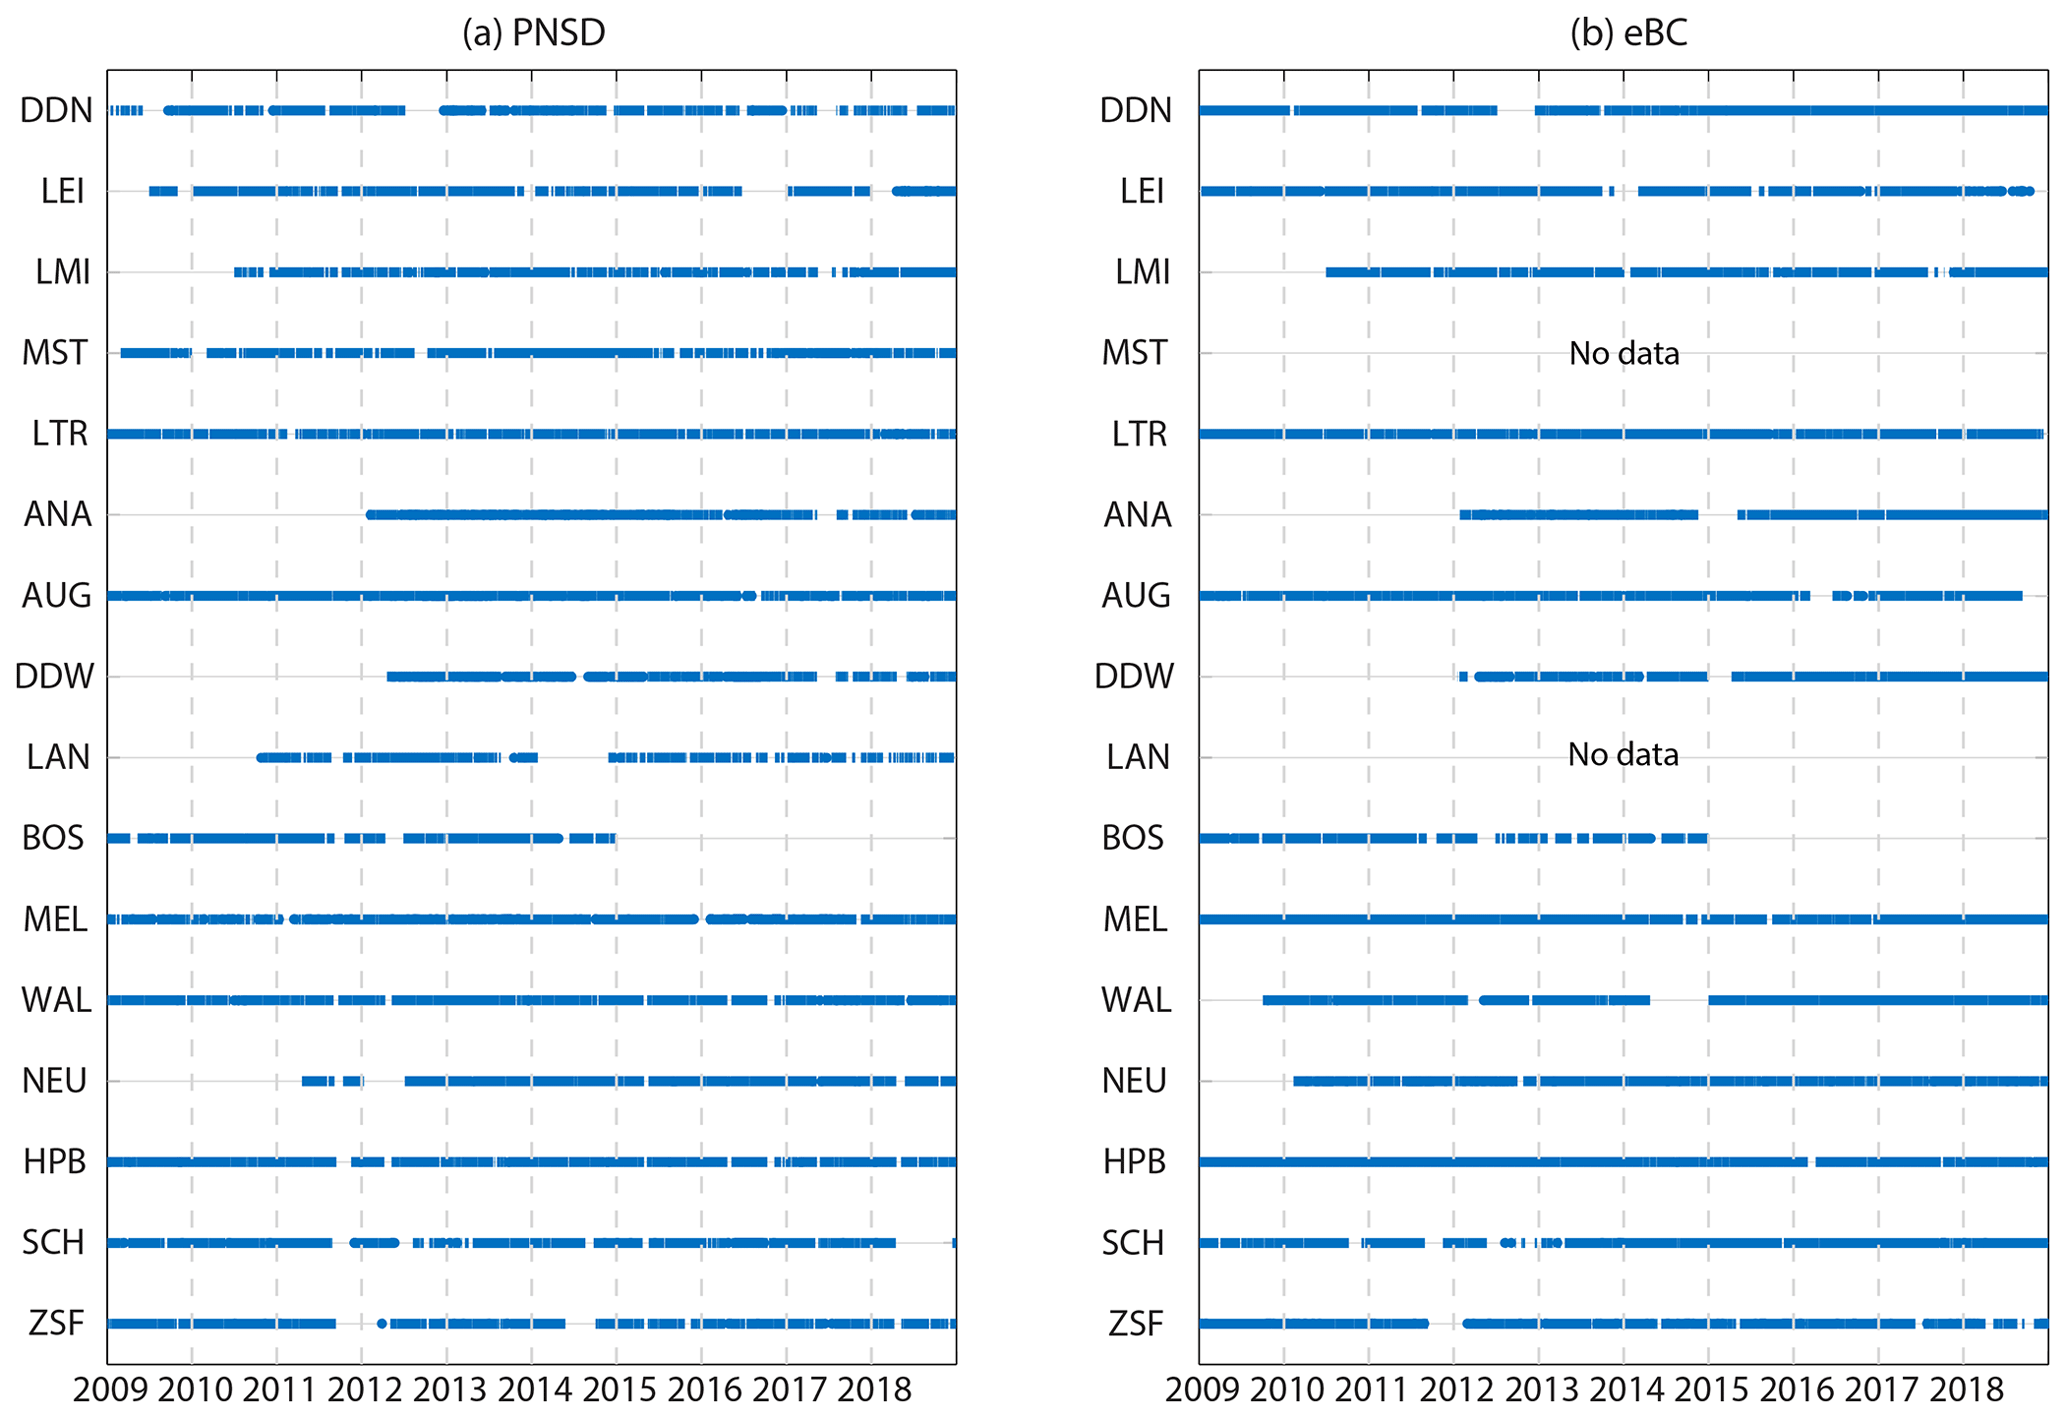
Figure 2Data coverage of the PNSD and eBC mass concentrations from 2009 to 2018 at the 16 GUAN sites.
2.3 Trend analysis methods
Environmental data are usually not normally distributed. Therefore, non-parametric methods are often used to detect the long-term trends (e.g. Asmi et al., 2013; Bigi and Ghermandi, 2014; Collaud Coen et al., 2013). Detection of long-term linear trends can be affected by several factors such as time span and time resolution, magnitude of variability, autocorrelation, and periodicity of the time series (Weatherhead et al., 1998). To analyse the long-term trends of the PNCs and the eBC mass concentrations, two trend evaluation methods, a customised Sen–Theil trend estimator and the generalised least-square regression (GLS), were used in this study. Moreover, the regional Mann–Kendall test was used to detect the overall trends over the whole study region. To ensure the comparability of trend slopes among the different sites, relative slopes (absolute slope divided by the median value of the whole time series) in percent per year were used.
2.3.1 Customised Sen–Theil trend estimator
The customised Sen–Theil trend estimator (customised Sen's estimator, hereafter) is a modified non-parametric procedure based on the ordinary Sen's slope estimator (Sen, 1968; Theil, 1992; Birmili et al., 2015). This approach can give the true slope of atmospheric parameters by fully considering the effect of their periodic variations, such as seasonal, weekly, and diurnal cycles, and avoid the influence of outliers, missing values, and statistical distribution of the data. Based on the hourly or daily time series x(i), firstly, the rates of change mi,k of each data pair [x(i), )] are calculated as
where k is the integer. Δt ensures that each data point is compared only with data points that are separated by a multiple of 52 weeks (364 d); that is, data points from two different years are compared only if they both were measured in the same hour of the day, day of the week, and season of the year. For our dataset, more than 10 000 slopes mi,k are calculated for each time series. The median of those slopes is taken as the true slope for the whole period. Significance and confidence interval (CI) of the trends are determined at 95 % significance level from the distribution of mi,k.
2.3.2 Generalised least-square regression and autoregressive bootstrap confidence intervals
The second method used to detect the trends is the generalised least-square (GLS) regression (Mudelsee, 2010; Asmi et al., 2013). A brief introduction of the method is given here; for details refer to Mudelsee (2010) and Asmi et al. (2013). GLS is an approach for estimating the linear parameters in a linear regression model. For a time series of an observed parameter x(i), compactly written as , the linear regression model can be defined as
where β1 and β2 are the two trend parameters (intercept and slope). Ω(t(i)) is a seasonal component. S(i) is a variability function scaling the random noise term e(i). The GLS regresses the trend and seasonal parameters (denoted as β hereinafter) by minimising the sum of squares of the residuals (SSQG).
where t is time, x is observation data, and V is the covariance matrix that can be estimated by Eq. (6) in Asmi et al. (2013).
To evaluate the robustness of the derived slopes, the autoregressive bootstrap (ARB) method is used to construct the CIs (Mudelsee, 2010, algorithm 3.5). The ARB resamples the white-noise residuals of data using the autoregressive persistence model, adds the resampled residuals to the fitted data, and recalculates the slopes. The resampling is repeated 1000 times and the CIs are estimated from these 1000 resampled slopes.
2.3.3 Regional Mann–Kendall test
To detect if an overall increase or decrease exists in the whole region, the regional Mann–Kendall test was also applied in this study. Mann–Kendall test is a commonly used method for detection of long-term trends (Mann, 1945; Kendall, 1938). It detects the trend using the Kendall's tau test which is known as a rank correlation test and evaluates if a monotonic increasing or decreasing trend exists. If a significant monotonic increase or decrease is detected, the Sen's slope estimator is further used to determine the slope and CI of the time series (Gilbert, 1987). The regional Mann–Kendall test (Helsel and Frans, 2006) is a method adapted from the seasonal Kendall test to determine whether a monotonic increase or decrease can be observed across a large area including multiple locations. For details about the regional Mann–Kendall test, refer to Helsel and Frans (2006). Considering the dataset size and calculation efficiency, the monthly median time series was used for the regional Mann–Kendall test in this study.
3.1 Overall trends over the time period 2009−2018
The temporal trends of the observed PNCs and eBC mass concentrations were evaluated using the customised Sen's estimator and GLS–ARB. The daily median time series was used for the customised Sen's estimator, and the monthly median time series was used for GLS–ARB. The relative annual slopes are listed in Table 3. The trend is marked as “statistically significant” (s.s.) in the table if it is statistically significant at the 95 % significance level. For the five parameters at the 16 sites (76 trends in total; see Table S1 in the Supplement), the trends detected by the two methods agree well with each other with seven exceptions that we conclude as no s.s. trends (N[20−800] at MEL, N[10−30] at LMI, LAN, HPB and SCH, and N[200−800] at LAN and BOS). The s.s. negative slopes were found at 14 out of 16 sites for N[30−200], N[200−800], and N[20−800]; at eight out of 14 sites for N[10−30]; and at all sites for eBC mass concentration. The annual slope of the eBC mass concentration varies between −13.1 % and −1.7 % per year. The slopes of the PNCs vary from −17.2 % to −1.7 %, −7.8 % to −1.1 %, and −11.1 % to −1.2 % per year (only the s.s. trends) for 10–30, 30–200, and 200–800 nm particle diameter, respectively. Robustness analysis (see Sect. S1 in the Supplement) suggests that the time span of our dataset is long enough for slope detection.
Table 3Multi-annual trends of the PNCs and eBC mass concentration in percentage per year, calculated using the customised Sen's estimator and generalised least-square regression with autoregression bootstrap (GLS–ARB). Statistically significant slopes at the 95 % significance level are marked as bold numbers. Five site categories in the left column are roadside (RS), urban background (UB), regional background (RB), low mountain range (LMT), and high Alpine (HA).
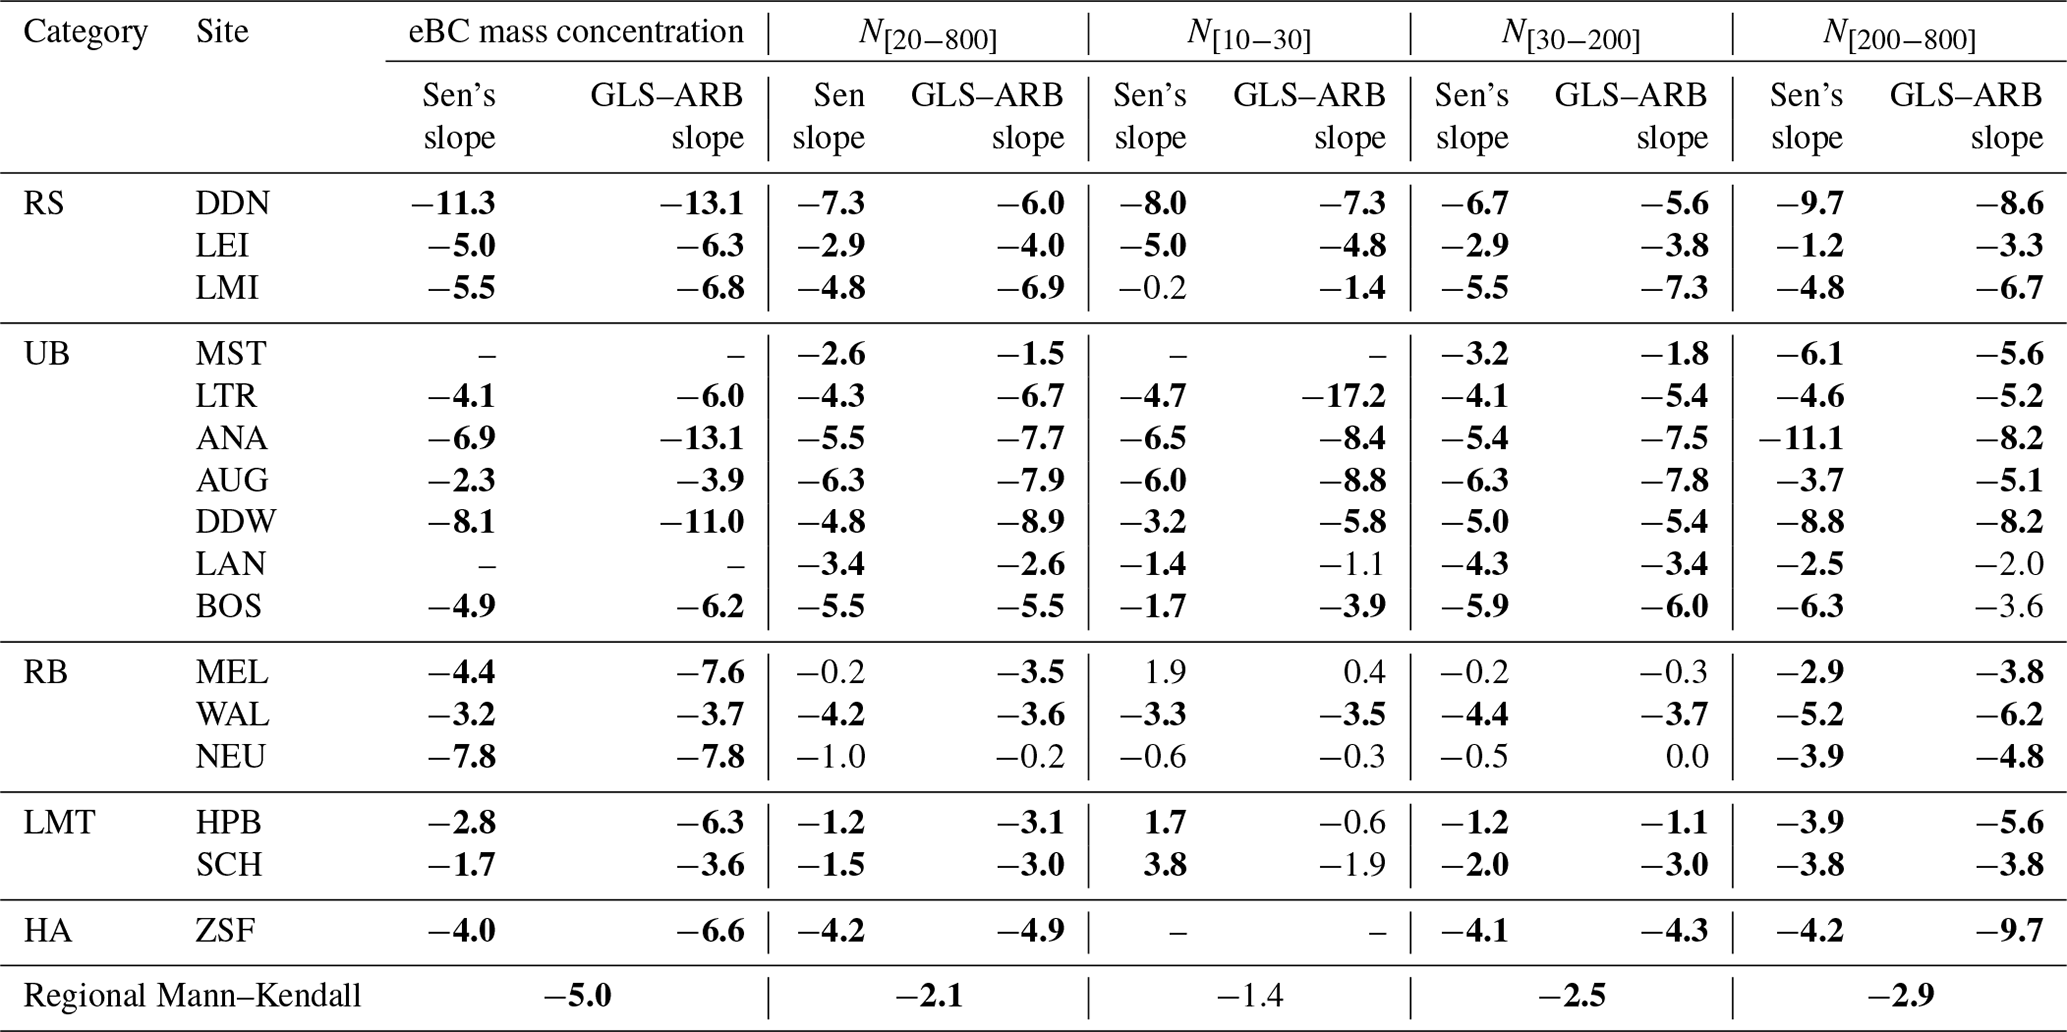
To evaluate the overall trends of PNCs and eBC mass concentration over Germany, the regional Mann–Kendall test was applied to our dataset and the results are also listed in Table 3. It should be noted that roadside sites might bias the regional Mann–Kendall trends because of their prominent local influence. Moreover, the 13 non-roadside sites in GUAN are not evenly distributed at a spatial scale as there are five sites located in the state of Saxony, and HPB is only 42 km away from ZSF. To ensure the representativeness of the regional trends, three roadside sites (DDN, LMI, and LEI) as well as LTR, ANA, and ZSF were excluded in the regional Mann–Kendall test. The highest regional decrease of 5 % per year appears in the eBC mass concentration of which anthropogenic emissions are the major source. The regional trends of N[30−200] and N[200−800] are both s.s. negative. In the urban area, N[30−200] and eBC mass concentration are found to be closely related to the emissions from incomplete diesel combustion (Cheng et al., 2013; Krecl et al., 2015). Therefore, the s.s. regional decreases in N[30−200] and eBC mass concentration are very likely to stem from the decrease in anthropogenic emissions in Germany. However, an insignificant regional trend was detected for N[10−30]. A plausible explanation is that anthropogenic emissions have only minor or negligible influence on N[10−30] in the regional background area due to the short lifetime and high spatial variability of nucleation-mode particles (Sun et al., 2019).
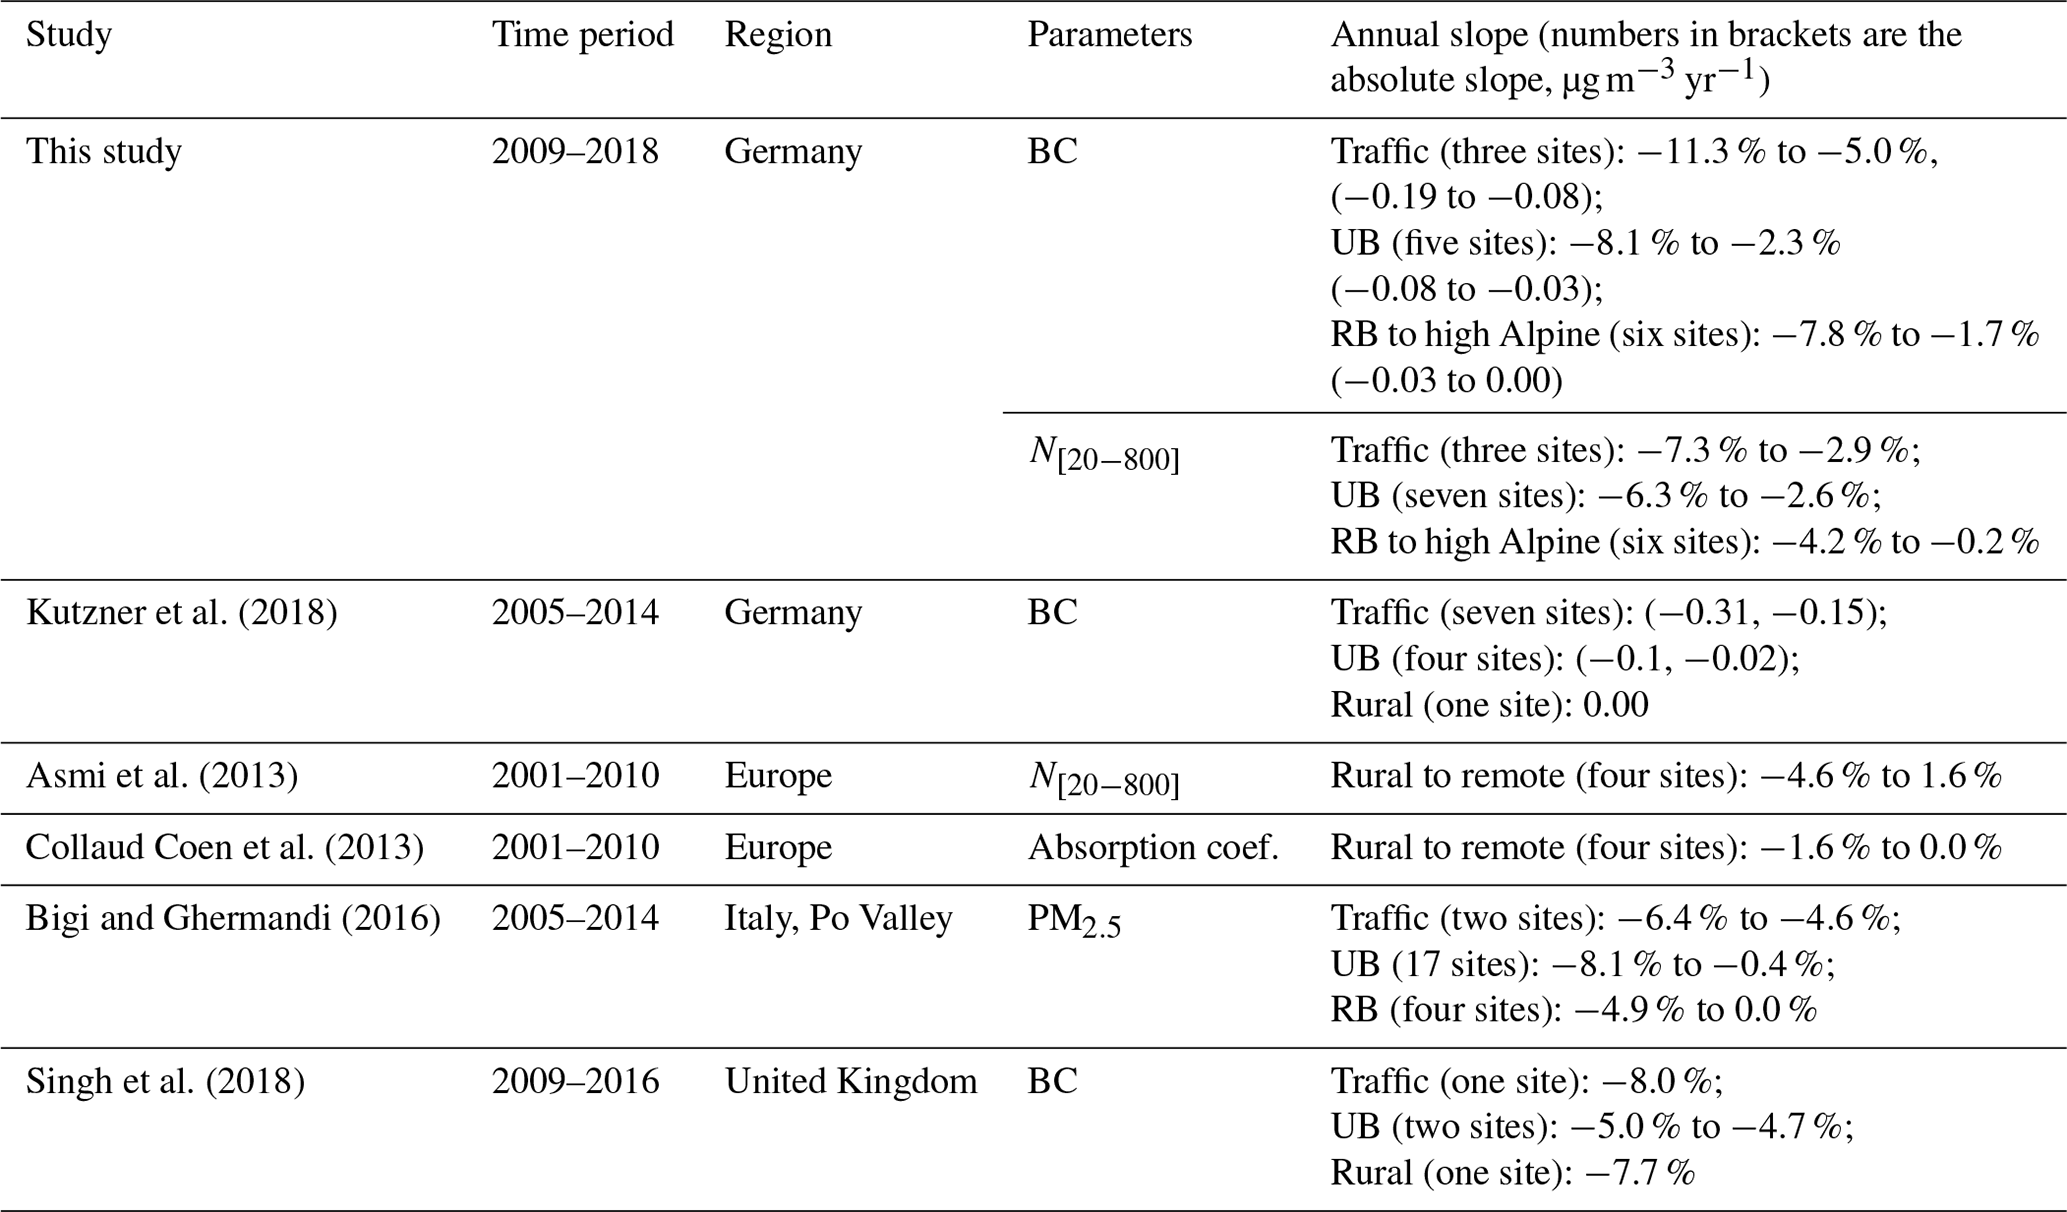
The trends of the PNCs and eBC mass concentration in this study are consistent with results from other studies conducted in Europe. Table 4 compares the long-term trends of aerosol concentrations between the present and other studies. Since 2001, the s.s. decrease in BC, PNCs, and PM2.5 have been detected for most of the evaluated sites in Table 4. The implementation of emission mitigation polices has been thought to be the dominant impact factors in these studies. In particular, there is one similar study that evaluated the trend of BC mass concentration in Germany for the time period 2005–2014 (Kutzner et al., 2018), in which decreased BC mass concentration was detected at 12 sites. Comparing the two studies, the absolute decreasing trend of BC mass for 2005–2014 is stronger than our results for 2009–2018, which might stem from the difference between the effects of emission mitigation policies in the two study periods.
Table 4Comparison of long-term trend studies of BC, PNC, and PM in Europe.
3.2 Emission change in Germany
Long-term trends of aerosol concentrations on regional scales could occur due to several factors such as emission changes and changes in long-range transport and vertical diffusion due to inter-annual variations in weather and climate. In areas strongly affected by human activities (e.g. traffic, domestic heating, industry), changes in emissions are usually the main cause of the trend of aerosol concentrations. In this section, the long-term variation in total emission of major pollutants in Germany is compared with the trends of aerosol concentrations measured at the six regional background and mountain sites. The emission data are from the German Informative Inventory Report (UBA, 2019a, b) produced by the national coordination agency for the National System of Emissions Inventories (Nationales Systems Emissionsinventare, NaSE) sited within the federal German Environment Agency (UBA) and is based on a large number of sources and publications. Detailed information is available in UBA (2019a, b).
In 2005, the German federal government established the German Sustainability Development Strategy with the goal of reducing the emissions of SO2, NOx, NH3, non-methane volatile organic compounds (NMVOCs), and PM2.5. Figure 3a illustrates the variation in BC total emission in Germany from 2009 to 2017 (black line) and the annual mean eBC mass concentration index (defined as the percentage of the concentration for the year of 2009) for the six regional background and mountain sites (magenta line). From 2009 to 2017, the total emission of BC in Germany deceases about −3.4 % per year and highly agrees with the trend of mean eBC mass concentration. The eBC mass concentration is influenced by emission, transport, and scavenging simultaneously. The agreement between the trend of BC total emission and eBC mass concentration suggests that emission reduction is very likely to be the dominant factor for the decrease in eBC mass concentration over Germany, while other factors do not show a clear contribution.
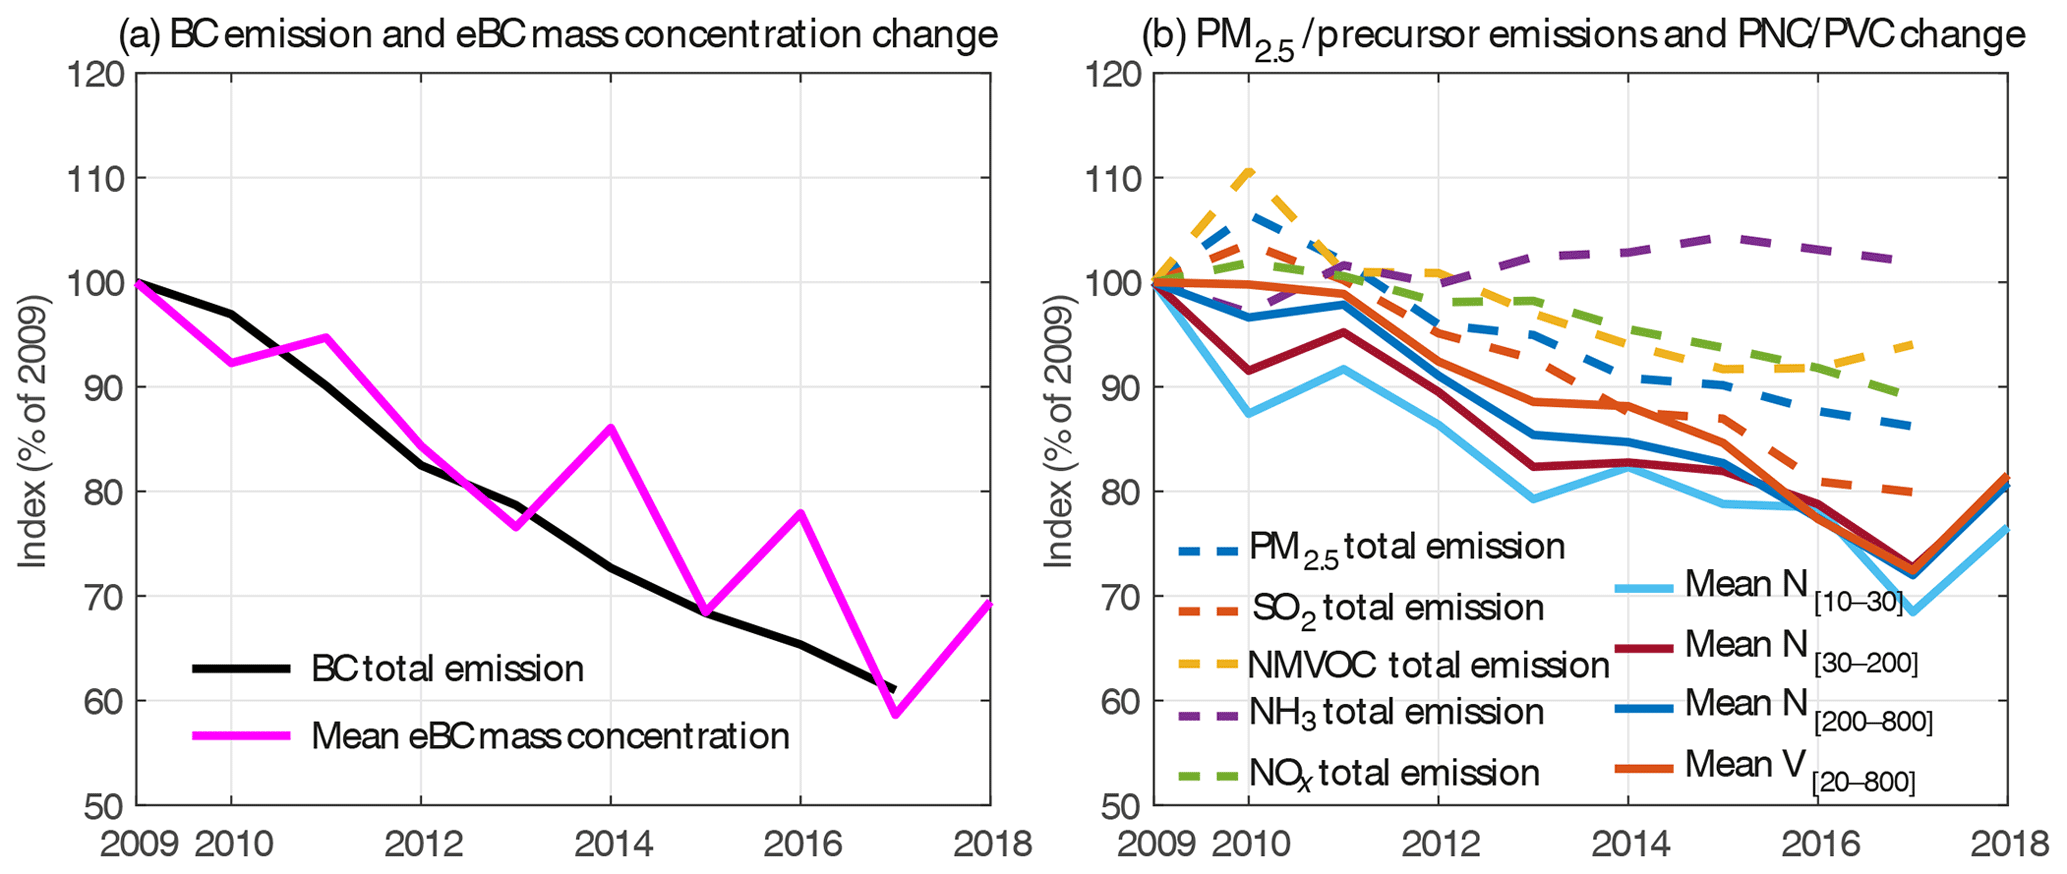
Figure 3Long-term change index (percent of average in 2009) of measured parameters at the regional background and mountain station sites and total emissions in Germany: (a) measured eBC mass concentration and BC emission; (b) measured N[10−30], N[30−200], N[200−800], and V[20−800] and emission of PM2.5, SO2, NMVOC, NH3, and NOx.
Other than primary emission, another important process controlling the PNC is the formation of secondary particulate matter. The decreased anthropogenic emissions might reduce the concentration of precursor gases and thus inhibit secondary aerosol formation. Figure 3b illustrates the variation in total emission of PM2.5 and some selected precursor gases, as well as the annual mean PNC index for the six regional background and mountain sites. It should be noted that PNC is not a conserved parameter and might change rapidly by particle coagulation. Thus, another parameter, particle volume concentration (PVC) in the size range of 20–800 nm (V[20−800]), is also shown in Fig. 3b for a better comparability. Total emissions of all precursors and PM2.5 except NH3 decreased around −2.2 % to −0.9 % per year during 2009–2018. However, the measured N[30−200], N[200−800], and V[20−800] decrease about −2.5 % per year, which is stronger than the decreases in the emissions. Secondary aerosol formation processes are highly complex and non-linear, determined not only by the concentrations of precursors but also by many other factors such as solar radiation, temperature, humidity, and diffusion condition. Thus, the concentration of secondary aerosol might not follow the variation in precursor concentrations. It was found that secondary aerosol contributes a large fraction in particulate matter in the regional background settings (Castro et al., 1999). Therefore, discrepancies are observed between the emissions and particle concentrations, although decrease trends are found in both of them.
Based on the above results, we believe that the observed trends of PNCs and eBC mass concentration are mainly due to the reduction in emissions. The annual changes of meteorological conditions might have an impact on PNCs but are not likely to be the decisive impact factor. Detailed discussion on the possible influence of meteorological conditions will be discussed in Sect. 4. The decreased pollutant concentrations are highly associated with the reduced risk of human health. Pope et al. (2009) demonstrated that a decrease of 10 µg m−3 in the PM2.5 mass concentration is related to an increase in life expectancy of 0.61±0.20 year in 211 countries. The improved health effects because of decreased UFP and BC would be even greater compared with those of PM2.5 mass concentration. As of 2018, 97 % of cities in low- and mid-income countries do not meet the World Health Organization (WHO) air quality guidelines (WHO, 2018). Our result demonstrates that the implementation of proper emission mitigation policies can largely reduce the BC mass concentration and PNC and thus may effectively reduce the health risk in polluted regions.
3.3 Diurnal variation in trends
The emission intensities of some emission sources have distinct diurnal variations, such as that of traffic and residential activities (e.g. domestic heating). The trends based on the subsets of the time series might reflect the impact of these changes. In this section we will analyse the diurnal variations in trends and investigate their connection to the sources.
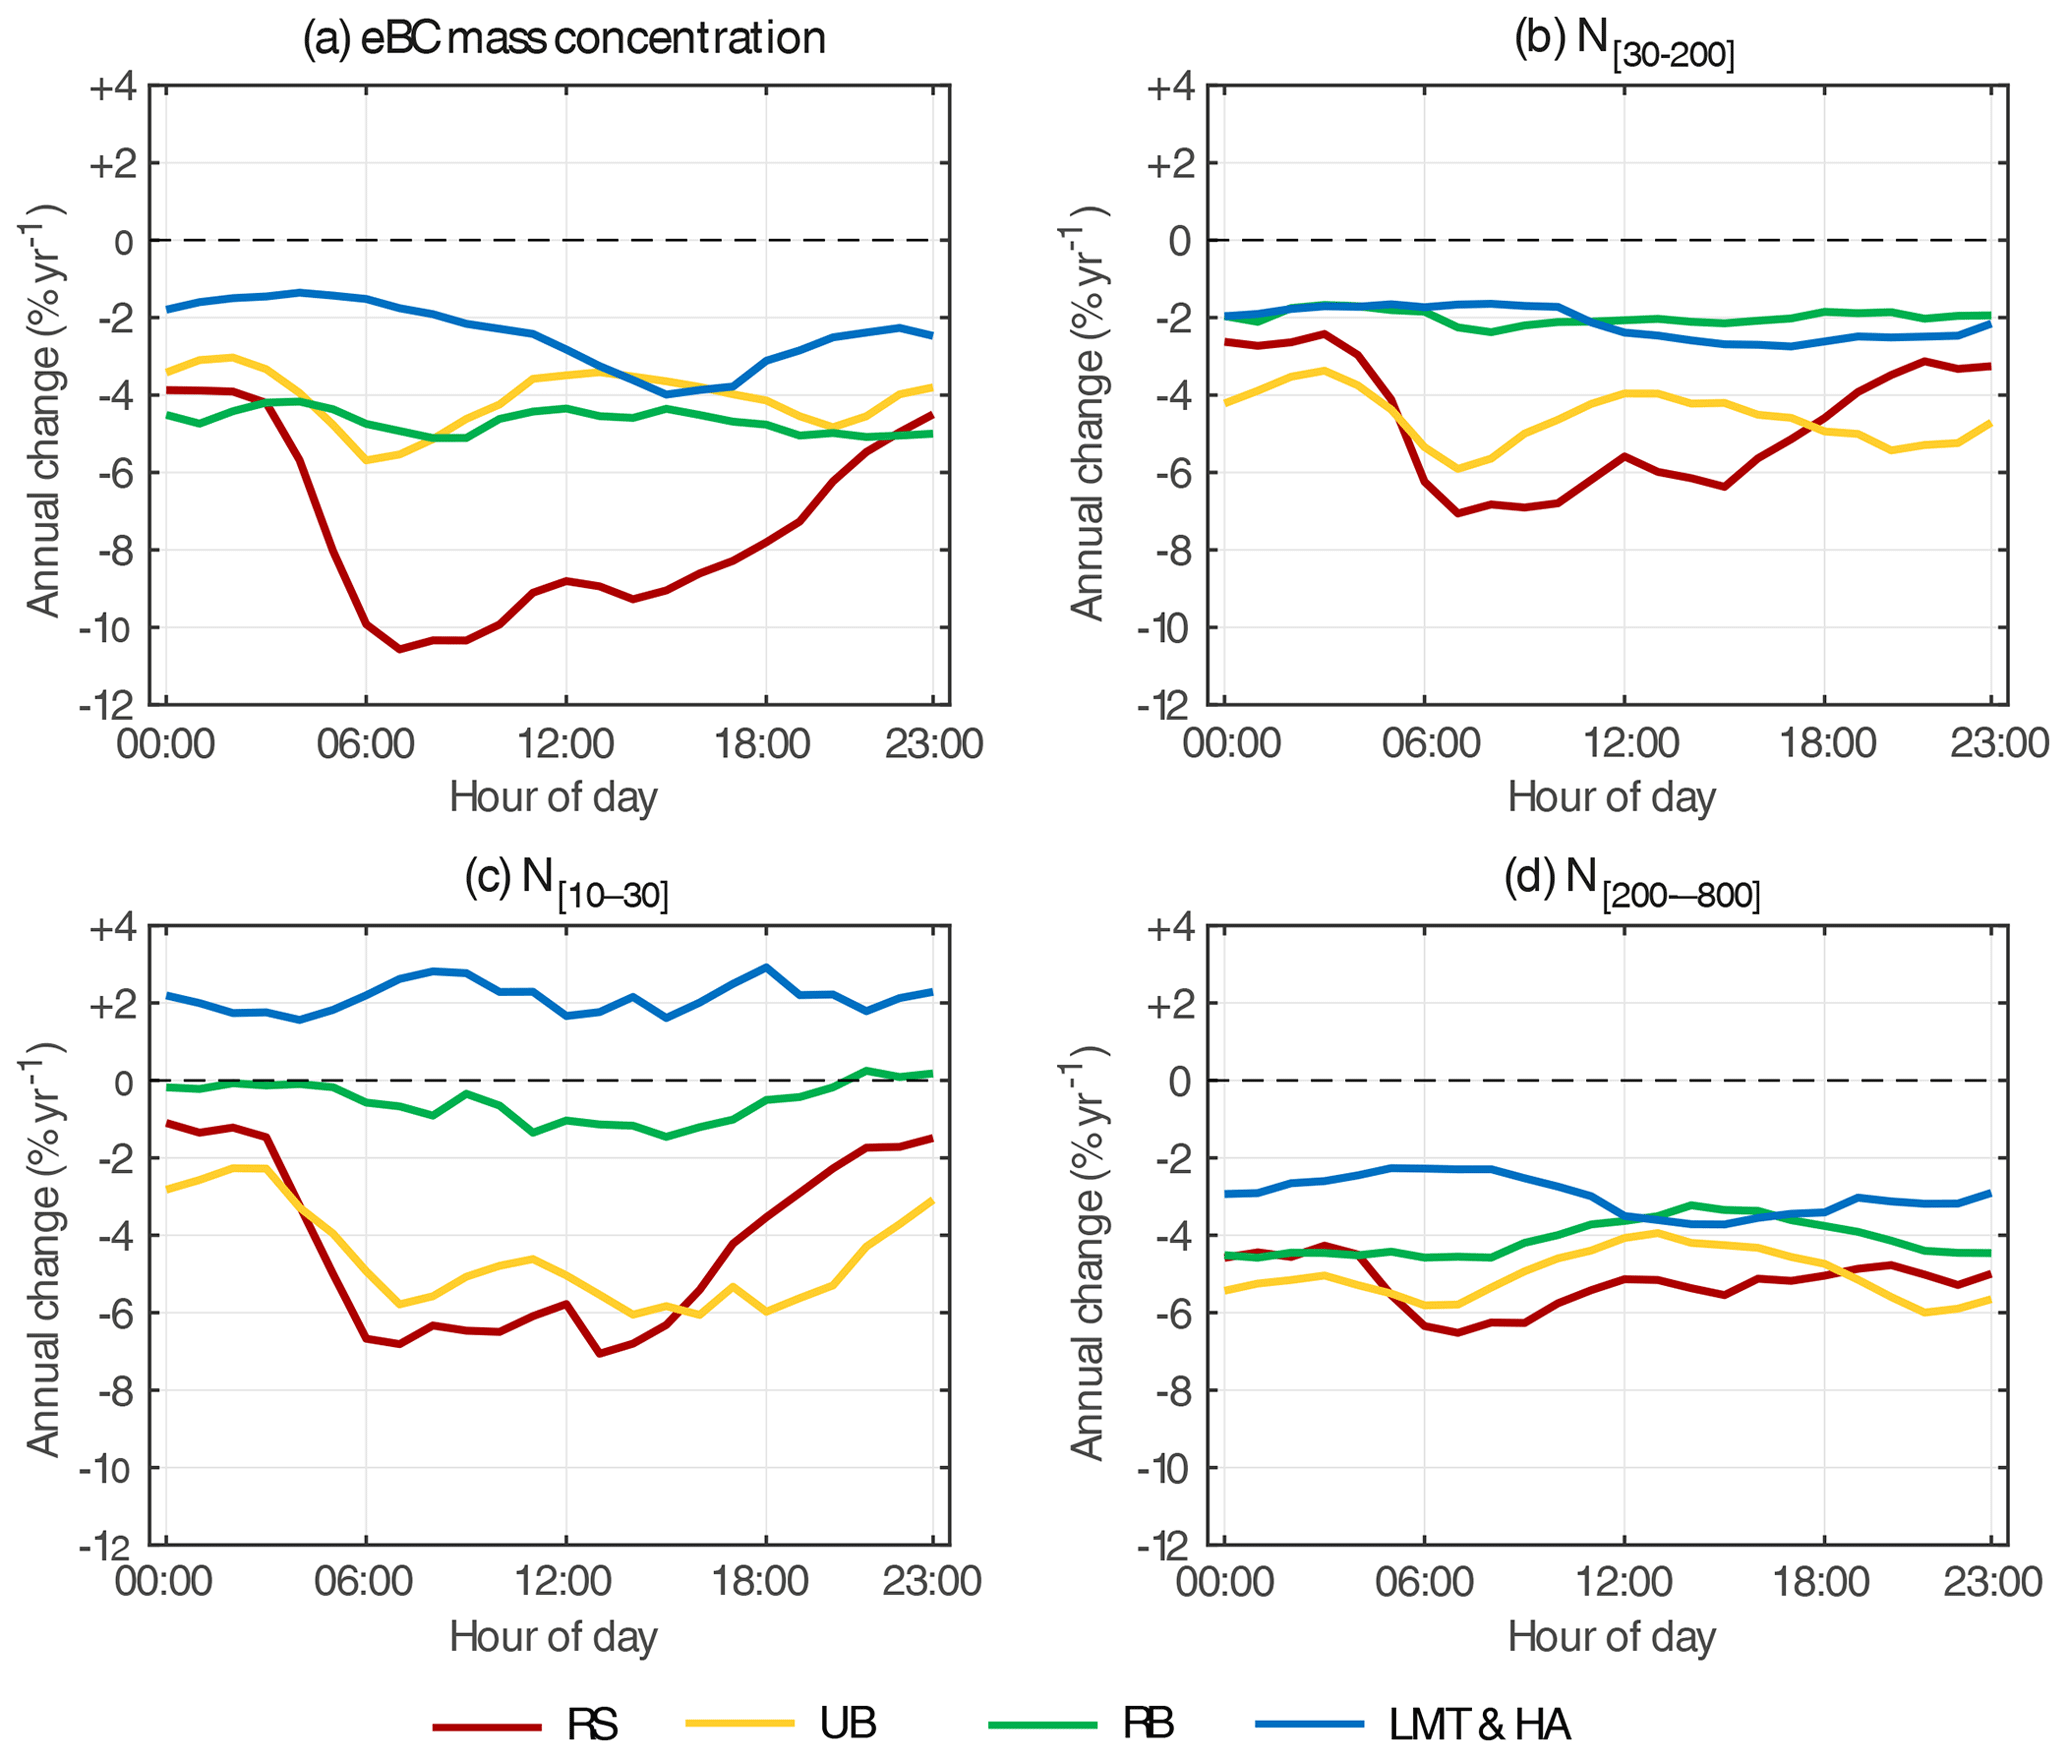
Figure 4Diurnal variations in the trends of PNCs and eBC mass concentration for the four site categories (RS: roadside; UB: urban background; RB: regional background; LMT&HA: low mountain range and high Alpine).
Figure 4 shows the Sen's slope of the measured PNCs and eBC mass concentration at each hour of day for each site category. To evaluate the diurnal trends, data pairs belonging to the same hour of day were selected for the calculation of Sen's slope. Figure 4 shows that all four parameters show distinct diurnal variations at the roadside and urban background sites. At the roadside sites, the decreases in eBC mass concentration, N[10−30], and N[30−200] are much stronger during daytime than during night-time. At the urban background sites, the diurnal trends also show a stronger decrease in the morning and evening. Such diurnal patterns are consistent with the diurnal variation in vehicle volume in the urban area where traffic emission is the dominant source of BC and UFP (Ma and Birmili, 2015). As shown in Fig. S2 in the Supplement, road transport contributes to the highest reduction in total emission of BC, PM2.5, and precursors NOx and NMVOC, from 2009 to 2017. Therefore, it can be concluded that the strong daytime reduction in PNCs and eBC mass concentration in the urban area is a result of the decrease in road transport emissions. In Germany, the government has made a great effort to reduce the emissions due to road transport. The 10th BimSchV (first issued in 1994 and entered into force of recast on 14 December 2010) regulates the emission requirement for petrol, diesel, and bio-diesel. And the 28th BImSchV (issued in 2004 and amended every year) regulates the type of engines for mobile machinery that can be marketed commercially, ensuring low emissions from new commercial vehicles. Meanwhile, the implementation of the European Emission Standard (EURO standards, https://en.wikipedia.org/wiki/European_emission_standards, last access: 18 September 2019) starting from the 1990s has significantly reduced the emissions from gasoline and diesel engines. Moreover, another regulation LEZ (35th BImSchV) has effectively reduced the traffic emissions by restricting highly polluting vehicles in defined areas in the city. Resulting from the above policies, the road transport emissions of BC, PM2.5, NOx, and NMVOC have significantly decreased from 2009 to 2017 as shown in Fig. S2. Our results confirm that the reduction in traffic emissions plays a main role in the decreasing trends of eBC mass concentration in Germany, especially in the urban area.
For regional background and low mountain range sites that are far from the road traffic and not directly affected by traffic emissions, trends of eBC mass concentration and PNCs do not show distinct diurnal patterns. However, downward trends are still visible, which stems mainly from the decrease in background concentration in the whole region caused by the reduction in emissions as shown in Fig. S2. For the low mountain range and high Alpine sites, trends of eBC mass concentration, N[30−200], and N[200−800] show weakly diurnal patterns with slightly more reduction in the afternoon. This is mainly because the high-altitude sites might have more chance to merge into the planetary boundary layer (PBL) in the afternoon, resulting in a much stronger influence of anthropogenic emissions.
It is interesting that at the roadside and urban background sites the trend of N[10−30] has a similar diurnal pattern as those for N[30−200] and eBC mass concentration, but at regional background and low mountain range sites they look quite different. At the regional background sites, N[10−30] shows a maximum average reduction rate of around −1.5 % per year in the afternoon but basically a zero trend during the night. New particle formation (NPF) is a dominant source of N[10−30] in the non-urban areas. Ma and Birmili (2015) reported that the annual average contribution of NPF to N[5−20] is 54 % at regional background sites. Also, the contribution of NPF has a diurnal pattern with higher levels in the afternoon and no influence during the night. Thus, the diurnal variations in N[10−30] trend at the regional background sites is likely to have resulted from the inter-annual changes in the regional NPF events. At the low mountain range sites, statistically insignificant positive trends are observed. One possible reason is that the low mountain range sites are far from emission sources of nucleation-mode particles (e.g. traffic), and NPF is also rare in these areas. Thus the trend of N[10−30] might be more influenced by meteorological conditions.
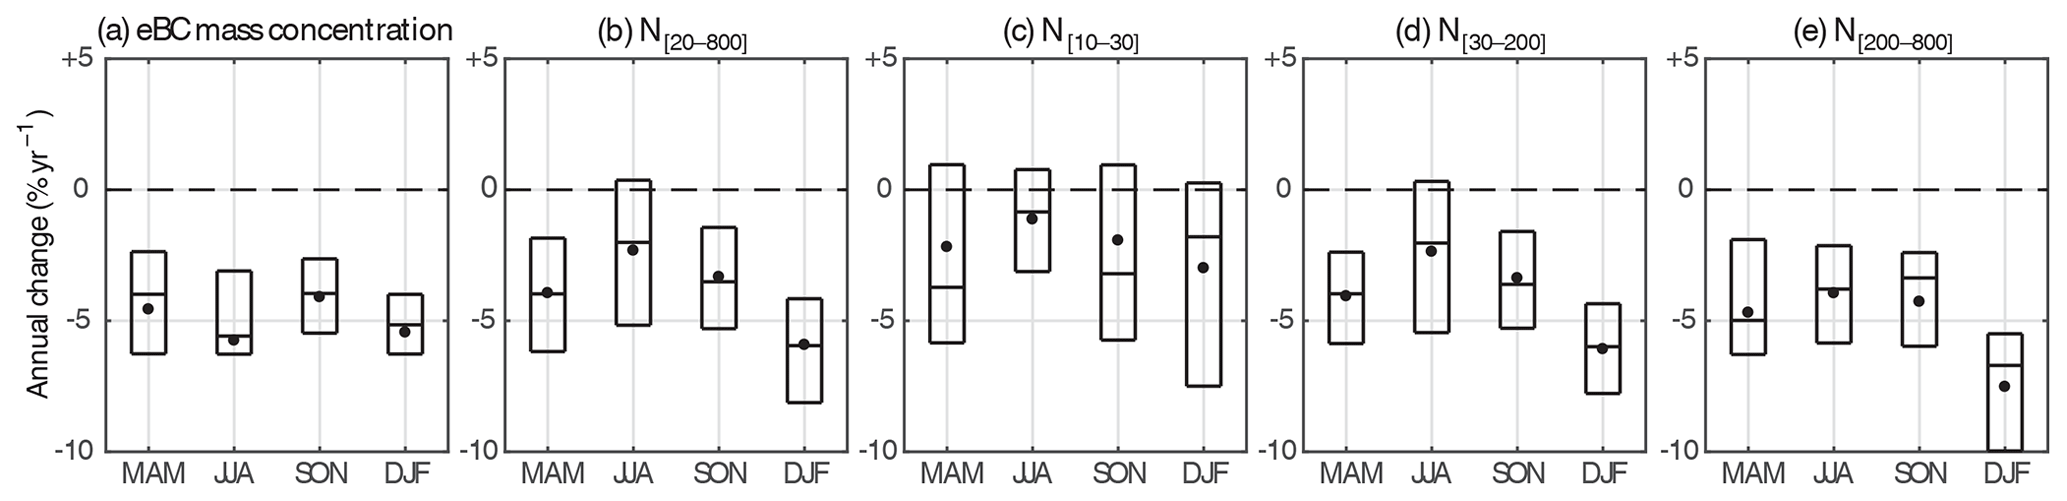
Figure 5Seasonal statistics of the trends of PNCs and eBC mass concentration. Dots denote the mean slope for all sites, the black line inside the box denotes the median slope, and the top and bottom of the box denote the 75th and 25th percentiles. Spring: March to May (MAM); summer: June to August (JJA); autumn: September to November (SON); and winter: December to February (DJF).
3.4 Seasonal variation in trends
Figure 5 shows the trends of the PNCs and eBC mass concentration for each season. In general, negative trends are found for the five parameters in all seasons. Similar seasonal trend patterns with stronger decreasing rate in winter are detected for all PNCs, which is likely to have been caused by factors that have strong seasonal variation such as domestic heating and/or meteorological conditions. The emission of domestic heating is much stronger during the cold season. The first BImSchV limited the emission for medium and small combustions (e.g. domestic heating). Although domestic heating (residential sector) contributes only a minor fraction of the total emission of BC, PM2.5, SO2, and NMVOC, its absolute decrease from 2009 to 2017 is large and comparable with other sectors (Fig. S2). The least decreasing rates in the PNCs were found in summer. Other than the low residential emission in warm seasons, another reason might be the strong seasonal variations in biogenic emissions (Asmi et al., 2013). Biogenic emissions contribute considerable secondary organic aerosol (SOA) precursors in summer and thus contribute more to PNCs. Without any strong long-term variation, the stable contribution of biogenic emissions to PNCs might lower the relative decreasing rates in PNCs in summer. No clear seasonal pattern could be observed for eBC mass concentration because its emission decrease is mostly contributed by the road transport that has no obvious seasonal variation. Long-term change of meteorological parameters might also affect the seasonal trends as well and will be discussed in Sect. 4.
3.5 Evaluation of low-emission zones
As discussed in the previous sections, the reduction in total emissions could be reflected directly in the long-term trends of the aerosol observation in Germany, suggesting that a long-term observation network with different types of site is an effective tool to verify the effectiveness of emission control policies. However, the observed decrease in trends is a combined result of the various emission mitigation policies. A question raised is whether such a long-term observation network can reflect the effect of a specific emission mitigation policy. LEZ is believed to be a good candidate for such an evaluation for several reasons. Firstly, LEZ usually has a clear introduction date in each city. Secondly, traffic emissions are the major source of aerosol particles in the urban area. Thirdly, traffic emission sources are basically evenly distributed in the urban area, and therefore their contribution of particulate matter in the urban area will not be strongly influenced by wind direction. In this section, we will analyse the effects of two LEZs in the urban area based on our dataset.
LEZ is an urban access regulation in Europe and is one of the key ways to reduce traffic emissions in urban areas. In Germany, high-, medium-, and low-emitting vehicles are required to be marked with red, yellow, or green colour stickers on the front window shield. The green sticker denotes the diesel vehicles with at least EURO 4 or EURO 3 standard engines with a particular filter and petrol vehicles meeting at least the EURO 1 standard. Vehicles with green stickers have the lowest emissions and can enter all LEZs. Vehicles with other stickers, meaning higher emissions, are restricted. In Germany, the first LEZ was launched in 2008 in Berlin. As of November 2019, LEZs are implemented in over 60 cities. Short-term studies have shown that LEZ can immediately reduce the pollutant levels after the implementation (Rasch et al., 2013; Qadir et al., 2013; Jones et al., 2012).
We select two cities that have implemented LEZs in 2009–2018 and have measurements of both PNCs and eBC mass concentration: Leipzig and Augsburg. Figure 6 illustrates the de-seasonalised time series of monthly averaged parameters measured at the two urban background sites AUG and LTR, by subtracting the seasonal cycle from the mean monthly time series. The horizontal dashed lines in Fig. 6 denote the mean values with respect to different LEZ stages. In Augsburg, the first, second, and third stages of the LEZs were implemented respectively on 1 July 2009 (red dashed line), 1 January 2011 (yellow dashed line), and 1 June 2016 (green dashed line). Figure 6a and b show that the eBC mass concentration and N[30−200] gradually decreased after the implementation of each of the new stages of LEZs. And the differences between the concentration levels at different stages are statistically significant at the 95 % significance level. However, the difference between stages 2 and 3 is relatively negligible. A possible reason is that the third stage of LEZs came into force in June 2016 in Augsburg. By June 2016, around 52 cities in Germany had already implemented the third stage of LEZs, which accelerates the fleet update in the whole country (also in Augsburg). Thus, no large difference could be seen between the second and third stages of LEZs in the city of Augsburg. It is worth noticing that even with the seasonal variation subtracted from the time series, the amplitude of short-term variations in eBC mass concentration and N[30−200] is still very large mostly due to variations in meteorological conditions. Sometimes it is even larger than the concentration decrease caused by the implementation of LEZs. This indicates that short-term measurement might be influenced largely by the variations in meteorological conditions, and long-term measurements are necessary for a trustworthy verification of LEZs.
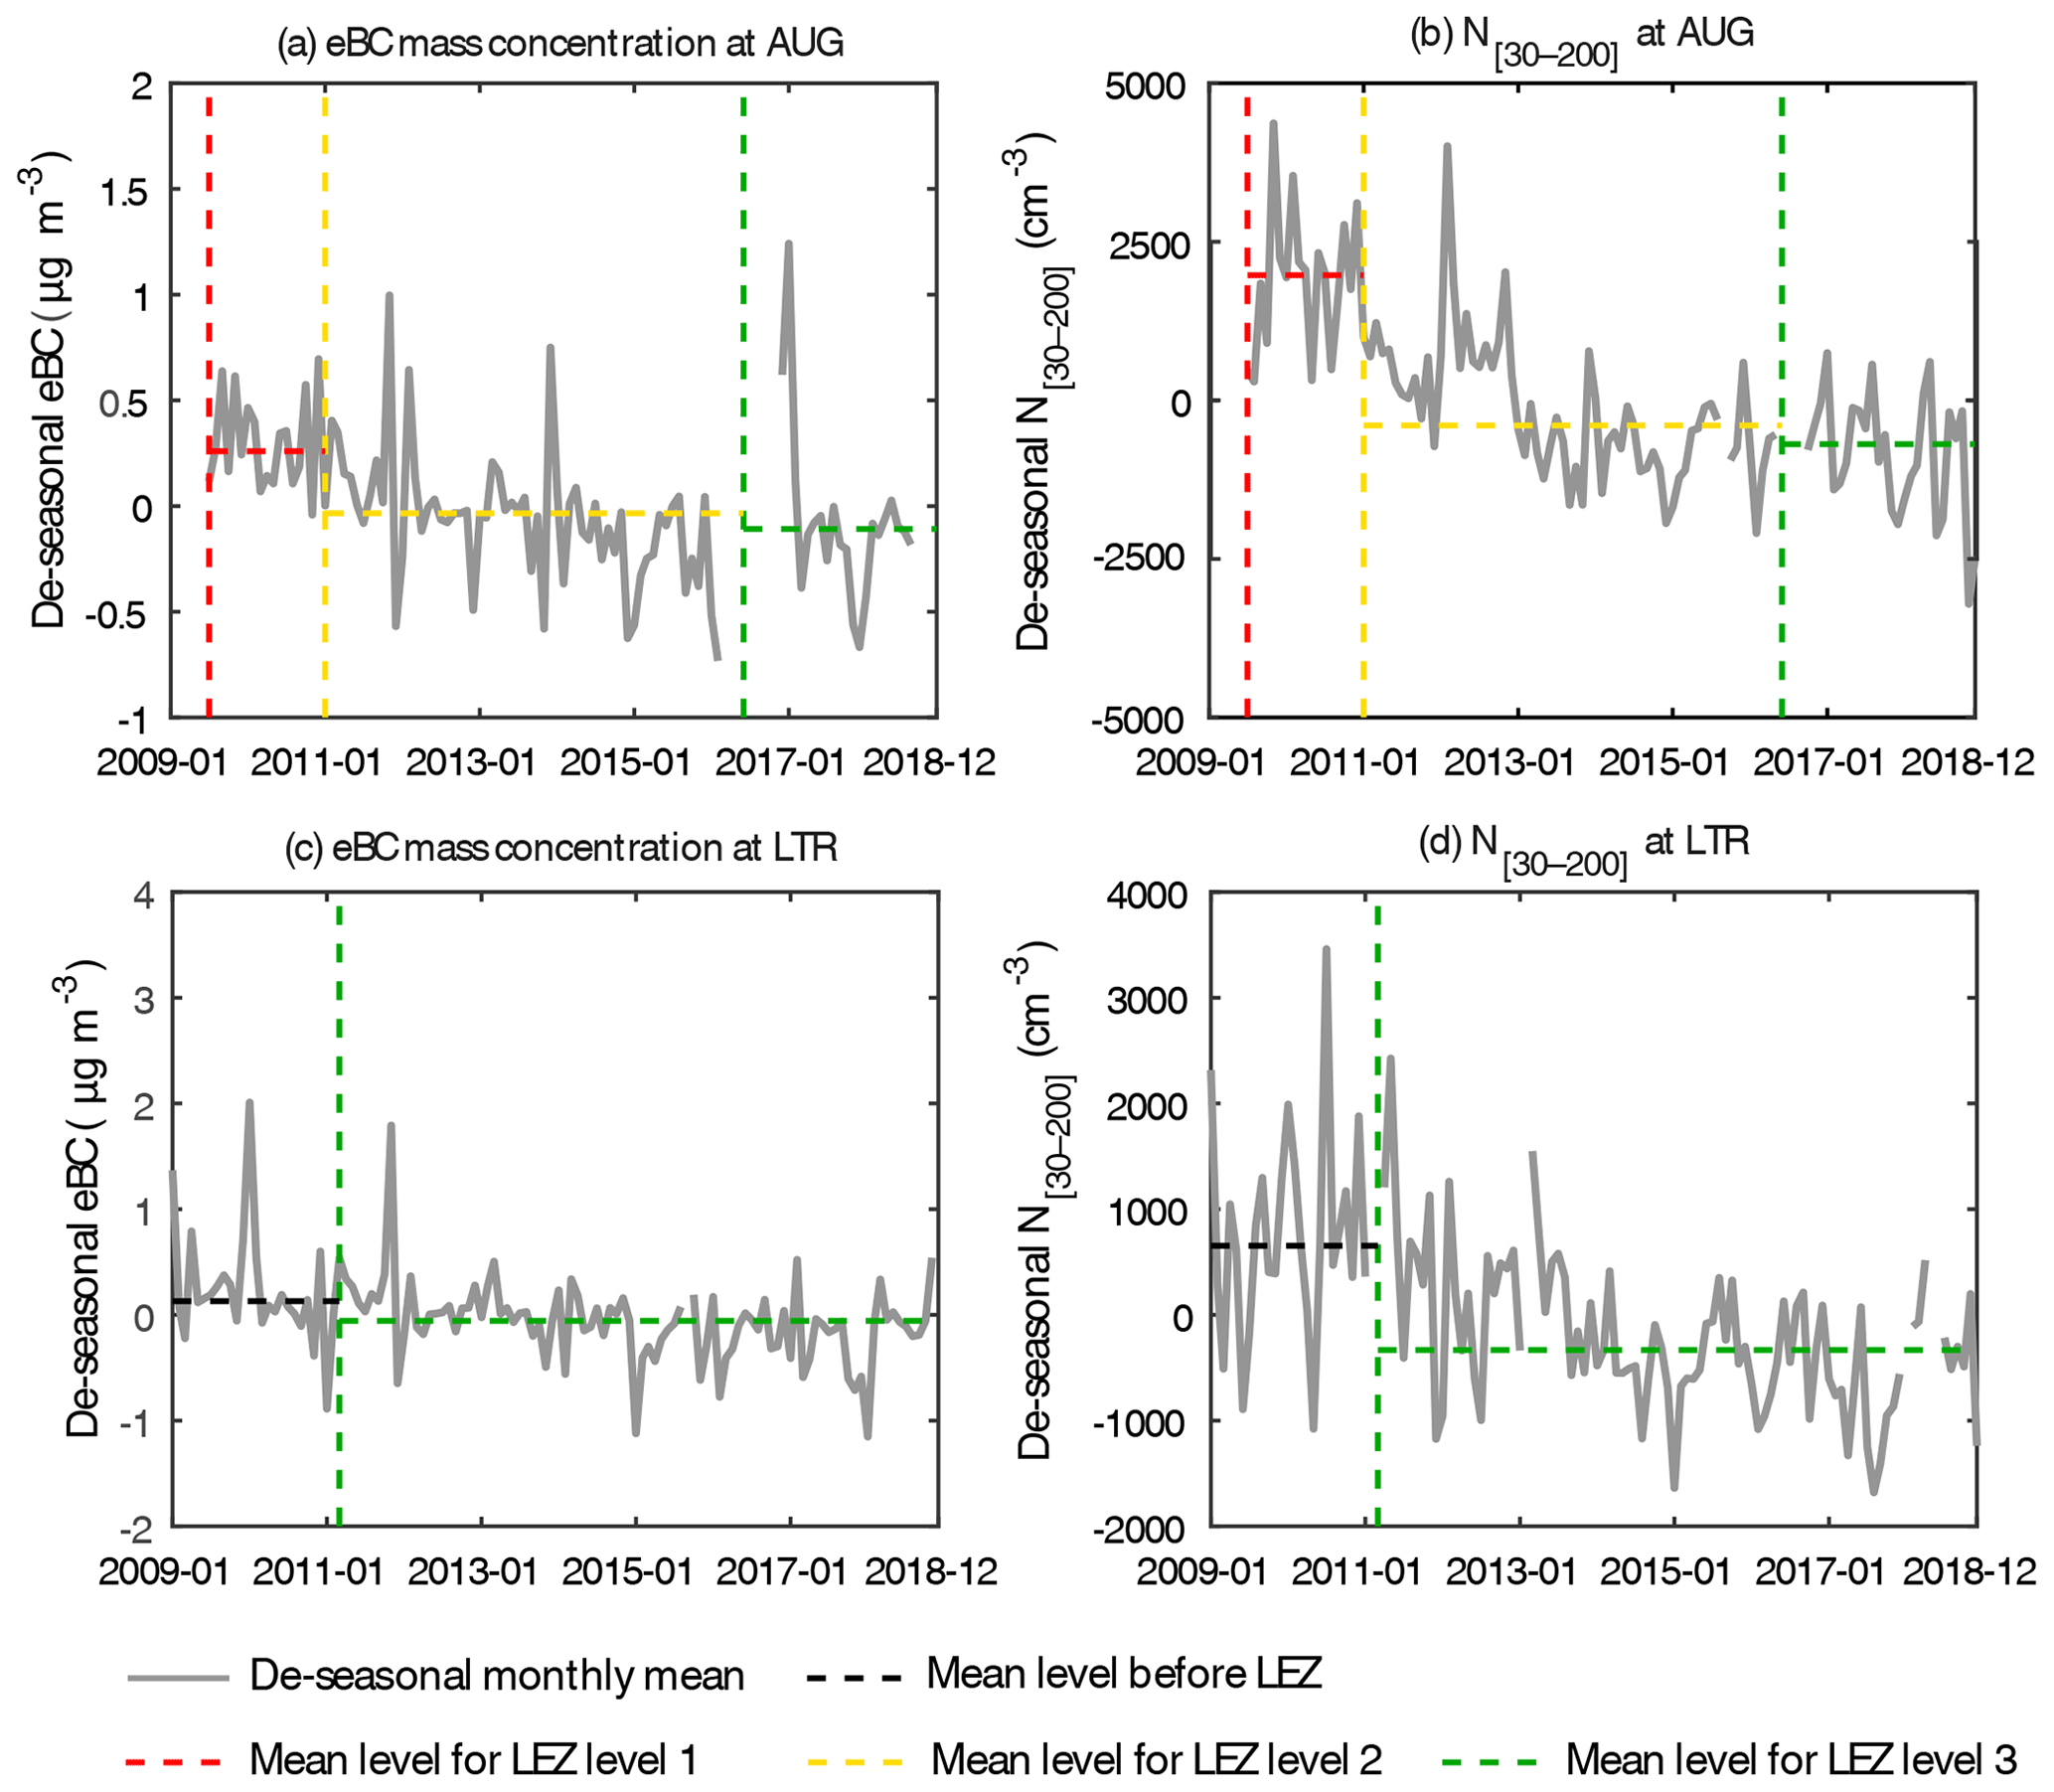
Figure 6De-seasonalised monthly time series of eBC mass concentration and N[30−200] at the two urban background sites AUG and LTR. The vertical dashed lines refer to the start dates of different stages of LEZs in the city of Augsburg and Leipzig. The horizontal dashed lines refer to the mean concentration levels of measured parameters during the corresponding time period.
The LEZ was entered into force in the city of Leipzig directly at the third level on 1 March 2011. Statistically significant differences are found between the concentration levels before and after the implementation of LEZs for both N[30−200] and eBC mass concentration. But the decrease in N[30−200] after 2010 (Fig. 6c) is much larger than that in eBC mass concentration (Fig. 6d). In Leipzig, the PNCs and eBC mass concentrations were measured at both roadside and urban background sites simultaneously, which provides us the possibility to directly detect the traffic contribution by evaluating the increment of the aerosol concentration (the difference of the concentrations between the traffic and the background sites). The effects of background variation, other sources, and meteorological factors can be ignored. Figure 7 illustrates the annually averaged diurnal cycles of the increments of eBC mass concentration (ΔeBC), N[30−200] (ΔN[30−200]), and N[200−800] (ΔN[200−800]). Before and after the implementation of LEZ (2010 and 2011), the increments show a sudden decrease of up to 40 % during daytime. The average ΔeBC, ΔN[30−200], and ΔN[200−800] during working hours (06:00 to 18:00 local time) in 2010 are respectively about 1.63, 1.33, and 1.58 times higher than those in 2011. After 2011, these aerosol variables continued to decrease, mainly due to the continuous update of the vehicle fleet. This result suggests that with a multiple-site network, the effect of emission control policy could be better detected from the increments between near-source and background sites.
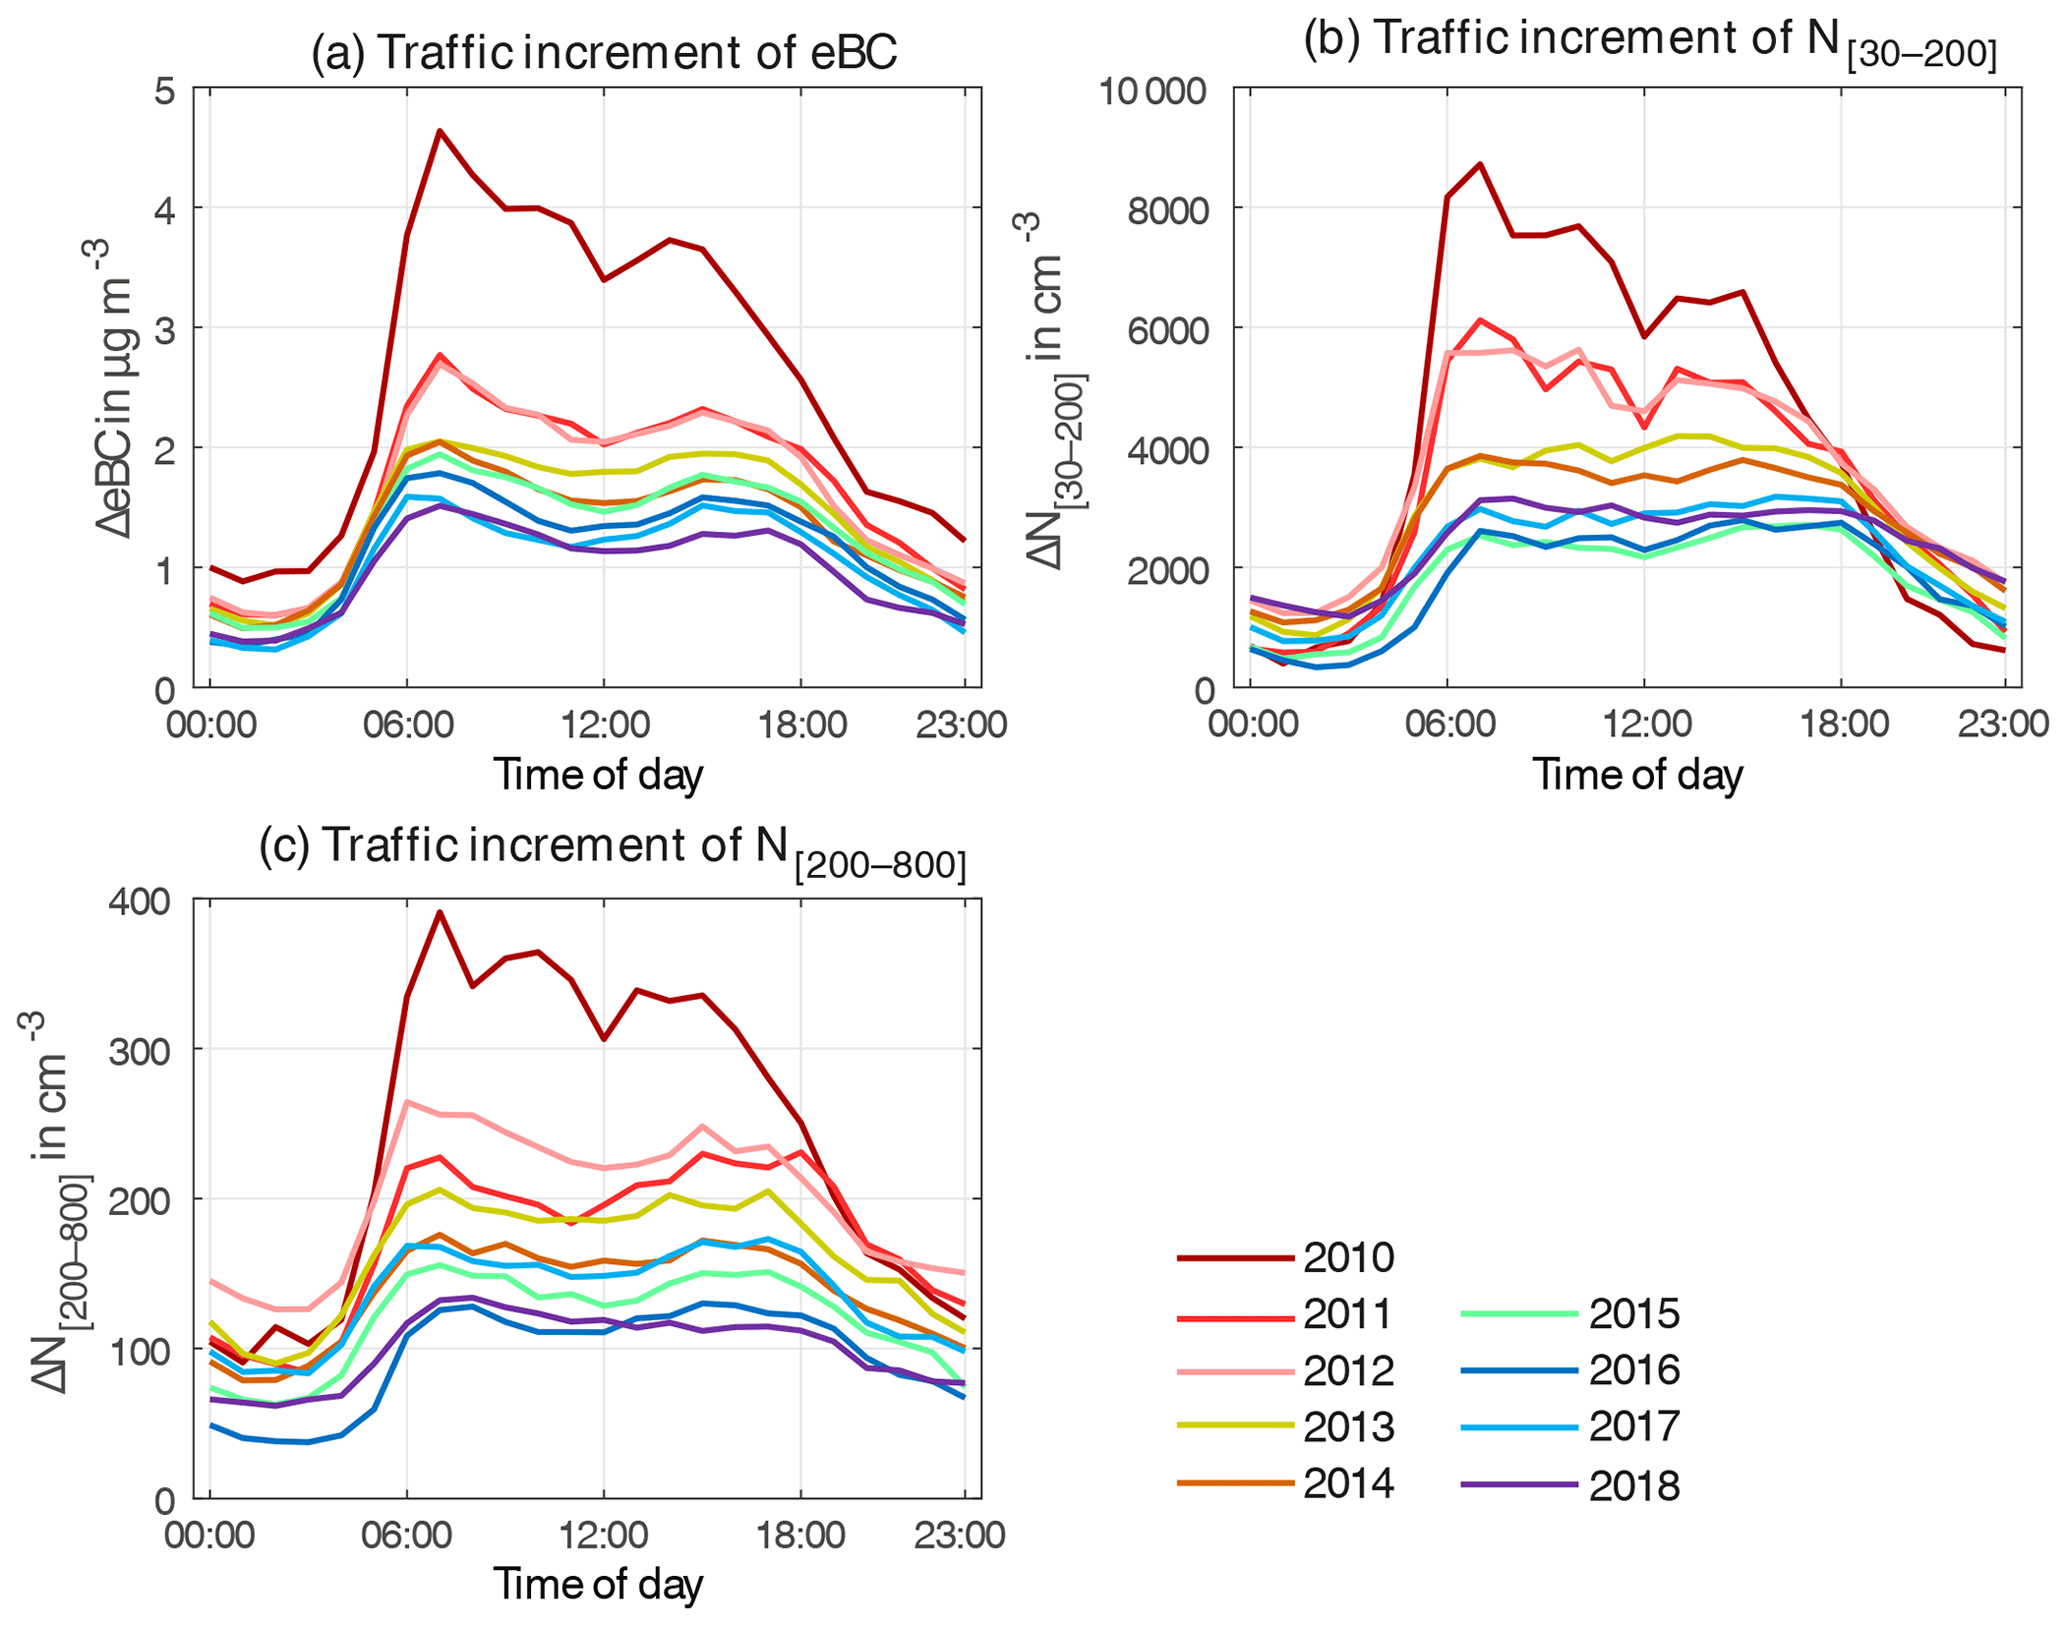
Figure 7Average diurnal cycles of the increment of eBC mass concentration (ΔeBC, panel a), N[30−200] (ΔN[30−200], panel b), and N[200−800] (ΔN[200−800], panel c).
Meteorological conditions also influence the concentration of aerosol particles (Birmili et al., 2001; Spindler et al., 2013; von Bismarck-Osten et al., 2013; Hussein et al., 2006), and their inter-annual changes might modify the trends of the parameters studied. In this section, the potential influence of meteorological conditions, including precipitation, temperature, wind speed, and air mass types, is discussed.
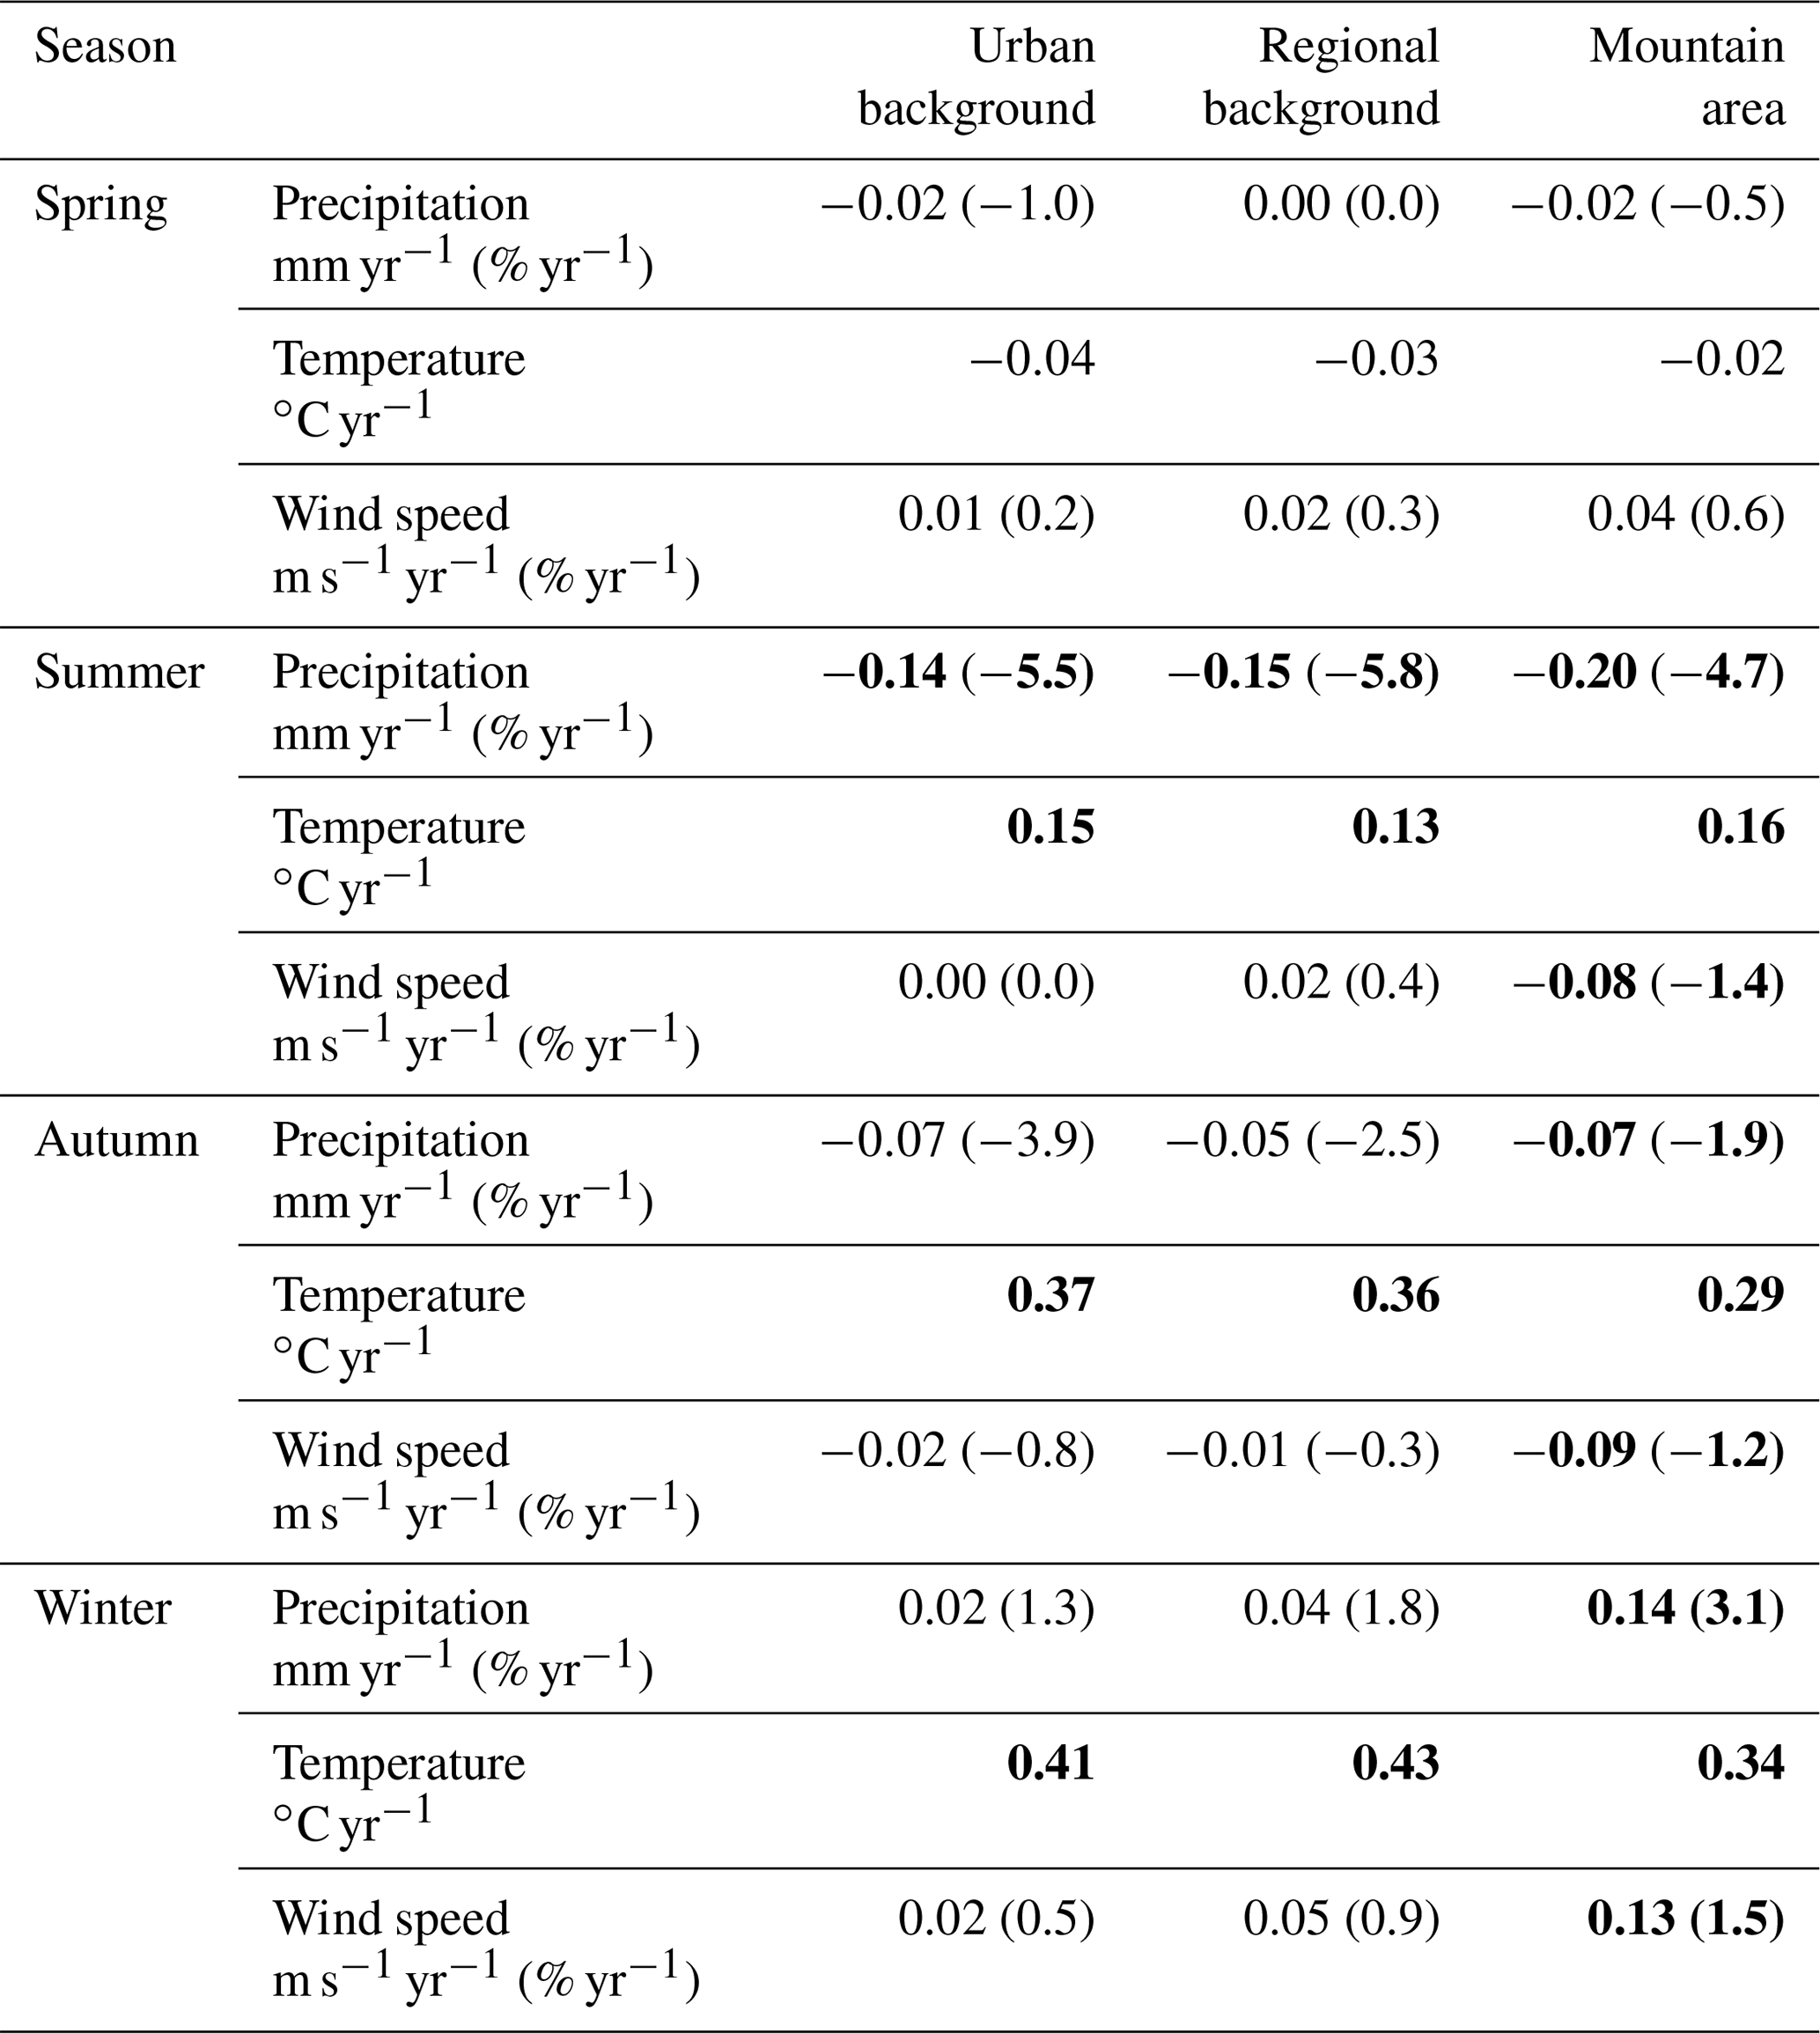
Table 5Trends of meteorological parameters for the three site categories in Germany. The bold numbers are the statistically significant slopes at the 95 % significance level. The daily meteorological data are from Germany's National Meteorological Service (Deutscher Wetterdienst, DWD).
4.1 Influence of precipitation, temperature, and wind speed on the detected trends
Table 5 provides the long-term trends of precipitation, ambient temperature, and wind speed in 2009–2018 based on the 76 measuring sites distributed all over Germany. The trends of the parameters were evaluated by the customised Sen's estimator. The data were obtained from Germany's National Meteorological Service (Deutscher Wetterdienst, DWD). The 76 DWD sites are grouped into three categories: urban background, regional background, and mountain area. The trends in all three meteorological parameters agree well among the three categories. Temperature shows a negligible change in spring, a slight increase in summer, and a larger increase up to 0.43 ∘C per year in autumn and winter. Increased temperature during cold seasons might have led to lower anthropogenic emissions from domestic heating and power generation and further led to a decrease in PNCs and eBC mass concentrations. Precipitation presents a s.s. decreasing trend up to about −6 % per year in summer, which might inhibit the wet deposition of aerosol particles and diminish the reduction of eBC mass concentrations and N[200−800] to a certain extent. No obvious trend is observed in wind speed. In summary, increased ambient temperature might contribute to the decrease in the PNCs and eBC mass concentrations shown in Sect. 3.1 and 3.4 by indirectly influencing anthropogenic emissions. Meanwhile decreased precipitation in summer might diminish the decrease in the PNCs and eBC mass concentration by inhibiting aerosol wet deposition.
4.2 Influence of air mass condition on the detected trends
Synoptic-scale air mass condition, including origin region and pathways, is an important factor driving regional pollutant concentration (Ma et al., 2014; Hussein et al., 2006). Atmospheric stability is also important as it dominates the vertical dilution of pollutants. Based on a self-developed back-trajectory cluster method (BCLM), the influences of the inter-annual changes in air mass conditions and atmospheric stability on the detected trends are investigated.
BCLM is based on a joint cluster analysis considering air mass backward trajectories, profiles of pseudo-potential temperature, and PM10 mass concentration over Germany (Birmili et al., 2010; Engler et al., 2007; Ma et al., 2014). In BCLM, 15 air mass types are defined to represent different meteorological conditions on the scale of Germany. Detailed information about data preparation, cluster processing, and the data procedures and data products is described in Sect. S3 and in Ma et al. (2014). Figure 8 shows the average trajectories and the normalised profiles of pseudo potential temperature (θv) for the 15 air mass types. The 15 air mass types are named by season (CS: cold season; TS: transition season; and WS: warm season) and synoptic pattern (ST: stagnant; A1: anticyclonic with air mass originating from eastern Europe; A2: anticyclonic with air mass originating from the west; C1: cyclonic with air mass originating from relatively south; C2: cyclonic with air mass originating from the north). Table 6 lists the basic statistical information of the 15 air mass types.
Table 6Basic statistical information of the 15 air mass types.
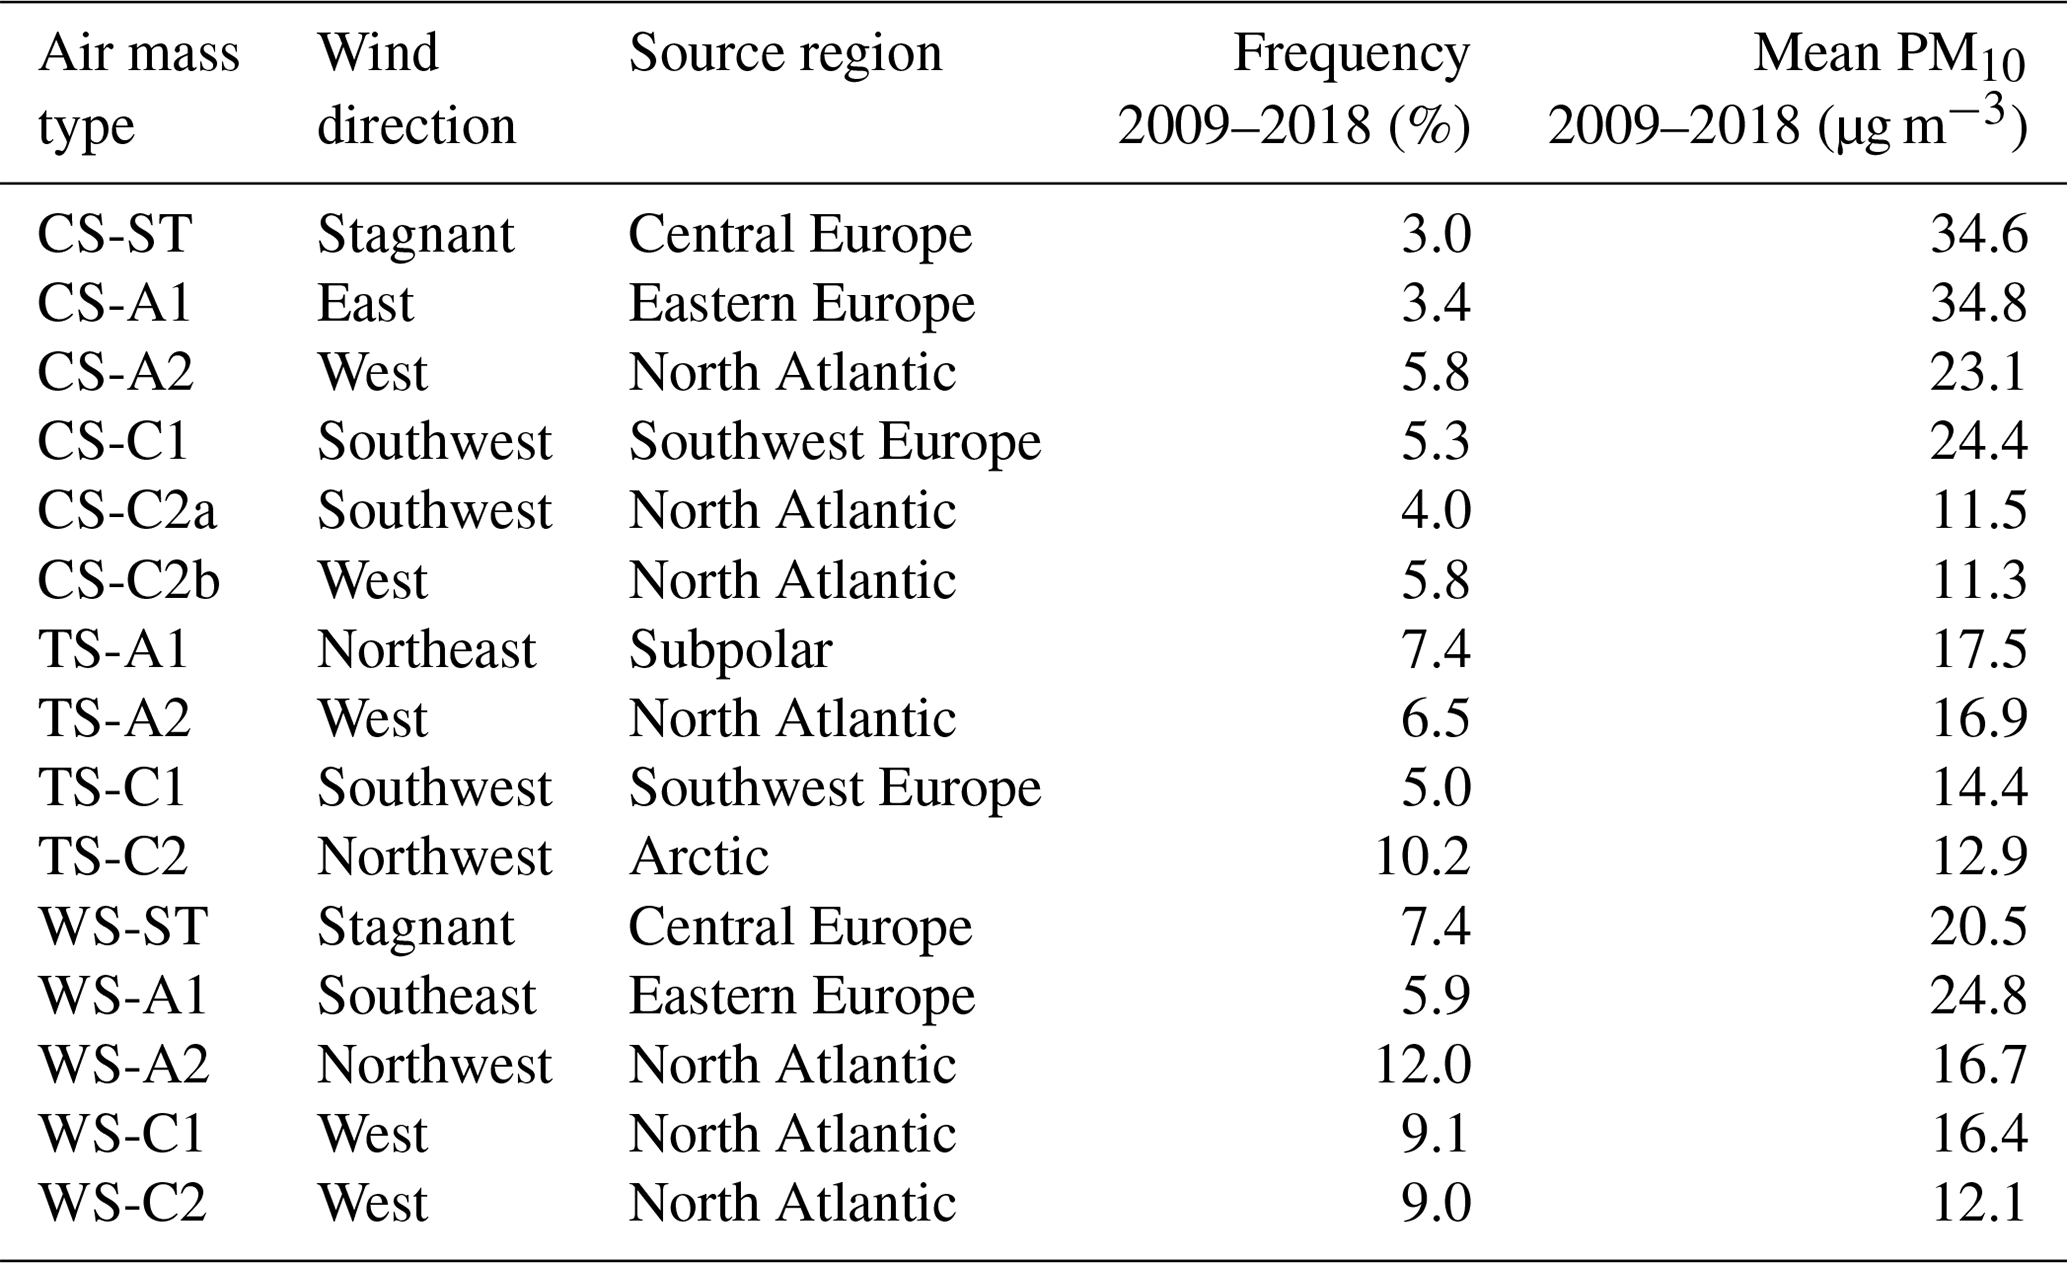
Figure 9 illustrates the statistics of PNCs and eBC mass concentrations for each air mass type at the regional background site category (MEL, WAL, and NEU). Large differences in the mean values of N[200−800] and eBC mass concentrations are observed among different air mass types; whereas N[10−30] and N[30−200] show less significant difference, N[10−30] and N[30−200] represent more local information and are not as sensitive as N[200−800] and eBC mass concentration. In the following discussion, only N[200−800] and eBC mass concentration are used.
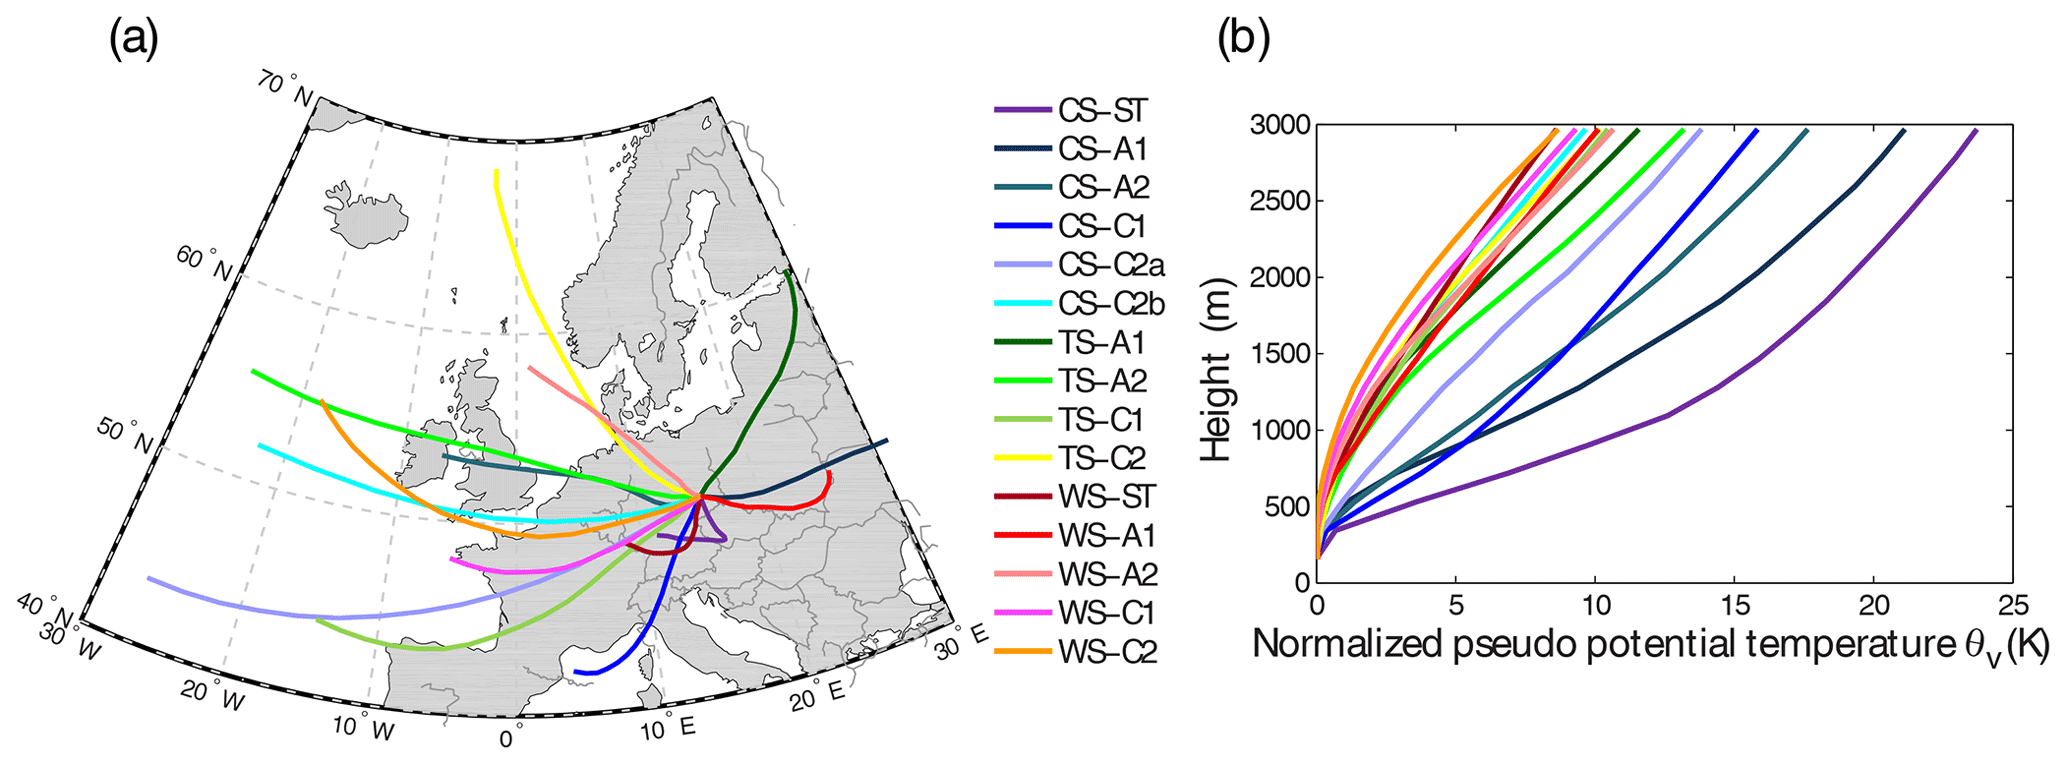
Figure 8(a) The 15 back-trajectory clusters terminated at MEL. (b) Average normalised profiles of pseudo potential temperature (θv) for the 15 clusters.
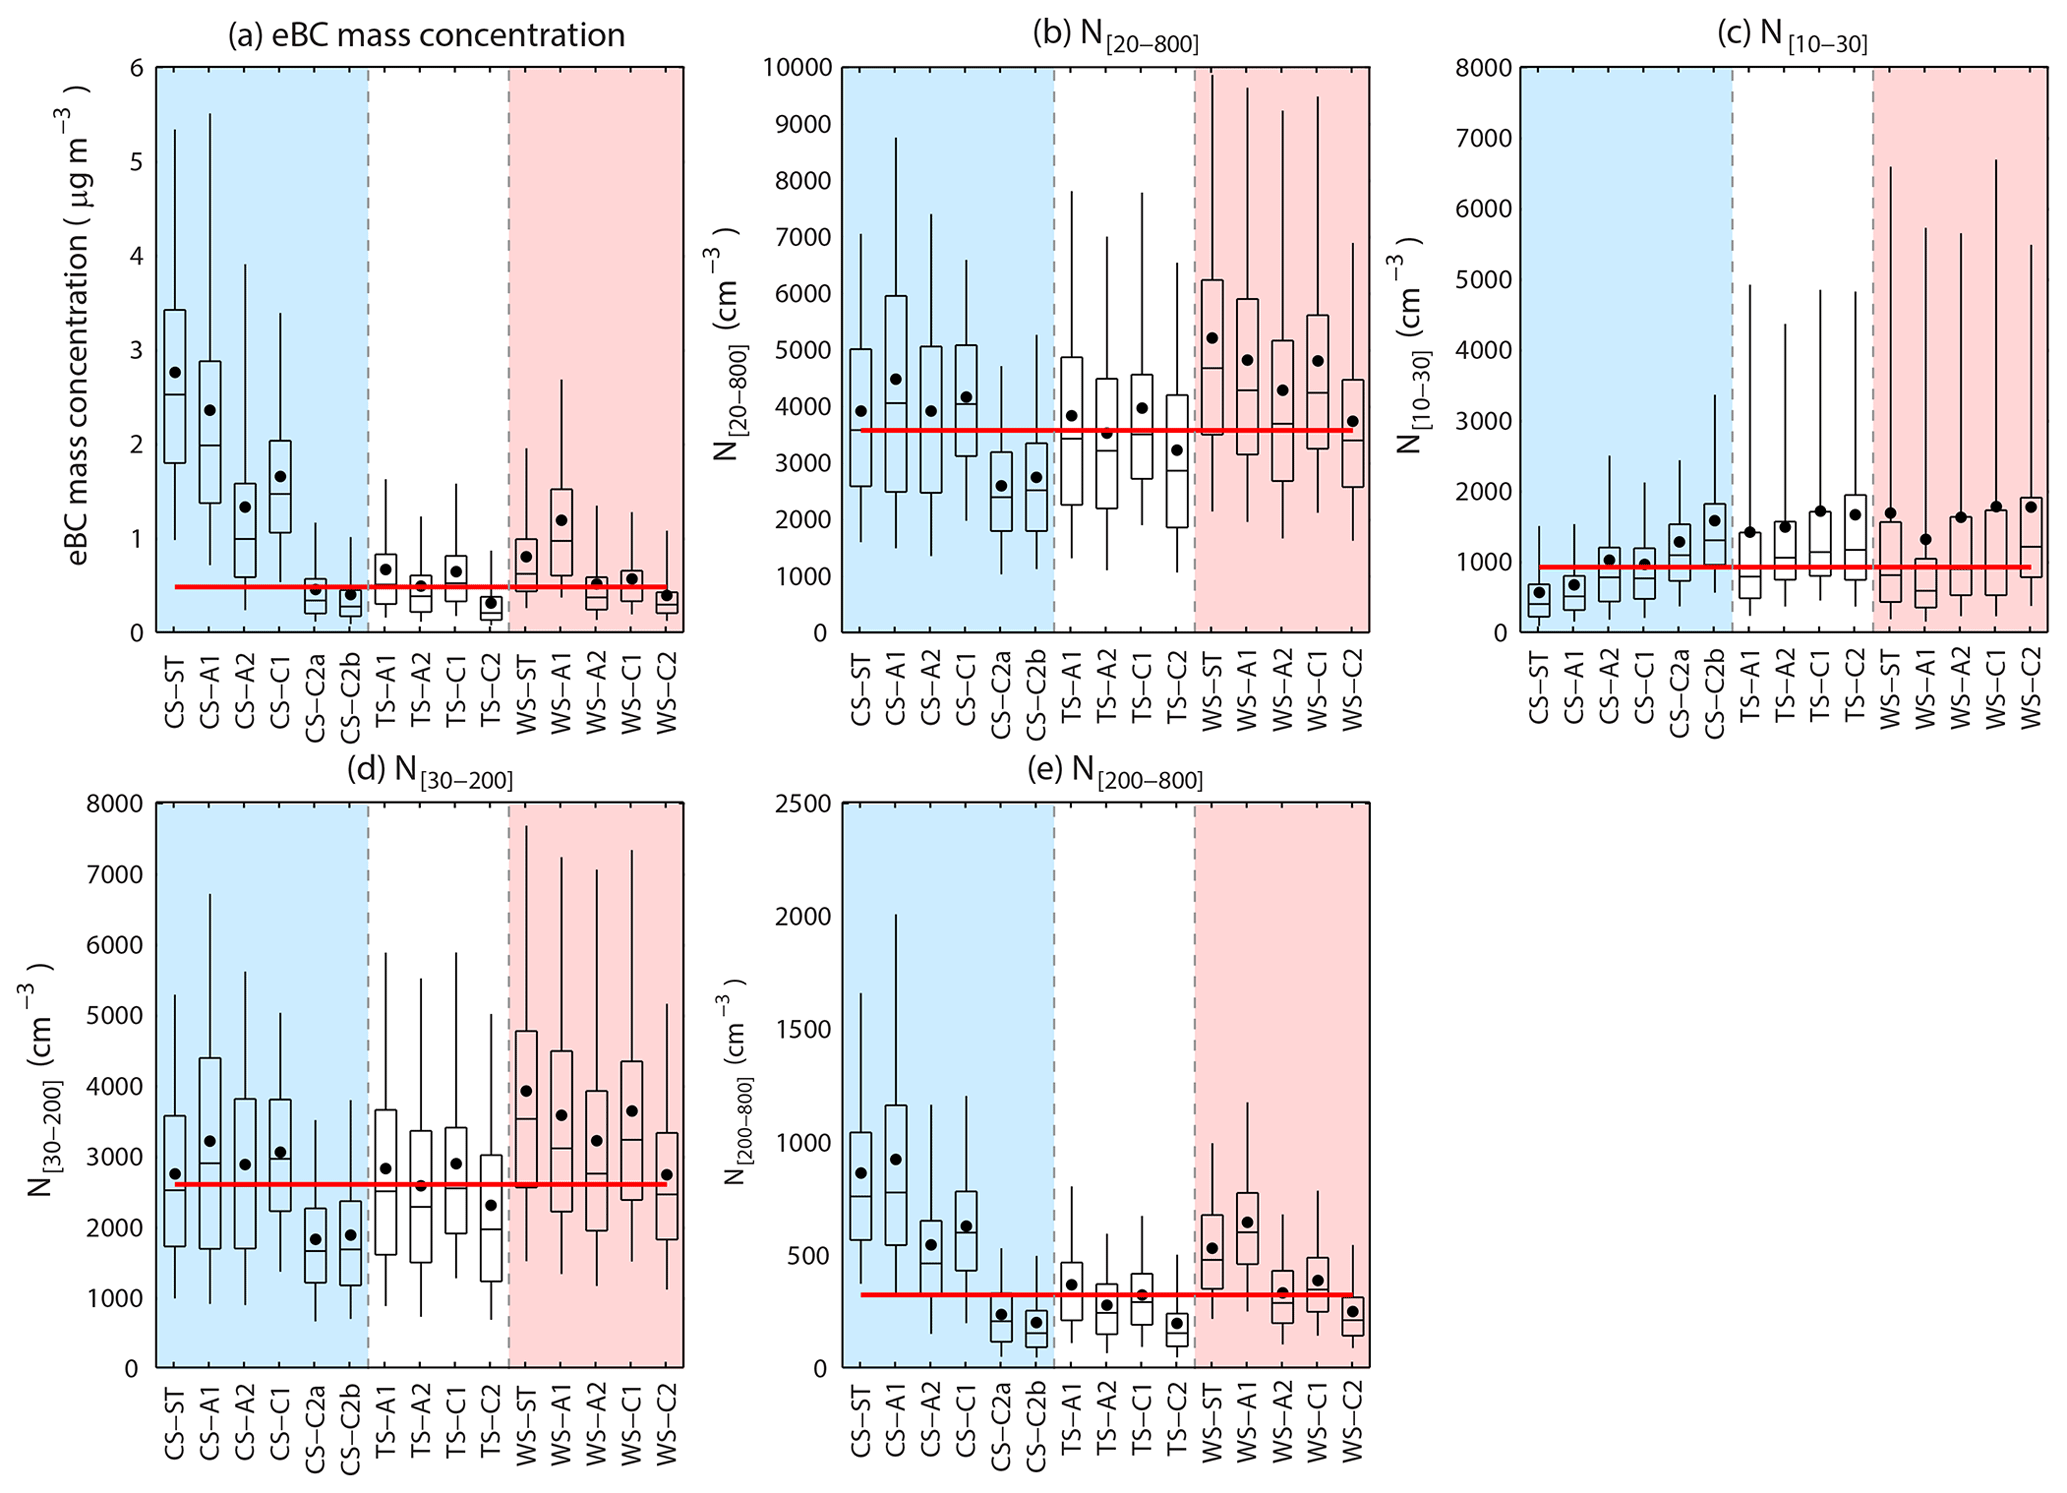
Figure 9Average eBC mass concentration (a) and PNCs (b–e) for the 15 air mass types at the regional background sites (MEL, WAL, and NEU). In each panel, the boxes and whiskers denote the 5th, 25th, 50th, 75th, and 95th percentiles, while the dots denote the mean values. The solid red line shows the overall median values.
Due to the high sensitivity of N[200−800] and eBC mass concentration to the air mass types, frequency changes of air mass types might lead to changes in their long-term trends. However, it is difficult to investigate the influence for each air mass type since the frequencies of the air mass types are quite low (3.0 % to 12.0 %). Therefore, the 15 air mass types are grouped into two categories according to pollution level. If both the median eBC mass concentration and N[200−800] are higher than their overall median concentration, the air mass is grouped into the polluted air mass category, and vice versa.
-
The polluted air mass category includes CS-ST, CS-A1, CS-A2, CS-C1, TS-A1, WS-ST, WS-A1, and WS-C1.
-
The cleaner air mass category includes CS-C2a, CS-C2b, TS-A2, TS-C1, TS-C2, WS-A2, and WS-C2.
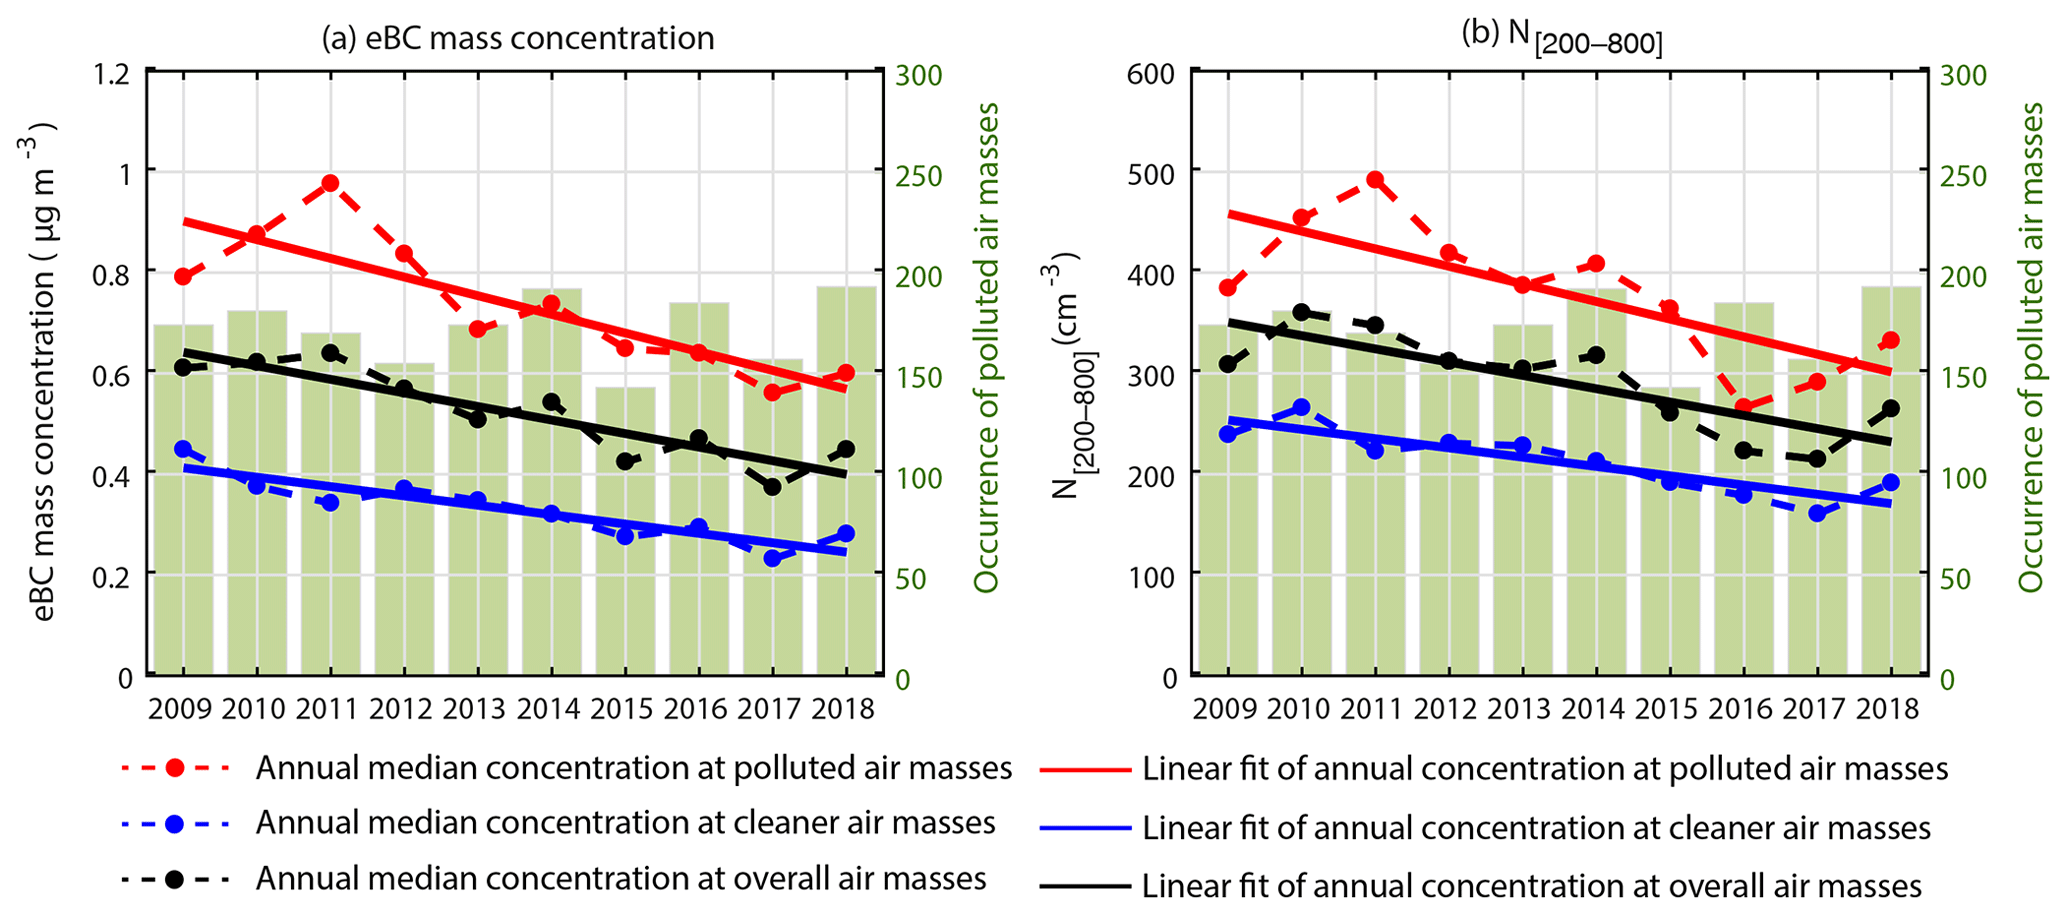
Figure 10Annual average eBC mass concentration and N[200−800] measured at the regional background and low mountain range sites for the polluted and clean air mass categories. Green bars show the frequency of polluted air masses in each year.
The annual occurrence of the polluted air mass category together with the annul mean values of N[200−800] and eBC mass concentration at the regional background and low mountain range sites are shown in Fig. 10. No clear trend of the occurrence of polluted air mass category could be found. However, a large difference is visible in the occurrences between different years. If the change in air mass frequency plays an important role in the variations in N[200−800] and eBC mass concentration, low polluted air mass occurrences should be associated with relatively low N[200−800] and eBC mass concentration. However, such a relationship is not visible in Fig. 10. The annual mean values of N[200−800] and eBC mass concentration (black lines in Fig. 10) decrease consistently. Therefore, it could be concluded that the inter-annual changes in synoptic-scale air mass conditions are not the reason for the decrease in pollutant concentrations shown in Sect. 3.
In this study, long-term trends of atmospheric PNCs and eBC mass concentration over a 10-year period (2009–2018) are determined for 16 sites in the GUAN, ranging from roadside to high Alpine environments. Overall, statistically significant decreasing trends are found for 85 % of the parameters and observation sites. Concretely, the annual slope of the eBC mass concentration varies between −13.1 % and −1.7 % per year. The slopes of the PNCs vary from −17.2 % to −1.7 %, −7.8 % to −1.1 %, and −11.1 % to −1.2 % per year for the 10–30, 30–200, and 200–800 nm size ranges, respectively. The regional Mann–Kendall test yields regional-scale trends of eBC mass concentration, N[30−200], and N[200−800] of −5 %, −2.5 %, and −2.9 % per year, respectively, indicating an overall decreasing trend in sub-micrometre PNC (except N[10−30]) and eBC mass concentration all over Germany.
Comparing the trends of measured parameters with the long-term change in total emission, we believe that the observed trends of PNCs and eBC mass concentrations are mainly due to the emission reduction. The decreasing trend of eBC mass concentration agrees well with the variation in BC total emission in Germany, suggesting reduction in emissions is the dominant factor for the reduction in eBC mass concentrations over the country. The decreasing rates of N[30−200], N[200−800], and V[20−800] are stronger than the decrease in the total emissions of all precursors and PM2.5, which could have been caused by the highly complex and non-linear processes of secondary aerosol formation.
The highest decrease in eBC mass concentration was observed during daytime at the roadside and urban background, implying a strong evidence of reduced traffic emissions in the urban area. When there are fewer motor vehicles at night, the PNCs and eBC mass concentration at the urban sites also show a significant decrease, which could be due to the background concentration decrease caused by the reduction in other emissions such as domestic heating, industry, etc. Stronger reductions in PNCs are found in winter, which is likely to be caused by the decreased emissions from domestic heating combustion.
Meteorological conditions are also able to influence the temporal variation in aerosol concentration. The inter-annual changes in precipitation and temperature might have some influence on the detected trends by indirectly influencing anthropogenic emissions and inhibiting aerosol wet deposition, but they seem to be not the dominant factors for the long-term decrease in the measured parameters. The influence of long-range transport pattern is also evaluated, and the inter-annual changes in synoptic-scale air mass conditions are found to not be the reason for the decrease in pollutant concentrations.
This study suggests that a combination of emission mitigation policies can effectively improve the air quality on large spatial scales such as in Germany. Given the relative novelty of the long-term measurements (PNSD, BC) in a network such as GUAN, the results proved to be robust and comprehensive. Our study also shows that long-term measurements of aerosol parameters in different environments could be very instrumental in detecting and understanding the long-term effects of emission mitigation policies.
This paper refers to data from the German Ultrafine Aerosol Network (GUAN) that are stored at the World Data Centre for Aerosols EBAS database (Birmili et al., 2015). Data access is possible through the persistent identifier https://doi.org/10.5072/guan (TROPOS, 2019) or by visiting the EBAS user interface directly (http://ebas.nilu.no, last access: 3 January 2020). The emission inventory is available at https://iir-de.wikidot.com/ (UBA, 2019a) and https://www.umweltbundesamt.de/themen/luft/emissionen-von-luftschadstoffen (UBA, 2019b).
The supplement related to this article is available online at: https://doi.org/10.5194/acp-20-7049-2020-supplement.
AW, NM, WB, MH, and JS designed the research. JS and NM conducted the data analysis. TT, KaW, MM, FR, TM, AlS, SB, GL, JC, JG, HF, BB, CA, HK, LR, RS, HG, KlW, FM, AnS, and OB conducted the measurements. JS and NM wrote the paper with input from all co-authors.
The authors declare that they have no conflict of interest.
We acknowledge funding by the German Federal Environment Ministry (BMU) grants F&E 370343200 (German title: Erfassung der Zahl feiner und ultrafeiner Partikel in der Außenluft) from 2008 to 2010, and F&E 371143232 (German title: Trendanalysen gesundheitsgefährdender Fein- und Ultrafeinstaubfraktionen unter Nutzung der im German Ultrafine Aerosol Network (GUAN) ermittelten Immissionsdaten durch Fortführung und Interpretation der Messreihen) from 2012 to 2014. For the MST (Mülheim-Styrum) measurements, we thank the co-funding by the North Rhine-Westphalia Agency for Nature, Environment and Consumer Protection (LANUV). Measurements at Annaberg-Buchholz were supported by the EU-Ziel3 project UltraSchwarz (German title: Ultrafeinstaub und Gesundheit im Erzgebirgskreis und Region Usti), grant no. 100083657. Measurements at DDW (Dresden-Winckelmannstraße) were co-funded by the European Regional Development Fund Financing Programme Central Europe, grant no. 3CE288P (UFIREG). Measurements in AUG (Augsburg) were also partly funded by UFIREG and by the Helmholtz-Zentrum.
The authors would like to thank the technical and scientific staff members of the stations included in this study. André Sonntag and Stephan Nordmann (TROPOS/UBA) contributed to data processing. Thomas A. J. Kuhlbusch and Ulrich Quass contributed the data quality assurance and data analysis at MST. Horst-Günther Kath (State Dept. for Environmental and Agricultural Operations in Saxony, Betriebsgesellschaft für Umwelt und Landwirtschaft – BfUL), Andreas Hainsch (Labour Inspectorate of Lower Saxony, Staatliches Gewerbeaufsichtsamt Hildesheim – GAA), and Dieter Gladtke (Agency for Nature Protection, the Environment, and Customer Protection in North Rhine-Westfalia, Landesamt für Natur, Umwelt und Verbraucherschutz Nordrhein-Westfalen – LANUV) made the GUAN measurements possible at their respective observation sites. We also thank Werner Wunderlich in Hessian State Office for Nature Conservation, Environment and Geology for the eBC mass concentration data at Raunheim and Karin Uhse at the German Environment Agency (UBA) for the PNC data quality check at LAN. We thank Andreas Rudolph, Dustin Konzack, and Andreas Fischer at TOPAS GmbH, Dresden, for kindly providing the UFP monitor TSI 3031 at LAN (data 2015–2018) and yearly quality assurance checks.
This work was also accomplished in the frame of the project ACTRIS-2 (Aerosols, Clouds, and Trace gases Research InfraStructure) under the European Union – Research Infrastructure Action in the frame of the H2020 programme for “Integrating and opening existing national and regional research infrastructures of European interest” under grant agreement N654109 (Horizon 2020). Additionally, we acknowledge the WCCAP (World Calibration Centre for Aerosol Physics) as part of the WMO GAW programme base-funded by the UBA.
This paper was edited by Veli-Matti Kerminen and reviewed by two anonymous referees.
Asmi, A., Collaud Coen, M., Ogren, J. A., Andrews, E., Sheridan, P., Jefferson, A., Weingartner, E., Baltensperger, U., Bukowiecki, N., Lihavainen, H., Kivekas, N., Asmi, E., Aalto, P. P., Kulmala, M., Wiedensohler, A., Birmili, W., Hamed, A., O'Dowd, C., Jennings, S. G., Weller, R., Flentje, H., Fjaeraa, A. M., Fiebig, M., Myhre, C. L., Hallar, A. G., Swietlicki, E., Kristensson, A., and Laj, P.: Aerosol decadal trends – Part 2: In-situ aerosol particle number concentrations at GAW and ACTRIS stations, Atmos. Chem. Phys., 13, 895–916, https://doi.org/10.5194/acp-13-895-2013, 2013.
Barmpadimos, I., Hueglin, C., Keller, J., Henne, S., and Prévôt, A. S. H.: Influence of meteorology on PM10 trends and variability in Switzerland from 1991 to 2008, Atmos. Chem. Phys., 11, 1813–1835, https://doi.org/10.5194/acp-11-1813-2011, 2011.
Bigi, A. and Ghermandi, G.: Long-term trend and variability of atmospheric PM10 concentration in the Po Valley, Atmos. Chem. Phys., 14, 4895–4907, https://doi.org/10.5194/acp-14-4895-2014, 2014.
Birmili, W., Wiedensohler, A., Heintzenberg, J., and Lehmann, K.: Atmospheric particle number size distribution in central Europe: Statistical relations to air masses and meteorology, J. Geophys. Res.-Atmos., 106, 32005–32018, 2001.
Birmili, W., Heinke, K., Pitz, M., Matschullat, J., Wiedensohler, A., Cyrys, J., Wichmann, H. E., and Peters, A.: Particle number size distributions in urban air before and after volatilisation, Atmos. Chem. Phys., 10, 4643–4660, https://doi.org/10.5194/acp-10-4643-2010, 2010.
Birmili, W., Sun, J., Weinhold, K., Merkel, M., Rasch, F., Wiedensohler, A., Bastian, S., Löschau, G., Schladitz, A., Quass, U., Kuhlbusch, T. A. J., Kaminski, H., Cyrys, J., Pitz, M., Gu, J., Peters, A., Flentje, H., Meinhardt, F., Schwerin, A., Bath, O., Ries, L., Gerwig, H., Wirtz, K., and Weber, S.: Atmospheric aerosol measurements in the German Ultrafine Aerosol Network (GUAN) – Part 3: Black Carbon mass and particle number concentrations 2009 to 2014, Gefahrst. Reinh. Luft, 75, 479–488, 2015.
Birmili, W., Weinhold, K., Rasch, F., Sonntag, A., Sun, J., Merkel, M., Wiedensohler, A., Bastian, S., Schladitz, A., Löschau, G., Cyrys, J., Pitz, M., Gu, J., Kusch, T., Flentje, H., Quass, U., Kaminski, H., Kuhlbusch, T. A. J., Meinhardt, F., Schwerin, A., Bath, O., Ries, L., Gerwig, H., Wirtz, K., and Fiebig, M.: Long-term observations of tropospheric particle number size distributions and equivalent black carbon mass concentrations in the German Ultrafine Aerosol Network (GUAN), Earth Syst. Sci. Data, 8, 355–382, https://doi.org/10.5194/essd-8-355-2016, 2016.
Castro, L. M., Pio, C. A., Harrison, R. M., and Smith, D. J. T.: Carbonaceous aerosol in urban and rural European atmospheres: estimation of secondary organic carbon concentrations, Atmos. Environ., 33, 2771–2781, https://doi.org/10.1016/S1352-2310(98)00331-8, 1999.
Chen, X., Zhang, Z., Engling, G., Zhang, R., Tao, J., Lin, M., Sang, X., Chan, C., Li, S., and Li, Y.: Characterization of fine particulate black carbon in Guangzhou, a megacity of South China, Atmos. Pollut. Res., 5, 361–370, https://doi.org/10.5094/APR.2014.042, 2014.
Cheng, Y. H., Shiu, B. T., Lin, M. H., and Yan, J. W.: Levels of black carbon and their relationship with particle number levels – observation at an urban roadside in Taipei City, Environ. Sci. Pollut. Res., 20, 1537–1545, 2013.
Cohen, A. J., Brauer, M., Burnett, R., Anderson, H. R., Frostad, J., Estep, K., Balakrishnan, K., Brunekreef, B., Dandona, L., and Dandona, R.: Estimates and 25-year trends of the global burden of disease attributable to ambient air pollution: an analysis of data from the Global Burden of Diseases Study 2015, The Lancet, 389, 1907–1918, 2017.
Collaud Coen, M., Andrews, E., Asmi, A., Baltensperger, U., Bukowiecki, N., Day, D., Fiebig, M., Fjaeraa, A. M., Flentje, H., Hyvarinen, A., Jefferson, A., Jennings, S. G., Kouvarakis, G., Lihavainen, H., Myhre, C. L., Malm, W. C., Mihapopoulos, N., Molenar, J. V., O'Dowd, C., Ogren, J. A., Schichtel, B. A., Sheridan, P., Virkkula, A., Weingartner, E., Weller, R., and Laj, P.: Aerosol decadal trends – Part 1: In-situ optical measurements at GAW and IMPROVE stations, Atmos. Chem. Phys., 13, 869–894, https://doi.org/10.5194/acp-13-869-2013, 2013.
Engler, C., Rose, D., Wehner, B., Wiedensohler, A., Brüggemann, E., Gnauk, T., Spindler, G., Tuch, T., and Birmili, W.: Size distributions of non-volatile particle residuals (Dp<800 nm) at a rural site in Germany and relation to air mass origin, Atmos. Chem. Phys., 7, 5785–5802, https://doi.org/10.5194/acp-7-5785-2007, 2007.
European Environment Agency (EEA): Air quality in Europe – 2017 report, Luxembourg, 74 pp., available at: https://www.eea.europa.eu/publications/air-quality-in-europe-2017 (last access: 3 January 2020), 2017.
Gilbert, R. O.: Statistical methods for environmental pollution monitoring, John Wiley & Sons, 204–225, 1987.
Helsel, D. R. and Frans, L. M.: Regional Kendall Test for Trend, Environ. Sci. Technol., 40, 4066–4073, https://doi.org/10.1021/es051650b, 2006.
Hussein, T., Karppinen, A., Kukkonen, J., Härkönen, J., Aalto, P. P., Hämeri, K., Kerminen, V. M., and Kulmala, M.: Meteorological dependence of size-fractionated number concentrations of urban aerosol particles, Atmos. Environ., 40, 1427–1440, 2006.
Janssen, N. A., Gerlofs-Nijland, M. E., Lanki, T., Salonen, R. O., Cassee, F., Hoek, G., Fischer, P., Brunekreef, B., and Krzyzanowski, M.: Health effects of black carbon, WHO Regional Office for Europe, available at: http://www.euro.who.int/__data/assets/pdf_file/0004/162535/e96541.pdf (last access: 4 June 2020), 2012.
Jones, A. M., Harrison, R. M., Barratt, B., and Fuller, G.: A large reduction in airborne particle number concentrations at the time of the introduction of “sulphur free” diesel and the London Low Emission Zone, Atmos. Environ., 50, 129–138, https://doi.org/10.1016/j.atmosenv.2011.12.050, 2012.
Kendall, M. G.: A new measure of rank correlation, Biometrika, 30, 81–93, 1938.
Krecl, P., Targino, A. C., Johansson, C., and Ström, J.: Characterisation and source apportionment of submicron particle number size distributions in a busy street canyon, Aerosol Air Qual. Res., 15, 220–233, 2015.
Kreyling, W. G., Semmler-Behnke, M., and Möller, W.: Health implications of nanoparticles, J. Nanopart. Res., 8, 543–562, https://doi.org/10.1007/s11051-005-9068-z, 2006.
Kutzner, R. D., von Schneidemesser, E., Kuik, F., Quedenau, J., Weatherhead, E. C., and Schmale, J.: Long-term monitoring of black carbon across Germany, Atmos. Environ., 185, 41–52, https://doi.org/10.1016/j.atmosenv.2018.04.039, 2018.
Ma, N. and Birmili, W.: Estimating the contribution of photochemical particle formation to ultrafine particle number averages in an urban atmosphere, Sci. Total Environ., 512/513, 154–166, https://doi.org/10.1016/j.scitotenv.2015.01.009, 2015.
Ma, N., Birmili, W., Müller, T., Tuch, T., Cheng, Y. F., Xu, W. Y., Zhao, C. S., and Wiedensohler, A.: Tropospheric aerosol scattering and absorption over central Europe: a closure study for the dry particle state, Atmos. Chem. Phys., 14, 6241–6259, https://doi.org/10.5194/acp-14-6241-2014, 2014.
Mann, H. B.: Nonparametric tests against trend, Econometrica, J. Econ. Soc., 13, 245–259, 1945.
Masiol, M., Squizzato, S., Chalupa, D. C., Utell, M. J., Rich, D. Q., and Hopke, P. K.: Long-term trends in submicron particle concentrations in a metropolitan area of the northeastern United States, Sci. Total Environ., 633, 59–70, https://doi.org/10.1016/j.scitotenv.2018.03.151, 2018.
Mudelsee, M.: Climate Time Series Analysis: Classical Statistical and Bootstrap Methods, Springer, Dordrecht, 65–176, 2010.
Murphy, D. M., Chow, J. C., Leibensperger, E. M., Malm, W. C., Pitchford, M., Schichtel, B. A., Watson, J. G., and White, W. H.: Decreases in elemental carbon and fine particle mass in the United States, Atmos. Chem. Phys., 11, 4679–4686, https://doi.org/10.5194/acp-11-4679-2011, 2011.
Müller, T., Henzing, J. S., de Leeuw, G., Wiedensohler, A., Alastuey, A., Angelov, H., Bizjak, M., Collaud Coen, M., Engström, J. E., Gruening, C., Hillamo, R., Hoffer, A., Imre, K., Ivanow, P., Jennings, G., Sun, J. Y., Kalivitis, N., Karlsson, H., Komppula, M., Laj, P., Li, S. M., Lunder, C., Marinoni, A., Martins dos Santos, S., Moerman, M., Nowak, A., Ogren, J. A., Petzold, A., Pichon, J. M., Rodriquez, S., Sharma, S., Sheridan, P. J., Teinilä, K., Tuch, T., Viana, M., Virkkula, A., Weingartner, E., Wilhelm, R., and Wang, Y. Q.: Characterization and intercomparison of aerosol absorption photometers: result of two intercomparison workshops, Atmos. Meas. Tech., 4, 245–268, https://doi.org/10.5194/amt-4-245-2011, 2011.
Pérez, N., Pey, J., Cusack, M., Reche, C., Querol, X., Alastuey, A., and Viana, M.: Variability of particle number, black carbon, and PM10, PM2.5, and PM1 levels and speciation: influence of road traffic emissions on urban air quality, Aerosol Sci. Technol., 44, 487–499, 2010.
Petzold, A. and Schönlinner, M.: Multi-angle absorption photometry – a new method for the measurement of aerosol light absorption and atmospheric black carbon, J. Aerosol Sci., 35, 421–441, 2004.
Pfeifer, S., Birmili, W., Schladitz, A., Müller, T., Nowak, A., and Wiedensohler, A.: A fast and easy-to-implement inversion algorithm for mobility particle size spectrometers considering particle number size distribution information outside of the detection range, Atmos. Meas. Tech., 7, 95–105, https://doi.org/10.5194/amt-7-95-2014, 2014.
Pope, C. A., Ezzati, M., and Dockery, D. W.: Fine-Particulate Air Pollution and Life Expectancy in the United States, New Engl. J. Med., 360, 376–386, https://doi.org/10.1056/NEJMsa0805646, 2009.
Putaud, J. P., Cavalli, F., Martins dos Santos, S., and Dell'Acqua, A.: Long-term trends in aerosol optical characteristics in the Po Valley, Italy, Atmos. Chem. Phys., 14, 9129–9136, https://doi.org/10.5194/acp-14-9129-2014, 2014.
Qadir, R. M., Abbaszade, G., Schnelle-Kreis, J., Chow, J. C., and Zimmermann, R.: Concentrations and source contributions of particulate organic matter before and after implementation of a low emission zone in Munich, Germany, Environ. Pollut., 175, 158–167, https://doi.org/10.1016/j.envpol.2013.01.002, 2013.
Rasch, F., Birmili, W., Weinhold, K., Nordmann, S., Sonntag, A., Spindler, G., Herrmann, H., Wiedensohler, A., and Löschau, G.: Significant reduction of ambient black carbon and particle number in Leipzig as a result of the low emission zone, Gefahrst. Reinh. Luft, 73, 483–489, 2013.
Schladitz, A., Leníček, J., Beneš, I., Kováč, M., Skorkovský, J., Soukup, A., Jandlová, J., Poulain, L., Plachá, H., Löschau, G., and Wiedensohler, A.: Air quality in the German–Czech border region: A focus on harmful fractions of PM and ultrafine particles, Atmos. Environ., 122, 236–249, https://doi.org/10.1016/j.atmosenv.2015.09.044, 2015.
Schmid, O. and Stoeger, T.: Surface area is the biologically most effective dose metric for acute nanoparticle toxicity in the lung, J. Aerosol Sci., 99, 133–143, 2016.
Seaton, A., Godden, D., MacNee, W., and Donaldson, K.: Particulate air pollution and acute health effects, The Lancet, 345, 176–178, https://doi.org/10.1016/S0140-6736(95)90173-6, 1995.
Sen, P. K.: Estimates of the Regression Coefficient Based on Kendall's Tau, J. Am. Stat. Assoc., 63, 1379–1389, https://doi.org/10.1080/01621459.1968.10480934, 1968.
Singh, A., Bloss, W. J., and Pope, F. D.: 60 years of UK visibility measurements: impact of meteorology and atmospheric pollutants on visibility, Atmos. Chem. Phys., 17, 2085–2101, https://doi.org/10.5194/acp-17-2085-2017, 2017.
Spindler, G., Grüner, A., Müller, K., Schlimper, S., and Herrmann, H.: Long-term size-segregated particle (PM10, PM2.5, PM1) characterization study at Melpitz – influence of air mass inflow, weather conditions and season, J. Atmos. Chem., 70, 165–195, https://doi.org/10.1007/s10874-013-9263-8, 2013.
Sun, J., Birmili, W., Hermann, M., Tuch, T., Weinhold, K., Spindler, G., Schladitz, A., Bastian, S., Löschau, G., Cyrys, J., Gu, J., Flentje, H., Briel, B., Asbach, C., Kaminski, H., Ries, L., Sohmer, R., Gerwig, H., Wirtz, K., Meinhardt, F., Schwerin, A., Bath, O., Ma, N., and Wiedensohler, A.: Variability of black carbon mass concentrations, sub-micrometer particle number concentrations and size distributions: results of the German Ultrafine Aerosol Network ranging from city street to High Alpine locations, Atmos. Environ., 202, 256–268, https://doi.org/10.1016/j.atmosenv.2018.12.029, 2019.
Swietlicki, E., Hansson, H.-C., Hämeri, K., Svenningsson, B., Massling, A., McFiggans, G., McMurry, P., Petäjä, T., Tunved, P., and Gysel, M.: Hygroscopic properties of submicrometer atmospheric aerosol particles measured with H-TDMA instruments in various environments – a review, Tellus B, 60, 432–469, 2008.
Theil, H.: A Rank-Invariant Method of Linear and Polynomial Regression Analysis, in: Henri Theil's Contributions to Economics and Econometrics: Econometric Theory and Methodology, edited by: Raj, B. and Koerts, J., Springer Netherlands, Dordrecht, 345–381, 1992.
TROPOS (the Leibniz Institute for Tropospheric Research): Continuous data from the German Ultrafine Aerosol Network (GUAN), https://doi.org/10.5072/guan, last access: 15 December 2019.
UBA (German Federal Environmental Agency): German Informative Inventory Report 2019 (IIR 2019), available at: http://iir-de.wikidot.com/, last access: 15 December 2019a.
UBA (German Federal Environmental Agency): Emissionen von Luftschadstoffen, available at: https://www.umweltbundesamt.de/themen/luft/emissionen-von-luftschadstoffen, last access: 15 December 2019b.
von Bismarck-Osten, C., Birmili, W., Ketzel, M., Massling, A., Petäjä, T., and Weber, S.: Characterization of parameters influencing the spatio-temporal variability of urban particle number size distributions in four European cities, Atmos. Environ., 77, 415–429, https://doi.org/10.1016/j.atmosenv.2013.05.029, 2013.
Weatherhead, E. C., Reinsel, G. C., Tiao, G. C., Meng, X. L., Choi, D., Cheang, W. K., Keller, T., DeLuisi, J., Wuebbles, D. J., and Kerr, J. B.: Factors affecting the detection of trends: Statistical considerations and applications to environmental data, J. Geophys. Res.-Atmos., 103, 17149–17161, 1998.
WHO (World Health Organization): WHO Global Ambient Air Quality Database, available at: https://www.who.int/airpollution/data/cities/en/ (last access: 12 December 2019), 2018.
Wiedensohler, A.: An approximation of the bipolar charge distribution for particles in the submicron range, J. Aerosol Sci., 19, 387–389, 1988.
Wiedensohler, A., Birmili, W., Nowak, A., Sonntag, A., Weinhold, K., Merkel, M., Wehner, B., Tuch, T., Pfeifer, S., Fiebig, M., Fjäraa, A. M., Asmi, E., Sellegri, K., Depuy, R., Venzac, H., Villani, P., Laj, P., Aalto, P., Ogren, J. A., Swietlicki, E., Williams, P., Roldin, P., Quincey, P., Hüglin, C., Fierz-Schmidhauser, R., Gysel, M., Weingartner, E., Riccobono, F., Santos, S., Grüning, C., Faloon, K., Beddows, D., Harrison, R., Monahan, C., Jennings, S. G., O'Dowd, C. D., Marinoni, A., Horn, H. G., Keck, L., Jiang, J., Scheckman, J., McMurry, P. H., Deng, Z., Zhao, C. S., Moerman, M., Henzing, B., de Leeuw, G., Löschau, G., and Bastian, S.: Mobility particle size spectrometers: harmonization of technical standards and data structure to facilitate high quality long-term observations of atmospheric particle number size distributions, Atmos. Meas. Tech., 5, 657–685, https://doi.org/10.5194/amt-5-657-2012, 2012.
Wiedensohler, A., Wiesner, A., Weinhold, K., Birmili, W., Hermann, M., Merkel, M., Müller, T., Pfeifer, S., Schmidt, A., and Tuch, T.: Mobility particle size spectrometers: Calibration procedures and measurement uncertainties, Aerosol Sci. Technol., 52, 146–164, 2018.