the Creative Commons Attribution 4.0 License.
the Creative Commons Attribution 4.0 License.
 | 04 Jun 2020
Measurement report: Vertical distribution of atmospheric particulate matter within the urban boundary layer in southern China – size-segregated chemical composition and secondary formation through cloud processing and heterogeneous reactions
Shengzhen Zhou
Luolin Wu
Junchen Guo
Weihua Chen
Xuemei Wang
Yafang Cheng
Zuzhao Huang
Jinpu Zhang
Pingqing Fu
Shiguo Jia
Yanning Chen
Junxia Kuang
Many studies have recently been done on understanding the sources and formation mechanisms of atmospheric aerosols at ground level. However, vertical profiles and sources of size-resolved particulate matter within the urban boundary layer are still lacking. In this study, vertical distribution characteristics of size-segregated particles were investigated at three observation platforms (ground level, 118 m, and 488 m) on the 610 m high Canton Tower in Guangzhou, China. Size-segregated aerosol samples were simultaneously collected at the three levels in autumn and winter. Major aerosol components, including water-soluble ions, organic carbon, and elemental carbon, were measured. The results showed that daily average fine-particle concentrations generally decreased with height. Concentrations of sulfate and ammonium in fine particles displayed shallow vertical gradients, and nitrate concentrations increased with height in autumn, while the chemical components showed greater variations in winter than in autumn. The size distributions of sulfate and ammonium in both seasons were characterized by a dominant unimodal mode with peaks in the size range of 0.44–1.0 µm. In autumn, the nitrate size distribution was bimodal, peaking at 0.44–1.0 and 2.5–10 µm, while in winter it was unimodal, implying that the formation mechanisms for nitrate particles were different in the two seasons. Our results suggest that the majority of the sulfate and nitrate is formed from aqueous-phase reactions, and we attribute coarse-mode nitrate formation at the measurement site to the heterogeneous reactions of gaseous nitric acid on existing sea-derived coarse particles in autumn. Case studies further showed that atmospheric aqueous-phase and heterogeneous reactions could be important mechanisms for sulfate and nitrate formation, which, in combination with adverse weather conditions such as temperature inversion and calm wind, led to haze formation during autumn and winter in the Pearl River Delta (PRD) region.
- Article
(4014 KB) -
Supplement
(2680 KB) - BibTeX
- EndNote


Air pollution is of serious environmental concern in China and is often characterized by high concentrations of many pollutants, among which fine particulate matter (particles with an aerodynamic diameter of 2.5 µm and smaller or PM2.5) is currently the primary pollutant in most cities. Aerosol particles can profoundly affect public health, visibility, and climate change, and their effects are strongly dependent on size distribution and chemical composition (Pöschl, 2005; Zhang et al., 2015). The chemical constituents of particulate matter (PM) include sulfate, nitrate, ammonium, organic matter, elemental carbon, crustal species, and trace metals, which have a variety of primary and secondary sources in both nature and human activities. Moreover, primary and secondary aerosols undergo chemical and physical processes, for example transport, cloud processing, and removal from the atmosphere, leading to significant spatial and temporal variations of the sources and formation mechanisms of atmospheric aerosols (Huang et al., 2014; Sun et al., 2015; Zhang et al., 2015; Liang et al., 2016).
Knowing the size-resolved PM chemical composition is a key factor in understanding the sources, formation, and transformation of atmospheric particles (Cabada et al., 2004; Seinfeld and Pandis, 2006; Wang et al., 2014). Atmospheric aerosol number size distribution is characterized by a number of modes, such as the Aitken and nucleation modes (less than 0.1 µm), accumulation mode (∼0.1 to ∼2 µm), and coarse mode (∼2 to ∼50 µm). However, the mass distribution of airborne particles is typically dominated by two modes: the accumulation mode and the coarse mode (Seinfeld and Pandis, 2006). In many cases, the accumulation mode consists of two overlapping sub-modes: the condensation mode and the droplet mode. The condensation sub-mode originates from primary emissions and the growth of smaller particles by coagulation and condensation, while the droplet sub-mode mainly results from cloud/fog processing or the coagulation of smaller particles (Seinfeld and Pandis, 2006). The two sub-modes were first reported for sulfate particles (0.2±0.02 µm for the condensation mode and 0.54±0.07 µm for the droplet mode) (Hering and Friedlander, 1982). Numerous studies have shown that in-cloud processes or multiphase reactions are plausible mechanisms for the formation of droplet-mode particles (Meng and Seinfeld, 1994; Zhuang et al., 1999a; Yao et al., 2003; Guo et al., 2010; Tian et al., 2016). Recently, strong evidence has shown that the first sub-mode (i.e., the condensation mode) can also be formed by cloud processing (Hoppel et al., 1985; Ovadnevaite et al., 2017). However, the contribution of smaller-sized particles in the condensation mode to total aerosol mass concentration was found to be quite small. Coarse-mode particles are primarily produced by mechanical processes like sea spay, mineral particles, and plant debris; however, coarse-mode secondary sulfates and nitrates have also been observed, and their formation has been attributed to heterogeneous and multiphase reactions (Pakkanen, 1996; Liu et al., 2008).
Measurements of ambient particles at several heights rather than at a single ground level provide unique information about their sources and dynamic transport. In addition, vertical PM distribution can reflect the influences of atmospheric boundary meteorology on aerosol chemistry. Vertical profiles of atmospheric pollutants are frequently measured on tall towers located in urban areas. Valiulis et al. (2002) estimated the trace metal emissions in Vilnius, Lithuania, using a vertical concentration gradient based on TV-tower and road-tunnel measurement data and showed that traffic was the main source for airborne trace metals. Harrison et al. (2012) reported a wide measured range of ambient particle physical properties and chemical compositions on the BT Tower 160 m above street level in central London. Öztürk et al. (2013) conducted high-resolution measurements of aerosol particle composition using a compact time-of-flight aerosol mass spectrometer and found considerable variability in the vertical distribution of aerosol mass concentration and composition on a 265 m tall tower near suburban Denver, Colorado. Chan et al. (2005) showed a complex vertical distribution of fine PM and carbonaceous species over Beijing, based on measurements from a 325 m meteorological tower. Sun et al. (2015) conducted real-time and simultaneous vertical measurements of aerosol particles at ground level and at 260 m on the same tower, and they showed very dynamic changes in vertical concentration profiles of meteorological parameters below 300 m that affected the formation and evolution processes of aerosols during haze episodes (Sun et al., 2015; Wang et al., 2018). A series of vertical measurements of atmospheric particulate matter and meteorological parameters on a 255 m meteorological tower in Tianjin, China, have been carried out in recent years (Zhang et al., 2011; Shi et al., 2012; Wang et al., 2016). Deng et al. (2014) reported the vertical distribution of PM10, PM2.5, and PM1.0 mass concentrations measured on the Canton Tower at 121 and 454 m from November 2010 to May 2013. However, measurements of size-resolved chemical compositions in the vertical within the urban boundary layer are still lacking. Wang et al. (2016) investigated the size distribution of chemical compositions and sources of particulate matter in different modes at ground level and 220 m in Tianjin. They suggested that 220 m is insufficiently high to eliminate the influence of local surface emissions, and measurements taken at that height do not reflect the background levels of pollutants within the urban canopy. Aerosol pollution frequently occurs in China, as exemplified by three city groupings in the Jing-Jin-Ji (Beijing, Tianjin, and Hebei Province), the Yangtze River Delta, and the Pearl River Delta (PRD) regions. State-of-the-art air-quality models still often fail to simulate the observed high PM2.5 concentrations even after including aerosol–radiation–meteorology feedback, indicating that key atmospheric chemical processes, such as heterogeneous and multiphase reactions, are lacking in models for secondary aerosol formation (Zheng et al., 2015; Cheng et al., 2016). To improve the understanding of haze formation, models will require updated kinetic and mechanistic data of multiphase chemistry, and the quantification of the aerosol formation through heterogeneous reactions is needed from field measurements, laboratory experiments, and model simulations under real atmospheric conditions (Zheng et al., 2015; Yun et al., 2018; An et al., 2019). Field studies showed that extremely high PM2.5 concentrations usually occurred under high relative humidity conditions (Sun et al., 2013; Wang et al., 2014). Multiphase reactions in the cloud liquid water and in aerosol water can promote secondary aerosol formation (Seinfeld et al., 2006; Ervens, 2015; McNeill, 2015; Cheng et al., 2016). Hence, size-resolved vertical concentration profiles of the major components of PM can add important knowledge about aerosol sources and formation mechanisms in the urban atmospheric boundary layer.
The Pearl River Delta (PRD) region is the low-lying area surrounding the Pearl River estuary, where the Pearl River flows into the South China Sea. The weather is generally warm and humid all year and is strongly influenced by the Asian monsoon. The PRD region is one of the most densely urbanized regions in the world, and it has recently experienced severe PM pollution and photochemical smog events (Zhang et al., 2008; Huang et al., 2014; Zhou et al., 2014). Autumn and winter are typical pollution seasons in this region (Chan and Yao, 2008; Tao et al., 2018). In this study, size-resolved PM samples were collected at three heights (ground level, 118 m, and 488 m) on the Canton Tower in Guangzhou, the central city in the PRD region. The main water-soluble ions (Na+, K+, Mg2+, Ca2+, , F−, Cl−, , , ) and carbonaceous species (organic carbon, OC; elemental carbon, EC) were measured, and these observations are used to examine formation mechanisms and sources. The objectives of this study are to (1) analyze the vertical mass size distribution of the PM chemical components and the factors that affect their vertical variations; (2) investigate the roles of in-cloud processes and multiphase reactions in secondary aerosol formation and the implications for haze pollution in subtropical urban areas; and (3) evaluate the simulation performance of the Weather Research and Forecasting Model coupled with online chemistry (WRF-Chem) in the vertical based on the measurement data.
2.1 Observational site and sample collection
The sampling site, the Canton Tower, is located in central urban Guangzhou and is the second highest TV tower in the world with a total height of 610 m. The main tower is 454 m high and the antenna mast adds another 156 m. Four levels (ground level, 118 m, 168 m, and 488 m) were selected by the Guangzhou Environmental Monitoring Center (EMC) to create a vertical gradient of observation platforms. Online measurements of pollutants, including SO2 (Model 43i, Thermo), CO (Model 48i, Thermo), O3 (Model 49i, Thermo), NO∕NOx (Model 42i, Thermo), and PM (PM2.5 and PM1.0; Model 5030i SHARP, Thermo), were conducted on the four observation platforms. Meteorological factors (relative humidity, temperature, wind speed and direction) were also recorded on the tower. All these data were applied to the discussion in the following sections.
Size-segregated aerosol samples were concurrently collected at three of the four levels (i.e., ground level, 118 m, and 488 m) in autumn (October and November 2015) and winter (December 2015 and January 2016) (Fig. 1). Three six-stage samplers (Model 131 High Flow Impactor, MSP Corporation) with a sampling flow rate of 100 L min−1 were used at the three heights. The 50 % cut-point diameters of the six-stage samplers were 0.25, 0.44, 1.0, 1.4, 2.5, 10.0, and 18.0 (inlet) µm. The three impactors (or samplers) were calibrated using a mass flow meter (Model 4040, TSI) in the laboratory prior to the measurements. The flow rates of the impactors were measured at the beginning of the sampling. At the end of the sampling, the flow rates were recorded again. If the flow rate of each impactor at the beginning and end of the sampling differed by more than 10 %, the sample was marked as suspect and the data were discarded. The average flow rates at the beginning and end of the sampling were used as the sampling flow rate. In addition, a Magnehelic® pressure gauge was used to monitor the inlet flow rate through the impactor. The pressure drop was also recorded at the beginning and end of the sampling. A 24 h sampling resolution was adopted every other day from 10:00 to 10:00 the next day (local time, UTC+8). The collection substrates were 75 mm diameter quartz filters, and a final 90 mm quartz filter was applied to collect aerosols with diameters of less than 0.25 µm. To eliminate possible organic contaminants, all of the quartz membrane filters were prebaked at 550 ∘C for 4 h before use. In total, 19 and 13 sets of samples, including one set of background samples, were collected at each height in autumn and winter. After collection, the filters were put into Petri dishes, kept in ice boxes during transportation to the laboratory, and then stored in a freezer at −18 ∘C prior to analysis. We estimated the impacts of temperature and pressure on the flow rate due to the sampling heights, which are less than 5 % (refer to Supplement).
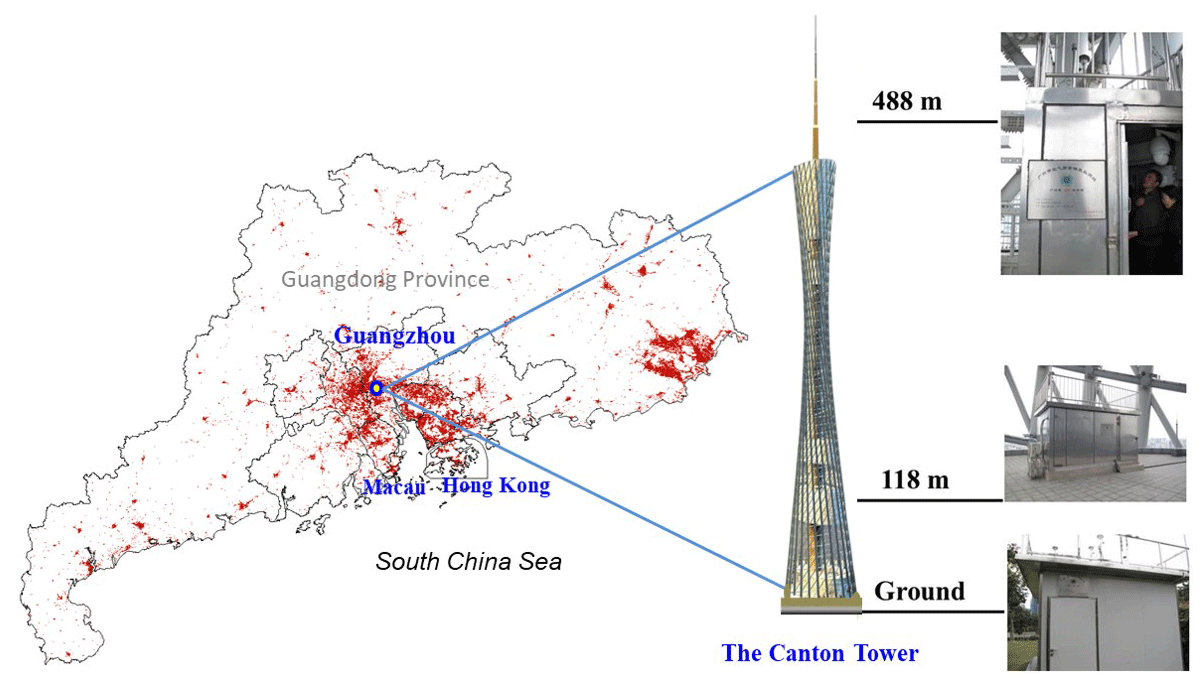
Figure 1Map showing the PRD region and the Canton Tower sampling sites in Guangdong Province, China. The red contour indicates the spatial distribution of urban areas from ESA's global land cover data 2015 (credit: http://www.esa-landcover-cci.org/, 17 May 2019).
2.2 Chemical analysis
A quarter of each quartz filter was cut out and dissolved in 15 mL of deionized water (18.2 MΩ, Millipore) for 30 min in an ultrasonic ice water bath. The extracted solution was filtered through a microporous membrane (0.2 µm pore size) into a clean polycarbonate bottle and then analyzed by an ion chromatograph (ICS-5000, Dionex). The cations (Na+, K+, Ca2+, Mg2+, ) were separated using a CS12A column (4×250 mm) and eluted with KOH solution. The anions (F−, Cl−, , , ) were analyzed using an AS23 column (4×250 mm) and eluted with a methane sulfonic acid solution. Multiple points of calibration were used for each batch of ionic analyses. The OC and EC mass concentrations were determined using a thermal optical carbon analyzer (DRI Model 2001A, Atmospheric Inc., USA). The analytical procedures were described in detail in Chow et al. (2001) and Cao et al. (2004). Due to the nonuniform deposition nature of the size-resolved samplers, charring correction using optical transmittance may have introduced uncertainty in determining the OC and EC split point. The data presented in this paper were all field-blank corrected.
2.3 Data analysis
Back-trajectory analysis was performed using the Hybrid Single-Particle Lagrangian Integrated Trajectory Model (HYSPLIT 4.9). The principle of this model can be found in Draxler and Hess (1998). The Global Data Assimilation System (GDAS, ) was used for the input meteorological data, and 72 h air-mass back trajectories were calculated at starting times of 02:00, 08:00, 14:00, and 20:00 LST with arrival heights of 200 and 500 m above ground level. Cluster analysis was performed to segregate the calculated trajectories into distinct cluster groups using the HYSPLIT clustering algorithm. A ceilometer (Model CL31, Vaisala Corp, Finland) was applied to measure the vertical backscatter density on the roof of the South China Institute of Environment Sciences, Ministry of Ecology and Environment, which is about 4 km northeast of the Canton Tower.
Vertical profiles of wind direction and speed, relative humidity (RH), temperature (T), and the chemical components of PM2.5 were simulated by the Weather Research and Forecasting Model coupled with online chemistry (WRF-Chem) version 3.7.1 (Skamarock et al., 2008). Detailed information on the model setup can be found in the Supplement and references (Fan et al., 2015; Chen et al., 2016).
3.1 General characteristics
Figure 2 shows the temporal profiles of daily averaged PM2.5 mass concentrations measured at the three heights (i.e., ground level, 118 m, and 448 m) during the sampling periods. The mismatch between the real-time PM2.5 concentrations and the reconstructed PM2.5 mass by combining the main components was likely due to sampling artefacts and the lack of comprehensive offline analysis of PM2.5 chemical components such as H and O associated with OC, geological minerals, and liquid water (Chow et al., 2015). The daily averaged PM2.5 mass concentrations at the three heights varied significantly in the ranges of 12.5–76.0, 12.3–54.2, and 7.9–44.4 µg m−3 in autumn, and in the ranges of 10.2–104.8, 10.7–83.4, and 7.2–47.2 µg m−3 in winter. The average PM2.5 mass concentrations were 44±15, 36±11, and 28±10 µg m−3 at ground level, 118 m, and 488 m in autumn, slightly higher than those in winter (42±23, 34±19, and 22±12 µg m−3). A pollution episode (i.e., E1) in autumn was identified when the PM2.5 concentration at ground level exceeded the air-quality standard (75 µg m−3), and another episode (i.e., E2) was identified in winter when the standard was exceeded continuously over a 3 d period. The diurnal variations of PM2.5 and PM1.0 concentrations at the three heights in autumn and winter are shown in Figs. S1 and S2 in the Supplement. In general, PM2.5 and PM1.0 concentrations at ground level and 118 m showed distinct diurnal cycles with higher concentrations occurring at rush hour in the morning and evening. However, the concentrations at 488 m showed a unimodal distribution with higher concentrations observed in the afternoon (12:00–17:00 LST), lagging 3–4 h behind those at ground level and 118 m. This can be attributed to the fact that the convective boundary layer begins to extend vertically after sunrise on typical days, and particles were transported upward by turbulence. The diurnal variations of CO and NOx showed similar trends as the PM. The O3 diurnal cycle showed a single peak pattern at the three levels with the highest values at around 14:00 LST. The O3 concentrations were higher at 488 m than at the lower levels. The O3 concentration differences between the lower levels and 448 m were widened at night due to the intensive NO titration loss at lower levels (Figs. S1 and S2).
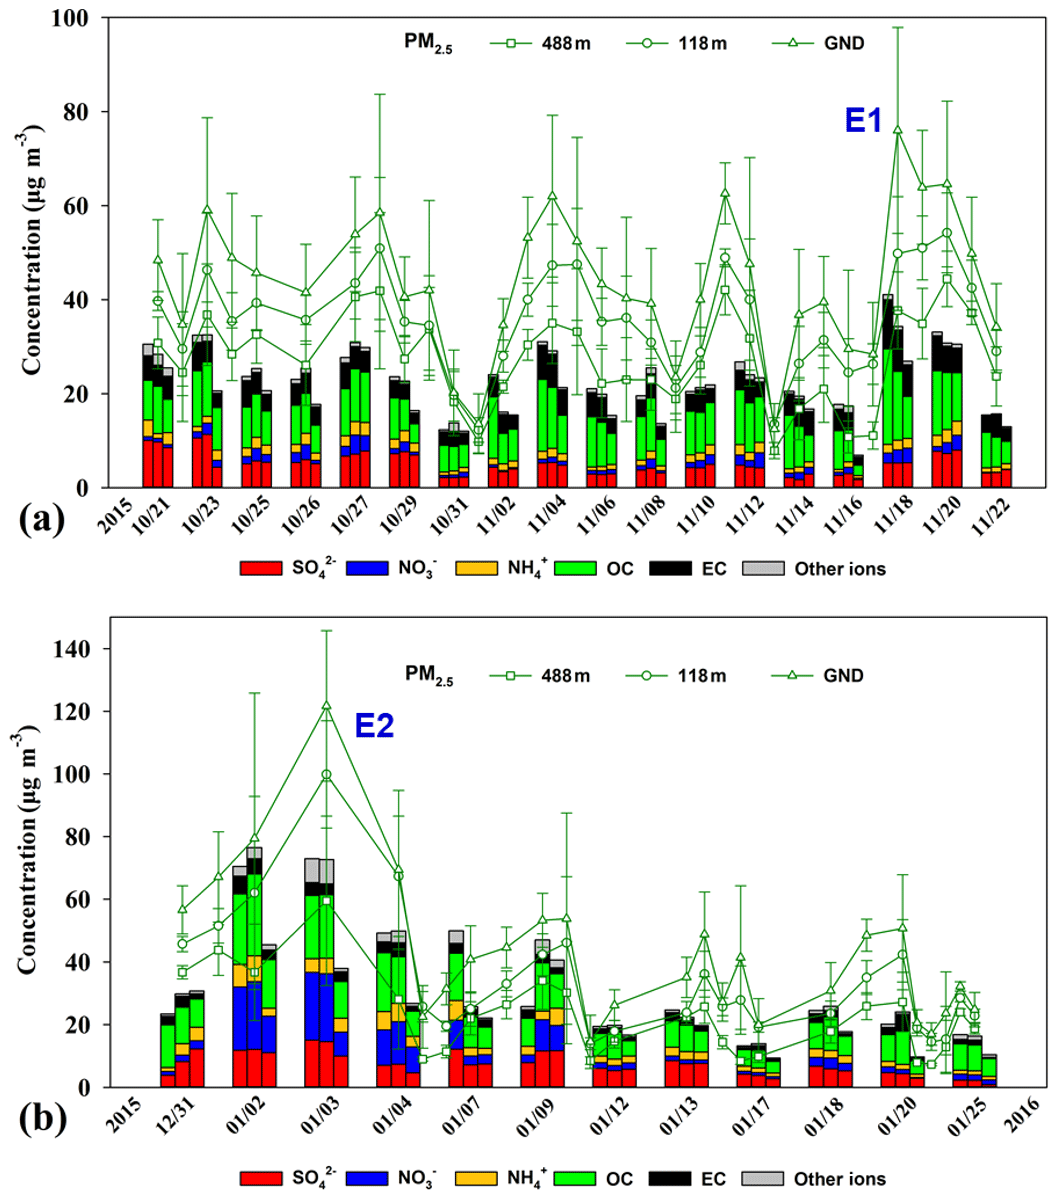
Figure 2PM2.5 mass and chemical component concentrations at ground level (GND), 118 m, and 488 m during the (a) autumnal and (b) winter sampling periods. The dates on the x axis are the sampling days. The stacked bar diagrams for each day represent chemical components at ground level (left), 118 m (middle), and 488 m (right). The green lines represent the daily averaged PM2.5 mass concentration. E1 and E2 represent two haze episodes with daily average PM2.5 concentrations on the ground site higher than 75 g m−3. Error bars represent the standard deviations of the mean.
3.2 Vertical distribution
3.2.1 Vertical distribution of the major chemical components
The profiles of the major PM2.5 chemical components can generally be classified into three vertical gradients. The first category presents the highest concentrations at ground level, the second category shows the highest concentrations at 118 m, and the third category shows the highest concentrations at 488 m. The statistics of the three types in autumn and winter are listed in Tables S1 and S2 in the Supplement. We found that the second and third categories were the major categories for sulfate, nitrate, and ammonium (SNA) in autumn, while those in winter were prone to peak at ground level and 118 m. Meanwhile, OC and EC presented the highest concentrations at ground level in both seasons.
Figure 3 shows the representative and average vertical profiles of PM2.5, sulfate, ammonium, nitrate, OC, and EC mass concentrations at the tower. In autumn, the vertical gradients for averaged sulfate, nitrate, and ammonium were observed to be shallow, attributed to the second category in which sulfate and nitrate concentrations were slightly higher at 118 m (Fig. 3a), while mean ammonium concentrations increased with height. Sulfate, nitrate, and ammonium concentrations on the polluted day (i.e., 18 November 2015) all increased with height. In particular, nitrate concentration was 1.5 times higher at 488 m than that at ground level, which will be further discussed in the case studies. The vertical gradients for OC and EC in autumn were found to be different from those for sulfate and ammonium, with the EC concentration 27.9 % lower and the OC concentration 34.0 % lower at 488 m than at ground level. The results suggest that the carbonaceous components are likely from local sources, and the inorganics (sulfate and nitrate) are transported from some distance. The decrease in air-pollutant concentrations with height is considered to be associated with ground-level sources (Zauli Sajani et al., 2018). No vertical gradients could be established for any of the measured PM components during cleaner days (e.g., as seen on 31 October 2015), which was likely attributed to the turbulent mixing of air pollutants within the boundary layer (Guinot et al., 2006).
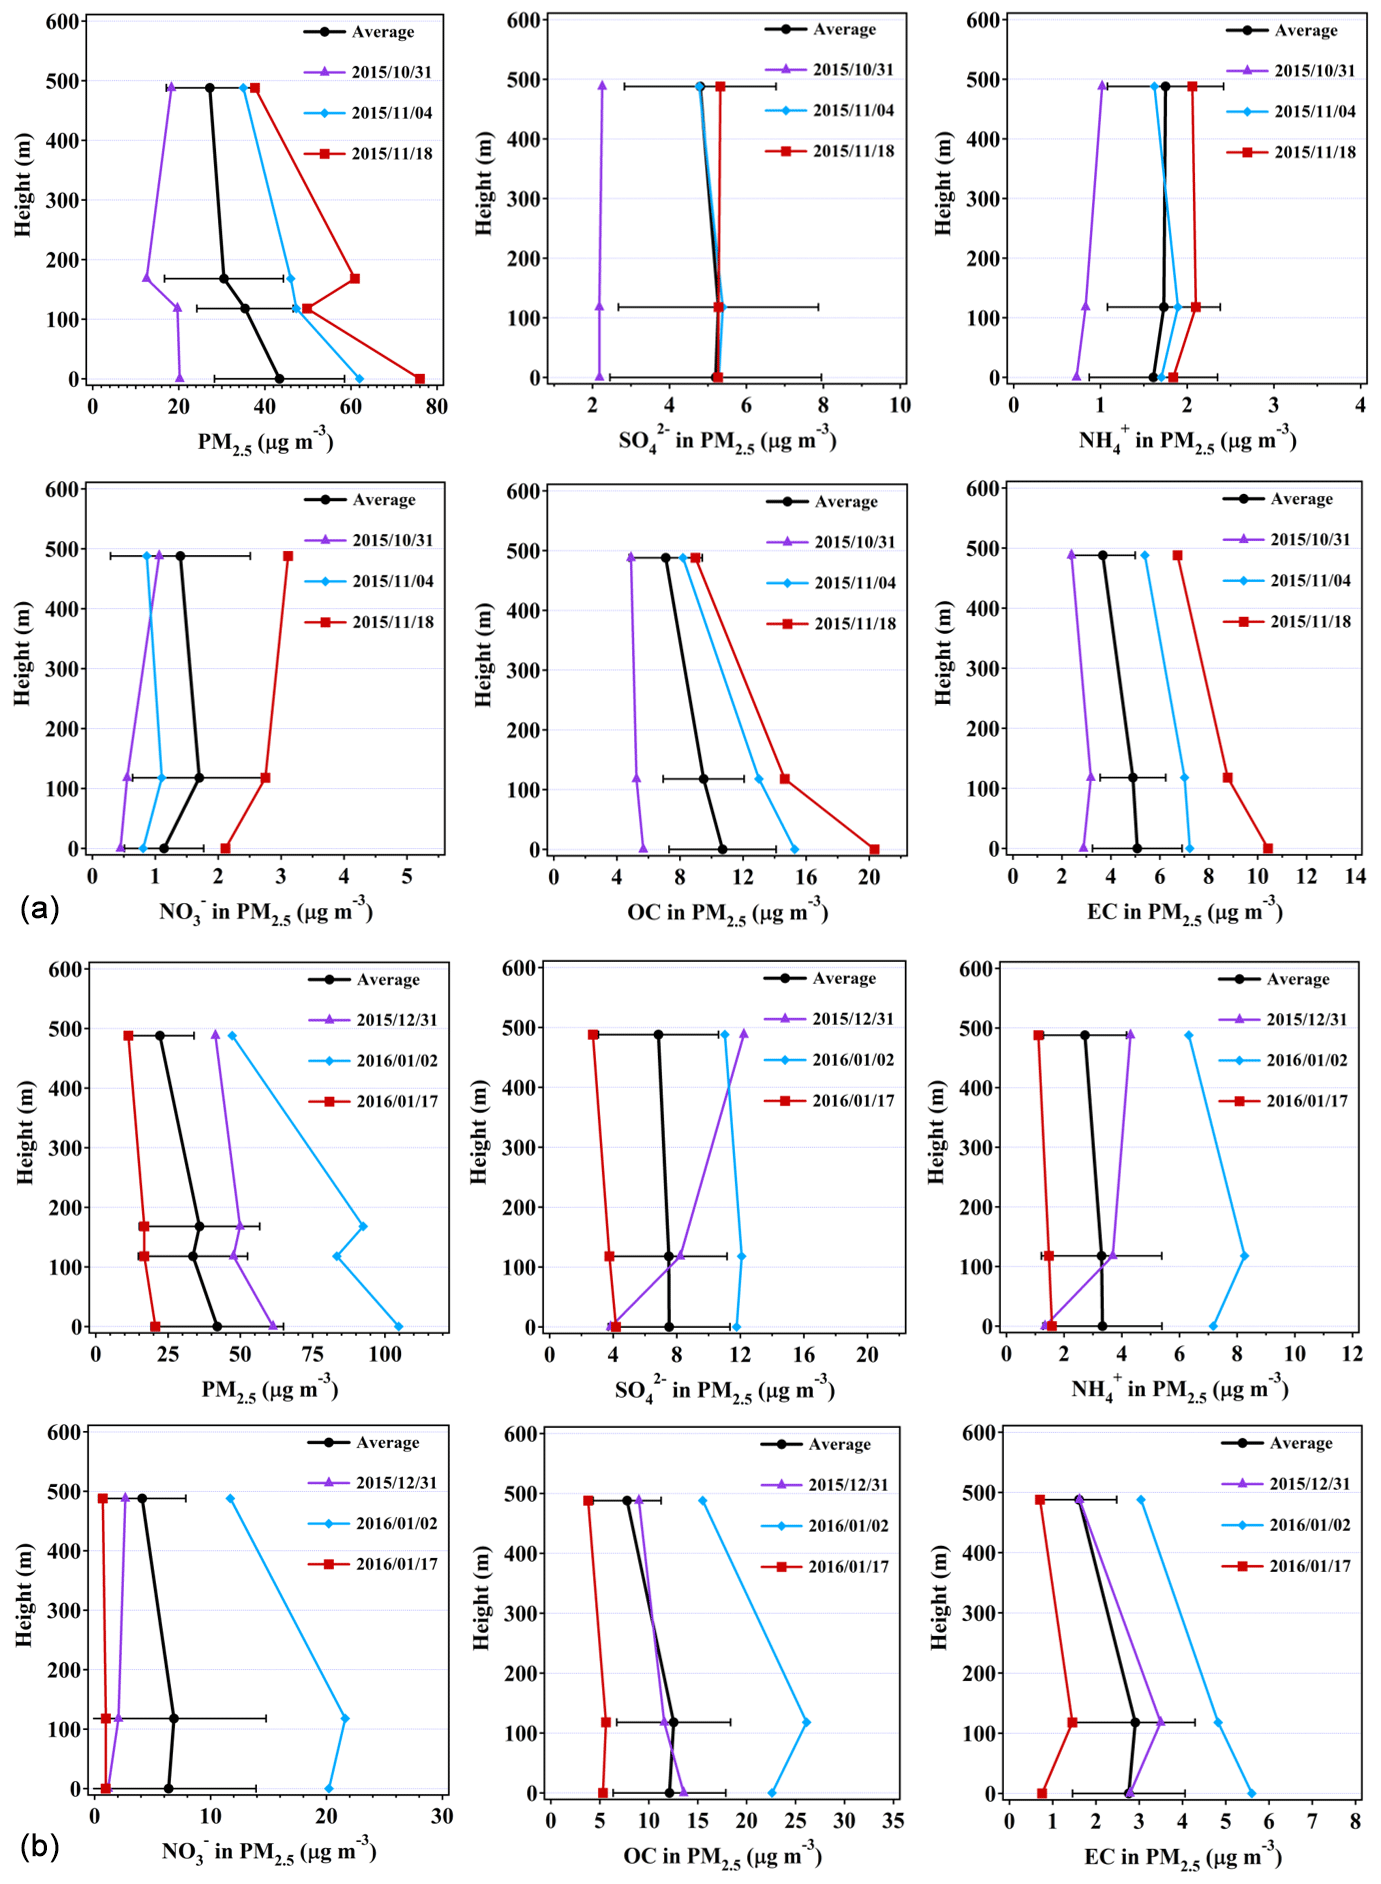
Figure 3Representative and average vertical profiles of sulfate, ammonium, nitrate, OC, and EC mass concentrations at ground level, 118 m, and 488 m during (a) autumn and (b) winter. Four layers of PM2.5 mass concentrations are shown here with the data measured by the Guangzhou EMC. Error bars represent standard deviations of the mean. Dates are presented as year/month/day.
In winter, averaged concentrations of sulfate and ammonium were generally observed to be higher at ground level than those at higher levels (Fig. 3b). However, concentrations of nitrate, OC, and EC were peaking at 118 m. On cleaner days (i.e., 17 January 2016), the vertical gradients for mean PM2.5, SNA, OC, and EC mass concentrations were found to be shallow due probably to the well-mixed air masses, while on polluted days (i.e., 2 January 2016), the concentrations for sulfate, nitrate, ammonium, and OC were higher at 118 m. Our results showed that the vertical gradients for sulfate, nitrate, and ammonium concentrations tend to peak at 118 and 488 m in both the autumnal and winter seasons when the PM2.5 concentrations were high (Table S1). The reasons are unclear, but they were probably due to local chemical formation or the regional transport of particles. However, back-trajectory analysis showed that local chemical formation contributed to high SNA mass concentrations rather than regional transport during the sampling time (Fig. S4).
3.2.2 Chemical composition in fine and coarse aerosols
Figure 4 shows the percentages of measured chemical composition in fine (PM2.5) and coarse (PM2.5−18) particles at the three heights (ground level, 118 m, and 488 m). Sulfate, OC, and EC were the major chemical components of fine particles in autumn. Elevated proportions of nitrate and ammonium were found in winter, possibly related to the equilibrium between gas-phase HNO3 and NH3 and their particle phases. Ammonium nitrate is a temperature- and relative-humidity-dependent compound, and low temperature and high RH facilitate the gas-to-particle partitioning (Wang et al., 2012; Bian et al., 2014). During the sampling periods, the average temperature in winter (13.5 ∘C) was much lower than that in autumn (23.1 ∘C), while the RH was the opposite, explaining the higher concentration of NH4NO3 in winter than in autumn. There was no significant difference between the relative contributions of the main chemical components of fine particles at ground level and at 118 m. We found that the total contribution of , , and at 488 m was higher than the corresponding contributions at the two lower levels, indicating more favorable secondary formation and aging processes of aerosols at higher altitude. Our results showed that OC, nitrate, crustal (e.g., Ca2+, Mg2+), and sea salt (e.g., Na+ and Cl−) were the major components of the measured species, but the comparisons with PM1 and PM2.5 suggest these components were relatively small in the coarse particles. The percentages for nitrate and sea salt were higher in autumn than in winter, suggesting that sea salt is a non-negligible source of aerosols in autumn in the PRD region. We also found that the fractions of primary inorganic ions (e.g., Ca2+) and EC in coarse particles decreased with height probably due to their sources (e.g., road dust and traffic emissions) being near the ground.
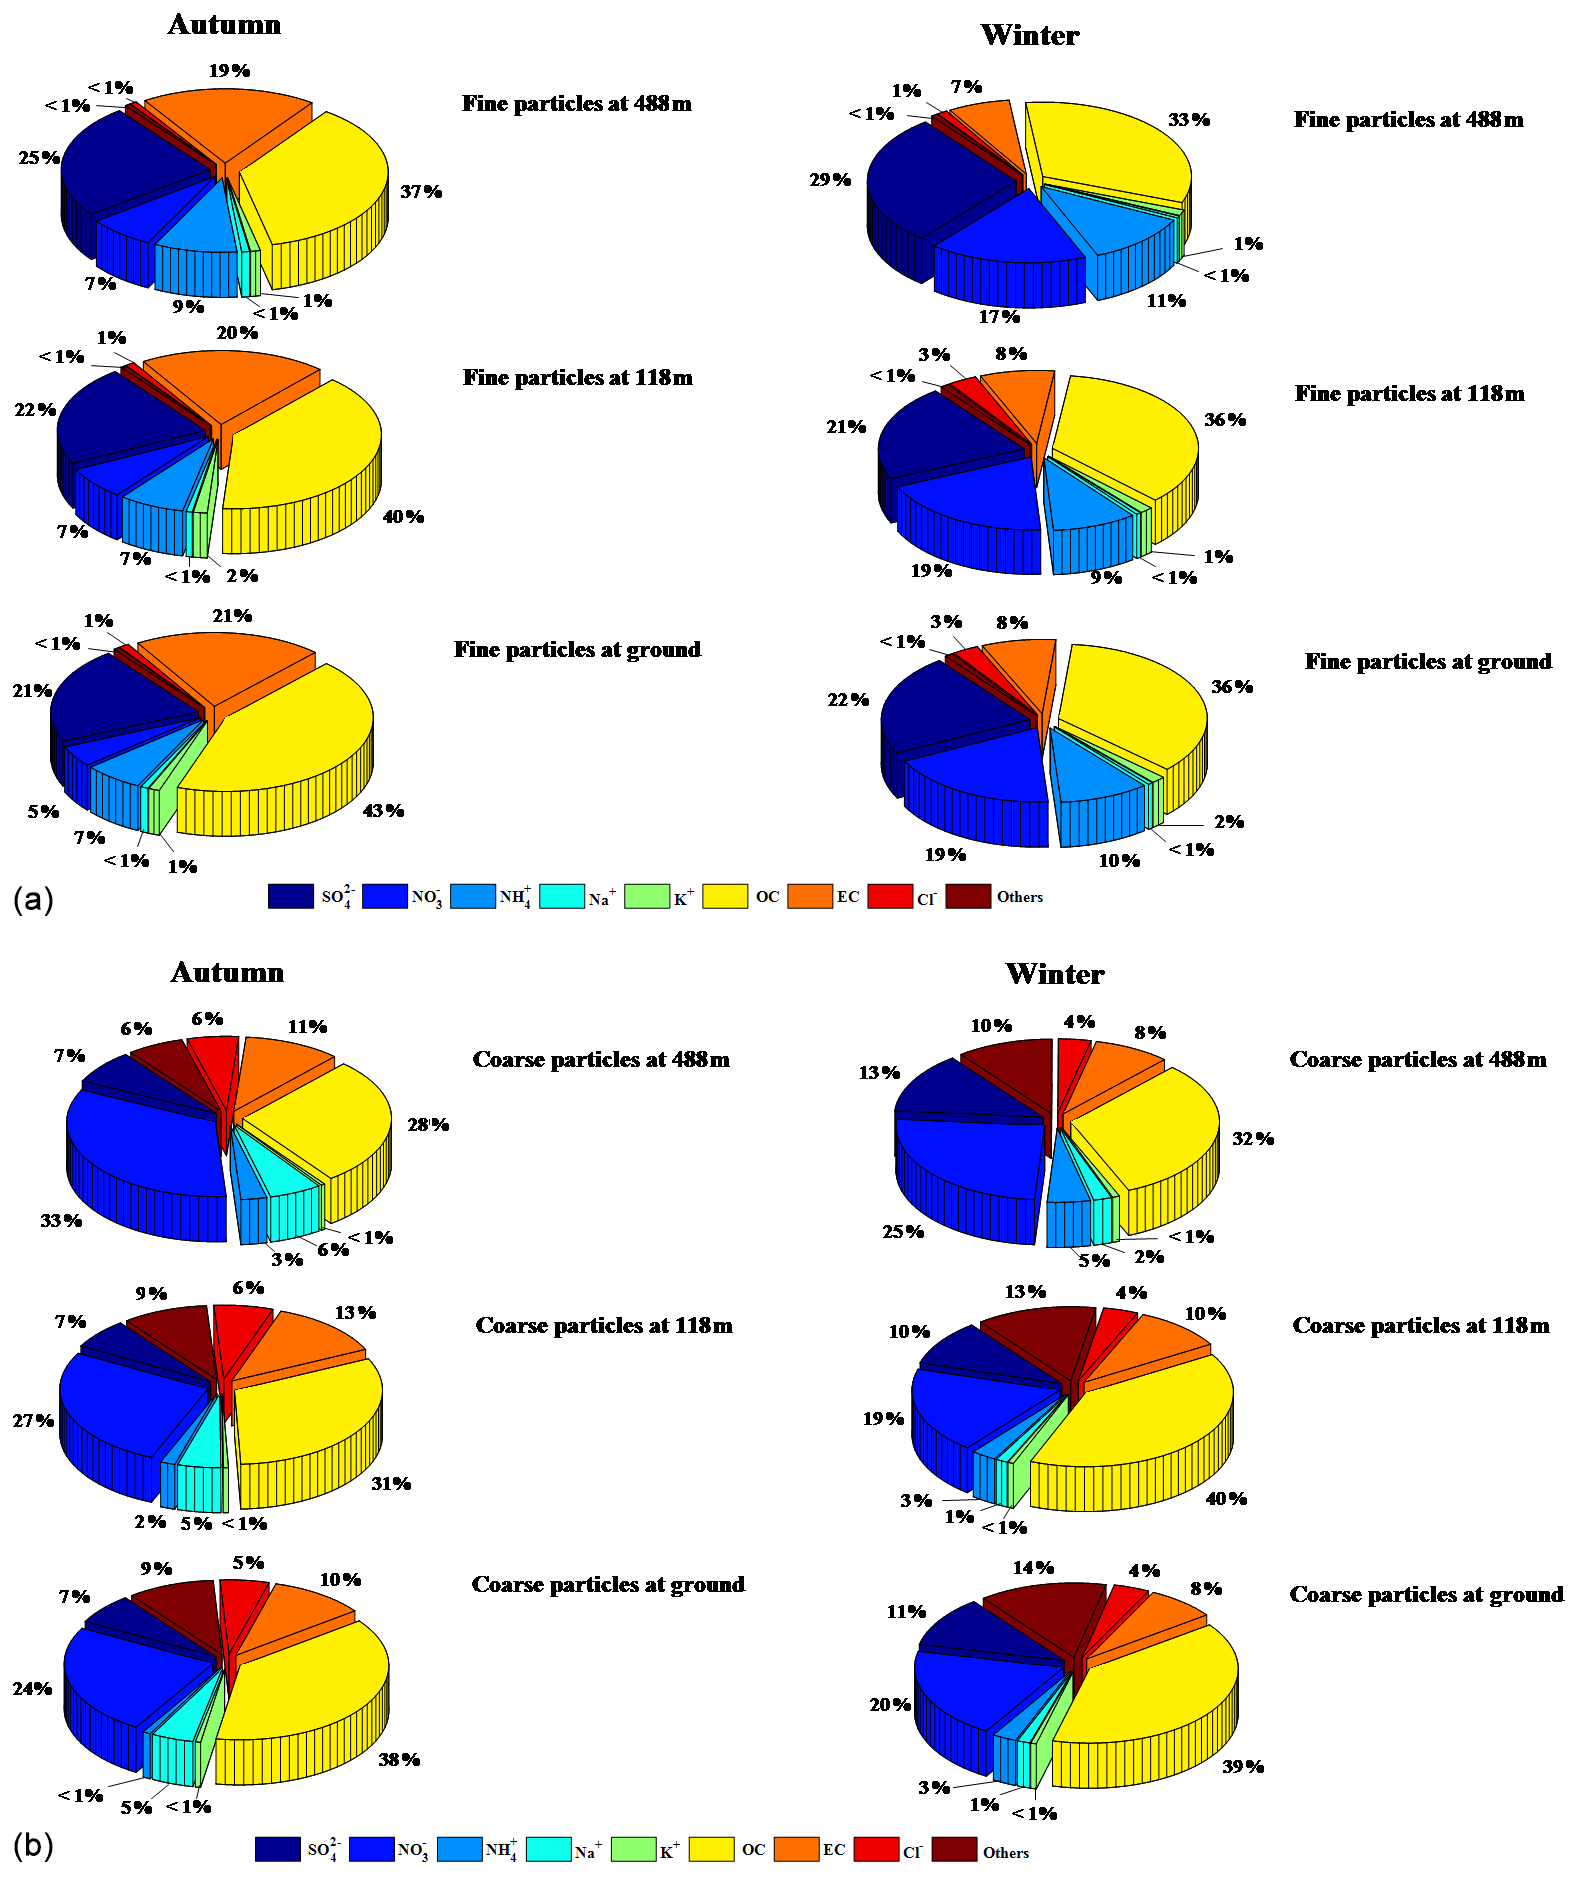
Figure 4Relative importance of the main chemical components in (a) fine-mode and (b) coarse-mode particles at three different levels of the Canton Tower.
3.2.3 Mass size distributions
Difference in mass size distributions may be attributed to differences in the sources and formation mechanisms of aerosol chemical components. The average mass size distributions of the ionic compounds, OC, and EC at the three heights during autumn and winter are shown in Figs. 5 and 6.
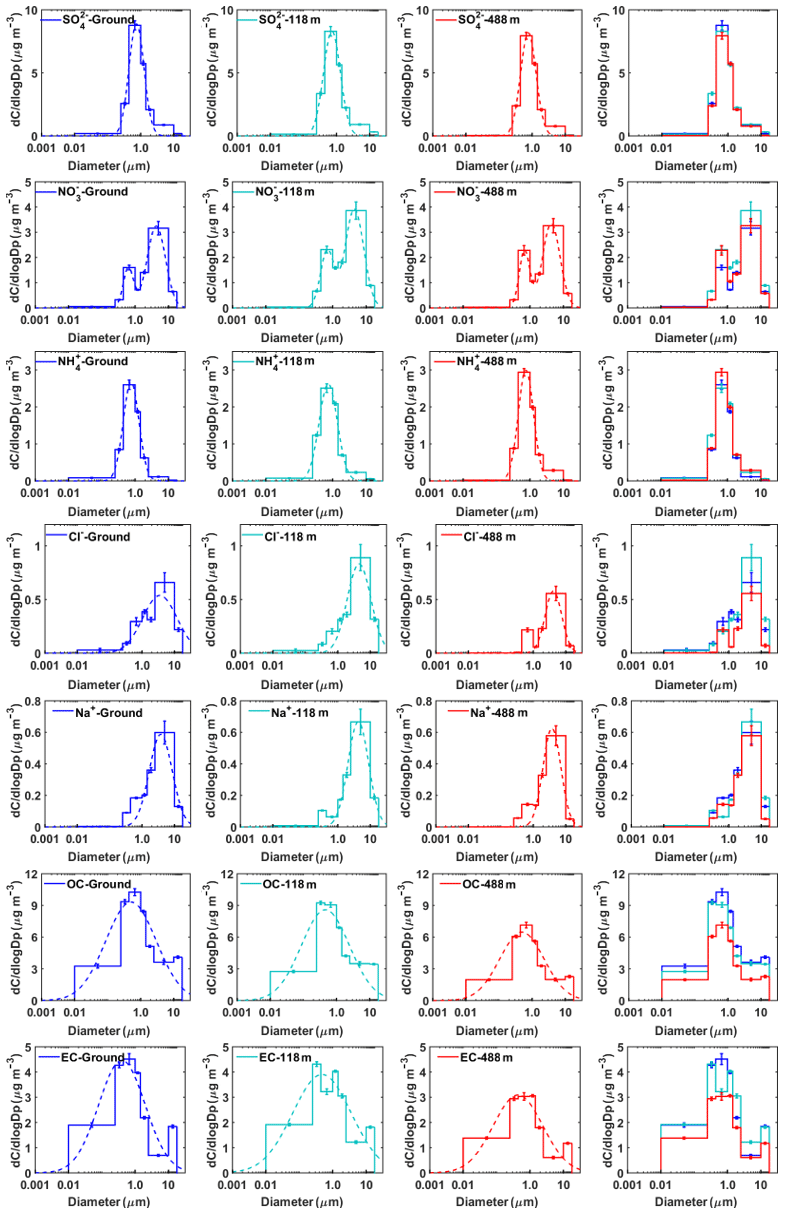
Figure 5Mass concentration size distributions of the main chemical components measured at ground level, 118 m, and 488 m in autumn. The dotted lines represent the nonlinear fitting of the measured average size distribution. The error bars represent the sampling and analytical standard errors for each compound.
(1) Sulfate, nitrate, and ammonium
Sulfate did not show obvious seasonal and vertical variations in mass size distribution (Figs. 5 and 6). The average mass size distributions of showed a dominant peak in the range of 0.44–1.0 µm (a typical droplet mode) and a minor coarse mode in the range of 2.5–10 µm. The mass size distributions of sulfate at the three levels were similar, indicating that sulfate may have similar formation mechanisms at these levels. Previous studies showed that droplet-mode sulfate could be formed in cloud or fog (Zhuang et al., 1999a; Kerminen and Wexler, 1995; Meng and Seinfeld, 1994). Guo et al. (2010) proposed three possible formation processes for droplet-mode sulfate, including condensation and coagulation of smaller particles, in-cloud aqueous processes, and processes in deliquesced aerosol particles. It is generally recognized that coagulation is negligible at typical ambient particle number concentrations (Hinds, 1999). Therefore, the in-cloud coalescence of droplets or aqueous-phase chemistry is responsible for the production of several sulfate modes (Feingold et al., 1996). Using a positive matrix factorization (PMF) method similar to that described in Guo et al. (2010), we obtained three modes (i.e., condensation, droplet, and coarse modes) for the sulfate size distribution. The droplet mode accounted for 79.4 %, 78.5 %, and 86.9 % in autumn, and 78.5 %, 78.3 %, and 80.4 % in winter at ground level, 118 m, and 488 m (Table S3). High relative humidity was measured during the autumnal and winter measurement periods (at ∼78 % and 80 % on average) in Guangzhou. The contribution of droplet-mode sulfate was higher at 488 m than that at the two lower levels, suggesting that in-cloud or aerosol droplet processes are likely to be the main formation pathways for sulfate. There is also evidence of frequent cloud coverages at 500–1500 m above the ground in urban Guangzhou, measured using a ceilometer during the measurement periods (Figs. S10 and S11). Relative humidity would influence the relative size distributions of the different chemical species. The air was not dried upstream of the impactor, and therefore relative humidity would influence the size distributions of different chemical species. In this study, the monthly averaged relative humidity was around 80 % in both seasons. We assume that the hygroscopic growth factor is independent of particle size and is about 1.5 for ammonium sulfate and ammonium nitrate at 80 % RH (Tang, 1996). A maximum overestimated value of about 10 %, 13 %, and 6 % for droplet-mode sulfate was obtained at ground level, 118 m, and 488 m, respectively. The droplet-mode nitrates were overestimated to be about 11 %, 16 %, and 6 % at ground level, 118 m, and 488 m, respectively. Our results are similar to those in Chen el al. (2018), who concluded that the influence of cut-off shift on filter-based particle sampling driven by hygroscopic growth is generally negligible (less than 7 %) in urban areas, but they need to be considered (about 10 %–20 %) in continental background areas in Europe. The influence from relative humidity on the size distribution is indeed present based on the average particle concentrations in the droplet mode in this study. However, it is unlikely to change our conclusion that in-cloud processing contributed to the droplet-mode aerosols (Table S3). In addition, Meng and Seinfeld (1994) showed that water accretion alone cannot account for the growth of droplet-mode particles from the condensation mode. They proposed that the activation of condensation-mode particles to form fogs or clouds followed by the significant production of sulfate from the SO2 oxidation within droplets (also for nitrate) and fog evaporation are plausible mechanisms for the formation of urban and regional aerosols in the droplet mode.
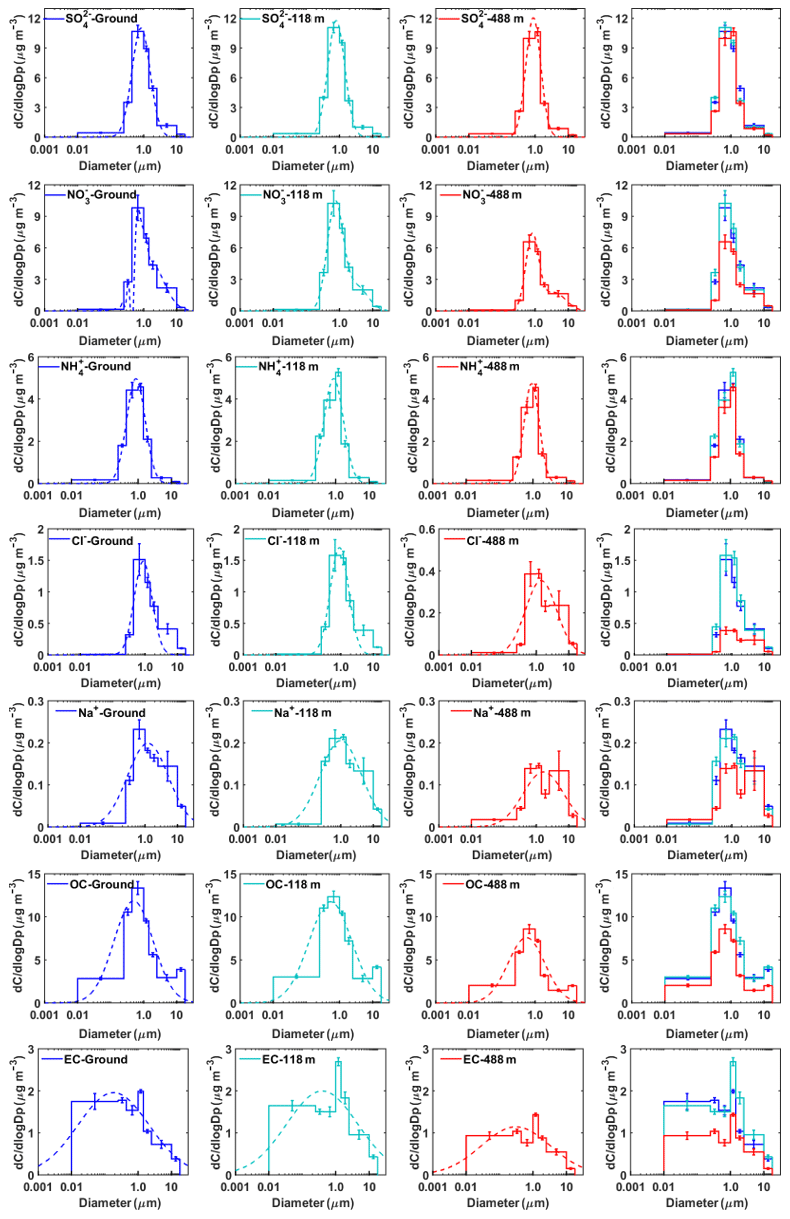
Figure 6Mass concentration size distributions of the main chemical components measured at ground level, 118 m, and 488 m in winter. The dotted lines represent the nonlinear fitting of the measured average size distribution. The error bars represent the sampling and analytical standard errors for each compound.
The mass size distribution for nitrate exhibited two modes with mass median aerodynamic diameters of 0.44–1.0 µm (fine mode) and 2.5–10 µm (coarse mode) in autumn, while the fine-mode pattern peak, around 1.0 µm, was observed in winter. The coarse-mode nitrate was likely formed by the heterogeneous reactions of gaseous nitric acid with pre-existing sea- and soil-derived coarse particles (Anlauf et al., 2006; Harrison and Pio, 1983; Harrison and Kitto, 1990; Pakkanen, 1996; Wall et al., 1988; Wu and Okada, 1994; Zhuang et al., 1999a). We found that coarse-mode Na+, Cl−, and were at almost the same particle size, while Ca2+ peaked at a particle size larger than (Fig. S3). It is thus reasonable to conclude that coarse-mode is probably associated with sea salt rather than Ca2+, which is consistent with the previous work in Hong Kong (Zhuang et al., 1999b). Sea-salt particles can grow by water uptake in fogs and clouds. A previous study showed that a substantial amount of nitrates forms when HNO3 reacts with deliquesced sea salt as compared to the dry NaCl particles (Brink, 1998). Hence, we speculated that nitrates were formed from the reactive uptake of HNO3 in the deliquesced sea-salt droplets rather than dry particles in Guangzhou. The back-trajectory cluster analysis showed that the sampled air masses were predominantly from the South China Sea and moved toward Guangzhou in autumn (Fig. S4), bringing high concentrations of sea-salt particles available for heterogeneous reactions. Moreover, high relative humidity, fog, and low clouds, which were observed during the observation, could facilitate the heterogeneous formation of coarse-mode nitrates.
In winter, the mass size distribution for nitrate was dominated by the droplet mode (with a size range of 0.44–1.0 µm), in contrast to a relatively small nitrate peak in this mode in autumn (Figs. 5 and 6). Previous studies showed that droplet-mode nitrate could be produced by the condensation of nitric acid onto pre-existing particles and/or heterogeneous reactions of N2O5 (Guo et al., 2010; Wang et al., 2012). The contribution of heterogeneous reactions between nitric acid and sea-salt droplets was minor in winter given that the air masses were predominantly from inland (Fig. S4), bringing a much lower concentration of coarse-mode sea-salt aerosols than in autumn (Figs. 5 and 6). Therefore, the heterogeneous reactions of nitric acid with sea-salt droplets were less prominent in winter.
Ammonium commonly appears in the forms of NH4NO3 and (NH4)2SO4. Although fine-mode ions were found to be dominant in the mass size distribution in both autumn and winter, the concentration of fine-mode ions was strongly correlated with that of the same mode (R>0.89 at three heights) while only moderately correlated with that of fine-mode ions in autumn, implying that fine-mode nitrates exist not only as NH4NO3 but also as other forms (i.e., NaNO3) in autumn. Figure 5 shows that ammonium concentration was the highest at 488 m in autumn. The possible reason for this phenomenon might be that temperature (T) was lower and relative humidity (RH) was higher at 488 m, which was favorable for the partitioning of semi-volatile NH4NO3 into the particle phase (Stelson and Seinfeld, 1982; Wang et al., 2012). This is supported by the evidence that nitrate concentration in fine particles generally increased with height (Fig. 3).
(2) Sodium and chloride
The mass size distributions for Na+ and Cl− showed distinctly different patterns in autumn and in winter. Na+ and Cl− exhibited unimodal peaking in the range of 2.5–10 µm in autumn. The proportion of Na+ in coarse mode to the total Na+ mass was 63 %, 71 %, and 68 %, and the proportion of Cl− ions observed in coarse mode was 59 %, 69 %, and 70 %, respectively, at ground level, 118 m, and 488 m. This indicates that their contributions at the upper levels were slightly higher than those at ground level. Chloride in the coarse-mode particles was thought to originate from marine sources and be associated with sodium (Zhao and Gao, 2008; Bian et al., 2014). As discussed above (Fig. S4), ambient air in Guangzhou was strongly influenced by particles from marine sources which were transported from the South China Sea in autumn. We calculated the chloride depletion based on the concentrations of Na+ and Cl− (Eq. 1) to estimate the nitrate and sulfate formation rates on the sea-salt particles (Zhuang et al., 1999b):
where [Na+] is the measured concentration and 1.174 is the molar ratio of Cl− to Na+ in seawater. Higher chloride depletion (in percentage) was found for larger size particles (>1.0 µm) at the highest testing level (488 m) (Fig. S5), demonstrating more aged aerosol which had undergone significant chemical processing during advection to the 488 m sampling site. In comparison, possible sources for fine-mode chloride particles were biomass burning, coal combustion, and waste incineration (Fu et al., 2018; Zhao and Gao, 2008). The origin of fine chloride particles in winter during the measurement periods, however, is difficult to determine based on the broad peaks for Na+ and Cl−.
(3) OC and EC
In general, the mass size distributions for OC showed dominant droplet modes in both autumn and winter with smaller peaks in the coarse mode (Figs. 5 and 6). The size distributions of OC in our work are similar to those in previous studies in Shanghai (Ding et al., 2017) and in Alpine valleys (Jaffrezo et al., 2005), while they are very different from those at rural and remote sites on the Tibetan Plateau (Wan et al., 2015) and in Xishuangbanna, China (Guo, 2016). The dominant droplet mode for OC is very similar to that of sulfate, suggesting that a large amount of OC may originate from secondary formation processes (Jaffrezo et al., 2005). The high OC∕EC ratios were found in particles with sizes larger than 0.25 µm, especially for droplet-mode particles, indicating the enhancement of the secondary formation of OC in this mode. We further evaluated the contributions of secondary organic carbon (SOC) to OC using the EC tracer method (Castro et al., 1999; Zhou et al., 2014). The results showed that SOC accounted for a large fraction of OC in our study (Fig. S6). The mass size distributions for EC are fairly different between autumn and winter. Huang et al. (2006) reported that EC showed a dominant accumulation mode with a mass median aerodynamic diameter of 0.42 µm from vehicle emissions in a tunnel in Guangzhou. However, in this study, the peak concentration for EC in autumn was in the size range of 0.44–1.0 µm, suggesting that EC had aged after emission. EC showed a general bimodal peak in winter, with a broad EC peak in accumulation mode and a sharp peak (the highest concentration) of around 1.0–1.44 µm at 188 m, suggesting that its source might be different from the other two levels. One possible reason for the abnormally high concentrations of EC was the influence of local point sources (i.e., high chimneys from power plants and industry) around Guangzhou, which emitted elevated concentrations of air pollutants from combustion sources. We also found that the concentrations of co-emitted SO2 and CO were the highest at 188 m among the three heights (Fig. S7).
3.3 Case studies of PM vertical profile
Factors that influence vertical distribution of PM include meteorology, regional transport, source emissions, and chemical reactions. In the previous sections, our results revealed that in-cloud aqueous reactions and heterogeneous reactions were important aerosol formation pathways in this coastal urban area under high relative humidity. Here we consider two PM pollution episodes (E1 and E2) to investigate these mechanisms for haze formation in autumn and in winter (Fig. 2). There was no rain during the pollution episodes. The E1 episode, which occurred on 18 November 2015, represented a typical pollution scenario in autumn. An anomalous increase in PM2.5 concentration was observed at 168 m compared to the concentrations on non-event days. In addition, the average sulfate, nitrate, and ammonium (SNA) concentrations were higher at 488 and 118 m than those at ground level (Fig. 3a). We simulated horizontal and vertical wind, RH, and T. The results showed that a horizontal southerly wind was prevalent prior to 18 November with a period of calm wind from around 02:00 to 14:00 LST on the day. Subsequently, the wind direction changed predominantly to the north (Fig. S8a), consistent with back-trajectory analysis which showed that air masses firstly came from the south and then changed direction to the north on 19 November (Fig. S9). Low-altitude temperature inversion was observed between 118 and 168 m that night probably due to the convergence of two different air streams (Fig. S8a). A previous study (Wu et al., 2013) demonstrated that poor air quality is associated with surface and low-altitude inversions in the PRD region. The RH vertical profile decreased between ground level and 168 m and became relatively stable between 168 and 488 m. Subsequently the RH increased until it reached a maximum at around 900 m, followed by a sharp decrease (Fig. 7a). We simulated a large amount of low cloud cover on 17 and 18 November based on the WRF model results and MODIS satellite images (Figs. 8a and S10). The vertical wind blew dominantly upward during nighttime and downward during daytime (Fig. 8a), which facilitated the transport of residual particles produced from cloud evaporation to lower altitudes after sunrise. The average sulfur oxidation ratio (SOR during E1 was 0.22, 0.18, and 0.12 at ground level, 118 m, and 488 m, higher than that on non-event days. The concentration of SO2 increased with height (12.4 µg m−3 at ground level, 16.1 µg m−3 at 118 m, and 27.0 µg m−3 at 488 m), suggesting that it was impacted more by emissions from local sources, where the air masses were fresh. The newly emitted SO2 at high altitudes compensated for part of the sulfate converted from SO2, leading to a decrease in SOR with height. The corresponding values for nitrogen oxidation ratios (NORs; were 0.01, 0.02, and 0.07 at the three levels. A number of previous studies demonstrated that high relative humidity favors the production of secondary aerosols (Sun et al., 2013; Cheng et al., 2016; Zheng et al., 2015). Our results suggest that aqueous-phase and heterogeneous reactions contributed significantly to the sulfate and nitrate in the PRD region during this episode.
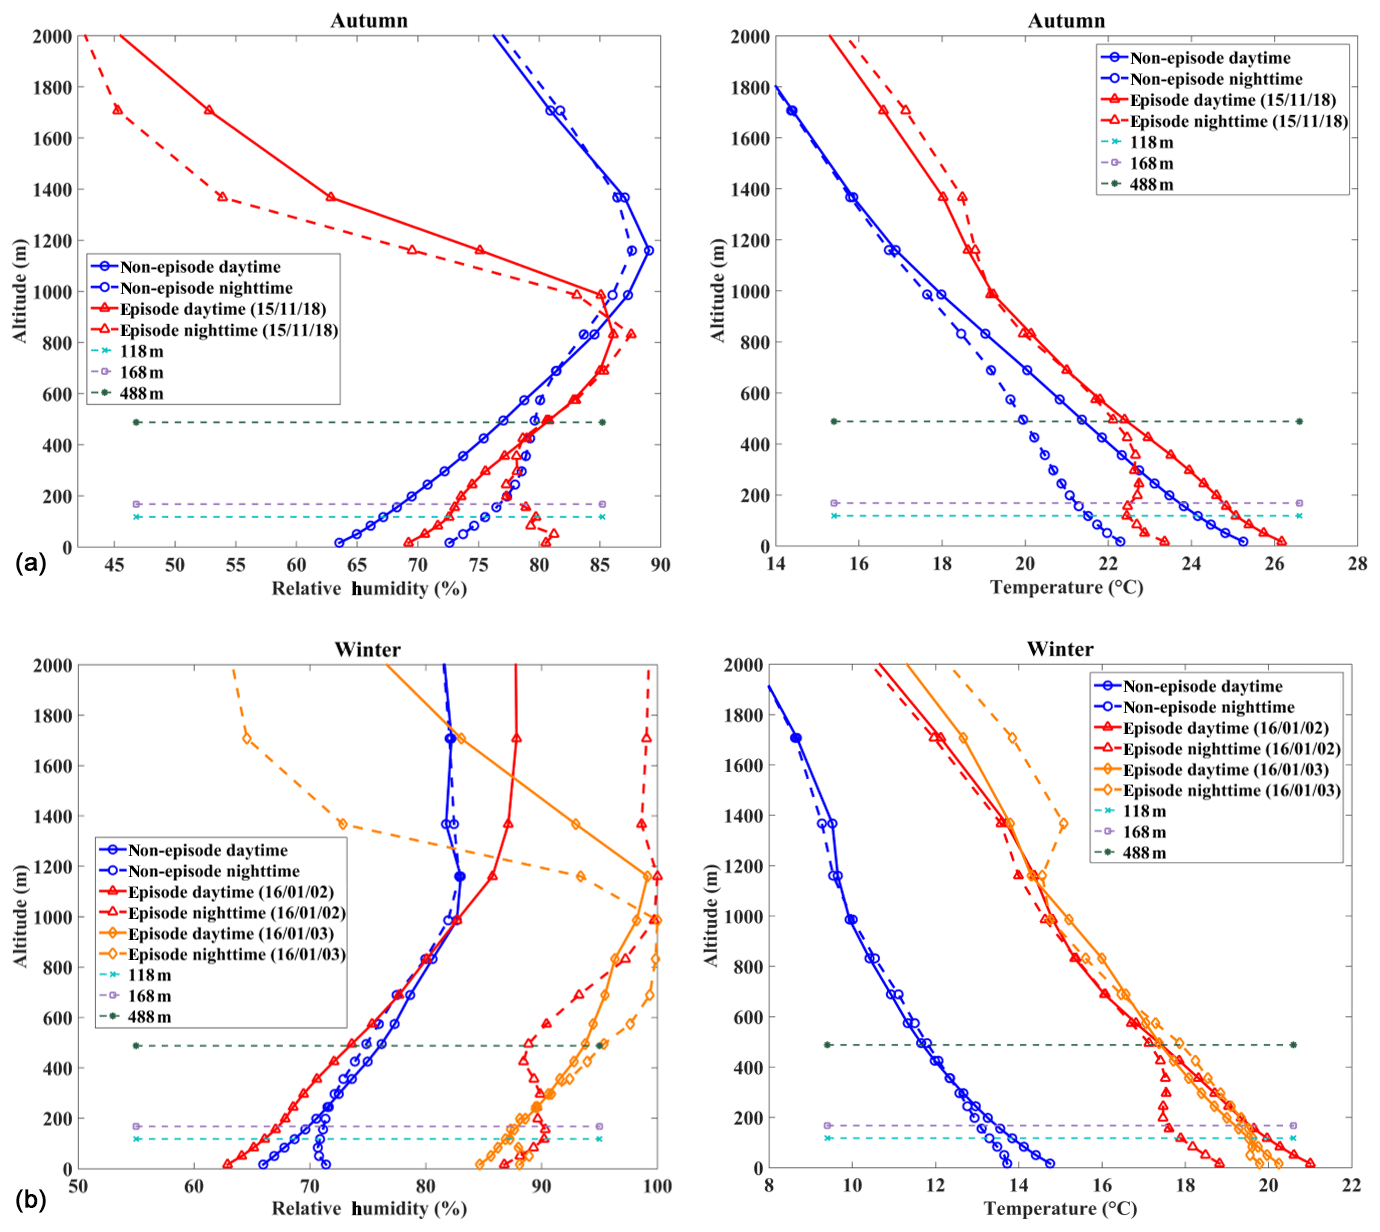
Figure 7Vertical profiles of relative humidity and temperature modeled by the WRF model for the (a) E1 autumnal and (b) E2 winter field studies as marked in Fig. 2. Dates are presented as year/month/day.
The E2 episode represented a typical pollution event in winter, showing a similar PM2.5 vertical distribution as E1. The highest sulfate, nitrate, ammonium, and OC concentrations were observed at 118 m (Fig. 3b). Horizontal wind was mainly from the north before noon (2 January) and changed to the south in the afternoon (Fig. S8b). Similar temperature and RH profiles were found for E2 as those for E1, which was characterized by low-altitude temperature inversion extending from 118 to 488 m on 2 January and from 50 to 168 m on 3 January, as well as a higher RH at higher levels during nighttime (Fig. 7b). Low-level cloud was observed during this period, associated with weak convection simulated by the WRF model (Figs. 8b and S11). The average SOR in PM2.5 was 0.36, 0.27, and 0.30 at ground level, 118 m, and 488 m, again higher than on non-event days. The average NOR was 0.13, 0.14, and 0.21 at ground level, 118 m, and 488 m, 2 or 3 times higher than on non-event days. Based on the above findings, a schematic graph was generated to illustrate one of the typical haze formation mechanisms in the PRD region in autumn and winter (Fig. 9). A calm wind zone was established over the PRD region during the later autumnal and winter pollution episodes due to the confrontation of southerly and northerly air masses, which have the potential to further transform into strong nocturnal temperature inversions. The stagnant atmospheric conditions inhibited the air pollution dispersion. Low-level cloud cover facilitated the surface aerosol pollution due to in-cloud processing, where secondary aerosols were produced from the intensive aqueous reactions within the clouds and cloud evaporation and redistributed residual aerosols. Previous studies have shown high mixing ratios of gas-phase hydroxyl (OH) and peroxy (HO2, RO2) radicals in the PRD region (Hofzumahaus et al., 2009; Lu et al., 2012). High concentrations of hydrogen peroxide (H2O2) and O3 were also detected in this region (Hua et al., 2008; Wang et al., 2017). We did not measure these oxidants in either the gas or aqueous phases. However, it is reasonable to assume that these gas-phase oxidants might be scavenged by the clouds, which are then transferred into the cloud droplets and facilitate the aqueous-phase reactions. In addition, the temperature inversion layer disappeared during daytime, and downward vertical wind speed was found through the model results (Fig. 8), leading to favorable meteorological conditions which facilitate the release and downward transport of residual aerosols from evaporating low-level clouds. The aforementioned processes were confirmed in our study, which shows that the vertical concentrations of sulfate, nitrate, and ammonium increased with height during pollution episodes. Our results suggested that meteorology (such as nighttime temperature inversion and calm wind) together with aqueous-phase (cloud processing) and heterogeneous reactions would significantly contribute to the aerosol formation and haze episodes in the autumnal and winter seasons over the PRD region.
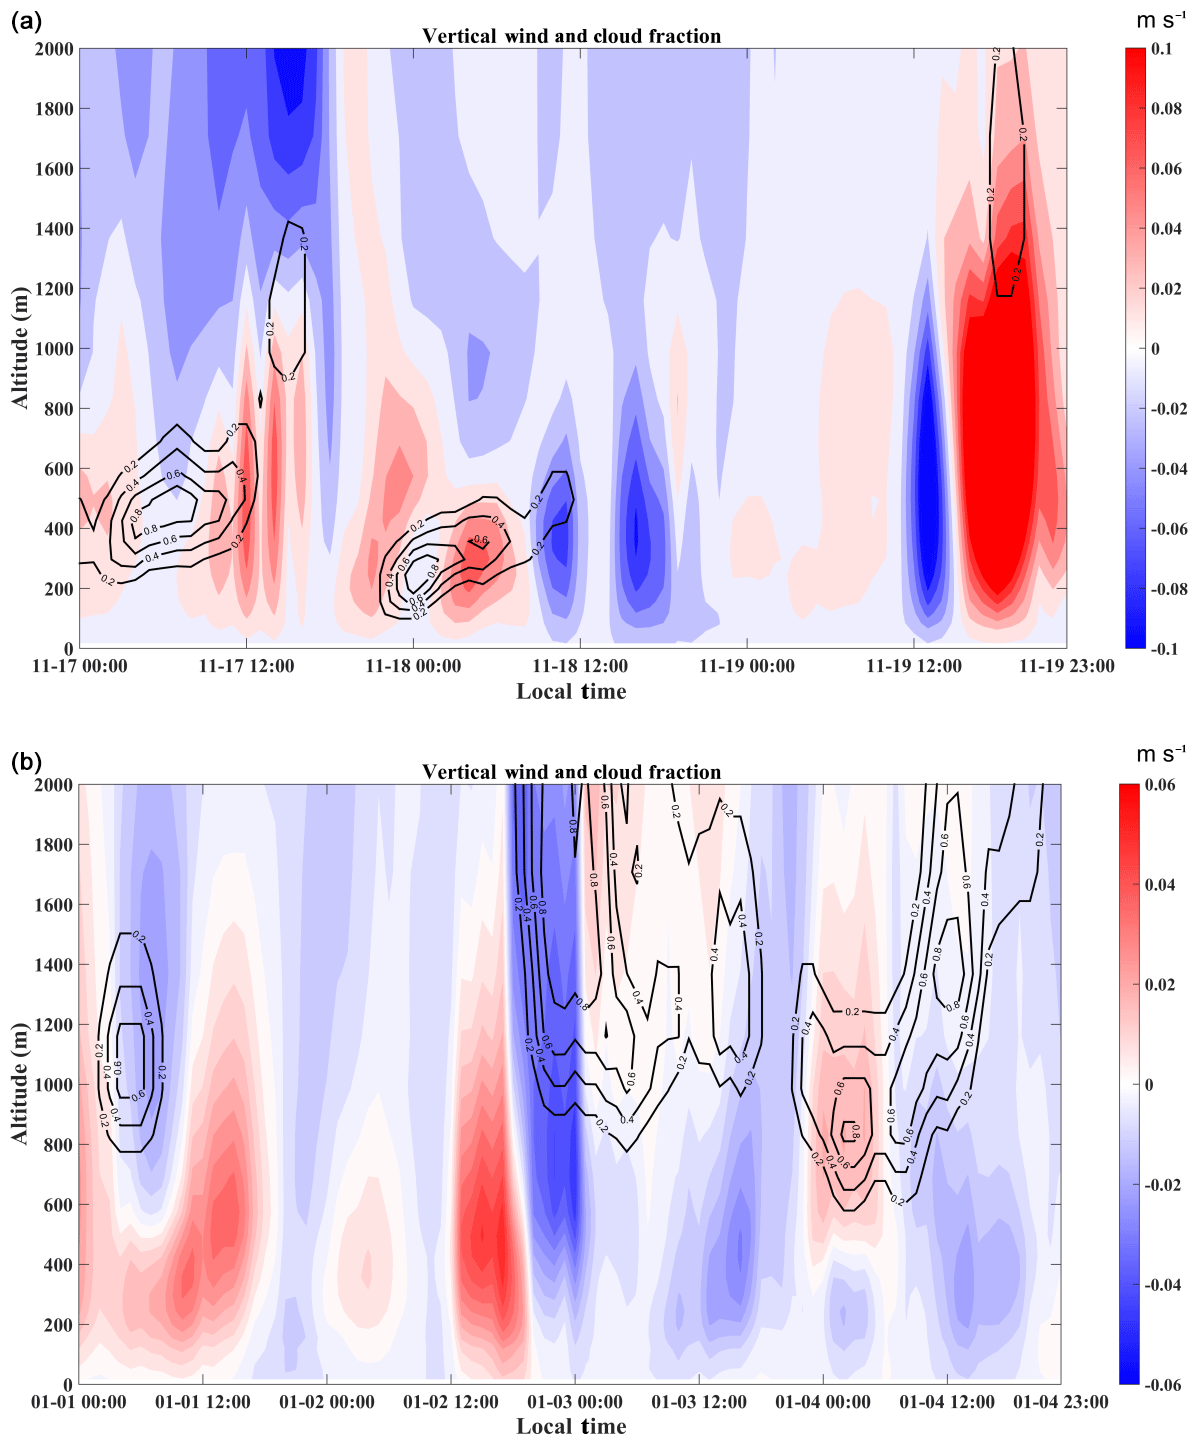
Figure 8Distribution of vertical wind (color scale: red – upward; blue – downward) and cloud fraction (black contour line) simulated by the WRF model during (a) autumnal and (b) winter episodes.
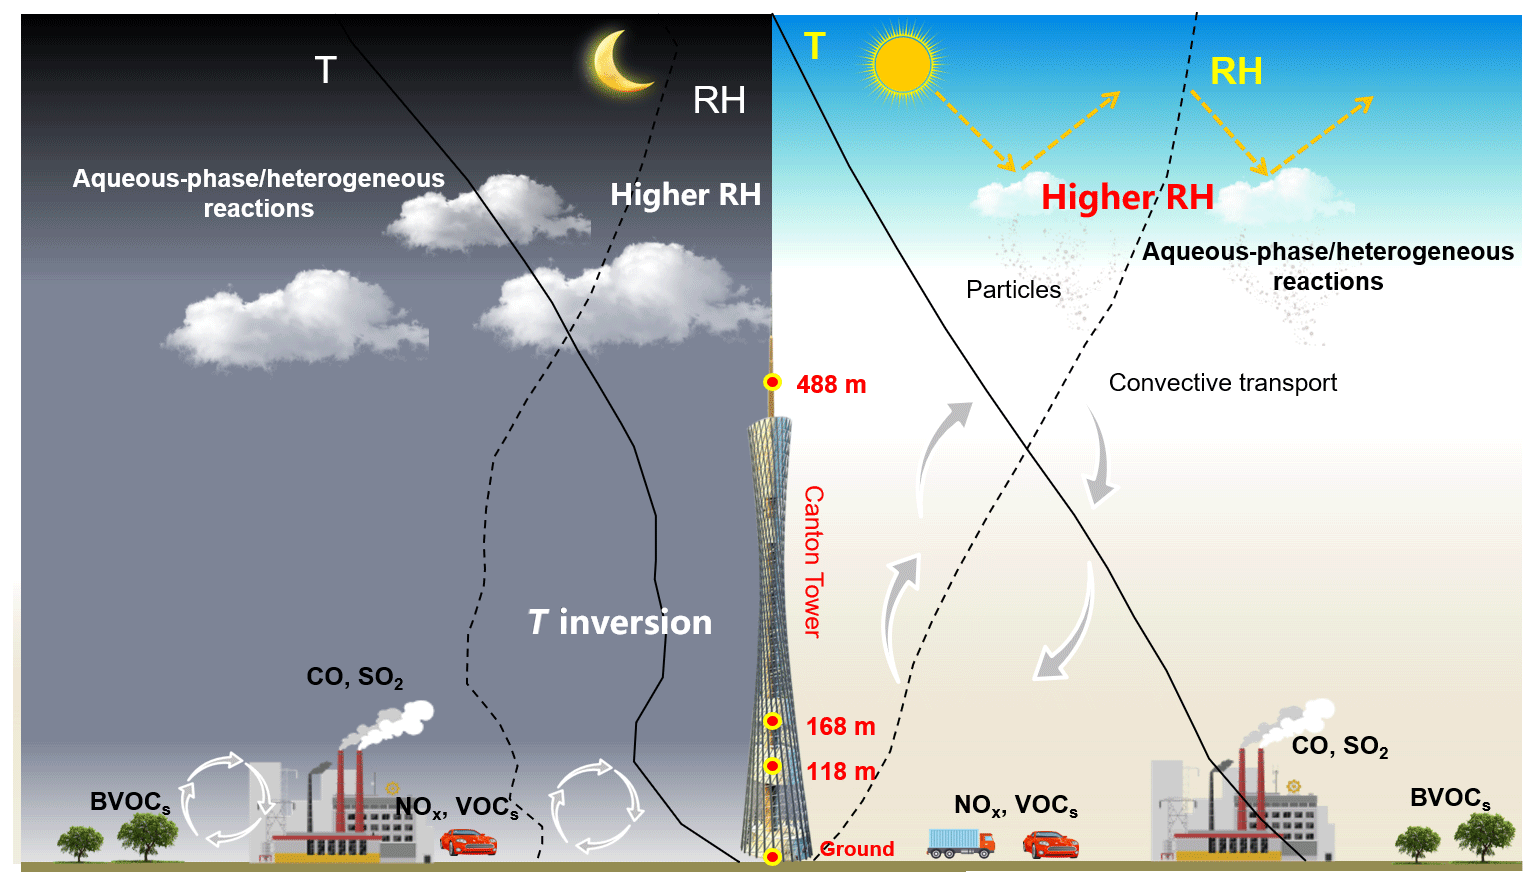
Figure 9Schematic graph illustrating a typical haze formation mechanism in the PRD region in autumn and winter.
3.4 Model simulation and implications
Vertical concentration distributions of sulfate, nitrate, and ammonium were further simulated by the WRF-Chem model. The description and configurations of the model can be found in the Supplement. Figure 10 shows the simulated vertical concentration profiles of sulfate, nitrate, and ammonium in autumn and winter and their comparison with observations. Sulfate was generally underestimated in the WRF-Chem model at the upper level, while it was in relatively good agreement with observations at ground level. Possible reasons for the underestimations of sulfate are as follows: (1) SO2 precursors were underestimated at the upper levels (by about 45 % to 77 %; Table S6) possibly due to the insufficient upward transport of SO2 in the current model, especially in urban areas where the urban canopy is low in resolution; and (2) heterogeneous/multiphase formations of sulfate in droplets or aerosol water have not been considered enough in current models (Chen et al., 2016; Cheng et al., 2016). Nitrate was overestimated by the WRF-Chem model. Here three reasons are put forward. First is the underestimation of how at the upper levels, which consumes less NH3, facilitates the formation of NH3NO4 in the fine mode (Tuccella et al., 2012). Second, the heterogeneous reaction of HNO3 on coarse-mode sea-salt aerosols, however, will reduce the formation of fine-mode nitrate (Chen et al., 2016). Therefore, sea-salt emissions in current models should be evaluated especially over the coastal regions. Third, the cloud fraction and liquid water content may not be well simulated in the model. For ammonium, the simulated concentrations were overall consistent with the measured ones except for being slightly overestimated at ground level. The large discrepancies between the observation and simulation of sulfate and nitrate suggested that physical and chemical mechanisms in the current WRF-Chem models still need to be improved to better predict aerosol mass and composition. Based on our observations, in-cloud aqueous-phase reactions and heterogeneous reactions should play important roles in sulfate and nitrate formation; thus, they need to be refined in the model. The evaluation of the WRF-Chem model incorporating the above-mentioned mechanisms is beyond the scope of this study, and an in-depth investigation needs to be done in future. Hence, more studies, such as long-term aerosol and high-frequency micrometeorological measurements (Valiulis et al., 2002; Ceburnis et al., 2008; Ervens, 2015), are needed to identify the key aerosol sources and formation pathways and to further improve the air-quality models.
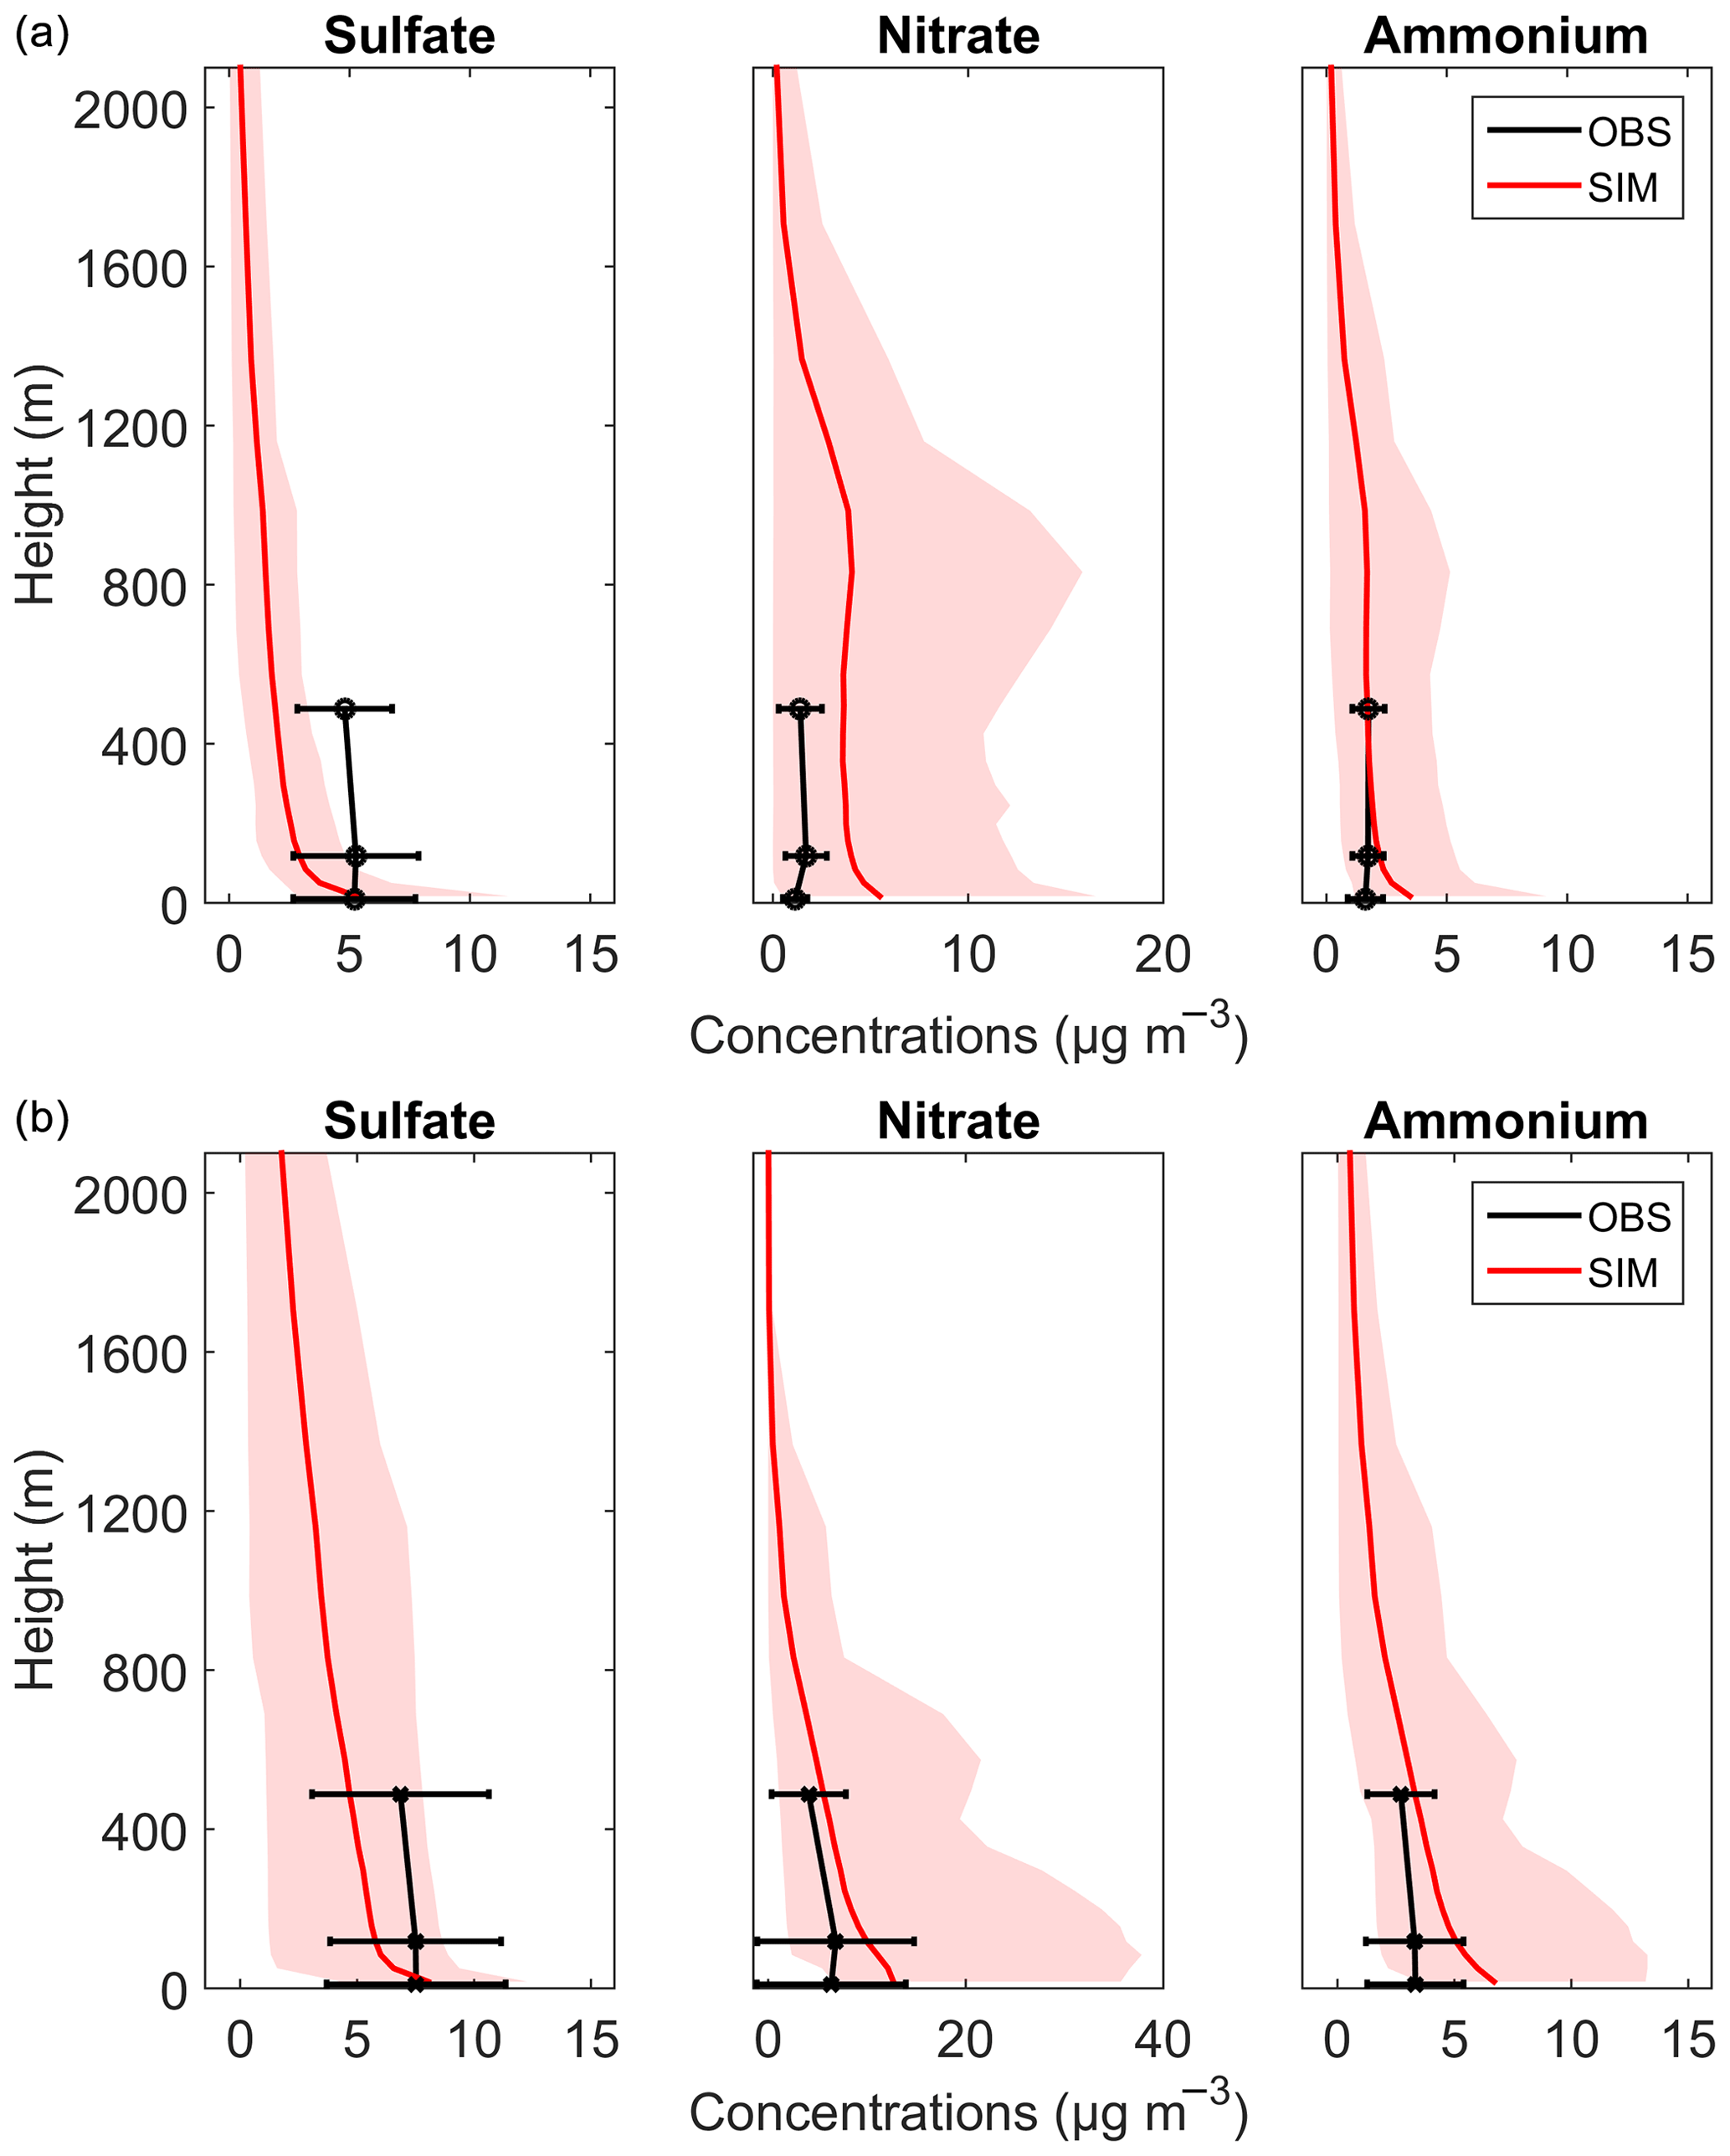
Figure 10The vertical concentration profiles of sulfate, nitrate, and ammonium in PM2.5 during (a) autumn and (b) winter. The solid red lines are the average modeled concentrations, and the shaded regions indicate the minimum and maximum values of the simulation. The average measurement data are in black with horizontal error bars.
Vertical characteristics and potential formation processes of size-resolved aerosols were studied during the autumnal and winter seasons, utilizing the 610 m Canton Tower in Guangzhou. Complex vertical variations in PM composition were observed. In autumn, sulfate and ammonium had shallower vertical gradients than nitrate, which showed higher concentrations at higher observation levels. OC and EC showed steeper vertical gradients, with concentrations 34.0 % and 27.9 % lower at 488 m than at ground level. The chemical components of the fine particles showed more pronounced and complex vertical gradients in winter than in autumn possibly due to the effects of atmospheric stability, regional transport, and chemical reactions. The percentage of secondary inorganic ions in fine particles generally increased with height. The size distributions of sulfate and ammonium were similar at the three heights during the observation, characterized by a dominant droplet mode. Bimodal size distributions in autumn and a unimodal mode in winter were observed for nitrate, suggesting different formation pathways for nitrate in different seasons. Na+ and Cl− exhibited dominant unimodal distributions in the range of 2.5–10 µm in autumn, associated with the regional transport of sea salt. Na+ and Cl− size distributions were dominant in the fine mode in winter. OC and EC were generally observed in the fine mode with a comparatively broad size distribution. Our study indicated that vertical meteorological parameters, such as RH and T, and the aqueous and heterogeneous atmospheric chemical reactions altogether led to the aerosol formation and haze episodes in the PRD region. We further simulated the vertical concentration distributions of sulfate, nitrate, and ammonium using the WRF-Chem model, and we found that the current model could not reproduce them well. Overall, the results of this study can help improve our understanding of the formation of atmospheric aerosols in polluted subtropical environments and can be used to refine global models that simulate the aerosol properties.
The atmospheric particulate matter data used for analysis are available in the Supplement, and the data are also available upon request from the corresponding author.
The supplement related to this article is available online at: https://doi.org/10.5194/acp-20-6435-2020-supplement.
SZ and XW designed and led the study. SZ, HZ, JZ, YC, and JK contributed to aerosol measurements. SZ, JG, and WC carried out the data analysis. LW and WC performed the model simulations. JZ, YFC, YS, PF, JT, and SJ discussed the results and commented on the paper. SZ wrote the paper with contributions from all coauthors.
The authors declare that they have no conflict of interest.
This work was funded by the National Key Research and Development Program of China (2017YFC0210104, 2016YFC0203305), the National Natural Science Foundation of China (41505106, 41875152, 21577177), the National Science Fund for Distinguished Young Scholars (41425020), the Fundamental Research Funds for the Central Universities (16lgpy28), and the National Natural Science Foundation as a key project (91644215, 41630422). The authors thank Li Yang, Qi Zhang, Wenchao Ji, Yuanyuan Jia, Zuozhi Zhong, Hao Liu, Xiaoran Liu, Xiaodong Zhang, and Guo Xu for their support in aerosol sample collection and analysis. We also acknowledge the financial support of Guangzhou Environmental Protection Bureau and the State Key Laboratory of Atmospheric Boundary Layer Physics and Atmospheric Chemistry at the Institute of Atmospheric Physics.
This research has been supported by the National Key Research and Development Program of China (grant nos. 2017YFC0210104, 2016YFC0203305), the National Natural Science Foundation of China (grant nos. 41505106, 41875152, 21577177), the National Science Fund for Distinguished Young Scholars (grant no. 41425020), the Fundamental Research Funds for the Central Universities (grant no. 16lgpy28), and the National Natural Science Foundation as a key project (grant nos. 91644215, 41630422).
This paper was edited by Barbara Ervens and reviewed by four anonymous referees.
An, Z. S., Huang, R. J., Zhang, R. Y., Tie, X.X, Li, G. H., Cao, J. J., Zhou, W.J., Shi, Z. G., Han, Y. M., Gu, Z. L., and Ji, Y. M.: Severe haze in northern China: A synergy of anthropogenic emissions and atmospheric processes, P. Natl. Acad. Sci. USA, 116, 8657–8666, https://doi.org/10.1073/pnas.1900125116, 2019.
Anlauf, K., Li, S. M., Leaitch, R., Brook, J., Hayden, K., Toom-Sauntry, D., and Wiebe, A.: Ionic composition and size characteristics of particles in the Lower Fraser Valley: Pacific 2001 field study, Atmos. Environ., 40, 2662–2675, https://doi.org/10.1016/j.atmosenv.2005.12.027, 2006.
Bian, Q., Huang, X. H. H., and Yu, J. Z.: One-year observations of size distribution characteristics of major aerosol constituents at a coastal receptor site in Hong Kong – Part 1: Inorganic ions and oxalate, Atmos. Chem. Phys., 14, 9013–9027, https://doi.org/10.5194/acp-14-9013-2014, 2014.
Brink, H. M: Reactive uptake of HNO3 and H2SO4 in sea-salt (NaCl) particles, J. Aerosol Sci., 1–2, https://doi.org/10.1016/S0021-8502(97)00460-6, 1998.
Cabada, J. C., Rees, S., Takahama, S., Khlystov, A., Pandis, S. N., Davidson, C. I., and Robinson, A. L.: Mass size distributions and size resolved chemical composition of fine particulate matter at the Pittsburgh supersite, Atmos. Environ., 38, 3127–3141, https://doi.org/10.1016/j.atmosenv.2004.03.004, 2004.
Castro, L., Pio, C., Harrison, R. M., and Smith, D.: Carbonaceous Aerosol in Urban and Rural European Atmospheres: Estimation of Secondary Organic Carbon Concentrations, Atmos. Environ., 33, 2771–2781, https://doi.org/10.1016/S1352-2310(98)00331-8, 1999.
Cao, J. J., Lee, S. C., Ho, K. F., Zou, S. C., Fung, K., Li, Y., Watson, J. G., and Chow, J. C.: Spatial and seasonal variations of atmospheric organic carbon and elemental carbon in Pearl River Delta Region, China, Atmos. Environ., 38, 4447–4456, https://doi.org/10.1016/j.atmosenv.2004.05.016, 2004.
Ceburnis, D., Dowd, C. D. O', Jennings, G. S., Facchini, M. C., Emblico, L., Decesari, S., Fuzzi, S., and Sakalys, J.: Marine aerosol chemistry gradients: Elucidating primary and secondary processes and fluxes, Geophys. Res. Let., 35, L07804, https://doi.org/10.1029/2008GL033462, 2008.
Chan, C. K. and Yao, X. H.: Air pollution in mega cities in China, Atmos. Environ., 42, 1–42, https://doi.org/10.1016/j.atmosenv.2007.09.003, 2008.
Chan, C. Y., Xu, X. D., Li, Y. S., Wong, K. H., Ding, G. A., Chan, L. Y., and Cheng, X. H.: Characteristics of vertical profiles and sources of PM2.5, PM10 and carbonaceous species in Beijing, Atmos. Environ., 39, 5113–5124, https://doi.org/10.1016/j.atmosenv.2005.05.009, 2005.
Chen, W., Wang, X., Cohen, J. B., Zhou, S., Zhang, Z., Chang, M., and Chan, C.-Y.: Properties of aerosols and formation mechanisms over southern China during the monsoon season, Atmos. Chem. Phys., 16, 13271–13289, https://doi.org/10.5194/acp-16-13271-2016, 2016.
Chen, Y., Wild, O., Wang, Y., Ran, L., Teich, M., Größ, J., Wang, L., Spindler, G., Herrmann, H., van Pinxteren, D., McFiggans, G., and Wiedensohler, A.: The influence of impactor size cut-off shift caused by hygroscopic growth on particulate matter loading and composition measurements, Atmos. Environ., 195, 141–148, https://doi.org/10.1016/j.atmosenv.2018.09.049, 2018.
Cheng, Y. F., Zheng, G. J., Wei, C., Mu, Q., Zheng, B., Wang, Z. B., Gao, M., Zhang, Q., He, K. B., Carmichael, G., Pöschl, U., and Su, H.: Reactive nitrogen chemistry in aerosol water as a source of sulfate during haze events in China, Sci. Adv., 2, e1601530, https://doi.org/10.1126/sciadv.1601530, 2016.
Chow, J. C., Watson, J. G., Crow, D., Lowenthal, D. H., and Merrifield, T.: Comparison of IMPROVE and NIOSH carbon measurements, Aerosol. Sci. Technol., 34, 23–34, https://doi.org/10.1080/02786820119073, 2001.
Chow, J. C., Lowenthal, D. H., Chen, L. W. Antony, Wang, X. L., and Watson, J. G.: Mass reconstruction methods for PM2.5: a review, Air Quality, Atmos. Health, 8, 243–263, https://doi.org/10.1007/s11869-015-0338-3, 2015.
Deng, X. J., Li, F., Li, Y. H., Li, J. Y., Huang, H. Z., and Liu, X. T.: Vertical distribution characteristics of PM in the surface layer of Guangzhou, Particuology, 20, 3–9, https://doi.org/10.1016/j.partic.2014.02.009, 2014.
Ding, X. X., Kong, L. D., Du, C. T., Zhanzakova, A., Fu, H. B., Tang, X. F., Wang, L., Yang, X., Chen, J. M., and Cheng, T. T.: Characteristics of size-resolved atmospheric inorganic and carbonaceous aerosols in urban Shanghai, Atmos. Environ., 167, 625–641, https://doi.org/10.1016/j.atmosenv.2017.08.043, 2017.
Draxler, R. R. and Hess, G. D.: An overview of the HYSPLIT_4 modelling system for trajectories, dispersion, and deposition, Aust. Met. Mag., 47, 295–308, 1998.
Ervens, B.: Modeling the Processing of Aerosol and Trace Gases in Clouds and Fogs. Chem. Rev., 115, 4157–4198, https://doi.org/10.1021/cr5005887, 2015.
Fan, Q., Lan, J., Liu, Y. M. Wang, X. M., Chan, P. W., Hong, Y. Y., Feng, Y. R., Liu, Y. X., Zeng, Y. J., and Liang, G. X.: Process analysis of regional aerosol pollution during spring in the Pearl River Delta region, China, Atmos. Environ., 122, 829–838, https://doi.org/10.1016/j.atmosenv.2015.09.013, 2015.
Feingold, G., Kreidenweis, S. M., Stevens, B., and Cotton, W. R.: Numerical simulations of stratocumulus processing of cloud condensation nuclei through collision-coalescence, J. Geophys. Res.-Atmos., 101, 21391–21402, https://doi.org/10.1029/96jd01552, 1996.
Fu, X., Wang, T., Wang, S. X., Zhang, L., Cai, S., Xing, J., and Hao, J. M.: Anthropogenic emissions of hydrogen chloride and fine particulate chloride in China, Environ. Sci. Technol., 52, 1644–1654, https://doi.org/10.1021/acs.est.7b05030, 2018.
Guinot, B., Roger, J. C., Cachier, H., Pucai, W., Bai, J. H., and Tong, Y.: Impact of vertical atmospheric structure on Beijing aerosol distribution, Atmos. Environ., 40, 5167–5180, https://doi.org/10.1016/j.atmosenv.2006.03.051, 2006.
Guo, S., Hu, M., Wang, Z. B., Slanina, J., and Zhao, Y. L.: Size-resolved aerosol water-soluble ionic compositions in the summer of Beijing: implication of regional secondary formation, Atmos. Chem. Phys., 10, 947–959, https://doi.org/10.5194/acp-10-947-2010, 2010.
Guo, Y.: Size distribution characteristics of carbonaceous aerosol in a rural location in northwestern China, Air Quality, Atmos. Health, 9, 193–200, https://doi.org/10.1007/s11869-015-0322-y, 2016.
Harrison, R. M. and Kitto, A. M.: Field intercomparison of filter pack and denuder sampling methods for reactive gaseous and particulate pollutants, Atmos. Environ. A., 24, 2633–2640, https://doi.org/10.1016/0960-1686(90)90142-A, 1990.
Harrison, R. M. and Pio, C. A.: Size-differentiated composition of inorganic atmospheric aerosols of both marine and polluted continental origin, Atmos. Environ. (1967), 17, 1733–1738, https://doi.org/10.1016/0004-6981(83)90180-4, 1983.
Harrison, R. M. , Dall'Osto, M., Beddows, D. C. S. , Thorpe, A. J., Bloss, W. J. , Allan, J. D., Coe, H., Dorsey, J. R., Gallagher, M., Martin, C., Whitehead, J., Williams, P. I., Jones, R. L., Langridge, J. M., Benton, A. K., Ball, S. M., Langford, B., Hewitt, C. N., Davison, B., Martin, D.,Petersson, K. F., Henshaw, S. J., White, I. R., Shallcross, D. E., Barlow, J. F., Dunbar, T., Davies, F., Nemitz, E., Phillips, G. J., Helfter, C., Di Marco, C. F., and Smith, S.: Atmospheric chemistry and physics in the atmosphere of a developed megacity (London): an overview of the REPARTEE experiment and its conclusions, Atmos. Chem. Phys., 12, 3065–3114, https://doi.org/10.5194/acp-12-3065-2012, 2012.
Hering, S. V. and Friedlander, S.: Origins of aerosol sulfur size distributions in the Los Angeles basin, Atmos. Environ. (1967), 16, 2647–2656, https://doi.org/10.1016/0004-6981(82)90346-8, 1982.
Hinds, W. C.: Aerosol Technology: Properties, Behavior, and Measurement of Airborne Particles, 2nd Edition, Wiley, 1999.
Hofzumahaus, A., Rohrer, F., Lu, K. D., Bohn, B., Brauers, T., Chang, C. C., Fuchs, H., Holland, F., Kita, K., Kondo, Y., Li, X., Lou, S. Y., Shao, M., Zeng, L., Wahner, A., and Zhang, Y. H.: Amplified Trace Gas Removal in the Troposphere, Science, 324, 1702–1704, 2009.
Hoppel, W. A., Fitzgerald, J. W., and Larson, R. E.: Aerosol size distributions in air masses advecting off the east coast of the United States, J. Geophys. Res.-Atmos., 90, 2365–2379, https://doi.org/10.1029/JD090iD01p02365, 1985.
Hua, W., Chen, Z. M., Jie, C. Y., Kondo, Y., Hofzumahaus, A., Takegawa, N., Chang, C. C., Lu, K. D., Miyazaki, Y., Kita, K., Wang, H. L., Zhang, Y. H., and Hu, M.: Atmospheric hydrogen peroxide and organic hydroperoxides during PRIDE-PRD'06, China: their concentration, formation mechanism and contribution to secondary aerosols, Atmos. Chem. Phys., 8, 6755–6773, https://doi.org/10.5194/acp-8-6755-2008, 2008.
Huang, R. J., Zhang, Y. L., Bozzetti, C., Ho, K. F., Cao, J. J., Han, Y., Daellenbach, K. R., Slowik, J. G., Platt, S. M., Canonaco, F., Zotter, P., Wolf, R., Pieber, S. M., Bruns, E. A., Crippa, M., Ciarelli, G., Piazzalunga, A., Schwikowski, M., Abbaszade, G., Schnelle-Kreis, J., Zimmermann, R., An, Z. S., Szidat, S., Baltensperger, U., Haddad, I. E., and Prevot, A. S. H.: High secondary aerosol contribution to particulate pollution during haze events in China, Nature, 514, 218–222, https://doi.org/10.1038/nature13774, 2014.
Huang, X. F., Yu, J. Z., He, L. Y., and Hu, M.: Size Distribution Characteristics of Elemental Carbon Emitted from Chinese Vehicles: Results of a Tunnel Study and Atmospheric Implications, Environ. Sci. Technol., 40, 5355–5360, https://doi.org/10.1021/es0607281, 2006.
Huang, X.-F. and Yu, J. Z.: Size distributions of elemental carbon in the atmosphere of a coastal urban area in South China: characteristics, evolution processes, and implications for the mixing state, Atmos. Chem. Phys., 8, 5843–5853, https://doi.org/10.5194/acp-8-5843-2008, 2008.
Jaffrezo, J.-L., Aymoz, G., and Cozic, J.: Size distribution of EC and OC in the aerosol of Alpine valleys during summer and winter, Atmos. Chem. Phys., 5, 2915–2925, https://doi.org/10.5194/acp-5-2915-2005, 2005.
Kerminen, V. M. and Wexler, A. S.: Growth laws for atmospheric aerosol particles: An examination of the bimodality of the accumulation mode, Atmos. Environ., 29, 3263–3275, https://doi.org/10.1016/1352-2310(95)00249-X, 1995.
Liang, C. S., Duan, F. K., He, K. B., and Ma, Y. L.: Review on recent progress in observations, source identifications and countermeasures of PM2.5, Environ. Int., 86, 150–170, https://doi.org/10.1016/j.envint.2015.10.016, 2016.
Liu, S., Hu, M., Slanina, S., He, L. Y., Niu, Y. W., Bruegemann, E., Gnauk, T., and Herrmann, H.: Size distribution and source analysis of ionic compositions of aerosols in polluted periods at Xinken in Pearl River Delta (PRD) of China, Atmos. Environ., 42, 6284–6295, https://doi.org/10.1016/j.atmosenv.2007.12.035, 2008.
Lu, K. D., Rohrer, F., Holland, F., Fuchs, H., Bohn, B., Brauers, T., Chang, C. C., Häseler, R., Hu, M., Kita, K., Kondo, Y., Li, X., Lou, S. R., Nehr, S., Shao, M., Zeng, L. M., Wahner, A., Zhang, Y. H., and Hofzumahaus, A.: Observation and modelling of OH and HO2 concentrations in the Pearl River Delta 2006: a missing OH source in a VOC rich atmosphere, Atmos. Chem. Phys., 12, 1541–1569, https://doi.org/10.5194/acp-12-1541-2012, 2012.
McNeill, V. F.: Aqueous Organic Chemistry in the Atmosphere: Sources and Chemical Processing of Organic Aerosols, Environ. Sci. Technol., 49, 1237–1244, https://doi.org/10.1021/es5043707, 2015.
Meng, Z. Y. and Seinfeld, J. H.: On the source of the submicrometer droplet mode of urban and regional aerosols, Aerosol. Sci. Technol., 20, 253–265, https://doi.org/10.1080/02786829408959681, 1994.
Ovadnevaite, J., Zuend, A., Laaksonen, A., Sanchez, K. J., Roberts, G., Ceburnis, D., Decesari, S., Rinaldi, M., Hodas, N., Facchini, M. C., Seinfeld J. H., and Dowd, C. O: Surface tension prevails over solute effect in organic-influenced cloud droplet activation, Nature, 546, 637–641, https://doi.org/10.1038/nature22806, 2017.
Öztürk, F., Bahreini, R., Wagner, N. L., Dubé, W. P., Young, C. J., Brown, S. S., Brock, C. A., Ulbrich, I. M., Jimenez, J. L., Cooper, O. R., and Middlebrook, A. M.: Vertically resolved chemical characteristics and sources of submicron aerosols measured on a Tall Tower in a suburban area near Denver, Colorado in winter, J. Geophys. Res.-Atmos., 118, 2013JD019923, https://doi.org/10.1002/2013JD019923, 2013.
Pakkanen, T. A.: Study of formation of coarse particle nitrate aerosol, Atmos. Environ., 30, 2475–2482, https://doi.org/10.1016/1352-2310(95)00492-0, 1996.
Pöschl, U.: Atmospheric aerosols: Composition, transformation, climate and health effects, Angew. Chem. Int. Ed., 44, 7520–7540, https://doi.org/10.1002/anie.200501122, 2005.
Seinfeld, J. H. and Pandis, S. N.: Atmospheric Chemistry and Physics: From air pollution to climate change, John Wiley & Sons, New York, 2006.
Shi, G. L., Tian, Y. Z., Han, S. Q., Zhang, Y. F., Li, X., Feng, Y. C., Wu, J. H., and Zhu, T.: Vertical characteristics of carbonaceous species and their source contributions in a Chinese mega city, Atmos. Environ., 60, 358–365, https://doi.org/10.1016/j.atmosenv.2012.06.069, 2012.
Skamarock, W. C., Klemp, J. B., Dudhia, J., Gill, D. O., Barker, D., Duda, M. G., and Powers, J. G.: A Description of the Advanced Research WRF Version 3, NCAR Technical Notes, NCAR/TN-4751STR, https://doi.org/10.5065/D68S4MVH, 2008.
Stelson, A. W. and Seinfeld, J. H.: Relative humidity and temperature dependence of the ammonium nitrate dissociation constant, Atmos. Environ., 16, 983–992, https://doi.org/10.1016/0004-6981(82)90184-6, 2007.
Sun, Y. L., Wang, Z., Fu, P. Q, Jiang, Q., Yang, T., Li, J., and Ge, X. L.: The impact of relative humidity on aerosol composition and evolution processes during wintertime in Beijing, China, Atmos. Environ., 77, 927–934, https://doi.org/10.1016/j.atmosenv.2013.06.019, 2013.
Sun, Y. L., Du, W., Wang, Q. Q., Zhang, Q., Chen, C., Chen, Y., Chen, Z., Fu, P. Q., Wang, Z., Gao, Z., and Worsnop, D. R.: Real-Time Characterization of Aerosol Particle Composition above the Urban Canopy in Beijing: Insights into the Interactions between the Atmospheric Boundary Layer and Aerosol Chemistry, Environ. Sci. Technol., 49, 11340–11347, https://doi.org/10.1021/acs.est.5b02373, 2015.
Tang, I. N.: Chemical and size effects of hygroscopic aerosols on light scattering coefficients, J. Geophys. Res.-Atmos., 101, 19245–19250, https://doi.org/10.1029/96jd03003, 1996.
Tao, J., Zhang, Z. S., Tan, H. B, Zhang, L. M., Wu, Y. F., Sun, J. R., Che, H. Z., Cao, J. J., Cheng, P., Chen, L. G., and Zhang, R. J.: Observational evidence of cloud processes contributing to daytime elevated nitrate in an urban atmosphere, Atmos. Environ., 186, 209–215, https://doi.org/10.1016/j.atmosenv.2018.05.040, 2018.
Tian, S. L., Pan, Y. P., and Wang, Y. S.: Size-resolved source apportionment of particulate matter in urban Beijing during haze and non-haze episodes, Atmos. Chem. Phys., 16, 1–19, https://doi.org/10.5194/acp-16-1-2016, 2016.
Tuccella, P., Curci, G., Visconti, G., Bessagnet, B., Menut, L., and Park, R. J.: Modeling of gas and aerosol with WRF/Chem over Europe: Evaluation and sensitivity study, J. Geophys. Res.-Atmos., 117, D03303, https://doi.org/10.1029/2011jd016302, 2012.
Valiulis, D., Ceburnis, D., Sakalys, J., and Kvietkus, K.: Estimation of atmospheric trace metal emissions in Vilnius City, Lithuania, using vertical concentration gradient and road tunnel measurement data, Atmos. Environ., 36, 6001–6014, https://doi.org/10.1016/S1352-2310(02)00764-1, 2002.
Wall, S. M., John, W., and Ondo, J. L.: Measurement of aerosol size distributions for nitrate and major ionic species, Atmos. Environ. (1967), 22, 1649–1656, https://doi.org/10.1016/0004-6981(88)90392-7, 1988.
Wan, X., Kang, S., Wang, Y., Xin, J., Liu, B., Guo, Y., Wen, T., Zhang, G., and Cong, Z.: Size distribution of carbonaceous aerosols at a high-altitude site on the central Tibetan Plateau (Nam Co Station, 473 0m a.s.l.), Atmos. Res., 153, 155–164, https://doi.org/10.1016/j.atmosres.2014.08.008, 2015.
Wang, G. H., Cheng, C. L., Huang, Y., Tao, J., Ren, Y. Q., Wu, F., Meng, J. J., Li, J. J., Cheng, Y. T., Cao, J. J., Liu, S. X., Zhang, T., Zhang, R., and Chen, Y. B.: Evolution of aerosol chemistry in Xi'an, inland China, during the dust storm period of 2013 – Part 1: Sources, chemical forms and formation mechanisms of nitrate and sulfate, Atmos. Chem. Phys., 14, 11571–11585, https://doi.org/10.5194/acp-14-11571-2014, 2014.
Wang, J., Zhou, M., Liu, B. S., Wu, J. H., Peng, X., Zhang, Y. F., Han, S. Q., Feng, Y. C., and Zhu, T.: Characterization and source apportionment of size-segregated atmospheric particulate matter collected at ground level and from the urban canopy in Tianjin, Environ. Pollut., 219, 982–992, https://doi.org/10.1016/j.envpol.2016.10.069, 2016.
Wang, Q., Sun, Y., Xu, W., Du, W., Zhou, L., Tang, G., Chen, C., Cheng, X., Zhao, X., Ji, D., Han, T., Wang, Z., Li, J., and Wang, Z.: Vertically resolved characteristics of air pollution during two severe winter haze episodes in urban Beijing, China, Atmos. Chem. Phys., 18, 2495–2509, https://doi.org/10.5194/acp-18-2495-2018, 2018.
Wang, T., Xue, L. K., Brimblecombe, P., Lam, Y.F., Li, L., Zhang, L.: Ozone pollution in China: A review of concentrations, meteorological influences, chemical precursors, and effects, Sci. Total Environ., 575, 1582–1596, https://doi.org/10.1016/j.scitotenv.2016.10.081, 2017.
Wang, X. F., Wang, W. X., Yang, L. X., Gao, X. M., Nie, W., Yu, Y. C., Xu, P. J., Zhou, Y., and Wang, Z.: The secondary formation of inorganic aerosols in the droplet mode through heterogeneous aqueous reactions under haze conditions, Atmos. Environ., 63, 68–76, https://doi.org/10.1016/j.atmosenv.2012.09.029, 2012.
Wu, M., Wu, D., Fan, Q., Wang, B. M., Li, H. W., and Fan, S. J.: Observational studies of the meteorological characteristics associated with poor air quality over the Pearl River Delta in China, Atmos. Chem. Phys., 13, 10755–10766, https://doi.org/10.5194/acp-13-10755-2013, 2013.
Wu, P. M. and Okada, K.: Nature of coarse nitrate particles in the atmosphere – a single particle approach, Atmos. Environ., 28, 2053–2060, https://doi.org/10.1016/1352-2310(94)90473-1, 1994.
Yao, X. H., Lau, A. P. S., Fang, M., Chan, C. K., and Hu, M.: Size distributions and formation of ionic species in atmospheric particulate pollutants in Beijing, China: 1-inorganic ions, Atmos. Environ., 37, 2991–3000, https://doi.org/10.1016/S1352-2310(03)00255-3, 2003.
Yun, H., Wang, W. H., Wang, T., Xia, M., Yu, C., Wang, Z., Poon, S. C. N., Yue, D. L., and Zhou, Y.: Nitrate formation from heterogeneous uptake of dinitrogen pentoxide during a severe winter haze in southern China, Atmos. Chem. Phys., 18, 17515–17527, https://doi.org/10.5194/acp-18-17515-2018, 2018.
Zauli Sajani, S., Marchesi, S., Trentini, A., Bacco, D., Zigola, C., Rovelli, S., Ricciardelli, I., Maccone, C., Lauriola, P., Cavallo, D. M., Poluzzi, V., Cattaneo, A., and Harrison, R. M.: Vertical variation of PM2.5 mass and chemical composition, particle size distribution, NO2, and BTEX at a high rise building, Environ. Pollut., 235, 339–349, https://doi.org/10.1016/j.envpol.2017.12.090, 2018.
Zhang, R. Y., Wang, G. H., Guo, S., Zamora, M. L., Ying, Q., Lin, Y., Wang, W. G., Hu, M., and Wang, Y.: Formation of Urban Fine Particulate Matter, Chem. Rev., 115, 3803–3855, https://doi.org/10.1021/acs.chemrev.5b00067, 2015.
Zhang, Y. F., Xu, H., Tian, Y. Z., Shi, G. L., Zeng, F., Wu, J. H., Zhang, X. Y., Li, X., Zhu, T., and Feng, Y. C.: The study on vertical variability of PM10 and the possible sources on a 220 m tower, in Tianjin, China, Atmos. Environ., 45, 6133–6140, https://doi.org/10.1016/j.atmosenv.2011.08.040, 2011.
Zhang, Y. H., Hu, M., Zhong, L. J., Wiedensohler, A., Liu, S., Andreae, M. O., Wang, W., and Fan, S. J.: Regional integrated experiments on air quality over Pearl River Delta 2004 (PRIDE-PRD2004): Overview, Atmos. Environ., 42, 6157–6173, https://doi.org/10.1016/j.atmosenv.2008.03.025, 2008.
Zhao, Y. L. and Gao, Y.: Mass size distributions of water-soluble inorganic and organic ions in size-segregated aerosols over metropolitan Newark in the US east coast, Atmos. Environ., 42, 4063–4078, https://doi.org/10.1016/j.atmosenv.2008.01.032, 2008.
Zheng, G. J., Duan, F. K., Su, H., Ma, Y. L., Cheng, Y., Zheng, B., Zhang, Q., Huang, T., Kimoto, T., Chang, D., Pöschl, U., Cheng, Y. F., and He, K. B.: Exploring the severe winter haze in Beijing: the impact of synoptic weather, regional transport and heterogeneous reactions, Atmos. Chem. Phys., 15, 2969–2983, https://doi.org/10.5194/acp-15-2969-2015, 2015.
Zhou, S. Z., Wang, T., Wang, Z., Li, W. J., Xu, Z., Wang, X. F., Yuan, C., Poon, C. N., Louie, P. K. K., Luk, C. W. Y., and Wang, W. X.: Photochemical evolution of organic aerosols observed in urban plumes from Hong Kong and the Pearl River Delta of China, Atmos. Environ., 88, 219–229, https://doi.org/10.1016/j.atmosenv.2014.01.032, 2014.
Zhuang, H., Chan, C. K., Fang, M., and Wexler, A. S.: Size distributions of particulate sulfate, nitrate, and ammonium at a coastal site in Hong Kong, Atmos. Environ., 33, 843–853, https://doi.org/10.1016/S1352-2310(98)00305-7, 1999a.
Zhuang, H., Chan, C. K., Fang, M., and Wexler, A. S.: Formation of nitrate and non-sea-salt sulfate on coarse particles, Atmos. Environ., 33, 4223–4233, https://doi.org/10.1016/S1352-2310(99)00186-7, 1999b.