the Creative Commons Attribution 4.0 License.
the Creative Commons Attribution 4.0 License.
 | 03 Jun 2020
Worsening urban ozone pollution in China from 2013 to 2017 – Part 2: The effects of emission changes and implications for multi-pollutant control
Yiming Liu
The Chinese government launched the Air Pollution Prevention and Control Action Plan in 2013, and various stringent measures have since been implemented, which have resulted in significant decreases in emissions and ambient concentrations of primary pollutants such as SO2, NOx, and particulate matter (PM). However, surface ozone (O3) concentrations have still been increasing in urban areas across the country. In a previous analysis, we examined in detail the roles of meteorological variation during 2013–2017 in the summertime surface O3 trend in various regions of China. In this study, we evaluated the effect of changes in multi-pollutant emissions from anthropogenic activities on O3 levels during the same period by using an up-to-date regional chemical transport model (WRF-CMAQ) driven by an interannual anthropogenic emission inventory. The Community Multiscale Air Quality (CMAQ) model was improved with regard to heterogeneous reactions of reactive gases on aerosol surfaces, which led to better model performance in reproducing the ambient concentrations of those gases. The model simulations showed that the maximum daily 8 h average (MDA8) O3 mixing ratio in urban areas increased by 0.46 ppbv per year (ppbv a−1) (p=0.001) from 2013 to 2017. In contrast, a slight decrease in MDA8 O3 by 0.17 ppbv a−1 (p=0.005) in rural areas was predicted, mainly attributable to the NOx emission reduction. The effects of changes in individual pollutant emissions on O3 were also simulated. The reduction of NOx emission increased the O3 levels in urban areas due to the nonlinear NOx and volatile organic compound (VOC) chemistry and decreasing aerosol effects; the slight increase in VOC emissions enhanced the O3 levels; the reduction of PM emissions increased the O3 levels by enhancing the photolysis rates and reducing the loss of reactive gases on aerosol surfaces; and the reduction of SO2 emissions resulted in a drastic decrease in sulfate concentrations, which increased O3 through aerosol effects. In contrast to the unfavorable effect of the above changes in pollutant emissions on efforts to reduce surface O3, the reduction of CO emissions did help to decrease the O3 level in recent years. The dominant cause of increasing O3 due to changes in anthropogenic emissions varied geographically. In Beijing, NOx and PM emission reductions were the two largest causes of the O3 increase; in Shanghai, the reduction of NOx and increase in VOC emissions were the two major causes; in Guangzhou, NOx reduction was the primary cause; in Chengdu, the PM and SO2 emission decreases contributed most to the O3 increase. Regarding the effects of decreasing concentrations of aerosols, the drop in heterogeneous uptake of reactive gases – mainly HO2 and O3 – was found to be more important than the increase in photolysis rates. The adverse effect of the reductions of NOx, SO2, and PM emissions on O3 abatement in Beijing, Shanghai, Guangzhou, and Chengdu would have been avoided if the anthropogenic VOCs emission had been reduced by 24 %, 23 %, 20 %, and 16 %, respectively, from 2013 to 2017. Our analysis revealed that the NOx reduction in recent years has helped to contain the total O3 production in China. However, to reduce O3 levels in major urban and industrial areas, VOC emission controls should be added to the current NOx-SO2-PM policy.
- Article
(4780 KB) - Companion paper
-
Supplement
(5787 KB) - BibTeX
- EndNote


China has experienced severe haze pollution due to high concentrations of particulate matter (PM) in the past decade (e.g., Guo et al., 2014; Huang et al., 2014). To alleviate this air-quality problem, the Chinese government launched the Air Pollution Prevention and Control Action Plan in 2013 and has since implemented various emission-control measures (Zhang et al., 2019). Anthropogenic emissions of sulfur dioxide (SO2), nitrogen oxides (NOx), carbon monoxide (CO), and PM2.5 (PM with an aerodynamic diameter less than 2.5 µm) in China were reduced by 59 %, 21 %, 23 %, and 33 % from 2013 to 2017, respectively, while the emission of volatile organic compounds (VOCs) increased slightly (Zheng et al., 2018). As a result, ambient concentrations of SO2, NO2, CO, PM2.5, and PM10 (PM with an aerodynamic diameter less than 10 µm) have declined, according to data from national environmental monitoring stations (http://www.mee.gov.cn, last access: 18 January 2020; Fig. S1 in the Supplement). However, surface ozone (O3) concentrations in urban and surrounding areas increased from 2013 to 2017 (Lu et al., 2018). It is of critical importance to evaluate the effects of the existing control policies on atmospheric O3 and refine these, if necessary, to improve overall air quality.
Ground-level O3 is produced by chemical reactions involving NOx, CO, and VOCs in the presence of sunlight. The key step in O3 formation is the oxidation of nitric oxide (NO) by hydroperoxyl (HO2) and alkylperoxyl (RO2) to form NO2, with subsequent photolysis of NO2. It is well known that the relationship between O3 and its precursors is nonlinear and that NOx can either suppress or increase O3 formation depending on its abundance relative to VOCs (and CO) (e.g., Atkinson, 2000; T. Wang et al., 2017). A large body of literature has established that O3 formation in urban centers is generally VOCs limited; that is, reducing VOC emissions leads to a decrease in O3 concentrations, but reducing NOx emissions has the opposite result; in contrast, O3 formation above rural areas is typically in the NOx-limited or transitional regime, in which reducing NOx emissions results in decreased O3 (NRC, 1991; Atkinson, 2000; T. Wang et al., 2017). Any process that perturbs HO2 and RO2 radicals will also affect O3 production (e.g., J. Li et al., 2018). Therefore, elucidating the chemical drivers of O3 changes requires understanding the abundance and proportions of O3 precursors and the radicals involved in O3 formation. Aerosols in the atmosphere can affect O3 concentrations via altering the solar actinic flux, which photolyzes gases to initiate oxidation (Li et al., 2011; Xing et al., 2017) and via heterogeneous reactions of reactive gases on aerosol surfaces (J. Li et al., 2018; Stadtler et al., 2018; Lou et al., 2014).
Several studies have attempted to uncover the chemical drivers of the recent O3 increase in China. Using a regional chemical transport model (WRF-CMAQ), P. F. Wang et al. (2019) derived the variation of maximum daily 8 h average (MDA8) O3 due to emission changes during 2013–2015 by subtracting the simulated changes due to meteorological variations from the total observed changes. They found that the increase in O3 concentrations in 2014–2015 relative to 2013 was mainly due to the emission changes, and they speculated that the decrease in PM2.5 concentrations and the reduction of NOx emission in VOC-limited regions could be the causes. In their study, however, the effects of emission changes during the study period were not explicitly simulated with interannual emissions. Li et al. (2019) utilized a global model (GEOS-Chem) to simulate the MDA8 O3 in 2013 and 2017 and conducted sensitivity experiments for the effects of changes in PM2.5 concentrations and anthropogenic emissions of O3 precursors (NOx and VOCs). Their results indicated that the drastic decrease in the PM2.5 concentrations (∼40 %) during the period, which reduced the uptake of HO2 on aerosol surfaces, was the main reason for the O3 increase in the North China Plain (NCP). N. Wang et al. (2019) simulated the effect of NOx emission reduction during 2012–2016 with the WRF-CMAQ model in eastern China, which indicated increasing surface O3 in urban areas due to the reduction of NOx emissions. Yu et al. (2019) applied the Kolmogorov–Zurbenko filtering technique to the observed MDA8 O3 during 2013–2017 in the Yangtze River Delta region and concluded that the changes in O3 precursor emissions contributed 76.7 % to the O3 increase, compared with 22 % due to the decrease in PM2.5 concentration.
We have been further investigating the meteorological and chemical driver(s) of the increasing summer surface O3 in urban areas of China during 2013–2017 using an improved regional chemical transport model (WRF-CMAQ) driven by interannual meteorological data and anthropogenic emission inventories. The role of meteorological variation and total emission changes, the effect of changes in individual meteorological factors, and the impact of changes in long-range transport of O3 and its precursors from outside the modeling domain are discussed in a companion paper (Part 1; Liu and Wang, 2020). The goal of the present work is to quantify (1) the effect of the changes in anthropogenic emissions of individual pollutants (NOx, VOCs, CO, PM, SO2, and NH3) on urban O3, which has not been addressed in the aforementioned studies but is important for further development of mitigation policy and (2) the effects of changes in aerosol concentrations on O3 using a regional model with up-to-date radical sources and heterogeneous reactions. The improved model should give a more realistic account of gas–particle interactions crucial to O3 formation, compared with its earlier version. In Sect. 2, we briefly introduce the model system and experiment settings; Sect. 3 first compares the simulated reactive gases that are subject to significant heterogeneous reactions with the observations reported in the literature. We then quantify the simulated trends of MDA8 O3 in urban and rural areas during 2013–2017. We further investigate the response of MDA8 O3 to the changes in individual pollutant emissions from anthropogenic activities from 2013 to 2017. We then examine the effect of aerosols on the O3 changes by altering the photolysis rates and heterogeneous reactions. Lastly, we conduct numerical sensitivity experiments to calculate the magnitude of VOCs emission reductions needed to overcome the adverse effect of other pollutant reductions on the goal of O3 mitigation. Section 4 gives the conclusions.
2.1 Model settings and emission inputs
The CMAQ model (Community Multiscale Air Quality model, version 5.2.1) driven by the Weather Research and Forecasting (WRF) model and the interannual Multi-resolution Emission Inventory for China (MEIC; http://www.meicmodel.org, last access: 18 January 2020) was applied to conduct the simulations in this study. The model settings and emission inputs are described in the companion paper (Liu and Wang, 2020). The CMAQ model is an offline chemical transport model (Byun and Schere, 2006) that does not consider the effect of pollutants on meteorology but applies an in-line method (Binkowski et al., 2007) that uses the aerosol and O3 concentrations predicted within a simulation to calculate the solar radiation and photolysis rates. As a result, the model takes into consideration the effect of aerosols on O3 formation via altering the photolysis rates.
2.2 Updating heterogeneous reactions
The heterogeneous reactions in the original CMAQ model (version 5.2.1) include only the absorptions of NO2, NO3, and N2O5 on aerosol surfaces. To faithfully reproduce the effect of aerosols on O3 via scavenging gaseous pollutants, we updated the heterogeneous reaction rate of NO2 and NO3 on the aerosol surface and incorporated additional heterogeneous reactions of gases into the CMAQ model, namely those of HO2, O3, OH, and H2O2 (refer to Table S2 in the companion paper (Liu and Wang, 2020) for the detailed heterogeneous reactions in the original and updated CMAQ models). The uptake coefficients (γ) of gases are the key parameters of heterogeneous reactions, but they vary according to factors such as aerosol water content and aerosol composition. In this study, we selected the “best guess” uptake coefficients for the gases, which have been widely used in chemical transport models in previous studies.
The uptake coefficient of N2O5 in the original CMAQ model was incorporated by Sarwar et al. (2012), based on the parameterization developed by Bertram and Thornton (2009) that considered its dependence on particle liquid water, particulate nitrate, and chloride.
The heterogeneous reaction rate of NO2 in the original CMAQ model was suggested by Kurtenbach et al. (2001), based on the measurements at a relative humidity of 50 % under dark conditions. Field and laboratory studies found that the rate not only depends on the relative humidity (Qin et al., 2009; Stutz et al., 2004) but also on sunlight intensity (Ndour et al., 2008; Stemmler et al., 2007). Fu et al. (2019) developed a new parameterization for the NO2 heterogeneous reaction rate that considered both these factors, which has improved the simulation of the reaction product, i.e., nitrous acid (HONO). This parameterization was adopted in the updated CMAQ model.
Several laboratory studies have shown that the measured ranges from 10−4 to 10−2 (Rudich et al., 1996; Exner et al., 1992; Moise et al., 2002). In the original CMAQ model, 10−4 was adopted as the value for (Mao et al., 2013). A higher value (10−3) was recommended by Jacob (2000) and was subsequently widely adopted in chemical transport models to investigate the effect of heterogeneous reactions on O3 concentrations (Stadtler et al., 2018; Lou et al., 2014). This value was adopted in the updated CMAQ model.
The uptake coefficients of HO2 vary widely, depending on the transition metal ions contained in aerosols (George et al., 2013; Huijnen et al., 2014). The heterogeneous reaction of HO2 can produce either H2O2 or H2O, depending on the particulate compounds in the aqueous phase. Li et al. (2019) conducted sensitivity experiments for the products of this reaction using the GEOS-Chem model, finding little dependence on the reaction products when assessing the effect of aerosol on O3 concentrations. Here, we let the heterogeneous reaction of HO2 produce only H2O2, and adopt 0.2 for , as recommended by Jacob (2000).
We used the value of 0.1 for the uptake coefficient of OH, based on the laboratory studies of DeMore et al. (1997). This value was also adopted by Zhang and Carmichael (1999) and Zhu et al. (2010) to explore heterogeneous reactions in a chemical transport model.
Previous laboratory and field studies of the heterogeneous reaction of O3 have given a wide range of : from 10−6 to 10−4 on dust (Michel et al., 2002, 2003; Hanisch and Crowley, 2003), up to 10−4 on sodium chloride aerosol (Abbatt and Waschewsky, 1998), and from 10−5 to 10−3 on soot particles (Longfellow et al., 2000). Most previous modeling studies adopted (Liao et al., 2004; Liao and Seinfeld, 2005; Pozzoli et al., 2008), while one recommended a lower value ( for dust particles (Bauer et al., 2004). We applied 10−5 to the uptake of O3 on all the aerosols in our simulation.
DeMore et al. (1997) reported that the uptake coefficient of H2O2 on sulfuric acid and water surfaces ranged from to 0.18. De Reus et al. (2005) found that using accommodation coefficients of 0.2 and for HO2 and H2O2, respectively, ensured agreement between simulated and observed values, under the assumption that H2O2 was produced in the heterogeneous reaction of HO2. Thus, was adopted for the uptake coefficient of H2O2 in this study.
The companion paper (Part 1; Liu and Wang, 2020) presented validation results of the updated CMAQ model against the observations of SO2, NO2, CO, O3, and PM2.5 from national environmental monitoring stations. In this study, we used the updated and original CMAQ models to simulate the concentrations of gases lost or produced on aerosol surfaces for the summer of 2013 and compared the simulated results with the observations reported in the literature (Table S1 in the Supplement).
2.3 Experiment settings
We applied the updated WRF-CMAQ model to conduct simulations for the summer months (June, July, and August) from 2013 to 2017 with anthropogenic emissions. The shipping emissions were kept unchanged in the 5-year simulation, due to a lack of data for recent years. In Part 1 of our work (Liu and Wang, 2020), we showed the effect of changes in total anthropogenic emissions on O3 changes by comparing the O3 levels in 2013 simulated using anthropogenic emissions from different years. In this study, three additional sets of modeling experiments were established. The first was designed to quantify the responses of O3 to changes in individual pollutant emissions from 2013 to 2017, with the simulation in 2013 being regarded as the baseline experiment. The anthropogenic emissions of NOx, VOCs, SO2, CO, NH3, PM (comprising PM10, PM2.5, and its components), black carbon (BC), organic carbon (OC), and combined NOx and VOCs in 2013 were changed individually to those for 2017 in each sensitivity experiment (total number of experiments is 10), and the results were compared with those in the baseline experiment (Table S2). The second set of experiments was designed to investigate the effect of changes in aerosols on O3 levels via altering the photolysis rates and heterogeneous reactions (Table S3). The individual effects of aerosols were deleted in each sensitivity experiment, and the results were compared with those in the baseline simulation. The corresponding differences showed the effects of aerosols on O3 in 2013 in terms of photolysis rates or with respect to each heterogeneous reaction. A similar method was applied to the simulation of 2013 but with the 2017 anthropogenic emissions, and the difference was the effect of aerosols on the O3 levels when the anthropogenic emissions of 2017 were applied in 2013. Finally, by comparing the results before and after the change in emissions from 2013 to 2017, the responses of O3 to changes in aerosols via altering the photolysis rates and each heterogeneous reaction were quantified. Nineteen sensitivity experiments were performed. The third set of experiments was designed to calculate the magnitude that the VOC emissions in 2017 would have had to be reduced by from 2013 to overcome the adverse effect of the changes in other pollutant emissions on O3 reduction during this period. Based on the simulation of 2013 incorporating the 2017 anthropogenic emissions of all pollutants except VOCs, the VOC emissions were reduced by 10 %, 20 %, 30 %, 40 %, and 50 % in the sensitivity runs and the results were compared with those in the baseline experiment (Table S4). By comparing the response of the 2013 O3 level to various VOC emission reductions, the required reduction of VOC emissions was quantified.
3.1 Comparison of the simulated and observed reactive gases
The simulated mixing ratios of reactive gases that are subject to significant heterogeneous reactions were compared with the observed values for the gases O3, NO2, NO3, N2O5, HONO, ClNO2, HO2, OH, and H2O2 (Table S1). Except for O3 and NO2, which are measured by the regular national air monitoring network, the other gases were measured only in research-focused field campaigns. We compiled literature-reported summer concentrations of these gases for various years and compared these with the model-simulated values for 2013.
The uptake of NO2 on wet aerosol surfaces can produce HONO in the atmosphere, which is an important source of OH radicals via photolysis. After the update of the CMAQ model, the predicted average NO2 mixing ratio in China decreased from 19.2 to 16.6 ppbv, which came close to the observed value (15.1 ppbv). As a product of NO2 uptake, the HONO mixing ratios increased significantly and approached the observed values in Beijing (J. Q. Wang et al., 2017) and Guangzhou (Qin et al., 2009; X. Li et al., 2012). The decrease in NO2 and increase in HONO were attributed to the increase in heterogeneous reaction rates of NO2 due to the effects of relative humidity and sunlight intensity in the updated CMAQ model (Fu et al., 2019). Table S1 also presents the observed HONO mixing ratios at two coastal sites in Hong Kong (Z. Y. Li et al., 2018; Xu et al., 2015), but their levels were substantially underpredicted because capturing such coastal characteristics is challenging for the model, due to its low horizontal resolution (36 km).
The simulated NO3 mixing ratio decreased slightly (∼ 1 pptv) due to the decrease in NO2 and O3 mixing ratios and the increase in (from 10−4 to 10−3). This decrease in NO3 value was much smaller than the differences between the simulated and observed values in Shanghai (Wang et al., 2013) and Guangzhou (S. W. Li et al., 2012). Nevertheless, the simulated NO3 value moved closer to the observed value in Shanghai (Wang et al., 2013) after the heterogeneous reactions in the model were updated.
The parameterization of remains unchanged in the revised model. However, the decrease in NO2 and O3 levels resulted in a decrease in N2O5 and thus a decrease in ClNO2. The simulated maximum N2O5 mixing ratio at the Wangdu site decreased by ∼50 % and thus agreed much better with the observed value (Tham et al., 2016). The simulated maximum ClNO2 mixing ratio decreased slightly, by a margin much smaller than the biases between the simulation and observation. Table S1 presents the observed N2O5 and ClNO2 values at a high-altitude site on Mount Tai (Z. Wang et al., 2017) and a coastal site in Hong Kong (Yan et al., 2019; Tham et al., 2014). Large differences between simulations and observations were found due to the complex terrains at these two sites, which are difficult for our model to simulate.
The CMAQ model predicted the mixing ratios of HO2 and OH radicals to be slightly lower after the incorporation of their heterogeneous reactions. The changes were small, probably due to the scavenging effects of aerosols being counteracted by the increase in radical sources generated by HONO photolysis. The measured value for HO2 contains an uncorrected contribution from RO2 (Fuchs et al., 2011), which could explain in part the underestimation of HO2 that occurred when using the updated and original models. For OH radicals, the mixing ratios simulated by both the original and updated models were comparable with the observed value in Wangdu (Tan et al., 2017), Beijing (Lu et al., 2013), and Guangzhou (Lu et al., 2012). The slight decrease in the OH mixing ratio after the update helped bring the simulation closer to the observations.
In the original CMAQ model, the MDA8 O3 mixing ratio was overestimated by 11.4 ppbv. The bias was reduced to 6.8 ppbv with the updated heterogeneous reactions. In addition to the greater uptake of O3 on aerosol surfaces, the updated model also includes other heterogeneous gas–aerosol reactions, weakening the atmospheric oxidation capacity and thus inhibiting O3 formation.
The H2O2 mixing ratio decreased substantially from ∼0.8 to ∼0.2 ppbv, and the simulated value agreed well with the values recorded in Wangdu (Wang et al., 2016) and Beijing (Qin et al., 2018; Liang et al., 2013) after updating the model. Our results suggest that the chemical transport models are likely to substantially overestimate the H2O2 concentration if they do not include the sink of H2O2 on aerosol surfaces.
In summary, after updating the heterogeneous reactions in the CMAQ model, the simulations agreed better with the observations, especially for NO2, HONO, O3, and H2O2.

Figure 1Trends of simulated MDA8 O3 mixing ratios averaged in urban and rural areas and all land areas of China in summer (June–August) from 2013 to 2017. See Fig. S3 for the locations of urban and rural areas.
3.2 Variations in the urban and rural O3
As most of the 493 air-quality monitoring sites established in 2013 are located in urban areas (refer to Fig. S1 in Part 1, Liu and Wang, 2020), the data from these stations mainly reflect the O3 concentration changes in urban areas. The model simulations for the summer months from 2013 to 2017 over China give a comprehensive picture of the O3 variations over the entire land areas of the country. Our previous analysis based on model simulations revealed that different trends in O3 concentrations existed in urban and rural areas (Liu and Wang, 2020). In this study, we further quantified the O3 trends in urban and rural areas over China using the nighttime light data from the Visible Infrared Imaging Radiometer Suite (VIIRS) Day/Night Band (DNB) (Fig. S2). We allocated the nighttime light data to the CMAQ modeling domain and averaged the values in each modeling grid cell. An urban area (or rural area) was regarded as a grid point with an averaged light value ≥2 (or <2 ). Figure S3 shows the spatial distribution of the urban and rural areas in China. The rates of changes in the MDA8 O3 mixing ratios in urban and rural areas from 2013 to 2017 were then quantified based on the simulation results (Fig. 1). The model predicted that the MDA8 O3 mixing ratio in urban areas increased at a rate of 0.46 ppbv per year (ppbv a−1) (p=0.001). This simulated increase (∼2 ppbv from 2013 to 2017) in the nightlight-classified urban areas is much lower than the average increase observed at 493 sites in 74 cities (∼9 ppbv, Fig. S1d). The discrepancy can be explained as follows. The urban areas determined using the nightlight data are not exactly the same as those 493 sites and cover some rural areas (with decreasing ozone) and additional small townships (Fig. S3). When we matched the modeled locations to the 493 observation sites, the model captured 57 % of the rate of increase of MDA8 O3 averaged at those sites (see Fig. S3 in Part 1, Liu and Wang, 2020). Part 1 also showed a large variability of meteorological impacts on O3 in different regions (e.g., Beijing, Shanghai, Guangzhou, and Chengdu), and the simulated overall urban O3 trend with a high confidence level (p=0.001) suggests that this regional variability in meteorological impact can be “averaged out”, leading to a clearer urban O3 trend driven by emission changes.
The simulated MDA8 O3 mixing ratio in rural areas decreased at a rate of −0.17 ppbv a−1 (p=0.005), which is supported by the recently reported rural ozone trends in China. T. Wang et al. (2019) revealed no significant change in O3 levels observed at a coastal site (Hok Tsui) in South China in the outflow of air mass from eastern China during 2007–2018. More recently, Xu et al. (2020) reported decreasing O3 mixing ratios from 2013 to 2016 at two rural sites in Beijing-Tianjin-Hebei (BTH) (Shangduanzi) and Yangtze River Delta (YRD) (Linan). Overall, the MDA8 O3 mixing ratio in China exhibited a slightly decreasing trend (−0.15 ppbv a−1, p=0.006) due to the decrease in a large rural area, which suggested that the ozone concentration has leveled off in recent years.

Figure 2Spatial distributions of changes in anthropogenic pollutant emissions in the summer of 2017 relative to that of 2013, including (a) NOx, (b) VOCs, (c) CO, (d) SO2, (e) NH3, (f) PM10, (g) PM2.5, (h) BC, and (i) OC. Emission data are obtained from the Multi-resolution Emission Inventory for China (MEIC; http://www.meicmodel.org, last access: 18 January 2020).
3.3 Response of O3 to changes in multi-pollutant emissions
Figure 2 presents the spatial distribution of changes in individual pollutant emissions in 2017 relative to 2013 (http://www.meicmodel.org, last access: 18 January 2020). Significant reductions in anthropogenic emissions of NOx, CO, SO2, NH3, PM10, PM2.5, BC, and OC were found in eastern China, while the emissions in western China decreased slightly and even increased in some areas. NH3 emission, which is primarily from agriculture (Fig. S4e), generally decreased across eastern China but increased in large areas in Neimenggu (Inner Mongolia Autonomous Region) and northwestern China and some scattered areas in eastern China. VOC emissions, which have not been subject to effective control measures, increased at scattered points (mostly industrial sites) over eastern China, except for Shandong province, where VOC emissions decreased across the region. In summary, the emissions of NOx, CO, SO2, PM10, PM2.5, BC, and OC over mainland China were reduced by 21 %, 24 %, 61 %, 38 %, 33 %, 29 %, and 34 % in summer from 2013 to 2017, respectively (Fig. S4). In contrast, NH3 emissions only decreased by 4 %, and VOC emissions increased by 5 % during the same period.

Figure 3Spatial distribution of the simulated MDA8 O3 mixing ratios responding to the changes in individual pollutant emissions in summer from 2013 to 2017, including (a) NOx, (b) VOCs, (c) NOx and VOCs, (d) CO, (e) SO2, (f) NH3, (g) PM, (h) BC, and (i) OC.
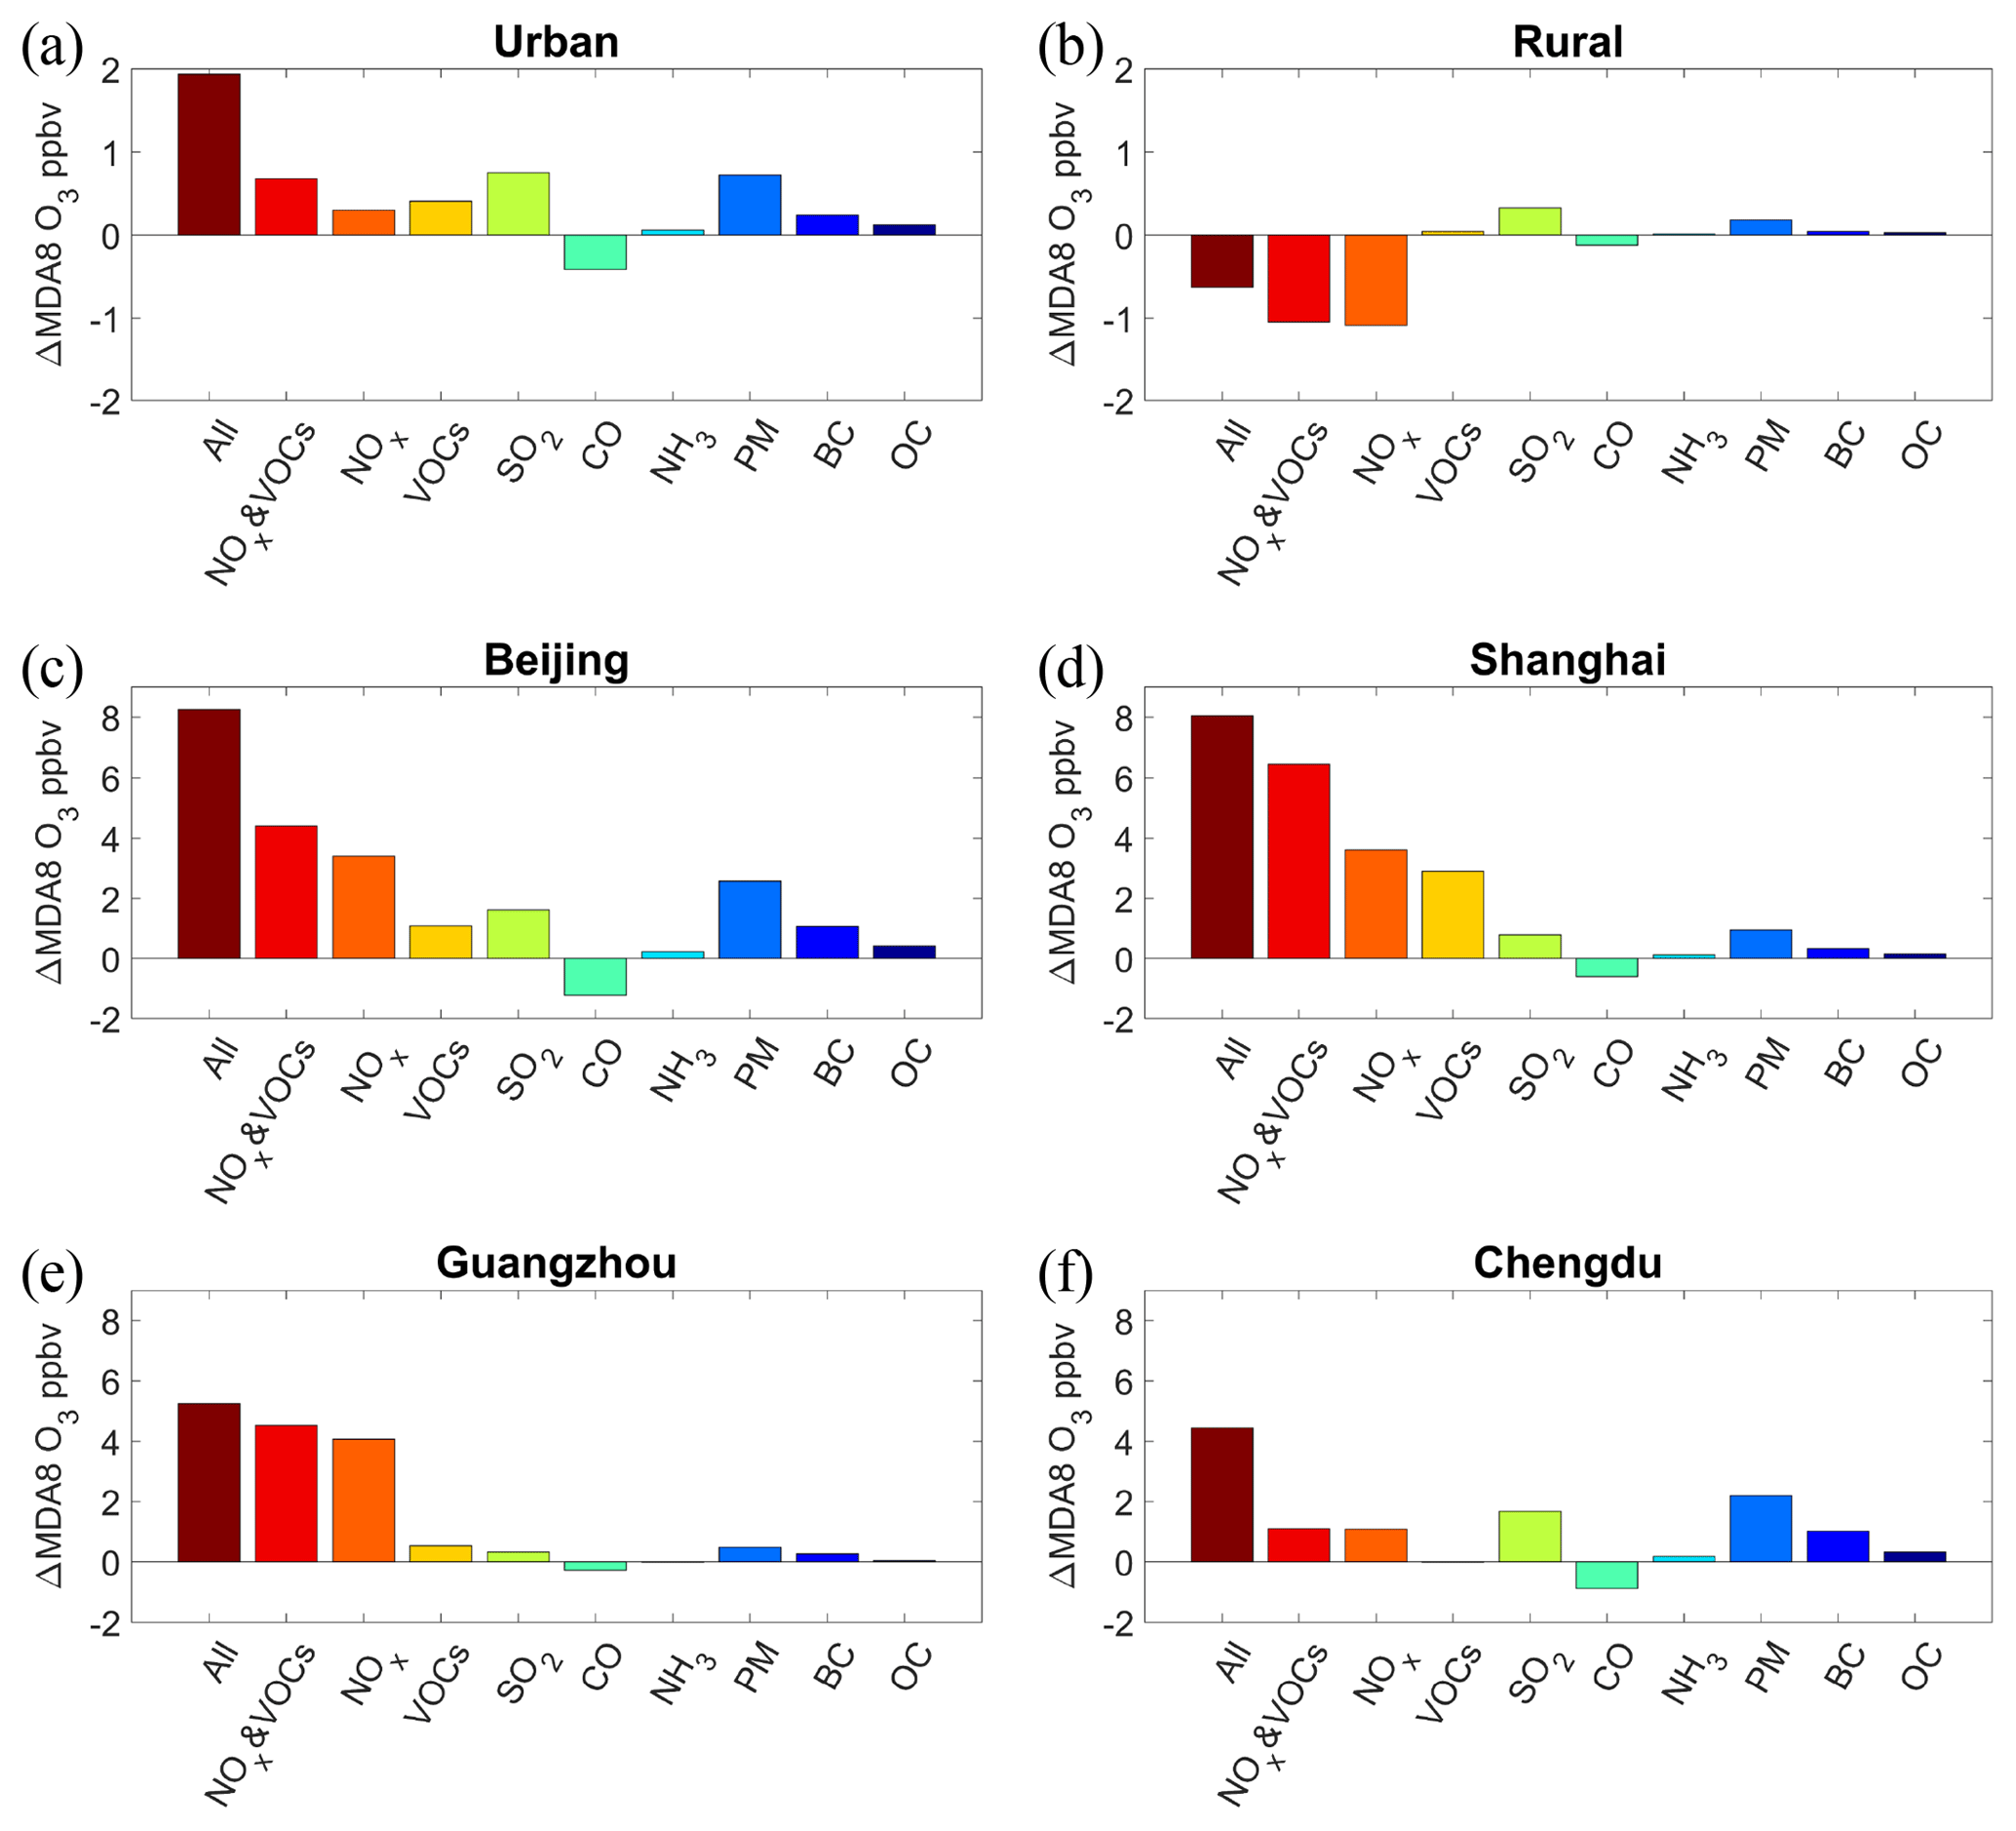
Figure 4Response of the simulated MDA8 O3 mixing ratios to the changes in individual pollutant emissions in summer from 2013 to 2017 in (a) the urban areas, (b) the rural areas, (c) Beijing, (d) Shanghai, (e) Guangzhou, and (f) Chengdu. See Fig. S1 in Part 1 (Liu and Wang, 2020) for the locations of the four megacities.
Figure 3 shows the spatial distribution of the effect of changes in these pollutant emissions on the MDA8 O3 levels over China between 2013 and 2017. The average changes in O3 mixing ratios in urban and rural areas (see Fig. S3 for their locations) are shown in Fig. 4a and b, respectively. The decrease in NOx emissions caused an increase in O3 mixing ratios in urban and industrial hot spots but a decrease in O3 concentrations across a large swathe of rural areas (Fig. 3a). Quantitatively, the MDA8 O3 mixing ratio increased by 0.30 ppbv in urban areas and decreased by 1.08 ppbv in rural areas, due to the NOx emission reductions (Fig. 4a and b). In view of the small effects of changes in other pollutant emissions on rural O3 mixing ratios (Fig. 4b), the decreasing trend of O3 levels from 2013 to 2017 in rural areas was mainly ascribed to the reduction of NOx emissions, consistent with the fact that O3 formation in rural areas in China is generally limited by NOx (e.g., Xing et al., 2011; T. Wang et al., 2017). The increase in O3 levels in urban areas due to NOx reductions can be explained by two factors. First, most urban areas are in the VOCs-limited regime, where the reduction of NOx emissions reduces the NO titration effect on O3, resulting in increased O3 concentrations. Second, the decrease in NOx emissions can reduce the concentration and increase O3 via weakening the aerosol effects.
In the simulation of VOCs emission changes, the spatial distribution of the O3 levels closely tracked the changes in VOC emissions (Fig. 3b). Specifically, the increase in VOCs emission caused an increase in the MDA8 O3 mixing ratios across eastern China, except for Shandong province, where O3 levels decreased due to the substantial reduction of VOC emissions from the transportation sector according to the MEIC emission inventory (http://www.meicmodel.org, last access: 18 January 2020). The simulation predicted an increase of 0.41 ppbv in the MDA8 O3 mixing ratios from 2013 to 2017 due to the increase in VOC emissions in urban areas (Fig. 4a). When changes in both the NOx and VOC emissions were simulated, it was the changes in NOx emissions that primarily contributed to the changes in O3 mixing ratio (Fig. 3c). In the simulation of changing CO emissions, the reduction of CO emissions reduced the O3 level across China (Fig. 3d). A particularly large decrease in the O3 mixing ratio was found in the NCP region, where both the CO emissions and their corresponding reduction were large. The CO emission reductions led to a decrease of 0.41 ppbv in MDA8 O3 in urban areas (Fig. 4a). CO is an important O3 precursor and plays a similar role to VOCs in O3 formation, but the changes in its emission have rarely been discussed in previous studies of the causes of variations in O3 concentrations. In fact, our results indicated that the reduction of CO emissions was the only government-implemented measure that reduced O3 levels in recent years.
In addition to the effects of O3 precursors, the emissions of other pollutants can also affect O3 concentrations by altering photolysis rates and the loss of reactive gases from heterogeneous reactions. The reduction of SO2 emissions increased the O3 levels across China, particularly in northern China and the Sichuan Basin (SCB) (Fig. 3e). Quantitatively, SO2 emission reductions led to an increase of 0.75 ppbv in the MDA8 O3 mixing ratios in urban areas (Fig. 4a), which was the largest cause of O3 increases among all the pollutant emissions changes considered in this work. The SO2 emission was reduced by more than 60 % from 2013 to 2017, which resulted in a significant decrease in ambient concentrations and increased O3 concentrations by increasing the photolysis rates and retarding the loss of reactive gases from heterogeneous reactions. The reduction of NH3 emissions, an important precursor of ammonium, increased the O3 mixing ratio across China in a similar way to the reduction in SO2 emissions (Fig. 3f), but to a small extent, as the NH3 emission was only reduced by 4 %. Specifically, the increase in the MDA8 O3 mixing ratios in urban areas due to the reduction of NH3 emissions was only 0.06 ppbv (Fig. 4a), which was an insignificant fraction of the total increases in O3 mixing ratios.
The reduction of primary PM emissions also enhanced O3 formation across China, especially in the NCP and SCB regions (Fig. 3g). The MDA8 O3 mixing ratios increased by 0.72 ppbv due to the PM emission reduction in urban areas (Fig. 4a). The effect of the changes in PM emissions on O3 levels was comparable with that of the changes in SO2 emissions, which indicated the significant O3-promoting role played by reductions in both primary and secondary aerosols. BC and OC are among the components of direct aerosol emissions, and reductions in both were found to increase the O3 levels (Fig. 3h and i). Although the reduction of BC emissions was smaller than the reduction in OC emissions, the increase in MDA8 O3 due to the former was more significant. BC is an especially strong absorber of visible solar radiation in the atmosphere (Ramanathan and Carmichael, 2008), and therefore greatly retards photolysis rates by reducing the solar radiation reaching the earth's surface.
The dominant cause of O3 increases due to emission changes varied among regions. Figure 4 shows the average changes in O3 mixing ratios due to changes in individual pollutant emissions in four megacities, i.e., Beijing, Shanghai, Guangzhou, and Chengdu (refer to Fig. S1 in Part 1 for their locations), which are the representative cities in the BTH, YRD, Pearl River Delta (PRD), and SCB regions, respectively. In Beijing, NOx and PM emission reductions were the two largest causes of rising O3 levels, followed by SO2 emission reductions. Air quality in the BTH region is a major concern, and strict emission-control measures have been implemented since 2013. As a result, the emissions of NOx, PM2.5, and SO2 in BTH were reduced by 25 %, 44 %, and 65 % from 2013 to 2017 (Fig. S5), respectively, which were generally larger reductions than occurred in other regions (Fig. 2). In Shanghai, the increase in the O3 level was mainly due to the reduction of NOx emissions and increase in VOC emissions. This result is consistent with the finding of Yu et al. (2019) using the Kolmogorov–Zurbenko filtering technique, who also suggested that the changes in O3 precursor emissions in the YRD contributed more to O3 increases than did the decrease in PM2.5 concentrations. In the YRD, NOx emissions decreased by 19 %, and that of VOCs increased by 10 % from 2013 to 2017 (Fig. S6). Meanwhile, the PM2.5 concentration in Shanghai was relatively low in summer. As a result, the effects of the PM and SO2 emission reductions were smaller than those due to the changes in NOx and VOC emissions. In Guangzhou, the NOx emission reduction was the dominant cause of the O3 increase, while the effects of SO2 and PM emission reductions on O3 levels were insignificant. This result can likewise be ascribed to the low concentration of PM2.5 in summer and relatively large reduction of NOx emissions (Fig. S7) in the PRD. In Chengdu, the PM and SO2 emission reductions contributed most to the increases in O3 levels. The concentration of PM2.5 in the SCB was high due to the basin topography and high emissions of both PM and its precursors. The significant reductions of PM2.5 (35 %) and SO2 (65 %) emissions in the SCB (Fig. S8) were thus the two major causes of the O3 increase there. The intercity variations in the dominant causes of increases in O3 concentrations suggest that if the government wishes to alleviate urban O3 pollution, they can adopt additional, localized emission-reduction measures as part of policies (see Sect. 3.5).
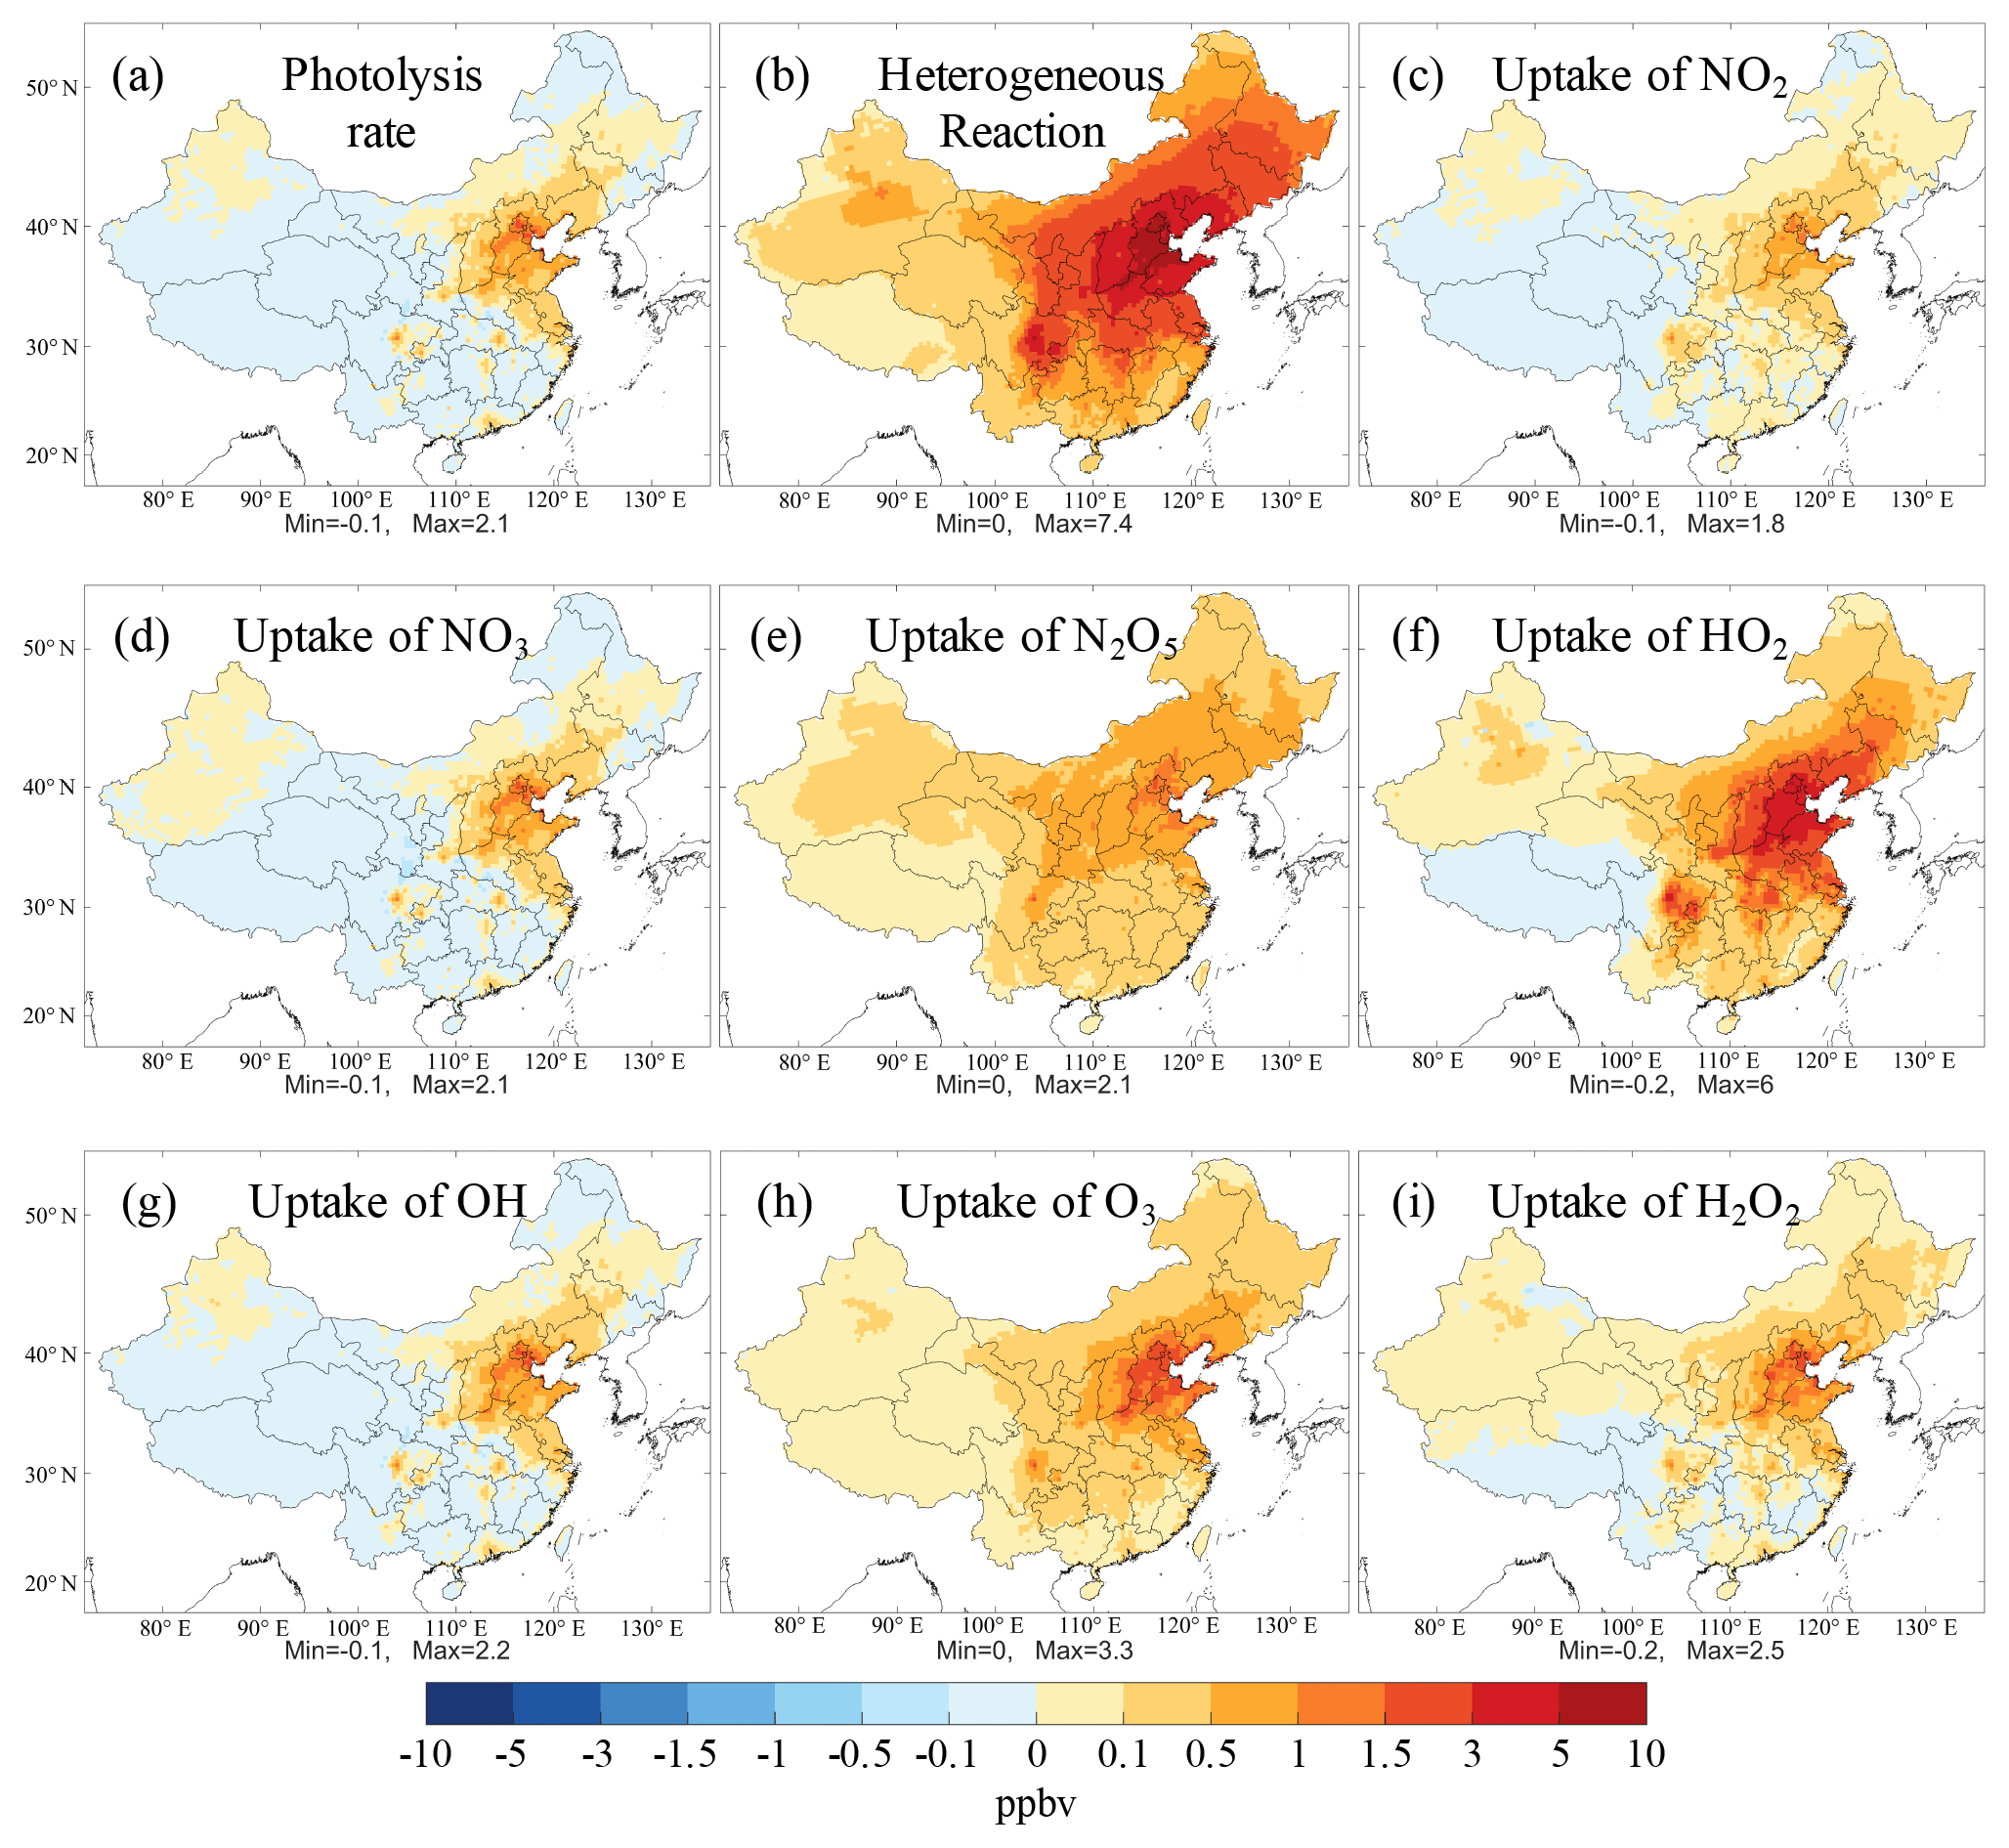
Figure 5Spatial distribution of the simulated MDA8 O3 mixing ratios responding to the changes in the effects of aerosol in summer from 2013 to 2017 (see Methods section). The aerosol affects O3 via altering (a) photolysis rates, (b) all heterogeneous reactions, and individual heterogeneous reactions, namely the uptake of (c) NO2, (d) NO3, (e) N2O5, (f) HO2, (g) OH, (h) O3, and (i) H2O2.
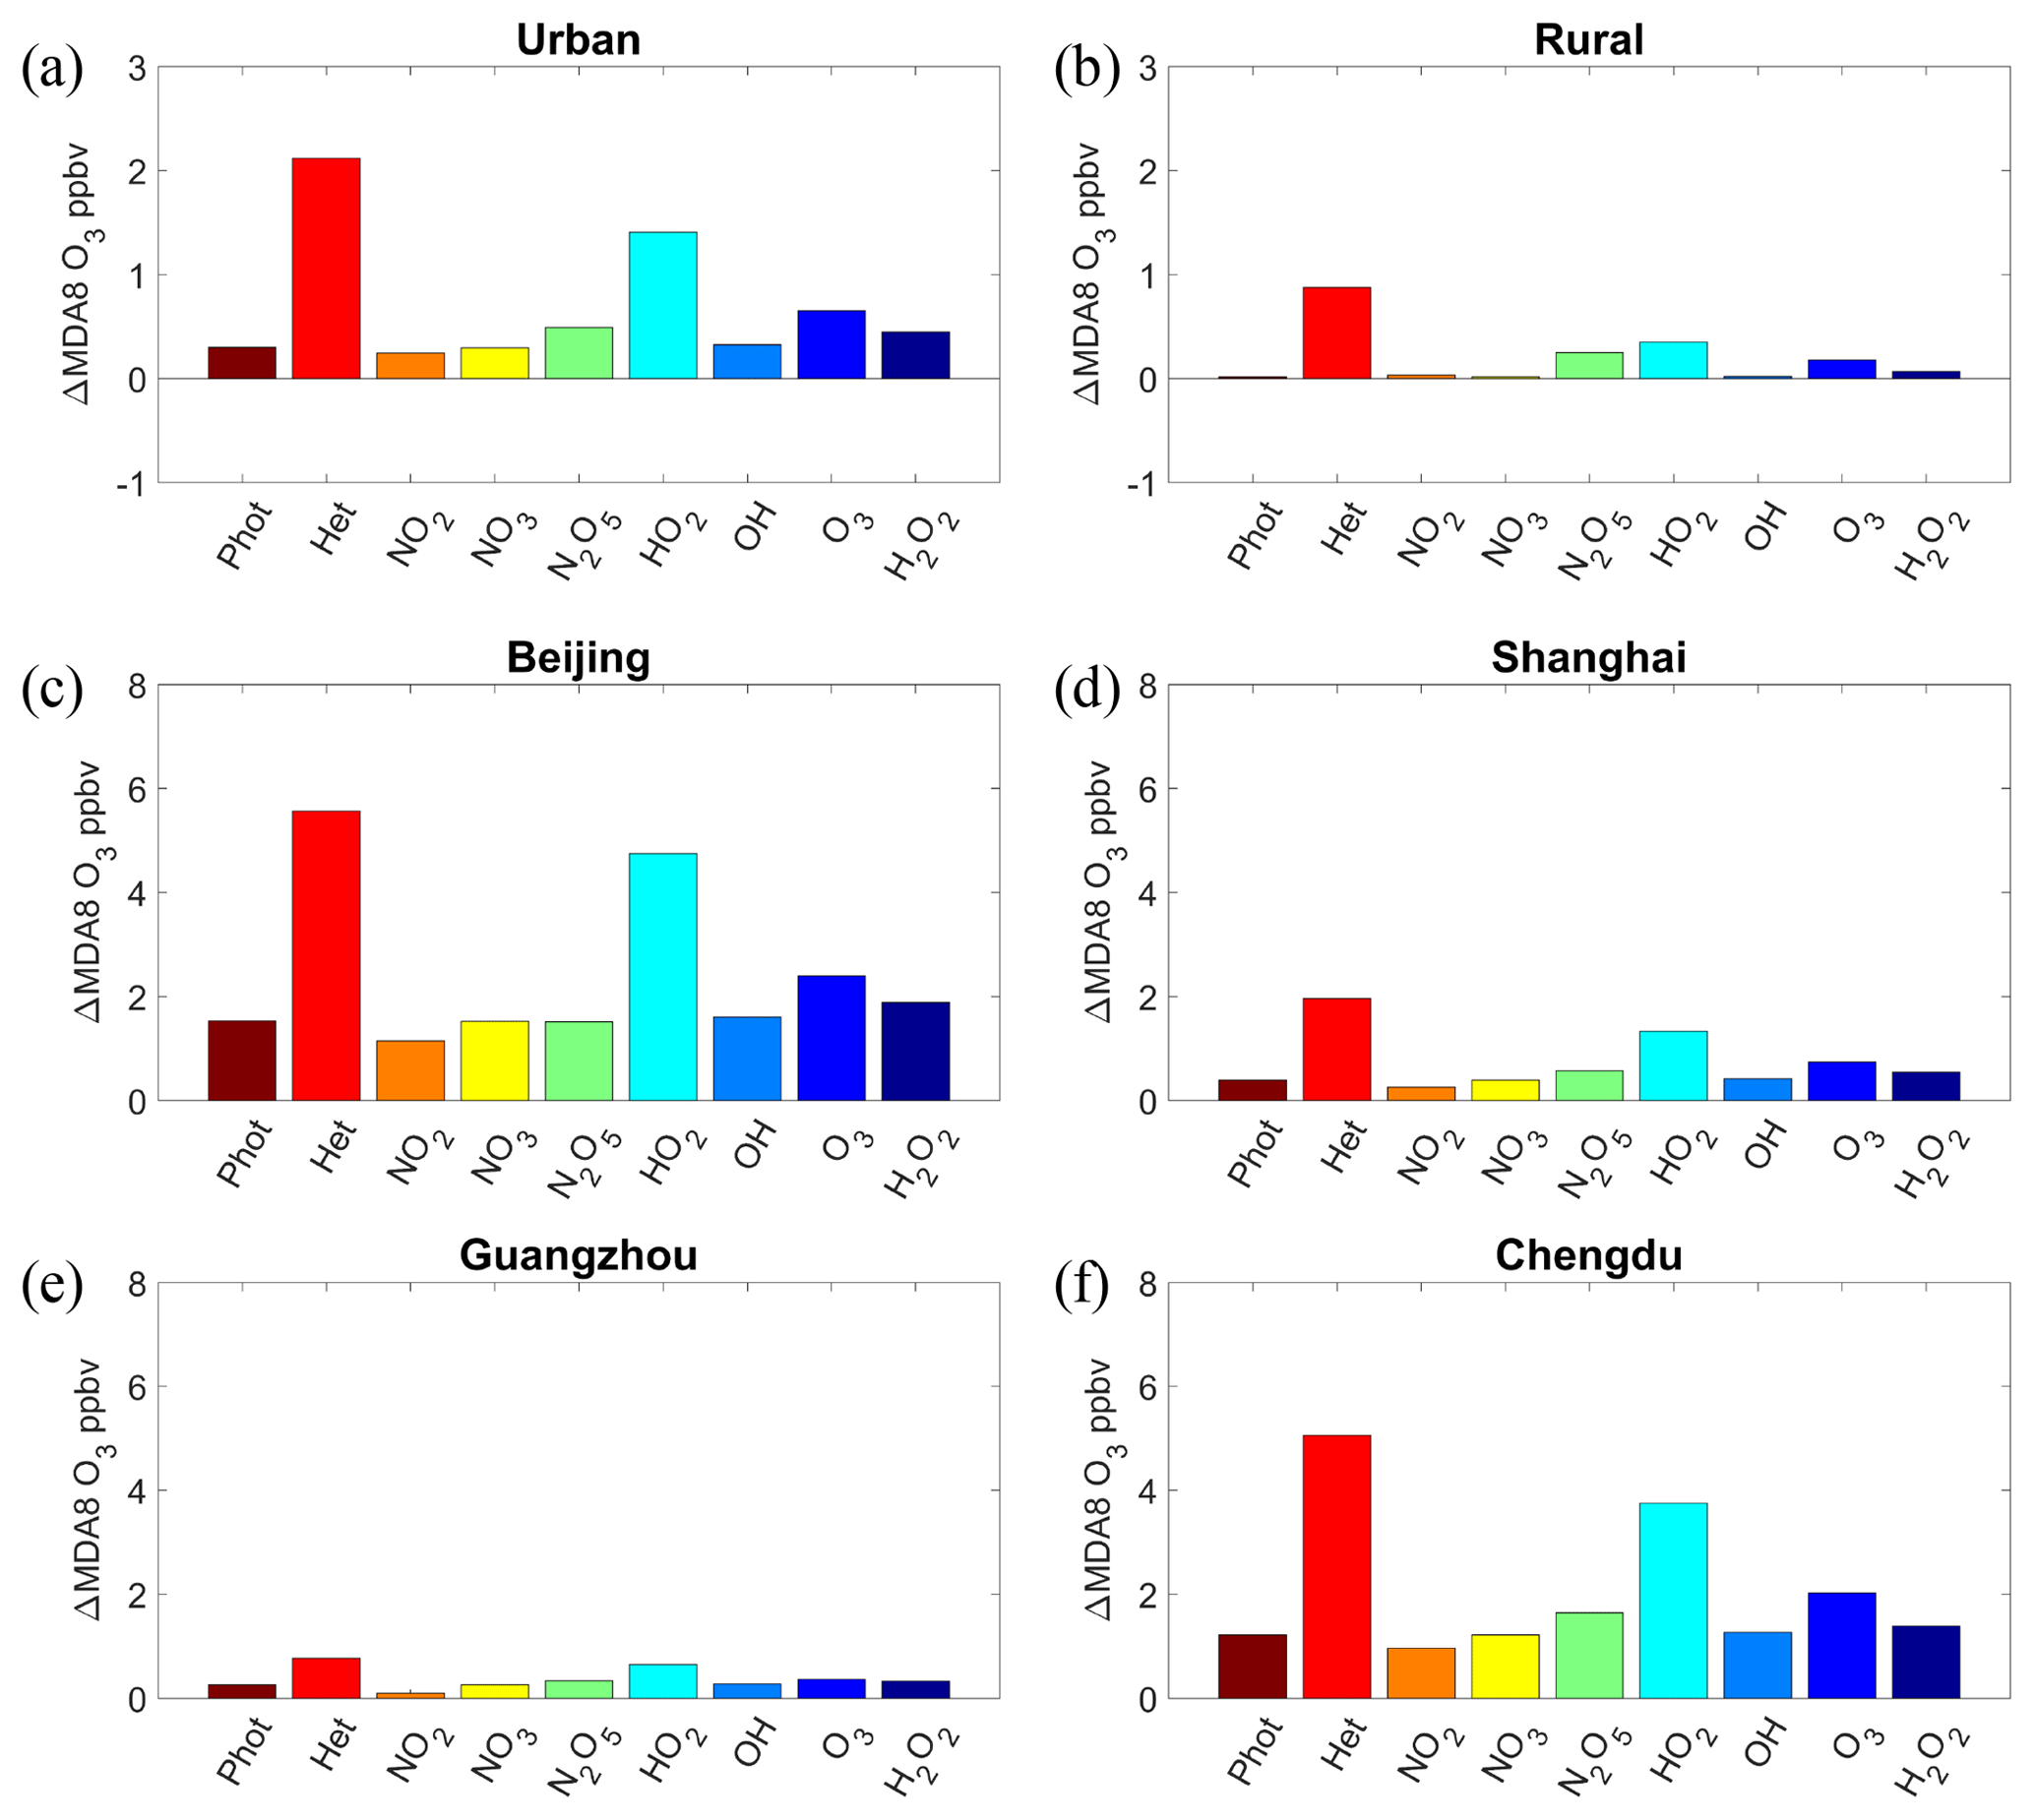
Figure 6Response of the simulated MDA8 O3 mixing ratios to the changes in the effects of aerosols in summer from 2013 to 2017 in (a) the urban area, (b) the rural area, (c) Beijing, (d) Shanghai, (e) Guangzhou, and (f) Chengdu. The aerosol affects O3 via altering the photolysis rates (Phot), all heterogeneous reactions (Het), and individual heterogeneous reactions, namely the uptake of NO2, NO3, N2O5, HO2, OH, O3, and H2O2.
3.4 The effects of aerosol on the O3 variations
Aerosols in the atmosphere derived from direct emission and secondary formation can reduce photolysis rates and scavenge reactive gases from heterogeneous reactions, thereby inhibiting O3 formation. Figure 5 shows the spatial distribution of changes in the MDA8 O3 mixing ratios due to the changes in the radiative and heterogeneous chemical effects of aerosols from 2013 to 2017 (see Methods section). We isolated the effects of changes in seven heterogeneous reactions on the O3 variations, and the average changes in O3 levels in urban and rural areas are shown in Fig. 6a and b, respectively. As the PM2.5 concentrations decreased substantially due to the reduction of anthropogenic pollutant emissions, the effects of aerosols on O3 concentrations also decreased, which led to an increase in O3 levels. The effects of the decrease in PM concentrations on O3 were insignificant in western China. Significant increases in O3 mixing ratios due to the decrease in various aerosol effects were found in urban and industrial areas of eastern China, particularly the NCP and SCB regions, where pollutant emissions were high and subject to a substantial reduction in the past few years. We found that the heterogeneous chemical effect, rather than the radiative effect, contributed most to the increase in O3 levels driven by changes in PM concentrations. Quantitatively, the changes in photolysis rates and heterogeneous reactions increased the MDA8 O3 mixing ratio by 0.30 and 2.12 ppbv in urban areas, respectively. In rural areas, the MDA8 O3 mixing ratio increased by 0.87 ppbv via the heterogeneous chemical reactions on aerosols, while the effect of changes in photolysis rates was negligible. As for various heterogeneous reactions, the changes in individual reactions all increased MDA8 O3 from 2013 to 2017. The decrease in the aerosol-sink effect of HO2 contributed most to the O3 increase due to changes in PM concentrations, followed by O3, N2O5, and H2O2. The effects of changes in the heterogeneous reactions of NO2, NO3, and OH on the increase in O3 levels were small.
The effect of the decrease in aerosol concentrations on O3 levels varied by city. Significant effects were found in Beijing and Chengdu, where the PM2.5 concentration was high and was subject to a large reduction by the implementation of emission-control measures. In contrast, the PM2.5 concentration was lower in Shanghai and Guangzhou, and their O3 levels were less affected by the decrease in aerosol concentrations.
Li et al. (2019) also investigated the effects of changes in photolysis rates and heterogeneous reactions on O3 levels, using the GEOS-Chem model incorporating heterogeneous reactions of nitrogen oxides and HO2. They quantified the effect of changes in photolysis rates by scaling the aerosol-extinction rate using the satellite-based aerosol optical depth changes and the effect of changes in heterogeneous reactions by scaling the aerosol surface area using the measurement-based PM2.5 changes from 2013 to 2017. They concluded that the increase in O3 mixing ratios due to changes in PM concentrations could be largely ascribed to the decrease in the effect of HO2 heterogeneous reaction. Using a regional model and adopting different experimental settings, our work uncovered a similar and substantial effect of HO2 uptake on increases in O3 levels due to changes in PM concentrations. In addition, with more heterogeneous reactions implemented in the CMAQ model, we found that the uptake of O3 on aerosol surfaces was also important, following HO2.
3.5 The anthropogenic VOCs emission controls to reduce O3
The results in the preceding sections show that although the CO emission reductions contributed to a decrease in O3 levels, the reductions of SO2, NOx, and PM emissions had a counterproductive effect on O3 reductions, resulting in a substantial increase in urban O3 concentrations due to the nonlinear NOx and VOC chemistry and the weakening of aerosol effects. To alleviate these negative effects of PM-targeted control policies and thereby reduce ambient O3 concentrations, we found that anthropogenic VOC emissions must also be reduced alongside reductions in emissions of other pollutants.

Figure 7Response of simulated MDA8 O3 mixing ratios with 2017 emissions (except for VOCs) to the reductions of anthropogenic VOCs from the 2013 level in summer in Beijing, Shanghai, Guangzhou, and Chengdu. The black crosses depict the MDA8 values in 2013 and the required reduction of VOC emissions in 2017 to maintain the 2013 O3 level in each city.
Figure 7 presents the changes in the MDA8 O3 mixing ratios from its 2013 value, where the 2013 VOC emissions were decreased from 0 % to 50 %, while the 2017 emissions of other pollutants were retained (see Methods section). The MDA8 O3 mixing ratios in the four studied megacities decrease linearly with the reduction of VOC emissions, reflecting that O3 formation in these cities is VOCs limited. Compared with the O3 level in 2013, the VOC emissions would have needed to be reduced by approximately 20 % to prevent increases in MDA8 O3 from 2013 to 2017. This suggests that the adverse effects of the reductions of NOx, SO2, and PM emissions on urban O3 could have been avoided with a ∼20 % reduction of VOC emissions from 2013 to 2017. The exact reductions of VOC emissions required vary among the four megacities: Beijing (24 %), Shanghai (23 %), Guangzhou (20 %), and Chengdu (16 %). In Beijing (BTH region), the drastic reductions of NOx, SO2, and PM emissions would have necessitated a more substantial reduction of VOC emissions to counteract the O3 increase. In Shanghai (YRD region) and Guangzhou (PRD region), the increase in O3 concentrations due to the reductions in NOx emissions also calls for a significant reduction in VOC emissions. In Chengdu (SCB region), a smaller VOCs emission reduction is needed because of the relatively small increase in O3 concentrations due to changes in other emissions. We also found that the required percentage reductions of VOC emissions in each city were comparable with the actual percentage reductions in NOx emissions (25 %, 19 %, 18 %, and 14 % for Beijing, Shanghai, Guangzhou, and Chengdu, respectively), suggesting that similar percentage reductions of VOCs and NOx would have prevented the increase in O3 levels from 2013 to 2017.
Our results have important implications for air-pollution control policy in the coming years. In 2018, the Chinese government issued a Three-Year Action Plan (2018–2020) mandating further reductions of national SO2 and NOx emissions by at least 15 % by the year 2020 compared with those in the year 2015 and an 18 % reduction in ambient PM2.5 concentrations in cities currently not compliant with China's PM2.5 standards (http://www.gov.cn/zhengce/content/2018-07/03/content_5303158.htm, last access: 18 January 2020). This implies that if VOC emissions are not reduced in the near future, the O3 pollution in major cities will continue to worsen. Therefore, we suggest that VOC emission controls be implemented together with the PM-targeted measures in order to alleviate the urban O3 pollution.
This study has quantified the effects of changes in pollutant emissions from anthropogenic activities on the summer surface O3 concentrations over China from 2013 to 2017. The control measures, while successful in reducing the concentrations of primary pollutants and particulate matter, were found to increase urban O3 but reduce rural O3; overall, the NOx emission reduction has helped to contain total ozone production in China. The reduction in NOx emission and slight increase in VOC emissions led to ozone increase in urban areas due to the nonlinear chemistry of O3, and the large reductions in PM and SO2 emissions contributed to urban ozone increase resulting from the complex effects of aerosols on radiation and chemical reactions. Among the primary PM components, the emission decrease in BC increased O3 more than that for OC despite its smaller reduction compared to OC, resulting from BC being a strong absorber of solar radiation. The dominant causes of the urban ozone increase due to emission change varied among different cities, and they were NOx and PM in Beijing, NOx and VOC in Shanghai, NOx in Guangzhou, and PM and SO2 in Chengdu. For the aerosol effects, the decrease in heterogeneous uptake of reactive gases was more important than the increase in photolysis rates. Only the CO emission cut helped to decrease urban ozone. Our results show that comparable percentage reductions in anthropogenic VOCs to that achieved for NOx could have prevented the increases in urban O3 concentrations. We thus recommend that VOCs controls be implemented in current and future emission-reduction measures to improve the overall air quality. In view of the importance and complexity of the uptake of reactive gases on aerosol surfaces, more research should be conducted in this area.
The code or data used in this study are available upon request from Yiming Liu (yming.liu@polyu.edu.hk) and Tao Wang (cetwang@polyu.edu.hk).
The supplement related to this article is available online at: https://doi.org/10.5194/acp-20-6323-2020-supplement.
TW initiated the research. YL and TW designed the research framework. YL modified the model and performed model simulations. TW and YL analyzed the results and wrote the paper.
The authors declare that they have no conflict of interest.
We would like to thank Qiang Zhang from Tsinghua University for providing the emission inventory, and Xiao Fu from The Hong Kong Polytechnic University for sharing the model codes of HONO sources.
This research has been supported by the Hong Kong Research Grants Council (grant no. T24-504/17-N) and the National Natural Science Foundation of China (grant no. 91844301).
This paper was edited by Qiang Zhang and reviewed by two anonymous referees.
Abbatt, J. P. D. and Waschewsky, G. C. G.: Heterogeneous Interactions of HOBr, HNO3, O3, and NO2 with Deliquescent NaCl Aerosols at Room Temperature, J. Phys. Chem. A, 102, 3719–3725, https://doi.org/10.1021/jp980932d, 1998.
Atkinson, R.: Atmospheric chemistry of VOCs and NOx, Atmos. Environ., 34, 2063–2101, https://doi.org/10.1016/S1352-2310(99)00460-4, 2000.
Bauer, S. E., Balkanski, Y., Schulz, M., Hauglustaine, D. A., and Dentener, F.: Global modeling of heterogeneous chemistry on mineral aerosol surfaces: Influence on tropospheric ozone chemistry and comparison to observations, J. Geophys. Res.-Atmos., 109, D02304, https://doi.org/10.1029/2003jd003868, 2004.
Bertram, T. H. and Thornton, J. A.: Toward a general parameterization of N2O5 reactivity on aqueous particles: the competing effects of particle liquid water, nitrate and chloride, Atmos. Chem. Phys., 9, 8351–8363, https://doi.org/10.5194/acp-9-8351-2009, 2009.
Binkowski, F. S., Arunachalam, S., Adelman, Z., and Pinto, J. P.: Examining photolysis rates with a prototype online photolysis module in CMAQ, 46, 1252–1256, https://doi.org/10.1175/jam2531.1, 2007.
Byun, D. and Schere, K. L.: Review of the governing equations, computational algorithms, and other components of the models-3 Community Multiscale Air Quality (CMAQ) modeling system, Appl. Mech. Rev., 59, 51–77, https://doi.org/10.1115/1.2128636, 2006.
DeMore, W. B., Sander, S. P., Golden, D. M., Hampson, R. F., Kurylo, M. J., Howard, C. J., Ravishankara, A. R., Kolb, C. E., and Molina, M. J.: Chemical kinetics and photochemical data for use in stratospheric modeling, National Aeronautics and Space Administration and Jet Propulsion Laboratory, California Institute of Technology, California, 1997.
de Reus, M., Fischer, H., Sander, R., Gros, V., Kormann, R., Salisbury, G., Van Dingenen, R., Williams, J., Zöllner, M., and Lelieveld, J.: Observations and model calculations of trace gas scavenging in a dense Saharan dust plume during MINATROC, Atmos. Chem. Phys., 5, 1787–1803, https://doi.org/10.5194/acp-5-1787-2005, 2005.
Exner, M., Herrmann, H., and Zellner, R.: Laser-based studies of reactions of the nitrate radical in aqueous solution, Berichte der Bunsengesellschaft für physikalische Chemie, 96, 470–477, https://doi.org/10.1002/bbpc.19920960347, 1992.
Fu, X., Wang, T., Zhang, L., Li, Q., Wang, Z., Xia, M., Yun, H., Wang, W., Yu, C., Yue, D., Zhou, Y., Zheng, J., and Han, R.: The significant contribution of HONO to secondary pollutants during a severe winter pollution event in southern China, Atmos. Chem. Phys., 19, 1–14, https://doi.org/10.5194/acp-19-1-2019, 2019.
Fuchs, H., Bohn, B., Hofzumahaus, A., Holland, F., Lu, K. D., Nehr, S., Rohrer, F., and Wahner, A.: Detection of HO2 by laser-induced fluorescence: calibration and interferences from RO2 radicals, Atmos. Meas. Tech., 4, 1209–1225, https://doi.org/10.5194/amt-4-1209-2011, 2011.
George, I. J., Matthews, P. S. J., Whalley, L. K., Brooks, B., Goddard, A., Baeza-Romero, M. T., and Heard, D. E.: Measurements of uptake coefficients for heterogeneous loss of HO2 onto submicron inorganic salt aerosols, Phys. Chem. Chem. Phys., 15, 12829–12845, https://doi.org/10.1039/c3cp51831k, 2013.
Guo, S., Hu, M., Zamora, M. L., Peng, J. F., Shang, D. J., Zheng, J., Du, Z. F., Wu, Z., Shao, M., Zeng, L. M., Molina, M. J., and Zhang, R. Y.: Elucidating severe urban haze formation in China, P. Natl. Acad. Sci. USA, 111, 17373–17378, https://doi.org/10.1073/pnas.1419604111, 2014.
Hanisch, F. and Crowley, J. N.: Ozone decomposition on Saharan dust: an experimental investigation, Atmos. Chem. Phys., 3, 119–130, https://doi.org/10.5194/acp-3-119-2003, 2003.
Huang, R. J., Zhang, Y. L., Bozzetti, C., Ho, K. F., Cao, J. J., Han, Y. M., Daellenbach, K. R., Slowik, J. G., Platt, S. M., Canonaco, F., Zotter, P., Wolf, R., Pieber, S. M., Bruns, E. A., Crippa, M., Ciarelli, G., Piazzalunga, A., Schwikowski, M., Abbaszade, G., Schnelle-Kreis, J., Zimmermann, R., An, Z. S., Szidat, S., Baltensperger, U., El Haddad, I., and Prevot, A. S. H.: High secondary aerosol contribution to particulate pollution during haze events in China, Nature, 514, 218–222, https://doi.org/10.1038/nature13774, 2014.
Huijnen, V., Williams, J. E., and Flemming, J.: Modeling global impacts of heterogeneous loss of HO2 on cloud droplets, ice particles and aerosols, Atmos. Chem. Phys. Discuss., 14, 8575–8632, https://doi.org/10.5194/acpd-14-8575-2014, 2014.
Jacob, D. J.: Heterogeneous chemistry and tropospheric ozone, Atmos. Environ., 34, 2131–2159, 2000.
Kurtenbach, R., Becker, K. H., Gomes, J. A. G., Kleffmann, J., Lorzer, J. C., Spittler, M., Wiesen, P., Ackermann, R., Geyer, A., and Platt, U.: Investigations of emissions and heterogeneous formation of HONO in a road traffic tunnel, Atmos. Environ., 35, 3385–3394, https://doi.org/10.1016/s1352-2310(01)00138-8, 2001.
Li, J., Wang, Z., Wang, X., Yamaji, K., Takigawa, M., Kanaya, Y., Pochanart, P., Liu, Y., Irie, H., Hu, B., Tanimoto, H., and Akimoto, H.: Impacts of aerosols on summertime tropospheric photolysis frequencies and photochemistry over Central Eastern China, Atmos. Environ., 45, 1817–1829, https://doi.org/10.1016/j.atmosenv.2011.01.016, 2011.
Li, J., Chen, X. S., Wang, Z. F., Du, H. Y., Yang, W. Y., Sun, Y. L., Hu, B., Li, J. J., Wang, W., Wang, T., Fu, P. Q., and Huang, H. L.: Radiative and heterogeneous chemical effects of aerosols on ozone and inorganic aerosols over East Asia, Sci. Total Environ., 622, 1327–1342, https://doi.org/10.1016/j.scitotenv.2017.12.041, 2018.
Li, K., Jacob, D. J., Liao, H., Shen, L., Zhang, Q., and Bates, K. H.: Anthropogenic drivers of 2013–2017 trends in summer surface ozone in China, P. Natl. Acad. Sci. USA, 116, 422–427, 2019.
Li, S. W., Liu, W. Q., Xie, P. H., Qin, M., and Yang, Y. J.: Observation of nitrate radical in the nocturnal boundary layer during a summer field campaign in Pearl River Delta, China, Terr. Atmos. Ocean. Sci., 23, 39–48, https://doi.org/10.3319/Tao.2011.07.26.01(a), 2012.
Li, X., Brauers, T., Häseler, R., Bohn, B., Fuchs, H., Hofzumahaus, A., Holland, F., Lou, S., Lu, K. D., Rohrer, F., Hu, M., Zeng, L. M., Zhang, Y. H., Garland, R. M., Su, H., Nowak, A., Wiedensohler, A., Takegawa, N., Shao, M., and Wahner, A.: Exploring the atmospheric chemistry of nitrous acid (HONO) at a rural site in Southern China, Atmos. Chem. Phys., 12, 1497–1513, https://doi.org/10.5194/acp-12-1497-2012, 2012.
Li, Z. Y., Xue, L. K., Yang, X., Zha, Q. Z., Tham, Y. J., Yan, C., Louie, P. K. K., Luk, C. W. Y., Wang, T., and Wang, W. X.: Oxidizing capacity of the rural atmosphere in Hong Kong, Southern China, Sci. Total Environ., 612, 1114–1122, https://doi.org/10.1016/j.scitotenv.2017.08.310, 2018.
Liang, H., Chen, Z. M., Huang, D., Zhao, Y., and Li, Z. Y.: Impacts of aerosols on the chemistry of atmospheric trace gases: a case study of peroxides and HO2 radicals, Atmos. Chem. Phys., 13, 11259–11276, https://doi.org/10.5194/acp-13-11259-2013, 2013.
Liao, H. and Seinfeld, J. H.: Global impacts of gas-phase chemistry-aerosol interactions on direct radiative forcing by anthropogenic aerosols and ozone, J. Geophys. Res.-Atmos., 110, D18208, https://doi.org/10.1029/2005jd005907, 2005.
Liao, H., Seinfeld, J. H., Adams, P. J., and Mickley, L. J.: Global radiative forcing of coupled tropospheric ozone and aerosols in a unified general circulation model, J. Geophys. Res.-Atmos., 109, D16207, 2004.
Liu, Y. and Wang, T.: Worsening urban ozone pollution in China from 2013 to 2017 – Part 1: The complex and varying roles of meteorology, Atmos. Chem. Phys., 20, 6305–6321, https://doi.org/10.5194/acp-20-6305-2020, 2020.
Longfellow, C. A., Ravishankara, A. R., and Hanson, D. R.: Reactive and nonreactive uptake on hydrocarbon soot: HNO3, O3, and N2O5, 105, 24345–24350, https://doi.org/10.1029/2000jd900297, 2000.
Lou, S. J., Liao, H., and Zhu, B.: Impacts of aerosols on surface-layer ozone concentrations in China through heterogeneous reactions and changes in photolysis rates, Atmos. Environ., 85, 123–138, https://doi.org/10.1016/j.atmosenv.2013.12.004, 2014.
Lu, K. D., Rohrer, F., Holland, F., Fuchs, H., Bohn, B., Brauers, T., Chang, C. C., Häseler, R., Hu, M., Kita, K., Kondo, Y., Li, X., Lou, S. R., Nehr, S., Shao, M., Zeng, L. M., Wahner, A., Zhang, Y. H., and Hofzumahaus, A.: Observation and modelling of OH and HO2 concentrations in the Pearl River Delta 2006: a missing OH source in a VOC rich atmosphere, Atmos. Chem. Phys., 12, 1541–1569, https://doi.org/10.5194/acp-12-1541-2012, 2012.
Lu, K. D., Hofzumahaus, A., Holland, F., Bohn, B., Brauers, T., Fuchs, H., Hu, M., Häseler, R., Kita, K., Kondo, Y., Li, X., Lou, S. R., Oebel, A., Shao, M., Zeng, L. M., Wahner, A., Zhu, T., Zhang, Y. H., and Rohrer, F.: Missing OH source in a suburban environment near Beijing: observed and modelled OH and HO2 concentrations in summer 2006, Atmos. Chem. Phys., 13, 1057–1080, https://doi.org/10.5194/acp-13-1057-2013, 2013.
Lu, X., Hong, J. Y., Zhang, L., Cooper, O. R., Schultz, M. G., Xu, X. B., Wang, T., Gao, M., Zhao, Y. H., and Zhang, Y. H.: Severe surface ozone pollution in China: A global perspective, Environ. Sci. Tech. Lett., 5, 487–494, https://doi.org/10.1021/acs.estlett.8b00366, 2018.
Mao, J. Q., Paulot, F., Jacob, D. J., Cohen, R. C., Crounse, J. D., Wennberg, P. O., Keller, C. A., Hudman, R. C., Barkley, M. P., and Horowitz, L. W.: Ozone and organic nitrates over the eastern United States: Sensitivity to isoprene chemistry, J. Geophys. Res.-Atmos., 118, 11256–11268, 2013.
Michel, A. E., Usher, C. R., and Grassian, V. H.: Heterogeneous and catalytic uptake of ozone on mineral oxides and dusts: A Knudsen cell investigation, Geophys. Res. Lett., 29, 1665, https://doi.org/10.1029/2002gl014896, 2002.
Michel, A. E., Usher, C. R., and Grassian, V. H.: Reactive uptake of ozone on mineral oxides and mineral dusts, Atmos. Environ., 37, 3201–3211, https://doi.org/10.1016/S1352-2310(03)00319-4, 2003.
Moise, T., Talukdar, R. K., Frost, G. J., Fox, R. W., and Rudich, Y.: Reactive uptake of NO3 by liquid and frozen organics, 107, 4041, https://doi.org/10.1029/2001jd000334, 2002.
Ndour, M., D'Anna, B., George, C., Ka, O., Balkanski, Y., Kleffmann, J., Stemmler, K., and Ammann, M.: Photoenhanced uptake of NO2 on mineral dust: Laboratory experiments and model simulations, Geophys. Res. Lett., 35, L05812, https://doi.org/10.1029/2007gl032006, 2008.
NRC: Rethinking the ozone problem in urban and regional air pollution, National Academy Press, Washington, D.C., 1991.
Pozzoli, L., Bey, I., Rast, S., Schultz, M. G., Stier, P., and Feichter, J.: Trace gas and aerosol interactions in the fully coupled model of aerosol-chemistry-climate ECHAM5-HAMMOZ: 1. Model description and insights from the spring 2001 TRACE-P experiment, J. Geophys. Res.-Atmos., 113, D07308, https://doi.org/10.1029/2007jd009007, 2008.
Qin, M., Xie, P., Su, H., Gu, J., Peng, F., Li, S., Zeng, L., Liu, J., Liu, W., and Zhang, Y.: An observational study of the HONO–NO2 coupling at an urban site in Guangzhou City, South China, Atmos. Environ., 43, 5731–5742, https://doi.org/10.1016/j.atmosenv.2009.08.017, 2009.
Qin, M. R., Chen, Z. M., Shen, H. Q., Li, H., Wu, H. H., and Wang, Y.: Impacts of heterogeneous reactions to atmospheric peroxides: Observations and budget analysis study, Atmos. Environ., 183, 144–153, https://doi.org/10.1016/j.atmosenv.2018.04.005, 2018.
Ramanathan, V. and Carmichael, G.: Global and regional climate changes due to black carbon, Nat. Geosci., 1, 221–227, https://doi.org/10.1038/ngeo156, 2008.
Rudich, Y., Talukdar, R. K., Ravishankara, A. R., and Fox, R. W.: Reactive uptake of NO3 on pure water and ionic solutions, J. Geophys. Res.-Atmos., 101, 21023–21031, https://doi.org/10.1029/96jd01844, 1996.
Sarwar, G., Simon, H., Bhave, P., and Yarwood, G.: Examining the impact of heterogeneous nitryl chloride production on air quality across the United States, Atmos. Chem. Phys., 12, 6455–6473, https://doi.org/10.5194/acp-12-6455-2012, 2012.
Stadtler, S., Simpson, D., Schröder, S., Taraborrelli, D., Bott, A., and Schultz, M.: Ozone impacts of gas–aerosol uptake in global chemistry transport models, Atmos. Chem. Phys., 18, 3147–3171, https://doi.org/10.5194/acp-18-3147-2018, 2018.
Stemmler, K., Ndour, M., Elshorbany, Y., Kleffmann, J., D'Anna, B., George, C., Bohn, B., and Ammann, M.: Light induced conversion of nitrogen dioxide into nitrous acid on submicron humic acid aerosol, Atmos. Chem. Phys., 7, 4237–4248, https://doi.org/10.5194/acp-7-4237-2007, 2007.
Stutz, J., Alicke, B., Ackermann, R., Geyer, A., Wang, S., White, A. B., Williams, E. J., Spicer, C. W., and Fast, J. D.: Relative humidity dependence of HONO chemistry in urban areas, J. Geophys. Res.-Atmos., 109, D03307, https://doi.org/10.1029/2003jd004135, 2004.
Tan, Z., Fuchs, H., Lu, K., Hofzumahaus, A., Bohn, B., Broch, S., Dong, H., Gomm, S., Häseler, R., He, L., Holland, F., Li, X., Liu, Y., Lu, S., Rohrer, F., Shao, M., Wang, B., Wang, M., Wu, Y., Zeng, L., Zhang, Y., Wahner, A., and Zhang, Y.: Radical chemistry at a rural site (Wangdu) in the North China Plain: observation and model calculations of OH, HO2 and RO2 radicals, Atmos. Chem. Phys., 17, 663–690, https://doi.org/10.5194/acp-17-663-2017, 2017.
Tham, Y. J., Yan, C., Xue, L. K., Zha, Q. Z., Wang, X. F., and Wang, T.: Presence of high nitryl chloride in Asian coastal environment and its impact on atmospheric photochemistry, Chinese Sci. Bull., 59, 356–359, https://doi.org/10.1007/s11434-013-0063-y, 2014.
Tham, Y. J., Wang, Z., Li, Q., Yun, H., Wang, W., Wang, X., Xue, L., Lu, K., Ma, N., Bohn, B., Li, X., Kecorius, S., Größ, J., Shao, M., Wiedensohler, A., Zhang, Y., and Wang, T.: Significant concentrations of nitryl chloride sustained in the morning: investigations of the causes and impacts on ozone production in a polluted region of northern China, Atmos. Chem. Phys., 16, 14959–14977, https://doi.org/10.5194/acp-16-14959-2016, 2016.
Wang, J. Q., Zhang, X. S., Guo, J., Wang, Z. W., and Zhang, M. G.: Observation of nitrous acid (HONO) in Beijing, China: Seasonal variation, nocturnal formation and daytime budget, Sci. Total Environ., 587, 350–359, https://doi.org/10.1016/j.scitotenv.2017.02.159, 2017.
Wang, N., Lyu, X. P., Deng, X. J., Huang, X., Jiang, F., and Ding, A. J.: Aggravating O3 pollution due to NOx emission control in eastern China, Sci. Total Environ., 677, 732–744, https://doi.org/10.1016/j.scitotenv.2019.04.388, 2019.
Wang, P. F., Guo, H., Hu, J. L., Kota, S. H., Ying, Q., and Zhang, H.: Responses of PM2.5 and O3 concentrations to changes of meteorology and emissions in China, Sci. Total Environ., 662, 297–306, https://doi.org/10.1016/j.scitotenv.2019.01.227, 2019.
Wang, S. S., Shi, C. Z., Zhou, B., Zhao, H., Wang, Z. R., Yang, S. N., and Chen, L. M.: Observation of NO3 radicals over Shanghai, China, Atmos. Environ., 70, 401–409, https://doi.org/10.1016/j.atmosenv.2013.01.022, 2013.
Wang, T., Xue, L. K., Brimblecombe, P., Lam, Y. F., Li, L., and Zhang, L.: Ozone pollution in China: A review of concentrations, meteorological influences, chemical precursors, and effects, Sci. Total Environ., 575, 1582–1596, https://doi.org/10.1016/j.scitotenv.2016.10.081, 2017.
Wang, T., Dai, J., Lam, K. S., Nan Poon, C., and Brasseur, G. P.: Twenty-five years of lower tropospheric ozone observations in tropical East Asia: The influence of emissions and weather patterns, Geophys. Res. Lett., 46, 11463–11470, https://doi.org/10.1029/2019gl084459, 2019.
Wang, Y., Chen, Z., Wu, Q., Liang, H., Huang, L., Li, H., Lu, K., Wu, Y., Dong, H., Zeng, L., and Zhang, Y.: Observation of atmospheric peroxides during Wangdu Campaign 2014 at a rural site in the North China Plain, Atmos. Chem. Phys., 16, 10985–11000, https://doi.org/10.5194/acp-16-10985-2016, 2016.
Wang, Z., Wang, W., Tham, Y. J., Li, Q., Wang, H., Wen, L., Wang, X., and Wang, T.: Fast heterogeneous N2O5 uptake and ClNO2 production in power plant and industrial plumes observed in the nocturnal residual layer over the North China Plain, Atmos. Chem. Phys., 17, 12361–12378, https://doi.org/10.5194/acp-17-12361-2017, 2017c.
Xing, J., Wang, S. X., Jang, C., Zhu, Y., and Hao, J. M.: Nonlinear response of ozone to precursor emission changes in China: a modeling study using response surface methodology, Atmos. Chem. Phys., 11, 5027–5044, https://doi.org/10.5194/acp-11-5027-2011, 2011.
Xing, J., Wang, J., Mathur, R., Wang, S., Sarwar, G., Pleim, J., Hogrefe, C., Zhang, Y., Jiang, J., Wong, D. C., and Hao, J.: Impacts of aerosol direct effects on tropospheric ozone through changes in atmospheric dynamics and photolysis rates, Atmos. Chem. Phys., 17, 9869–9883, https://doi.org/10.5194/acp-17-9869-2017, 2017.
Xu, X., Lin, W., Xu, W., Jin, J., Wang, Y., Zhang, G., Zhang, X., Ma, Z., Dong, Y., Ma, Q., Yu, D., Li, Z., Wang, D., and Zhao, H.: Long-term changes of regional ozone in China: Implications for human health and ecosystem impacts, Elem. Sci. Anth., 8, 13, https://doi.org/10.1525/elementa.409, 2020.
Xu, Z., Wang, T., Wu, J. Q., Xue, L. K., Chan, J., Zha, Q. Z., Zhou, S. Z., Louie, P. K. K., and Luk, C. W. Y.: Nitrous acid (HONO) in a polluted subtropical atmosphere: Seasonal variability, direct vehicle emissions and heterogeneous production at ground surface, Atmos. Environ., 106, 100–109, https://doi.org/10.1016/j.atmosenv.2015.01.061, 2015.
Yan, C., Tham, Y. J., Zha, Q. Z., Wang, X. F., Xue, L. K., Dai, J. N., Wang, Z., and Wang, T.: Fast heterogeneous loss of N2O5 leads to significant nighttime NOx removal and nitrate aerosol formation at a coastal background environment of southern China, Sci. Total Environ., 677, 637–647, https://doi.org/10.1016/j.scitotenv.2019.04.389, 2019.
Yu, Y., Wang, Z., He, T., Meng, X., Xie, S., and Yu, H.: Driving factors of the significant increase in surface ozone in the Yangtze River Delta, China, during 2013–2017, Atmos. Pollut. Res., 10, 1357–1364, https://doi.org/10.1016/j.apr.2019.03.010, 2019.
Zhang, Q., Zheng, Y. X., Tong, D., Shao, M., Wang, S. X., Zhang, Y. H., Xu, X. D., Wang, J. N., He, H., Liu, W. Q., Ding, Y. H., Lei, Y., Li, J. H., Wang, Z. F., Zhang, X. Y., Wang, Y. S., Cheng, J., Liu, Y., Shi, Q. R., Yan, L., Geng, G. N., Hong, C. P., Li, M., Liu, F., Zheng, B., Cao, J. J., Ding, A. J., Gao, J., Fu, Q. Y., Huo, J. T., Liu, B. X., Liu, Z. R., Yang, F. M., He, K. B., and Hao, J. M.: Drivers of improved PM2.5 air quality in China from 2013 to 2017, P. Natl. Acad. Sci. USA, 116, 24463–24469, https://doi.org/10.1073/pnas.1907956116, 2019.
Zhang, Y. and Carmichael, G. R.: The role of mineral aerosol in tropospheric chemistry in East Asia – A model study, J. Appl. Meteorol., 38, 353–366, 1999.
Zheng, B., Tong, D., Li, M., Liu, F., Hong, C., Geng, G., Li, H., Li, X., Peng, L., Qi, J., Yan, L., Zhang, Y., Zhao, H., Zheng, Y., He, K., and Zhang, Q.: Trends in China's anthropogenic emissions since 2010 as the consequence of clean air actions, Atmos. Chem. Phys., 18, 14095–14111, https://doi.org/10.5194/acp-18-14095-2018, 2018.
Zhu, S., Butler, T., Sander, R., Ma, J., and Lawrence, M. G.: Impact of dust on tropospheric chemistry over polluted regions: a case study of the Beijing megacity, Atmos. Chem. Phys., 10, 3855–3873, https://doi.org/10.5194/acp-10-3855-2010, 2010.