the Creative Commons Attribution 4.0 License.
the Creative Commons Attribution 4.0 License.
 | 03 Jun 2020
Worsening urban ozone pollution in China from 2013 to 2017 – Part 1: The complex and varying roles of meteorology
Yiming Liu
China has suffered from increasing levels of ozone pollution in urban areas despite the implementation of various stringent emission reduction measures since 2013. In this study, we conducted numerical experiments with an up-to-date regional chemical transport model to assess the contribution of the changes in meteorological conditions and anthropogenic emissions to the summer ozone level from 2013 to 2017 in various regions of China. The model can faithfully reproduce the observed meteorological parameters and air pollutant concentrations and capture the increasing trend in the surface maximum daily 8 h average (MDA8) ozone (O3) from 2013 to 2017. The emission-control measures implemented by the government induced a decrease in MDA8 O3 levels in rural areas but an increase in urban areas. The meteorological influence on the ozone trend varied by region and by year and could be comparable to or even more significant than the impact of changes in anthropogenic emissions. Meteorological conditions can modulate the ozone concentration via direct (e.g., increasing reaction rates at higher temperatures) and indirect (e.g., increasing biogenic emissions at higher temperatures) effects. As an essential source of volatile organic compounds that contributes to ozone formation, the variation in biogenic emissions during summer varied across regions and was mainly affected by temperature. China's midlatitude areas (25 to 40∘ N) experienced a significant decrease in MDA8 O3 due to a decline in biogenic emissions, especially for the Yangtze River Delta and Sichuan Basin regions in 2014 and 2015. In contrast, in northern (north of 40∘ N) and southern (south of 25∘ N) China, higher temperatures after 2013 led to an increase in MDA8 O3 via an increase in biogenic emissions. We also assessed the individual effects of changes in temperature, specific humidity, wind field, planetary boundary layer height, clouds, and precipitation on ozone levels from 2013 to 2017. The results show that the wind field change made a significant contribution to the increase in surface ozone over many parts of China. The long-range transport of ozone and its precursors from outside the modeling domain also contributed to the increase in MDA8 O3 in China, especially on the Qinghai–Tibetan Plateau (an increase of 1 to 4 ppbv). Our study represents the most comprehensive and up-to-date analysis of the impact of changes in meteorology on ozone across China and highlights the importance of considering meteorological variations when assessing the effectiveness of emission control on changes in the ozone levels in recent years.
- Article
(9666 KB) - Companion paper
-
Supplement
(9654 KB) - BibTeX
- EndNote


Elevated concentrations of ozone (O3) on the earth's surface are harmful to human health and terrestrial vegetation (Lefohn et al., 2018; Lelieveld et al., 2015; Fleming et al., 2018). With rapid urbanization and economic development, the ozone concentrations in the troposphere have increased in the past decades over most regions of Asia, including China (Gaudel et al., 2018; Sun et al., 2016; T. Wang et al., 2019; Xu et al., 2016; Ziemke et al., 2019), and ground-level ozone pollution has become a major concern in China's urban and industrial regions (Wang et al., 2017; Verstraeten et al., 2015). In 2013, the Chinese government launched the Air Pollution Prevention and Control Action Plan to reduce anthropogenic emissions. The Chinese Ministry of Ecology and Environment reported that the observed concentrations of primary pollutants had decreased significantly since these strict control measures (http://www.mee.gov.cn, last access: 1 December 2019). However, the ozone concentrations in major urban areas of China have continued to increase, and the magnitude and frequency of high-ozone events are much greater in China than in cities in Japan, South Korea, Europe, and the United States (Lu et al., 2018). The ozone problem has become a new challenge to air quality management in China. A comprehensive understanding of the causes of the increase in surface ozone levels in China is necessary to develop a comprehensive whole-air improvement strategy.
Ground-level ozone is produced in situ by chemical reactions from ozone precursors, NOx, volatile organic compounds (VOCs), and carbon monoxide (CO) or transported from outside the region and from higher altitudes (Atkinson, 2000; Roelofs and Lelieveld, 1997; Akimoto et al., 2015). Meteorological conditions affect the surface ozone concentrations directly via changes in chemical reaction rates, dilution, wet and dry removal, and transport flux or indirectly via changes in natural emissions (Lu et al., 2019b; Lin et al., 2008). As for the direct effects, an increase in temperature can enhance ozone formation by altering the chemical reaction rates (Lee et al., 2014; Fu et al., 2015), and an increase in water vapor can lead to a decrease in ozone concentrations in the lower troposphere (Kalabokas et al., 2015; He et al., 2017). An increase in the planetary boundary layer (PBL) height can decrease ozone levels via dilution of primary pollutants into a larger volume of air (Sanchez-Ccoyllo et al., 2006). Clouds have also been shown to decrease ozone concentrations via aqueous-phase chemistry and photochemistry, which enhances scavenging of oxidants and reduces the oxidative capacity of the troposphere (Lelieveld and Crutzen, 1990), and precipitation decreases the ozone concentration via the wet removal of ozone precursors (Seinfeld and Pandis, 2006; Shan et al., 2008). Wind fields can significantly affect ozone by transporting ozone and ozone precursors in and out of the region of interest (Lu et al., 2019a; Sanchez-Ccoyllo et al., 2006). As for the indirect effects, an increase in temperature can enhance the biogenic emissions of VOCs and thus affect ozone production (Tarvainen et al., 2005; Guenther et al., 2006; Im et al., 2011).
Several studies have used statistical analysis or numerical modeling to assess the effects of meteorological variations on the recent urban ozone trend in China. Using a convergent cross-mapping method to overcome the interactions between various factors, Chen et al. (2019) quantified the influence of individual meteorological factors on the O3 concentration in Beijing from 2006 to 2016. The results indicated that temperature was the critical meteorological driver of the summer ozone concentrations in Beijing. Cheng et al. (2019) applied the Kolmogorov–Zurbenko filtering method to the ozone variations in Beijing from 2006 to 2017, and the results suggested that the relative contribution of meteorological conditions to long-term variation in ozone was only 2 % to 3 %, but short-term ozone concentrations were affected significantly by variations in meteorological conditions. Yin et al. (2019) also used the Kolmogorov–Zurbenko approach to analyze the ozone data for Guangzhou from 2014 to 2018 and showed that four meteorological factors, including temperature, relative humidity, etc., accounted for 76 % of the variability in the baseline ozone level. P. F. Wang et al. (2019) used a chemistry transport model (Community Multiscale Air Quality modeling system; CMAQ) to investigate the response of summer ozone concentrations to changes in meteorological conditions from 2013 to 2015, and they showed that the maximum daily 8 h average (MDA8) O3 mixing ratio decreased by 5 to 10 ppb in most cities due to changes in meteorological conditions and biogenic emissions in the latter 2 years, except for some cities in eastern, south-central, and southwestern China in which the ozone mixing ratio increased by less than 10 ppb. Lu et al. (2019a) used the GEOS-Chem model to explore changes in source attributions contributing to ozone changes over China in 2016 and 2017 and suggested that the increases in ozone in 2017 relative to 2016 were mainly caused by higher background ozone driven by hotter and drier weather conditions.
Despite these studies, a more comprehensive understanding of the role of the meteorological conditions in the recent ozone changes is still warranted. Previous analyses with a statistical method have been limited to a few cities (i.e., Beijing and Guangzhou). China has a vast territory with a wide range of climates, so the meteorological conditions in various parts of China may have experienced different changes in recent years. Previous chemical transport modeling studies examined either the meteorological impact for 2 or 3 years (no more), the combined (not individual) effects of meteorological parameters, or the combined (not separate) effect of biogenic emission and meteorology changes.
The objective of our study is to investigate the effects of changes in meteorological conditions and anthropogenic emissions on summer surface ozone increases over China from 2013 to 2017 using an up-to-date regional chemical transport model driven by the interannual meteorological conditions and anthropogenic emissions over the 5 years. This paper (Part 1) assesses the role of meteorological conditions, and a companion paper (Part 2; Liu and Wang, 2020) focuses on the role of anthropogenic emissions and implications for multi-pollutant control. Section 2 introduces the observational data, the model used, and experiment settings. In Sect. 3, we first evaluate the simulated meteorological factors and pollutant concentrations based on the observations. Subsequently, we separate the changes in the MDA8 O3 due to the variations in meteorological conditions and anthropogenic emissions by conducting numerical sensitivity experiments and explore their contributions to the ozone changes during the 5 years. Considering the importance of biogenic emissions to ozone production, we estimate the meteorology-driven biogenic emissions over China from 2013 to 2017 and assess their impacts on the variations in ozone. Lastly, the effects of changes in individual meteorological factors are examined, and the role of long-range transport is assessed. Section 4 summarizes the conclusions.
2.1 Measurement data
We used observational data to evaluate the meteorological parameters and air pollutant concentrations simulated by the Weather Research and Forecasting (WRF)-CMAQ model. The daily meteorological observations were obtained from the National Meteorological Information Center (http://data.cma.cn, last access: 1 December 2019), including the daily average temperature at a height of 2 m, relative humidity at a height of 2 m, wind speed at a height of 10 m, and surface pressure at ∼700 ground weather stations in China. The observed concentrations of air pollutants were obtained from the China National Environmental Monitoring Center (http://106.37.208.233:20035/, last access: 1 December 2019), including SO2, NO2, CO, O3, and PM2.5. In 2013, there were 493 environmental monitoring stations in 74 major cities, mostly in urban areas. As a result, only these stations have continuous 5-year observations of pollutants from 2013 to 2017. With the increasing recognition of the air pollution problem in China, more monitoring stations have been built since 2013, and the total number exceeded 1500 in 2017. We applied data quality control to the observed pollutant concentrations to remove unreliable outliers following the approach used in previous studies (Lu et al., 2018; Song et al., 2017). The locations of environmental monitoring stations are presented in Fig. S1 in the Supplement.
To evaluate the model performance, we calculated some statistical parameters, including the mean observation, mean simulation, mean bias, mean absolute gross error, root mean square error, index of agreement, and correlation coefficient. The equations for these statistical parameters can be found in Fan et al. (2013).
2.2 Model settings
The CMAQ modeling system (Byun and Schere, 2006) was developed by the United States Environmental Protection Agency (US EPA) to approach air quality as a whole by including state-of-the-art capabilities to model multiple air quality issues, including tropospheric ozone, fine particles, toxins, acid deposition, and visibility degradation. This study used the CMAQ model (version 5.2.1), an offline chemical transport model without considering the effects of air pollutants on meteorological fields. The meteorological inputs are driven by the WRF model. Table S1 in the Supplement shows the settings of the physical parameterization schemes for the WRF model. The meteorological initial and boundary conditions were provided by NCEP/NCAR FNL reanalysis data with a horizontal resolution of 1∘. Figure S1 shows the modeling domains for the WRF and CMAQ model with a horizontal resolution of 36 km. The model has 23 vertical layers and reaches 50 hPa at the top. The CMAQ modeling domain, which is a few grids smaller than the WRF modeling domain to reduce the effect of the meteorological boundary from the WRF model, covers all the land areas of China and the surrounding regions. The boundary conditions of chemical species for CMAQ were derived from the modeling results of the global chemistry transport model, Model for Ozone and Related Chemical Tracers, version 4 (MOZART-4) (http://www.acom.ucar.edu/wrf-chem/mozart.shtml, last access: 1 December 2019) (Emmons et al., 2010). We used SAPRC07TIC (Carter, 2010; Hutzell et al., 2012; Xie et al., 2013; Lin et al., 2013) as the gas-phase chemical mechanism and AERO6i (Murphy et al., 2017; Pye et al., 2017) as the aerosol mechanism in the CMAQ model.
The original CMAQ model includes the heterogeneous reactions of only NO2, NO3, and N2O5 on aerosol surfaces. Recent studies (K. Li et al., 2019a, b) have suggested that the heterogeneous reactions on aerosol surfaces, mainly the uptake of HO2, played a significant role in the increasing O3 concentrations in China from 2013 to 2017. To better simulate the effects of aerosol on ozone via heterogeneous reactions, we updated the heterogeneous reaction rates of NO2 and NO3 on the aerosol surface and incorporated more heterogeneous reactions into the CMAQ model, including the uptake of HO2, O3, OH, and H2O2. The detailed heterogeneous reactions in the updated CMAQ model are listed in Table S2. We select the “best guess” uptake coefficients of these gases, which have been widely used in previous chemical transport model studies (Jacob, 2000; Zhu et al., 2010; Zhang and Carmichael, 1999; Fu et al., 2019; Liao et al., 2004). These improvements help the CMAQ model better simulate ozone and other pollutants, and their influence and that of aerosol on the ozone concentration via various heterogeneous reactions are evaluated in the companion paper (Part 2; Liu and Wang, 2020).
2.3 Emissions
For anthropogenic emissions, we used the Multi-resolution Emission Inventory for China (MEIC) for 2013 to 2017 (http://www.meicmodel.org/, last access: 1 December 2019), which was developed by Tsinghua University and has been evaluated by satellite data and ground observations (Zheng et al., 2018). International shipping emissions in 2010 were obtained from the Hemispheric Transport Atmospheric Pollution emissions version 2.0 dataset (Janssens-Maenhout et al., 2015). Biogenic emissions from 2013 to 2017 were calculated from the Model of Emissions of Gases and Aerosols from Nature (MEGAN) (Guenther et al., 2006) and driven by the interannual summer meteorological inputs from the WRF model.
2.4 Experiment settings
The model simulations were conducted for the summers (June, July, and August) from 2013 to 2017 and driven by interannual meteorology and anthropogenic emissions, namely the base simulations. The shipping emissions remained unchanged in the 5-year simulation due to a lack of data for recent years. To investigate the causes of the increasing surface ozone levels in China, we conducted four sets of modeling experiments based on the simulation of 2013. The first was designed to evaluate the effects of changes in meteorological conditions and anthropogenic emissions (Table S3). We derived the effects of meteorological variation by comparing the simulated ozone concentrations in different years but with the same anthropogenic emissions and chemical boundary conditions as those from 2013. The effects of changes in anthropogenic emissions were derived by comparing the simulated ozone values in 2013 but with anthropogenic emissions from different years. The second set was designed to evaluate the effects of variations in biogenic emissions driven by meteorological conditions (Table S4), which were derived by comparing the simulated ozone values in 2013 but with biogenic emissions from different years. The third set was designed to evaluate the contributions of the individual meteorological parameters to the ozone change from 2013 to 2017 (Table S5), including temperature, specific humidity, wind field, PBL height, clouds, and precipitation. Here we used specific humidity rather than relative humidity, because the specific humidity, which scaled with water vapor concentrations and was simulated by the model, was more useful for understanding the ozone formation chemistry. The fourth set (Table S6) was designed to evaluate the contribution of long-range transport from outside the CMAQ modeling domain (Fig. S1) by comparing the simulated ozone levels in 2013 with those with chemical boundary conditions from MOZART from different years.
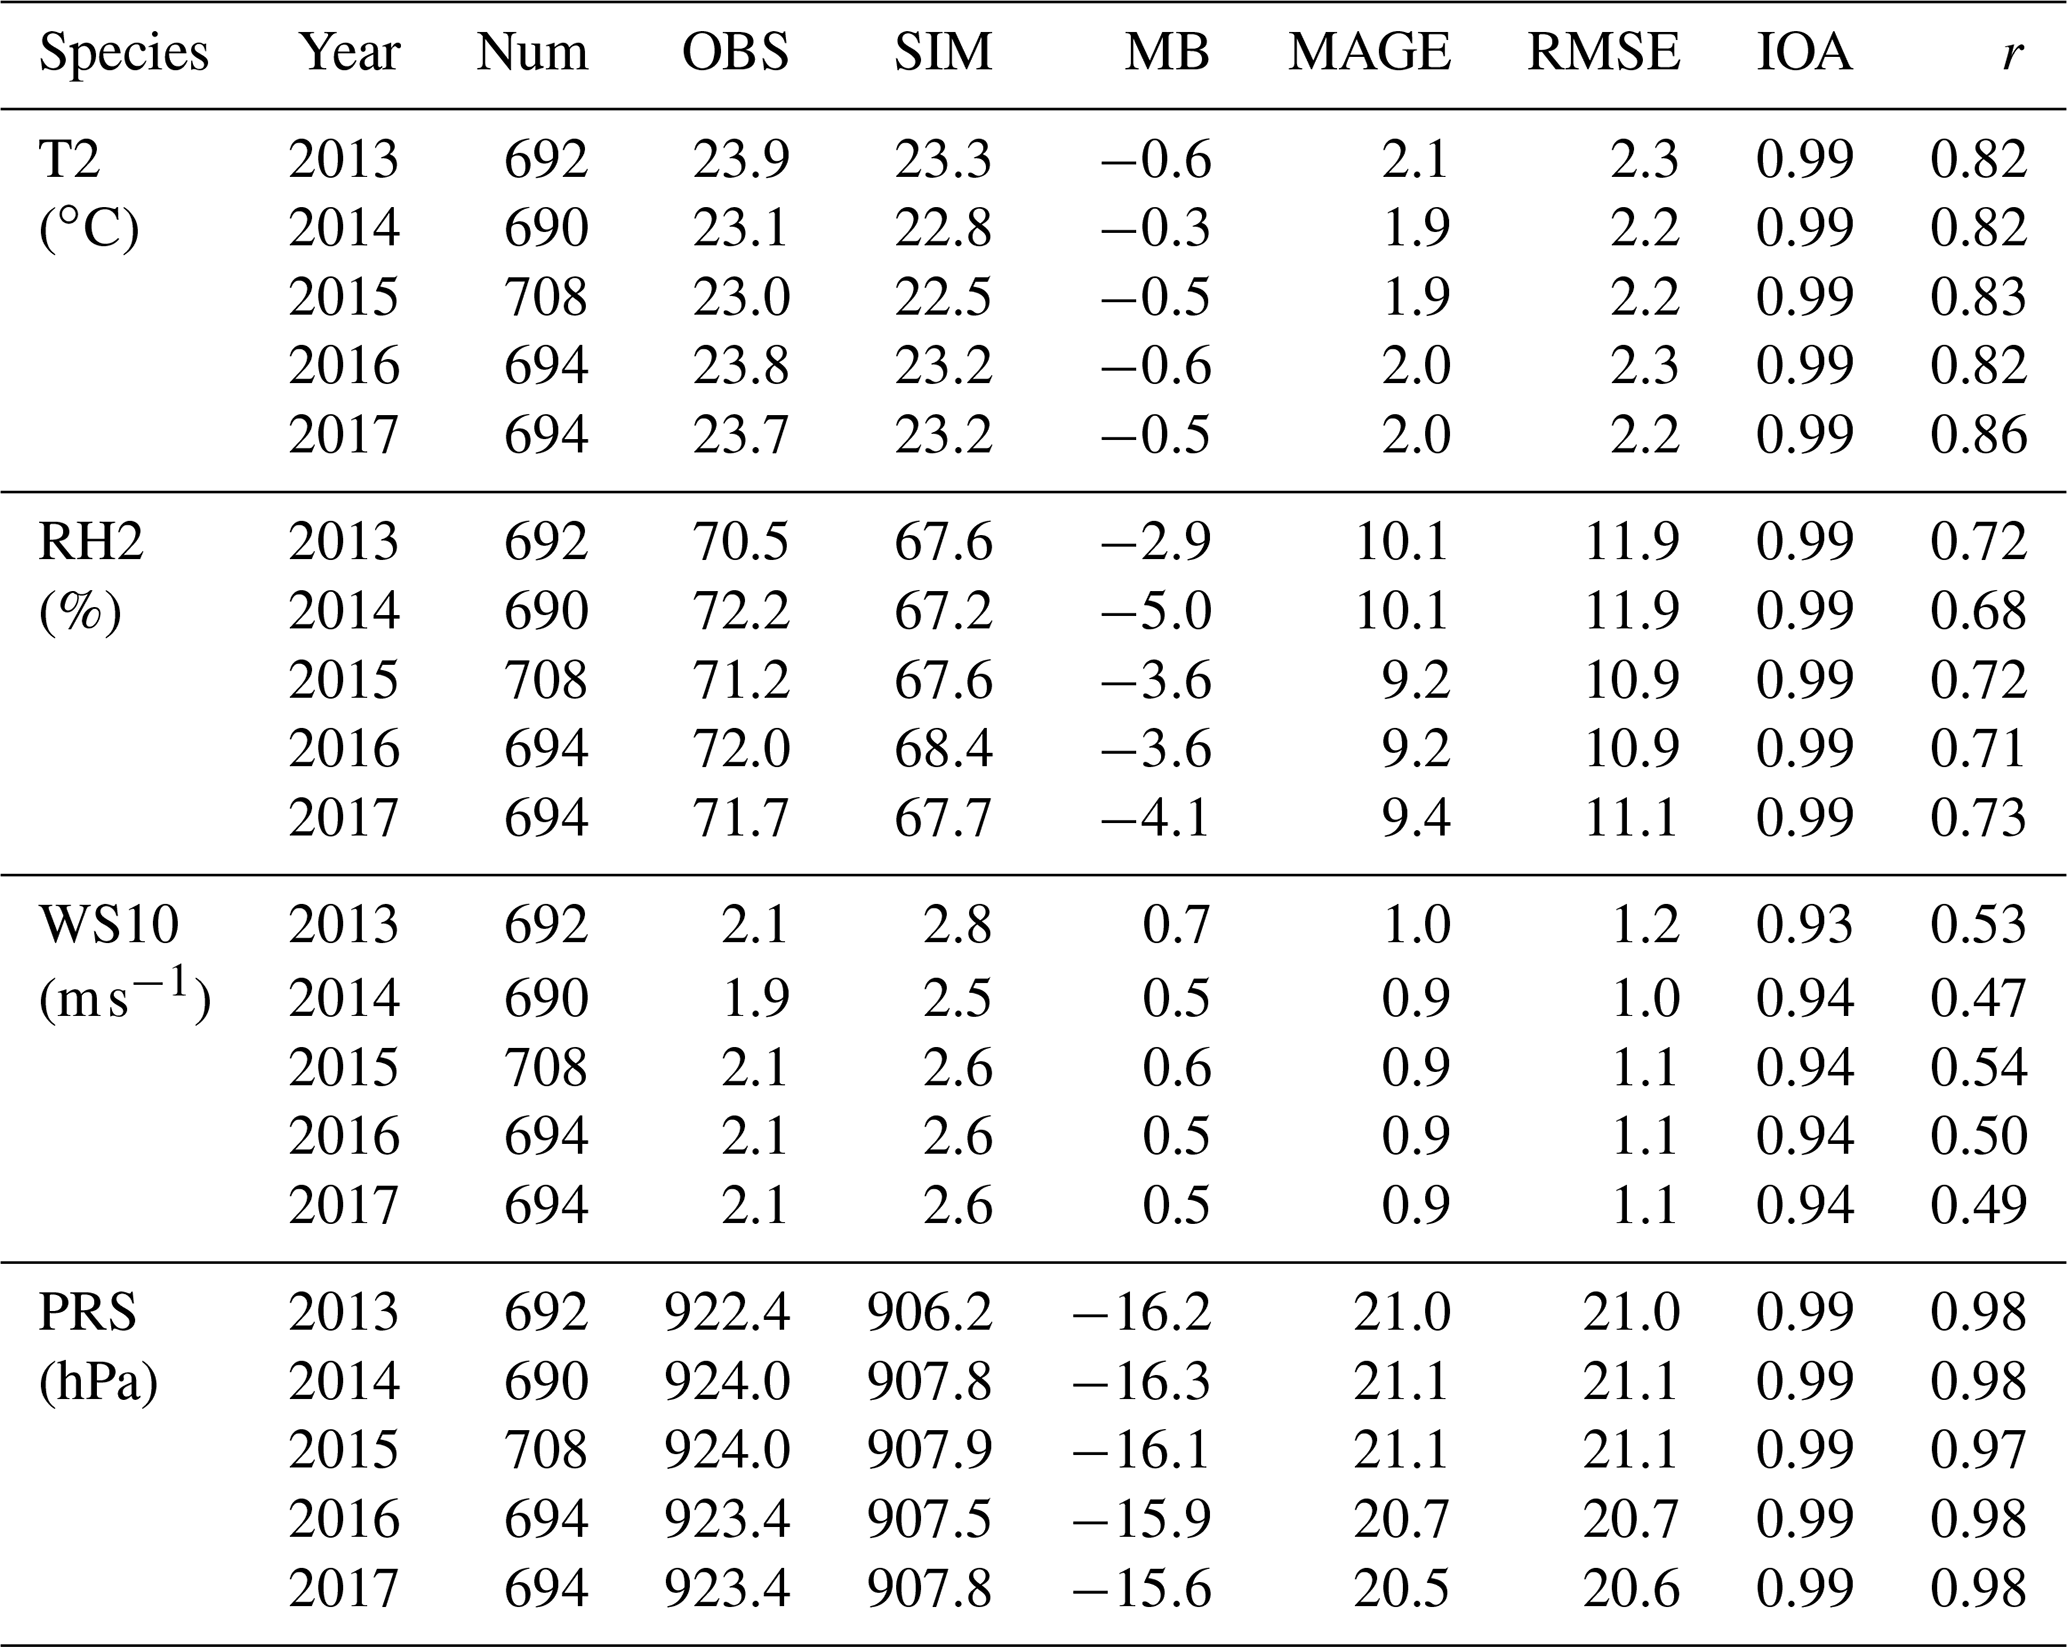
Table 1Evaluation results for the meteorological factors (T2 is temperature at a height of 2 m; RH2 is relative humidity at a height of 2 m; WS10 is wind speed at a height of 10 m; PRS is surface pressure; Num is number of sites with available observation for statistics; OBS is mean observation; SIM is mean simulation; MB is mean bias; MAGE is mean absolute gross error; RMSE is root mean square error; IOA is index of agreement; r is correlation coefficient; OBS, SIM, MB, MAGE, and RMSE have the same units as given in the first column, while IOA and r have no unit).
3.1 Model evaluation
Table 1 shows the evaluation results for temperature, relative humidity, wind speed, and surface pressure. The results for all weather stations in China were averaged. The simulated temperatures at the height of 2 m were slightly underestimated with biases of less than 0.6 ∘C in 5 years. The high correlation coefficients (over 0.82) indicate that the WRF model can capture variations in temperature. Like temperature, the simulated relative humidity values were also slightly under-predicted and had a high correlation coefficient with the observations. The simulated wind speeds at the height of 10 m were slightly overestimated by about 0.5 m s−1 due to the underestimation of the effects of urban topography in the WRF model and were often found in other WRF modeling studies (Fan et al., 2015; Hu et al., 2016). The WRF model faithfully reproduces surface pressures for 5 years with low biases and high correlation coefficients. The WRF model could also capture the temporal variations in meteorological parameters. For example, the simulated temperature at the height of 2 m decreased from 2013 to 2015 and then increased from 2015 to 2017, which is consistent with the observations. The good performance of the WRF model gives us the confidence to use the simulations to study the effects of variations in meteorological conditions on ozone levels.
Table 2Evaluation results for the air pollutants in China (Num is number of sites with available observation for statistics; OBS is mean observation; SIM is mean simulation; MB is mean bias; MAGE is mean absolute gross error; RMSE is root mean square error; IOA is index of agreement; r is correlation coefficient; OBS, SIM, MB, MAGE, and RMSE have the same units as given in the first column, while IOA and r have no unit).
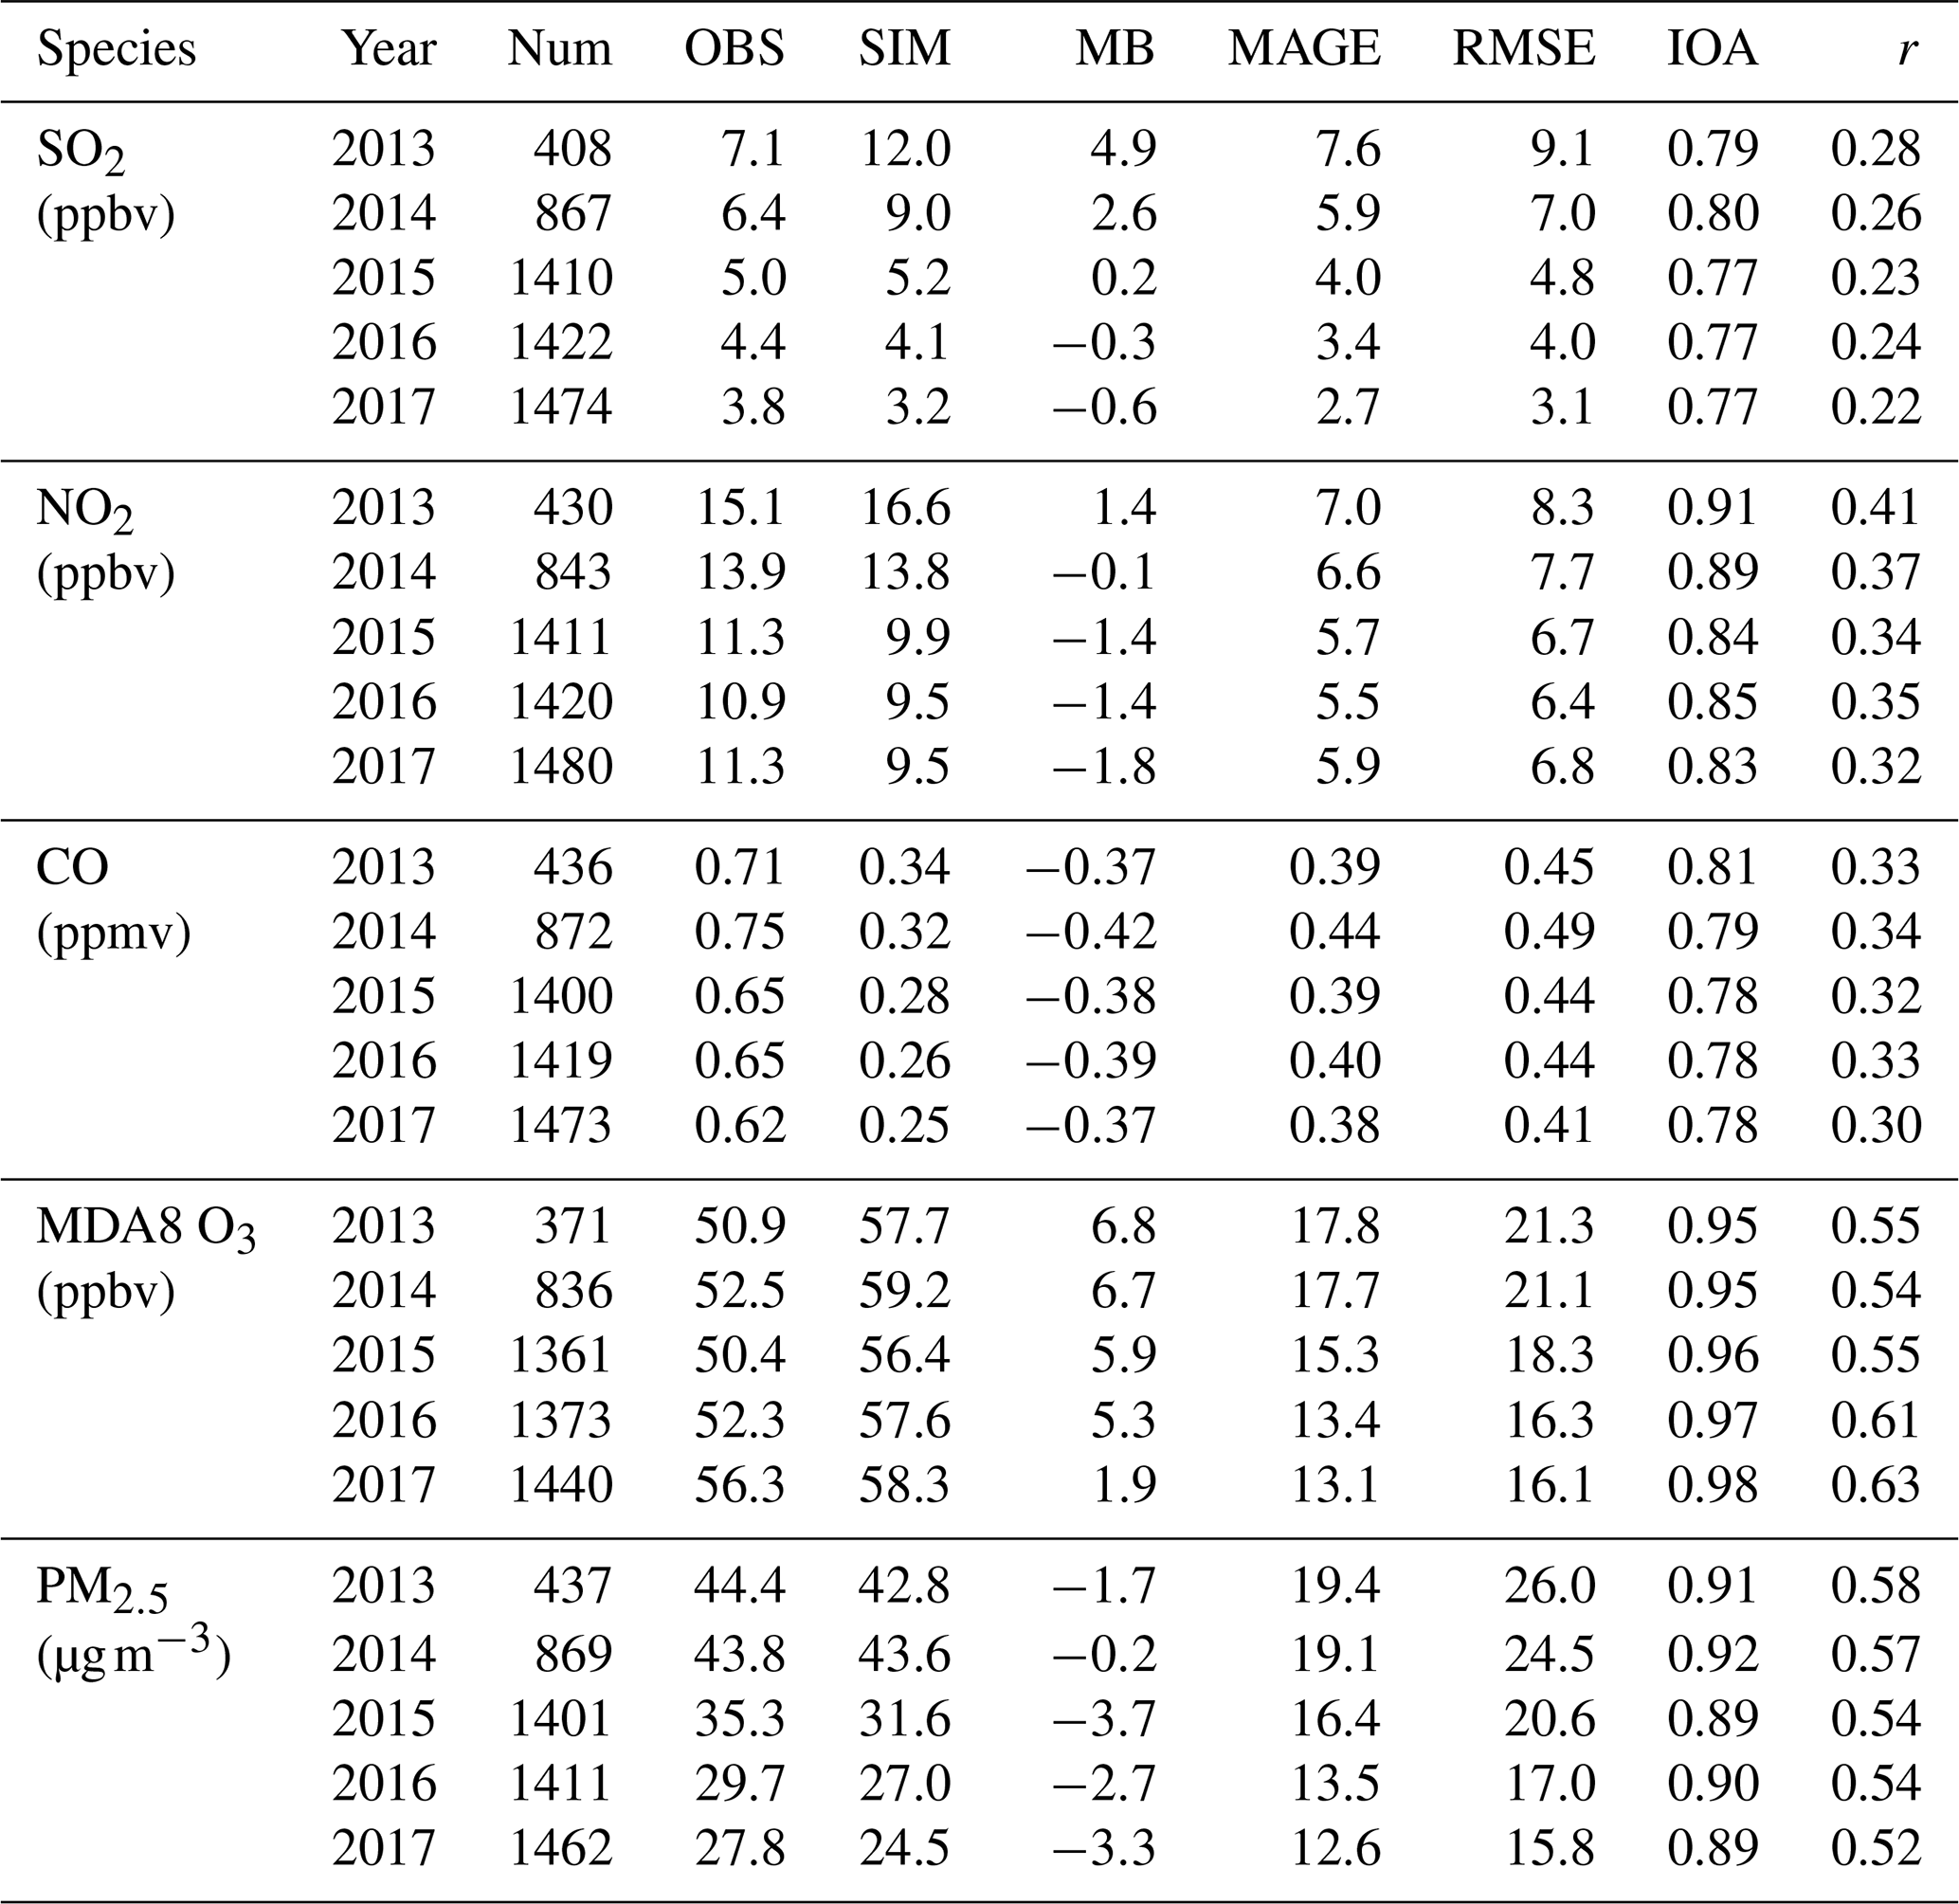
Table 2 presents the evaluation results for air pollutant concentrations in China. Generally, the CMAQ model has excellent performance on simulating pollutant concentrations with low biases, high index of agreement, and high correlation coefficients. The simulated NO2 mixing ratio was slightly underestimated for these 5 years in general, which can be explained in part by the fact that the NO2 concentrations in the national network were measured using the catalytic conversion method, which overestimates NO2, especially during periods with active photochemistry and at locations away from primary emission sources (Xu et al., 2013; Zhang et al., 2017; Fu et al., 2019). The simulated CO mixing ratio is underestimated significantly by the CMAQ model, which might be due to the missing sources of CO such as biomass burning. The CMAQ model predicts a slightly higher MDA8 O3 mixing ratio, which could be explained by the artificial mixing of ozone precursors in modeling grids leading to higher ozone production efficiency and positive ozone biases, especially for models with coarser resolutions (Young et al., 2018; Chen et al., 2018; Yu et al., 2016). However, the overall CMAQ model performance is acceptable and can support further investigation of the drivers of increasing ozone levels in China.
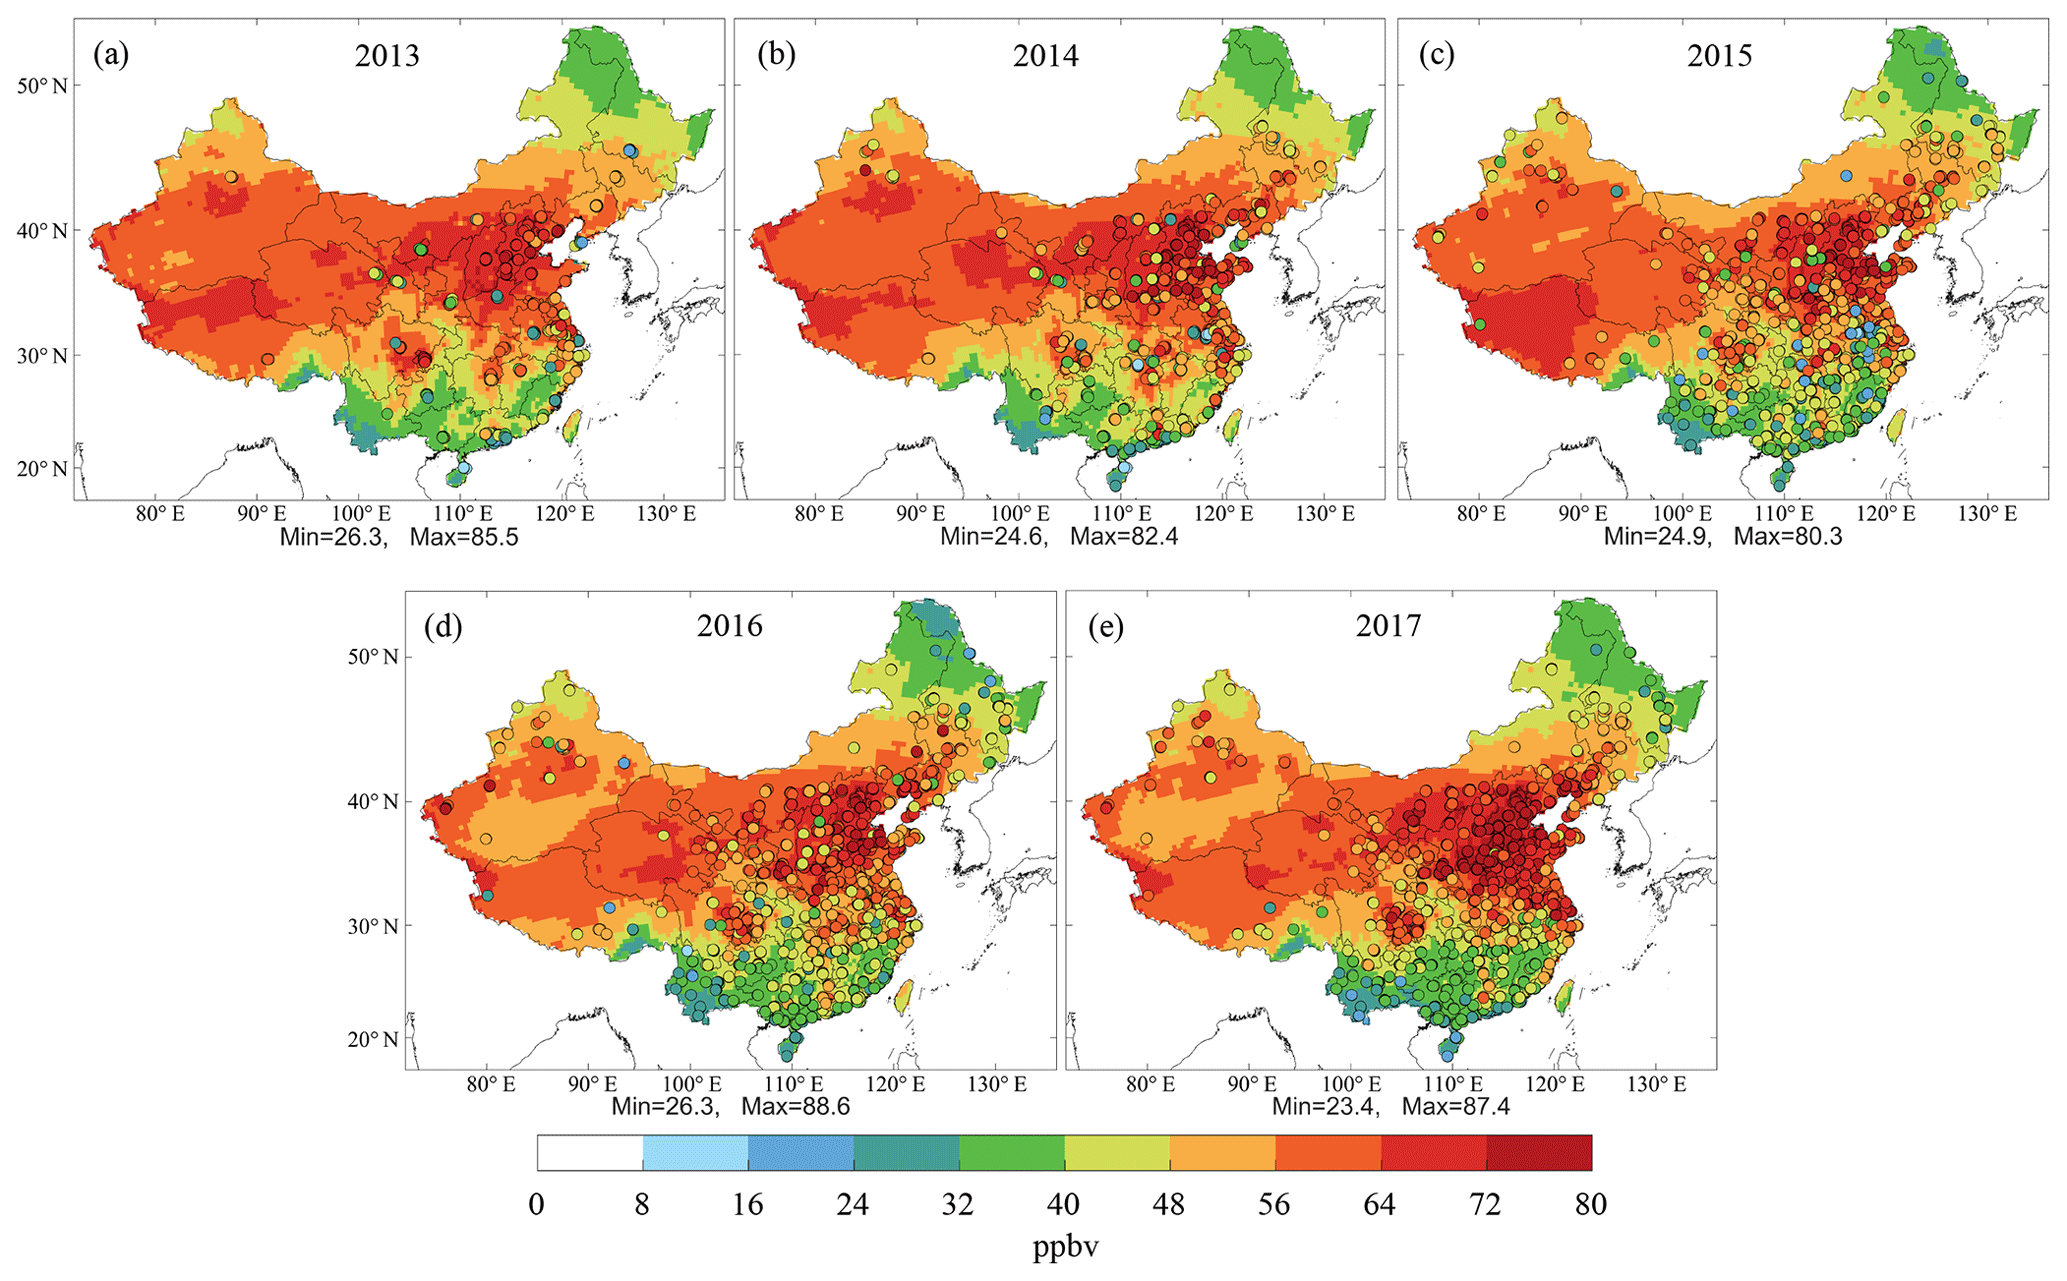
Figure 1Spatial distribution of the simulated surface maximum daily 8 h average (MDA8) O3 mixing ratios in summer (June–August) of 2013 (a), 2014 (b), 2015 (c), 2016 (d), and 2017 (e). Circles with color are the available observed values at environmental monitoring stations in each year.
3.2 Rate of change in ozone due to meteorology and anthropogenic emission
Figure 1 shows the spatial distribution of the summer surface MDA8 O3 level over land areas of China in summer from 2013 to 2017. The CMAQ model can faithfully capture the spatiotemporal variations in the observed MDA8 O3 level. Both the simulations and the observations exhibit elevated concentration in midlatitude areas, including the North China Plain (NCP), Yangtze River Delta (YRD), Sichuan Basin (SCB), and large areas in central and western China. The O3 levels in southern China are lower than those in northern China, but they are relatively high in the Pearl River Delta (PRD) region.
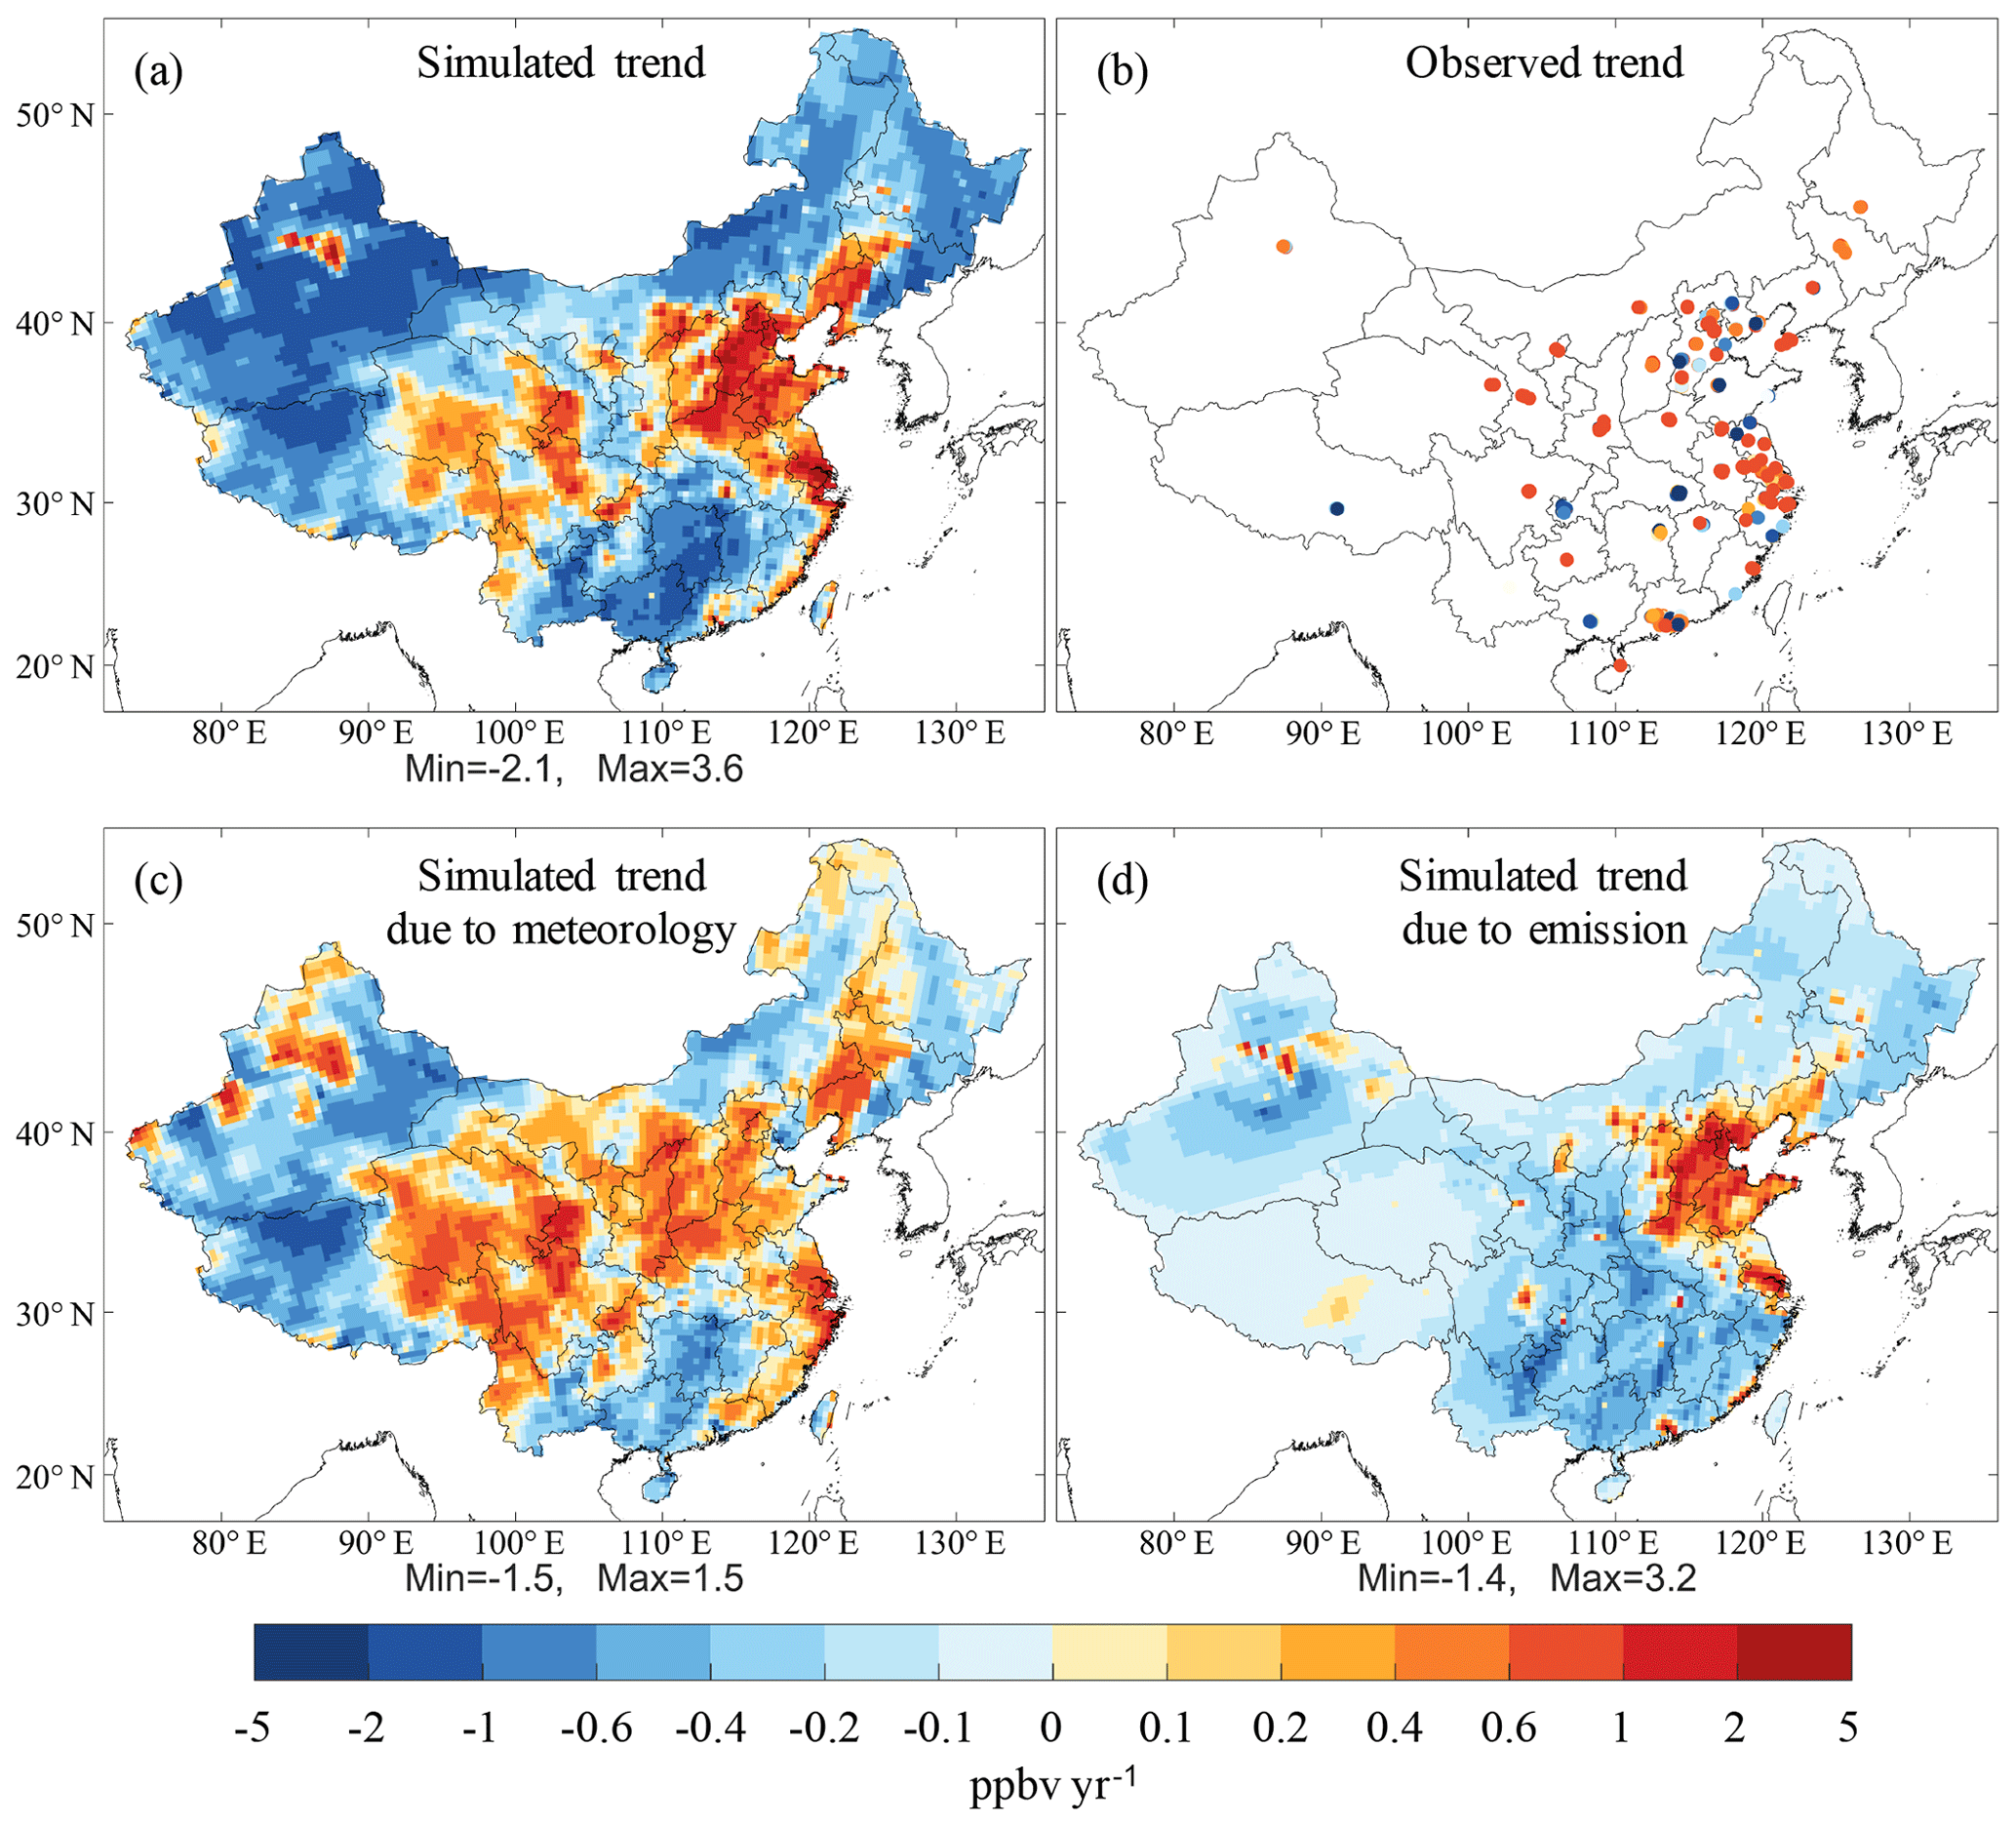
Figure 2Rates of changes in the simulated (a) and observed (b) surface MDA8 O3 mixing ratios in summer from 2013 to 2017. In panel (b), only environmental monitoring sites (493) with data available in all 5 years are presented. (c) and (d) present the rates of changes in the simulated MDA8 O3 mixing ratios due to variations in meteorological conditions and anthropogenic emissions in summer from 2013 to 2017 (see Methods section). The corresponding p values of regression are presented in Fig. S2.
We applied the linear regression method to obtain rates of change in the simulated and observed interannual MDA8 O3, which are shown in Fig. 2. In general, the observed MDA8 O3 mixing ratios present an increasing trend from 2013 to 2017 in many of the 493 monitoring stations (most located in urban areas of 74 major cities), while the trend result at some of these sites has relatively low confidence level as indicated by large p values (Fig. S2). The model captured 57 % of the observed rate of increase averaged for the 493 sites (Fig. S3). With the aid of the model simulations, the characteristics of the changes in MDA8 O3 levels were revealed for all areas, including those with no monitoring stations. Both observations and model simulations show that NCP, YRD, SCB, northeastern China, and some areas in western China experienced increasing levels of ozone pollution. Interestingly, the model results revealed that MDA8 O3 levels were decreasing in large parts of rural areas that could not be covered by the current monitoring stations, such as northwestern China and southern China.
We separated the changing rates of simulated MDA8 O3 into those due to variations in meteorological conditions and changes in anthropogenic emissions (also see Fig. 2). Here, the impact of biogenic emission variation is included in the effects of meteorological variation, because it is affected by meteorology. The result shows that the changing rates of ozone over China were more affected by meteorological changes than by emission changes in terms of spatial distribution. The regions with an increasing or decreasing trend of ozone were generally consistent with the contributions from variations in meteorology except for some regions whose ozone trends were dominated by anthropogenic emission changes. The changes in anthropogenic emissions have resulted in ozone increases in NCP, YRD, PRD, SCB, and other scattered megacities but decreases in rural regions. This discrepancy can be explained by the different ozone formation regimes in urban (VOCs-limited) areas and rural (NOx-limited) areas (K. Li et al., 2019a; N. Wang et al., 2019). A recent study reported the observations of surface ozone during 1994–2018 at a coastal site in southern China and revealed no significant changes in the ozone levels in the outflow of air masses from mainland China during recent years (T. Wang et al., 2019). These results suggest that nationwide NOx emission reductions may have decreased ozone production over large regions despite causing an ozone increase in urban areas. The impact of anthropogenic emission changes on ozone levels in recent years remains a challenging and momentous topic and will be assessed in the companion paper (Part 2; Liu and Wang, 2020). The present paper focuses on the effects of meteorological conditions.
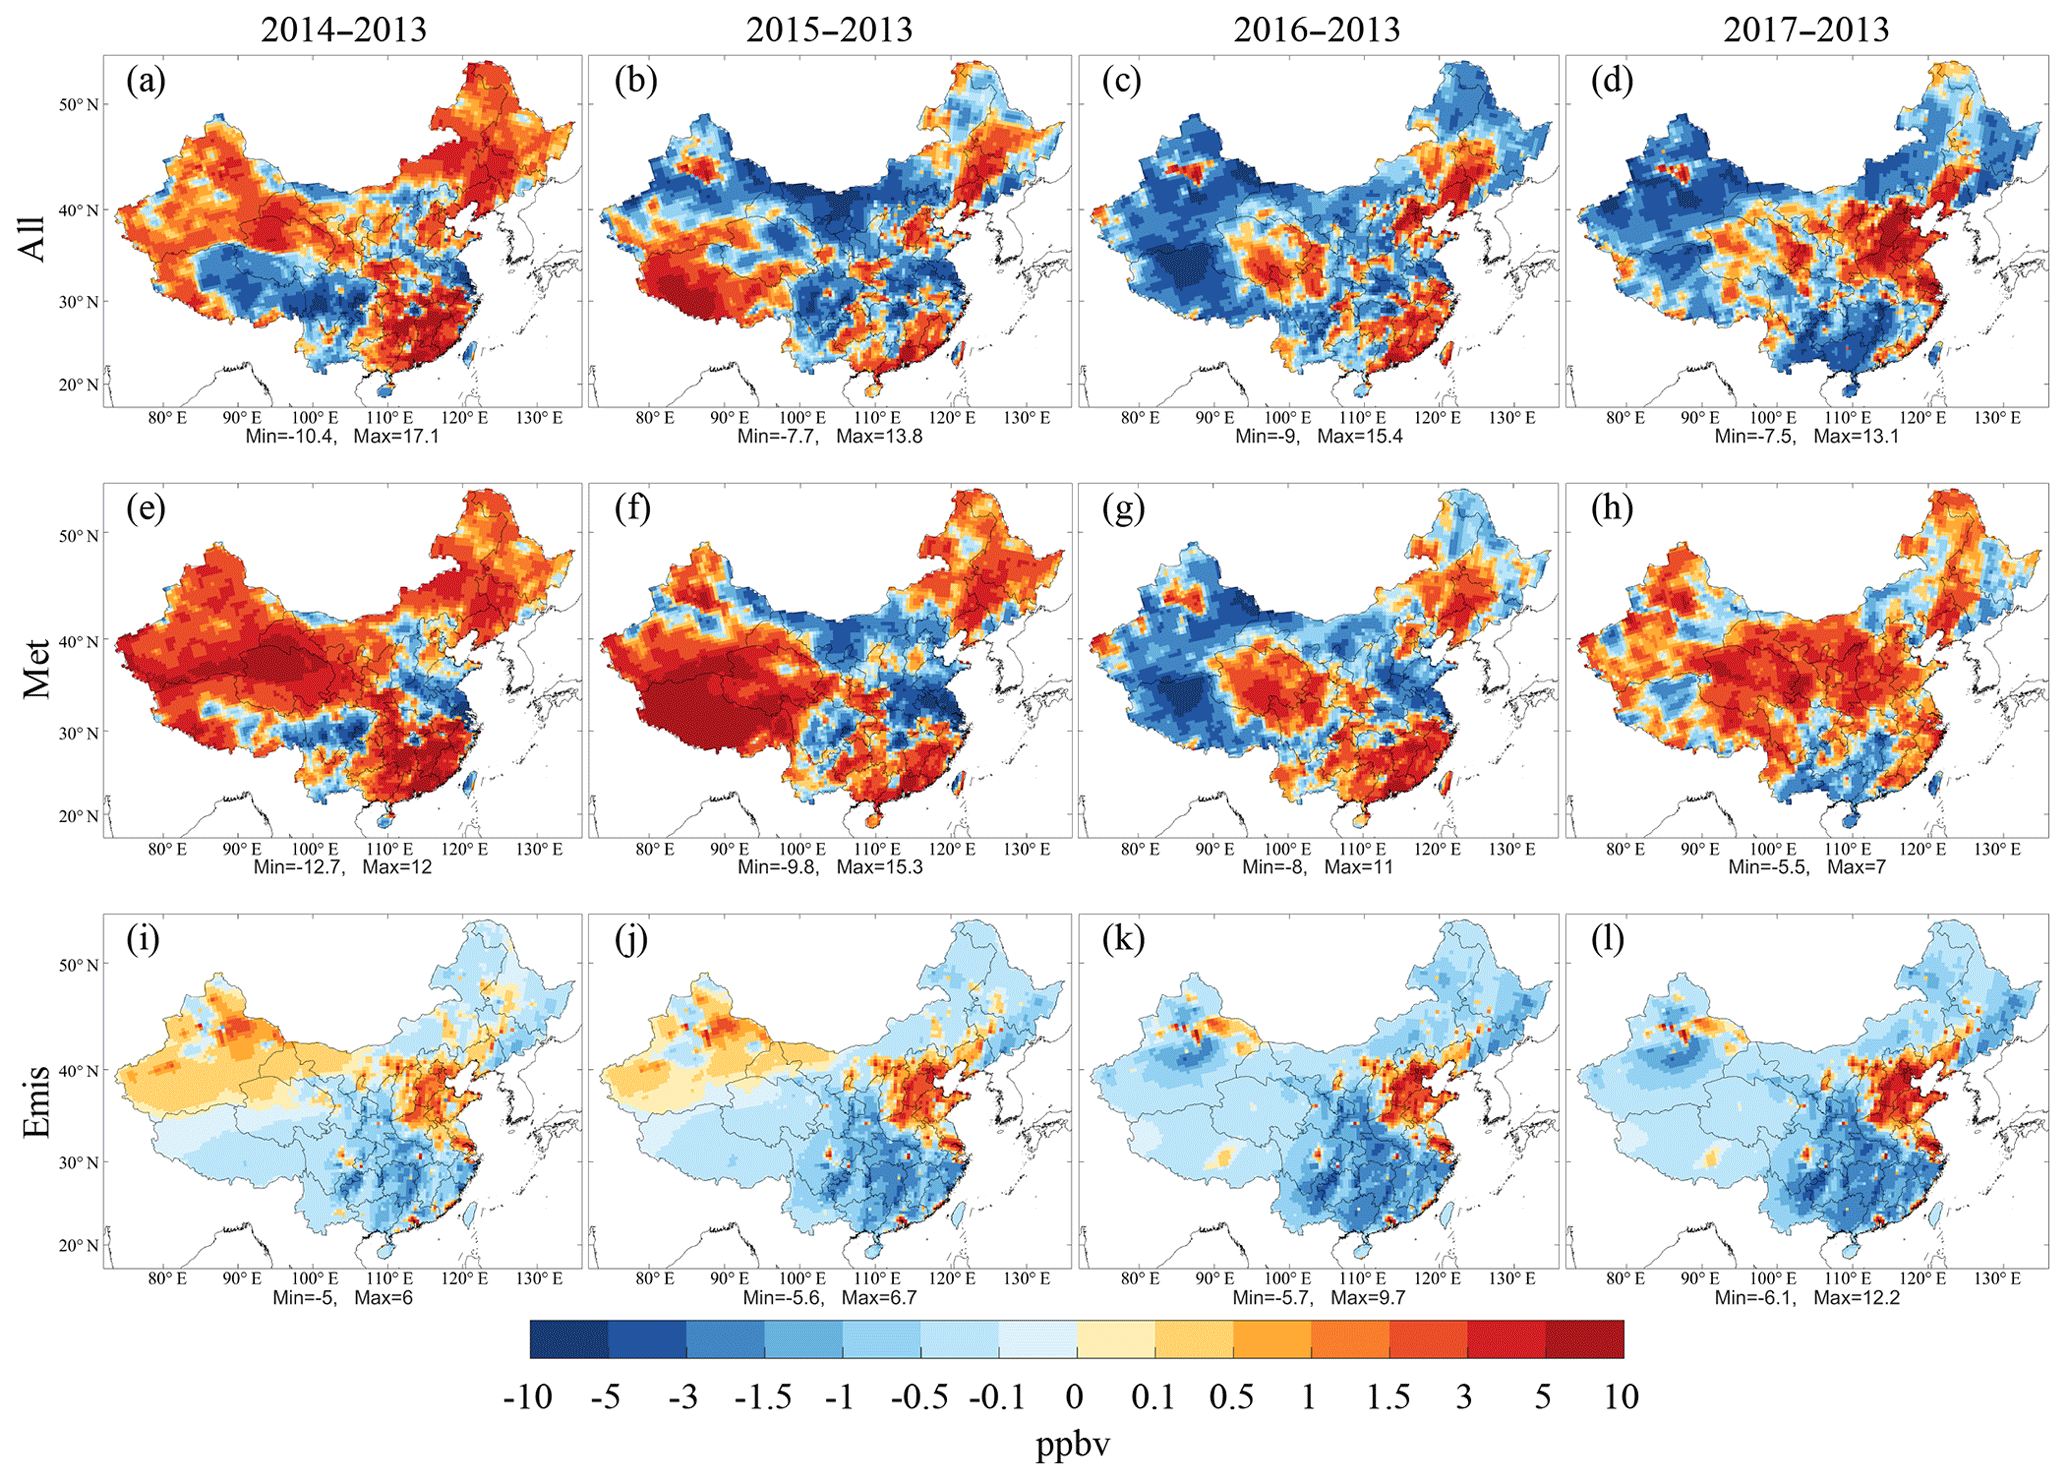
Figure 3Changes in the simulated summer surface MDA8 O3 mixing ratios from the base simulation (All, a–d); those due to variations in meteorological conditions (Met, e–h); and anthropogenic emissions (Emis, i–l) in 2014, 2015, 2016, and 2017 relative to 2013.
3.3 Impact of meteorological conditions and anthropogenic emissions relative to 2013
We next quantified the impact of meteorological conditions and anthropogenic emissions on ozone changes from 2013 to 2017 relative to 2013 (Fig. 3). The changes in MDA8 O3 from the base simulation varied spatially and yearly, mainly as a result of meteorological conditions. The variation in the MDA8 O3 mixing ratio due to meteorological changes ranged from −12.7 to 15.3 ppbv over China from 2014 to 2017 relative to 2013. The emission-induced MDA8 O3 changes in each year exhibited similar spatial patterns, which were consistent with those of the changing rates due to emission changes (Fig. 2d). The impact of emission changes on the MDA8 O3 concentrations became increasingly significant as anthropogenic emissions were further reduced. Our results differ from those by P. F. Wang et al. (2019), who suggested a less important role of meteorology in the variation of ozone from 2013 to 2015. The discrepancy could be due to the difference in the chemical mechanisms and method used for quantifying the effects of emission changes. They calculated the changes in ozone levels due to emission variations by subtracting simulated changes due to meteorological conditions variations from total observed changes, and we calculated by comparing the simulated difference between the simulations in 2013 driven by anthropogenic emissions from different years.
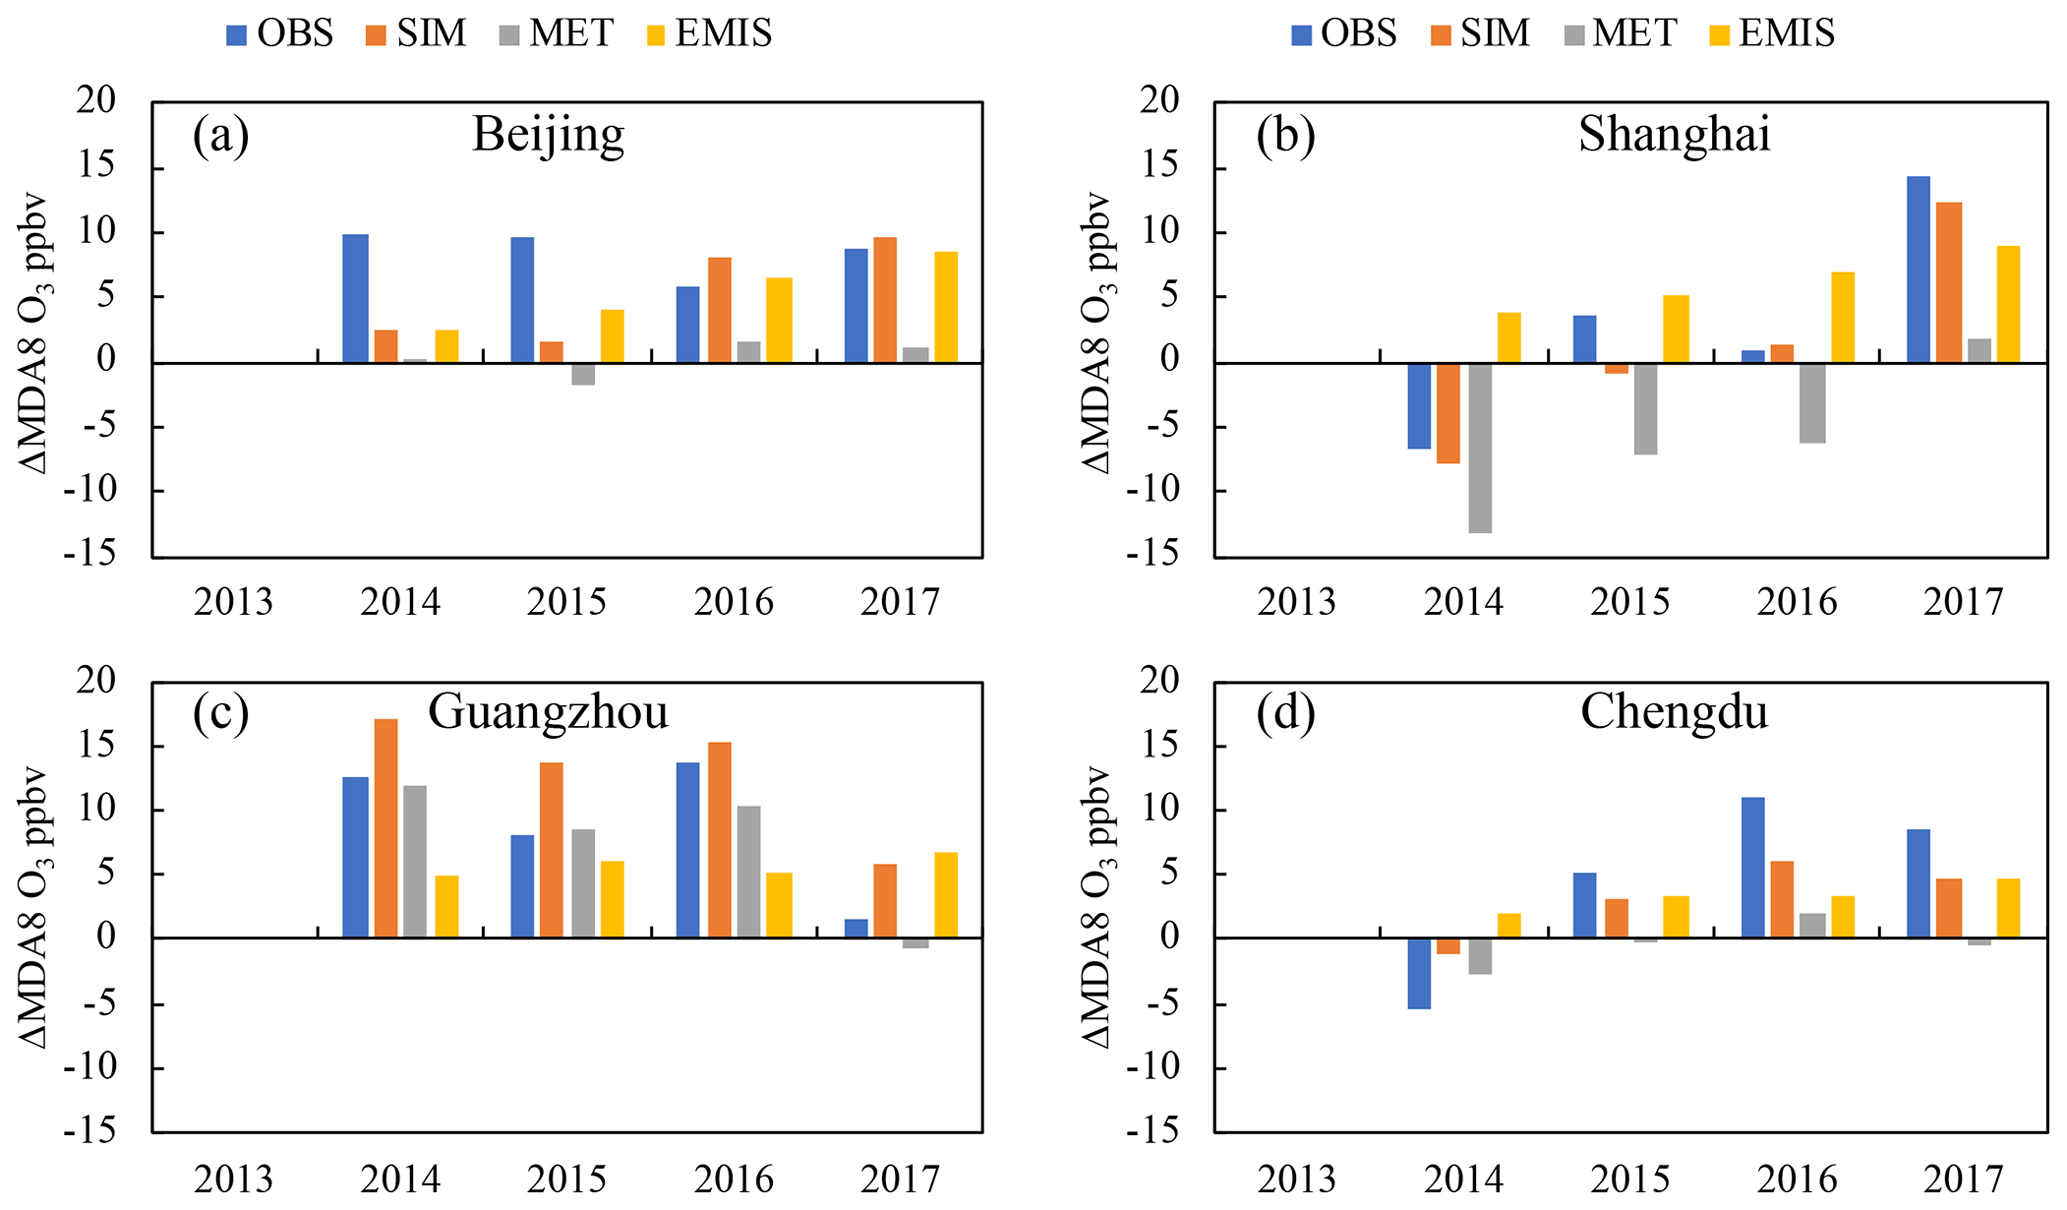
Figure 4Interannual changes in the simulated (SIM) and observed (OBS) summer surface MDA8 O3 mixing ratios and those due to variations in meteorological conditions (MET) and anthropogenic emissions (EMIS) in (a) Beijing, (b) Shanghai, (c) Guangzhou, and (d) Chengdu in 2013–2017 relative to 2013.
We further found that in some specific regions and years, the changes in MDA8 O3 due to meteorological variation could be comparable to or greater than those due to emission changes, which highlights the significant role of meteorological conditions in ozone variations. As a result, we selected four megacities in different regions of China to further examine the impact of changes in meteorological conditions and anthropogenic emissions on ozone levels (Fig. 4) – Beijing, Shanghai, Guangzhou, and Chengdu – which are principal cities in the Beijing-Tianjin-Hebei (BTH) region in the north, the YRD in the east, the PRD in the south, and the SCB in the southwestern part of China, respectively (see Fig. S1 for their locations). The numbers of monitoring sites used to obtain the average values for these four cities were 12, 9, 11, and 8, respectively. Most of these sites are situated inside the city, and thus the average results represent the conditions in urban areas. As shown in Fig. 4, the changes in observed MDA8 O3 varied in cities and years, which were generally captured by the model (except for the changes of MDA8 O3 in Beijing in 2014 and 2015, which were underestimated, likely due to underestimation of anthropogenic emissions in Beijing and its surrounding regions in those 2 years). The contributions of anthropogenic emissions to MDA8 O3 exhibited an almost linear increasing trend in the four cities from 2013 to 2017, whereas the contribution of meteorology could be positive or negative, depending on the region and year.
In Beijing (the BTH region), the variations in meteorological conditions had little effect on the MDA8 O3 changes from 2014 to 2017 relative to 2013. The increase in ozone was driven primarily by the changes in anthropogenic emissions. This characteristic can also be identified in the larger BTH region, as shown in Fig. 3. In Shanghai (the YRD region), the effects of meteorology were comparable with those of anthropogenic emissions in terms of the absolute values of the contribution to MDA8 O3 changes. From 2014 to 2016, the meteorology was unfavorable for ozone formation, which masks the ozone increase due to emission changes. However, meteorological conditions became a positive driver in 2017, leading to a drastic increase in the total MDA8 O3 mixing ratio (over 10 ppb). In Guangzhou (the PRD region), the role of meteorological conditions was opposite to that in Shanghai. The weather changes were conducive to ozone formation from 2014 to 2016 compared with 2013, contributing to a large increase in MDA8 O3 by over 10 ppbv; in 2017, however, the impact of changes in meteorological conditions on ozone levels decreased substantially, leading to a moderate increase in MDA8 O3 in that year compared with 2013. In Chengdu (the SCB region), the impact of meteorological conditions on ozone variation was limited in these years, and the ozone level was mainly affected by emission changes, similar to the situation in Beijing. Our result is similar to those by P. F. Wang et al. (2019) for Shanghai and Guangzhou from 2013 to 2015, both indicating meteorological variations unfavorable for ozone formation in Shanghai and favorable in Guangzhou. On the other hand, our simulations differ from theirs that showed a considerable negative contribution of the meteorology variations to ozone levels in Beijing and Chengdu. Our study and that of Chen et al. (2019) suggest a weak role of meteorology variation in the summer ozone trend in Beijing. In addition to these four regions, we found a significant impact of meteorology on the ozone change in western China, especially the Qinghai–Tibetan Plateau (Fig. 3). The meteorological variations contributed to considerable increases in MDA8 O3 in 2014–2017 in this region relative to 2013.

Figure 5The simulated daytime averaged temperature at a height of 2 m (Temp., a–e) and total biogenic isoprene emissions (Bio. isop. emis., f–j) in summer of 2013 from the base simulations and their changes in 2014, 2015, 2016, and 2017 relative to 2013. Panels (k)–(o) (MDA8 O3) show the simulated summer surface MDA8 O3 mixing ratios in 2013 from the base simulation and their changes due to variations in biogenic emissions in 2014, 2015, 2016, and 2017 relative to 2013.
3.4 Impact of meteorology-driven biogenic emissions relative to 2013
Temperature is an important meteorological driver of biogenic emissions. Figure 5 displays the temperature changes in land areas of China from 2014 to 2017 compared with 2013. The changes in the spatial distribution were similar in these 4 years. A decrease in temperature was found in midlatitude areas (25 to 40∘ N), and an increase was found in southern (south of 25∘ N) and northern China (north of 40∘ N). As shown in Fig. S4, in midlatitude areas such as the BTH, YRD, and SCB, the temperature decreased from 2013 to 2015 and then increased from 2015 to 2017. In contrast, in southern China, such as the PRD region, the temperature increased during 2013–2014 and then slightly decreased during 2014–2017. The variation in the observed temperature is well captured by the WRF model, which enables the MEGAN model to calculate the variation of biogenic emissions driven by the realistic temperature. We present the results of biogenic isoprene emissions, because isoprene is generally the most abundant biogenic VOC and has the highest ozone formation potential (Zheng et al., 2009). Large isoprene emissions were found in the southern parts of China and northeast China, which have high vegetation covers in summer (Fig. 5f). The spatial and interannual variations of biogenic isoprene emissions followed the changes in temperatures in China, leading to similar changes in MDA8 O3 concentrations.
In midlatitude areas of China, the variations in biogenic emissions induced a decrease in the MDA8 O3 level after 2013. The most significant decrease in the MDA8 O3 level was found in the YRD and SCB regions, where there were high biogenic emissions and a drastic temperature decrease. In 2014 and 2015, the MDA8 O3 mixing ratio decreased by ∼5 ppbv in these two regions compared with 2013. The changes in ozone were less affected by biogenic emissions due to the lower biogenic emissions and smaller variation of temperature in the BTH region. In southern and northern China, the increase in temperature and then biogenic emissions since 2013 led to an enhancement of the MDA8 O3 mixing ratio by up to 1 to 2 ppbv (Fig. 5). In Guangzhou, for example, affected by temperature-dependent biogenic emissions, the MDA8 O3 increased by 0.8 ppbv from 2013 to 2014 and then decreased slightly from 2014 to 2017 (Fig. S5).
The changes in MDA8 O3 concentrations due to changes in biogenic emissions in Shanghai and Guangzhou (Fig. S5) generally matched the total changes in ozone levels due to variations in meteorological conditions and provided a considerable contribution to them (Fig. 4). The variations in biogenic emissions were mostly affected by temperature. In Sect. 3.5, we also found that the changes in ozone levels caused by temperature variations via altering chemical reaction rates had an even more significant impact than via changing biogenic emissions in 2017 relative to 2013. As a result, temperature can play an important role in the variations in ozone levels in recent years. Previous studies also demonstrated the significant role of temperature in the ozone trend in China and other regions (Hsu, 2007; Jing et al., 2014; Lee et al., 2014). However, the role of meteorology is complex and the changes in other meteorological factors can counteract this effect. In Beijing and Chengdu, for example, the changes in ozone levels due to variations in meteorology were insignificant and could not reflect those caused by variations in temperature-dependent biogenic emissions (Fig. 4).
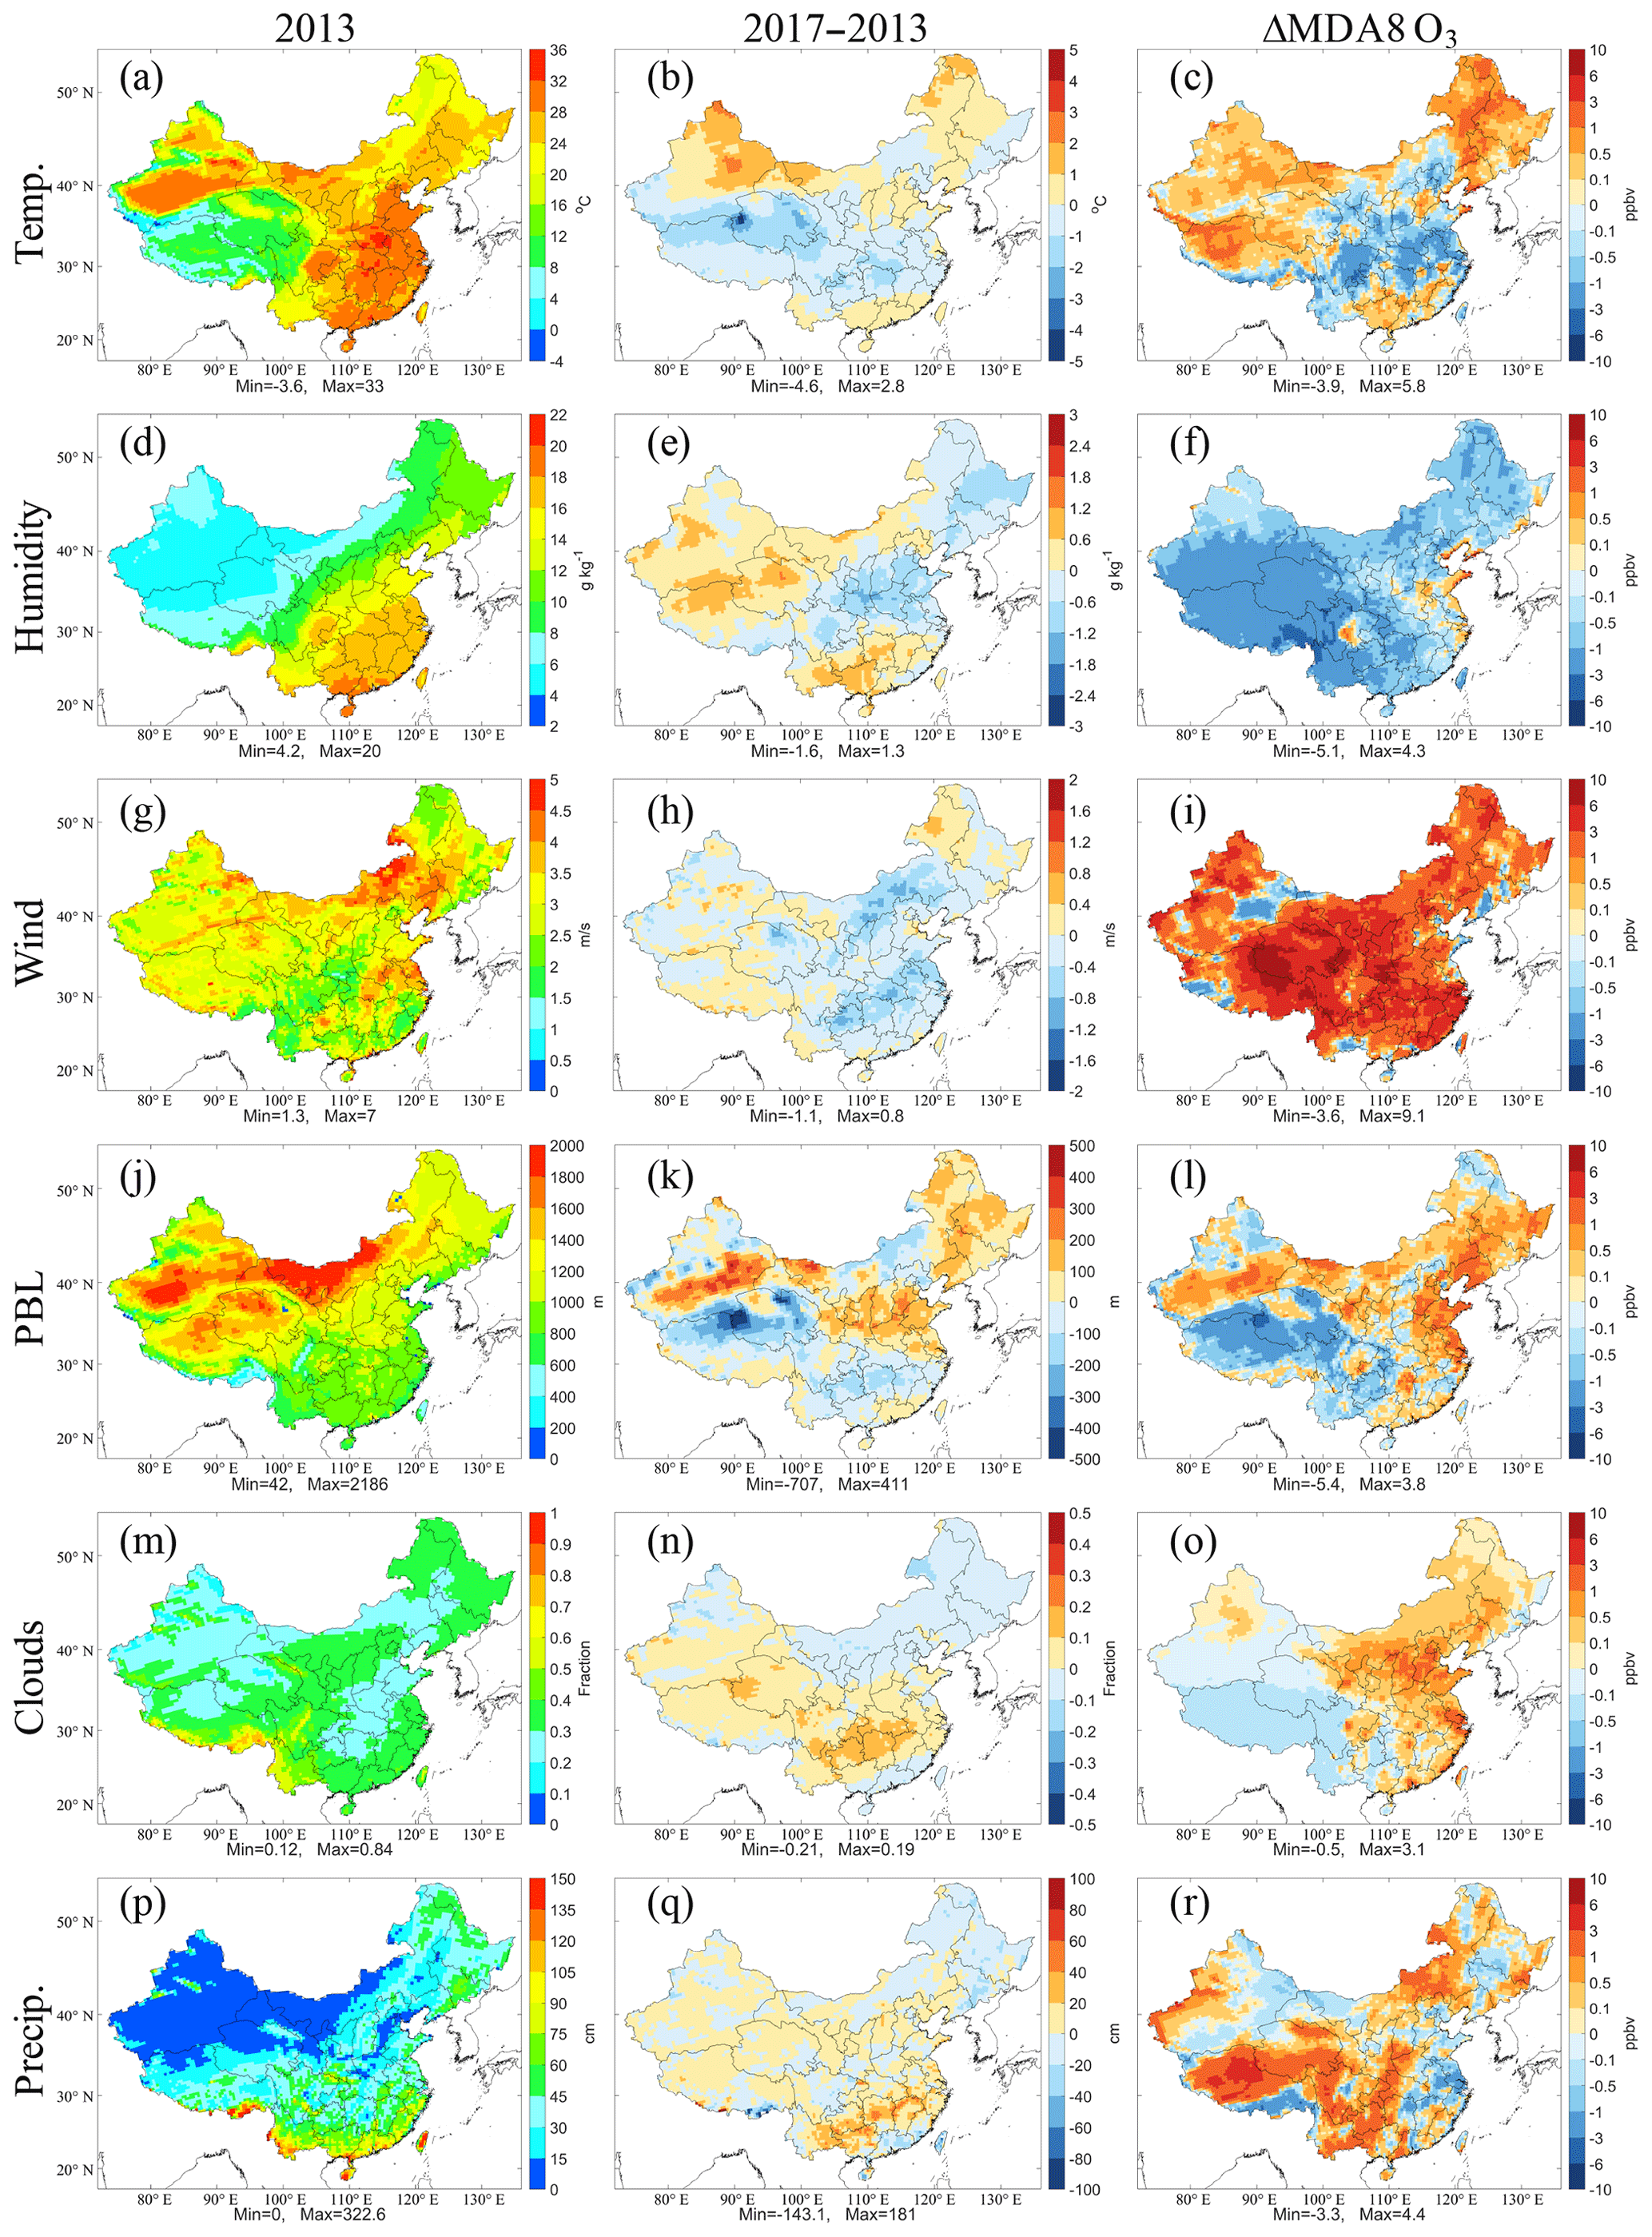
Figure 6The simulated averaged temperature (Temp.) and specific humidity (Humidity) at a height of 2 m, wind speed at a height of 10 m (Wind), planetary boundary layer (PBL) height, total clouds fraction (Clouds), and accumulated precipitation (Precip.) in the daytime in summer of 2013 from the base simulation (the left column) and their changes in 2017 relative to 2013 (the central column). The right column shows the changes in simulated summer surface MDA8 O3 mixing ratios due to variations in temperature, specific humidity, wind fields, PBL height, clouds, and precipitation in 2017 relative to 2013.
3.5 Impact of individual meteorological parameters in 2017 relative to 2013
Figure 6 shows the individual effects of changing temperature, humidity, wind field, PBL height, clouds, and precipitation between 2017 and 2013 on the ozone level. Of all the meteorological parameters, the change in wind fields had the most significant impact on MDA8 O3. It led to an increase in MDA8 O3 mixing ratio in nearly all of China, with a maximum of 9.1 ppbv (Fig. 6i). Notable increases in MDA8 O3 in western and eastern China due to the change in wind fields were identified, which contributed significantly to the meteorology-induced increasing ozone (Fig. 3h). In the Qinghai–Tibetan Plateau of western China, where terrain heights are greater than 3 km, the significant increase in the MDA8 O3 mixing ratio (3 to 9 ppbv) due to wind change from 2013 to 2017 can be attributed in part to the enhanced downward transport from the upper troposphere as indicated by the increase in the potential vorticity (PV) (Fig. S6). In eastern China, the increase in O3 level can be explained by the decrease in the wind speeds (Fig. 6h), which helps the accumulation of O3 and its precursors and then increases ozone concentrations. There is no strong evidence for the change in the vertical transport from the free troposphere to the surface in eastern China and the horizontal transport from other regions within the modeling domain between these 2 years, according to the wind data (Fig. S7).
In addition to wind fields, other meteorological parameters contribute to the ozone change. Because a high temperature facilitates the formation of ozone via the increase in chemical reaction rates, the changes in ozone due to temperature were consistent with the changes in temperature in terms of spatial distribution (Fig. 6b and c). The MDA8 O3 decreased in central China and increased in other parts of China. This change in the spatial distribution was similar to that due to the changes in biogenic emissions, because they were both affected by temperature. However, comparing Fig. 5o to Fig. 6c, we found that the impact of temperature via the change in the chemical reaction rates was generally more significant than that via the change in biogenic emissions from 2013 to 2017 (also see Fig. S8 for the quantitative comparisons in different cities).
The specific humidity decreased in central China and northeast China but increased in other parts of China from 2013 to 2017 (Fig. 6e). A decrease in the specific humidity in central China led to an increase in the MDA8 O3 concentration in localized areas, and an increase in other parts of China resulted in a decrease in the MDA8 O3 concentration in a large area (Fig. 6f). A negative correlation between ozone concentration and humidity in various regions over China was also reported in many previous studies (Ma et al., 2019; R. Li et al., 2019).
From 2013 to 2017, the PBL height increased in most parts of China, including NCP, northeast China, and northwest China (Fig. 6k). Our modeling results show that the increase in the PBL height enhanced the MDA8 O3 concentration in most parts of China (Fig. 6l). A positive correlation between the PBL height and the ozone level in China is also revealed in the statistical results of He et al. (2017). Possible reasons for the ozone increase with the increase in the PBL height include lower NO concentration at the urban surface due to the deep vertical mixing, which then limits ozone destruction and increases ozone concentrations (He et al., 2017), and more downward transport of ozone from the free troposphere where the ozone concentration is higher than the near-surface concentration (Sun et al., 2010).
The cloud fraction increased in southwestern China and the Qinghai–Tibetan Plateau but slightly decreased in other parts of China from 2013 to 2017 (Fig. 6n). Because clouds can decrease ozone concentrations via aqueous-phase chemistry and photochemistry to enhance scavenging of oxidants and reduce the oxidative capacity of the troposphere (Lelieveld and Crutzen, 1990), the MDA8 O3 mixing ratio in most parts of China increased except for southwestern China and the Qinghai–Tibetan Plateau (Fig. 6o).
The change in precipitation was similar to that of the cloud fraction in terms of spatial distribution (Fig. 6q) but made an opposite contribution to ozone levels compared with clouds (Fig. 6r). A positive correlation (p=0.95) between ozone and precipitation was also reported by the statistical results of R. Li et al.(2019). Although precipitation can decrease ozone concentrations via the scavenging of ozone precursors (Seinfeld and Pandis, 2006; Shan et al., 2008), an increase in precipitation may decrease aerosol concentrations that could increase ozone levels by altering photolysis rates and heterogeneous reactions.
The meteorological parameters that dominate ozone changes can differ in the four megacities (Fig. S9). The decrease in cloud cover was the important meteorological cause that increased MDA8 O3 in Beijing from 2013 to 2017, the wind field change was the dominant factor that increased and decreased the MDA8 O3 level in Shanghai and Guangzhou, respectively, and the decrease in temperature contributed primarily to the decline in MDA8 O3 in Chengdu. However, the effect of the dominant meteorological factor on variations in the ozone level could be counteracted by the influence of other meteorological factors. For example, in Shanghai, the significant positive effect of changes in wind fields on ozone formation was offset by the negative effects of changes in temperature and precipitation, leading to the smaller increase in the ozone level due to the overall meteorological changes in 2017 compared with 2013 (Fig. 6b). The synergistic or counteracting effects from individual meteorological factors can give rise to the complex impact of the overall meteorology on ozone variations.

Figure 7Changes in the simulated summer surface MDA8 O3 mixing ratios due to variations in long-range transport in 2014, 2015, 2016, and 2017 relative to 2013.
3.6 Impact of long-range transport relative to 2013
The chemical boundary conditions for the CMAQ model were derived from the results of the MOZART global model, which can represent the long-range transport of ozone and its precursors from outside the CMAQ modeling domain to China and surrounding regions (Fig. S1). We changed the chemical boundary conditions in 2013 to different years to investigate the role of long-range transport in ozone variations in China, and the results are shown in Fig. 7. Changes in long-range transport after 2013 increased the MDA8 O3 mixing ratio over China except for some areas in northwestern China. Compared with a small increase in MDA8 O3 (<1 ppbv) in eastern China, the Qinghai–Tibetan Plateau encountered a significant increase in MDA8 O3 by about 1 to 4 ppbv due to changes in long-range transport after 2013. Increases in ozone levels were also found if we compared the changes in MDA8 O3 due to variations in chemical boundary conditions relative to 2014. Ozone and its precursors can be transported a long distance and then affect surface O3 in remote regions (West et al., 2009; Wild et al., 2004). A previous MOZART study by Li et al. (2014) found that the transport from the emissions of all Eurasian regions except China contributed 10 to 15 ppbv to the surface O3 mixing ratio over western China. An analysis of 10 d back trajectories at Mount Waliguan (a remote mountain site in western China) also showed that the air mass from central Asia contributed to the high O3 levels observed at the site during summer via long-range transport in the free troposphere (Wang et al., 2006). Our study indicates a considerable increase (1 to 4 ppbv) in this long-range transport contribution since 2013.
This study explored the impact of changes in meteorological conditions and anthropogenic emissions on the recent ozone variations across China. The changes in anthropogenic emissions since 2013 increased the MDA8 O3 levels in urban areas but decreased the ozone levels in rural areas. The meteorological impact on the ozone trend varied by region and by year and could be comparable with or even larger than the impact of changes in anthropogenic emissions. The individual effects of changes in temperature, specific humidity, wind field, planetary boundary layer height, clouds, and precipitation from 2013 to 2017 on the ozone levels were examined in this study. The results show that the changes in the wind fields made a significant contribution to the increase in surface ozone levels over many parts of China. The main findings for various regions of China are summarized as follows.
-
In Beijing (the Beijing-Tianjin-Hebei region), the contribution of meteorological changes to the variations in summer ozone was small in 2014–2017 relative to 2013, and the changes in anthropogenic emissions dominated the increase in ozone. Decreasing cloud cover was the dominant meteorological factor that contributed to the increase in MDA8 O3.
-
In Shanghai (the Yangtze River Delta region), meteorological variation decreased ozone formation from 2014 to 2016, which masked a large increase in ozone due to changes in emissions. The meteorological conditions in 2017 became a positive driver for an increase in ozone, leading to a drastic increase in the total MDA8 O3 mixing ratio (over 10 ppb). Changes in biogenic emissions had a significant impact on the ozone level in this region. The temperature decrease after 2013 resulted in a considerable decline in MDA8 O3, especially in 2014 and 2015. The wind field change was the dominant factor that increased MDA8 O3 in 2017 relative to 2013.
-
In Chengdu (the Sichuan Basin region), the impact of meteorological conditions on changes in ozone was limited from 2013 to 2017, and the ozone concentration was mainly affected by emissions, as in Beijing. However, the biogenic emissions induced by meteorological conditions were important and led to a moderate decrease in the ozone level. The drop in temperature contributed to the decrease in MDA8 O3 in 2017 relative to 2013.
-
In Guangzhou (the Pearl River Delta region), the meteorological conditions were more conducive to ozone formation from 2014 to 2016 than in 2013, which led to a significant increase (>10 ppbv) in MDA8 O3. In 2017, the impact of changes in meteorological conditions on ozone levels decreased substantially, and the increase in MDA8 O3 was small and only due to the changes in emissions. The biogenic emissions driven by meteorological conditions were also important to ozone formation and increased MDA8 O3 after 2013. The wind field change was the dominant meteorological factor that decreased MDA8 O3 in 2017 compared with 2013.
-
In western China, the increase in ozone concentrations was mainly caused by meteorological conditions. The increase in MDA8 O3 in Qinghai–Tibetan Plateau from 2013 to 2017 was ascribed to enhanced downward transport from the upper troposphere. The long-range transport of ozone and its precursors from outside the modeling domain also contributed to the increase in MDA8 O3 in most parts of China, especially on the Qinghai–Tibetan Plateau.
In conclusion, our study highlights the complex but varying effects of meteorological conditions on surface ozone levels across the regions of China and for different years. It is therefore necessary to consider meteorological variability when assessing the effectiveness of emission-control policies on changes in the levels of ozone (and other air pollutants) in different cities and/or regions of China. Such an approach could be useful for the development of future air pollution mitigation policies.
The code or data used in this study are available upon request from Yiming Liu (yming.liu@polyu.edu.hk) and Tao Wang (cetwang@polyu.edu.hk).
The supplement related to this article is available online at: https://doi.org/10.5194/acp-20-6305-2020-supplement.
TW initiated the research, YL and TW designed the paper framework. YL ran the model, processed the data, and made the plots. YL and TW analyzed the results and wrote the paper.
The authors declare that they have no conflict of interest.
We would like to thank Qiang Zhang from Tsinghua University for providing the emission inventory, Qi Fan from Sun Yat-sen University for helping to access the meteorological data, Xiao Fu from The Hong Kong Polytechnic University for sharing the model codes of HONO sources.
This research has been supported by the Hong Kong Research Grants Council (grant no. T24-504/17-N) and the National Natural Science Foundation of China (grant no. 91844301).
This paper was edited by Jianzhong Ma and reviewed by two anonymous referees.
Akimoto, H., Mori, Y., Sasaki, K., Nakanishi, H., Ohizumi, T., and Itano, Y.: Analysis of monitoring data of ground-level ozone in Japan for long-term trend during 1990–2010: Causes of temporal and spatial variation, Atmos. Environ., 102, 302–310, https://doi.org/10.1016/j.atmosenv.2014.12.001, 2015.
Atkinson, R.: Atmospheric chemistry of VOCs and NOx, Atmos. Environ., 34, 2063–2101, https://doi.org/10.1016/S1352-2310(99)00460-4, 2000.
Byun, D. and Schere, K. L.: Review of the governing equations, computational algorithms, and other components of the models-3 Community Multiscale Air Quality (CMAQ) modeling system, Appl. Mech. Rev., 59, 51–77, https://doi.org/10.1115/1.2128636, 2006.
Carter, W. P. L.: Development of the SAPRC-07 chemical mechanism, Atmos. Environ., 44, 5324–5335, https://doi.org/10.1016/j.atmosenv.2010.01.026, 2010.
Chen, X. Y., Liu, Y. M., Lai, A. Q., Han, S. S., Fan, Q., Wang, X. M., Ling, Z. H., Huang, F. X., and Fan, S. J.: Factors dominating 3-dimensional ozone distribution tropospheric ozone period, Environ. Pollut., 232, 55–64, https://doi.org/10.1016/j.envpol.2017.09.017, 2018.
Chen, Z., Zhuang, Y., Xie, X., Chen, D., Cheng, N., Yang, L., and Li, R.: Understanding long-term variations of meteorological influences on ground ozone concentrations in Beijing During 2006–2016, Environ. Pollut., 245, 29–37, https://doi.org/10.1016/j.envpol.2018.10.117, 2019.
Cheng, N. L., Li, R. Y., Xu, C. X., Chen, Z. Y., Chen, D. L., Meng, F., Cheng, B. F., Ma, Z. Q., Zhuang, Y., He, B., and Gao, B. B.: Ground ozone variations at an urban and a rural station in Beijing from 2006 to 2017: Trend, meteorological influences and formation regimes, J. Clean Prod., 235, 11–20, https://doi.org/10.1016/j.jclepro.2019.06.204, 2019.
Emmons, L. K., Walters, S., Hess, P. G., Lamarque, J.-F., Pfister, G. G., Fillmore, D., Granier, C., Guenther, A., Kinnison, D., Laepple, T., Orlando, J., Tie, X., Tyndall, G., Wiedinmyer, C., Baughcum, S. L., and Kloster, S.: Description and evaluation of the Model for Ozone and Related chemical Tracers, version 4 (MOZART-4), Geosci. Model Dev., 3, 43–67, https://doi.org/10.5194/gmd-3-43-2010, 2010.
Fan, Q., Liu, Y. M., Wang, X. M., Fan, S. J., Chan, P. W., Lan, J., and Feng, Y. R.: Effect of different meteorological fields on the regional air quality modelling over Pearl River Delta, China, Int. J. Environ. Pollut., 53, 3–23, https://doi.org/10.1504/ijep.2013.058816, 2013.
Fan, Q., Lan, J., Liu, Y. M., Wang, X. M., Chan, P. W., Hong, Y. Y., Feng, Y. R., Liu, Y. X., Zeng, Y. J., and Liang, G. X.: Process analysis of regional aerosol pollution during spring in the Pearl River Delta region, China, Atmos. Environ., 122, 829–838, https://doi.org/10.1016/j.atmosenv.2015.09.013, 2015.
Fleming, Z. L., Doherty, R. M., von Schneidemesser, E., Malley, C. S., Cooper, O. R., Pinto, J. P., Colette, A., Xu, X. B., Simpson, D., Schultz, M. G., Lefohn, A. S., Hamad, S., Moolla, R., Solberg, S., and Feng, Z. Z.: Tropospheric Ozone Assessment Report: Present-day ozone distribution and trends relevant to human health, Elementa-Sci. Anthrop., 6, 12, https://doi.org/10.1525/elementa.273, 2018.
Fu, T. M., Zheng, Y. Q., Paulot, F., Mao, J. Q., and Yantosca, R. M.: Positive but variable sensitivity of August surface ozone to large-scale warming in the southeast United States, Nat. Clim. Change, 5, 454–458, https://doi.org/10.1038/Nclimate2567, 2015.
Fu, X., Wang, T., Zhang, L., Li, Q., Wang, Z., Xia, M., Yun, H., Wang, W., Yu, C., Yue, D., Zhou, Y., Zheng, J., and Han, R.: The significant contribution of HONO to secondary pollutants during a severe winter pollution event in southern China, Atmos. Chem. Phys., 19, 1–14, https://doi.org/10.5194/acp-19-1-2019, 2019.
Gaudel, A., Cooper, O. R., Ancellet, G., Barret, B., Boynard, A., Burrows, J. P., Clerbaux, C., Coheur, P. F., Cuesta, J., Cuevas, E., Doniki, S., Dufour, G., Ebojie, F., Foret, G., Garcia, O., Granados-Munoz, M. J., Hannigan, J. W., Hase, F., Hassler, B., Huang, G., Hurtmans, D., Jaffe, D., Jones, N., Kalabokas, P., Kerridge, B., Kulawik, S., Latter, B., Leblanc, T., Le Flochmoen, E., Lin, W., Liu, J., Liu, X., Mahieu, E., McClure-Begley, A., Neu, J. L., Osman, M., Palm, M., Petetin, H., Petropavlovskikh, I., Querel, R., Rahpoe, N., Rozanov, A., Schultz, M. G., Schwab, J., Siddans, R., Smale, D., Steinbacher, M., Tanimoto, H., Tarasick, D. W., Thouret, V., Thompson, A. M., Trickl, T., Weatherhead, E., Wespes, C., Worden, H. M., Vigouroux, C., Xu, X., Zeng, G., and Ziemke, J.: Tropospheric Ozone Assessment Report: Present-day distribution and trends of tropospheric ozone relevant to climate and global atmospheric chemistry model evaluation, Elementa-Sci. Anthrop., 6, 39, https://doi.org/10.1525/elementa.291, 2018.
Guenther, A., Karl, T., Harley, P., Wiedinmyer, C., Palmer, P. I., and Geron, C.: Estimates of global terrestrial isoprene emissions using MEGAN (Model of Emissions of Gases and Aerosols from Nature), Atmos. Chem. Phys., 6, 3181–3210, https://doi.org/10.5194/acp-6-3181-2006, 2006.
He, J., Gong, S., Yu, Y., Yu, L., Wu, L., Mao, H., Song, C., Zhao, S., Liu, H., Li, X., and Li, R.: Air pollution characteristics and their relation to meteorological conditions during 2014–2015 in major Chinese cities, Environ. Pollut., 223, 484–496, https://doi.org/10.1016/j.envpol.2017.01.050, 2017.
Hsu, K.-J.: Relationships between ten-year trends of tropospheric ozone and temperature over Taiwan, Sci. Total Environ., 374, 135–142, https://doi.org/10.1016/j.scitotenv.2007.01.003, 2007.
Hu, J., Chen, J., Ying, Q., and Zhang, H.: One-year simulation of ozone and particulate matter in China using WRF/CMAQ modeling system, Atmos. Chem. Phys., 16, 10333–10350, https://doi.org/10.5194/acp-16-10333-2016, 2016.
Hutzell, W. T., Luecken, D. J., Appel, K. W., and Carter, W. P. L.: Interpreting predictions from the SAPRC07 mechanism based on regional and continental simulations, Atmos. Environ., 46, 417–429, 2012.
Im, U., Markakis, K., Poupkou, A., Melas, D., Unal, A., Gerasopoulos, E., Daskalakis, N., Kindap, T., and Kanakidou, M.: The impact of temperature changes on summer time ozone and its precursors in the Eastern Mediterranean, Atmos. Chem. Phys., 11, 3847–3864, https://doi.org/10.5194/acp-11-3847-2011, 2011.
Jacob, D. J.: Heterogeneous chemistry and tropospheric ozone, Atmos. Environ., 34, 2131–2159, 2000.
Janssens-Maenhout, G., Crippa, M., Guizzardi, D., Dentener, F., Muntean, M., Pouliot, G., Keating, T., Zhang, Q., Kurokawa, J., Wankmüller, R., Denier van der Gon, H., Kuenen, J. J. P., Klimont, Z., Frost, G., Darras, S., Koffi, B., and Li, M.: HTAP_v2.2: a mosaic of regional and global emission grid maps for 2008 and 2010 to study hemispheric transport of air pollution, Atmos. Chem. Phys., 15, 11411–11432, https://doi.org/10.5194/acp-15-11411-2015, 2015.
Jing, P., Lu, Z., Xing, J., Streets, D. G., Tan, Q., O'Brien, T., and Kamberos, J.: Response of the summertime ground-level ozone trend in the Chicago area to emission controls and temperature changes, 2005–2013, Atmos. Environ., 99, 630–640, https://doi.org/10.1016/j.atmosenv.2014.10.035, 2014.
Kalabokas, P. D., Thouret, V., Cammas, J. P., Volz-Thomas, A., Boulanger, D., and Repapis, C. C.: The geographical distribution of meteorological parameters associated with high and low summer ozone levels in the lower troposphere and the boundary layer over the eastern Mediterranean (Cairo case), Tellus B, 67, 27853, https://doi.org/10.3402/tellusb.v67.27853, 2015.
Lee, Y. C., Shindell, D. T., Faluvegi, G., Wenig, M., Lam, Y. F., Ning, Z., Hao, S., and Lai, C. S.: Increase of ozone concentrations, its temperature sensitivity and the precursor factor in South China, Tellus B, 66, 23455, https://doi.org/10.3402/tellusb.v66.23455, 2014.
Lefohn, A. S., Malley, C. S., Smith, L., Wells, B., Hazucha, M., Simon, H., Naik, V., Mills, G., Schultz, M. G., Paoletti, E., De Marco, A., Xu, X. B., Zhang, L., Wang, T., Neufeld, H. S., Musselman, R. C., Tarasick, D., Brauer, M., Feng, Z. Z., Tang, H. Y., Kobayashi, K., Sicard, P., Solberg, S., and Gerosa, G.: Tropospheric ozone assessment report: Global ozone metrics for climate change, human health, and crop/ecosystem research, Elementa-Sci. Anthrop., 6, 28, https://doi.org/10.1525/elementa.279, 2018.
Lelieveld, J. and Crutzen, P. J.: Influences of cloud photochemical processes on tropospheric ozone, Nature, 343, 227–233, https://doi.org/10.1038/343227a0, 1990.
Lelieveld, J., Evans, J. S., Fnais, M., Giannadaki, D., and Pozzer, A.: The contribution of outdoor air pollution sources to premature mortality on a global scale, Nature, 525, 367–371, https://doi.org/10.1038/nature15371, 2015.
Li, K., Jacob, D. J., Liao, H., Shen, L., Zhang, Q., and Bates, K. H.: Anthropogenic drivers of 2013–2017 trends in summer surface ozone in China, P. Natl. Acad. Sci. USA, 116, 422–427, 2019a.
Li, K., Jacob, D. J., Liao, H., Zhu, J., Shah, V., Shen, L., Bates, K. H., Zhang, Q., and Zhai, S.: A two-pollutant strategy for improving ozone and particulate air quality in China, Nat. Geosci., 12, 906–910, https://doi.org/10.1038/s41561-019-0464-x, 2019b.
Li, R., Wang, Z., Cui, L., Fu, H., Zhang, L., Kong, L., Chen, W., and Chen, J.: Air pollution characteristics in China during 2015–2016: Spatiotemporal variations and key meteorological factors, Sci. Total Environ., 648, 902–915, https://doi.org/10.1016/j.scitotenv.2018.08.181, 2019.
Li, X., Liu, J., Mauzerall, D. L., Emmons, L. K., Walters, S., Horowitz, L. W., and Tao, S.: Effects of trans-Eurasian transport of air pollutants on surface ozone concentrations over Western China, J. Geophys. Res.-Atmos., 119, 12338–12354, https://doi.org/10.1002/2014jd021936, 2014.
Liao, H., Seinfeld, J. H., Adams, P. J., and Mickley, L. J.: Global radiative forcing of coupled tropospheric ozone and aerosols in a unified general circulation model, J. Geophys. Res.-Atmos., 109, D16207, 2004.
Lin, J. T., Patten, K. O., Hayhoe, K., Liang, X. Z., and Wuebbles, D. J.: Effects of future climate and biogenic emissions changes on surface ozone over the United States and China, J. Appl. Meteorol. Climatol., 47, 1888–1909, https://doi.org/10.1175/2007jamc1681.1, 2008.
Lin, Y. H., Zhang, H. F., Pye, H. O. T., Zhang, Z. F., Marth, W. J., Park, S., Arashiro, M., Cui, T. Q., Budisulistiorini, H., Sexton, K. G., Vizuete, W., Xie, Y., Luecken, D. J., Piletic, I. R., Edney, E. O., Bartolotti, L. J., Gold, A., and Surratt, J. D.: Epoxide as a precursor to secondary organic aerosol formation from isoprene photooxidation in the presence of nitrogen oxides, P. Natl. Acad. Sci. USA, 110, 6718–6723, 2013.
Liu, Y. and Wang, T.: Worsening urban ozone pollution in China from 2013 to 2017 – Part 2: The effects of emission changes and implications for multi-pollutant control, Atmos. Chem. Phys., 20, 6323–6337, https://doi.org/10.5194/acp-20-6323-2020, 2020.
Lu, X., Hong, J. Y., Zhang, L., Cooper, O. R., Schultz, M. G., Xu, X. B., Wang, T., Gao, M., Zhao, Y. H., and Zhang, Y. H.: Severe surface ozone pollution in China: A global perspective, Environ. Sci. Tech. Lett., 5, 487–494, https://doi.org/10.1021/acs.estlett.8b00366, 2018.
Lu, X., Zhang, L., Chen, Y., Zhou, M., Zheng, B., Li, K., Liu, Y., Lin, J., Fu, T.-M., and Zhang, Q.: Exploring 2016–2017 surface ozone pollution over China: source contributions and meteorological influences, Atmos. Chem. Phys., 19, 8339–8361, https://doi.org/10.5194/acp-19-8339-2019, 2019a.
Lu, X., Zhang, L., and Shen, L.: Meteorology and climate influences on tropospheric ozone: A review of natural sources, chemistry, and transport patterns, Curr. Pollution Rep., 5, 238–260, https://doi.org/10.1007/s40726-019-00118-3, 2019b.
Ma, T., Duan, F. K., He, K. B., Qin, Y., Tong, D., Geng, G. N., Liu, X. Y., Li, H., Yang, S., Ye, S. Q., Xu, B. Y., Zhang, Q., and Ma, Y. L.: Air pollution characteristics and their relationship with emissions and meteorology in the Yangtze River Delta region during 2014–2016, J. Environ. Sci., 83, 8–20, https://doi.org/10.1016/j.jes.2019.02.031, 2019.
Murphy, B. N., Woody, M. C., Jimenez, J. L., Carlton, A. M. G., Hayes, P. L., Liu, S., Ng, N. L., Russell, L. M., Setyan, A., Xu, L., Young, J., Zaveri, R. A., Zhang, Q., and Pye, H. O. T.: Semivolatile POA and parameterized total combustion SOA in CMAQv5.2: impacts on source strength and partitioning, Atmos. Chem. Phys., 17, 11107–11133, https://doi.org/10.5194/acp-17-11107-2017, 2017.
Pye, H. O. T., Murphy, B. N., Xu, L., Ng, N. L., Carlton, A. G., Guo, H., Weber, R., Vasilakos, P., Appel, K. W., Budisulistiorini, S. H., Surratt, J. D., Nenes, A., Hu, W., Jimenez, J. L., Isaacman-VanWertz, G., Misztal, P. K., and Goldstein, A. H.: On the implications of aerosol liquid water and phase separation for organic aerosol mass, Atmos. Chem. Phys., 17, 343–369, https://doi.org/10.5194/acp-17-343-2017, 2017.
Roelofs, G.-J. and Lelieveld, J.: Model study of the influence of cross-tropopause O3 transports on tropospheric O3 levels, Tellus B, 49, 38–55, https://doi.org/10.3402/tellusb.v49i1.15949, 1997.
Sanchez-Ccoyllo, O. R., Ynoue, R. Y., Martins, L. D., and Andrade, M. D.: Impacts of ozone precursor limitation and meteorological variables on ozone concentration in Sao Paulo, Brazil, Atmos. Environ., 40, 552–562, https://doi.org/10.1016/j.atmosenv.2006.04.069, 2006.
Seinfeld, J. H. and Pandis, S. N.: Atmospheric chemistry and physics: From air pollution to climate change, John Wiley & Sons, New Jersey, 2006.
Shan, W., Yin, Y., Zhang, J., and Ding, Y.: Observational study of surface ozone at an urban site in East China, Atmos. Res., 89, 252–261, https://doi.org/10.1016/j.atmosres.2008.02.014, 2008.
Song, C. B., Wu, L., Xie, Y. C., He, J. J., Chen, X., Wang, T., Lin, Y. C., Jin, T. S., Wang, A. X., Liu, Y., Dai, Q. L., Liu, B. S., Wang, Y. N., and Mao, H. J.: Air pollution in China: Status and spatiotemporal variations, Environ. Pollut., 227, 334–347, https://doi.org/10.1016/j.envpol.2017.04.075, 2017.
Sun, L., Xue, L., Wang, T., Gao, J., Ding, A., Cooper, O. R., Lin, M., Xu, P., Wang, Z., Wang, X., Wen, L., Zhu, Y., Chen, T., Yang, L., Wang, Y., Chen, J., and Wang, W.: Significant increase of summertime ozone at Mount Tai in Central Eastern China, Atmos. Chem. Phys., 16, 10637–10650, https://doi.org/10.5194/acp-16-10637-2016, 2016.
Sun, Y., Wang, Y., and Zhang, C.: Vertical observations and analysis of PM2.5, O3, and NOx at Beijing and Tianjin from towers during summer and Autumn 2006, Adv. Atmos. Sci., 27, 123, https://doi.org/10.1007/s00376-009-8154-z, 2010.
Tarvainen, V., Hakola, H., Hellén, H., Bäck, J., Hari, P., and Kulmala, M.: Temperature and light dependence of the VOC emissions of Scots pine, Atmos. Chem. Phys., 5, 989–998, https://doi.org/10.5194/acp-5-989-2005, 2005.
Verstraeten, W. W., Neu, J. L., Williams, J. E., Bowman, K. W., Worden, J. R., and Boersma, K. F.: Rapid increases in tropospheric ozone production and export from China, Nat. Geosci., 8, 690–695, https://doi.org/10.1038/ngeo2493, 2015.
Wang, N., Lyu, X. P., Deng, X. J., Huang, X., Jiang, F., and Ding, A. J.: Aggravating O3 pollution due to NOx emission control in eastern China, Sci. Total Environ., 677, 732–744, https://doi.org/10.1016/j.scitotenv.2019.04.388, 2019.
Wang, P. F., Guo, H., Hu, J. L., Kota, S. H., Ying, Q., and Zhang, H.: Responses of PM2.5 and O3 concentrations to changes of meteorology and emissions in China, Sci. Total Environ., 662, 297–306, https://doi.org/10.1016/j.scitotenv.2019.01.227, 2019.
Wang, T., Wong, H. L. A., Tang, J., Ding, A., Wu, W. S., and Zhang, X. C.: On the origin of surface ozone and reactive nitrogen observed at a remote mountain site in the northeastern Qinghai-Tibetan Plateau, western China, J. Geophys. Res.-Atmos., 111, D08303, https://doi.org/10.1029/2005jd006527, 2006.
Wang, T., Xue, L. K., Brimblecombe, P., Lam, Y. F., Li, L., and Zhang, L.: Ozone pollution in China: A review of concentrations, meteorological influences, chemical precursors, and effects, Sci. Total Environ., 575, 1582–1596, doi10.1016/j.scitotenv.2016.10.081, 2017.
Wang, T., Dai, J., Lam, K. S., Nan Poon, C., and Brasseur, G. P.: Twenty-five years of lower tropospheric ozone observations in tropical East Asia: The influence of emissions and weather patterns, Geophys. Res. Lett., 46, 11463–11470, https://doi.org/10.1029/2019gl084459, 2019.
West, J. J., Naik, V., Horowitz, L. W., and Fiore, A. M.: Effect of regional precursor emission controls on long-range ozone transport – Part 1: Short-term changes in ozone air quality, Atmos. Chem. Phys., 9, 6077–6093, https://doi.org/10.5194/acp-9-6077-2009, 2009.
Wild, O., Pochanart, P., and Akimoto, H.: Trans-Eurasian transport of ozone and its precursors, J. Geophys. Res.-Atmos., 109, D11302,, https://doi.org/10.1029/2003jd004501, 2004.
Xie, Y., Paulot, F., Carter, W. P. L., Nolte, C. G., Luecken, D. J., Hutzell, W. T., Wennberg, P. O., Cohen, R. C., and Pinder, R. W.: Understanding the impact of recent advances in isoprene photooxidation on simulations of regional air quality, Atmos. Chem. Phys., 13, 8439–8455, https://doi.org/10.5194/acp-13-8439-2013, 2013.
Xu, W., Lin, W., Xu, X., Tang, J., Huang, J., Wu, H., and Zhang, X.: Long-term trends of surface ozone and its influencing factors at the Mt Waliguan GAW station, China – Part 1: Overall trends and characteristics, Atmos. Chem. Phys., 16, 6191–6205, https://doi.org/10.5194/acp-16-6191-2016, 2016.
Xu, Z., Wang, T., Xue, L. K., Louie, P. K. K., Luk, C. W. Y., Gao, J., Wang, S. L., Chai, F. H., and Wang, W. X.: Evaluating the uncertainties of thermal catalytic conversion in measuring atmospheric nitrogen dioxide at four differently polluted sites in China, Atmos. Environ., 76, 221–226, https://doi.org/10.1016/j.atmosenv.2012.09.043, 2013.
Yin, C., Deng, X., Zou, Y., Solmon, F., Li, F., and Deng, T.: Trend analysis of surface ozone at suburban Guangzhou, China, Sci. Total Environ., 695, 133880, https://doi.org/10.1016/j.scitotenv.2019.133880, 2019.
Young, P. J., Naik, V., Fiore, A. M., Gaudel, A., Guo, J., Lin, M. Y., Neu, J. L., Parrish, D. D., Rieder, H. E., Schnell, J. L., Tilmes, S., Wild, O., Zhang, L., Ziemke, J., Brandt, J., Delcloo, A., Doherty, R. M., Geels, C., Hegglin, M. I., Hu, L., Im, U., Kumar, R., Luhar, A., Murray, L., Plummer, D., Rodriguez, J., Saiz-Lopez, A., Schultz, M. G., Woodhouse, M. T., and Zeng, G.: Tropospheric Ozone Assessment Report: Assessment of global-scale model performance for global and regional ozone distributions, variability, and trends, Elementa-Sci. Anthrop., 6, 49, https://doi.org/10.1525/elementa.265, 2018.
Yu, K., Jacob, D. J., Fisher, J. A., Kim, P. S., Marais, E. A., Miller, C. C., Travis, K. R., Zhu, L., Yantosca, R. M., Sulprizio, M. P., Cohen, R. C., Dibb, J. E., Fried, A., Mikoviny, T., Ryerson, T. B., Wennberg, P. O., and Wisthaler, A.: Sensitivity to grid resolution in the ability of a chemical transport model to simulate observed oxidant chemistry under high-isoprene conditions, Atmos. Chem. Phys., 16, 4369–4378, https://doi.org/10.5194/acp-16-4369-2016, 2016.
Zhang, L., Li, Q., Wang, T., Ahmadov, R., Zhang, Q., Li, M., and Lv, M.: Combined impacts of nitrous acid and nitryl chloride on lower-tropospheric ozone: new module development in WRF-Chem and application to China, Atmos. Chem. Phys., 17, 9733–9750, https://doi.org/10.5194/acp-17-9733-2017, 2017.
Zhang, Y. and Carmichael, G. R.: The role of mineral aerosol in tropospheric chemistry in East Asia – A model study, J. Appl. Meteorol., 38, 353–366, 1999.
Zheng, B., Tong, D., Li, M., Liu, F., Hong, C., Geng, G., Li, H., Li, X., Peng, L., Qi, J., Yan, L., Zhang, Y., Zhao, H., Zheng, Y., He, K., and Zhang, Q.: Trends in China's anthropogenic emissions since 2010 as the consequence of clean air actions, Atmos. Chem. Phys., 18, 14095–14111, https://doi.org/10.5194/acp-18-14095-2018, 2018.
Zheng, J. Y., Shao, M., Che, W. W., Zhang, L. J., Zhong, L. J., Zhang, Y. H., and Streets, D.: Speciated VOC Emission Inventory and Spatial Patterns of Ozone Formation Potential in the Pearl River Delta, China, Environ. Sci. Technol., 43, 8580–8586, https://doi.org/10.1021/es901688e, 2009.
Zhu, S., Butler, T., Sander, R., Ma, J., and Lawrence, M. G.: Impact of dust on tropospheric chemistry over polluted regions: a case study of the Beijing megacity, Atmos. Chem. Phys., 10, 3855–3873, https://doi.org/10.5194/acp-10-3855-2010, 2010.
Ziemke, J. R., Oman, L. D., Strode, S. A., Douglass, A. R., Olsen, M. A., McPeters, R. D., Bhartia, P. K., Froidevaux, L., Labow, G. J., Witte, J. C., Thompson, A. M., Haffner, D. P., Kramarova, N. A., Frith, S. M., Huang, L.-K., Jaross, G. R., Seftor, C. J., Deland, M. T., and Taylor, S. L.: Trends in global tropospheric ozone inferred from a composite record of TOMS/OMI/MLS/OMPS satellite measurements and the MERRA-2 GMI simulation, Atmos. Chem. Phys., 19, 3257–3269, https://doi.org/10.5194/acp-19-3257-2019, 2019.