the Creative Commons Attribution 4.0 License.
the Creative Commons Attribution 4.0 License.
 | 20 May 2020
Characterization of carbonaceous aerosols in Singapore: insight from black carbon fragments and trace metal ions detected by a soot particle aerosol mass spectrometer
Laura-Hélèna Rivellini
Max Gerrit Adam
Nethmi Kasthuriarachchi
Alex King Yin Lee
Understanding sources and atmospheric processes that can influence the physiochemical properties of carbonaceous aerosols is essential to evaluate their impacts on air quality and climate. However, resolving the sources, emission characteristics, and aging processes of carbonaceous aerosols in complex urban environments remains challenging. In this work, a soot particle aerosol mass spectrometer (SP-AMS) was deployed to characterize organic aerosols (OAs), refractory black carbon (rBC), and trace metals in Singapore, a highly urbanized city with multiple local and regional air pollution sources in the tropical region. rBC (–) fragments and trace metal ions (K+, Na+, Ni+, V+, and Rb+) were integrated into our positive matrix factorization of OA. Two types of fossil fuel combustion-related OAs with different degrees of oxygenation were identified. This work provides evidence that over 90 % of rBC originated from local combustion sources with a major part related to traffic and ∼30 % associated with fresh secondary organic aerosol (SOA) produced under the influence of shipping and industrial emission activities (e.g., refineries and petrochemical plants) during daytime. The results also show that ∼43 % of the total rBC was emitted from local traffic, while the rest of the rBC fraction stemmed from multiple sources including vehicular sources, shipping, and industrial emissions, but was not fully resolved. There was only a weak association of the cooking-related OA component with rBC. Although there was no observable biomass burning episode during the sampling period, K+ and Rb+ were mainly associated with the more oxidized oxygenated OA component, indicating the potential contribution of regional biomass burning and/or coal combustion emissions to this aged OA component. Furthermore, the aerosol pollutants transported from the industrial area and shipping ports presented higher and ratios than those associated with traffic. The observed association between Na+ and rBC suggests that the contribution of anthropogenic emissions to total particulate sodium should not be ignored in coastal urban environments. Overall, this work demonstrates that rBC fragments and trace metal ions can improve our understanding of the sources, emission characteristics, and aging history of carbonaceous aerosol (OA and rBC) in this type of complex urban environment.
- Article
(5490 KB) -
Supplement
(6812 KB) - BibTeX
- EndNote


Rapid economic growth in Southeast Asia has resulted in frequent air pollution episodes in the region, primarily due to emissions from different types of fuel and biomass combustion (UN Environment, 2014). Besides typical urban emissions (e.g., local traffic), Singapore is a highly urbanized and densely populated city located at the southern end of the Malay Peninsula that can be seasonally impacted by air pollutants, especially fine particulate matter, caused by agricultural burning and wildfire events in neighboring countries (Atwood et al., 2013; Salinas et al., 2013). Singapore is also the major maritime hub in Southeast Asia. According to the World Shipping Council, Singapore has the world's second-busiest port in terms of shipping tonnage (World Shipping Council, 2019). Deep-sea cargo ships typically burn heavy residual oil; hence, the impacts of ship emissions on both local and regional particulate pollution can be substantial (Saputra et al., 2013; Velasco and Roth, 2012). Furthermore, one of the world's largest oil refinery and manufacturing complexes is located in the industrial zone of Singapore (Chou et al., 2019; Diez et al., 2019), although its potential influence on the local and regional air quality remains poorly understood.
Most of the air quality studies that have focused on particulate pollution in Singapore have relied on the off-line chemical speciation of aerosol filter samples (Balasubramanian and Qian, 2004; Atwood et al., 2013; Yang et al., 2013; Engling et al., 2014). Although this approach can provide valuable information to characterize the sources and transport of atmospheric aerosols, higher time resolution measurements are essential to evaluate the potential impacts of short-term pollution events on air quality and to track rapid variations in the aerosol composition due to emissions and atmospheric dynamics. In particular, the combination of a real-time aerosol mass spectrometry technique and positive matrix factorization (PMF) analysis has been widely used to characterize the chemical compositions and potential sources of atmospheric submicrometer organic aerosols (OA) worldwide (Zhang et al., 2007b; Jimenez et al., 2009). Recently (in 2015), Budisulistiorini et al. (2018) observed a strong haze event in Singapore using an online aerosol chemical speciation monitor (ACSM); the event lasted for only a few hours and stemmed from the regional transport of air masses influenced by wildfires in Kalimantan and Sumatra, Indonesia. Two OA components caused by peat and biomass burning events, which accounted for ∼30 % of the total OA mass, could be identified based on their PMF analysis.
Combustion processes are known sources of urban carbonaceous aerosol, which consists of OA and black carbon (BC). The diversity of anthropogenic activities in Singapore can lead to complex mixtures of OA and BC, and their sources can be difficult to interpret based on the PMF analysis of OA fragments measured by online aerosol mass spectrometry alone. For example, although Budisulistiorini et al. (2018) could identify a primary OA (POA) component that originated from local fossil fuel combustion and a secondary OA (SOA) component that was produced via a few possible formation mechanisms in Singapore during the haze period in 2015, only limited information on their emission characteristics and formation/aging processes could be provided. Taking advantage of a soot particle aerosol mass spectrometer (SP-AMS) that can detect refractory BC (rBC, an operational defined term) and trace metals in addition to non-refractory particulate matter (NR-PM, including OA, sulfate, nitrate, ammonium, and chloride) (Carbone et al., 2015; Onasch et al., 2012), the primary goal of this work was to improve our understanding of the emission characteristics and aging processes of carbonaceous aerosols in Singapore by performing three versions of a PMF analysis with different model inputs obtained from our SP-AMS measurements: (1) OA fragments, (2) OA and rBC fragments (), and (3) OA and rBC fragments and trace metal ions. To our knowledge, this is the first time that a SP-AMS instrument has been deployed in Singapore or Southeast Asia for this type of field investigation. The results provide insights into how OA components are co-emitted and interact with BC and metal species in the atmosphere.
2.1 Sampling site and co-located measurements
A SP-AMS was deployed to measure the chemical composition of atmospheric submicrometer aerosols (see details in Sect. 2.2). Other co-located instruments for PM2.5 characterizations include an Aethalometer (AE33, Magee Scientific), a MARGA (monitor for aerosols and gases, Metrohm), and a semicontinuous organic and elemental carbon (OC∕EC) analyzer (Sunset Laboratory). Gas-phase species, including nitrogen oxides (NOx, Horiba APNA-370), carbon monoxide (CO, Horiba APMA-370), and ozone (O3, 2B Technologies Inc., Model 202), were also measured. The measurements were carried out from 14 May to 9 June 2017 at the E2 building (1∘18′ N, 103∘46′ E; 67 m above sea level) within the campus of the National University of Singapore. The measurement site is located in the southern part of Singapore, and it is consequently ∼1 km from large-scale shipping port facilities (Fig. S1a in the Supplement). The air quality at the site can be influenced by nearby traffic and emissions from an industrial area located to the southwest of the measurement site (Table S1 in the Supplement).
Co-located meteorological measurements of wind speed and direction (03001 RM Young Wind Sentry Set), relative humidity (RH) and temperature (Vaisala model CS500), solar radiation (LI-COR model LI-200X), and rainfall (Hydrological Services CS700) were conducted throughout the entire sampling period. In general, the month of May falls into the inter-monsoonal period (i.e., March–May) and is characterized by low wind speed, whereas June–September is classified as the southwest monsoon period and is characterized by low rainfall levels compared with the rest of the year (NEA, 2018). During this field study, the shift from low intensity and variable winds toward stronger wind blowing from southwest was observed during the second half of May. Furthermore, the beginning of June clearly appeared to be under the influence low-level winds from the southwest (Figs. 1 and S1b). These observations suggest that the sampling period covered the transition period from the late inter-monsoon to the early southwest monsoon season.
2.2 Data collection
2.2.1 Soot particle aerosol mass spectrometer (SP-AMS)
A Teflon-coated cyclone (URG, model 2000-30ED) with a cutoff diameter of 2.5 µm was installed in the sampling inlet of the SP-AMS. A detailed description of SP-AMS has been reported by Onasch et al. (2012); thus, only a brief description of its working principle is given in this section. SP-AMS is based on the design of a high-resolution time-of-flight aerosol mass spectrometer (HR-ToF-MS; DeCarlo et al., 2006). HR-ToF-AMS can quantify NR-PM by flash vaporization of aerosol particles at 600 ∘C on a resistively heated tungsten surface. SP-AMS has an additional Nd-YAG intra-cavity infrared (IR) laser module at the wavelength of 1064 nm. rBC absorbs strongly at this wavelength and consequently heats up to ∼4000 ∘C for rBC vaporization (Onasch et al., 2012). The term rBC is an operationally defined term that applies to BC particles detected by SP-AMS. The resulting gas-phase molecules are ionized using the electron impact (EI) ionization method at 70 eV and are analyzed by a ToF-MS. Non-refractory and refractory species that are internally mixed with soot particles, such as organics, inorganics, or trace elements, can be detected via laser vaporizer measurements (Carbone et al., 2015; Corbin et al., 2018; Onasch et al., 2012). In the present study, the SP-AMS was operated at 1 min alternating intervals between the IR laser-on (i.e., dual vaporizers) and laser-off modes (i.e., tungsten vaporizer only), with a mass spectral resolving power of approximately 2000 at m∕z 28. The vacuum aerodynamic diameter (dva) of ambient particles is determined by the measured particle time-of-flight (PToF) from the chopper wheel to the tungsten vaporizer (Jayne et al., 2000).
2.2.2 Calibrations
Calibrations of the SP-AMS for quantifying NR-PM in the laser-off mode were performed by generating dried monodispersed (300 nm) ammonium nitrate (NH4NO3) particles. The NH4NO3 solution was atomized by a constant output atomizer (TSI, Model 3076). The aqueous droplets were subsequently dried by passing them through a diffusion dryer and were size-selected using a differential mobility analyzer (DMA, TSI Inc., Model 3081). The ionization efficiency (IE) and the mass-based ionization efficiency (mIENO3) were determined based on three sets of calibration data throughout the sampling period. Similarly, dried, monodisperse (300 nm) BC particles generated by atomizing the standard Regal black (Regal 400R pigment black, Cabot Corp., recommended by Onasch et al., 2012) were used to determine the mass-based ionization efficiency of rBC (mIErBC) and its ionization efficiency relative to nitrate (RIErBC = mIErBC ∕ mIE) for the quantification of rBC in the laser-on mode.
The calibration and field data were processed using the Igor-based AMS data analysis software SQUIRREL v. 1.16I for unit mass resolution (UMR) data and PIKA, v. 1.57I for high-resolution peak fitting (Sueper, 2015) with the corrected air fragment column of the standard fragmentation table based on particle-free ambient air data (Allan et al., 2004; DeCarlo et al., 2006). The sum of the carbon ion clusters – measured in the laser-on mode was used for quantifying rBC mass in both calibration and ambient data. The average ratio (0.65) obtained from Regal black was used to correct the non-refractory organic interference in for the quantification of total rBC mass loadings. The campaign averages of RIErBC and RIE were 0.15 (±0.04) and 4.24 (±0.04), respectively. The default RIE values of nitrate (1.1), sulfate (1.2), and organics (1.4) were used for the respective mass concentration quantification (Jimenez, 2003). NR-PM was quantified based on the laser-off mode measurements, and the collection efficiency (CE) was determined using the composition-dependent approach (CDCE, Fig. S2a) (Middlebrook et al., 2012). Note that the sample stream was dried to less than 30 % RH using a Nafion dryer (PD-200T-12 MPS, Perma Pure) throughout the sampling period in order to reduce CE uncertainties due to particle bouncing on the surface of the tungsten vaporizer. The SP-AMS measurements were compared with the sulfate and organic matter (OM) concentrations measured by the MARGA and the OC∕EC analyzer, respectively, showing strong temporal (r values of 0.77 and 0.93, respectively) and quantitative (slopes of 0.81 and 0.88, respectively) agreements between these measurements (Fig. S3a, b). A CE of 0.6 was used for rBC quantification due to an incomplete overlap between the laser vaporizer and the particle beam (Willis et al., 2014). The corrected rBC concentrations were also comparable to those measured by the Aethalometer (r value of 0.96 and a slope of 0.83) and the EC measured by the OC∕EC analyzer (r value of 0.84 and slope of 1.1) (Fig. S3c, d). Potassium (K+), sodium (Na+), vanadium (V+), nickel (Ni+), and rubidium (Rb+) ions were detected (Table S2). The signals of these trace metal ions were not calibrated; thus, their raw signals were used to investigate their temporal variations.
2.3 Data analysis
2.3.1 Positive matrix factorization of OA, rBC, and metals
Positive matrix factorization (PMF) is widely used to identify sources of OA measured by different versions of aerosol mass spectrometers (Ulbrich et al., 2009; Zhang et al., 2011). Each factor contains signals at m∕z values, which have common source characteristics and chemical properties that can be used to trace the origin and processing history of that factor. The PMF evaluation tool (PET, v3.00D; Ulbrich et al., 2009) was used to identify the potential sources and characteristics of OA based on the organic fragments measured in the laser-off mode. In the process of applying PMF, the ions with a signal-to-noise ratio (SNR) of 0.2< SNR <2.0 were downweighted by a factor of 2. -related ions (O+, HO+, H2O+, and CO+) were downweighted, and bad ions (SNR <0.2) were removed from the analysis. The results were obtained for 8 to 10 factors with an F peak varying from −1 to 1 and increasing by a step size of 0.2. Elemental ratios (O∕C, H∕C, and N∕C) of each factor were determined using the improved-ambient method, as described by Canagaratna et al. (2015b). A five-factor solution was selected as final result from the OA laser-off PMF analysis.
PMF analysis was further applied to determine how rBC was associated with different OA factors. For this purpose, the PMF inputs were generated using (1) organic fragments measured by the laser-on mode (Fig. S4a–c) and (2) both organic and fragments measured by the laser-on mode (Fig. S4d–f). The in the mass spectra of each PMF factor was used to quantify the fraction of rBC associated with the identified OA components. Note that the interference of non-refractory organic signals on refractory fragments was subtracted based on the method described in Wang et al. (2018); hence, the fragment was not corrected based on the fragment in the PMF analysis. Lastly, five metal ions (K+, Na+, Ni+, V+, and Rb+) were included in the PMF model (Fig. S4g–i), as the majority of their signals were higher than their respective limit of detection (Table S2). The metal ion signals were corrected to nitrate equivalent mass concentrations by assuming that their RIE values were equal to 1, and the K+ signals were downweighted by a factor 2. A similar approach was applied by Carbone et al. (2019), who included rBC fragments, calcium (42Ca+), and zinc (68Zn+) isotopic ions to distinguish between lubricating oil and fuel OA types emitted at the exhaust of diesel engines. Note that the correction approach for obtaining refractory signals can only be applied when both the mass spectra and time series of each OA component identified in the laser-off and laser-on PMF analysis are similar. The scatter plots (Fig. S5) and correlation coefficients (r; Table S3) highlight the consistency of the mass spectra (0.91<r<0.99), as well as time series (0.78<r<0.98), of the five OA types identified in this work. The time-dependent collection efficiency (or CDCE) of rBC was determined based on the BC measured by the Aethalometer (Fig. S2b). Additional PMF analyses, with the CDCE applied on the input matrix for both the OA and refractory components, were also conducted (see details in the Supplement, S1). The PMF results were compared with those obtained without the application of the CDCE on the input matrix, as shown in Tables 1 and S4.
2.3.2 Air mass back trajectories and wind analysis
The origins of air masses were investigated using 5 d back trajectories generated every hour (648 back trajectories in total) at a height of 64 m with the Hybrid Single-Particle Lagrangian Integrated Trajectory (HYSPLIT) model coupled with meteorological data from the Global Data Assimilation System (GDAS, 1∘). This model was developed by the National Oceanic and Atmospheric Administration (NOAA; Draxler and Rolph, 2003). A cluster analysis was performed on all of the hourly back trajectories, and the three clusters identified are shown in Fig. S1c. Details on the back-trajectory clustering can be found in Baker (2010) and Borge et al. (2007).

Figure 1(a) Time series of solar radiation (SR), precipitation, temperature, relative humidity, wind speed (WS) and direction (WD), PMF factors (HOA, O-HOA, COA, LO-OOA, and MO-OOA from laser-off measurements), rBC, NOx, total OA, and inorganic species. (b) Average chemical compositions of NR-PM and rBC with the contribution of the PMF factors to total OA. (c) Diurnal patterns of rBC, total OA, inorganic species, and solar radiation (represented by the yellow bars).
The potential sources of pollutants were investigated using ZeFir nonparametric wind regression (NWR) and potential source contribution function (PSCF) package developed by Petit et al. (2017) using Igor Pro. These analytical methods require high time resolution atmospheric measurements as inputs, and they combine them with local wind measurements for NWR and with air mass back trajectories for PSCF. The NWR is commonly employed to identify nearby sources by coupling atmospheric species concentrations with co-located wind speed and direction (Henry et al., 2009). This method consists of weighting the average concentrations with each wind speed and direction pair and using two kernel smoothing functions. In this study, the NWR graphs were generated for an angle resolution of 1∘ and a radial resolution of 0.1 m s−1, and their respective smoothing parameters (or kernel parameters) were empirically set at 5 and 2.5. For regional source investigation, the PSCF has been favored, as larger geographical scales can be studied (Polissar et al., 2001). The PSCF principle consists of redistributing high pollutant concentrations based on air mass trajectories' residence times. Thus, individual species concentrations are redistributed along the trajectories into geographical emission parcels. In our study, the PSCF calculations were performed considering only pollutant concentrations above their respective 75th percentile (graphic parameters: cell size of 0.1∘ and smoothing of 2).
3.1 Overview of SP-AMS measurements
Figure 1a presents the time series of particle- and gas-phase species, PMF factors, and meteorological parameters (i.e., solar radiation, temperature, RH, precipitation, wind direction, and wind speed) measured during this field campaign. The mean concentration of total PM (i.e., NR-PM + rBC measured by the SP-AMS) observed in this campaign was 11.9 (±5.0) µg m−3, which is about one-fifth of the average concentration of 49.8 µg m−3 during the haze event due to the Indonesian wildfires in 2015 (Budisulistiorini et al., 2018). The main contributors to the submicrometer aerosol mass loadings were OA (5.59±2.66 µg m3; 46.6 %), sulfate (, 3.29±1.83 µg m3, 27.4 %), and rBC (1.79±0.37 µg m3; 17.6 %), whereas ammonium (, 0.85±0.37 µg m3; 7.1 %), nitrate (, 0.11±0.09 µg m3; 0.9 %), and chloride (Cl−, 0.05±0.04 µg m3; 0.4 %) were minor contributors (Fig. 1b). The overall chemical compositions were not sensitive to the three major types of air mass back trajectories identified within the sampling period (Fig. S1d).
The average RH was ∼75 % for the temperature ranging from 26 to 32 ∘C. The time series of wind speed and direction show a regular pattern with a stronger wind speed from the southwest direction and drier conditions between 13:00 and 16:00 LT (local time; Fig. S1b). This is primarily due to the sea breeze phenomena that is commonly observed in Singapore during the inter-monsoon period. Note that a large industrial zone is located to the southwest of the measurement site (Fig. S1a). The sea breeze might carry the polluted air from industry, such as oil refinery and shipping emissions, to the measurement site and surrounding area. In particular, rBC is considered to be a primary and persistent air pollutant emitted from combustion processes. While the rBC hot spot observed under low wind speed conditions was likely due to local traffic emissions, the elevated levels of rBC in the southwest sector (Fig. 2) highlight the potential influences of industrial emissions of both primary and secondary pollutants on the air quality of the sampling region, as discussed in Sect. 3.2 and 3.3. Details on rBC sources and characteristics are discussed in Sect. 3.4 and 3.5.
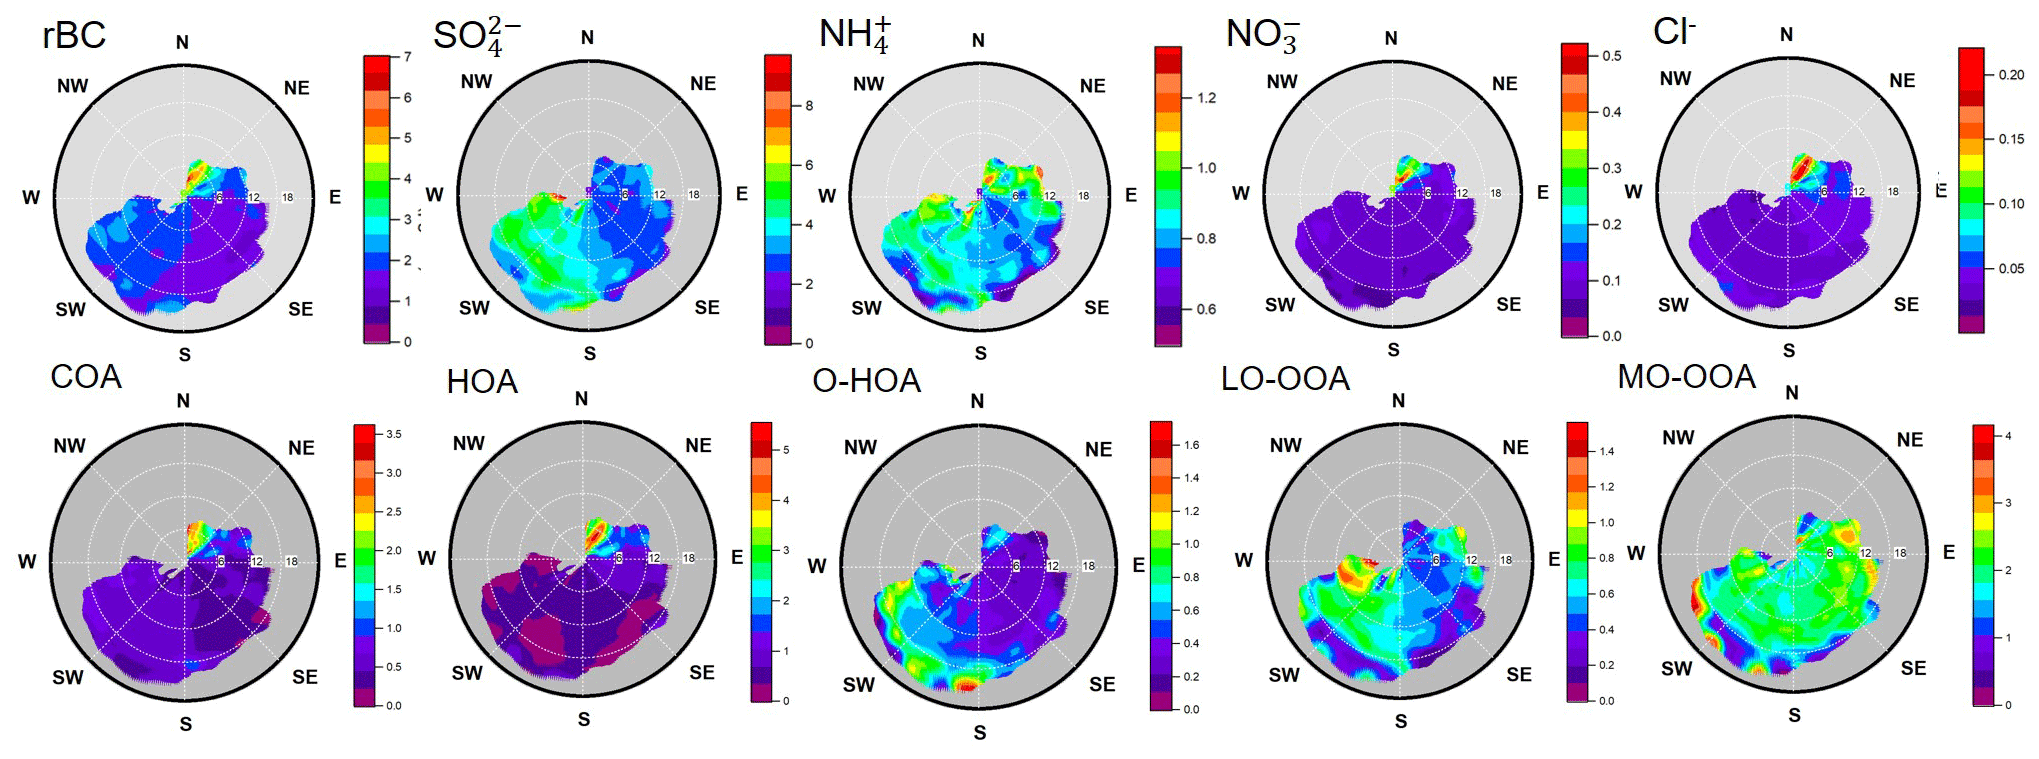
Figure 2NWR plots of aerosol components measured by the SP-AMS during the whole campaign. (Note that all species and OA components are from laser-off measurements except for rBC.)
3.2 Acidic sulfate and organosulfur formation during sea breeze period
The diurnal cycle of shows a sharp increase starting from ∼10:00 LT that reaches a maximum at ∼15:00 LT (Fig. 1c) and can be explained by the active photochemistry during daytime. The average value of 0.71 for the measured to predicted ratio () (Zhang et al., 2007a) and the absence of a diurnal pattern for (Fig. 1c) implies that gaseous ammonia was insufficient to neutralize acidic sulfate plumes within a timescale of a few hours (Attwood et al., 2014; Guo et al., 2015; Kim et al., 2015). Note that and Cl− mass concentrations were too low to have substantial influences on the levels. The diurnal cycle and NWR plot of the ratios (Fig. S6a, b) illustrate that the sulfate plumes observed during the sea breeze from the southwest were more acidic than the background sulfate aerosol (Fig. S6c). This particle acidity dependence seems to coincide with diurnal variations in the size distribution. Throughout the day, relatively large sulfate particles are observed with a vacuum aerodynamic diameter (dva) that peaks at ∼400 nm, whereas those encountered during the sea breeze present a broader mode with a dva ranging between 200 and 400 nm (Fig. S6a, d). This suggests that a large fraction of the acidic particles observed during the sea breeze period was freshly formed in the atmosphere.
It is important to note that the period with elevated concentrations of sulfate and sulfur-containing fragments was synchronized with the sea breeze from the southwest, from which refinery, petrochemical industry, and shipping emissions could be carried to our sampling site (Figs. 2, S6e). Therefore, the enhancements of sulfate and organosulfur could be due to the oxidation of biogenic dimethyl sulfide (DMS) emitted from the ocean which can produce methanesulfonic acid (MSA) and (Ge et al., 2012; Willis et al., 2016; Xu et al., 2017; Saarikoski et al., 2019) in addition to the local anthropogenic sources such as SO2 emitted from shipping activities and industry (e.g., oil refinery in this study) (Saliba et al., 2010; Ripoll et al., 2015; Rivellini et al., 2017). The sulfur-containing fragments measured by the SP-AMS, including CH3SO+, , and could be attributed to both MSA and organosulfur compounds (Farmer et al., 2010). In particular, the fragment showed a moderate correlation with both and less oxidized oxygenated OA (LO-OOA, see PMF results for OA in Sect. 3.3; r value of 0.66–0.73), and the lowest values appeared to coincide with the highest values of the CH2SO+ signals (Fig. S4).
3.3 Identification of major OA sources
Five distinct OA components were identified based on the PMF analysis of organic fragments measured by the laser-off mode of SP-AMS measurement (i.e., a standard HR-ToF-AMS measurement). The OA components include hydrocarbon-like OA (HOA), oxygenated-HOA (O-HOA), cooking-related OA (COA), less oxidized oxygenated OA (LO-OOA), and more oxidized oxygenated OA (MO-OOA). The mass spectra and diurnal cycles of the five OA components are presented in Fig. 3. The OOA components were the main contributors to the total OA, with MO-OOA and LO-OOA accounting for 32.1 % and 10.4 %, respectively. The HOA, O-HOA, and COA components contributed to 19.4 %, 26.4 %, and 11.7 % of the total OA mass, respectively (Fig. 1b). Detailed descriptions of each OA factor, classified into (1) combustion emissions, (2) cooking emissions, and (3) secondary organic aerosol, are given in the following sections.
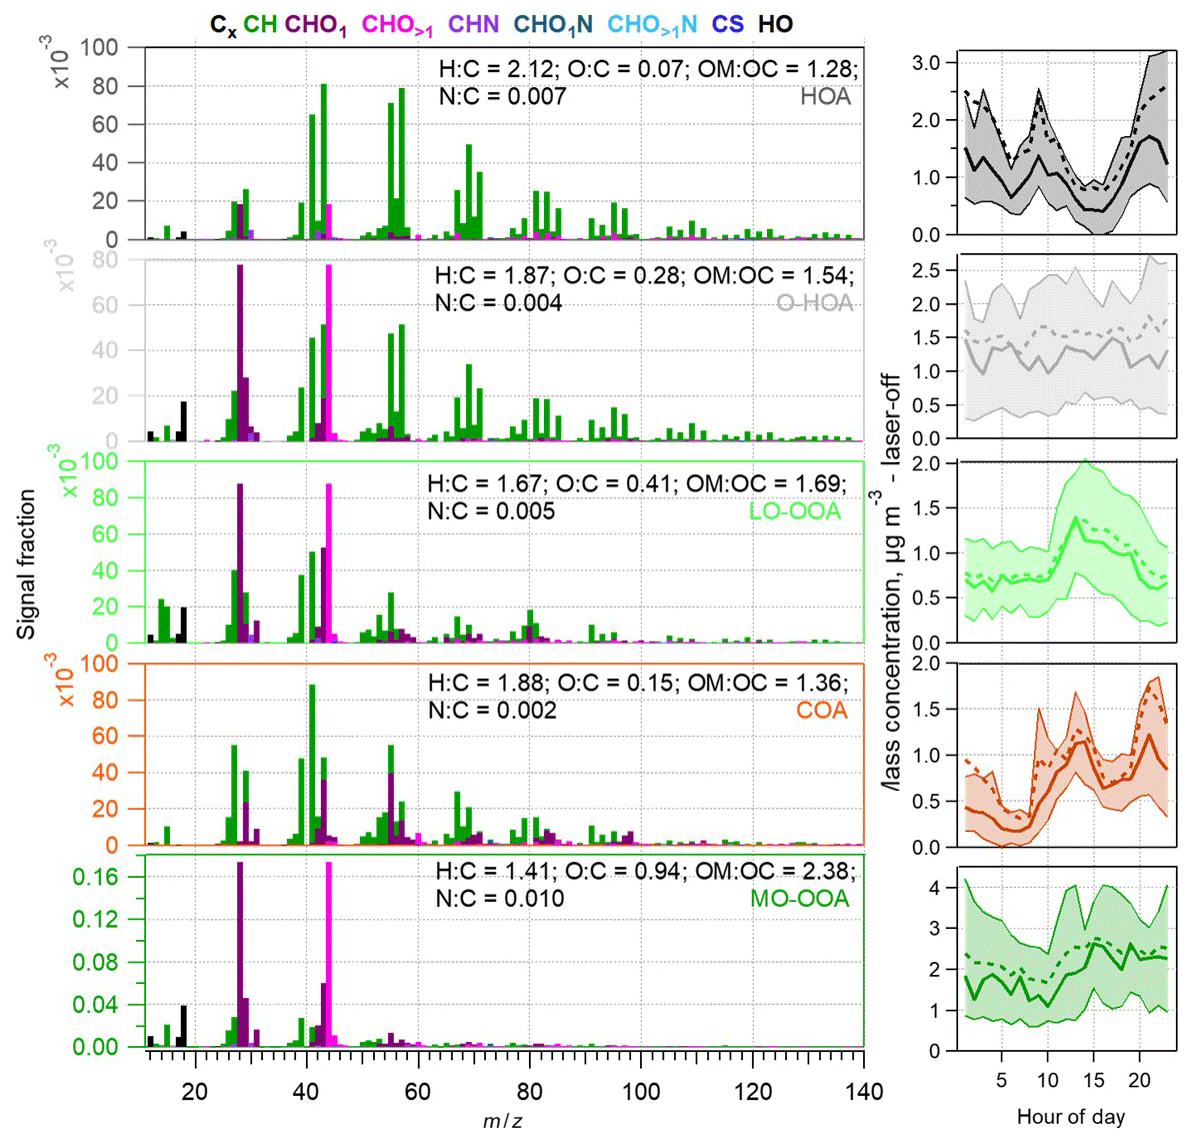
Figure 3(a) Mass spectra and elemental ratios of the five-factor solution obtained from the PMF analysis of laser-off measurements and (b) their respective diurnal cycles (the median is shown using the plain line, the mean is shown using the dotted line, and the 25th and 75th percentiles are shown using the shaded area) for the entire campaign. The PMF results from laser-on measurements are shown in Fig. S4.
3.3.1 Combustion emissions
HOA was the main contributor to the POA fraction and was moderately correlated with the combustion tracers including rBC (r value of 0.79), NOx (r value of 0.83), and CO (r value of 0.81). The mass spectrum of HOA is similar to those from engine exhausts (Crippa et al., 2013; Ng et al., 2011; Zhang et al., 2005) and is dominated by non-oxygenated fragments (i.e., CxHy) with average H∕C and O∕C ratios of 2.12 and 0.07, respectively. HOA accounted for up to ∼20 % of total OA during the morning (∼09:00 LT) which matched the enhancement of the traffic volume during rush hours. In addition, the concentrations of HOA started increasing at the beginning of the evening rush hour (∼17:00 LT) and reached a maximum at ∼21:00 LT. HOA and combustion tracers (rBC, NOx, and CO) exhibited a hot spot in the NWR plots (Figs. 2; S7e, f) under relatively low wind speed conditions. The above observations suggest that HOA concentrations were largely influenced by nearby on-road engine exhausts and the contraction of the boundary layer in the evening.
High concentrations of rBC, NOx, and HOA were observed during the middle of the night between 25 and 28 May, indicating the presence of large combustion sources during nighttime that might occasionally impact the air quality at our sampling site (Fig. 1a). This observation was also reflected in the diurnal plots (Figs. 3, S8), as the mean mass concentrations of HOA, rBC, NOx, and CO during the middle of the night were much higher than their corresponding median values. Figure S8a shows that the highest N∕C ratio was observed during the morning traffic peak hours, but it remained relatively low for the rest of the period. This observation suggests that the emission characteristics of these unknown combustion sources at nighttime could be different from those associated with traffic emissions during the daytime. Although it is difficult to confirm the origin of the nighttime combustion emissions without further evidence, the observed events were coupled with low wind speed conditions, suggesting that they were likely due to local emissions from the city. For example, significant emissions due to flaring from petrochemical industries, which largely depends on plant operation, during relatively stagnant atmospheric conditions could lead to elevated concentrations of combustion-related species.
O-HOA showed distinctive time series and oxygenation level compared with HOA (r of 0.17 and O∕C of 0.07). The mass spectral profile (Fig. 3) illustrates that O-HOA could be an oxygenated fraction of combustion particles that was co-emitted with HOA and/or produced rapidly via the oxidation of HOA near emission sources. However, similar to the case of rBC, the elevated concentrations of O-HOA observed from the southwest direction with a strong wind speed (∼18 m s−1) suggests that O-HOA was partly related to the emissions transported from the industrial zone (Fig. 2). The temporal variability of O-HOA depicts a rather singular behavior, showing a higher average concentration before 24 May (2.2 µg m−3). During rest of the campaign, the principal source of O-HOA was mainly local anthropogenic activities (Fig. S7a–d) and remained at a rather low concentration, with an average of 0.9 µg m−3. The relatively constant diurnal cycle of O-HOA compared with that of HOA further underlines multiple sources for this OA component.
3.3.2 Cooking emissions
COA is another major POA component identified in this study. COA concentrations remained low in the morning and exhibited peaks around lunchtime (13:00 LT) and dinnertime (21:00 LT), as seen in Fig. 3. This type of COA diurnal pattern has been commonly observed in urban studies (Allan et al., 2010; Sun et al., 2011; Fröhlich et al., 2015). Furthermore, the COA mass spectrum shows a higher m∕z 55/57 ratio than HOA, as has been reported in previous studies (Allan et al., 2010; Mohr et al., 2012), and is strongly correlated with the COA mass spectrum reported in France (Crippa et al., 2013) and in the megacities of China (Hu et al., 2013; Elser et al., 2016). An organic fragment tracer, C6H10O+, tracked the time profile of COA (r2 of 0.90), further confirming the existence of COA components (Zhang et al., 2011). A local COA hot spot shown in the NWR plots (Fig. 2) suggests that the campus canteens and a residential building nearby are likely the major contributors to the observed COA mass loadings. Note that COA has been shown to contribute up to 50 % of the total OA in other urban locations (e.g., downtown area with substantial emissions from restaurants) depending on the site characteristics (Allan et al., 2010; Huang et al., 2010; Sun et al., 2012; Crippa et al., 2013) and cooking styles. Similar to other combustion-related emissions, high concentrations of the COA component were also observed during the middle of the night between 25 and 28 May (Fig. 1). This observation implies that combustion-related emissions might contain some COA-like particles, contributing to the reported mass concentrations of COA in general. After removing the data from 25 and 28 May, the diurnal profile shows that lower mass concentrations of COA were observed overnight (Fig. S8d).
3.3.3 Secondary organic aerosol
The mass spectra of LO-OOA was dominated by the oxygenated fragments of C2H3O+ and , whereas MO-OOA was mainly characterized by fragments (Fig. 3). The different degrees of oxygenation between LO-OOA and MO-OOA and their secondary nature are shown in the van Krevelen diagram (Fig. S9) (Heald et al., 2010; Ng et al., 2011). MO-OOA (O∕C ratio of 0.94 and N∕C ratio of 0.01) likely represented a more aged fraction of SOA. The MO-OOA concentrations were insensitive to the local wind pattern (i.e., more homogeneous distribution in the NWR plot, Fig. 2) and increased gradually in the afternoon, possibly due to the combined effects of photochemistry and the mixing of air masses transported from regions without significant local industrial influences. Similar to many other studies, the source identification of the MO-OOA component is not straightforward, as their mass spectral features can be obtained by the oxidation of different types of POA and SOA components (Donahue et al., 2009; Jimenez et al., 2009; Zhang et al., 2007b). Additional information is essential to further interpret their potential sources and/or formation mechanisms (see discussion in Sect. 3.5).
In contrast, the moderate correlation observed between LO-OOA and (r value of 0.73) and the similarity between their diurnal patterns illustrate that LO-OOA were freshly formed SOA materials (O∕C ratio of 0.41). The latter might be formed via the local photooxidation of POA and/or SOA precursors under the influence of anthropogenic emissions transported from the southwest by the sea breeze (Fig. 2). Previous laboratory studies have evidenced the importance of acidic seeds and RH on SOA formation (Liggio and Li, 2006; Wong et al., 2015). The acidic nature of sulfate particles and RH encountered on site might facilitate the partitioning of volatile organic compounds (VOCs, from both biogenic and anthropogenic sources) into the particle-phase, leading to the production of SOA and, perhaps, organosulfur compounds, as discussed in Sect. 3.2. Furthermore, Kasthuriarachchi et al. (2020) reported that the concentrations of organonitrate and nitrogen-containing fragments (i.e., CxHyN+ and ) slightly increased during daytime (e.g., Fig. S8a) with LO-OOA, contributing to 30 % of the observed fragments (Fig. S10). This suggests that the photooxidation of VOCs under high-NOx conditions could be a potential pathway toward LO-OOA formation given that the NOx concentrations reached up to 160 ppb (Fig. 1a; mean of 16.5 ppb) during the campaign.
3.4 Characterization of rBC associated with different OA sources
Integrating rBC fragments (–) into the PMF analysis of organic fragments measured by the laser-on mode of SP-AMS measurements yielded a five-factor solution. They show similar mass spectra and temporal variably compared to their corresponding OA factors identified in the PMF analysis of the laser-off datasets (Figs. S4, S5). These observations suggest that the major OA sources identified in Sect. 3.3 are still valid; hence, the addition of rBC fragments in the PMF analysis can provide additional information to improve our understanding of how ambient rBC might be co-emitted or might interact with different types of POA and SOA during atmospheric dispersion. Note that Fig. S4 shows higher mass loadings of PMF factors determined by the laser-on measurement than those observed in the PMF results from the laser-off measurement. This type of OA signal enhancement has been observed in previous studies (Lee et al., 2015; Willis et al., 2014), but the fundamental reason for it remains unclear. Therefore, this section will primarily focus on (1) quantifying the distribution of rBC fragments among different PMF factors and (2) investigating the potential application of rBC fragment ratios for identifying the origin of ambient rBC-containing particles.
Figure 4a shows that 43 % of the total rBC mass was associated with the HOA components in this study, indicating that the majority of rBC was emitted by local vehicular emissions. The COA factor was associated with less than 2 % of the total rBC mass, suggesting that it was unlikely to have been co-emitted from modern kitchens and that coalescence of COA and rBC particles was insignificant near the sampling location; this is consistent with previous findings that COA and rBC were largely externally mixed in different urban environments (Lee et al., 2015, 2017; Wang et al., 2018). This observation also suggests that potential interference from combustion-related emissions (Sect. 3.3.2) with respect to the overall temporal variation and mass concentrations of COA is not likely to be significant. The two OA components that were influenced by local industries, O-HOA and LO-OOA, were associated with 20 % and 29 % of the total rBC, respectively. This result highlights the fact that both O-HOA and LO-OOA components consist of mixtures of primary and secondary particles (i.e., rBC + HOA + OOA for O-HOA, and rBC + OOA for LO-OOA), although they could be influenced by different types of industrial emissions and atmospheric processing. It is worth noting that LO-OOA had the second largest contribution to the total rBC, suggesting that at least a fraction of rBC from industrial emissions could act as an effective condensation sink for LO-OOA produced via photochemistry during their dispersion. While MO-OOA had the largest contribution to total OA mass, only 6 % of the total rBC mass was associated with this aged SOA component.
Previous studies have reported that the physical structure and chemical composition of BC-containing particles depend on the conditions of combustion processes and the types of combustibles involved (Vander Wal and Tomasek, 2004). Such relationship is possibly observed through the relative intensities of the carbon fragments (–) (Corbin et al., 2014). Table 1 shows that the ratios remained roughly constant regardless of the origin of rBC, whereas the ratios varied between PMF factors. The relative contributions of each factor to the – fragments are presented in Fig. 4b. The ratio of rBC associated with HOA was 0.66 (±0.07) , which was within the range of those emitted from aircraft turbines, Regal black (i.e., a BC standard for SP-AMS calibration), and particles produced by a propane diffusion flame (0.50–0.78) and, more importantly, was close to those reported for diesel engine exhaust (Carbone et al., 2019; Corbin et al., 2014; Onasch et al., 2012). Furthermore, the size distribution of unit mass resolution data shows lower m∕z 12-to-m∕z 36 ratios (a proxy for ) for particles with dva smaller than 100 nm (Fig. S11a). This suggests that rBC particles with a relatively small diameter were mainly associated with fresh traffic emissions (Massoli et al., 2012). Our results illustrate that rBC transported from the industrial area and shipping ports gave ratios closer to unity, i.e., 0.79 (±0.10) for LO-OOA, and 1.00 (±0.11 for O-HOA), which is similar to previous observations for soot particles emitted from a marine engine using heavy fuel oil (Corbin et al., 2018), rBC-containing particles emitted from chemical and petrochemical industries (Wang et al., 2018), and rBC with a high fullerene content (Canagaratna et al., 2015a; Corbin et al., 2014). The NWR and diurnal plots of the ratio (Fig. 4c, d) clearly show that rBC with higher ratios was transported to the site by the sea breeze from the southwest, which is consistent with our PMF results that O-HOA and LO-OOA were influenced by industrial emissions and were associated with rBC with higher ratios compared with other OA components.

Figure 4(a) Fractions of rBC and (b) the relative contributions of – fragments contributed by the five OA components identified by the PMF analysis with OA and rBC fragments measured by the laser-on mode as model inputs. (c) NWR plot and (d) diurnal cycle of the ratio (the 25th and 75th percentiles are shown using the shaded area).
Table 1(a) Carbon fragment ratios observed by the laser-on measurement for each PMF factor. The bold text represents the results with both rBC fragments and trace metal ions included as PMF input. (b) The contribution of each PMF factor to the total signal of specific metal ions. For the entire table, the values in parenthesis are those obtained from PMF with the CDCE-corrected input matrix (see details in the Supplement – S1 and Table S4).
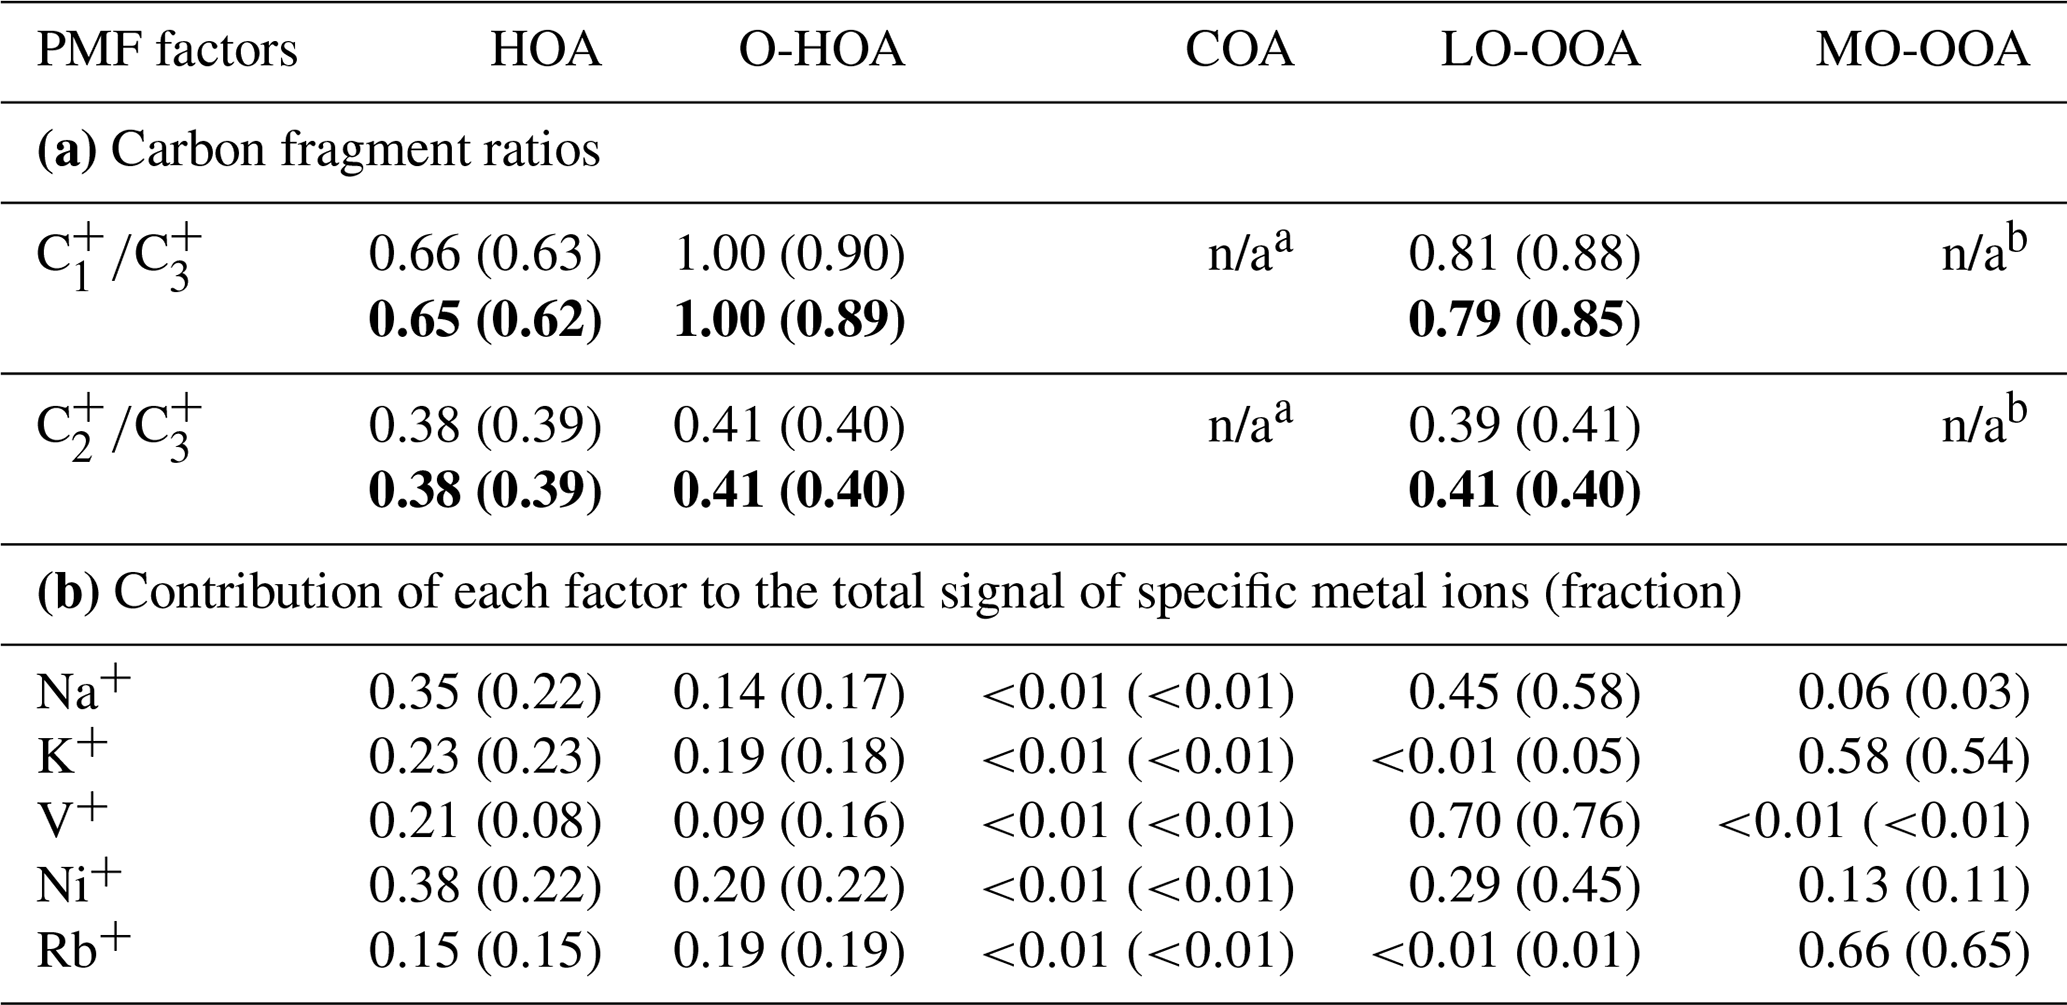
a None of the refractory fragments were associated with the COA factor. b Large variations in the fragment ratios between cases were observed; hence, the ratios were not reported for MO-OOA. n/a: not applicable.
3.5 Characterization of metal ions associated with different OA sources
In addition to quantifying rBC, the laser-on mode of SP-AMS measurement can detect trace metals as rBC-containing particles can be heated to reach the vaporization temperature of the associated trace metals (Carbone et al., 2015; Corbin et al., 2018; Onasch et al., 2012). In this work, five trace metal ions, including K+, Rb+, Na+, V+, and Ni+, were integrated into the PMF analysis of organic and rBC fragments measured by the laser-on mode of SP-AMS. The addition of these trace metal ions did not result in major changes in the mass spectral features or the temporal variations of the five PMF factors identified in Sect. 3.4 (Figs. S4, S5). As these trace metals are relatively stable in the particle phase, investigating how these trace metal ions are associated with different PMF factors can improve our understanding of the emission characteristics and perhaps the aging history of specific OA components. This section will mainly focus on discussing the trace metals associated with OA and rBC that were related to (1) local combustion emissions and (2) the aged SOA component (i.e., MO-OOA).
3.5.1 Combustion emissions
Based on the PMF results that include trace metal ions, sodium (Na+) was mainly associated with HOA, O-HOA, and LO-OOA (Fig. 5a); this may have been due to different types of fossil fuel combustion emissions (e.g., local traffic, shipping, and various industrial activities), as discussed in Sect. 3.4. The Na+ signals also correlated strongly with rBC (r value of 0.80, Fig. 5b) and moderately with HOA (r value of 0.65). The absence of a correlation between rBC and Na+ in the laser-off mode measurement suggests a large degree of internal mixing between Na and rBC. The presence of sodium compounds in fuel, including remaining catalyst used for biodiesel esterification, drying agents, corrosion inhibitors, and fuel additives, has previously been observed as a cause of fuel injector fouling (Barker et al., 2013; Coordinating Research Council, 2013); hence, the co-emissions of sodium with rBC and HOA from on-road engines was highly possible. Recent experiments conducted with SP-AMS measurements have also reported non-negligible amounts of Na in soot particles emitted by marine, locomotive, and vehicle engines (Dallmann et al., 2014; Omidvarborna et al., 2016; Saarikoski et al., 2017; Corbin et al., 2018; Carbone et al., 2019). Na+ is widely used to identify the influence of marine sources in source apportionment analysis; hence, the potential contribution of sea spray aerosols to Na+ signals cannot be neglected, especially for factors (i.e., O-HOA and LO-OOA) connected to sea breeze transport. However, it is important to emphasize that Na+ and Cl− exhibit rather poor temporal correlations (r value less than 0.30) for both laser-off and laser-on data regardless of the influence of sea breeze. Biomass burning can be a possible source of Na+ (Hsu et al., 2011), although no major fresh biomass burning emissions were observed in this study. The MO-OOA factor is suspected to be more influenced by aged regional biomass burning emissions (see further discussion in Sect. 3.5.2), but Na+ was not strongly associated with this factor.
Vanadium (V) and nickel (Ni) are usually residual trace metals in fuel, and their ratio in emissions can vary with the fuel type or combustion process observed (Moldanová et al., 2009; Yakubov et al., 2016). This ratio can be used to trace emissions from ships or heavy oil combustion industries (Ault et al., 2010; Liu et al., 2017). In particular, Fig. 5c shows that the ratio exhibited a distinctive diurnal variation, with higher values from 12:00 to 18:00 LT, which coincided with the sea breeze pattern. Two respective maxima are observed at 13:00 and 17:00 LT, and the hourly averaged ratio is between 5 and 7 (75th percentiles >12; Fig. 5c). Assuming a similar RIE for V+ and Ni+ measured by the SP-AMS, our observation is consistent with other studies that have reported ratios ranging from 4 to 7 for ship emissions and heavy fuel combustion by engines (Agrawal et al., 2009; Corbin et al., 2018; Viana et al., 2008). In addition to a moderate correlation between LO-OOA and V+ (r value of 0.47), ∼70 % of the V+ signals were associated with the LO-OOA component (Fig. 5a). Figure 5d clearly shows that the ratios increased with the concentrations of and LO-OOA under southwesterly sea breeze conditions. These observations confirm that a part of the and LO-OOA encountered on site was influenced by ship emissions and/or heavy oil combustion from the industrial zone.
3.5.2 Potential origins of MO-OOA
Although a large local source of biomass burning in Singapore is uncommon, it is important to investigate the potential influences of biomass burning events, including agricultural burning and forest fires, from nearby countries (Fig. S12a). Budisulistiorini et al. (2018) reported high mass loadings of biomass burning OA (BBOA) during an Indonesian wildfire in 2015 which had strong impacts on the air quality in Southeast Asia. BBOA is not identified in the PMF analysis in this field study. However, the average fraction of to total organic aerosol () of 0.8 % (Fig. S13a) with ∼86 % of the data giving values above 0.3 % (i.e., a background values for non-biomass burning; Cubison et al., 2011) in the laser-off mode measurement suggests potential influences from aged biomass burning emissions that cannot be easily separated by the conventional PMF analysis of organic fragments alone. Note that MO-OOA and COA present slightly higher values of 0.5 % and 0.8 %, respectively (Fig. 6a). However, the origin of MO-OOA is highly uncertain compared with the other OA factors identified in this study due to the fact that atmospheric aging can diminish the distinctive mass spectral features of POA in general, e.g., decreasing in for BBOA (Cubison et al., 2011) and converging in the f43–f44 framework for OOA production (Ng et al., 2010). Therefore, the following discussion will focus on evaluating the potential connections between the MO-OOA component and aged regional emissions.
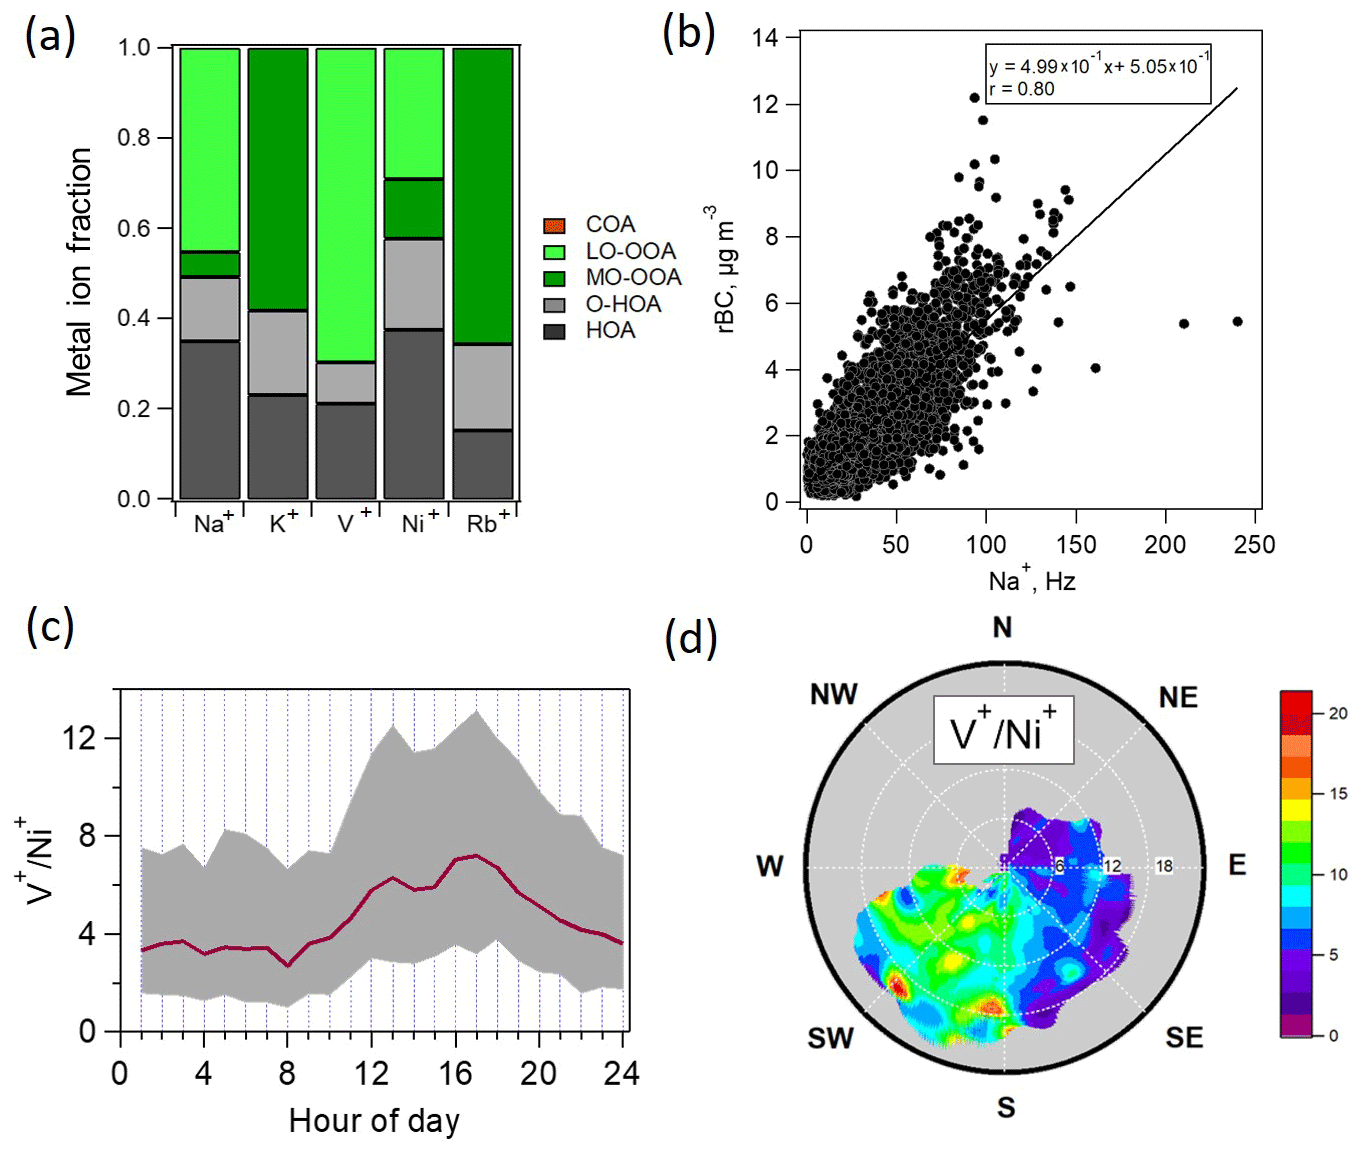
Figure 5(a) Fractions of the trace metal ions contributed by each OA component obtained from the PMF analysis with OA, rBC, and metal ions measured by the laser-on mode as model inputs. (b) Scatter plot of 5 min averaged rBC concentrations vs. Na+ signals. (c) Diurnal cycle of the ratio (the 25th and 75th percentiles are shown using the shaded area). (d) NWR plot of the ratio over the entire campaign.
Figures 6c and S14b show that high Rb+ and K+ signals were associated with the more oxygenated (f44>0.7) fraction of OA, and moderate correlations between MO-OOA and the two metal were observed (Rb+ had an r value of 0.58 and K+ had an r value of 0.71; Fig. S13b). Furthermore, the results of the PMF analysis demonstrated that both K+ and Rb+ were mainly associated with MO-OOA (58 %–66 %, Fig. 5a) followed by the two combustion-related components (HOA and O-HOA). Although potassium and rubidium are not unique tracers for a specific combustion source, previous studies have shown that these two metals can be largely associated with biomass burning emissions (Artaxo et al., 1993; Lee et al., 2016; Achad et al., 2018). Note that rubidium has also been used as a coal combustion tracer in previous studies (Fine et al., 2004; Irei et al., 2014). Unlike the ambient OA component, the chemical identities of K+ and Rb+ are unlikely to be modified by the oxidative aging of aerosol particles. Therefore, a strong temporal correlation between Rb+ and K+ (r value of 0.85, Fig. 6b) further suggests that they were likely of similar origins in this study.
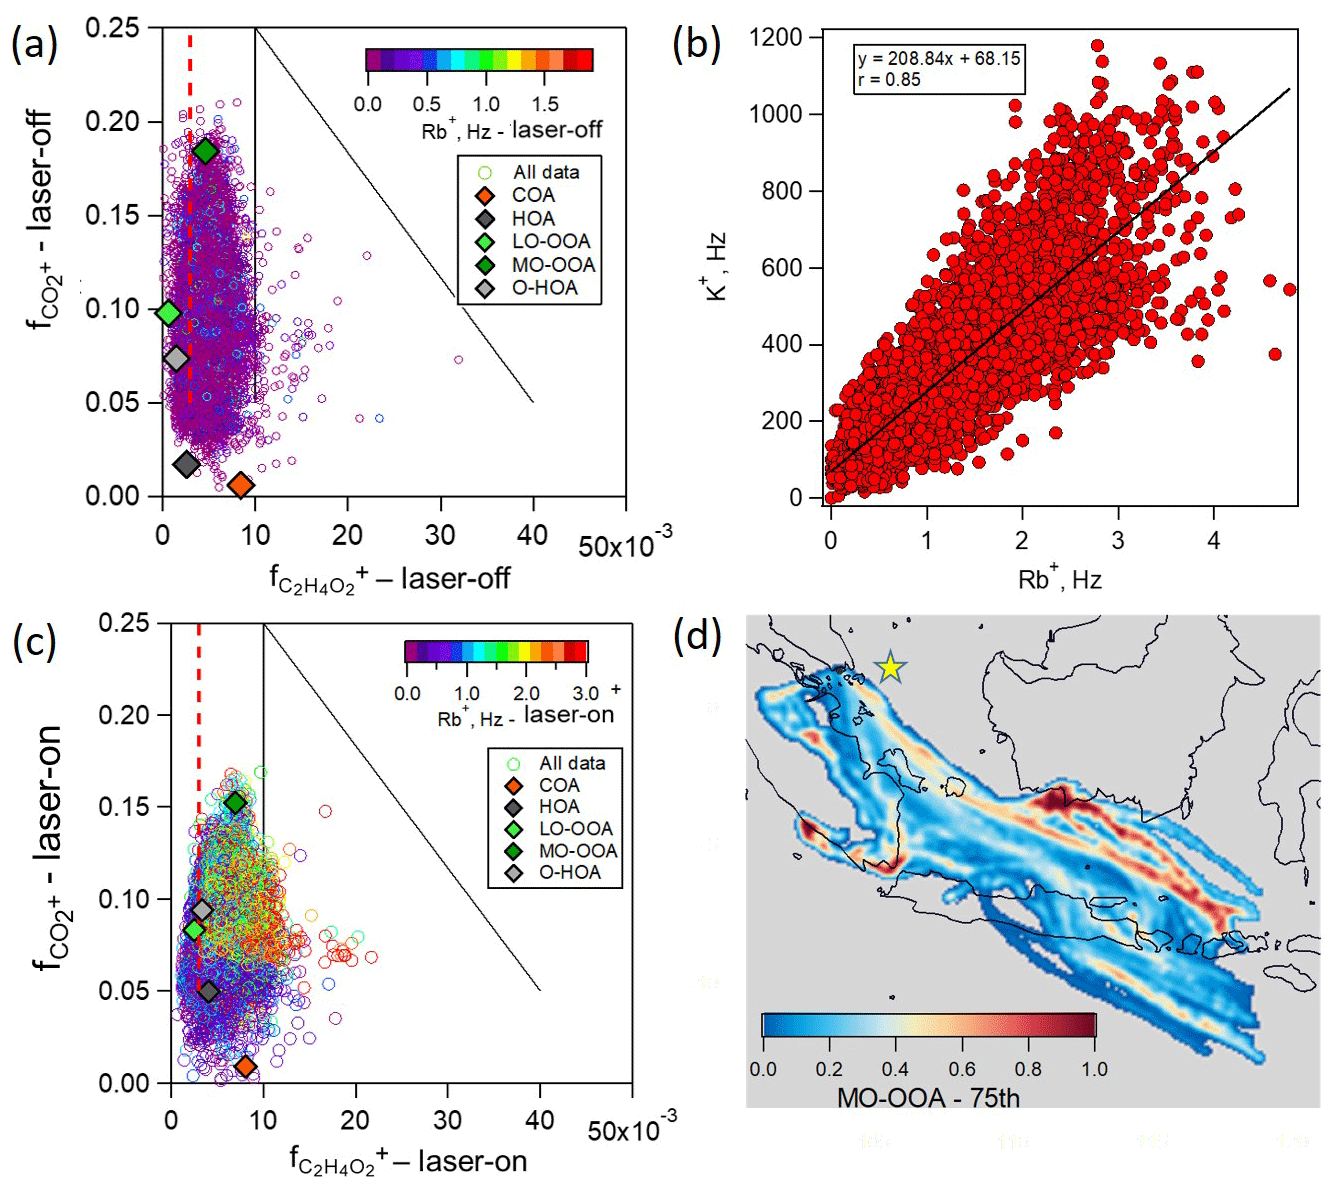
Figure 6Scatter plots of vs. with the symbol color scaled by the rubidium (Rb+) ion signals based on (a) laser-off and (c) laser-on measurements: the dash red line shows the 0.3 % background value, and plain black lines define the space with and without BB influence (inside and outside the triangular region, respectively, i.e., the black solid lines in panels a and c based on Cubison et al., 2011). (b) Scatter plot of potassium ion (K+) vs. rubidium (Rb+) signals from the laser-on measurements. (d) PSCF graph of MO-OOA considering only pollutant concentrations above their respective 75th percentile (Fig. S15 shows the PSCF graphs of K+, Rb+, and ).
The regional origin of K+, Rb+, , and MO-OOA was investigated using their PSCF. Their PSCF graphs (Figs. 6d, S15a–c) show several common origins with the high probability that the highest concentrations could be influenced by biomass burning events from Indonesia (Fig. S12a). Nevertheless, coal-fired power plants are located near the identified hot spots of Rb+ and K+ (Fig. S12b), so that a regional transport of coal-fired power plant emissions alongside biomass burning plumes would be possible. Note that MO-OOA contributes to the highest fraction of nitrogen-containing organic fragments ( ∼32 % and CxHyN+ ∼46 %) that can be generated by biomass burning emissions (Mace et al., 2003; Laskin et al., 2009; Desyaterik et al., 2013; Mohr et al., 2013). It is important to point out that most of the previous studies usually describe MO-OOA (or LV-OOA in some earlier studies) as an aged SOA component without providing further details regarding its potential origin or emission characteristics. Our observations underline the possibility of better understanding the origin of the MO-OOA component via measurements of refractory metals, even when atmospheric oxidative processing has made the mass spectral features of aged OA materials less distinguishable.
Real-time aerosol mass spectrometry techniques have been successfully deployed in the field worldwide over the last 2 decades, and their observations have substantially enhanced our quantitative understanding of the sources and formation of NR-PM, in particular via the use of PMF analysis for OA source apportionment (Fröhlich et al., 2015; Ng et al., 2010; Zhang et al., 2007b). In this work, we demonstrate the use of refractory aerosol components, rBC, and a few trace metals, measured by an Aerodyne SP-AMS to better characterize the sources, emission characteristics, and aging history of ambient OA and rBC in Singapore, a highly urbanized tropical city that is influenced by multiple local and regional air pollution sources.
By integrating the rBC fragment () into the PMF analysis, we can identify the major sources and characteristics of ambient rBC and OA particles based on their degree of association. In particular, the majority of total rBC (>90 %) originated from local combustion emissions, from which ∼30 % was largely associated with the fresh SOA components (LO-OOA). This observation implies that a fraction of rBC could act as a condensation sink for fresh SOA in this field study, although additional information is required to determine the mixing state of rBC and SOA. We further illustrate the potential application of relative intensities of major rBC fragments for aerosol source identification. While higher ratios (>0.7) were associated with rBC that originated from the industrial zone and shipping port (O-HOA and LO-OOA), rBC associated with traffic (HOA) gave lower ratios (∼0.65). Trace metals analysis further shows that the high ratios coincided with high ratios, highlighting the potential influences of emissions from shipping activities and oil refinery industry on the chemical characteristics of O-HOA and LO-OOA. The observed correlation between Na+ and rBC suggests that the contribution of anthropogenic emissions to the total particulate sodium should not be ignored in coastal urban environments. These results underline the advantages of using the refractory aerosol component to disentangle various combustion sources encountered in an urban environment that is influenced by multiple sources using a single online instrument.
One of the major challenges in interpreting the PMF results from AMS measurements is to identify the origin and aging history of ambient particles associated with highly oxidized OA components (e.g., MO-OOA in this work), as the mass spectral characteristics of OA converge along with their degree of oxidative aging. In general, the relative intensities of some highly oxygenated fragments (e.g., CO+ and ) increase continuously, while other mass spectral features (e.g., alkane/alkene patterns from combustion sources) are diminished during the aging processes. Ng et al. (2010) visualized such phenomena for SOA components in the f43–f44 space. Furthermore, the m∕z 60 (which refers to the organic fragments) has been widely used as tracer ions for BBOA. Cubison et al. (2011) generalized observations from worldwide field data which show that the m∕z 60 signature becomes less and less significant in aged BBOA materials. In this study, we propose that the MO-OOA component represented aged OA materials impacted by the regional biomass burning and perhaps coal combustion emissions, as MO-OOA was associated with refractory K+ and Rb+. Given the fact that MO-OOA was the major OA component of the total OA (∼32 %), this result highlights the fact that regional pollution can affect the air quality in Singapore – even though fresh regional biomass burning episodes were not observed during the sampling period.
More broadly, the improved source identification for OA and rBC can provide useful information to further investigate the effects of atmospheric aging on their physiochemical properties. For example, this work highlights the potential influences of regional biomass burning and coal combustion emissions on the MO-OOA component, which may provide important insight into how the light-absorbing properties of OA (i.e., brown carbon) evolve with transport and aging. Recently, Dasari et al. (2019) provided field evidence for the bleaching of brown carbon during their transport by photooxidation and that photodissociation can occur in the South Asian outflow based on measurements near and at a distance from specific combustion sources, including biomass burning and traffic. Furthermore, this type of PMF analysis could be applied to analyze the sources and characteristics of rBC-containing particles exclusively (i.e., rBC core with organic coatings) in order to advance our understanding of the effects of primary emissions and/or atmospheric processing on BC light absorption enhancement caused by the lensing effect.
The data used in this study are available from the first author upon request: please contact Laura-Helena Rivellini (erirlg@nus.edu.sg).
The supplement related to this article is available online at: https://doi.org/10.5194/acp-20-5977-2020-supplement.
AKYL supervised the project. MGA and NK carried out the experiment. LHR and MGA analyzed the data. LHR wrote the paper with support and comments from all co-authors.
The authors declare that they have no conflict of interest.
We would like to acknowledge Liya Yu and her research group members, Tham Jackson, Kong Quan, and Lei Pei Mei, from the NUS Environmental Research Institute for sharing their MARGA, semicontinuous OC/EC analyzer, and gas analyzer measurements. We also want to thank the Department of Geography at the National University of Singapore for providing the meteorological data.
This work was supported by the National Environmental Agency of Singapore (NEA; grant no. R-706-000-043-490) and the National University of Singapore start-up grant (grant no. R-302-000-173-133). The contents of this paper do not represent the views of the National Environmental Agency of Singapore.
This paper was edited by Eleanor Browne and reviewed by Eleanor Browne and one anonymous referee.
Achad, M., Caumo, S., de Castro Vasconcellos, P., Bajano, H., Gómez, D., and Smichowski, P.: Chemical markers of biomass burning: Determination of levoglucosan, and potassium in size-classified atmospheric aerosols collected in Buenos Aires, Argentina by different analytical techniques, Microchem. J., 139, 181–187, https://doi.org/10.1016/j.microc.2018.02.016, 2018.
Agrawal, H., Eden, R., Zhang, X., Fine, P. M., Katzenstein, A., Miller, J. W., Ospital, J., Teffera, S., and Cocker, D. R.: Primary Particulate Matter from Ocean-Going Engines in the Southern California Air Basin, Environ. Sci. Technol., 43, 5398–5402, https://doi.org/10.1021/es8035016, 2009.
Allan, J. D., Bower, K. N., Coe, H., Boudries, H., Jayne, J. T., Caragaratna, M. R., Millet, D. B., Goldstein, A. H., Quinn, P. K., Weber, R. J. C. G. L., and Worsnop, D. R.: Submicron aerosol composition at Trinidad Head, California, during ITCT 2K2: Its relationship with gas phase volatile organic carbon and assessment of instrument performance, J. Aerosol Sci., 35, 909–922, https://doi.org/10.1016/j.jaerosci.2004.02.007, 2004.
Allan, J. D., Williams, P. I., Morgan, W. T., Martin, C. L., Flynn, M. J., Lee, J., Nemitz, E., Phillips, G. J., Gallagher, M. W., and Coe, H.: Contributions from transport, solid fuel burning and cooking to primary organic aerosols in two UK cities, Atmos. Chem. Phys., 10, 647–668, https://doi.org/10.5194/acp-10-647-2010, 2010.
Artaxo, P., Gerab, F., and Rabello, M. L.: Elemental composition of aerosol particles from two atmospheric monitoring stations in the Amazon Basin, Nucl. Instrum. Methods Phys. Res. Sect. B, 75, 277–281, 1993.
Attwood, A. R., Washenfelder, R. A., Brock, C. A., Hu, W., Baumann, K., Campuzano-Jost, P., Day, D. A., Edgerton, E. S., Murphy, D. M., Palm, B. B., McComiskey, A., Wagner, N. L., Sá, S. S. de, Ortega, A., Martin, S. T., Jimenez, J. L., and Brown, S. S.: Trends in sulfate and organic aerosol mass in the Southeast U.S.: Impact on aerosol optical depth and radiative forcing, Geophys. Res. Lett., 41, 7701–7709, https://doi.org/10.1002/2014GL061669, 2014.
Atwood, S. A., Reid, J. S., Kreidenweis, S. M., Yu, L. E., Salinas, S. V., Chew, B. N., and Balasubramanian, R.: Analysis of source regions for smoke events in Singapore for the 2009 El Nino burning season, Atmos. Environ., 78, 219–230, https://doi.org/10.1016/j.atmosenv.2013.04.047, 2013.
Ault, A. P., Gaston, C. J., Wang, Y., Dominguez, G., Thiemens, M. H., and Prather, K. A.: Characterization of the Single Particle Mixing State of Individual Ship Plume Events Measured at the Port of Los Angeles, Environ. Sci. Technol., 44, 1954–1961, https://doi.org/10.1021/es902985h, 2010.
Baker, J.: A cluster analysis of long range air transport pathways and associated pollutant concentrations within the UK, Atmos. Environ., 44, 563–571, https://doi.org/10.1016/j.atmosenv.2009.10.030, 2010.
Balasubramanian, R. and Qian, W.-B.: Characterization and source identification of airborne trace metals in Singapore, J. Environ. Monit., 6, 813–818, https://doi.org/10.1039/B407523D, 2004.
Barker, J., Cook, S., and Richards, P.: Sodium Contamination of Diesel Fuel, its Interaction with Fuel Additives and the Resultant Effects on Filter Plugging and Injector Fouling, SAE Int. J. Fuels Lubr., 6, 826–838, https://doi.org/10.4271/2013-01-2687, 2013.
Borge, R., Lumbreras, J., Vardoulakis, S., Kassomenos, P., and Rodríguez, E.: Analysis of long-range transport influences on urban PM10 using two-stage atmospheric trajectory clusters, Atmos. Environ., 41, 4434–4450, https://doi.org/10.1016/j.atmosenv.2007.01.053, 2007.
Budisulistiorini, S. H., Riva, M., Williams, M., Miyakawa, T., Chen, J., Itoh, M., Surratt, J. D., and Kuwata, M.: Dominant contribution of oxygenated organic aerosol to haze particles from real-time observation in Singapore during an Indonesian wildfire event in 2015, Atmos. Chem. Phys., 18, 16481–16498, https://doi.org/10.5194/acp-18-16481-2018, 2018.
Canagaratna, M. R., Massoli, P., Browne, E. C., Franklin, J. P., Wilson, K. R., Onasch, T. B., Kirchstetter, T. W., Fortner, E. C., Kolb, C. E., Jayne, J. T., Kroll, J. H., and Worsnop, D. R.: Chemical Compositions of Black Carbon Particle Cores and Coatings via Soot Particle Aerosol Mass Spectrometry with Photoionization and Electron Ionization, J. Phys. Chem. A, 119, 4589–4599, https://doi.org/10.1021/jp510711u, 2015a.
Canagaratna, M. R., Jimenez, J. L., Kroll, J. H., Chen, Q., Kessler, S. H., Massoli, P., Hildebrandt Ruiz, L., Fortner, E., Williams, L. R., Wilson, K. R., Surratt, J. D., Donahue, N. M., Jayne, J. T., and Worsnop, D. R.: Elemental ratio measurements of organic compounds using aerosol mass spectrometry: characterization, improved calibration, and implications, Atmos. Chem. Phys., 15, 253–272, https://doi.org/10.5194/acp-15-253-2015, 2015b.
Carbone, S., Onasch, T., Saarikoski, S., Timonen, H., Saarnio, K., Sueper, D., Rönkkö, T., Pirjola, L., Häyrinen, A., Worsnop, D., and Hillamo, R.: Characterization of trace metals on soot aerosol particles with the SP-AMS: detection and quantification, Atmos. Meas. Tech., 8, 4803–4815, https://doi.org/10.5194/amt-8-4803-2015, 2015.
Carbone, S., Timonen, H. J., Rostedt, A., Happonen, M., Rönkkö, T., Keskinen, J., Ristimaki, J., Korpi, H., Artaxo, P., Canagaratna, M., Worsnop, D., Canonaco, F., Prévôt, A. S. H., Hillamo, R., and Saarikoski, S.: Distinguishing fuel and lubricating oil combustion products in diesel engine exhaust particles, Aerosol Sci. Technol., 53, 1–14, https://doi.org/10.1080/02786826.2019.1584389, 2019.
Chou, L. M., Huang, D., Tan, K. S., Toh, T. C., Goh, B. P. L., and Tun, K.: in: World Seas: an Environmental Evaluation, 2nd Edn., chap. 24, Singapore, edited by: Sheppard, C., Academic Press, 539–558, 2019.
Coordinating Research Council: CRC Report No. 665: Internal Diesel Injector Deposits, Coordinating Research Council, inc., 2013.
Corbin, J. C., Sierau, B., Gysel, M., Laborde, M., Keller, A., Kim, J., Petzold, A., Onasch, T. B., Lohmann, U., and Mensah, A. A.: Mass spectrometry of refractory black carbon particles from six sources: carbon-cluster and oxygenated ions, Atmos. Chem. Phys., 14, 2591–2603, https://doi.org/10.5194/acp-14-2591-2014, 2014.
Corbin, J. C., Mensah, A. A., Pieber, S. M., Orasche, J., Michalke, B., Zanatta, M., Czech, H., Massabò, D., Buatier de Mongeot, F., Mennucci, C., El Haddad, I., Kumar, N. K., Stengel, B., Huang, Y., Zimmermann, R., Prévôt, A. S. H., and Gysel, M.: Trace Metals in Soot and PM 2.5 from Heavy-Fuel-Oil Combustion in a Marine Engine, Environ. Sci. Technol., 52, 6714–6722, https://doi.org/10.1021/acs.est.8b01764, 2018.
Crippa, M., DeCarlo, P. F., Slowik, J. G., Mohr, C., Heringa, M. F., Chirico, R., Poulain, L., Freutel, F., Sciare, J., Cozic, J., Di Marco, C. F., Elsasser, M., Nicolas, J. B., Marchand, N., Abidi, E., Wiedensohler, A., Drewnick, F., Schneider, J., Borrmann, S., Nemitz, E., Zimmermann, R., Jaffrezo, J.-L., Prévô̂t, A. S. H., and Baltensperger, U.: Wintertime aerosol chemical composition and source apportionment of the organic fraction in the metropolitan area of Paris, Atmos. Chem. Phys., 13, 961–981, https://doi.org/10.5194/acp-13-961-2013, 2013.
Cubison, M. J., Ortega, A. M., Hayes, P. L., Farmer, D. K., Day, D., Lechner, M. J., Brune, W. H., Apel, E., Diskin, G. S., Fisher, J. A., Fuelberg, H. E., Hecobian, A., Knapp, D. J., Mikoviny, T., Riemer, D., Sachse, G. W., Sessions, W., Weber, R. J., Weinheimer, A. J., Wisthaler, A., and Jimenez, J. L.: Effects of aging on organic aerosol from open biomass burning smoke in aircraft and laboratory studies, Atmos. Chem. Phys., 11, 12049–12064, https://doi.org/10.5194/acp-11-12049-2011, 2011.
Dallmann, T. R., Onasch, T. B., Kirchstetter, T. W., Worton, D. R., Fortner, E. C., Herndon, S. C., Wood, E. C., Franklin, J. P., Worsnop, D. R., Goldstein, A. H., and Harley, R. A.: Characterization of particulate matter emissions from on-road gasoline and diesel vehicles using a soot particle aerosol mass spectrometer, Atmos. Chem. Phys., 14, 7585–7599, https://doi.org/10.5194/acp-14-7585-2014, 2014.
Dasari, S., Andersson, A., Bikkina, S., Holmstrand, H., Budhavant, K., Satheesh, S., Asmi, E., Kesti, J., Backman, J., Salam, A., Bisht, D. S., Tiwari, S., Hameed, Z., and Gustafsson, Ö.: Photochemical degradation affects the light absorption of water-soluble brown carbon in the South Asian outflow, Sci. Adv., 5, eaau8066, https://doi.org/10.1126/sciadv.aau8066, 2019.
DeCarlo, P. F., Kimmel, J. R., Trimborn, A., Northway, M. J., Jayne, J. T., Aiken, A. C., Gonin, M., Fuhrer, K., Horvath, T., Docherty, K. S., Worsnop, D. R., and Jimenez, J. L.: Field-Deployable, High-Resolution, Time-of-Flight Aerosol Mass Spectrometer, Anal. Chem., 78, 8281–8289, https://doi.org/10.1021/ac061249n, 2006.
Desyaterik, Y., Sun, Y., Shen, X., Lee, T., Wang, X., Wang, T., and Collett, J. L.: Speciation of “brown” carbon in cloud water impacted by agricultural biomass burning in eastern China, J. Geophys. Res.-Atmos., 118, 7389–7399, https://doi.org/10.1002/jgrd.50561, 2013.
Diez, J. R., Breul, M., and Moneke, J.: The SIJORI Growth Triangle: Territorial Complementarities or Competition for FDI in the Oil and Gas Industry?, J. Southeast Asian Econ., 36, 71–90, 2019.
Donahue, N. M., Robinson, A. L., and Pandis, S. N.: Atmospheric organic particulate matter: From smoke to secondary organic aerosol, Atmos. Environ., 43, 94–106, https://doi.org/10.1016/j.atmosenv.2008.09.055, 2009.
Draxler, R. R. and Rolph, G.: HYSPLIT (HYbrid Single-Particle Lagrangian Integrated Trajectory) model access via NOAA ARL READY website, NOAA Air Resources Laboratory, Silver Spring, 2003.
Elser, M., Huang, R.-J., Wolf, R., Slowik, J. G., Wang, Q., Canonaco, F., Li, G., Bozzetti, C., Daellenbach, K. R., Huang, Y., Zhang, R., Li, Z., Cao, J., Baltensperger, U., El-Haddad, I., and Prévôt, A. S. H.: New insights into PM2.5 chemical composition and sources in two major cities in China during extreme haze events using aerosol mass spectrometry, Atmos. Chem. Phys., 16, 3207–3225, https://doi.org/10.5194/acp-16-3207-2016, 2016.
Engling, G., He, J., Betha, R., and Balasubramanian, R.: Assessing the regional impact of indonesian biomass burning emissions based on organic molecular tracers and chemical mass balance modeling, Atmos. Chem. Phys., 14, 8043–8054, https://doi.org/10.5194/acp-14-8043-2014, 2014.
Farmer, D. K., Matsunaga, A., Docherty, K. S., Surratt, J. D., Seinfeld, J. H., Ziemann, P. J., and Jimenez, J. L.: Response of an aerosol mass spectrometer to organonitrates and organosulfates and implications for atmospheric chemistry, P. Natl. Acad. Sci. USA, 107, 6670–6675, https://doi.org/10.1073/pnas.0912340107, 2010.
Fine, P. M., Cass, G. R., and Simoneit, B. R. T.: Chemical Characterization of Fine Particle Emissions from the Wood Stove Combustion of Prevalent United States Tree Species, Environ. Eng. Sci., 21, 705–721, https://doi.org/10.1089/ees.2004.21.705, 2004.
Fröhlich, R., Crenn, V., Setyan, A., Belis, C. A., Canonaco, F., Favez, O., Riffault, V., Slowik, J. G., Aas, W., Aijälä, M., Alastuey, A., Artiñano, B., Bonnaire, N., Bozzetti, C., Bressi, M., Carbone, C., Coz, E., Croteau, P. L., Cubison, M. J., Esser-Gietl, J. K., Green, D. C., Gros, V., Heikkinen, L., Herrmann, H., Jayne, J. T., Lunder, C. R., Minguillón, M. C., Močnik, G., O'Dowd, C. D., Ovadnevaite, J., Petralia, E., Poulain, L., Priestman, M., Ripoll, A., Sarda-Estève, R., Wiedensohler, A., Baltensperger, U., Sciare, J., and Prévôt, A. S. H.: ACTRIS ACSM intercomparison – Part 2: Intercomparison of ME-2 organic source apportionment results from 15 individual, co-located aerosol mass spectrometers, Atmos. Meas. Tech., 8, 2555–2576, https://doi.org/10.5194/amt-8-2555-2015, 2015.
Ge, X., Setyan, A., Sun, Y., and Zhang, Q.: Primary and secondary organic aerosols in Fresno, California during wintertime: Results from high resolution aerosol mass spectrometry, J. Geophys. Res.-Atmos., 117, D19301, https://doi.org/10.1029/2012JD018026, 2012.
Guo, H., Xu, L., Bougiatioti, A., Cerully, K. M., Capps, S. L., Hite Jr., J. R., Carlton, A. G., Lee, S.-H., Bergin, M. H., Ng, N. L., Nenes, A., and Weber, R. J.: Fine-particle water and pH in the southeastern United States, Atmos. Chem. Phys., 15, 5211–5228, https://doi.org/10.5194/acp-15-5211-2015, 2015.
Heald, C. L., Kroll, J. H., Jimenez, J. L., Docherty, K. S., DeCarlo, P. F., Aiken, A. C., Chen, Q., Martin, S. T., Farmer, D. K., and Artaxo, P.: A simplified description of the evolution of organic aerosol composition in the atmosphere, Geophys. Res. Lett., 37, L08803, https://doi.org/10.1029/2010GL042737, 2010.
Henry, R., Norris, G. A., Vedantham, R., and Turner, J. R.: Source Region Identification Using Kernel Smoothing, Environ. Sci. Technol., 43, 4090–4097, https://doi.org/10.1021/es8011723, 2009.
Hsu, L.-J., Alwahabi, Z. T., Nathan, G. J., Li, Y., Li, Z. S., and Aldén, M.: Sodium and Potassium Released from Burning Particles of Brown Coal and Pine Wood in a Laminar Premixed Methane Flame Using Quantitative Laser-Induced Breakdown Spectroscopy, Appl. Spectrosc., 65, 684–691, https://doi.org/10.1366/10-06108, 2011.
Hu, W. W., Hu, M., Yuan, B., Jimenez, J. L., Tang, Q., Peng, J. F., Hu, W., Shao, M., Wang, M., Zeng, L. M., Wu, Y. S., Gong, Z. H., Huang, X. F., and He, L. Y.: Insights on organic aerosol aging and the influence of coal combustion at a regional receptor site of central eastern China, Atmos. Chem. Phys., 13, 10095–10112, https://doi.org/10.5194/acp-13-10095-2013, 2013.
Huang, X.-F., He, L.-Y., Hu, M., Canagaratna, M. R., Sun, Y., Zhang, Q., Zhu, T., Xue, L., Zeng, L.-W., Liu, X.-G., Zhang, Y.-H., Jayne, J. T., Ng, N. L., and Worsnop, D. R.: Highly time-resolved chemical characterization of atmospheric submicron particles during 2008 Beijing Olympic Games using an Aerodyne High-Resolution Aerosol Mass Spectrometer, Atmos. Chem. Phys., 10, 8933–8945, https://doi.org/10.5194/acp-10-8933-2010, 2010.
Irei, S., Shimono, A., Hikida, T., Kuramoto, K., Suzuki, Y., and Takami, A.: Qualitative Evaluation of m∕z 85, 87, and 133 Signals in Organic Aerosol Mass Spectra of Fly Ash Produced by Coal Combustion, Aerosol Air Qual. Res., 14, 406–412, https://doi.org/10.4209/aaqr.2013.04.0126, 2014.
Jayne, J. T., Leard, D. C., Zhang, X., Davidovits, P., Smith, K. A., Kolb, C. E., and Worsnop, D. R.: Development of an Aerosol Mass Spectrometer for Size and Composition Analysis of Submicron Particles, Aerosol Sci. Technol., 33, 49–70, https://doi.org/10.1080/027868200410840, 2000.
Jimenez, J. L.: Ambient aerosol sampling using the Aerodyne Aerosol Mass Spectrometer, J. Geophys. Res., 108, 8425, https://doi.org/10.1029/2001JD001213, 2003.
Jimenez, J. L., Canagaratna, M. R., Donahue, N. M., Prevot, A. S. H., Zhang, Q., Kroll, J. H., DeCarlo, P. F., Allan, J. D., Coe, H., Ng, N. L., Aiken, A. C., Docherty, K. S., Ulbrich, I. M., Grieshop, A. P., Robinson, A. L., Duplissy, J., Smith, J. D., Wilson, K. R., Lanz, V. A., Hueglin, C., Sun, Y. L., Tian, J., Laaksonen, A., Raatikainen, T., Rautiainen, J., Vaattovaara, P., Ehn, M., Kulmala, M., Tomlinson, J. M., Collins, D. R., Cubison, M. J., E, Dunlea, J., Huffman, J. A., Onasch, T. B., Alfarra, M. R., Williams, P. I., Bower, K., Kondo, Y., Schneider, J., Drewnick, F., Borrmann, S., Weimer, S., Demerjian, K., Salcedo, D., Cottrell, L., Griffin, R., Takami, A., Miyoshi, T., Hatakeyama, S., Shimono, A., Sun, J. Y., Zhang, Y. M., Dzepina, K., Kimmel, J. R., Sueper, D., Jayne, J. T., Herndon, S. C., Trimborn, A. M., Williams, L. R., Wood, E. C., Middlebrook, A. M., Kolb, C. E., Baltensperger, U., and Worsnop, D. R.: Evolution of Organic Aerosols in the Atmosphere, Science, 326, 1525–1529, https://doi.org/10.1126/science.1180353, 2009.
Kasthuriarachchi, N. Y., Rivellini, L.-H., Adam, M. G., and Lee, A. K. Y.: Strongly absorptive primary and secondary brown carbon in an urban, Environ. Sci. Technol., in review, 2020.
Kim, P. S., Jacob, D. J., Fisher, J. A., Travis, K., Yu, K., Zhu, L., Yantosca, R. M., Sulprizio, M. P., Jimenez, J. L., Campuzano-Jost, P., Froyd, K. D., Liao, J., Hair, J. W., Fenn, M. A., Butler, C. F., Wagner, N. L., Gordon, T. D., Welti, A., Wennberg, P. O., Crounse, J. D., Clair, J. M. S., Teng, A. P., Millet, D. B., Schwarz, J. P., Markovic, M. Z., and Perring, A. E.: Sources, seasonality, and trends of southeast US aerosol: an integrated analysis of surface, aircraft, and satellite observations with the GEOS-Chem chemical transport model, Atmos. Chem. Phys., 15, 10411–10433, https://doi.org/10.5194/acp-15-10411-2015, 2015.
Laskin, A., Smith, J. S., and Laskin, J.: Molecular Characterization of Nitrogen-Containing Organic Compounds in Biomass Burning Aerosols Using High-Resolution Mass Spectrometry, Environ. Sci. Technol., 43, 3764–3771, https://doi.org/10.1021/es803456n, 2009.
Lee, A. K. Y., Willis, M. D., Healy, R. M., Onasch, T. B., and Abbatt, J. P. D.: Mixing state of carbonaceous aerosol in an urban environment: single particle characterization using the soot particle aerosol mass spectrometer (SP-AMS), Atmos. Chem. Phys., 15, 1823–1841, https://doi.org/10.5194/acp-15-1823-2015, 2015.
Lee, A. K. Y., Willis, M. D., Healy, R. M., Wang, J. M., Jeong, C.-H., Wenger, J. C., Evans, G. J., and Abbatt, J. P. D.: Single-particle characterization of biomass burning organic aerosol (BBOA): evidence for non-uniform mixing of high molecular weight organics and potassium, Atmos. Chem. Phys., 16, 5561–5572, https://doi.org/10.5194/acp-16-5561-2016, 2016.
Lee, A. K. Y., Chen, C.-L., Liu, J., Price, D. J., Betha, R., Russell, L. M., Zhang, X., and Cappa, C. D.: Formation of secondary organic aerosol coating on black carbon particles near vehicular emissions, Atmos. Chem. Phys., 17, 15055–15067, https://doi.org/10.5194/acp-17-15055-2017, 2017.
Liggio, J. and Li, S.-M.: Organosulfate formation during the uptake of pinonaldehyde on acidic sulfate aerosols, Geophys. Res. Lett., 33, https://doi.org/10.1029/2006GL026079, 2006.
Liu, Z., Lu, X., Feng, J., Fan, Q., Zhang, Y., and Yang, X.: Influence of Ship Emissions on Urban Air Quality: A Comprehensive Study Using Highly Time-Resolved Online Measurements and Numerical Simulation in Shanghai, Environ. Sci. Technol., 51, 202–211, https://doi.org/10.1021/acs.est.6b03834, 2017.
Mace, K. A., Artaxo, P., and Duce, R. A.: Water-soluble organic nitrogen in Amazon Basin aerosols during the dry (biomass burning) and wet seasons, J. Geophys. Res.-Atmos., 108, 4512, https://doi.org/10.1029/2003JD003557, 2003.
Massoli, P., Fortner, E. C., Canagaratna, M. R., Williams, L. R., Zhang, Q., Sun, Y., Schwab, J. J., Trimborn, A., Onasch, T. B., Demerjian, K. L., Kolb, C. E., Worsnop, D. R., and Jayne, J. T.: Pollution Gradients and Chemical Characterization of Particulate Matter from Vehicular Traffic near Major Roadways: Results from the 2009 Queens College Air Quality Study in NYC, Aerosol Sci. Technol., 46, 1201–1218, https://doi.org/10.1080/02786826.2012.701784, 2012.
Middlebrook, A. M., Bahreini, R., Jimenez, J. L., and Canagaratna, M. R.: Evaluation of Composition-Dependent Collection Efficiencies for the Aerodyne Aerosol Mass Spectrometer using Field Data, Aerosol Sci. Technol., 46, 258–271, https://doi.org/10.1080/02786826.2011.620041, 2012.
Mohr, C., DeCarlo, P. F., Heringa, M. F., Chirico, R., Slowik, J. G., Richter, R., Reche, C., Alastuey, A., Querol, X., Seco, R., Peñuelas, J., Jiménez, J. L., Crippa, M., Zimmermann, R., Baltensperger, U., and Prévôt, A. S. H.: Identification and quantification of organic aerosol from cooking and other sources in Barcelona using aerosol mass spectrometer data, Atmos. Chem. Phys., 12, 1649–1665, https://doi.org/10.5194/acp-12-1649-2012, 2012.
Mohr, C., Lopez-Hilfiker, F. D., Zotter, P., Prévôt, A. S. H., Xu, L., Ng, N. L., Herndon, S. C., Williams, L. R., Franklin, J. P., Zahniser, M. S., Worsnop, D. R., Knighton, W. B., Aiken, A. C., Gorkowski, K. J., Dubey, M. K., Allan, J. D., and Thornton, J. A.: Contribution of Nitrated Phenols to Wood Burning Brown Carbon Light Absorption in Detling, United Kingdom during Winter Time, Environ. Sci. Technol., 47, 6316–6324, https://doi.org/10.1021/es400683v, 2013.
Moldanová, J., Fridell, E., Popovicheva, O., Demirdjian, B., Tishkova, V., Faccinetto, A., and Focsa, C.: Characterisation of particulate matter and gaseous emissions from a large ship diesel engine, Atmos. Environ., 43, 2632–2641, https://doi.org/10.1016/j.atmosenv.2009.02.008, 2009.
NEA: Annual Climatological report 2018, Scientific report, Meteorological Service Singapore, available at: http://www.weather.gov.sg/wp-content/uploads/2019/03/Annual-Climatological-Report-2018.pdf (last access: 23 August 2019), 2018.
Ng, N. L., Canagaratna, M. R., Zhang, Q., Jimenez, J. L., Tian, J., Ulbrich, I. M., Kroll, J. H., Docherty, K. S., Chhabra, P. S., Bahreini, R., Murphy, S. M., Seinfeld, J. H., Hildebrandt, L., Donahue, N. M., DeCarlo, P. F., Lanz, V. A., Prévôt, A. S. H., Dinar, E., Rudich, Y., and Worsnop, D. R.: Organic aerosol components observed in Northern Hemispheric datasets from Aerosol Mass Spectrometry, Atmos. Chem. Phys., 10, 4625–4641, https://doi.org/10.5194/acp-10-4625-2010, 2010.
Ng, N. L., Canagaratna, M. R., Jimenez, J. L., Zhang, Q., Ulbrich, I. M., and Worsnop, D. R.: Real-Time Methods for Estimating Organic Component Mass Concentrations from Aerosol Mass Spectrometer Data, Environ. Sci. Technol., 45, 910–916, https://doi.org/10.1021/es102951k, 2011.
Omidvarborna, H., Kumar, A., and Kim, D.-S.: Variation of diesel soot characteristics by different types and blends of biodiesel in a laboratory combustion chamber, Sci. Total Environ., 544, 450–459, https://doi.org/10.1016/j.scitotenv.2015.11.076, 2016.
Onasch, T. B., Trimborn, A., Fortner, E. C., Jayne, J. T., Kok, G. L., Williams, L. R., Davidovits, P., and Worsnop, D. R.: Soot Particle Aerosol Mass Spectrometer: Development, Validation, and Initial Application, Aerosol Sci. Technol., 46, 804–817, https://doi.org/10.1080/02786826.2012.663948, 2012.
Petit, J.-E., Favez, O., Albinet, A., and Canonaco, F.: A user-friendly tool for comprehensive evaluation of the geographical origins of atmospheric pollution: Wind and trajectory analyses, Environ. Model. Softw., 88, 183–187, https://doi.org/10.1016/j.envsoft.2016.11.022, 2017.
Polissar, A. V., Hopke, P. K., and Poirot, R. L.: Atmospheric Aerosol over Vermont:? Chemical Composition and Sources, Environ. Sci. Technol., 35, 4604–4621, https://doi.org/10.1021/es0105865, 2001.
Ripoll, A., Minguillón, M. C., Pey, J., Jimenez, J. L., Day, D. A., Sosedova, Y., Canonaco, F., Prévôt, A. S. H., Querol, X., and Alastuey, A.: Long-term real-time chemical characterization of submicron aerosols at Montsec (southern Pyrenees, 1570 m a.s.l.), Atmos. Chem. Phys., 15, 2935–2951, https://doi.org/10.5194/acp-15-2935-2015, 2015.
Rivellini, L.-H., Chiapello, I., Tison, E., Fourmentin, M., Féron, A., Diallo, A., N'Diaye, T., Goloub, P., Canonaco, F., Prévôt, A. S. H., and Riffault, V.: Chemical characterization and source apportionment of submicron aerosols measured in Senegal during the 2015 SHADOW campaign, Atmos. Chem. Phys., 17, 10291–10314, https://doi.org/10.5194/acp-17-10291-2017, 2017.
Saarikoski, S., Timonen, H., Carbone, S., Kuuluvainen, H., Niemi, J. V., Kousa, A., Rönkkö, T., Worsnop, D., Hillamo, R., and Pirjola, L.: Investigating the chemical species in submicron particles emitted by city buses, Aerosol Sci. Technol., 51, 317–329, https://doi.org/10.1080/02786826.2016.1261992, 2017.
Saarikoski, S., Reyes, F., Vázquez, Y., Tagle, M., Timonen, H., Aurela, M., Carbone, S., Worsnop, D. R., Hillamo, R., and Oyola, P.: Characterization of submicron aerosol chemical composition and sources in the coastal area of Central Chile, Atmos. Environ., 199, 391–401, https://doi.org/10.1016/j.atmosenv.2018.11.040, 2019.
Saliba, N. A., El Jam, F., El Tayar, G., Obeid, W., and Roumie, M.: Origin and variability of particulate matter (PM10 and PM2.5) mass concentrations over an Eastern Mediterranean city, Atmos. Res., 97, 106–114, https://doi.org/10.1016/j.atmosres.2010.03.011, 2010.
Salinas, S. V., Chew, B. N., Miettinen, J., Campbell, J. R., Welton, E. J., Reid, J. S., Yu, L. E., and Liew, S. C.: Physical and optical characteristics of the October 2010 haze event over Singapore: A photometric and lidar analysis, Atmos. Res., 122, 555–570, https://doi.org/10.1016/j.atmosres.2012.05.021, 2013.
Saputra, H., Maimun, A., and Koto, J.: Estimation and Distribution of Exhaust Ship Emission from Marine Traffic in the Straits of Malacca and Singapore using Automatic Identification System (AIS) Data, J. Mek., 36, 86–104, available at: https://jurnalmekanikal.utm.my/index.php/jurnalmekanikal/article/view/58 (last access: 23 August 2019), 2013.
Sueper, D.: ToF-AMS Analysis Software, available at: http://cires1.colorado.edu/jimenez-group/ToFAMSResources/ToFSoftware/index.html (last access: 23 August 2019), 2015.
Sun, Y., Wang, Z., Dong, H., Yang, T., Li, J., Pan, X., Chen, P., and Jayne, J. T.: Characterization of summer organic and inorganic aerosols in Beijing, China with an Aerosol Chemical Speciation Monitor, Atmos. Environ., 51, 250–259, https://doi.org/10.1016/j.atmosenv.2012.01.013, 2012.
Sun, Y.-L., Zhang, Q., Schwab, J. J., Demerjian, K. L., Chen, W.-N., Bae, M.-S., Hung, H.-M., Hogrefe, O., Frank, B., Rattigan, O. V., and Lin, Y.-C.: Characterization of the sources and processes of organic and inorganic aerosols in New York city with a high-resolution time-of-flight aerosol mass apectrometer, Atmos. Chem. Phys., 11, 1581–1602, https://doi.org/10.5194/acp-11-1581-2011, 2011.
Ulbrich, I. M., Canagaratna, M. R., Zhang, Q., Worsnop, D. R., and Jimenez, J. L.: Interpretation of organic components from Positive Matrix Factorization of aerosol mass spectrometric data, Atmos. Chem. Phys., 9, 2891–2918, https://doi.org/10.5194/acp-9-2891-2009, 2009.
UN Environment: The South East Asia Air Quality Regional Report, UN Environment, available at: http://www.unenvironment.org/resources/report/south-east-asia-air-quality-regional-report (last access: 20 March 2019), 2014.
Vander Wal, R. L. and Tomasek, A. J.: Soot nanostructure: dependence upon synthesis conditions, Combust. Flame, 136, 129–140, https://doi.org/10.1016/j.combustflame.2003.09.008, 2004.
Velasco, E. and Roth, M.: Review of Singapore's air quality and greenhouse gas emissions: Current situation and opportunities, J. Air Waste Manag. Assoc., 62, 625–641, https://doi.org/10.1080/10962247.2012.666513, 2012.
Viana, M., López, J. M., Querol, X., Alastuey, A., García-Gacio, D., Blanco-Heras, G., López-Mahía, P., Piñeiro-Iglesias, M., Sanz, M. J., Sanz, F., Chi, X., and Maenhaut, W.: Tracers and impact of open burning of rice straw residues on PM in Eastern Spain, Atmos. Environ., 42, 1941–1957, https://doi.org/10.1016/j.atmosenv.2007.11.012, 2008.
Wang, J., Wu, Y., Ge, X., Shen, Y., Ge, S., and Chen, M.: Characteristics and sources of ambient refractory black carbon aerosols: Insights from soot particle aerosol mass spectrometer, Atmos. Environ., 185, 147–152, https://doi.org/10.1016/j.atmosenv.2018.05.011, 2018.
Willis, M. D., Lee, A. K. Y., Onasch, T. B., Fortner, E. C., Williams, L. R., Lambe, A. T., Worsnop, D. R., and Abbatt, J. P. D.: Collection efficiency of the soot-particle aerosol mass spectrometer (SP-AMS) for internally mixed particulate black carbon, Atmos. Meas. Tech., 7, 4507–4516, https://doi.org/10.5194/amt-7-4507-2014, 2014.
Willis, M. D., Burkart, J., Thomas, J. L., Köllner, F., Schneider, J., Bozem, H., Hoor, P. M., Aliabadi, A. A., Schulz, H., Herber, A. B., Leaitch, W. R., and Abbatt, J. P. D.: Growth of nucleation mode particles in the summertime Arctic: a case study, Atmos. Chem. Phys., 16, 7663–7679, https://doi.org/10.5194/acp-16-7663-2016, 2016.
Wong, J. P. S., Lee, A. K. Y., and Abbatt, J. P. D.: Impacts of Sulfate Seed Acidity and Water Content on Isoprene Secondary Organic Aerosol Formation, Environ. Sci. Technol., 49, 13215–13221, https://doi.org/10.1021/acs.est.5b02686, 2015.
World Shipping Council: Global Trade: Top 50 World Container Ports, available at: http://www.worldshipping.org/about-the-industry/global-trade/top-50-world-container-ports, last access: 1 September 2019.
Xu, W., Han, T., Du, W., Wang, Q., Chen, C., Zhao, J., Zhang, Y., Li, J., Fu, P., Wang, Z., Worsnop, D. R., and Sun, Y.: Effects of Aqueous-Phase and Photochemical Processing on Secondary Organic Aerosol Formation and Evolution in Beijing, China, Environ. Sci. Technol., 51, 762–770, https://doi.org/10.1021/acs.est.6b04498, 2017.
Yakubov, M. R., Milordov, D. V., Yakubova, S. G., Borisov, D. N., Ivanov, V. T., and Sinyashin, K. O.: Concentrations of vanadium and nickel and their ratio in heavy oil asphaltenes, Pet. Chem., 56, 16–20, https://doi.org/10.1134/S0965544116010072, 2016.
Yang, L., Nguyen, D. M., Jia, S., Reid, J. S., and Yu, L. E.: Impacts of biomass burning smoke on the distributions and concentrations of C2–C5 dicarboxylic acids and dicarboxylates in a tropical urban environment, Atmos. Environ., 78, 211–218, https://doi.org/10.1016/j.atmosenv.2012.03.049, 2013.
Zhang, Q., Worsnop, D. R., Canagaratna, M. R., and Jimenez, J. L.: Hydrocarbon-like and oxygenated organic aerosols in Pittsburgh: insights into sources and processes of organic aerosols, Atmos. Chem. Phys., 5, 3289–3311, https://doi.org/10.5194/acp-5-3289-2005, 2005.
Zhang, Q., Jimenez, J. L., Worsnop, D. R., and Canagaratna, M.: A Case Study of Urban Particle Acidity and Its Influence on Secondary Organic Aerosol, Environ. Sci. Technol., 41, 3213–3219, https://doi.org/10.1021/es061812j, 2007a.
Zhang, Q., Jimenez, J. L., Canagaratna, M. R., Allan, J. D., Coe, H., Ulbrich, I., Alfarra, M. R., Takami, A., Middlebrook, A. M., Sun, Y. L., Dzepina, K., Dunlea, E., Docherty, K., DeCarlo, P. F., Salcedo, D., Onasch, T., Jayne, J. T., Miyoshi, T., Shimono, A., Hatakeyama, S., Takegawa, N., Kondo, Y., Schneider, J., Drewnick, F., Borrmann, S., Weimer, S., Demerjian, K., Williams, P., Bower, K., Bahreini, R., Cottrell, L., Griffin, R. J., Rautiainen, J., Sun, J. Y., Zhang, Y. M., and Worsnop, D. R.: Ubiquity and dominance of oxygenated species in organic aerosols in anthropogenically-influenced Northern Hemisphere midlatitudes, Geophys. Res. Lett., 34, L13801, https://doi.org/10.1029/2007GL029979, 2007b.
Zhang, Q., Jimenez, J. L., Canagaratna, M. R., Ulbrich, I. M., Ng, N. L., Worsnop, D. R., and Sun, Y.: Understanding atmospheric organic aerosols via factor analysis of aerosol mass spectrometry: a review, Anal. Bioanal. Chem., 401, 3045–3067, https://doi.org/10.1007/s00216-011-5355-y, 2011.