the Creative Commons Attribution 4.0 License.
the Creative Commons Attribution 4.0 License.
 | 19 May 2020
Hygroscopic properties and cloud condensation nuclei activity of atmospheric aerosols under the influences of Asian continental outflow and new particle formation at a coastal site in eastern Asia
Hing Cho Cheung
Charles Chung-Kuang Chou
Celine Siu Lan Lee
Wei-Chen Kuo
Shuenn-Chin Chang
The chemical composition of fine particulate matter (PM2.5), the size distribution and number concentration of aerosol particles (NCN), and the number concentration of cloud condensation nuclei (NCCN) were measured at the northern tip of Taiwan during an intensive observation experiment from April 2017 to March 2018. The parameters of aerosol hygroscopicity (i.e., activation ratio, activation diameter and kappa of CCN) were retrieved from the measurements. Significant variations were found in the hygroscopicity of aerosols (kappa – κ – of 0.18–0.56, for water vapor supersaturation – SS – of 0.12 %–0.80 %), which were subject to various pollution sources, including aged air pollutants originating in eastern and northern China and transported by the Asian continental outflows and fresh particles emitted from local sources and distributed by land–sea breeze circulations as well as produced by processes of new particle formation (NPF). Cluster analysis was applied to the back trajectories of air masses to investigate their respective source regions. The results showed that aerosols associated with Asian continental outflows were characterized by lower NCN and NCCN values and by higher kappa values of CCN, whereas higher NCN and NCCN values with lower kappa values of CCN were observed in the aerosols associated with local air masses. Besides, it was revealed that the kappa value of CCN exhibited a decrease during the early stage of an event of new particle formation, which turned to an increasing trend over the later period. The distinct features in the hygroscopicity of aerosols were found to be consistent with the characteristics in the chemical composition of PM2.5. This study has depicted a clear seasonal characteristic of hygroscopicity and CCN activity under the influence of a complex mixture of pollutants from different regional and/or local pollution sources. Nevertheless, the mixing state and chemical composition of the aerosols critically influence the aerosol hygroscopicity, and further investigations are necessary to elucidate the atmospheric processing involved in the CCN activation in coastal areas.


Aerosols suspended in the atmosphere allow for the condensation of water vapor under certain supersaturation conditions and subsequently evolve into cloud droplets. The activation of cloud condensation nuclei (CCN) depends on the size and chemical composition of aerosol particles, as well as on the meteorological conditions (i.e., water vapor supersaturation – SS – and uplift force for air parcels; Seinfeld and Pandis, 1998). Among the chemical and physical properties of aerosols, hygroscopicity plays a critical role in the complex aerosol–cloud interactions (McFiggans et al., 2006; Lee et al., 2010). Atmospheric aerosols are a mixture of different chemical species rather than a single compound and exist in various size ranges and mixing states. A single parameter called kappa (κ) has been developed to evaluate the hygroscopicity of aerosols, which represents a scaled volume fraction of soluble materials in particles and provides a theoretical framework to derive bulk hygroscopicity for aerosols with internal mixtures (Petters and Kreidenweis, 2007). However, while the hygroscopicity and CCN activity of a single component can be characterized in laboratories, the properties of their mixture in ambient air are difficult to estimate, owing to the complexity in the physiochemical characteristics of aerosols. Thus, field investigations have been conducted to study aerosol hygroscopicity and CCN activity in various environmental settings including the rural, urban, forest and marine boundary layer (Ehn et al., 2007; Massling et al., 2007; Gunthe et al., 2009; Wu et al., 2016; Schmale et al., 2017; Park et al., 2018). Furthermore, in situ measurements of physicochemical properties of aerosols and CCN in critical geographical areas in the climate system could provide a means of constraining the representation of relevant schemes in global climate models (Khairoutdinov and Randall, 2001; Morales Betancourt and Nenes, 2014; Seinfeld et al., 2016).
Due to the rapid industrialization and economic development in eastern Asia (EA) during the past few decades, it has become one of the most polluted regions in the world, where a significant amount of particulate matter (PM) and its precursors were emitted (Streets et al., 2003; Dentener et al., 2006; Zhang et al., 2009). Taiwan is located in the downwind area of the EA continental outflows and thereby is influenced by the pollution outbreaks during the winter monsoon seasons. Furthermore, the air quality in Taiwan is also known to be affected by the photochemical production of secondary aerosols. The geographical location thus provides a strategic platform to investigate the CCN activation of aerosols influenced by a complex mixture of pollutants (Chou et al., 2005, 2017; Chang et al., 2010; Cheung et al., 2013, 2016; Li et al., 2016; Lee et al., 2019). Cheung et al. (2013) reported that events of new particle formation (NPF) occurred frequently during summertime in Taiwan, where the number concentration of nucleation mode particles which formed from photochemical reactions was nearly 10 times that attributed to local primary pollution, indicating the critical impact of NPF on particle concentration. Previous studies suggested that the freshly formed particles could further grow into larger particles by the uptake of condensable vapors (i.e., organic and sulfuric vapors) and increased CCN concentration (Merikanto et al., 2009; Pierce et al., 2012); however, the detailed processes were not clear yet. To date, most of the studies on CCN and its interaction with NPF have been conducted in Europe and North America, whereas only a few studies with 1–3-month measurement periods in eastern Asia were available despite the frequent NPF observed in this region (Yue et al., 2011; Leng et al., 2014; Ma et al., 2016). In order to investigate the hygroscopicity and CCN activity of the aerosols with a complex pollution sources and aging processes, a 1-year observation study on the characteristics of aerosols and CCN was conducted in northern Taiwan. The aim of this study was to characterize the variations in aerosol hygroscopicity and CCN activity under the influence of continental outflows and new particle formation during different seasons.
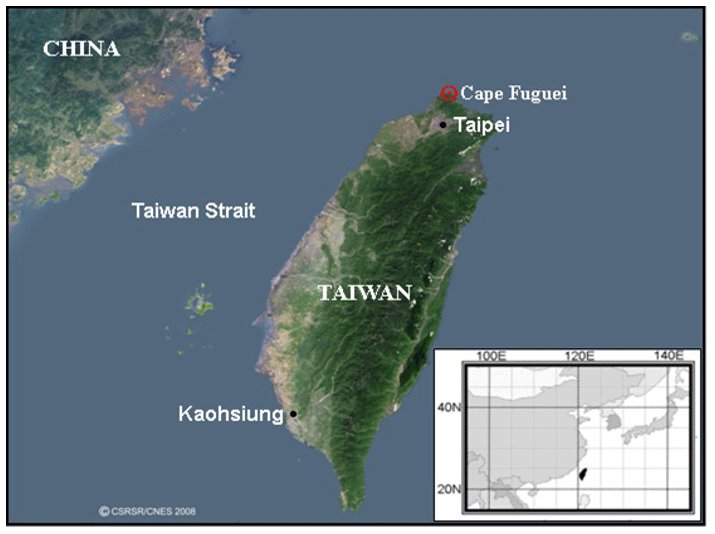
Figure 1The geographical location of the CAFÉ research station (25.30∘ N, 121.54∘ E), which is at the northern tip of Taiwan in eastern Asia. The digital map is provided by Center for Space and Remote Sensing Research, National Central University, Taiwan (© CSRSR).
2.1 Observation site and instrumentation
A field study was conducted at the Cape Fuguei Research Station (named CAFÉ; 25.30∘ N, 121.54∘ E, 10 m a.s.l.) located at the northern tip of Taiwan (see Fig. 1 for a map) from 1 April 2017 to 31 March 2018. The air quality in northern Taiwan exhibited significant seasonal variations, depending on the origins of polluted air masses. The EA continental pollution outbreaks dominated during the seasons of winter monsoons, whereas local pollution associated with southerly flows affected the study site, particularly during summer (Chou et al., 2017). Therefore, this station provides an ideal platform for studies on the aerosol hygroscopicity and CCN activity under the influence of various pollution sources. Further detailed information about the CAFÉ station can be found in Chou et al. (2017).
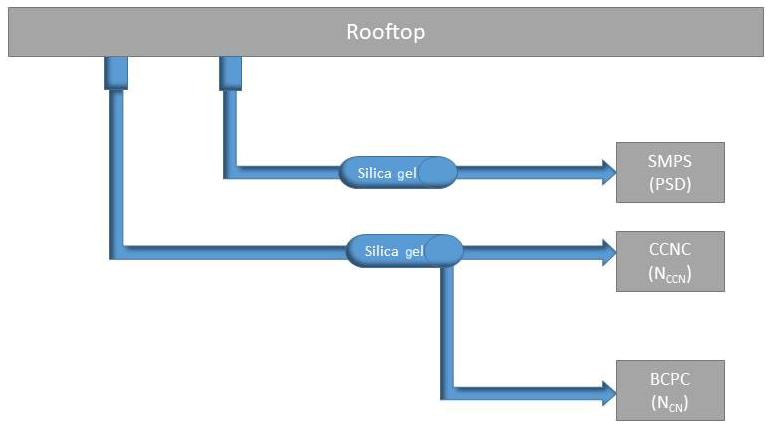
The aerosol sampling inlets were located on the rooftop of the station, and ambient air was drawn into the instruments through conductive tubing. Figure 2 illustrates the schematic of aerosol sampling. Two inlets were deployed for aerosol sampling and were equipped with diffusion dryers filled with silica gel to reduce RH. One of the inlets was for a particle size distribution measurement (13–736 nm), which was carried out by a scanning mobility particle sizer (SMPS, TSI Inc.). The SMPS system consisted of an electrostatic classifier (TSI 3080) with long-differential mobility analyzer (TSI 3081) and a water-based condensation particle counter (WCPC; TSI 3786). The sheath and sample flow rates were 3 and 0.6 L min−1, respectively, and the sample time interval was 5 min. The accuracy of particle sizing was checked using polystyrene latex spheres (PSLs). The nominal diameters of the PSLs were 97±3 nm (part no. 3100A, Thermo Scientific Inc.) and 240±5 nm (part no. 3240A, Thermo Scientific Inc.). The averaged modes of the PSLs measured by the SMPS were found to be 100±2.1 and 232.9±0 nm, respectively, and the differences from the nominal diameters were within 3 %. Multiple charge and diffusion loss corrections were applied to the particle size distribution data using the internal algorithm from the Aerosol Instrument Manager software. Furthermore, diffusion loss in the sampling tube was corrected according to the algorithm proposed by Holman (1972). The nucleation, Aitken and accumulation modes particle number concentrations were represented by N30 ( nm), N30−100 () and N100−736 (), respectively.
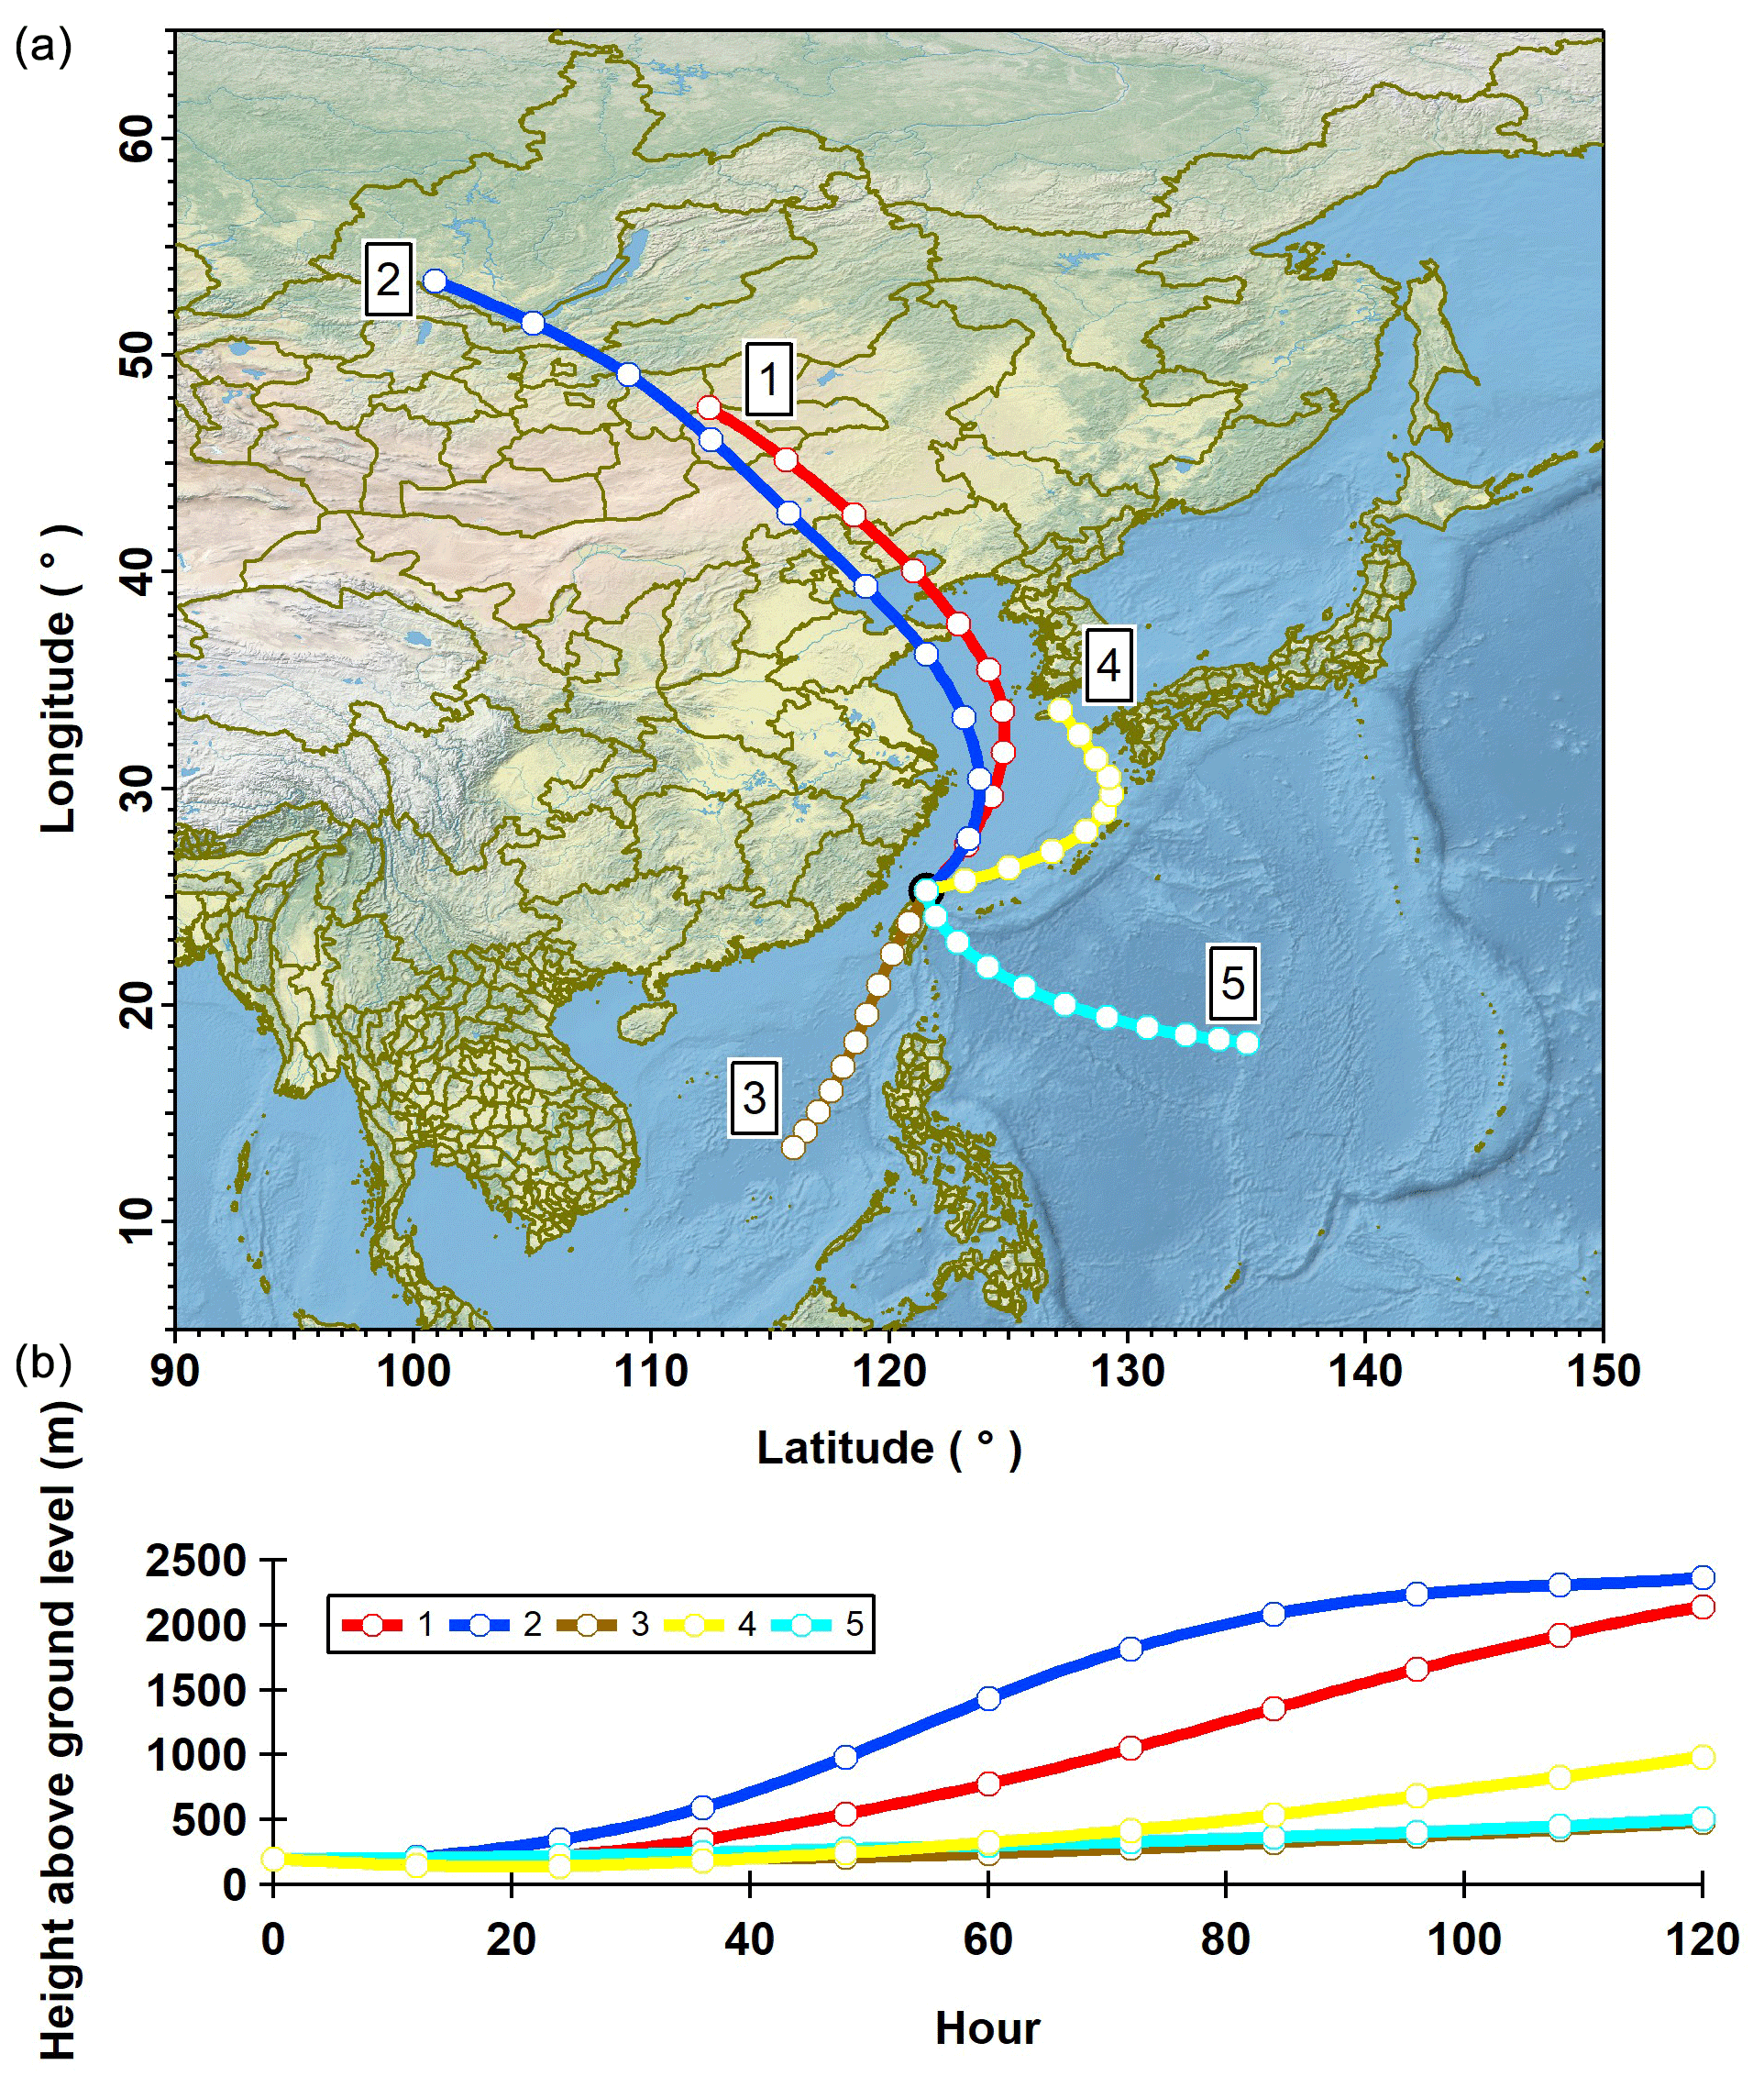
Figure 3Cluster classification of 120 h back trajectories during measurement period (upper panel), and air mass heights are shown in the graph below. Air masses with both clusters 1 and 2 originated in the inland regions of the Asian continent, but the movement of cluster 2 air masses was faster and from a higher elevation. Air masses in cluster 4 were pushed by a high-pressure system towards the south of the Korean Peninsula and Japan and then moved along the marine boundary slowly before reaching the CAFÉ station, while clusters 3 and 5 represent air masses that originated in the South China Sea and remote Pacific region, respectively. The data for the back-trajectory plot overlaid on the map are obtained from the HYSPLIT model of NOAA. The digital map (in panel a) is generated using Igor Pro 6.37 (© WaveMetrics).
The sample air from another inlet split into two streams for the CCN (NCCN) and total particle number concentrations (NCN) measurements, respectively, which were used to calculate the CCN activation ratio (AR). The instruments for the NCCN and NCN measurements were the cloud condensation nuclei counter (CCNC; CCNC-100, DMT Inc.) and butanol-based condensation particle counter (BCPC; TSI 3022, TSI Inc.). The calibrated supersaturation (SS) condition setting of the CCN counter was periodically changed from 0.12±0.044, 0.28±0.015, 0.54±0.002 to 0.80±0.067 % with a time interval of 21, 13, 13 and 13 min (a total of 1 h for each cycle). Since the CCNC needs several minutes to stabilize after changing the SS setting, only the last 5 min data were used for the kappa calculation. The flow rates for the CCNC and BCPC instruments were 0.5 and 0.3 L min−1, respectively, which were checked routinely during sampling periods by the DryCal flow calibrator (Defender 520, Mesa Labs Inc.). The flow ratio between the sheath and sample flow of CCNC was maintained at 10±0.3.
The SS calibration of the CCN counter was conducted using ammonium sulfate particles at the start, middle and end of the campaign. Since the counting efficiencies of CCNC were lower than BCPC, the maximum activated fraction of NCCN∕NCN would be smaller than 1. Therefore, the activation diameters used to calculate the SS values were determined by using half of the maximum activated fraction of NCCN∕NCN (Rose et al., 2010). The operation of the CCNC adopted in this study is referred to in Lance et al. (2006). It should be noted that the CCNC malfunctioned beginning in August 2017, and sampling was resumed in October 2017. Hence, data were not available during that period.
PM2.5 samples were collected by two sequential sampling systems (PNS 18-3.1DM, Comde-Derenda GmbH), and both samplers were equipped with a PM2.5 sharp-cut cyclone with a 16.7 L min−1 sampling flow rate. One sampler was equipped with Teflon filters which were used for the analysis of soluble ions (i.e., Na+, , K+, Mg2+, Ca2+, Cl−, and ) using an ion chromatograph (IC). Another sampler was equipped with quartz filters which were used for analysis of carbonaceous components (i.e., organic carbon – OC – and elemental carbon – EC) using a DRI-2001A carbonaceous aerosol analyzer with the alternative thermal protocol of the US Interagency Monitoring of Protected Visual Environments (IMPROVE_A; Chow et al., 2007). Details of the in-lab analysis are as described previously (Salvador and Chou, 2014). The sampling duration of each sample set was from 08:00 to 08:00 LT (24 h), and in total 282 samples were collected during the entire sampling period. Moreover, to assist the data interpretation, the hourly average mass concentration of PM2.5, the mixing ratio of trace gases (i.e., CO, O3, SO2 and NO2) and the meteorological parameters (i.e., wind direction and speed) reported from the air quality station of the Taiwan EPA that co-located with the CAFÉ station were analyzed in this study.
2.2 Data processing and analysis for aerosol hygroscopicity
Firstly, the NCCN and NCN data were synchronized into 5 min averages which matched the time interval for particle size distribution data measured by SMPS. The CCN activation ratio, i.e., the ratio of NCCN to NCN, was calculated for a given SS condition. Assuming that the particles were a homogeneous internal mixture, that large particles were activated first and that the number of particles out of the measured particle size range was negligible in NCCN, the cut-off diameter (Dcut) required for the CCN activation with the AR was calculated from Eq. (1) (Hung et al., 2014).
The corresponding kappa (κcut) was then calculated by Eq. (2), which represents the effective average hygroscopicity of CCN-active particles in the size range above Dcut (Rose et al., 2010).
The value of κ was determined by inserting the Dcut for D and varying both κ and the droplet diameter, Dwet, until the saturation ratio, s, was equivalent at the same time to the prescribed supersaturation, S, and to the maximum of a Kohler model curve of CCN activation. This is where S is the water saturation (), σS∕W is the solution surface tension (0.072 J m−2), ρW is the water density (997 kg m−3), MW is the molecular weight of water (0.018 kg mol−1), R is the universal gas constant (8.314 ) and T is 298.15 K. It should be noted that the kappa value calculated by the cut-off diameter is an alternative approach by using integrated CCN concentration measurements of polydisperse aerosols and should be used with caution when comparing with the kappa values obtained by alternative approaches such as size-resolved CCN measurements in which aerosols are not polydispersed.
The kappa value is used to describe the hygroscopicity of the aerosols; for example, ammonium nitrate and ammonium sulfate have kappa values of 0.67 and 0.61, respectively, whereas it is ∼0.1–0.2 for organic species (Petters and Kreidenweis, 2007). To remove the outliers in kappa data, we defined an outlier by values larger or smaller than 1.5 times the interquartile range (IQR) as follows:
where Q1 and Q3 are the first and third quarters of kappa data and IQR is Q3 minus Q1. About 12 % of the data point has been removed according to Eq. (3).
2.3 Back-trajectory cluster analysis
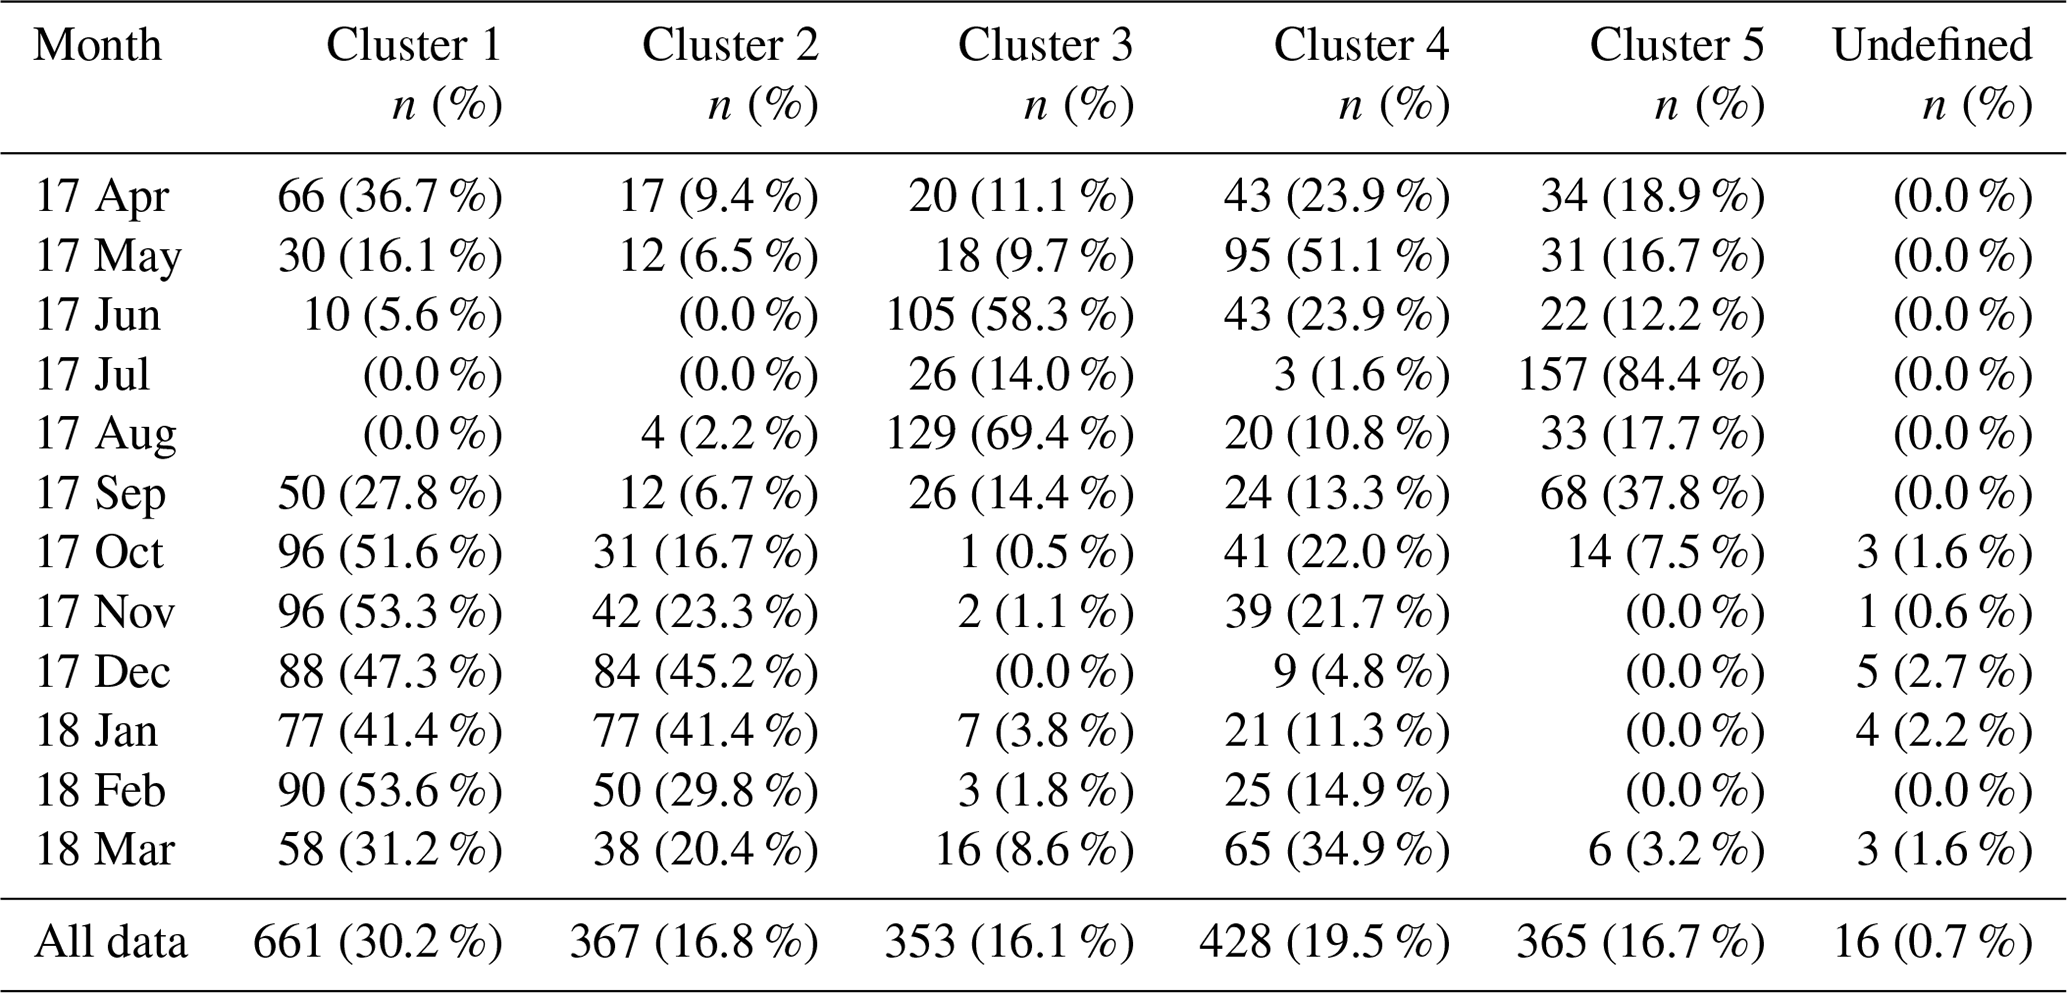
Back trajectories of 5 d of air masses were calculated every 4 h using the Hybrid Single-Particle Lagrangian Integrated Trajectory (HYSPLIT) model of the National Oceanic and Atmospheric Administration (NOAA) for the entire sampling period (Stein et al., 2015). The meteorological data used in the model were the 6-hourly Global Data Assimilation System (GDAS) archived data with a resolution of 0.5∘ in longitude and latitude. The end point of the trajectories was 200 m a.g.l. (above ground level) at the CAFÉ station. Cluster analysis was then used to group trajectories into five clusters (see Fig. 3). The air masses of clusters 1, 2 and 4 were associated with Asian continental outflows induced by the high-pressure system during the autumn to spring seasons. The air mass members of both clusters 1 and 2 were originating in the inland regions of the Asian continent, but the movement of cluster 2 air masses was faster and from higher altitudes. Air masses in cluster 4 were also induced by a high-pressure system but were moving slowly toward the Pacific Ocean and along the marine boundary before reaching the CAFÉ station. In contrast, clusters 3 and 5 include air masses originating in the Pacific areas and passing through Taiwan during warm seasons. The occurrence frequency of each cluster is listed in Table 1. The implications of origins and trajectories of air masses for CCN activation will be discussed in details in Sect. 3.2.
Table 1Statistics on the occurrence of respective air mass clusters for each month during the study period.
In the following, we first present the overall statistics of aerosol hygroscopicity and CCN activity and the seasonal and diurnal variations. Then, the features in aerosol hygroscopicity for respective air mass clusters are depicted. Finally, the implications of NPF for CCN activity will be discussed.
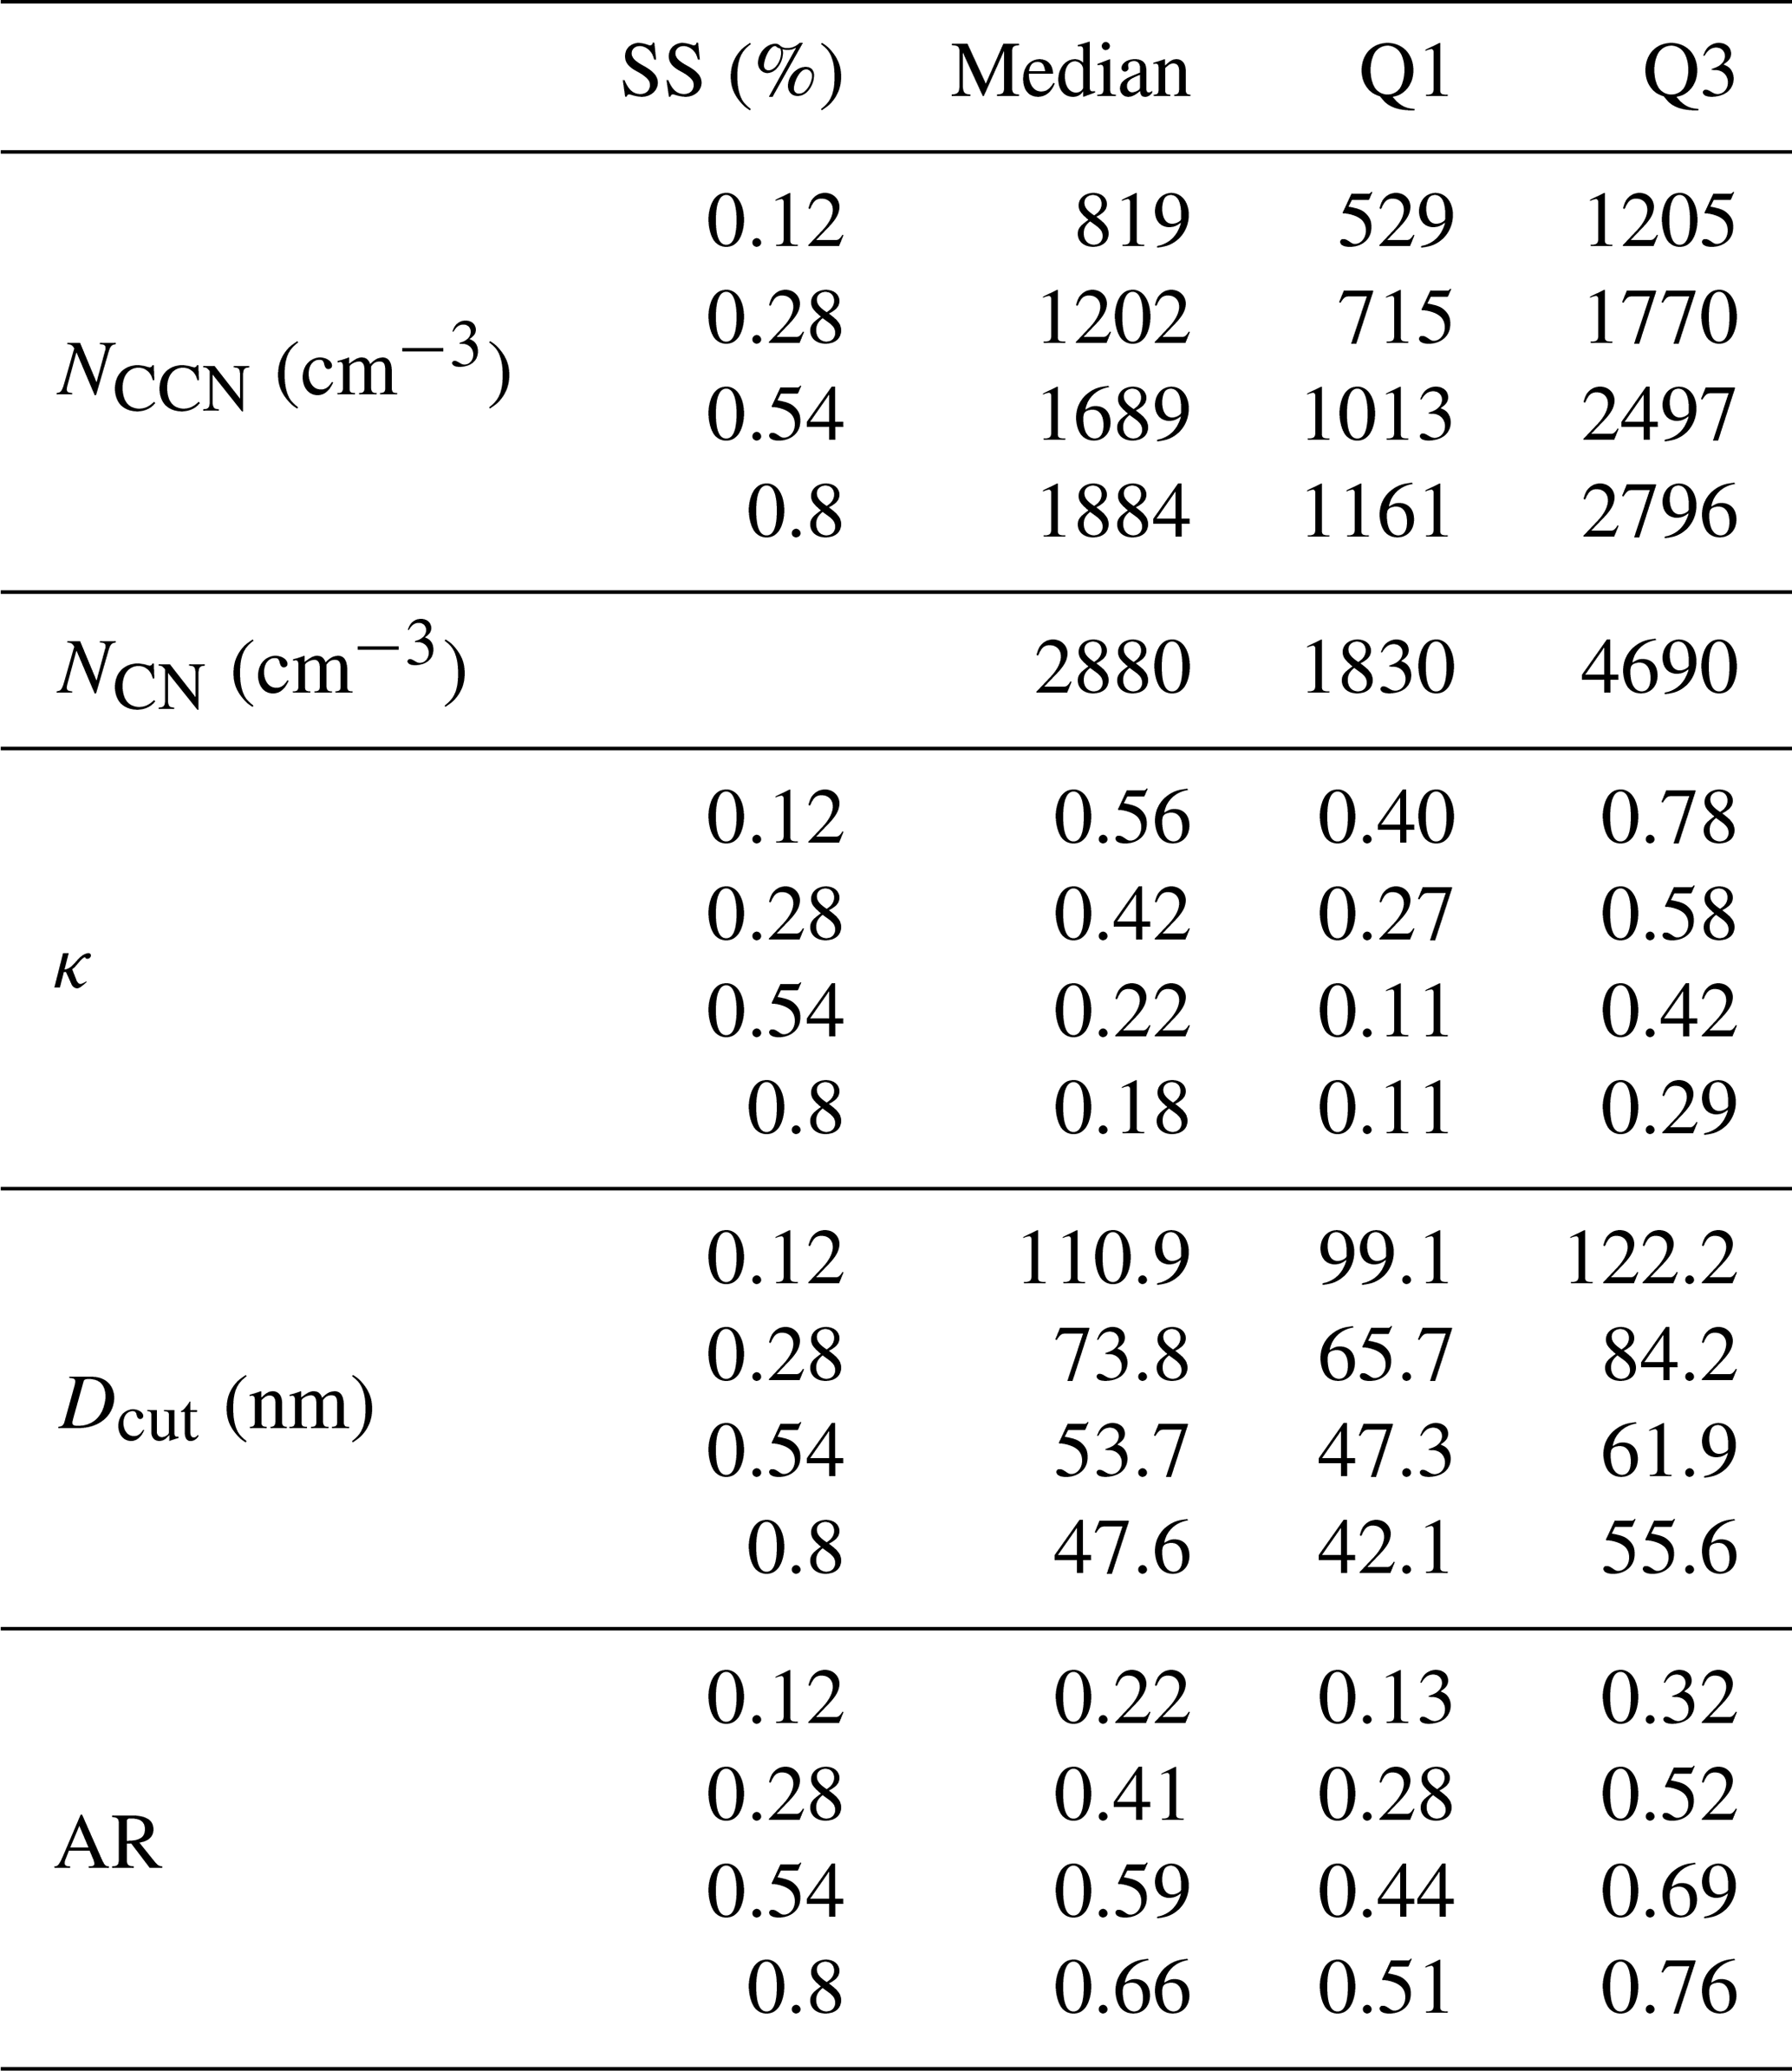
Table 2Statistics for the number concentrations of the cloud condensation nuclei (NCCN) and total particles (NCN), kappa value (κ), activation diameter (Dcut), and activation ratio (AR) under four different SS conditions during the study period.
3.1 Overall statistics for seasonal and diurnal variations of aerosol hygroscopicity
Statistics for the number concentration of cloud condensation nuclei (NCCN) and total particles (NCN) as well as for the activation ratio (AR), activation diameter (Dcut) and kappa (κ) values under specific SS conditions are summarized in Table 2. The median NCCN values ranged from 819 to 1884 cm−3 for an SS value of 0.12 %–0.80 %. The median κ values calculated for the sampling period ranged from 0.18 to 0.56 (SS of 0.12 %–0.80 %), which exhibited larger variations than that reported from coastal sites in Hong Kong SAR, China (κ of 0.28–0.39, for an SS value of 0.15 %–0.70 %; Meng et al., 2014), and in Noto Peninsula, Japan (κ of 0.19–0.37, for an SS value of 0.13 %–0.81 %; Iwamoto et al., 2016), as well as from the Asian rainforest sites at Bukit Atur, Malaysia (κ of 0.05–0.37, for an SS value of 0.11 %–0.73 %; Irwin et al., 2011). Schmale et al. (2018) summarized the results of CCN measurements reported from 12 sites on three continents. The standardized κ values at an SS value of 0.5 % were found to be 0.48, 0.41, 0.55 and 0.30 for rural-background, alpine, coastal-background and urban environmental settings, respectively. The estimated κ value at an SS value of 0.5 % was 0.35 for this study, which was significantly lower than that for coastal background and was more similar to that of urban aerosols.
The larger variations of κ values measured at the CAFÉ station compared to the results of the coastal studies at Hong Kong and Noto Peninsula, Japan (Meng et al., 2014; Iwamoto et al., 2016), may be attributed to the shorter periods of measurements in these two studies, which lasted for only 1 month in May and October, respectively, while the present study lasted for 1 year and thereby was subject to seasonal variations. Moreover, the κ values reported in these previous Asian studies were derived by size-resolved CCN data which represent the average hygroscopicity of the activated aerosols around the activation diameter (Da), while the kappa was calculated by Dcut in this study, which represents the average hygroscopicity of the aerosols above the size of Dcut. Nevertheless, the aerosol composition at the CAFÉ station are frequently influenced by local pollution from urban region and regional pollution associated with winter monsoons through different seasons, as indicated in previous studies (Chou et al., 2008, 2010, 2017); hence this explains the larger variations in κ values observed in this study. The implications of air mass history for aerosol hygroscopicity will be discussed in Sect. 3.2.
It is noteworthy that both the κ and Dcut decrease with the increase of SS. This could be due to the differences in the chemical composition of the aerosols for different size ranges, with less hygroscopic species in smaller particles and more hygroscopic species in larger ones. While the SS value increases, smaller and less hygroscopic particles have activated in the CCNC. Consequently, a smaller κ is retrieved as the cut-off diameter is adopted in the calculation (Rose et al., 2008). Previous studies on the size-resolved chemical composition of PM2.5 in northern Taiwan reported that the size distribution of aliphatic carbons peaked at 0.12–0.15 and 0.62–0.87 µm, while that for carbonyl carbons peaked only at 0.6–0.64 µm (Chou et al., 2005). Cheung et al. (2016) showed that the ultrafine particles (i.e., d<100 nm) collected from Taipei, an urban site in northern Taiwan, consisted mostly of organic matter. Moreover, Salvador et al. (2016) revealed that low-molecular-weight organic acids were abundant in the submicrometer aerosols in Taipei, Taiwan. In this context, the low hygroscopicity of small aerosols found in this study is consistent with the results of investigations on aerosol chemical composition.
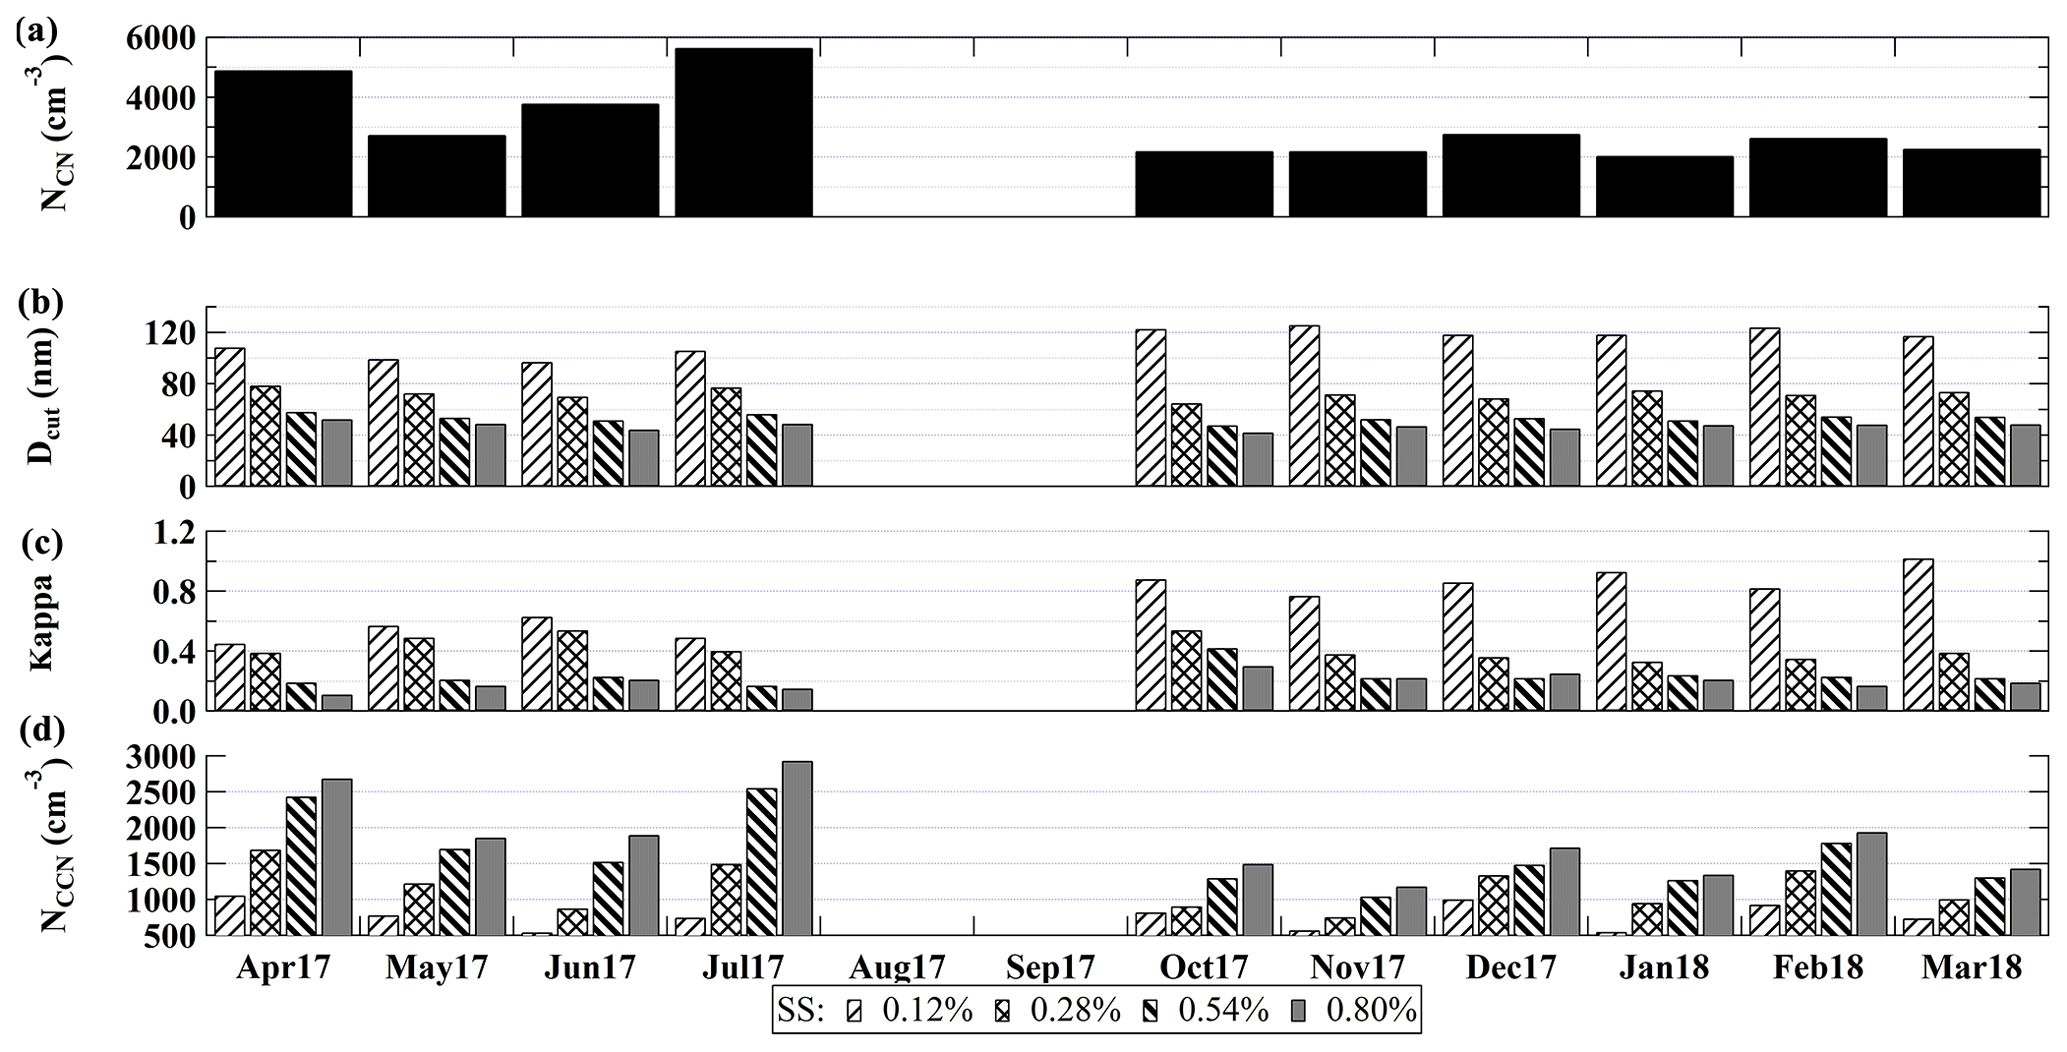
Figure 4Seasonal variations in the number concentration of total particles (NCN) and the number concentration of the cloud condensation nuclei (NCCN), kappa value (κ) and activation diameter (Dcut) measured for an SS value of 0.12 %, 0.28 %, 0.54 % and 0.80 %.
Figure 4 illustrates the monthly median of NCCN, κ and Dcut under different SS conditions and NCN for the entire campaign period. Distinct seasonal variations were observed in the measurements. Elevated levels of NCN and NCCN were observed in April (spring time) and July 2017 (summer time) (median NCN of 4960–5650 cm−3; median NCCN of 750–1060 cm−3 at an SS value of 0.12 to 2690–2930 cm−3 at an SS value of 0.80 %). During the spring and summer of 2017, NPF events were observed frequently, which induced an elevated NCN (maximum median of 5650 cm−3 in July 2017). The consistency in NCN and NCCN suggests that the particles generated by NPF processes could have contributed significantly to the increases in NCCN. On the other hand, according to the κ values, more hygroscopic particles were observed in June and October 2017. The variations of κ values could be under the influences of several mechanisms. The EA continental outflows affected the study site frequently in the seasons of EA winter monsoons, during which more inorganic aerosols could have been transported to the study site. Strong surface winds of winter monsoons could have also increased the production of sea salt particles around the coastal site and, thereby, resulted in increases in the kappa values. In addition, the uptake of hygroscopic species during particle growth and coagulation processes may influence the hygroscopicity of aerosols, which will be discussed in further details later on.
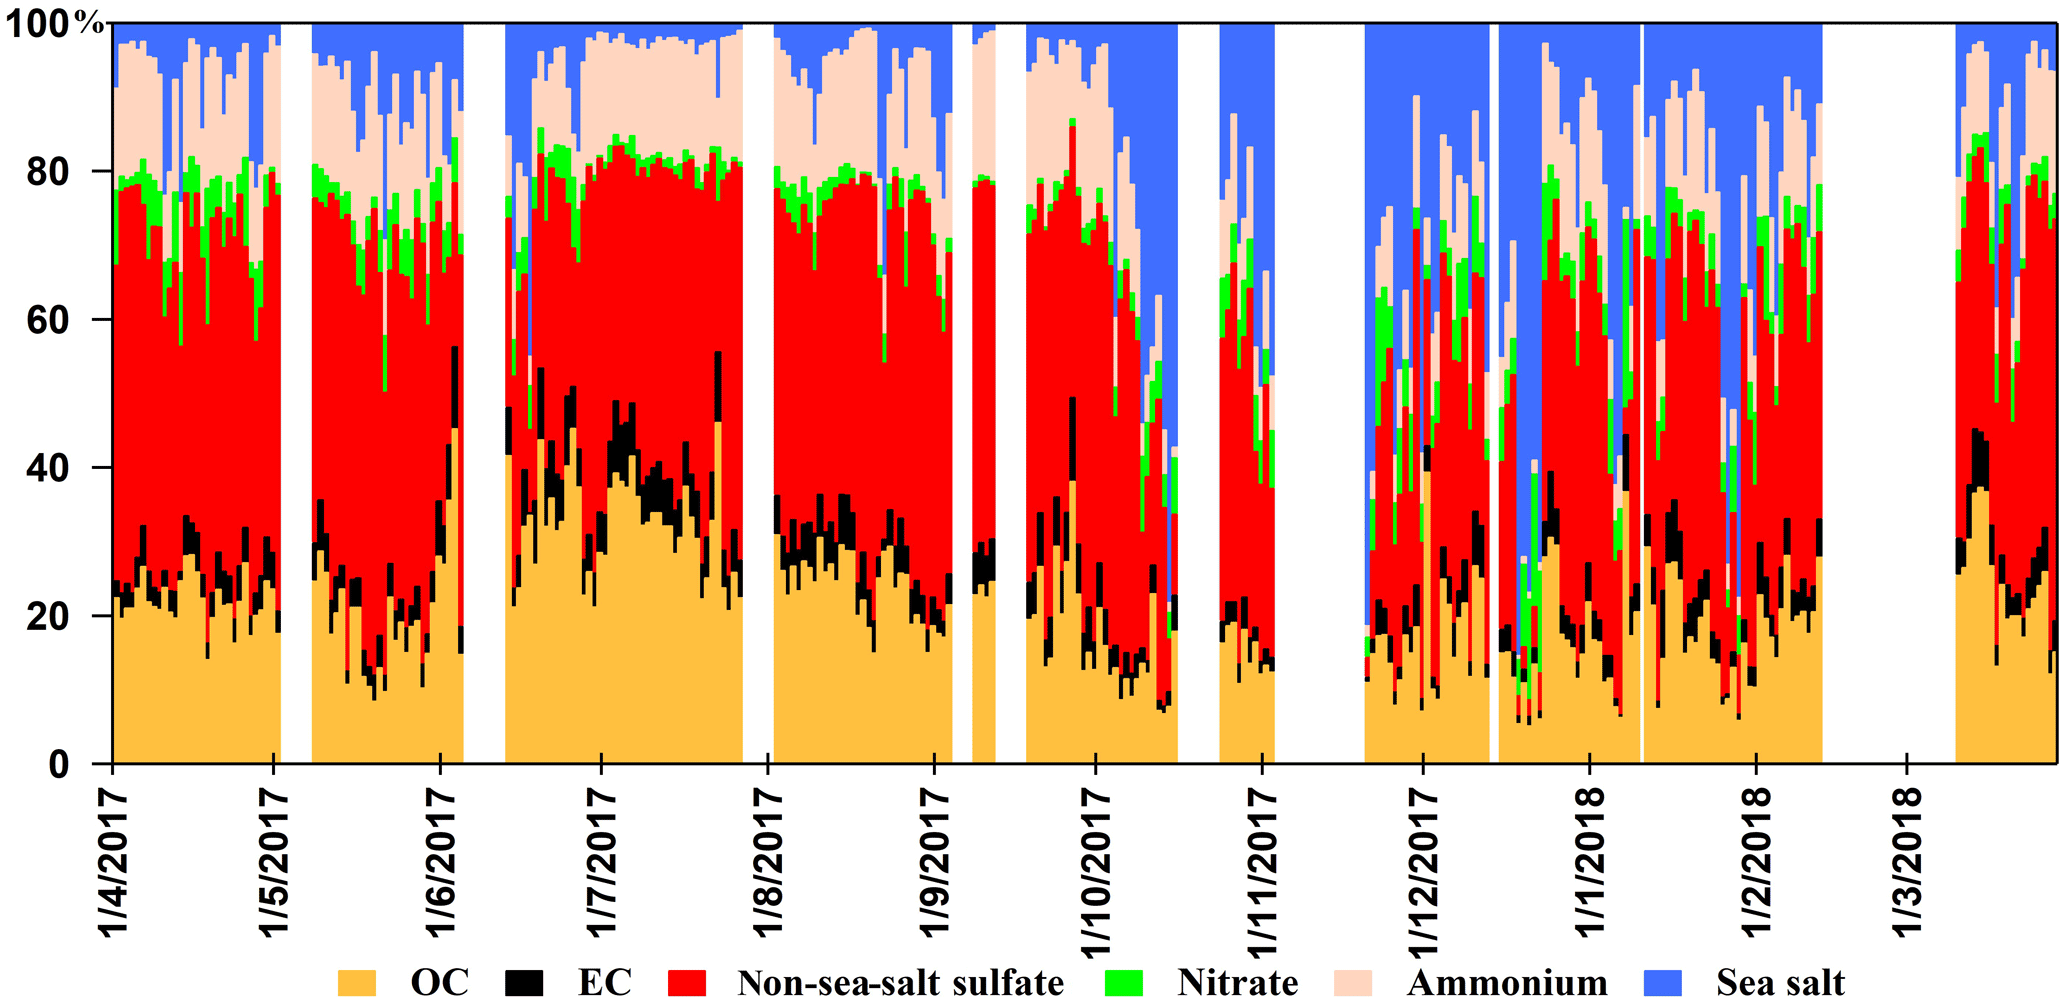
Figure 5Daily mass fraction of major PM2.5 chemical components measured during 1 April 2017–31 March 2018.
Figure 5 depicts the variations in the daily chemical composition of PM2.5, where a higher fraction of inorganic pollutants was found during April–May 2017 and February–March 2018, whereas sea salt (calculated by ) was elevated during October 2017–January 2018. The seasonality of aerosol composition was consistent with the long-term records of aerosol observation at this site (Chou et al., 2017). Petters and Kreidenweis (2007) have estimated CCN-derived κ values for inorganic and organic species, which showed that significantly higher κ values were found for major inorganics species in aerosols, such as ammonium sulfate, ammonium nitrate, sodium chloride (kappa of 0.61–1.28), while κ values for organic species were usually lower than 0.2. Thus, relatively lower kappa values observed during July–August 2017 were consistent with the PM2.5 chemical composition data in which a higher mass fraction of organic carbon was found.
3.2 Implications of different types of air masses
The air masses reaching this study site are known to be associated with the Asian continental outflows and/or with local pollution in northern Taiwan (Cheung et al., 2016). Since CO has longer atmospheric lifetime than NO2, a higher ΔCO∕ΔNO2 ratio can be used to indicate influences of aged regional air pollutants. The averaged median ΔCO∕ΔNO2 ratios for the five trajectory clusters were 76, 75, 32, 60 and 33, respectively. A higher ΔCO∕ΔNO2 ratio was found in clusters 1, 2 and 4, whereas the ΔCO∕ΔNO2 ratio of cluster 4 was found to be slightly lower than that of clusters 1 and 2. This was attributed to the differences in air mass history; the air masses of both clusters 1 and 2 originated in the inland areas of the Asian continent, whereas the air masses of cluster 4 passed through the south of the Korean Peninsula and Japan and came from the east of the CAFÉ station and, thereby, was occasionally impacted by some fresh emissions. The mixing ratio of O3, a typical secondary pollutant, provided further information about the sources of air plumes. The results showed that higher O3 levels (43–46 ppb) were found in continental outflows (i.e., clusters 1, 2 and 4) as compared to those of marine air masses (i.e., 26–28 ppb for clusters 3 and 5).
Furthermore, higher κ values were found for CCN transported with the continental outflows, which ranged from 0.16 to 0.69 for an SS value of 0.12 %–0.80 %. On the contrary, lower κ values (0.11–0.50) were found for the CCN in the air mass of clusters 3 and 5, which originated in the remote Pacific region and passed through Taiwan during summertime. This result was reasonable, since aged polluted air masses contained more inorganic species (with higher κ values), while the organic species (with lower κ values) contributed a higher fraction to the aerosol mass loading in urban areas of Taiwan (Chou et al., 2010, 2017). On the other hand, higher NCCN and NCN values were found in clusters 3 and 5 compared to clusters 1 and 2 (see Table 3). This could be due to the substantial production of new particles during warmer seasons (Cheung et al., 2013, 2016).
Table 3Statistics for the number concentration of cloud condensation nuclei (NCCN), kappa value (κ), activation diameter (Dcut), activation ratio (AR) and concentrations of major air pollutants (i.e., CO, NO2, O3 and PM2.5).


Figure 6Particle size distribution (PSD) observed for NPF and non-NPF events. Solid lines: median; shadow: first and third quartiles; dashed lines: fitted PSD.
3.3 Implications of new particle formation
As described in Sect. 3.1, large variations in NCCN and kappa values were found in summer, during which NPF events occurred frequently. An NPF event is defined as the increase of the number concentration of nucleation mode particles, and those particles are growing into Aitken and/or accumulation mode size ranges and last for a few hours until they disappear into the atmospheric condensation or coagulation sinks (Dal Maso et al., 2005). In total 53 NPF events were observed during the entire study period, among which 31 were observed in warm months (from June to September 2017). Investigations reported that NPF occurred more frequently during summer (34.6 %–42.8 %) and occasionally during spring (11.5 %) in urban areas of northern Taiwan (Cheung et al., 2013, 2016). Figure 6 illustrates the median particle size distribution for NPF and non-NPF days as well as the quartiles. The particle number concentration for NPF events was significantly higher than that for the non-NPF case. In addition, large variations were associated with the particle size range below 100 nm in NPF events, suggesting that a large amount of ultrafine particles formed.
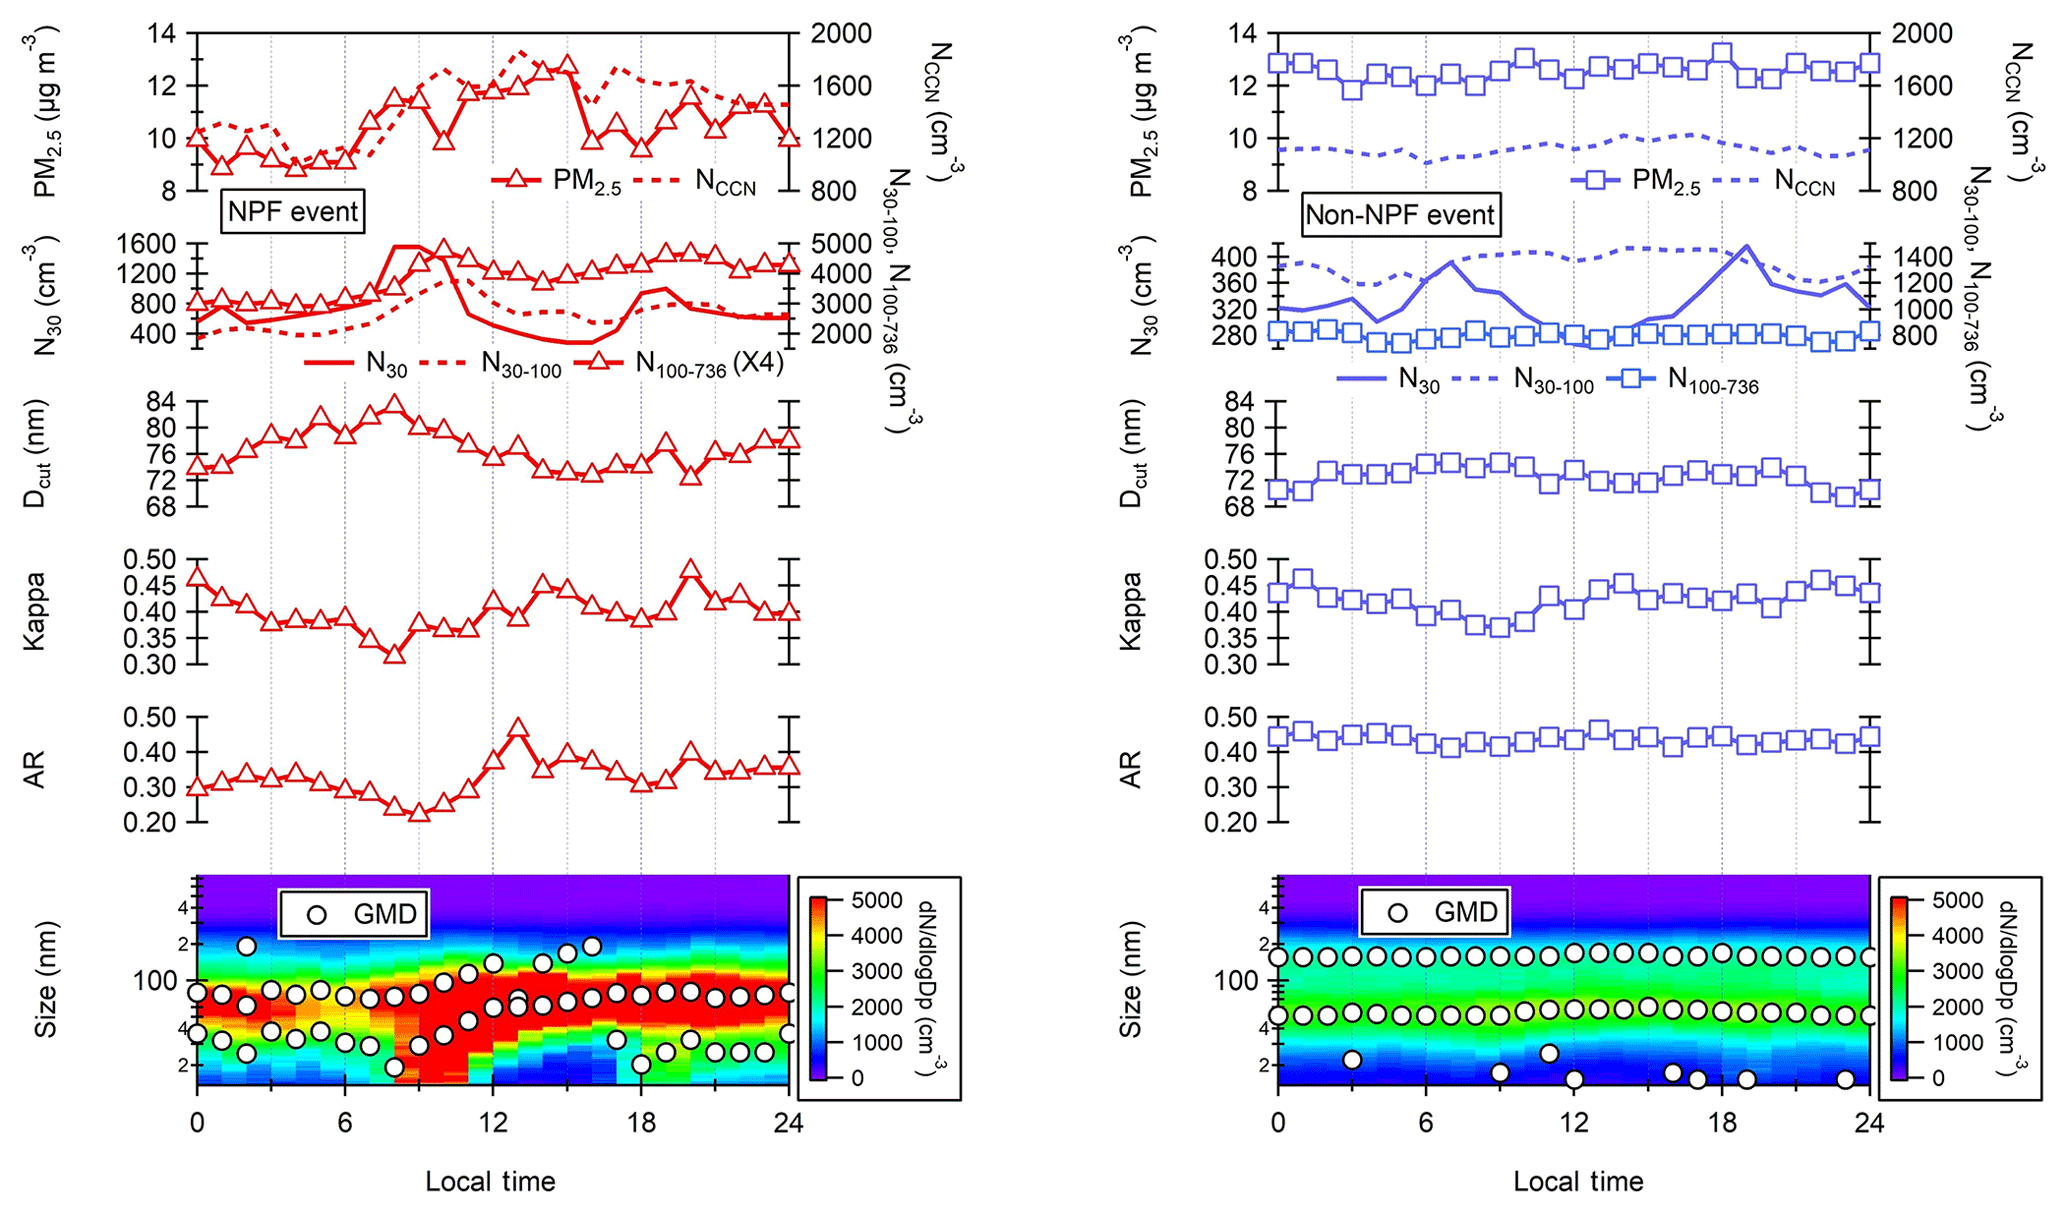
Figure 7Diurnal variations of the particle size distribution and geometric mean diameter (GMD), activation ratio (AR), kappa (κ) value, activation diameter (Dcut), particle number concentrations of N30, N30−100 and N100−736, NCN, and NCCN as well as PM2.5 for NPF and non-NPF events. CCN and related parameters were measured under an SS value of 0.28 %. GMD values were calculated based on the multiple-curve-fitting result by the DO-FIT model for which one to three modes were defined depending on the particle size distribution data.
In Fig. 7, diurnal variations in particle size distribution for NPF and non-NPF cases are presented along with the aerosol hygroscopic parameters of Dcut, κ and AR at an SS value of 0.28 %. In the plot of particle size distribution for NPF events, a banana feature (growth of particle diameter indicated by the geometric mean diameter – GMD) is obviously illustrated, which is typical for NPF process (Dal Maso et al., 2005; Cheung et al., 2011), whereas relatively stable particle size distribution exhibits for non-NPF periods with particles of 50–60 nm dominate throughout a day. On NPF days, a nucleation burst as indicated by a surge in nucleation mode particles (N30; number concentration of particle size ≤30 nm) from 06:00 to 10:00 LT is shown. Note that the number concentration of Aitken mode particles (indicated by N30−100; for particle size between 30 and 100 nm) increases consistently, implying active coagulation for the period. NCCN starts to increase around 07:00 LT. Note that the increasing rate of NCN is higher than that of NCCN, which in turn results in the decrease of AR. Note that the observed increase of CCN accompanying the growth of particles could be due to various mechanisms (e.g., vapor condensed on existing sub-CCN, coagulation between CCN processes and other oxidation processes), and the causes for the increase of CCN and the roles of NPF need to be further studied.
It was revealed that the kappa values exhibited a decreasing trend at the early stage of an NPF, which turned to an increase from 0.32 to 0.44 during the later stage (as shown in Fig. 7). A similar increase of κ values during the particle growth period was observed in a suburban region of northern China (Li et al., 2017). The κ values reached ∼0.4 after the growth process, which was likely a result of a mixture of hygroscopic species like ammonium sulfate (κ of 0.61) and organic matter (κ of 0.1–0.2). This was evidenced by the measurement of the chemical composition as shown in Fig. 5, where the PM2.5 was composed mostly of sulfate and organics, particularly during the warm months with frequent NPF events. Note that the chemical composition of ultrafine particles in urban Taipei was dominated by organic matter (Cheung et al., 2016), which generally has lower κ values. Therefore, our results indicated that these “growing” particles consisted of a mixture of sulfate and organic matter, which evidenced the influences of local (e.g., particles from vehicles emissions) and regional pollution (e.g., aged sulfate particles). In contrast, the increases in kappa during the later NPF course suggested that the “new CCN” were dominated by hygroscopic species. The field studies at North China Plain found two types of NPF events (Yue et al., 2010; Ma et al., 2016), including sulfur-rich NPF; i.e., condensation and neutralization of sulfuric acid contributed most to the growth of the new particles with high particle hygroscopicity and sulfur-poor NPF. This means that the condensation of organic compounds had a higher contribution to the growth with a lower particle hygroscopicity. Indeed, our results showed that the NPF events in northern Taiwan were characterized by elevated levels in both sulfur and organic matter (as shown in Fig. 5). In particular, the submicrometer particles in northern Taiwan were known to be enriched in sulfate (Cheung et al., 2016) and organic acids (Salvador et al., 2016).
This study presents the observation of aerosol hygroscopicity parameters, including κ, the activation diameter (Dcut) and the activation ratio () of CCN at a coastal research station (CAFÉ) in northern Taiwan during a 1-year campaign from April 2017 to March 2018. The parameters exhibited distinct seasonal variations. High levels of NCN and NCCN were consistently observed in spring and summer, whereas kappa values were elevated in autumn and minimal in summer. Measurements of the chemical composition of PM2.5 and cluster analysis of the back trajectories were deployed to elucidate the seasonality observed in the hygroscopicity of aerosols. The results of this study indicated that aerosols associated with Asian continental outflows contained more inorganic species and thereby were characterized with higher κ values, as compared to those associated with local urban pollution, which consisted substantially of organic matter.
The higher levels of NCCN and NCN found in spring and summer were attributed mainly to the NPF events which occurred frequently during warm months. Moreover, it was found that the kappa of CCN exhibited a decrease at the early stage of an NPF, which turned into an increasing trend during the later period. A two-stage hypothesis was proposed according to the results of this study for the implications of NPF for CCN activity. At the early stage of an NPF event, new particles formed, and this resulted in increases in N30 and thereby NCN, which was followed immediately by increases in the number density of Aiken mode particles (N30−100). The newly formed particles were composed mostly of organic matter, which could have “diluted” the hygroscopicity of preexisting CCN by coagulation and resulted in the decrease of kappa. In the later stage of the NPF event, as the preexisting sub-CCN particles grew up to the size of CCN, kappa increased because the sub-CCN particles consisted mostly of highly hygroscopic components.
The seasonal characteristics of hygroscopicity and CCN activity under the influence of a complex mixture of pollutants from different regional and/or local pollution sources have been presented in this study, and the impacts of NPF was demonstrated. Nevertheless, the mixing state and chemical composition of the aerosols, in particular the organic content of the sea spray aerosols, would critically influence the aerosol hygroscopicity in coastal areas. Hence further investigations are warranted to understand the atmospheric processing involved in the CCN activation, which would in turn affect cloud formation and the regional climate.
Data presented in this study are available on request by contacting Charles Chung-Kuang Chou (ckchou@gate.sinica.edu.tw) and Hing Cho Cheung (zhangqz6@mail.sysu.edu.cn).
HCC performed the instrumentation and data analysis. CCKC initiated the research program, led the research team and was in charge of the chemical analysis. CSLL participated in scientific discussions and the writing of this paper. WCK conducted data analysis for CCN. SCC was in charge of the operation of the air quality station of the Taiwan EPA. HCC prepared the paper with contributions from all co-authors.
The authors declare that they have no conflict of interest.
The authors gratefully acknowledge the logistic support and access to the station facility from the Research Center for Environmental Changes of the Academia Sinica and the financial support from the Ministry of Science and Technology of Taiwan (grant nos. 105-2111-M-001-004-MY3, 105-2811-M-001-136, 106-2811-M-001-091, 106-3114-M-001-001-A and 107-2811-M-001-1563) as well as from the Academia Sinica (grant no. AS-KPQ-106-DDPP). We also thank Tareq Hussein for providing us with the code for DO-FIT for particle size distribution fitting.
This research has been supported by the Ministry of Science and Technology of Taiwan (grant nos. 105-2111-M-001-004-MY3, 105-2811-M-001-136, 106-2811-M-001-091, 107-2811-M-001-1563 and 106-3114-M-001-001-A) and the Academia Sinica of Taiwan (grant no. AS-KPQ-106-DDPP).
This paper was edited by Aijun Ding and reviewed by four anonymous referees.
Chang, S.-C., Chou, C. C.-K., Chen, W.-N., and Lee, C.-T.: Asian dust and pollution transport – A comprehensive observation in the downwind Taiwan in 2006, Atmos. Res., 95, 19–31, https://doi.org/10.1016/j.atmosres.2009.07.012, 2010.
Cheung, H. C., Morawska, L., and Ristovski, Z. D.: Observation of new particle formation in subtropical urban environment, Atmos. Chem. Phys., 11, 3823–3833, https://doi.org/10.5194/acp-11-3823-2011, 2011.
Cheung, H. C., Chou, C. C.-K., Huang, W.-R., and Tsai, C.-Y.: Characterization of ultrafine particle number concentration and new particle formation in an urban environment of Taipei, Taiwan, Atmos. Chem. Phys., 13, 8935–8946, https://doi.org/10.5194/acp-13-8935-2013, 2013.
Cheung, H. C., Chou, C. C.-K., Chen, M.-J., Huang, W.-R., Huang, S.-H., Tsai, C.-Y., and Lee, C. S. L.: Seasonal variations of ultra-fine and submicron aerosols in Taipei, Taiwan: implications for particle formation processes in a subtropical urban area, Atmos. Chem. Phys., 16, 1317–1330, https://doi.org/10.5194/acp-16-1317-2016, 2016.
Chou, C. C.-K., Huang, S.-H., Chen, T.-K., Lin, C.-Y., and Wang, L.-C.: Size-segregated characterization of atmospheric aerosols in Taipei during Asian outflow episodes, Atmos, Res., 75, 89–109, https://doi.org/10.1016/j.atmosres.2004.12.002, 2005.
Chou, C. C.-K., Lee, C. T., Yuan, C. S., Hsu, W. C., Lin, C.-Y., Hsu, S.-C., and Liu, S. C.: Implications of the chemical transformation of Asian outflow aerosols for the long-range transport of inorganic nitrogen species, Atmos. Environ., 42, 7508–7519, https://doi.org/10.1016/j.atmosenv.2008.05.049, 2008.
Chou, C. C.-K., Lee, C. T., Cheng, M. T., Yuan, C. S., Chen, S. J., Wu, Y. L., Hsu, W. C., Lung, S. C., Hsu, S. C., Lin, C. Y., and Liu, S. C.: Seasonal variation and spatial distribution of carbonaceous aerosols in Taiwan, Atmos. Chem. Phys., 10, 9563–9578, https://doi.org/10.5194/acp-10-9563-2010, 2010.
Chou, C. C.-K., Hsu, W.-C., Chang, S.-Y., Chen, W.-N., Chen, M.-J., Huang, W.-R., Huang, S.-H., Tsai, C.-Y., Chang, S.-C., Lee, C.-T., and Liu, S.-C.: Seasonality of the mass concentration and chemical composition of aerosols around an urbanized basin in East Asia, J. Geophys. Res., 122, 2026–2042, https://doi.org/10.1002/2016JD025728, 2017.
Chow, J. C., Watson, J. G., Chen, L., Chang, M., Robinson, N. F., Trimble, D., and Kohl, S.: The IMPROVE_A temperature protocol for thermal/optical carbon analysis: maintaining consistency with a long-term database, J. Air Waste Manage. Assoc., 57, 1014–1023, https://doi.org/10.3155/1047-3289.57.9.1014, 2007.
Dal Maso, M., Kulmala, M., Riipinen, I., Wagner, R., Hussein, T., Aalto, P. P., and Lehtinen, K. E. J.: Formation and growth of fresh atmospheric aerosols eight years of aerosol size distribution data from SMEAR II, Hyytiälä, Finland, Boreal Env. Res., 10, 323–336, 2005.
Dentener, F., Kinne, S., Bond, T., Boucher, O., Cofala, J., Generoso, S., Ginoux, P., Gong, S., Hoelzemann, J. J., Ito, A., Marelli, L., Penner, J. E., Putaud, J.-P., Textor, C., Schulz, M., van der Werf, G. R., and Wilson, J.: Emissions of primary aerosol and precursor gases in the years 2000 and 1750 prescribed data-sets for AeroCom, Atmos. Chem. Phys., 6, 4321–4344, https://doi.org/10.5194/acp-6-4321-2006, 2006.
Ehn, M., Petäjä, T., Aufmhoff, H., Aalto, P., Hämeri, K., Arnold, F., Laaksonen, A., and Kulmala, M.: Hygroscopic properties of ultrafine aerosol particles in the boreal forest: diurnal variation, solubility and the influence of sulfuric acid, Atmos. Chem. Phys., 7, 211–222, https://doi.org/10.5194/acp-7-211-2007, 2007.
Gunthe, S. S., King, S. M., Rose, D., Chen, Q., Roldin, P., Farmer, D. K., Jimenez, J. L., Artaxo, P., Andreae, M. O., Martin, S. T., and Pöschl, U.: Cloud condensation nuclei in pristine tropical rainforest air of Amazonia: size-resolved measurements and modeling of atmospheric aerosol composition and CCN activity, Atmos. Chem. Phys., 9, 7551–7575, https://doi.org/10.5194/acp-9-7551-2009, 2009.
Holman, J. P.: Heat Transfer, McGraw-Hill, New York, 1972.
Hung, H.-M., Lu, W.-J., Chen, W.-N., Chang, C.-C., Chou, C. C.-K., and Lin, P.-H.: Enhancement of the hygroscopicity parameter kappa of rural aerosols in northern Taiwan by anthropogenic emissions, Atmos. Environ., 84, 78–87, https://doi.org/10.1016/j.atmosenv.2013.11.032, 2014.
Irwin, M., Robinson, N., Allan, J. D., Coe, H., and McFiggans, G.: Size-resolved aerosol water uptake and cloud condensation nuclei measurements as measured above a Southeast Asian rainforest during OP3, Atmos. Chem. Phys., 11, 11157–11174, https://doi.org/10.5194/acp-11-11157-2011, 2011.
Iwamoto, Y., Kinouchi, K., Watanabe, K., Yamazaki, N., and Matsuki, A.: Simultaneous Measurement of CCN Activity and Chemical Composition of Fine-Mode Aerosols at Noto Peninsula, Japan, in Autumn 2012, Aerosol Air Qual. Res., 16, 2107–2118, https://doi.org/10.4209/aaqr.2015.09.0545, 2016.
Khairoutdinov, M. F. and Randall, D. A.: A cloud-resolving model as a cloud parameterization in the NCAR Community Climate System Model: Preliminary results, Geophys. Res. Lett., 28, 3617–3620, https://doi.org/10.1029/2001GL013552, 2001.
Lance, S., Medina, J., Smith, J. N., and Nenes, A.: Mapping the operation of the DMT Continuous Flow CCN counter, Aerosol Sci. Technol., 40, 242–254, https://doi.org/10.1080/02786820500543290, 2006.
Lee, C. S. L., Chou, C. C.-K., Cheung, H. C., Tsai, C.-Y., Huang, W.-R., Huang, S.-H., Chen, M.-J., Liao, H.-T., Wu, C.-F., Tsao, T.-M., Tsai, M.-J., and Su, T.-C.: Seasonal variation of chemical characteristics of fine particulate matter at a high-elevation subtropical forest in East Asia, Environ. Pollut., 246, 668–677, https://doi.org/10.1016/j.envpol.2018.11.033, 2019.
Lee, S. S., Donner, L. J., and Penner, J. E.: Thunderstorm and stratocumulus: how does their contrasting morphology affect their interactions with aerosols?, Atmos. Chem. Phys., 10, 6819–6837, https://doi.org/10.5194/acp-10-6819-2010, 2010.
Leng, C., Zhang, Q., Tao, J., Zhang, H., Zhang, D., Xu, C., Li, X., Kong, L., Cheng, T., Zhang, R., Yang, X., Chen, J., Qiao, L., Lou, S., Wang, H., and Chen, C.: Impacts of new particle formation on aerosol cloud condensation nuclei (CCN) activity in Shanghai: case study, Atmos. Chem. Phys., 14, 11353–11365, https://doi.org/10.5194/acp-14-11353-2014, 2014.
Li, T.-C., Yuan, C.-S., Huang, H.-C., Lee, C.-L., Wu, S.-P., and Tong, C.: Inter-comparison of seasonal variation, chemical characteristics, and source identification of atmospheric fine particles on both sides of the Taiwan Strait, Sci. Rep.-UK, 6, 22956, https://doi.org/10.1038/srep22956, 2016.
Li, Y., Zhang, F., Li, Z., Sun, L., Wang, Z., Li, P., Sun, Y., Ren, J., Wang, Y., Cribb, M., and Yuan, C.: Influences of aerosol physiochemical properties and new particle formation on CCN activity from observation at a suburban site of China, Atmos. Res., 188, 80–89, https://doi.org/10.1016/j.atmosres.2017.01.009, 2017.
Ma, N., Zhao, C., Tao, J., Wu, Z., Kecorius, S., Wang, Z., Größ, J., Liu, H., Bian, Y., Kuang, Y., Teich, M., Spindler, G., Müller, K., van Pinxteren, D., Herrmann, H., Hu, M., and Wiedensohler, A.: Variation of CCN activity during new particle formation events in the North China Plain, Atmos. Chem. Phys., 16, 8593–8607, https://doi.org/10.5194/acp-16-8593-2016, 2016.
Massling, A., Leinert, S., Wiedensohler, A., and Covert, D.: Hygroscopic growth of sub-micrometer and one-micrometer aerosol particles measured during ACE-Asia, Atmos. Chem. Phys., 7, 3249–3259, https://doi.org/10.5194/acp-7-3249-2007, 2007.
McFiggans, G., Artaxo, P., Baltensperger, U., Coe, H., Facchini, M. C., Feingold, G., Fuzzi, S., Gysel, M., Laaksonen, A., Lohmann, U., Mentel, T. F., Murphy, D. M., O'Dowd, C. D., Snider, J. R., and Weingartner, E.: The effect of physical and chemical aerosol properties on warm cloud droplet activation, Atmos. Chem. Phys., 6, 2593–2649, https://doi.org/10.5194/acp-6-2593-2006, 2006.
Meng, J. W., Yeung, M. C., Li, Y. J., Lee, B. Y. L., and Chan, C. K.: Size-resolved cloud condensation nuclei (CCN) activity and closure analysis at the HKUST Supersite in Hong Kong, Atmos. Chem. Phys., 14, 10267–10282, https://doi.org/10.5194/acp-14-10267-2014, 2014.
Merikanto, J., Spracklen, D. V., Mann, G. W., Pickering, S. J., and Carslaw, K. S.: Impact of nucleation on global CCN, Atmos. Chem. Phys., 9, 8601–8616, https://doi.org/10.5194/acp-9-8601-2009, 2009.
Morales Betancourt, R. and Nenes, A.: Understanding the contributions of aerosol properties and parameterization discrepancies to droplet number variability in a global climate model, Atmos. Chem. Phys., 14, 4809–4826, https://doi.org/10.5194/acp-14-4809-2014, 2014.
Park, M., Yum, S. S., Kim, N., Cha, J. W., Shin, B., and Ryoo, S.-B.: Characterization of submicron aerosols and CCN over the Yellow Sea measured onboard the Gisang 1 research vessel using the positive matrix factorization analysis method, Atmos. Res., 214, 430–441, https://doi.org/10.1016/j.atmosres.2018.08.015, 2018.
Petters, M. D. and Kreidenweis, S. M.: A single parameter representation of hygroscopic growth and cloud condensation nucleus activity, Atmos. Chem. Phys., 7, 1961–1971, https://doi.org/10.5194/acp-7-1961-2007, 2007.
Pierce, J. R., Leaitch, W. R., Liggio, J., Westervelt, D. M., Wainwright, C. D., Abbatt, J. P. D., Ahlm, L., Al-Basheer, W., Cziczo, D. J., Hayden, K. L., Lee, A. K. Y., Li, S.-M., Russell, L. M., Sjostedt, S. J., Strawbridge, K. B., Travis, M., Vlasenko, A., Wentzell, J. J. B., Wiebe, H. A., Wong, J. P. S., and Macdonald, A. M.: Nucleation and condensational growth to CCN sizes during a sustained pristine biogenic SOA event in a forested mountain valley, Atmos. Chem. Phys., 12, 3147–3163, https://doi.org/10.5194/acp-12-3147-2012, 2012.
Rose, D., Gunthe, S. S., Mikhailov, E., Frank, G. P., Dusek, U., Andreae, M. O., and Pöschl, U.: Calibration and measurement uncertainties of a continuous-flow cloud condensation nuclei counter (DMT-CCNC): CCN activation of ammonium sulfate and sodium chloride aerosol particles in theory and experiment, Atmos. Chem. Phys., 8, 1153–1179, https://doi.org/10.5194/acp-8-1153-2008, 2008.
Rose, D., Nowak, A., Achtert, P., Wiedensohler, A., Hu, M., Shao, M., Zhang, Y., Andreae, M. O., and Pöschl, U.: Cloud condensation nuclei in polluted air and biomass burning smoke near the mega-city Guangzhou, China – Part 1: Size-resolved measurements and implications for the modeling of aerosol particle hygroscopicity and CCN activity, Atmos. Chem. Phys., 10, 3365–3383, https://doi.org/10.5194/acp-10-3365-2010, 2010.
Salvador, C. M. and Chou, C. C.-K.: Analysis of semi-volatile materials (SVM) in fine particulate matter, Atmos. Environ., 95, 288–295, https://doi.org/10.1016/j.atmosenv.2014.06.046, 2014.
Salvador, C. M., Ho, T.-T., Chou, C. C.-K., Chen, M.-J., Huang, W.-R., and Huang, S.-H.: Characterization of the organic matter in submicron urban aerosols using a Thermo-Desorption Proton-Transfer-Reaction Time-of-Flight Mass Spectrometer (TD-PTR-TOF-MS), Atmos. Environ., 140, 565–575, https://doi.org/10.1016/j.atmosenv.2016.06.029, 2016.
Schmale, J., Henning, S., Henzing, B., Keskinen, H., Sellegri, K., Ovadnevaite, J., Bougiatioti, A., Kalivitis, N., Stavroulas, I., Jefferson, A., Park, M., Schlag, P., Kristensson, A., Iwamoto, Y., Pringle, K., Reddington, C., Aalto, P., Aijälä, M., Baltensperger, U., Bialek, J., Birmili, W., Bukowiecki, N., Ehn, M., Fjæraa, A. M., Fiebig, M., Frank, G., Fröhlich, R., Frumau, A., Furuya, M., Hammer, E., Heikkinen, L., Herrmann, E., Holzinger, R., Hyono, H., Kanakidou, M., Kiendler-Scharr, A., Kinouchi, K., Kos, G., Kulmala, M., Mihalopoulos, N., Motos, G., Nenes, A., O'Dowd, C., Paramonov, M., Petäjä, T., Picard, D., Poulain, L., Prévôt, A. S. H., Slowik, J., Sonntag, A., Swietlicki, E., Svenningsson, B., Tsurumaru, H., Wiedensohler, A., Wittbom, C., Ogren, J. A., Matsuki, A., Yum, S. S., Myhre, C. L., Carslaw, K., Stratmann, F., and Gysel, M.: Collocated observations of cloud condensation nuclei, particle size distributions, and chemical composition, Sci. Data, 4, 170003, https://doi.org/10.1038/sdata.2017.3, 2017.
Schmale, J., Henning, S., Decesari, S., Henzing, B., Keskinen, H., Sellegri, K., Ovadnevaite, J., Pöhlker, M. L., Brito, J., Bougiatioti, A., Kristensson, A., Kalivitis, N., Stavroulas, I., Carbone, S., Jefferson, A., Park, M., Schlag, P., Iwamoto, Y., Aalto, P., Äijälä, M., Bukowiecki, N., Ehn, M., Frank, G., Fröhlich, R., Frumau, A., Herrmann, E., Herrmann, H., Holzinger, R., Kos, G., Kulmala, M., Mihalopoulos, N., Nenes, A., O'Dowd, C., Petäjä, T., Picard, D., Pöhlker, C., Pöschl, U., Poulain, L., Prévôt, A. S. H., Swietlicki, E., Andreae, M. O., Artaxo, P., Wiedensohler, A., Ogren, J., Matsuki, A., Yum, S. S., Stratmann, F., Baltensperger, U., and Gysel, M.: Long-term cloud condensation nuclei number concentration, particle number size distribution and chemical composition measurements at regionally representative observatories, Atmos. Chem. Phys., 18, 2853–2881, https://doi.org/10.5194/acp-18-2853-2018, 2018.
Seinfeld, J. H. and Pandis, S. N.: Atmospheric Chemistry and Physics: from air pollution to climate change, John Wiley & Sons, New York, 1998.
Seinfeld, J. H., Bretherton, C., Carslaw, K. S., Coe, H., DeMott, P. J., Dunlea, E. J., Feingold, G., Ghan, S., Guenther, A. B., Kahn, R., Kraucunas, I., Kreidenweis, S. M., Molina, M. J., Nenes, A., Penner, J. E., Parther, K. A., Ramanathan, V., Ramaswamy, V., Rasch, P. J., Ravishankara, A. R., Rosenfeld, D., Stephens, G., and Wood, R.: Improving our fundamental understanding of the role of aerosol-cloud interactions in the climate system, P. Natl. Acad. Sci. USA, 113, 5781–5790, https://doi.org/10.1073/pnas.1514043113, 2016.
Stein, A. F., Draxler, R. R., Rolph, G. D., Stunder, B. J. B., Cohen, M. D., and Ngan, F.: NOAA's HYSPLIT atmospheric transport and dispersion modeling system, B. Am. Meteorol. Soc., 96, 2059–2077, https://doi.org/10.1175/BAMS-D-14-00110.1, 2015.
Streets, D. G., Bond, T. C., Carmichael, G. R., Fernandes, S. D., Fu, Q., He, D., Klimont, Z., Nelson, S. M., Tsai, N. Y., Wang, M. Q., Woo, J.-H., and Yarber, K. F.: An inventory of gaseous and primary aerosol emissions in Asia in the year 2000, J. Geophys. Res., 108, 8809, https://doi.org/10.1029/2002JD003093, 2003.
Wu, Z. J., Zheng, J., Shang, D. J., Du, Z. F., Wu, Y. S., Zeng, L. M., Wiedensohler, A., and Hu, M.: Particle hygroscopicity and its link to chemical composition in the urban atmosphere of Beijing, China, during summertime, Atmos. Chem. Phys., 16, 1123–1138, https://doi.org/10.5194/acp-16-1123-2016, 2016.
Yue, D. L., Hu, M., Zhang, R. Y., Wang, Z. B., Zheng, J., Wu, Z. J., Wiedensohler, A., He, L. Y., Huang, X. F., and Zhu, T.: The roles of sulfuric acid in new particle formation and growth in the mega-city of Beijing, Atmos. Chem. Phys., 10, 4953–4960, https://doi.org/10.5194/acp-10-4953-2010, 2010.
Yue, D. L., Hu, M., Zhang, R. J., Wu, Z. J., Su, H., Wang, Z. B., Peng, J. F., He, L. Y., Huang, X. F., Gong, Y. G., and Wiedensohler, A.: Potential contribution of new particle formation to cloud condensation nuclei in Beijing, Atmos. Environ., 45, 6070–6077, https://doi.org/10.1016/j.atmosenv.2011.07.037, 2011.
Zhang, Q., Streets, D. G., Carmichael, G. R., He, K. B., Huo, H., Kannari, A., Klimont, Z., Park, I. S., Reddy, S., Fu, J. S., Chen, D., Duan, L., Lei, Y., Wang, L. T., and Yao, Z. L.: Asian emissions in 2006 for the NASA INTEX-B mission, Atmos. Chem. Phys., 9, 5131–5153, https://doi.org/10.5194/acp-9-5131-2009, 2009.