the Creative Commons Attribution 4.0 License.
the Creative Commons Attribution 4.0 License.
 | 15 May 2020
Deposition, recycling, and archival of nitrate stable isotopes between the air–snow interface: comparison between Dronning Maud Land and Dome C, Antarctica
V. Holly L. Winton
Alison Ming
Nicolas Caillon
Lisa Hauge
Anna E. Jones
Joel Savarino
Markus M. Frey
The nitrogen stable isotopic composition in nitrate (δ15N-) measured in ice cores from low-snow-accumulation regions in East Antarctica has the potential to provide constraints on past ultraviolet (UV) radiation and thereby total column ozone (TCO) due to the sensitivity of nitrate () photolysis to UV radiation. However, understanding the transfer of reactive nitrogen at the air–snow interface in polar regions is paramount for the interpretation of ice core records of δ15N- and mass concentrations. As undergoes a number of post-depositional processes before it is archived in ice cores, site-specific observations of δ15N- and air–snow transfer modelling are necessary to understand and quantify the complex photochemical processes at play. As part of the Isotopic Constraints on Past Ozone Layer Thickness in Polar Ice (ISOL-ICE) project, we report new measurements of mass concentration and δ15N- in the atmosphere, skin layer (operationally defined as the top 5 mm of the snowpack), and snow pit depth profiles at Kohnen Station, Dronning Maud Land (DML), Antarctica. We compare the results to previous studies and new data, presented here, from Dome C on the East Antarctic Plateau. Additionally, we apply the conceptual 1D model of TRansfer of Atmospheric Nitrate Stable Isotopes To the Snow (TRANSITS) to assess the impact of recycling on δ15N- and mass concentrations archived in snow and firn. We find clear evidence of photolysis at DML and confirmation of previous theoretical, field, and laboratory studies that UV photolysis is driving recycling and redistribution at DML. Firstly, strong denitrification of the snowpack is observed through the δ15N- signature, which evolves from the enriched snowpack (−3 ‰ to 100 ‰), to the skin layer (−20 ‰ to 3 ‰), to the depleted atmosphere (−50 ‰ to −20 ‰), corresponding to mass loss of from the snowpack. Based on the TRANSITS model, we find that is recycled two times, on average, before it is archived in the snowpack below 15 cm and within 0.75 years (i.e. below the photic zone). Mean annual archived δ15N- and mass concentration values are 50 ‰ and 60 ng g−1, respectively, at the DML site. We report an e-folding depth (light attenuation) of 2–5 cm for the DML site, which is considerably lower than Dome C. A reduced photolytic loss of at DML results in less enrichment of δ15N- than at Dome C mainly due to the shallower e-folding depth but also due to the higher snow accumulation rate based on TRANSITS-modelled sensitivities. Even at a relatively low snow accumulation rate of 6 cm yr−1 (water equivalent; w.e.), the snow accumulation rate at DML is great enough to preserve the seasonal cycle of mass concentration and δ15N-, in contrast to Dome C where the depth profiles are smoothed due to longer exposure of surface snow layers to incoming UV radiation before burial. TRANSITS sensitivity analysis of δ15N- at DML highlights that the dominant factors controlling the archived δ15N- signature are the e-folding depth and snow accumulation rate, with a smaller role from changes in the snowfall timing and TCO. Mean TRANSITS model sensitivities of archived δ15N- at the DML site are 100 ‰ for an e-folding depth change of 8 cm, 110 ‰ for an annual snow accumulation rate change of 8.5 cm yr−1 w.e., 10 ‰ for a change in the dominant snow deposition season between winter and summer, and 10 ‰ for a TCO change of 100 DU (Dobson units). Here we set the framework for the interpretation of a 1000-year ice core record of δ15N- from DML. Ice core δ15N- records at DML will be less sensitive to changes in UV than at Dome C; however the higher snow accumulation rate and more accurate dating at DML allows for higher-resolution δ15N- records.
- Article
(4598 KB) -
Supplement
(1921 KB) - BibTeX
- EndNote


Nitrate () is a naturally occurring ion and plays a major role in the global nitrogen cycle. It is one of the most abundant ions in Antarctic snow and is commonly measured in ice cores (e.g. Wolff, 1995). Nitrate in polar ice provides constraints on past solar activity (Traversi et al., 2012), sources, and the oxidative capacity of the atmosphere (Geng et al., 2017; Mulvaney and Wolff, 1993; Hastings et al., 2009, 2004; McCabe et al., 2007; Savarino et al., 2007; Morin et al., 2008). However, is a nonconservative ion in snow, and due to post-depositional processes (e.g. Mulvaney et al., 1998; Zatko et al., 2016), the interpretation of mass concentration records from ice core records is challenging (Erbland et al., 2015). The recent development of the analysis of the nitrogen isotopic composition of (δ15N-) in snow, ice, and aerosol provides a powerful means to understand the sources and processes involved in post-depositional processes, i.e. recycling at the interface between air and snow.
Primary sources of reactive nitrogen species to the Antarctic lower atmosphere and snowpack include the sedimentation of polar stratospheric clouds (PSCs) in late winter (Savarino et al., 2007), in addition to tropospheric transport of inorganic from lightning, biomass burning and soil emissions (Lee et al., 2014), and, to a minor extent, advection of oceanic organic nitrate such as methyl nitrate (CH3NO3) and peroxyacyl nitrates (PAN) (Jacobi et al., 2000; Jones et al., 1999; Beyersdorf et al., 2010). In the stratosphere, is produced through the stratospheric oxidation of nitrous oxide (N2O) from extraterrestrial fluxes of energetic particles and solar radiation (Savarino et al., 2007; Wolff, 1995; Wagenbach et al., 1998). A local secondary source of reactive nitrogen (nitrous acid, HONO, and nitrogen oxides, NOx) originates from post-depositional processes driven by sunlight, leading to re-emission from the snowpack and subsequent deposition to surface snow (Jones et al., 2001; Honrath et al., 1999; Oncley et al., 2004; Frey et al., 2009; Savarino et al., 2007; Mulvaney et al., 1998).
Local NOx emissions, produced from photolysis in polar regions, are expected to have a lifetime in the polar troposphere of <1 d before they are oxidized to nitric acid (HNO3) at Dome C and South Pole station (Davis et al., 2004b). Nitrate photolysis occurs at wavelengths (λ) of 290–345 nm with a maximum at 320 nm. Photolysis rate (J) depends on the adsorption cross section of , the quantum yield, and actinic flux within the snowpack. Photochemical production of nitrogen dioxide (NO2) is dependent on the mass concentration in the snowpack, the snowpack properties, and the intensity of solar radiation within the snowpack. The last of which is sensitive to solar zenith angle and snow optical properties, i.e. scattering and adsorption coefficients, which depend on snow density and morphology, and the light-absorbing impurity content (e.g. dust and black carbon) (France et al., 2011; Erbland et al., 2015; Zatko et al., 2013). Model results from Zatko et al. (2016) suggest that the range of modelled NOx fluxes from the snowpack to the overlaying air are similar in both polar regions due to the opposing effects of higher concentrations of both photolabile and light-absorbing impurities in Antarctica and Greenland, respectively. At Dome C, the light penetration depth (e-folding depth) is ∼10 cm for windpack layers and ∼20 cm for hoar layers (France et al., 2011). Based on the propagation of light into the snowpack, the snowpack can be divided into three layers. The first layer is known as the skin layer (5 mm thick), where direct solar radiation is converted into diffuse radiation. The second layer is called the active photic zone (below the skin layer), where solar radiation is effectively diffuse, and the intensity of the radiation decays exponentially (Warren, 1982). The third layer is called the archived zone (below the active photic zone), where no photochemistry occurs.
Previous research has focused predominantly at Dome C on the high-elevation polar plateau. Here, the exponential decay of mass concentrations in the snowpack were attributed to either evaporation or ultraviolet (UV) photolysis (Röthlisberger et al., 2000, 2002). The open debate of which post-depositional process controlled mass concentrations in the snowpack led to the use of a new isotopic tool, the nitrogen isotopic composition of NO3 (δ15N-; Blunier et al., 2005). More recently, theoretical (Frey et al., 2009), laboratory (Meusinger et al., 2014; Erbland et al., 2013, 2015; Shi et al., 2019; Berhanu et al., 2014), and field (Erbland et al., 2013; Frey et al., 2009; Shi et al., 2015) evidence has shown that mass loss from the surface snow to the overlying atmosphere and its associated isotopic fractionation is driven by photolysis. Fractionation constants, which assume a Rayleigh single loss and irreversible process of removal from the snow between phases during evaporation–condensation processes, have been calculated to separate the isotopic signature of evaporation and photolysis processes. As this approach may oversimplify the processes occurring at the air–snow interface, Erbland et al. (2013) referred to the quantity as an “apparent” fractionation constant (15εapp). Thus, the apparent fractionation constant represents the integrated isotopic effect of the processes involving in the surface of the snowpack and in the lower atmosphere. Fractionation constants associated with laboratory studies and field observations of photolysis are large, ‰ (Berhanu et al., 2014; Meusinger et al., 2014) and ‰ (Frey et al., 2009; Erbland et al., 2013), respectively. The negative fractionation constant obtained from photolysis implies that the remaining in the skin layer snow is enriched in δ15N-. In turn, the atmosphere is left with the source of NOx that is highly depleted in δ15N-. In comparison, nitrate evaporation from the snowpack has a 15εapp of ∼0 as determined by two independent studies (Erbland et al., 2013; Shi et al., 2019). This indicates that during evaporation, the air above the snow is not replenished, and thus there is only a small mass loss. As the fractionation associated with photolytic loss is large, and the isotope effects of evaporation are negligible (Shi et al., 2019), it follows that evaporation of is negligible on high-elevation Antarctic sites (Erbland et al., 2013; Shi et al., 2019).
Year-round measurements of mass concentrations and δ15N- in the skin layer and atmosphere at Dome C have provided insights into the annual cycle in Antarctica (Fig. 1; Erbland et al., 2013). Additional to year-round troposphere transport of (Lee et al., 2014), in the early winter, the stratosphere undergoes denitrification via formation of PSCs. As PSCs sediment slowly, there is a delay between the maximum stratospheric mass concentration and the maximum mass concentration deposited in the skin layer in late winter (Mulvaney and Wolff, 1993; Savarino et al., 2007). In spring, surface UV increases and initiates photolysis-driven post-depositional processes, which redistribute between the snowpack and overlying air throughout the sunlit summer season. This results in the δ15N- isotopic enrichment of the skin layer reservoir and maximum atmospheric mass concentrations in October–November. In summer, resembles a strongly asymmetric distribution within the atmosphere–snow column, with the bulk residing in the skin layer and only a small fraction in the atmospheric column above. Furthermore, snow pit profiles display an exponential decrease in mass concentration and an enrichment in the δ15N- composition with depth, indicating that post-depositional processes significantly modify the original mass concentration and δ15N- composition there (Erbland et al., 2013; Frey et al., 2009).
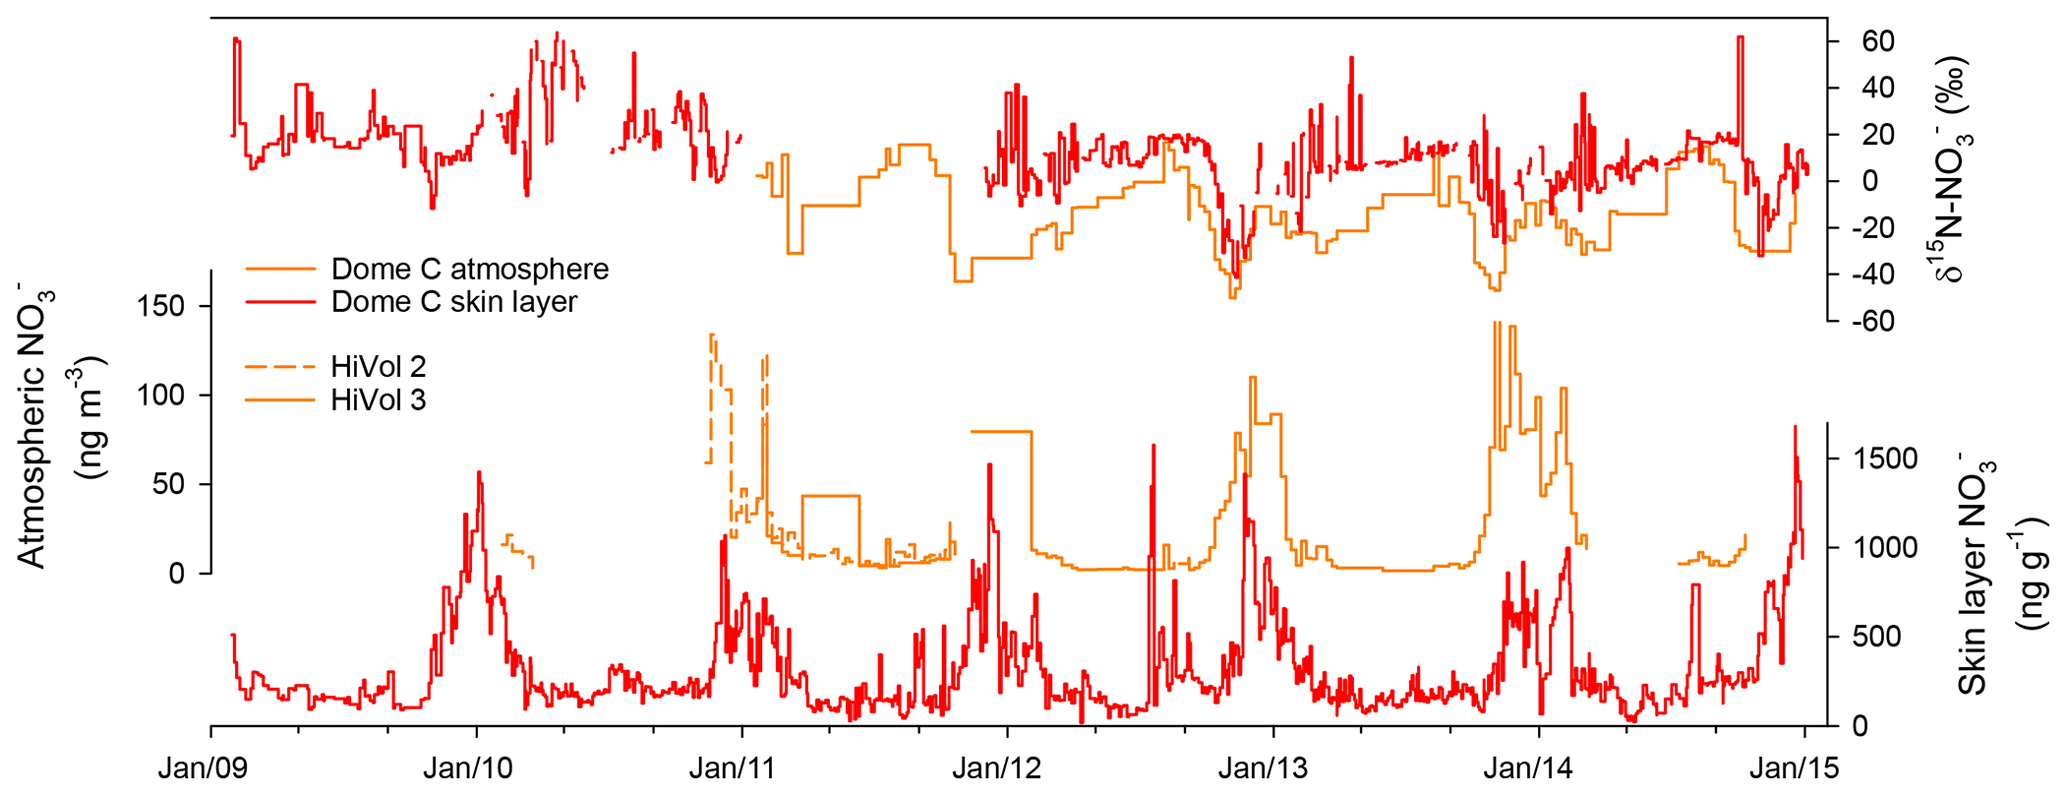
Figure 1Year-round atmospheric and skin layer mass concentration and δ15N- at Dome C. Two high-volume aerosol samplers were used at Dome C (HiVol 2 and HiVol 3) over the campaign and showed good reproducibility. Data sources: Erbland et al. (2013) (for years 2009–2010); this study (for 2011–2015).
This research at Dome C laid the foundation for Erbland et al. (2015) to derive a conceptual model of UV-photolysis-induced post-depositional processes of at the air–snow interface. Transfer of Atmospheric Nitrate Stable Isotopes To the Snow (TRANSITS) is a conceptual multilayer 1D model which aims to represent recycling at the air–snow interface including processes relevant for snow photochemistry (UV photolysis of , emission of NOx, local re-oxidation, and deposition of HNO3) and explicitly calculates mass concentrations and δ15N- in snow. The term “ recycling” refers to the following processes. Nitrate on the surface of a snow crystal can be lost from the snowpack (Dubowski et al., 2001), either by UV photolysis or evaporation. UV photolysis produces NO, NO2, and HONO, while only HNO3 can evaporate. Both of these processes produce reactive nitrogen that can be released from snow crystal into the interstitial air and rapidly transported out of the snowpack to the overlaying air via wind pumping (Zatko et al., 2013; Jones et al., 2000, 2001; Honrath et al., 1999). Here, NO2 is either oxidized to HNO3, which undergoes wet or dry deposition back to the skin layer within a day, or transported away from the site (Davis et al., 2004a). If HNO3 is redeposited to the skin layer, it is available for photolysis and/or evaporation again. Any locally produced NO2 and that is transported away from the site of emission represents a loss of from the snowpack. Nitrate recycling can occur multiple times before is eventually archived below the active photic zone in firn/ice cores (Davis et al., 2008; Erbland et al., 2015; Zatko et al., 2016; Sofen et al., 2014).
The signal in the snowpack is dependent on the snow accumulation rate. At sites with very low snow accumulation rates (i.e. Dome C: 2.5–3 cm yr−1), is not preserved in the snowpack because snow layers remain close to the surface and in contact with the overlaying atmosphere for a relatively long time, enhancing the effect of post-depositional processes which erase the source signature of δ15N-. Three distinct transects from coastal Antarctica to the East Antarctic Plateau show that isotopic fractionation is strongest with decreasing snow accumulation (Shi et al., 2018; Erbland et al., 2013; Noro et al., 2018). Skin layer mass concentrations are significantly higher at low-snow-accumulation sites, for example ∼160 (winter) to 1400 ng g−1 (summer) at Dome C compared to 50 (winter) to 300 ng g−1 (summer) at Dumont d'Urville (DDU) on the Antarctic coast. In contrast to low-snow-accumulation sites, loss is less pronounced on the coast, and seasonal cycles of mass concentration and δ15N- are preserved in the snowpack (Shi et al., 2015; Erbland et al., 2013). Erbland et al. (2013) suggested that loss at the coast reflects both photolysis and evaporation processes, while Shi et al. (2015) proposed that loss at the coast cannot be fully explained by local post-deposition processes and that seasonal cycles in the snowpack reflect stratospheric and troposphere sources during the cold and warm seasons, respectively. Furthermore, the strong inverse linear relationship between ice core mass concentration and accumulation rate was revealed in a composite of seven ice cores across Dronning Maud Land (DML; Pasteris et al., 2014). Over longer timescales, UV-driven post-depositional processing of is also driven by changes in the degree of post-depositional loss of with greater loss during the glacial period relative to the Holocene. The observed glacial–interglacial difference in post-depositional processing of is dominated by variations in snow accumulation rate (Geng et al., 2015).
Yet, photolysis leaves its own process-specific imprint in the snowpack (Shi et al., 2019; Erbland et al., 2015, 2013), which opens up the possibility of using δ15N- to infer past surface UV variability (Frey et al., 2009). However, photolysis rates in snow depend on a number of site-specific factors as does the degree of photolytic isotopic fractionation of eventually preserved in ice cores (Erbland et al., 2013; Berhanu et al., 2014). These factors need to be quantitatively understood at a given ice core site to enable quantitative interpretation of ice core records. Here, we carry out a comprehensive study of the air–snow transfer of at Kohnen Station in DML, East Antarctica, through mass concentration and δ15N- measurements in the atmosphere, skin layer, and snow pits and compare the observations to new and published (Erbland et al., 2015, 2013; Frey et al., 2009) observations from Dome C. Published data from Dome C comprises year-round atmospheric and skin layer measurements from 2009 to 2010 (Erbland et al., 2013) and multiple snow pit profiles (Erbland et al., 2013; Frey et al., 2009). New data from Dome C encompass an extended time series at Dome C of year-round atmospheric and skin layer mass concentration and δ15N- from 2011 to 2015 (Fig. 1). Due to the previous research outlined above, we assume that the photolysis is the dominant driver of post-depositional processes and later assess the validity of this assumption (Sect. 3.3). We apply the TRANSITS model (Erbland et al., 2015) to (i) understand how mass concentrations and δ15N- values are archived in deeper snow and ice layers and (ii) investigate the sensitivity of changes in the past snow accumulation rate, snowfall timing, e-folding depth of the snow photic zone, and total column ozone (TCO) to the δ15N- signature. In order to interpret this novel UV proxy, it is paramount to understand the air–snow transfer processes specific to an ice core site and how δ15N- is archived in the deeper snow and ice layers (Geng et al., 2015; Morin et al., 2009; Erbland et al., 2015). Within the framework of the Isotopic Constraints on Past Ozone Layer Thickness in Polar Ice (ISOL-ICE) project, which aims to understand natural causes of past TCO variability, this study provides a basis for the interpretation of δ15N- from a 1000-year ice core recovered in 2016/2017 at Kohnen Station.
2.1 Study sites
The ISOL-ICE campaign was carried out at the summer-only, continental Kohnen Station where the deep European Project for Ice Coring in Antarctica (EPICA) Dronning Maud Land (EDML; S, E; 2982 m a.s.l.; https://www.awi.de/en/expedition/stations/kohnen-station.html, last access: 8 April 2019) ice core was recovered in 2001–2006 to a depth of ∼2800 m (Wilhelms et al., 2017). As part of the ISOL-ICE campaign, a new ice core (ISOL-ICE; Winton et al., 2019a) was drilled 1 km from the EDML borehole (Fig. 2a–b). In addition, the ISOL-ICE air–snow transfer study site was located ∼200 m from the EDML ice core site (Fig. 2c). Here we compare two ice core drilling sites in Antarctica: Kohnen Station (referred to as DML henceforth) and Dome C ( S, E; Fig. 2). Both sites are similar in terms of the latitude and therefore in terms of radiative forcing at the top of the atmosphere (Table 1). Satellite images of TCO over Antarctica show that the lowest annual TCO values are centred over the South Pole region encompassing DML and usually Dome C, although the spatial variability is significant from year to year (https://ozonewatch.gsfc.nasa.gov/, last access: 4 March 2019). The sites are different in terms of their location with respect to moisture source, elevation, and precipitation regime. The DML site is situated ∼550 km from the ice shelf edge, is subject to cyclonic activity, and receives ∼80 % of its precipitation from frontal clouds (Reijmer and Oerlemans, 2002). Dome C is more remote (∼1100 km from the coast), and diamond dust is the dominant form of precipitation. The annual snow accumulation rate also differs between the sites; while both sites have exceptionally low accumulation compared to the coast, DML (annual mean: 6 cm yr−1 w.e.; Hofstede et al., 2004; Sommer et al., 2000) receives more than double that of Dome C (annual mean: 2.5 cm yr−1 w.e.; Le Meur et al., 2018).
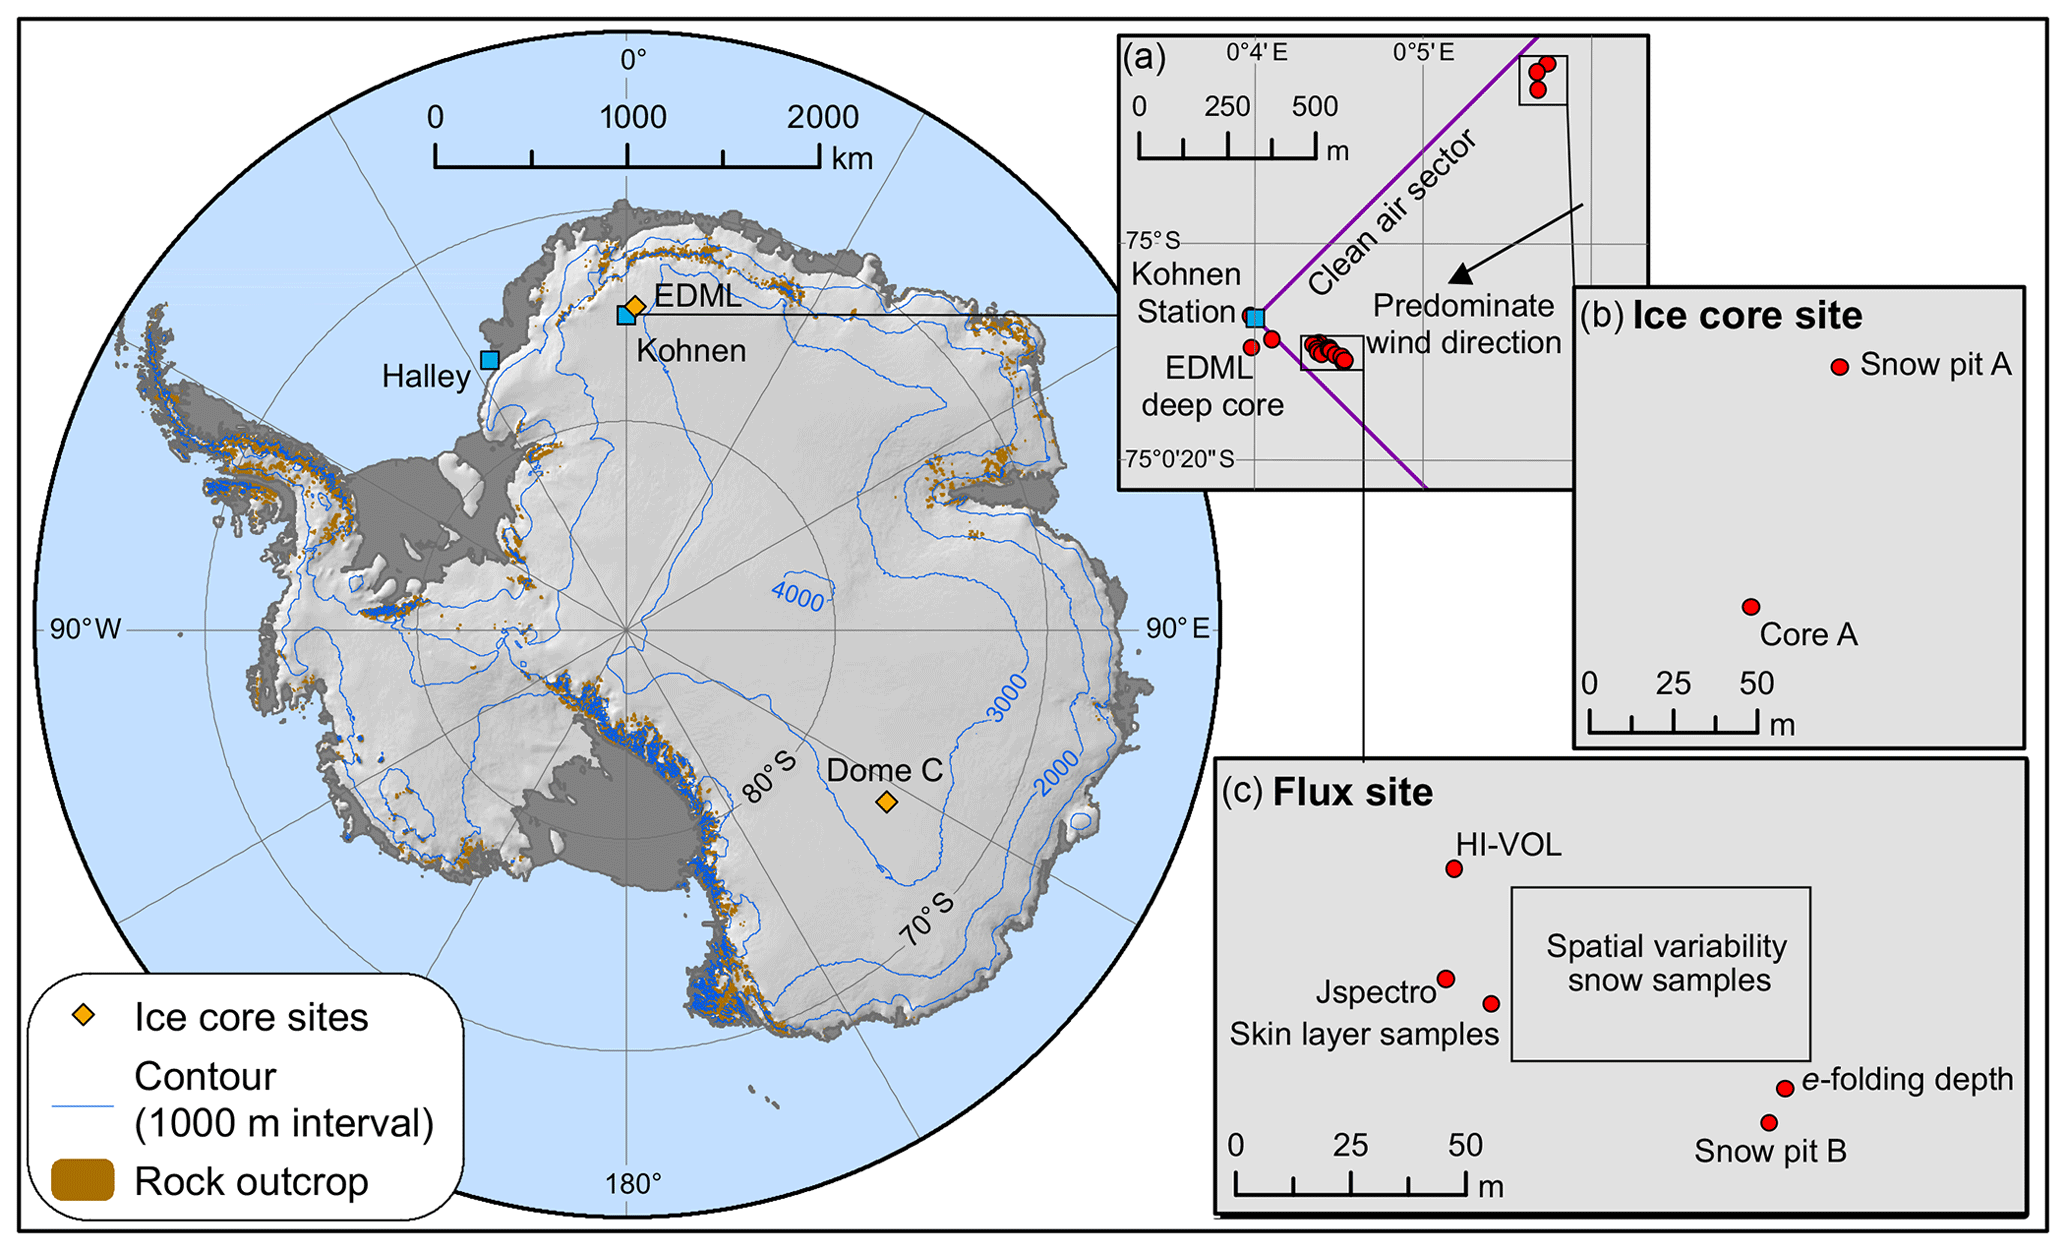
Figure 2Map of ISOL-ICE ice core drilling and atmospheric campaign and ice core sites and Antarctica stations mentioned in this study. (a) Insert of Kohnen Station in Dronning Maud Land (DML) highlighting the predominate wind direction, deep EDML ice core site, and the ISOL-ICE (b) “ice core” and (c) “flux” sites. (b) ISOL-ICE “ice core site” showing ice core, firn core, and snow pit A locations. (c) ISOL-ICE “flux” site showing location of in situ atmospheric instruments, surface snow, snow pit, and aerosol sampling locations, and e-folding depth measurements.
Table 1Site characteristics of Dronning Maud Land (DML) and Dome C ice core sites.
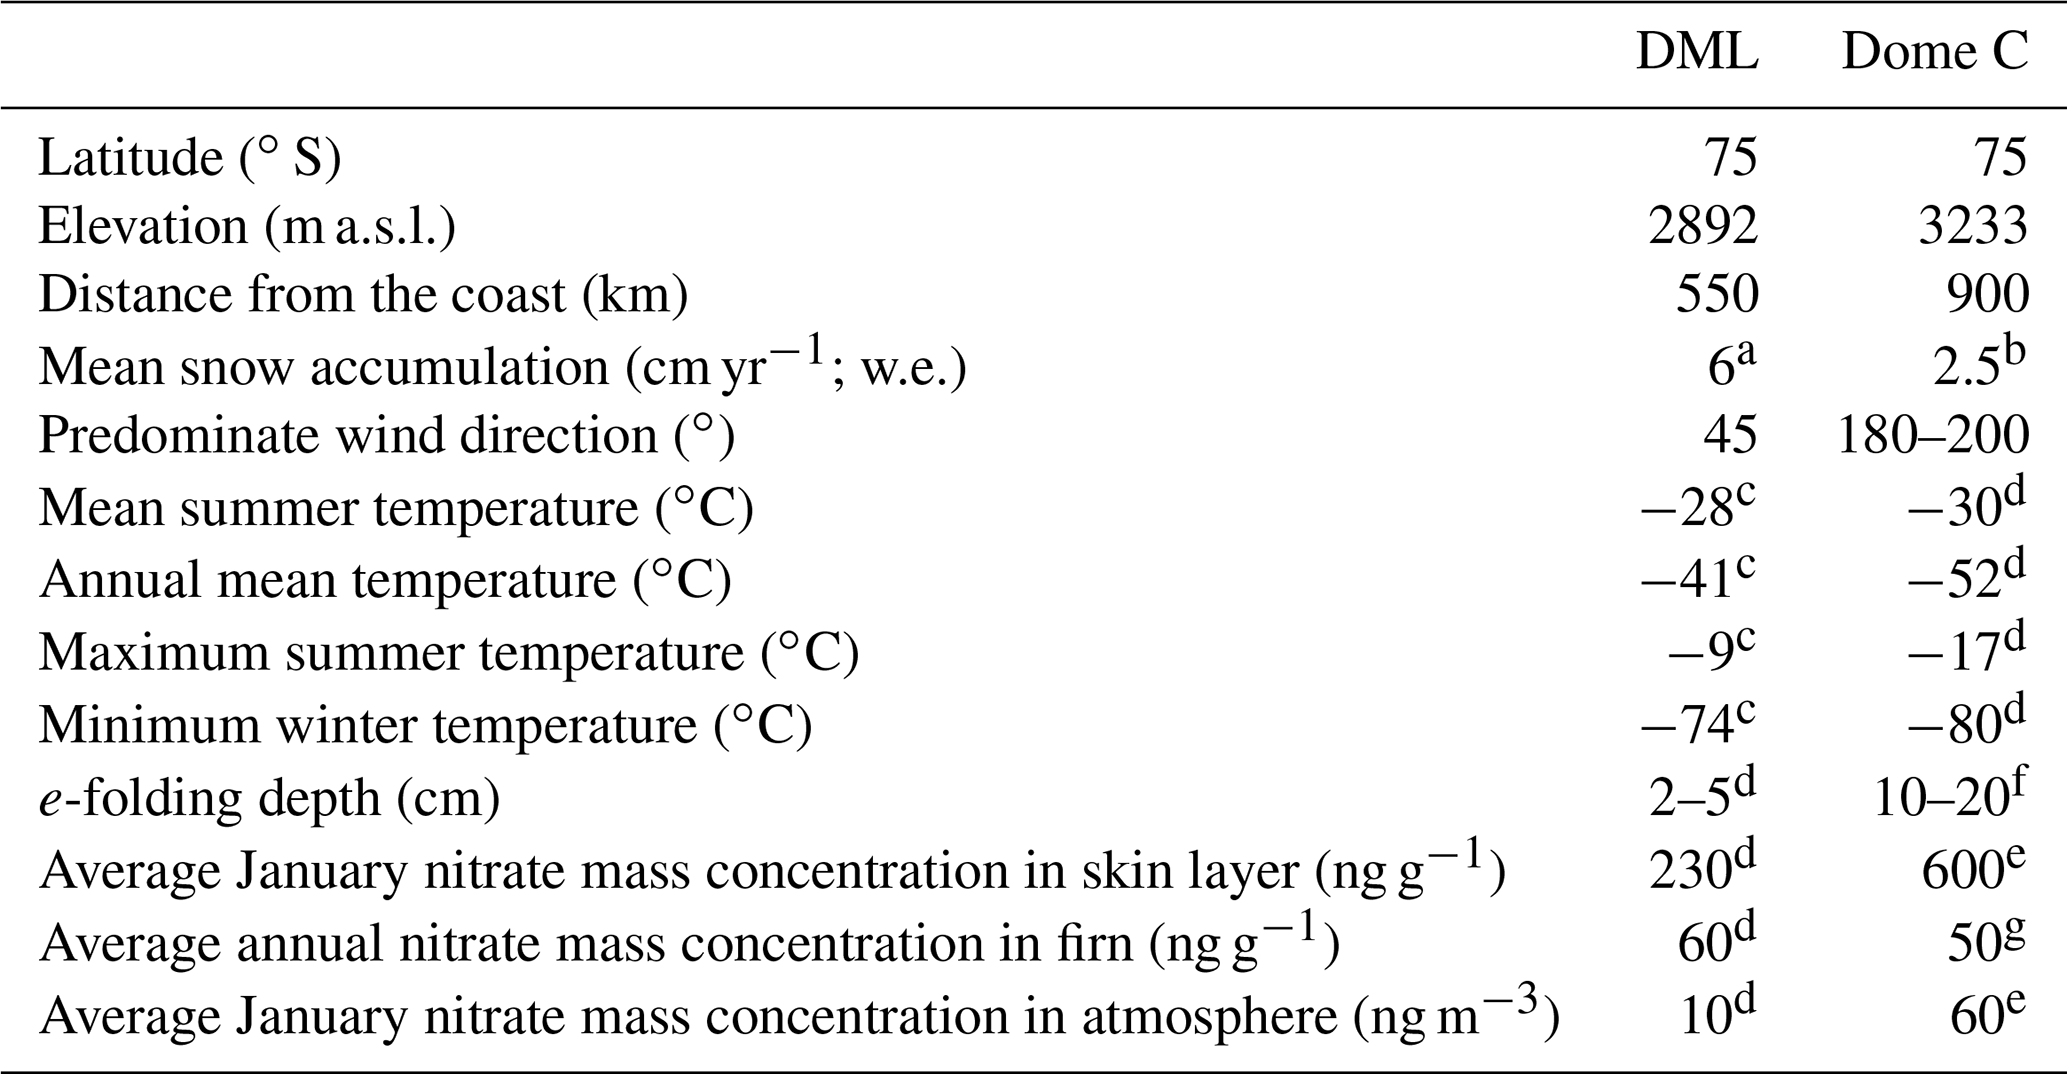
a Sommer et al. (2000); Hofstede et al. (2004). b Le Meur et al. (2018). c University of Utrecht (AWS9; DML05/Kohnen). d Erbland et al. (2013). e This study. f France et al. (2011). g Frey et al. (2009).
2.2 Snow and aerosol sampling
Daily skin layer samples, operationally defined as the top 5 mm of the snowpack following Erbland et al. (2013), were collected from the DML site (Fig. 2c) in January 2017 during the ISOL-ICE ice core drilling and air–snow transfer campaign. To prevent contamination from the nearby Kohnen Station, snow samples were collected from the “flux site” within the station's designated clean air sector (defined as 45∘ from both ends of the station building) located ∼1 km from the station (Fig. 2c). The skin layer samples were collected in polyethylene bags (Whirl-pak®) using a stainless steel trowel. A total of 45 skin layer samples were collected daily between 31 December 2016 and 29 January 2017 from a designated sampling site during the campaign ( S, E; Fig. 2c). To determine the spatial variability of in the skin layer at the flux site, an additional five skin layer samples were collected in a ∼2500 m2 area of the flux site ( S– E, S– E; Fig. 2c).
Adjacent to the skin layer samples, snow was sampled from a 1.6 m snow pit at the flux site (snow pit B; Fig. 2c) and a 2 m snow pit at the “ice core” site (snow pit A; Fig. 2b). Two parallel profiles were sampled for (i) major ion mass concentrations (including ) collected in prewashed 50 mL Corning® centrifuge tubes at 3 cm resolution by inserting the tube directly into the snow face and (ii) stable isotope analysis collected in Whirl-pak® bags at 2 cm resolution using a custom-made stainless-steel tool. Exposure blanks (following the same method as the samples by opening the tube/Whirl-pak® bag at the field site but not filling the sample container with snow) were also collected for both types of samples. Snow density and temperature were measured every 3 cm, and a visual log of snow pit stratigraphy was recorded.
Daily aerosol filters were collected using high-volume aerosol samplers custom built at the Institute of Environmental Geosciences (IGE), University of Grenoble Alpes, France, described previously (Frey et al., 2009; Erbland et al., 2013). The high-volume aerosol sampler collected atmospheric aerosol on glass fibre filters (Whatman GF/A filter sheets; 20.3 cm×25.4 cm) at an average flow rate of 1.2 m3 min−1 at standard temperature and pressure (STP; temperature: 273.15 K; pressure: 1 bar) to determine the mass concentration and isotopic composition of atmospheric . It is assumed that the atmospheric collected on glass fibre filters represents the sum of atmospheric particulate and HNO3 (gas phase). The bulk of HNO3 present in the gas phase is most likely adsorbed to aerosols on the filter, as described previously (Frey et al., 2009). Following the terminology of Erbland et al. (2013), we refer to “atmospheric ” as the combination (i.e. total) of HNO3 (gas phase) and particulate , and it is represented by the mass concentrations measured on aerosol filters.
The high-volume aerosol sampler was located 1 m above the snow surface at the flux site at the DML site (Fig. 2c), where a total of 35 aerosol filters were sampled daily between 3 and 27 January 2017. In addition, we coordinated an intensive 4 h sampling campaign in phase with Dome C, East Antarctica (Fig. 2), between 21 and 23 January 2017. At Dome C, a high-volume aerosol sampler was located on the roof of the atmospheric shelter (6 m above the snow surface), where a total of 12 samples were collected. At DML, loading and changing of aerosol collection substrates was carried out in a designated clean area. Aerosol-laden filters were transferred into individual double ziplock plastic bags immediately after collection and stored frozen until analysis at the British Antarctic Survey (BAS; major ions) and IGE ( isotopic composition). For the atmospheric work, three types of filter blanks were carried out, (i) laboratory filter blanks (n=3; Whatman GF/A filters that underwent the laboratory procedures without going into the field), (ii) procedural filter blanks (DML: n=4; Dome C: n=1; filters that had been treated as for normal samples but which were not otherwise used; once a week, during daily filter change-over, a procedural blank filter was mounted in the aerosol collector for 5 min without the collector pump in operation – this type of filter provides an indication of the operational blank associated with the sampling procedure), and (iii) 24 h exposure filter blanks sampled at the beginning and end of the field campaign (DML: n=2; Dome C: n=1; filters treated like a procedural blank but left in the collector for 24 h). All samples were kept frozen below −20 ∘C during storage and transport prior to analysis.
In addition, skin layer and aerosol samples were sampled continuously at Dome C over the period 2009–2015 following Erbland et al. (2013) and Frey et al. (2009). The sampling resolution for the skin layer was every 2–4 d and weekly for aerosol samples. Data from 2009 to 2010 have previously been published by Erbland et al. (2013), and we report the 2011–2015 data here (Fig. 1).
2.3 Major ion mass concentrations in snow and aerosol
Atmospheric and other major ions were extracted in 40 mL of ultrapure water (resistivity of 18.2 MΩ; Milli-Q water) by centrifugation using Millipore Centricon® Plus-70 filter units (10 kD filters) in a class-100 clean room at BAS. Major ion mass concentrations in DML snow samples were determined in an aliquot of melted snow from skin layer and snow pit samples and aerosol extracts by suppressed ion chromatography (IC) using a Dionex™ ICS-4000 Integrated Capillary HPIC™ System ion chromatograph. A suite of anions, including , chloride (Cl−), methanesulfonic acid (MSA), and sulfate (), were determined using an AS11-HC column and a CES 500 suppressor. Cations, including sodium (Na+), were determined using a CS12A column and a CES 500 suppressor. During the course of the sample sequence, instrumental blank solutions and certified reference materials (CRM; ERM-CA616 groundwater standard and ERM-CA408 simulated rainwater standard; Sigma-Aldrich) were measured regularly for quality control and yielded an accuracy of 97 % for . Nitrate mass concentrations in Dome C samples were determined by colorimetry at IGE following the procedure described in Frey et al. (2009). Blank concentrations for exposure blank, procedural blank, and laboratory blank and detection limits are reported in Table S1 in the Supplement.
Atmospheric mass concentrations (Caerosol) were estimated from high-volume aerosol filters by the ratio of total mass loading to the total volume of air pumped through the filter at STP conditions following Eq. (1) and assuming a uniform loading of the aerosol filter.
The non-sea-salt sulfate (nss-) fraction of was obtained by subtracting the contribution of sea-salt-derived from the measured mass concentrations (, where Na+ and are the measured concentrations in snow pit samples, and 0.252 is the ratio in bulk seawater (Keene et al., 1986).
2.4 Nitrate isotopic composition in snow and aerosol
Samples were shipped frozen to IGE where the isotope analysis was performed. The denitrifier method was used to determine the stable isotopic composition in samples at IGE following Morin et al. (2008). Briefly, samples were preconcentrated due to the low mass concentrations found in the atmosphere and snow over Antarctica. To obtain 100 nmol of required for isotope analysis, the meltwater of snow samples and aerosol extracts were sorbed onto 0.3 mL of anion exchange resin (AG1-X8 chloride form; Bio-Rad) and eluted with 5×2 mL of 1 M NaCl (high purity grade 99.0 %; American Chemical Society – ACS grade; AppliChem Panreac) following Silva et al. (2000). Recovery tests yielded 100 % recovery of (Frey et al., 2009; Erbland et al., 2013). Once preconcentrated, was converted to N2O gas by denitrifying bacteria, Pseudomonas aureofaciens. The N2O was split into O2 and N2 on a gold furnace heated to 900 ∘C followed by gas chromatographic separation and injection into the isotope ratio mass spectrometer (IRMS) for duel O and N analysis using a Thermo Finnigan™ MAT 253 IRMS equipped with a GasBench II™ and coupled to an in-house-built interface (Morin et al., 2009).
Certified reference materials (IAEA USGS-32, USGS-34, and USGS-35; Böhlke et al., 1993, 2003) were prepared (matrix match 1 M NaCl in identical water isotopic composition as samples; ACS grade) and subject to the same analytical procedures as snow and aerosol samples. The nitrogen isotopic ratio was referenced against N2-Air (Mariotti, 1983). We report 15N∕14N of (δ15N-) as δ values following Eq. (2).
For each batch of 60 samples, the overall accuracy of the method was estimated as the reduced standard deviation of the residuals from the linear regression between the measured reference materials (n=16) and their expected values. For the snow (n=118) and aerosol samples (n=35), the average uncertainty value obtained for δ15N was 0.5 ‰ for both datasets.
2.5 Nitrate mass flux estimates
The total deposition flux (F) of is partitioned into wet and dry deposition fluxes (Fwet and Fdry, respectively; Eq. 3), and can be estimated using the measured mass concentration of in the snowpack (Csnow) and the local snow accumulation rate (A; Eq. 4). Estimates of the dry deposition rate (Fdry) of were calculated using Eq. (5) using the atmospheric mass concentrations of (Caerosol) and a dry deposition velocity (Vdry deposition) of 0.8 cm s−1 and are reported in Table S2. This deposition velocity is based on the dry deposition of HNO3 at South Pole station (Huey et al., 2004), which has a similar snow accumulation rate (6.4 cm yr−1 w.e.; Mosley-Thompson et al., 1999) to DML. Other estimates of dry deposition velocities include 0.05–0.5 cm s−1 for HNO3 over snow (Hauglustaine et al., 1994; Seinfeld and Pandis, 1998), 1.0 cm s−1 for over the open ocean (Duce et al., 1991), and an apparent deposition velocity of 0.15 cm s−1 for summer HNO3 at Dome C (Erbland et al., 2013). The estimated apparent deposition velocity at Dome C is low because of the strong recycling of on the polar plateau in summer; i.e. reactive nitrogen is re-emitted from the skin layer to the atmosphere. Although gas-phase HNO3 and particulate have different dry deposition rates, the dry deposition velocity at DML is likely to lie between 0.15 and 0.8 cm s−1. We assume that a constant deposition velocity throughout the campaign is appropriate for DML.
Note that Eq. (4) does not take into account post-depositional processes of nonconservative ions, such as . We follow the approach of Erbland et al. (2013), using an archived mass flux (Fa) to represent the downward mass flux which escapes the photic zone towards deeper snow layers. Using simple mass balance, we can then estimate the mass flux of (Fre-emit), which is re-emitted from the snowpack to the overlaying atmosphere (Eq. 6).
2.6 Fractionation constants
Fractionation constants were calculated following the approach of Erbland et al. (2013). The apparent fractionation constant is denoted as 15εapp and calculated using Eq. (7).
where δ15Nf and δ15N0 are the δ values in the initial and remaining , and f is the remaining mass concentration. The ε values are related to the commonly used fractionation factor α by . The 15εapp derived for snow pits in the photic zone is 12 ‰.
2.7 Light attenuation through the snowpack (e-folding depth)
Measurements of light attenuation through the snowpack were made at the two snow pit sites during the ISOL-ICE campaign following a similar approach of previous studies (France and King, 2012; France et al., 2011). Vertical profiles of downwelling irradiance in the top 0.4 m of the snowpack were measured using a high-resolution spectrometer (HR4000; Ocean Optics) covering a spectral range of 280 to 710 nm. To do this, a fibre optic probe attached to the spectrometer and equipped with a cosine corrector with Spectralon diffusing material (CC-3-UV-S; Ocean Optics) was inserted into the snow to make measurements at approximately 0.03 m depth intervals. The fibre optic probe was either inserted horizontally into pre-cored holes, at least 0.5 m in length to prevent stray light, into the side wall of a previously dug snow pit, or pushed gradually into the undisturbed snowpack starting at the surface at a 45∘ angle, which was maintained by a metal frame. Most measurements with integration time ranging between 30 and 200 ms were carried out at noon to minimize changing sky conditions, and each vertical snow profile was completed within 0.5 h. The spectrometer was calibrated against a known reference spectrum from a Mercury Argon calibration source (HG-1; Ocean Optics), dark spectra were recorded in the field by capping the fibre optic probe, and spectral irradiance was then recorded at depth relative to that measured right above the snow surface.
The e-folding depth was then calculated according to the Beer–Bouguer–Lambert law. Stratigraphy of the snowpack recorded at each site showed presence of several thin (10 mm) wind crust layers over the top 0.4 m of snowpack. However, calculating e-folding depths for each layer in between wind crusts yielded inconclusive results. Therefore, reported e-folding depths (Fig. S1, Table S3) are based on complete profiles integrating potential effects from wind crust layers. We use e-folding depths observed in this study at DML and those reported previously at Dome C as guidance for our model sensitivity study to quantify the impact of the variability in e-folding depth on archived δ15N- in snow.
2.8 Nitrate photolysis rate coefficient
Hemispheric or 2π spectral actinic flux from 270 to 700 nm was measured at 2.1 m above the snow surface using an actinic flux spectroradiometer (Meteorologieconsult GmbH; Hofzumahaus et al., 2004). The 2π photolysis rate coefficients J() were then computed using the absorption cross section and quantum yield on ice estimated for −30 ∘C from Chu and Anastasio (2003). The mean 2πJ() value at DML during January 2017 was s−1, and it was s−1 during the 1 to 14 January 2017 period. The observed 2πJ() at DML was a factor of 3 lower than Dome C ( s−1; 1 to 14 January 2012), which was previously measured using the same instrument make and model and at the same latitude (Kukui et al., 2013). Only ∼5 % of the apparent intersite difference can be attributed to TCO being ∼25 DU larger at DML (306 DU) than at Dome C (287 DU) during the comparison period. The remainder was possibly due to greater cloudiness at DML and differences in calibration. In this study, the observed 2πJ() is used to estimate the snow emission flux of NO2.
2.9 Snow emission of NO2
The potential snow emission flux of NO2 () from photolysis in snow was estimated using Eq. (8).
where Jz() is the photolysis rate coefficient of reaction at depth, z, in the snowpack, and is derived by scaling surface measurements (Sect. 2.8) with e-folding depth (2–10 cm), and []z is the amount of per unit volume of snow at depth, z, in the snowpack. The calculated is a potential emission flux assuming that all within the snow grain is photo-available, no cage effects are present and NO2 is vented immediately after release from the snow grain to the air above the snowpack without undergoing any secondary reactions.
2.10 Air–snow transfer modelling
In order to evaluate the driving parameters of isotope air–snow transfer at DML we used the TRANSITS model (Erbland et al., 2015) to simulate snow depth profiles of mass concentration and δ15N- and compare them to our observations. Due to the reproducible depth profile of observed δ15N- within 1 km (Sect. 3.1.2), we assume the δ15N- composition is spatially uniform at DML, and thus a 1D model is appropriate for the site. The atmospheric boundary layer in the model is represented by a single box above the snowpack. The 1 m snowpack is divided into 1000 layers of 1 mm thickness. Below the photic zone of the snowpack, the mass concentrations and δ15N- values are assumed to be constant and thus archived during the model run. The model is run for 25 years (with a time step of 1 week), which is sufficient to reach steady state. The input data are provided in Table S4.
Photolysis rate coefficients of , i.e. J(), above and within the snowpack are used by the TRANSITS model runs as input for this study and are modelled offline using the tropospheric ultraviolet and visible (TUV)-snow radiative transfer model (Lee-Taylor and Madronich, 2002). The following assumptions were made: (i) a clear aerosol-free sky, (ii) extraterrestrial irradiance from Chance and Kurucz (2010), and (iii) a constant Earth–Sun distance as that on 27 December 2010 (Erbland et al., 2015). The TUV-snow radiative transfer model was constrained by optical properties of the Dome C snowpack (France et al., 2011), notably an e-folding depth of (i) 10 cm in the top 0.3 m and (ii) 20 cm below 0.3 m (Erbland et al., 2015), to compute J() profiles as a function of solar zenith angle (SZA) and TCO (Erbland et al., 2015) (Fig. S2; dashed lines).
The set-up used in this paper is similar to Erbland et al. (2015) except for the following modifications. We use the TCO from the NIWA Bodeker combined dataset version 3.3, at the location of the snow pit site, averaged from 2000 to 2016 (http://www.bodekerscientific.com/data/total-column-ozone, last acce3ss: 15 January 2019). The year-round atmospheric mass concentrations are taken from Weller and Wagenbach (2007), and the meteorology data are taken from Utrecht University Automatic Weather Station (AWS) at DML05/Kohnen (AWS9; https://www.projects.science.uu.nl/iceclimate/aws/files_oper/oper_20632, last access: 29 March 2017). The snow accumulation rate is set to 6 cm yr−1 w.e.; Sommer et al. (2000), and we refer to this simulation as our “base case” scenario. We carried out a sensitivity analysis to evaluate the impact of variable accumulation rate, timing of snowfall, and e-folding depth on the snow profile of mass concentrations and δ15N-. Our first set of sensitivity tests account for the new e-folding depth measurements at the DML site; the e-folding depth was varied within the range of observations from this study and previously at Dome C. The second set of sensitivity tests use an e-folding depth of 5 cm and were as follows: the snow accumulation rate was varied between the bounds seen in the last 1000 years at DML; the snow accumulation rate was varied from year to year according to observations from our snow pit profile, which ranged between 6.0 and 7.1 cm yr−1 w.e.; and the timing of the snow accumulation was varied throughout the year. We compare the second set of sensitivity tests to the 5 cm e-folding depth scenario and refer to this as our “5 cm EFD (e-folding depth) case” (Sect. 3.5.1). To evaluate the sensitivity of archived δ15N- to e-folding depth, changes in the J() profiles for Dome C (Erbland et al., 2015) were recalculated and used as TRANSITS input by scaling the surface value of J() with a new e-folding depth (2, 5, 10, 20 cm). An example is shown in Fig. S2a for SZA =70∘, TCO =300 DU, and an e-folding depth of 5 cm. The top 2 mm are retained from the Dome C case in Erbland et al. (2015) to account for nonlinearities in snow radiative transfer in snow, which are strongest in the non-diffuse zone right below the snow surface (Fig. S2b). It is noted that TUV-snow model estimates of downwelling or 2πJ() above the snow surface at the latitude of Dome C or DML (75∘ S) compare well to observations at Dome C in January 2012, whereas they are 3 times higher than measurements at DML in January 2017 (Table S5 and Sect. 3.3.2). This should not affect the results of the sensitivity study, which aims to explore relative changes in archived δ15N- due to a prescribed change in e-folding depth.
TRANSITS calculates the average number of recyclings before is archived, i.e. below the zone of active photochemistry. In TRANSITS, the average number of recyclings undergone by in a given box (snow layer or atmosphere) is represented by a tracer (or counter) called CYCL. The CYCL value for primary is set to 0, and CYCL variables in the boxes are incremented by 1 each time NO2 molecules cross the air–snow interface. The average number of recyclings is calculated as a mass-weighted average of the CYCL values of the 52 snow layers (representing 1 week of snowfall) which are archived below 1 m over the course of 1 year, in order to average out any seasonal variability. Erbland et al. (2015) noted that the number of recyclings represents an average value for the archived ; i.e. considering individual ions in the archived , the number of recyclings could be variable as some ions may have travelled through the entire snowpack zone of active photochemistry without being recycled, while some underwent many recyclings.
2.11 Snow pit dating
Dating of the snow pits was based on the measured concentrations of Na+, MSA, and nss- following previous aerosol and ice core studies at DML (Göktas et al., 2002; Weller et al., 2018). Here, Na+ mass concentrations have a sharp, well-defined peak in the austral spring/late winter, while MSA and nss-, primarily derived from the biogenic production of dimethylsulfide (DMS), record maximum concentrations in the austral autumn. Non-sea-salt (nss-) often displays a second peak corresponding to late austral spring/summer sometimes linked to MSA. Spring seasons were defined as 1 September and positioned at the Na+ peak, while autumn seasons were defined as 1 April and positioned where a MSA and nss- peak aligned (Fig. S3).
3.1 Evaluation of TRANSITS model results
Nitrate mass concentration and δ15N- composition data for aerosol, skin layer, and snow pit samples are available in Winton et al. (2019b).
3.1.1 Nitrate mass concentrations
Skin layer and atmospheric measurements of mass concentrations during the January 2017 ISOL-ICE campaign at DML are presented in Fig. 3. Aerosol mass concentrations of range from 0.5 to 19 ng m−3 and show a downward trend throughout January 2017 (R2=0.55; ; Fig. 3). In contrast, mass concentrations in the skin layer increase during the month from 136 to 290 ng g−1. Nitrate mass concentrations in both snow pits, which range from 23 to 142 ng g−1, are substantially lower than those in the skin layer. Our measurements agree well with published measurements of mass concentrations in snow pits at DML (Weller et al., 2004). While our January 2017 observations of atmospheric mass concentrations are 20–30 ng g−1 lower than those observed in 2003 by Weller and Wagenbach (2007), which could be due to interannual variability of atmospheric mass concentrations, which varied by 30 ng g−1 over summer between 2003 and 2005.

Figure 3January 2017 time series in Dronning Maud Land (DML) of (a) daily precipitation, (b) hourly wind direction and wind speed, (c) atmospheric and skin layer δ15N-, and (d) atmospheric and skin layer mass concentration. Error bars in panels (c)–(d) indicate the spatial variability in the site determined by multiple skin layer samples collected on 28 January 2017. The spatial variability exceeds the instrumental error, which is smaller than the symbol size. Meteorological data source: University of Utrecht (AWS9; DML05/Kohnen; S, E/W; ∼2900 m a.s.l.). Precipitation data source: RACMO2 (https://doi.org/10/c2pv, van de Berg et al., 2019).
A comparison of Dome C and DML observations in skin layer, aerosol, and depth profiles is illustrated in Fig. 4, while archived mass concentrations and δ15N- values are reported in Table 2. Compared to Dome C, average annual atmospheric, skin layer, and snow pit mass concentrations are lower at DML, in agreement with observational and modelling studies where higher mass concentrations are found at lower snow accumulation sites (Erbland et al., 2013). The mass concentration profile in the upper 50 cm of the snowpack at Dome C shows an exponential decrease with depth and becomes relatively constant at 35 ng g−1 at 20 cm compared to 160–1400 ng g−1 in the skin layer (Figs. 1 and 4; Erbland et al., 2013; Frey et al., 2009). While the highest mass concentrations in the snowpack at DML are also found in the skin layer, the mass concentration profile exhibits a different pattern. The sharp decrease in mass concentration occurs in the top ∼5 mm at which point the snow pit records interannual variability in the mass concentration. Nitrate mass concentrations in DML snow pits exhibit a maximum in summer and minimum in winter.
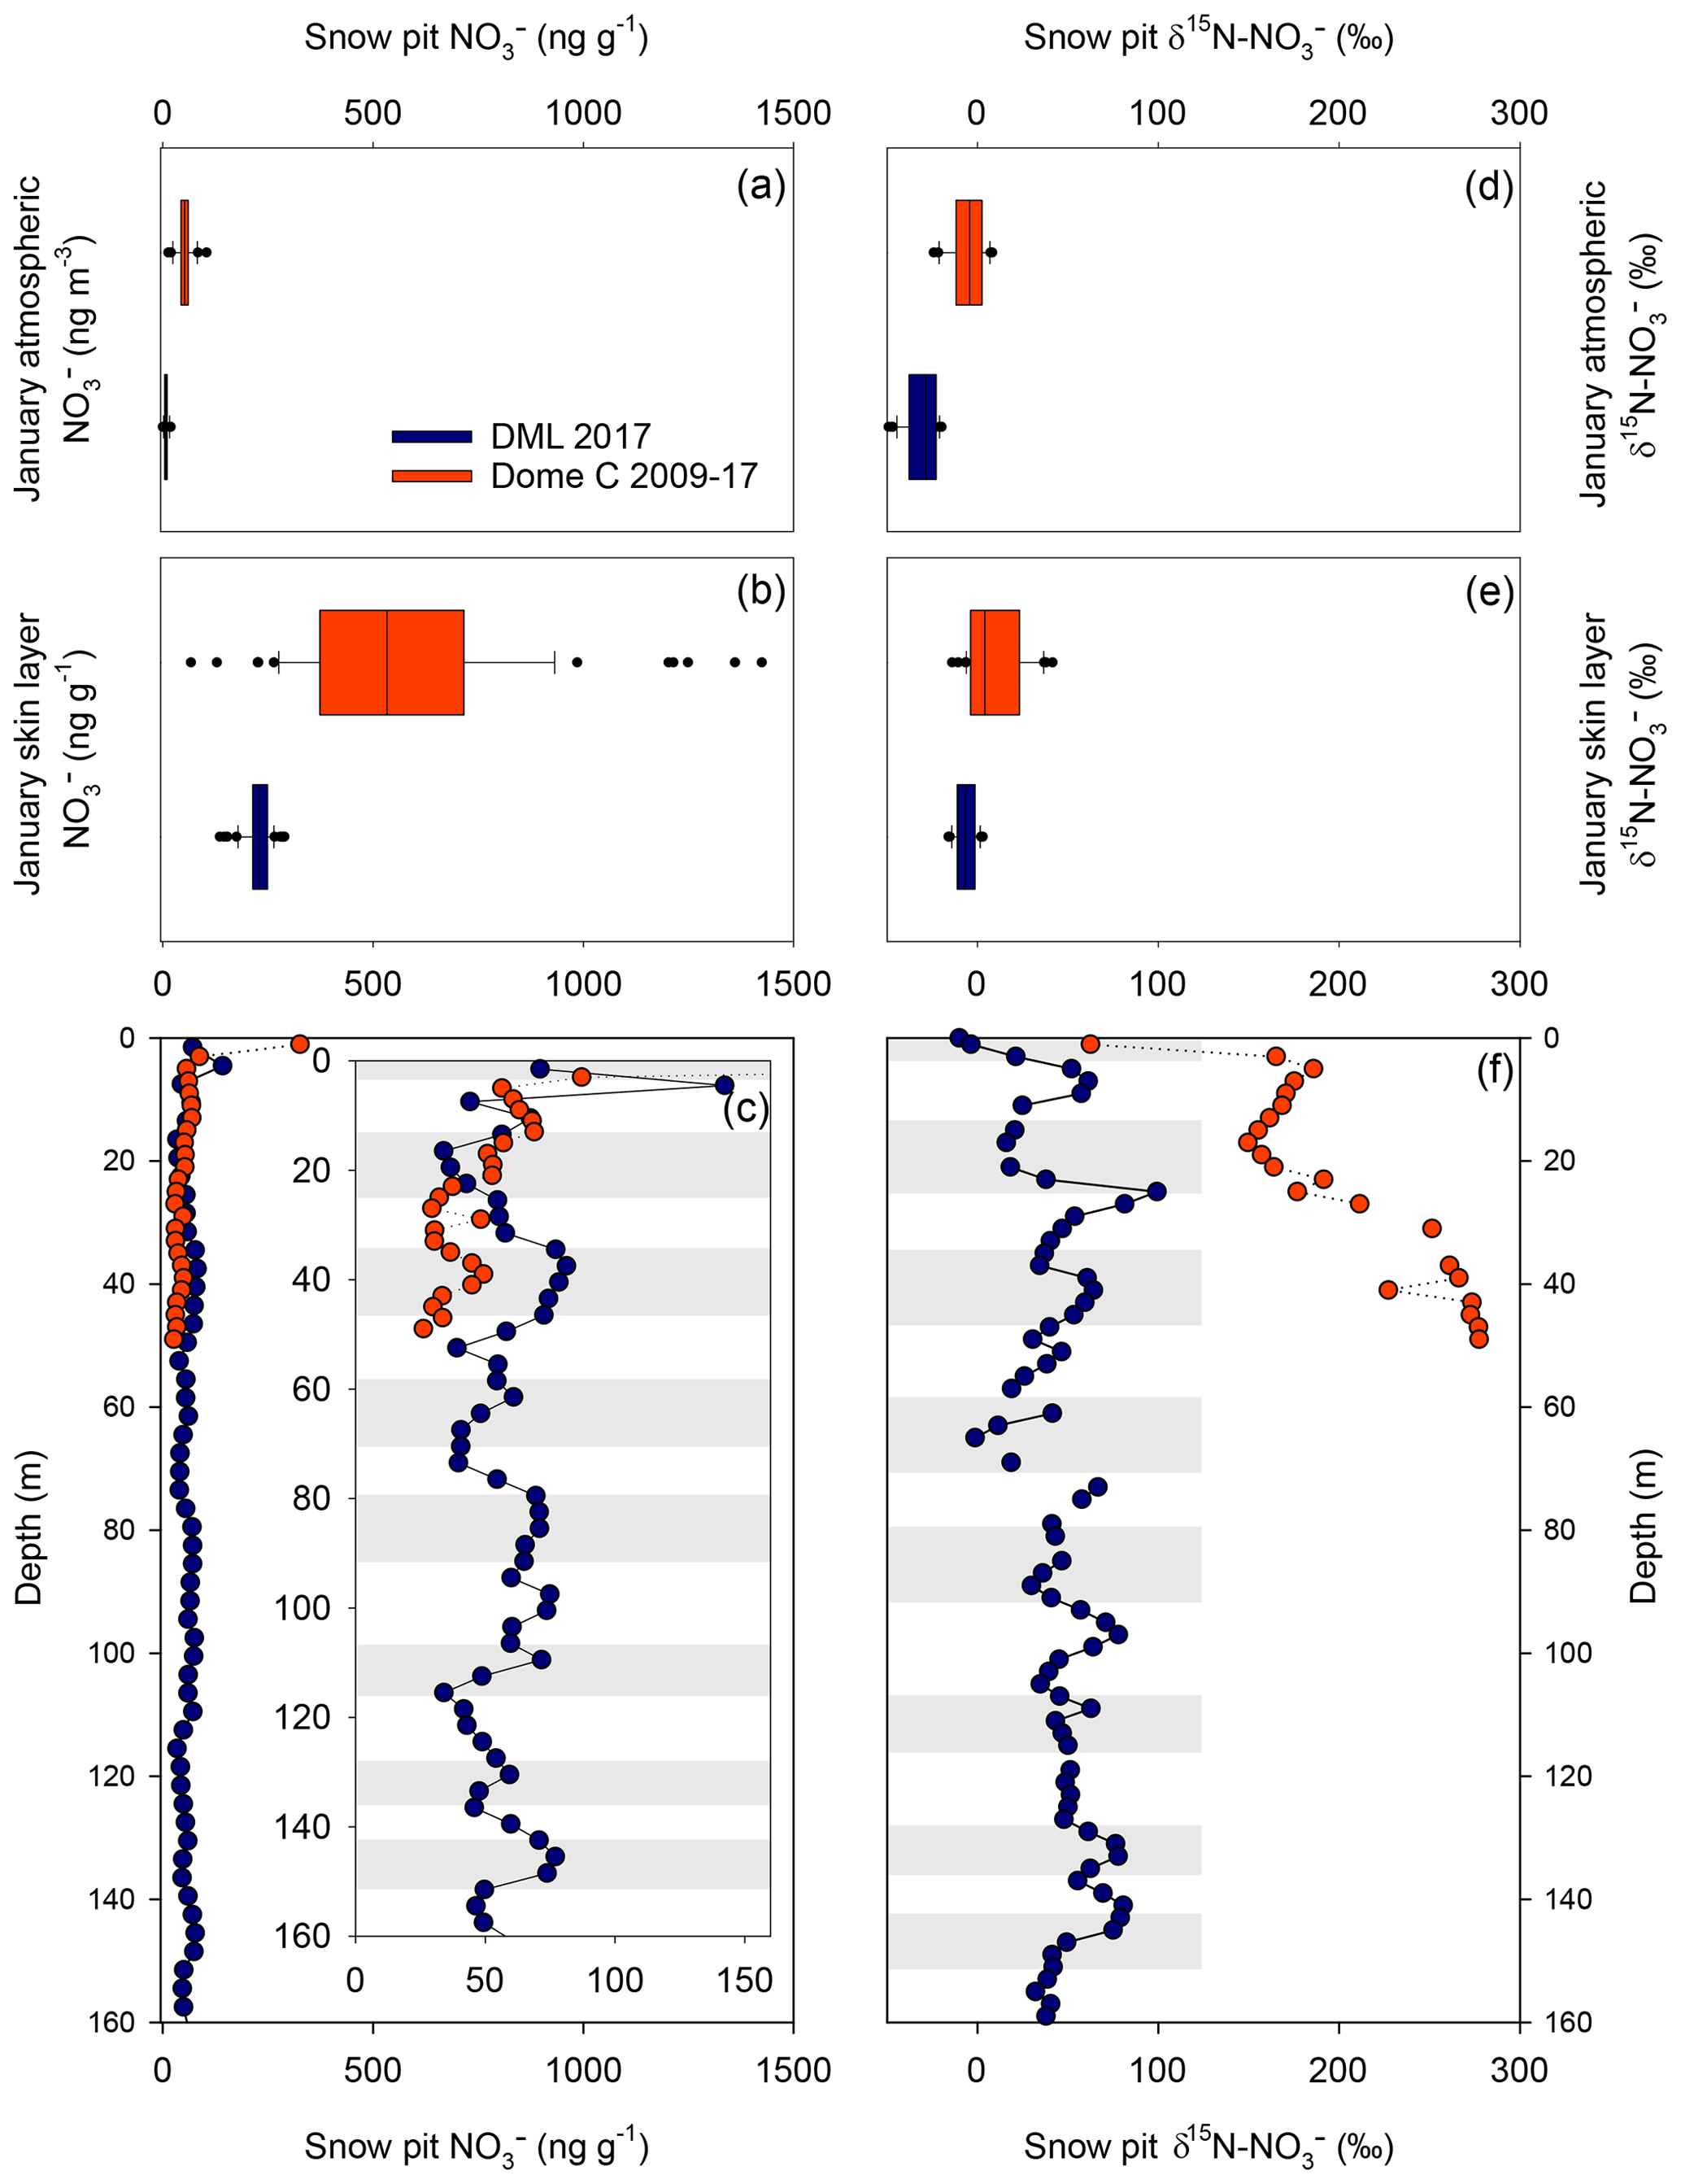
Figure 4Comparison of mass concentration and δ15N- at Dronning Maud Land (DML) and Dome C in January 2017. mass concentration in (a) atmosphere, (b) skin layer, and (c) depth profiles. Insert: depth profile of mass concentration highlighting seasonal variability. δ15N- in (d) atmosphere, (e) skin layer, and (f) depth profiles. Grey bars indicate summer seasons for DML depth profiles.
Table 2Summary of observed and simulated archived, aerosol, and skin layer mass concentrations, δ15N- composition, and mass fluxes at Dronning Maud Land (DML) and Dome C. Abbreviation n.d.: no data. Base case refers to the TRANSITS simulation with a snow accumulation rate of 6 cm yr−1 w.e. and an e-folding depth of 10 cm, while the 5 cm EFD case refers to a TRANSITS simulation with an observed snow accumulation rate that varied year to year between 6.0 and 7.1 cm yr−1 w.e. and an e-folding depth of 5 cm.
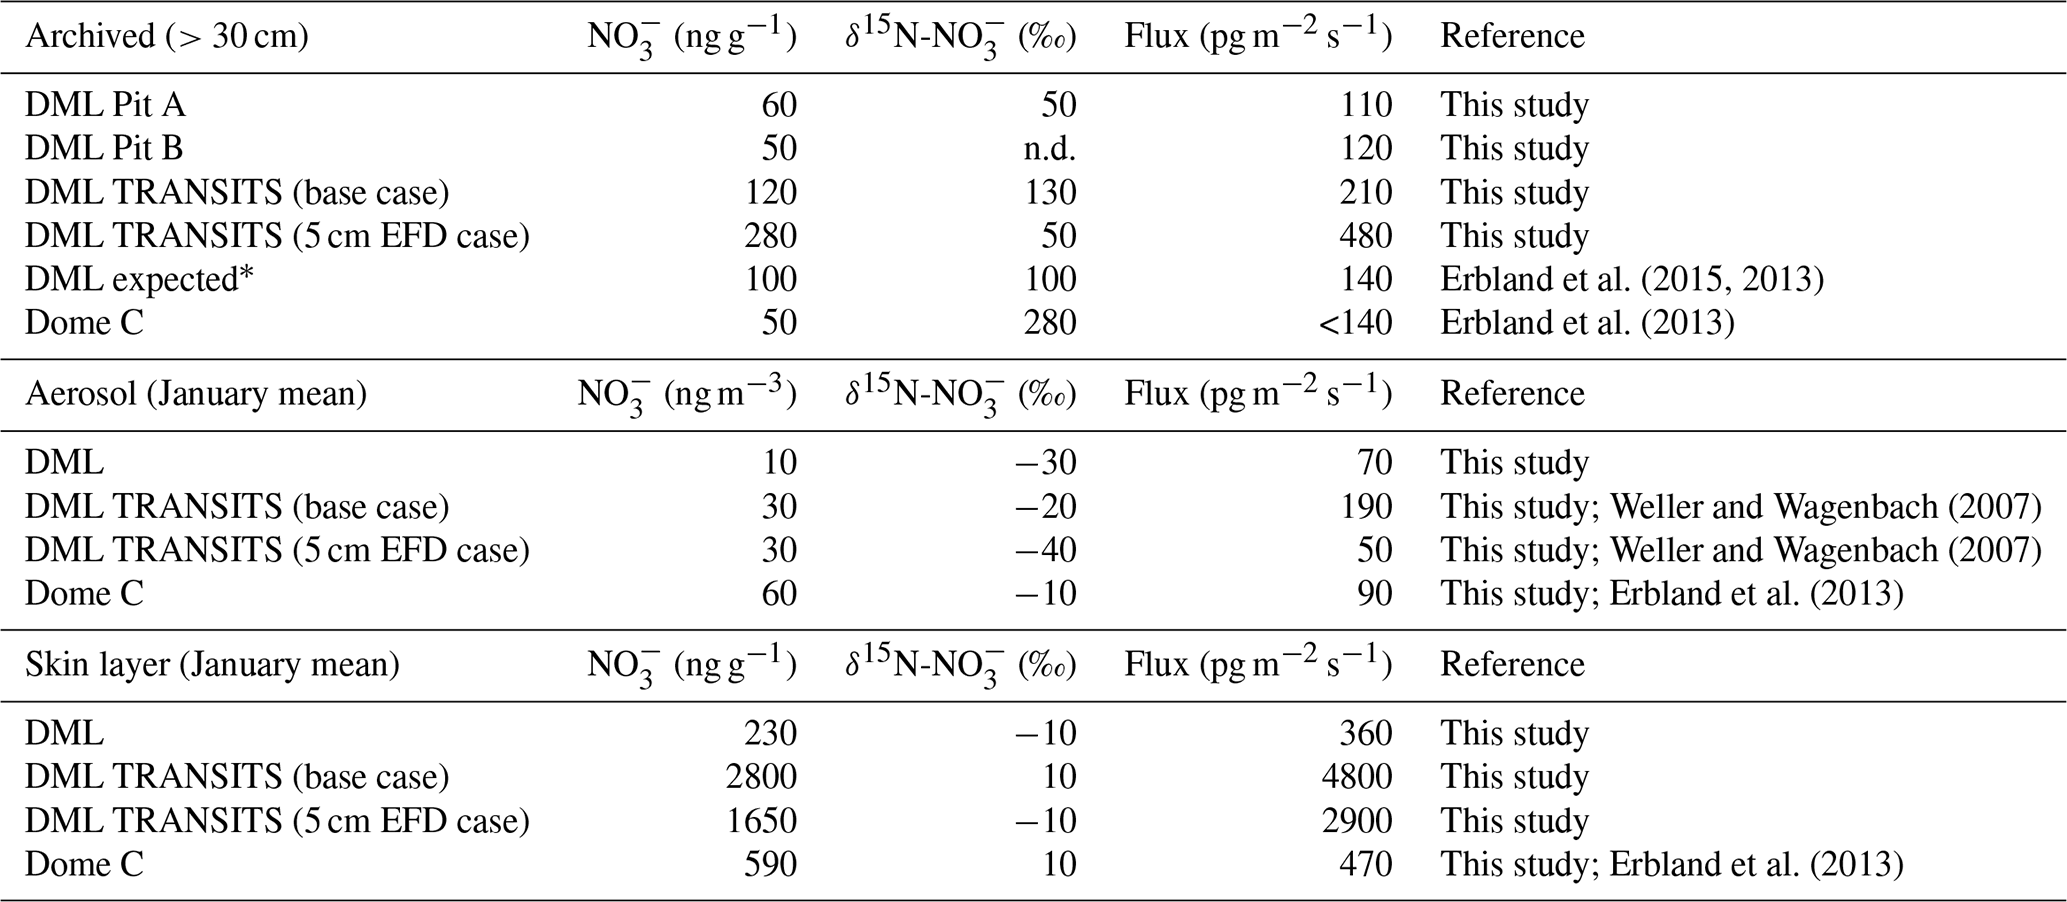
* Expected values for a site with an accumulation rate of 6 cm yr−1 w.e. based on the spatial transect of Erbland et al. (2015).
While the precision of the IC measurement of is better than 2 %, the spatial variability at DML in in the skin layer exceeds this. During the sampling campaign, five skin layer samples were taken from an area of ∼2500 m2 at the flux site (snow surface had sastrugi of up to 10 cm) to understand how representative the snow pit mass concentrations are of the greater study area. We found that the spatial variability in mass concentrations and δ15N- at DML was 10 % and 17 %, respectively (Fig. 3c–d). At Dome C, the spatial variability in mass concentrations was between 15 % and 20 %. We note that this variability includes the natural spatial variability and the operator sampling technique.
Simulated TRANSITS results for the base case and 5 cm EFD case scenarios at the air–snow interface are illustrated in Fig. 5 along with TCO data (Fig. 5a). In the atmosphere, the TRANSITS model is forced with the smoothed profile of year-round atmospheric measurements from the DML site (Weller and Wagenbach, 2007) where the highest mass concentrations are in spring and summer with a maximum of 80 ng m−3 in November and a minimum of 2 ng m−3 in winter (Fig. 5b). Overall, the simulated values in the base case scenario are higher than the 5 cm EFD case in summer and autumn and converge to similar values in winter. In the skin layer, the simulated annual cycle of mass concentrations steadily rise in spring and reach a peak in January when they begin to decline to the lowest mass concentration in winter (Fig. 5d). The simulated mass concentrations in the skin layer are an order of magnitude greater than our observations in January. The discrepancy between the significantly higher simulated mass concentrations than observations in the skin layer was also found at Dome C. Erbland et al. (2015) suggested that this discrepancy could be related to a sampling artefact, snow erosion, or a modelled time response to changes in past primary inputs. We provide an alternative explanation for the extremely high simulated mass concentrations in the skin layer using daily measurements of mass concentration in diamond dust and hoar frost collected from Polyvinyl chloride (PVC) sheets at Dome C in summer 2007/2008, i.e. new deposition. New deposition of diamond dust had mass concentrations of up to 2000 ng g−1, which is 4 times greater than that observed in natural snow from the skin layer at the same time (Fig. S4). Similarly, new deposition of hoar frost had mass concentrations of up to 900 ng g−1, which is 3 times greater than the skin layer snow. The formation of surface hoar frost occurs by co-condensation, i.e. the simultaneous condensation of water vapour and at the air–snow interface. Recent modelling suggests that co-condensation is the most important process explaining incorporation in snow undergoing temperature gradient metamorphism at Dome C (Bock et al., 2016). Diamond dust can also scavenge high concentrations of HNO3 at Dome C (Chan et al., 2018). Furthermore, the top layer of the snowpack is only 1 mm thick in the TRANSITS model, whereas our observations of the skin layer are 5 mm thick. Due to the photochemical loss of mass concentrations with depth, the highest mass concentrations are expected in the top 1 mm layer, which is the layer best in equilibrium with the atmosphere. Here, extremely high mass concentrations of from new deposition from diamond dust and hoar frost are also found. In summary, it is likely that we do not measure such high mass concentrations in hoar frost and diamond dust in the skin layer because of sampling artefacts or blowing snow, which can dilute or remove the diamond dust and hoar frost. It is interesting to note that the higher simulated values in the skin layer do not impact the simulated depth profiles.

Figure 5ISOL-ICE observations and simulated annual cycle of skin layer and atmospheric mass concentration and δ15N- at Dronning Maud Land (DML) from the base case and 5 cm EFD case TRANSITS model simulations for January 2017. (a) Total column ozone: NIWA Bodeker combined dataset version 3.3 at DML averaged from 2000 to 2016 (http://www.bodekerscientific.com/data/total-column-ozone, last access: 15 January 2019). (b) Atmospheric mass concentrations are observations from Kohnen Station (Weller and Wagenbach, 2007) that are used as input into the model. ISOL-ICE observations and TRANSITS simulations of (c) atmospheric δ15N-, (d) skin layer mass concentration, and (e) skin layer δ15N-.
3.1.2 Isotopic composition of nitrate
The seasonal evolution of observed and simulated air–snow δ15N- values are presented in Figs. 3 and 5, respectively. Atmospheric δ15N- ranges from −49 ‰ to −20 ‰ at DML and −9 ‰ to 8 ‰ at Dome C during the January campaign and is depleted with respect to the skin layer, which ranges from −22 ‰ to 3 ‰ at DML (Fig. 3). The simulated atmospheric δ15N- values in the base case for January are greater than our measurements, while the δ15N- values in the 5 cm EFD case fall within the range of observations (Fig. 5). The annual cycle of simulated atmospheric δ15N- for the 5 cm EFD case shows a 50 ‰ dip in spring to −42 ‰ from winter values, which coincides with the simulated atmospheric mass concentration increase in spring (Fig. 5c). The highest simulated atmospheric δ15N- values (7 ‰) occur in winter, for both scenarios. While the simulated skin layer δ15N- values in January for the base case are ∼10 ‰ higher than our highest observations for that month, but the average January value in the 5 cm EFD case (−7 ‰) falls in the range of observed values (−10 ‰) (Fig. 5e). For the 5 cm EFD case, they begin to decrease by 30 ‰ in spring at the same time as atmospheric δ15N- values decrease. In October and November, the skin layer δ15N- values begin to rise up to −11 ‰ in February in the 5 cm EFD case.
The δ15N- values in both snow pits at DML show extremely good reproducibility, with depth indicating there is little spatial variability within 1 km at the site (Fig. 4). The depth profiles of δ15N- values at DML exhibit large variability between seasons (−3 ‰ to 99 ‰) with more enriched values in spring and summer with respect to winter (Fig. 4). In comparison, the δ15N- values in snow pits at Dome C do not preserve a seasonal cycle. However, in parallel with the exponential decay of mass concentrations with depth at Dome C, there is a strong increase in the δ15N- with depth. At Dome C, δ15N- increases up to 250 ‰ in the top 50 cm; this increase is weaker at DML (up to 100 ‰ in the top 30 cm at which point seasonal cycles are evident). Although no annual cycle is preserved in the snowpack at Dome C, the year-round measurements of atmospheric δ15N- show a decrease during sunlit conditions in spring and summer (Fig. 1). While the δ15N- in the skin layer has a spring minimum that increases to a maximum at the end of summer (Fig. 1). Skin layer δ15N- is about 25 ‰ higher than atmospheric δ15N-.
Sensitivity results of the depth profiles for the base case and 5 cm EFD case scenarios are discussed in Sect. 3.5.1, and we refer the reader to that section for an in-depth discussion of the TRANSITS sensitivity tests. We briefly describe differences between the depth profiles of the base case and 5 cm EFD case here to set the scene for the discussion. Overall, TRANSITS modelling shows that (i) the simulated δ15N- values in the base case scenario are higher than the 5 cm EFD case, (ii) the 5 cm EFD case falls within the range of observations for δ15N- but is significantly higher than the observed mass concentrations, and (iii) TRANSITS modelling simulations using the observed e-folding depth of 5 cm (Sect. 3.3.2) are good fit with δ15N- observations.
3.1.3 Snow pit accumulation rate and nitrate mass fluxes
Annual layer counting of Na+ layers shows that snow pit A spans 8 years from autumn 2009 to summer 2017 and snow pit B spans 9 years from summer 2008 to summer 2017 with an age uncertainty of ±1 year at the base of the snow pit. The mean snow accumulation rate for the snow pits is estimated to be 6.3±1.4 cm yr−1 w.e., consistent with published accumulation rates of 6.0–7.1 cm yr−1 w.e. from snow pits and ice cores from DML (Sommer et al., 2000; Hofstede et al., 2004; Oerter et al., 2000).
Taking the simple mass balance approach, a schematic of mass fluxes for two scenarios is illustrated in Fig. 6. Scenario 1 is an average annual budget for DML (Fig. 6a). As the atmospheric campaign did not cover an entire annual cycle, we use estimates of atmospheric mass fluxes at DML reported by Pasteris et al. (2014) and Weller and Wagenbach (2007) of 43 and 45 pg m−2 s−1, respectively, as year-round dry deposition fluxes. Due to the linear relationship of ice core mass concentrations with the inverse accumulation, the authors assume that the magnitude of the dry deposition flux is homogenous over the DML region. Mean annual mass concentrations of in our snow pits suggest a total deposition mass flux of 110 pg m−2 s−1 and therefore a wet deposition mass flux of 65 pg m−2 s−1.
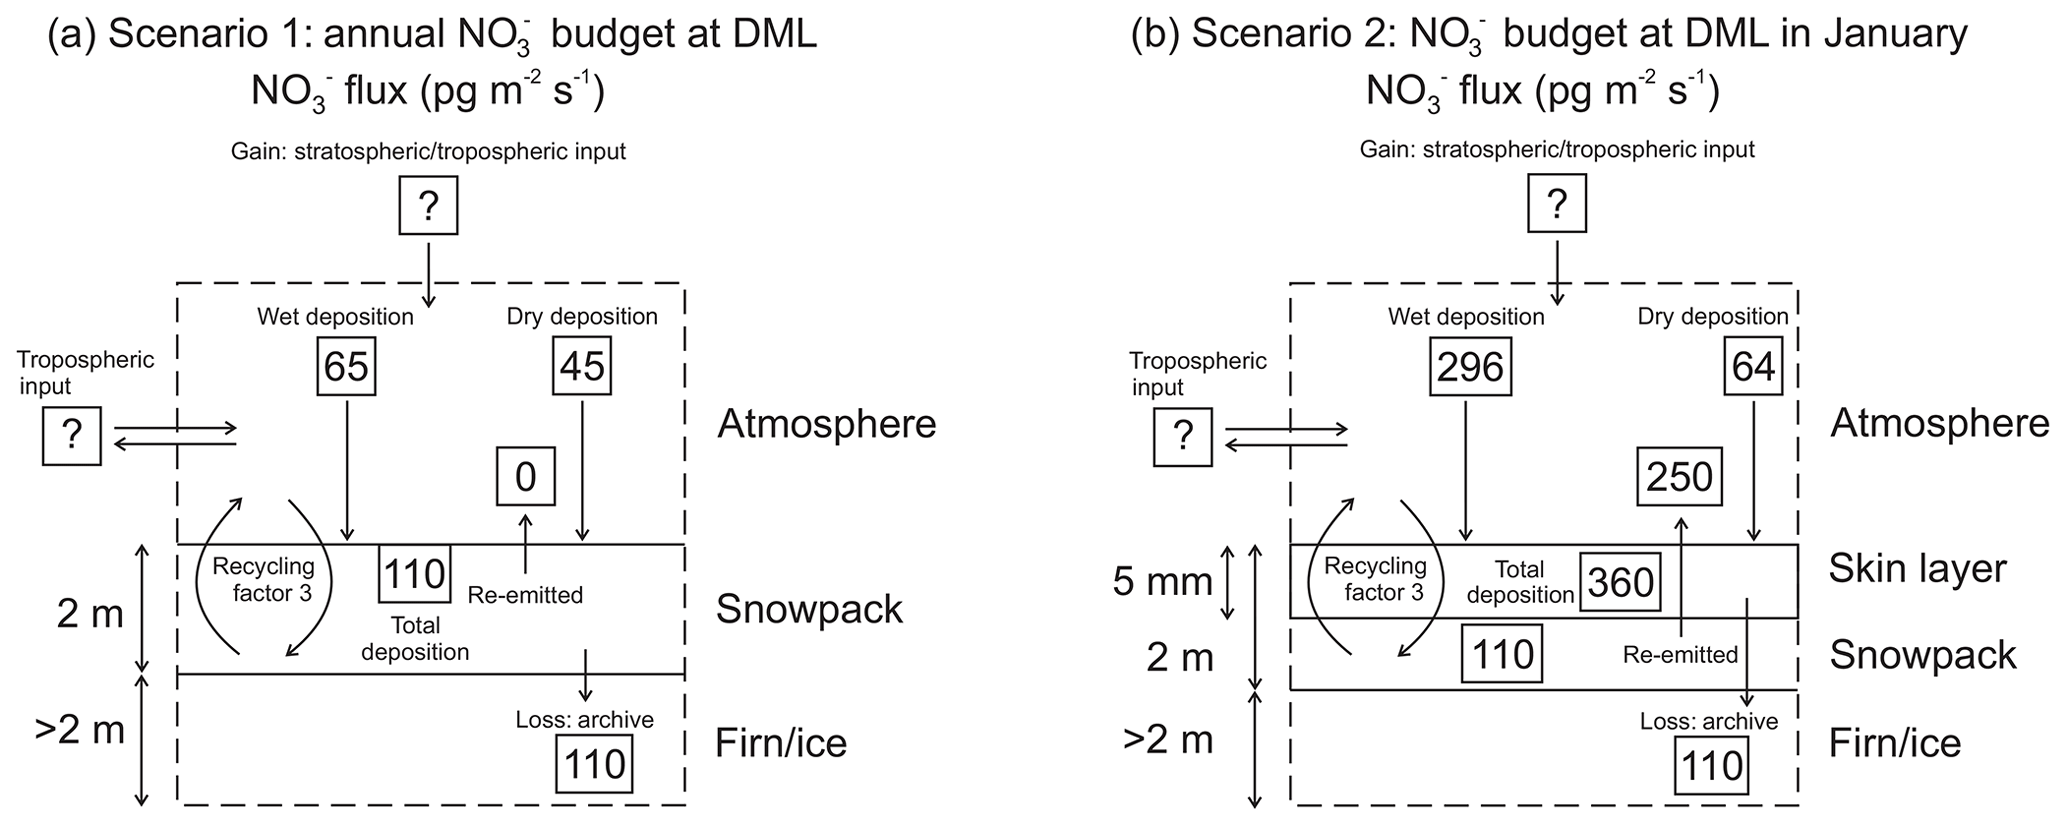
Figure 6Schematic of mass fluxes at Dronning Maud Land (DML) for (a) annual mean scenario and (b) January scenario.
However, at relatively low snow accumulation sites where photolysis drives the fractionation of from the surface snow to atmosphere (Frey et al., 2009), it is necessary to take into account the skin layer in the mass flux budget as this air–snow interface is where air–snow transfer of takes place. In scenario 2, we utilize the available mass concentrations measured in aerosol, skin layer, and snow pits from the ISOL-ICE campaign to estimate the mass flux budget for January 2017 (Fig. 6b). The dry deposition mass flux of atmospheric during January 2017 at DML averages 64±38 pg m−2 s−1 (Table S2) and is greater than the annual mean flux estimated by Pasteris et al. (2014) and Weller and Wagenbach (2007), which is to be expected given the higher atmospheric mass concentrations in summer (Fig. 5). Our wet deposition mass flux of 296 pg m−2 s−1 is also greater than the wet deposition flux calculated for the greater DML region by Pasteris et al. (2014). Like Dome C, the greatest deposition flux of is to the skin layer, and it is 360 pg m−2 s−1; however only 110 pg m−2 s−1 of is archived. Considering the active skin layer, only 30 % of deposited is archived in the snowpack, while 250 pg m−2 s−1 is re-emitted to the overlaying atmosphere.
Furthermore, the TRANSITS-simulated archived mass flux at DML of 210 pg m−2 s−1 for the base case and 480 pg m−2 s−1 for the 5 cm EFD case overpredict the observed archived mass flux due to the higher simulated archived mass concentrations. Interestingly, the simulated archived mass flux at Dome C (88 pg m−2 s−1) is lower than DML, yet the deposition flux to the skin layer in January at Dome C is similar to DML. We continue our discussion focusing on the recycling and redistribution of that occurs in the active skin layer, emphasizing its importance.
3.2 Nitrate deposition
3.2.1 Wet and dry deposition
Here we discuss the various processes in which can be deposited to the skin layer at DML. Firstly, we first look at atmospheric deposition in relation to the source region of the air mass. The mean annual wind direction at the site is 65∘ within the clean air sector (Figs. 3 and S5). There are two excursions from the predominant wind direction. The first excursion is between 19 and 22 January, where the wind direction switches to the southwest, i.e. atmosphere transport from the plateau. We do not see elevated mass concentrations during this period nor do we see a marked difference in isotopic signature that is similar to Dome C at this time (Fig. 4). This, in line with air mass back trajectories (not shown), suggests that transport of re-emitted from inland sites of the Antarctic, carrying a distinctively enriched δ15N- signature, did not influence DML during our campaign. The second excursion occurs during a few short periods when the wind direction switches upwind of the station; however, there are no spikes in the mass concentration or a change in the δ15N- signature, and so we can also rule out any downwind contamination from the station.
Secondly, we use modelled daily precipitation at the nearest Regional Atmospheric Climate Model (RACMO2; Van Meijgaard et al., 2008) grid point (75.0014∘ S, 0.3278∘ W; Fig. 3a) to identify the influence of cyclonic intrusions of marine air masses to wet deposition of . We observe that some peaks in the skin layer mass concentration are accompanied by fresh snow laden with relatively high sea salt aerosol mass concentrations and atmospheric mass concentrations, for example on 1, 13, and 18 January 2017 (Fig. S6). However, on other precipitation days, we observe lower atmospheric mass concentrations and higher skin layer mass concentrations that could be a result of HNO3 scavenging. With only 1 month of data it is difficult to see the impact of wet deposition on the mass concentration in the skin layer; i.e. whether fresh snowfall dilutes the mass concentration in the skin layer or whether it scavenges HNO3 (gas-phase), resulting in higher mass concentrations of in the skin layer.
Thirdly, we investigate daily changes in the atmospheric and skin layer mass concentrations and δ15N- over the campaign to see the influence of dry deposition, by adsorption of atmospheric to the snow surface, on the high mass concentrations observed in the skin layer. Temporal variation in the mass concentration and isotopic signature of aerosol and surface snow at DML over January 2017 suggests atmospheric is the source of to the skin layer. Throughout the month, the increase in the skin layer mass concentration of summer appears to be closely related to the decrease in the atmospheric mass concentrations (Fig. 3). There is a lag between atmospheric and skin layer ; i.e. atmospheric mass concentrations precede skin layer mass concentrations by a day or two; however a longer time series is required to confirm this. The lag suggests that atmospheric is a source of to the skin layer, in line with Dome C where the underlying snowpack is the dominant source of to the skin layer via photolytic recycling and redeposition. Furthermore, as atmospheric is deposited to the snow surface, 15N is preferentially removed first, leaving the air isotopically depleted relative to the isotopically enriched snow (Frey et al., 2009). Figures 3 and 4 illustrate that the δ15N- in the atmosphere is depleted with respect to the δ15N- in the skin layer snow. In the short time series, there are some periods where the δ15N- in the snow and atmosphere are in phase, for example, 3–13 January 2017. During other periods, the δ15N- in the snow and atmosphere switch to being out of phase, emphasizing isotopic fractionation during those periods. Both HNO3 and peroxynitric acid (HNO4) can be adsorbed to the snow surface in tandem (Jones et al., 2014), and although we have no direct measurements of these during the campaign, based on previous studies we suggest that HNO3 is dominantly adsorbed to the skin layer (Jones et al., 2007; Chan et al., 2018).
We conclude that scavenging, adsorption, and cyclonic intrusions of marine air masses deliver to the skin layer at DML in summer. During the campaign, deposition is not influenced by the transport of air masses from the polar plateau, which carry a distinct atmospheric δ15N- signature. Interestingly, model results from Zatko et al. (2016), which account for transport of snow-sourced emissions and deposition, show that the deposition of recycled to snow is lowest on the East Antarctic Plateau including the high-elevation DML region.
3.2.2 Temporal variability in nitrate deposition
The simulations in Fig. 5 and observations in Fig. 1 describe the seasonal evolution of deposition to the skin layer from the atmosphere at DML (Sect. 3.1.1 and 3.1.2). The annual cycle is consistent both (i) spatially across a vast area of Antarctica, i.e. South Pole, Dome C, Halley Station, and Neumayer Station (McCabe et al., 2007; Wolff et al., 2008; Erbland et al., 2013; Frey et al., 2009; Wagenbach et al., 1998), and (ii) temporally over last 7 years at Dome C (Fig. 1) (Erbland et al., 2015, 2013; Frey et al., 2009).
We also observe variability on shorter timescales. While not yet observed elsewhere on the Antarctic continent, over the short intensive sampling period at DML we observe significant variability in mass concentrations and δ15N- values that resembles a diurnal cycle. Over 4 h, the skin layer mass concentrations varied by 46 ng g−1, the skin layer δ15N- by 21 ‰, and the atmospheric δ15N- by 18 ‰. Other coastal studies have attributed daily variability to individual storm events (Mulvaney et al., 1998; Weller et al., 1999). The sampling duration in this study is too short to confirm any diurnal patterns, but it would be interesting to investigate this further in future work. We note that due to post-depositional processes (Sect. 3.3) any short-term signals observed in the skin layer are unlikely to be preserved.
3.3 Post-depositional processes
3.3.1 Nitrate redistribution
In corroboration with earlier work on the East Antarctic Plateau, we find clear evidence of redistribution via photolysis at DML and confirmation of our hypothesis that UV photolysis is driving recycling at DML. Firstly, the highly enriched δ15N- values of snow at DML (−3 ‰ to 99 ‰) and the highly depleted atmospheric δ15N- values at DML (−20 ‰ to −49 ‰) are unique to post-depositional processes at low accumulation sites in Antarctica (Fig. S7) and lie outside the range of known anthropogenic, marine, or other natural source end members (e.g. Hastings et al., 2013; Kendall et al., 2007; Hoering, 1957; Miller et al., 2017, 2018; Yu and Elliott, 2017; Li and Wang, 2008; Freyer, 1991; Savarino et al., 2007).
Secondly, denitrification of the snowpack is seen through the δ15N- signature, which evolves from the enriched snowpack (−3 ‰ to 99 ‰), to the skin layer (−22 ‰ to 3 ‰), to the depleted atmosphere (−49 ‰ to −20 ‰), corresponding to mass loss from the snowpack (Figs. 4 and S7). Denitrification causes the δ15N- of the residual snowpack to increase exponentially as mass concentrations decrease.
Thirdly, sensitivity analysis with TRANSITS, where photolysis is the driving process, is able to explain the observed snow pit δ15N- variability when the e-folding depth is taken into account (Sect. 3.5).
Fourthly, enrichment of δ15N- is observed in the top 30 cm of the snowpack at DML indicating photolytic redistribution at DML in the photic zone of the snowpack (Fig. 4). In the photic zone, the δ15N- observations closely match the simulated δ15N- values from TRANSITS (Sect. 3.5).
Lastly, calculated fractionation constants (15εapp) using our simulated results from the TRANSITS model base case (15εapp average of −19 ‰ for the top 30 cm, i.e. active photic zone with an e-folding depth of 10 cm) fall in the range of expected 15εapp values ( ‰) within the “transition zone” characterized by snow accumulation rates typical of sites located between the Antarctic Plateau and coast (5–20 cm yr−1 w.e.; Erbland et al. 2015). However, the 15εapp for the 5 cm EFD case (15εapp average of −11 ‰) is lower than predicted for a site with the same snow accumulation rate, highlighting the sensitivity of e-folding depth on redistribution. Erbland et al. (2013) noted that uncertainties in the 15εapp for snow pits in the transition zone were greater than coastal and plateau zones, indicating that the assumed single-loss Rayleigh model is not appropriate for transition zones. The discrepancy between our observed (12 ‰) and simulated (−19 ‰ and −11 ‰ for the base case and 5 cm EFD case, respectively) 15εapp is due to the higher snow accumulation rate, which preserves seasonality, and with a noisy signal, there is no pure separation of the loss processes assuming Rayleigh isotopic fractionation.
3.3.2 Nitrate recycling
Only three studies have attempted to quantify the degree of recycling between the air and snow (Davis et al., 2008; Erbland et al., 2015; Zatko et al., 2016). Erbland et al. (2015) used the TRANSITS model to estimate that is recycled four times on average before burial beneath the photic zone at Dome C, similar to the findings of Davis et al. (2008) for the same site. Using the approach of Erbland et al. (2015), we find that is recycled three times on average before it is archived at DML for the base case and two times on average for the 5 cm EFD case. Thus, a shallower e-folding depth reduces the recycling strength. Although these findings are consistent with spatial patterns of recycling factors across Antarctica reported by Zatko et al. (2016), predictions for the DML region are almost double our estimates. As Dome C and DML lie on the same latitude (75∘ S), incoming UV radiation (except for cloud cover) should not impact the efficiency of photolysis and thus recycling at the two sites. Below we provide some explanations for the weakened recycling at DML.
-
Higher snow accumulation rate. The TRANSITS modelling shows the influence of the snow accumulation rate on the depth profile of mass concentration and δ15N-, including the preservation of a seasonal cycle at higher snow accumulation rates (Sect. 3.5.2). At low-accumulation sites, i.e. Dome C, the annual layer thickness is thinner so that in those layers is exposed to sunlight (and the actinic flux) and photochemical processes for longer, resulting in strong recycling and δ15N- enrichment in the snowpack. At DML, which has a higher snow accumulation rate than Dome C, the snow layers are buried more rapidly, leaving less time for HNO3 to adsorb to the skin layer and less time for photolysis to redistribute snowpack to the overlying air for re-adsorption to the skin layer. Therefore, photolysis-driven recycling of is largely dependent on the time that remains in the snow photic zone.
-
Shallower e-folding depth. Based on measurements we derived an e-folding depth for DML ranging between 2 and 5 cm (Fig. S1). The standard deviations and variability between profiles (Table S3), reflect both systematic experimental errors and spatial variability in snow optical properties. e-folding depths at DML are similar to previous model estimates for South Pole (Wolff et al., 2002); however mean summer e-folding depths predicted for the DML region by Zatko et al. (2016) are overestimated by an order of magnitude. However, the e-folding depth at Dome C is considerably deeper, ranging between 10 and 20 cm depending on the snow properties (France et al., 2011). The origin of the reduced e-folding depth relative to Dome C is not known but is likely due to greater HUmic-LIke Substances (HULIS)/impurity content or different snow morphology (density and grain size of snow crystals) (Libois et al., 2013; Zatko et al., 2013; Brucker et al., 2010). In terms of published values, impurity concentrations are generally higher at DML, for example dust and major ion concentrations (Delmonte et al., 2019; Legrand and Delmas, 1988), due to proximity of marine sources. Yet station pollution is greater at Dome C (Helmig et al., 2020). Spatial patterns of modelled e-folding depths across Antarctica predict shallower e-folding depths in regions of relatively high black carbon concentrations located on the plateau in Antarctica (Zatko et al., 2016). In contrast, we observe a opposite pattern of higher black carbon concentrations and a deeper e-folding depth at Dome C compared to a shallower e-folding depth at DML. Therefore, the observed shallower e-folding depth at DML appears unrelated to black carbon concentrations as the modelling by Zatko et al. (2016) predicts a greater e-folding depth in the DML region where black carbon concentrations are lower. Furthermore, there is considerate variability in snow grain size across Antarctica. The larger e-folding depth in wind crust layers at Dome C is due to larger grain sizes in those layers (France et al., 2011). Snow grain size may be smaller at DML, which will increase scattering (Brucker et al., 2010), but further work is required to confirm if this is the dominate factor influencing the lower e-folding depth at DML. Sensitivity studies show that impurities make a small contribution to the e-folding depth compared to scattering by snow grains which dominate (France et al., 2011; Chan et al., 2015; Zatko et al., 2013).
-
Lower photolysis rate. For the 1 to 14 January 2017 period, model estimates of scaled approximately linearly with e-folding depth were 0.4, 1.0, and 1.9×10¹¹ molecule m−2 s−1 for e-folding depths of 2, 5, and 10 cm, respectively. Spatial variability in in the top 30 cm of surface snow at DML based on snow pits A and B is on the order of 13 % inducing similar variability in the model estimates of . Estimates of at Dome C, based on the same model during 1 to 14 January 2012, were larger with 1.2–7.3×10¹¹ molecule m−2 s−1 (Frey et al., 2013), mostly due to larger J() values observed above the surface as well as a larger e-folding depth (10 cm near the surface). It should be borne in mind that the above simple model estimates (Eq. 8) may significantly underestimate the real emission flux. Previous comparisons of computed with Eq. (8) and measured at Dome C showed that observations can exceed model predictions by up to a factor 50 (Frey et al., 2015, 2013). While mass concentrations in snow, the surface actinic flux, and the e-folding depth were measured at the DML field site, the quantum yield of photolysis in surface snow (Φ) was not but introduces significant uncertainty in the model estimates. Previous lab measurements on natural snow samples collected at Dome C showed Φ to vary between 0.003 and 0.05 (Meusinger et al., 2014). As described above (Sect. 2.8) used in Eq. (8) was calculated with Φ at −30 ∘C () after Chu and Anastasio (2003), which is near the lower end of the observed range. Thus, up to half of the mismatch between Eq. (8) and Dome C observations can be explained by adjusting Φ. Another factor contributing to larger fluxes and not included in Eq. (8) is forced ventilation.
In the more sophisticated TRANSITS model, Erbland et al. (2015) found that the photolytic quantum yield was one of the major controls on archived flux and primary input flux at Dome C. Erbland et al. (2015) initially used a quantum yield of at 246 K (France et al., 2011), but it underestimated recycling and overestimated primary trapped in snow. Adjusting the quantum yield to 0.026, within the range observed in the lab (Meusinger et al., 2014), gave more realistic archived δ15N- values. However, at Dome C TRANSITS-simulated fluxes were about a factor of 9–18 higher than observed . Erbland et al. (2015) suggested that the discrepancy could result from the simplifications made in the TRANSITS model regarding the fate of photolysis products.
Therefore, at DML, photolysis produces a lower snow emission flux of NO2 to the atmosphere than at Dome C. This is due to (i) the shallower e-folding depth compared to Dome C, which implies reduced emission flux of NOx, and (ii) the reduced UV exposure time of surface snow due to higher annual snow accumulation compared to Dome C. Furthermore, the large 15εapp associated with photolysis has been determined for snow at Dome C (Berhanu et al., 2014; Frey et al., 2009; Erbland et al., 2013) and DML. At both sites, δ15N- is enriched in the remaining skin layer. However, at DML, the 15εapp is lower, which implies a weaker photolytic loss of associated with a higher snow accumulation rate. The lower snow emission flux of NO2 and lower 15εapp are evidence of a reduced recycling strength at DML relative to Dome C.
-
Lower nitrate uptake at warmer temperatures. The adsorption of HNO3 on ice surfaces is temperature dependent with higher uptake at lower temperatures (Abbatt, 1997; Jones et al., 2014). Nitrate loss by evaporation is also dependent on temperature, with maximum loss at higher temperatures (Thibert and Domine, 1998; Röthlisberger et al., 2000). The seasonal temperature difference at an individual site (i.e. DML or Dome C) could allow a seasonal dependence on the uptake and loss of in the skin layer, which results in the retention of a greater proportion of in summer (Chan et al., 2018). However, there is only a relatively small temperature difference between Dome C and DML (Table 1), which is not enough to drive a large difference in HNO3 uptake (Jones et al., 2014).
-
Lower export of locally produced nitrate. The degree of recycling is also determined by atmospheric transport patterns across Antarctica. Export of locally produced NOx on the Antarctic Plateau leads to greater enrichment in the depth profile of δ15N- relative to the coast due to isotopic mass balance (Savarino et al., 2007; Zatko et al., 2016). Observations of enriched atmospheric δ15N- at the coast suggest that NOx has been sourced from in situ production on the Antarctic Plateau (Savarino et al., 2007; Morin et al., 2009; Shi et al., 2018). If there was less export of away from the DML site than Dome C, locally sourced NOx would be redeposited back to the skin layer at the site, and the depth profile of the δ15N- would not be as dramatically impacted as sites where there is substantial loss of .
3.4 Preservation and archival
We provide new constraints on the archival values and archival time of at DML. By modifying the approach of Weller et al. (2004) by taking the high observed skin layer mass concentrations into account (average of 230 ng g−1 in January for DML), we calculate a post-depositional loss of 60 ng g−1 (or 75 %) and enrichment of 170 ‰ from the snowpack at DML. There is a clear signal of δ15N- enrichment in the top 30 cm of the snowpack where the simulated 5 cm EFD case depth profile parallels the observed depth profile, indicating photolytic redistribution at DML in the photic zone of the snowpack (Sect. 3.5.1). Assuming all is archived below the photic zone, i.e. an e-folding depth of 5 cm, archival occurs below a depth of 15 cm, where has a residence time of 0.75 years in the photic zone corresponding to one summer. At this point, the amplitude of the annual cycle of observed δ15N- at DML does not vary. Archived values were calculated by averaging the mass concentration and δ15N- values below the photic zone, i.e. 15 cm. Our observed archived values of 50 ‰ and 60 ng g−1 for snow pit A and 50 ng g−1 for snow pit B agree well with the mean values of the snow pit below the photic zone and the archived δ15N- value of the 5 cm EFD case. Note that no δ15N- values were measured below 30 cm in snow pit B. For the base case scenario, the simulated archived (i.e. annual average of the first year below 1 m) mass concentration, δ15N-, and mass flux values are 120 ng g−1, 130 ‰, and 210 pg m−2 yr−1, respectively. In comparison, in the 5 cm EFD case, the simulated archived mass concentration, δ15N-, and mass flux values are 280 ng g−1, 50 ‰, and 480 pg m−2 yr−1, respectively. The seasonal variability in the simulated δ15N- depth profile for the 5 cm EFD case is constant between 30 ‰ and 80 ‰ below the photic zone, indicating that no further enrichment or redistribution is taking place in the archived section of the snowpack. The DML site has a lower observed archived δ15N- value and is less sensitive to recycling than expected from TRANSITS modelling of δ15N- along a snow accumulation gradient (Table 2; Erbland et al., 2015), and we suggest this is due to the lower observed e-folding depth than modelled.
Despite the relatively high mass concentrations and enriched δ15N- in the skin layer at DML, clear seasonal cycles remain in the depth profile in contrast to the lower snow accumulation site of Dome C where the depth profile is relatively constant below the photic zone (Fig. 4). At higher snow accumulation rates, the seasonality of atmospheric mass concentrations and δ15N- is preserved due to faster burial. Even at 6 cm yr−1 w.e., the snow layers remain in the active photic zone for 0.75 years, and the weaker recycling factor is low enough to conserve the seasonality. However, at Dome C, snow layers remain within the photic zone for longer (about 3 years or three summers), due to the deeper e-folding depth, and NO2 emission, and redistribution continues until the seasonal cycle becomes smoothed (Fig. 4). At Dome C, archival of occurs below a depth of 30 cm. Compared to Dome C, the archived values at DML have a similar mass concentration (Dome C: 35 ng g−1) but lower δ15N- value (Dome C: 300 ‰), due to the deeper photic zone, stronger redistribution, and recycling there. The greater residence time of in the photic zone at Dome C relative to DML is consistent with modelled spatial patterns of the lifetime of burial across Antarctica where remains in the photic zone for the longest in the lower snow accumulation regions (Zatko et al., 2016). The model predicts archival time to be 3–4 years at DML, which is considerably greater than our estimates.
3.5 Sensitivity of δ15N- to deposition parameters and implications for interpreting ice core records of δ15N- at DML
As first proposed by Frey et al. (2009) and later confirmed by field and lab studies (Erbland et al., 2015; Berhanu et al., 2014; Shi et al., 2019) it is UV photolysis of that dominates post-depositional fractionation of δ15N- in snow and firn. Yet the extent of photolytic fractionation and the δ15N- signature ultimately preserved in firn and ice depends on the UV spectrum of downwelling irradiance and on the time snow layers are exposed to incoming UV radiation. Previous studies showed that δ15N- is sensitive not only to TCO but also to deposition parameters such as the annual snow accumulation rate (Shi et al., 2018; Noro et al., 2018; Erbland et al., 2013). Thus, if all deposition parameters remained constant or are well constrained, it should be theoretically possible to use δ15N- as an ice core proxy for past surface UV radiation and stratospheric ozone. Understanding the depositional parameters and their impact on δ15N- is paramount for the interpretation of δ15N- signals preserved in ice cores. As the interpretation of δ15N- is site specific, we investigate the sensitivity of the δ15N- signature at DML to snow accumulation rate, e-folding depth, and TCO. Throughout Sect. 3.5 we compare sensitivity results to a “base case” simulation which was simulated using the mean annual snow accumulation rate at DML of 6 cm w.e. yr−1 and an e-folding depth of 10 cm. The base case simulation and snow pit δ15N- depth profiles parallel each other in the top 30 cm of the snowpack, but below the active photic zone, there is an offset between the depth profiles in terms of (i) the amplitude of the summer and winter δ15N-values and (ii) the mean δ15N- value (Fig. 7).
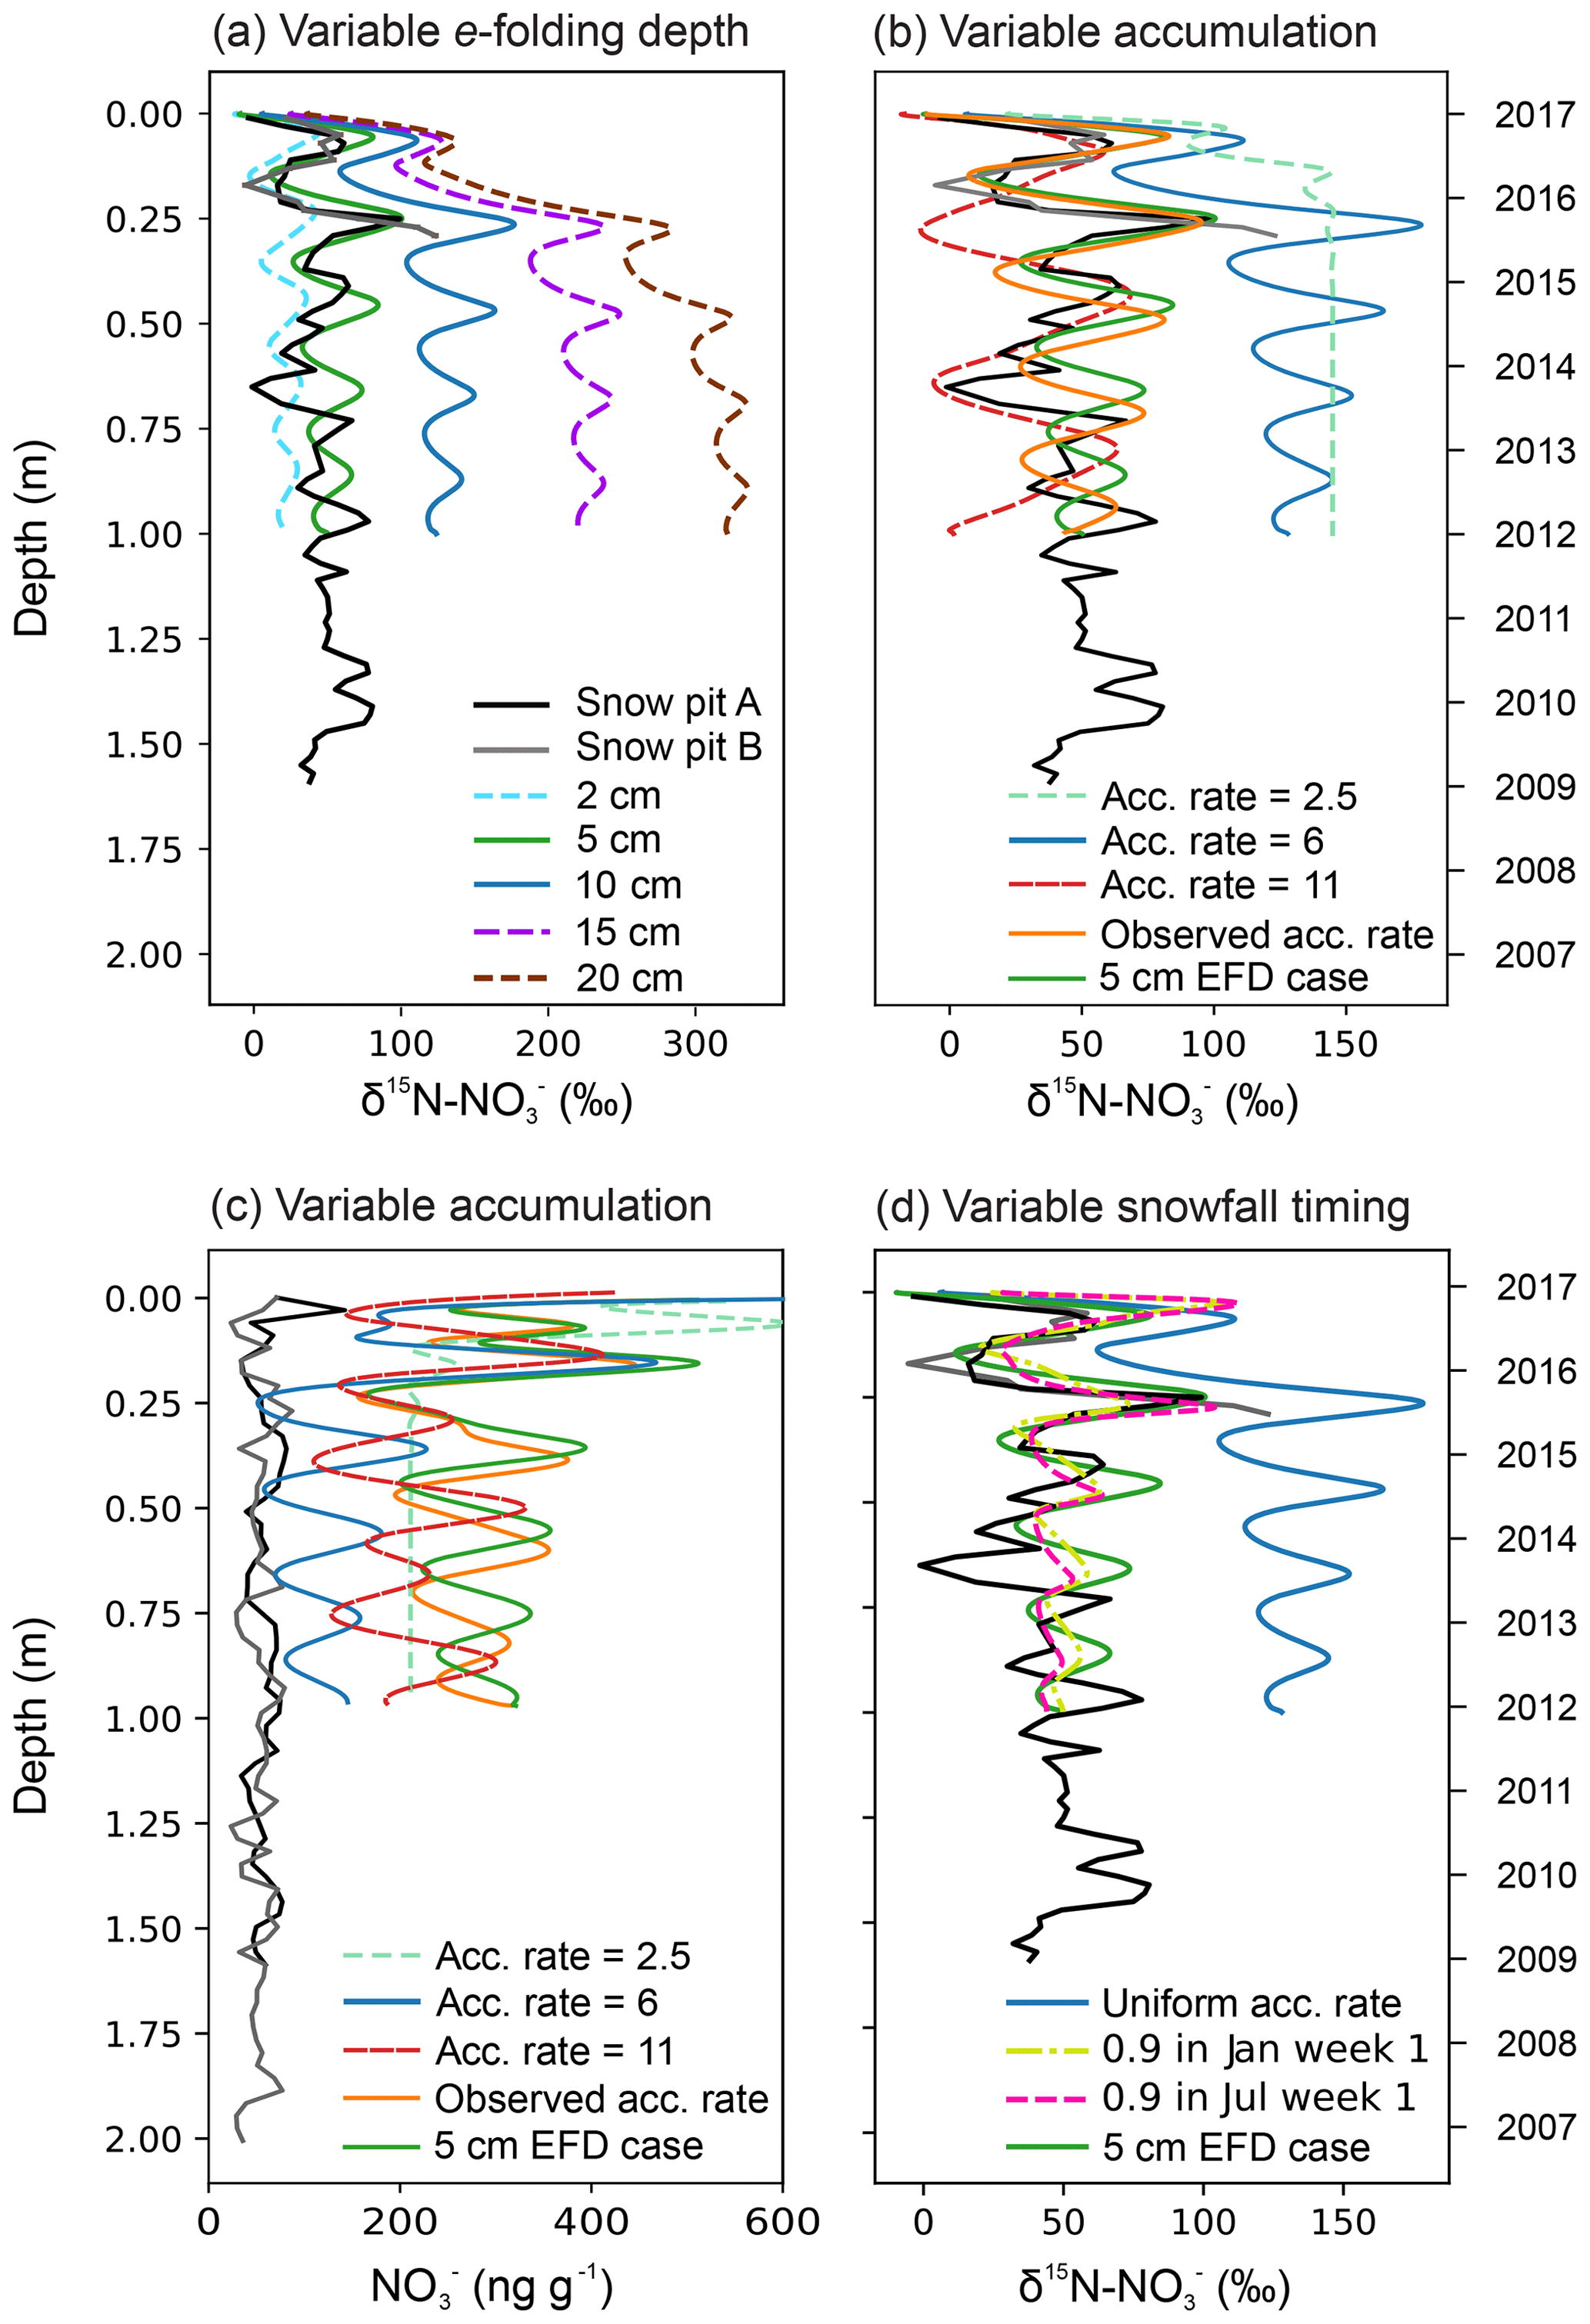
Figure 7Snow pit depth profiles of observations and simulations from TRANSITS. (a) Sensitivity of δ15N- to the e-folding depth. (b) Sensitivity of δ15N- and (c) sensitivity of mass concentration to the upper and lower bounds of accumulation rates observed over the last 1000 years at Dronning Maud Land (DML). Also shown are the depth profiles of the simulated δ15N- values and mass concentration using the observed accumulation rate in our snow pits, i.e. variable accumulation rate with depth (orange line). The observed snow accumulation rate from the snow pits varied between 3.5 and 7.1 cm yr−1 w.e. (d) Sensitivity of δ15N- to the timing of snow accumulation. In each panel, blue is the base case simulation and green is the 5 cm EFD case simulation, which we refer to throughout the study. Note that the nominal date refers to the base case simulation.
3.5.1 Sensitivity of the ice core δ15N- signal to e-folding depth
We measured an e-folding depth at DML between 2 and 5 cm, which is lower than that employed in the base case TRANSITS model simulation (10 cm). Furthermore, a range of e-folding depth values, between 3.7 and 20 cm, have been reported for Antarctica (Wolff et al., 2002; France et al., 2011; Zatko et al., 2016). Although the spatial trends predicted by the modelling of Zatko et al. (2016) are represented at Dome C and DML, an exception is the spatial pattern of the e-folding depth, where we observed a lower e-folding at DML than Dome C, opposite to what the model predicts. At DML, the Zatko et al. (2016) model results overestimate the archival time and recycling factor of , and we suggest this is due to the lower observed than modelled e-folding depth. Furthermore, the positive bias of the TRANSITS base case simulation in archived δ15N- at DML may be due to e-folding depth being smaller than at Dome C as indicated by direct observations. In order to test this assumption, the sensitivity of archived δ15N- to the e-folding depth parameter needs to be quantified, which has not been done before as far as we know. Zatko et al. (2016) modelled the e-folding depth over Antarctica and investigated the impact of snow-sourced NOx fluxes but not on δ15N-.
Sensitivity results of mass concentrations and δ15N- values in the depth profiles for the base case and 5 cm EFD case scenarios are illustrated in Fig. 7. The mass concentration and δ15N- depth profiles for the base case show seasonal variability in the first year with a range of 380 ng g−1 and 20 ‰, which decreases with depth to a range of 95 ng g−1 and 10 ‰ in the fourth year. In comparison, in the 5 cm EFD case, the seasonality of δ15N- and mass concentrations in the first year ranges from 290 ng g−1 and 40 ‰ to 75 ng g−1 and 20 ‰ in the fourth year. Figure 7a shows that the e-folding depth has a large influence on the δ15N- depth profile in terms of (i) depth of the photic zone and thus depth of the δ15N- enrichment and (ii) the mean archived δ15N- value below the photic zone. A larger e-folding depth increases the δ15N- enrichment in the photic zone and increases the archived mean δ15N- value. For example, an e-folding depth of 10 cm at DML gives δ15N- enrichment down to 30 cm and an archived mean δ15N- value of 125 ‰ in the snowpack compared to an e-folding depth of 20 cm, which enriches the snowpack down to 45 cm and more than doubles the archived mean δ15N- value to 320 ‰. Meanwhile, an e-folding depth of 2 cm gives minimal enrichment and a low archived mean δ15N- value of 25 ‰. In comparison to the base case simulation, which has an e-folding depth of 10 cm, a lower e-folding depth of 5 cm decreases the archived mean δ15N- in the snowpack to ∼50 ‰, closely matching our snow pit observations. Hence, a shallower e-folding depth in the range of that observed at DML, i.e. 2–5 cm can explain the more depleted δ15N- snow pit profile, relative to the base case simulation, as photolysis occurs in a shallower depth. Therefore, e-folding depth knowledge is required to understand the sensitivity of archived δ15N- at specific sites. We continue our sensitivity analysis using an e-folding depth of 5 cm and observed accumulation rate and refer to this scenario as our “5 cm EFD case”.
3.5.2 Sensitivity of the ice core δ15N- signal to accumulation rate
The δ15N- signal is also sensitive to the snow accumulation rate at DML. Plotted in Fig. 7b–c are the simulated mass concentration and δ15N- depth profiles for accumulation rates of 2.5 and 11 cm yr−1 w.e. for the 5 cm EFD case. As the accumulation rate increases, the annual layers of δ15N- become thicker, the seasonal amplitude increases, the mean annual δ15N- value decreases, and there is less δ15N- enrichment in the photic zone (Fig. 7b). At very low snow accumulation rates, the seasonal cycle is smoothed, as in the case of Dome C (Fig. 7b). A similar pattern is observed for the simulated mass concentrations with depth: seasonal cycles of mass concentrations are more pronounced at higher snow accumulation rates, while interannual variability is smoothed at very low accumulation rates such as Dome C (Fig. 7c). The relationship between the snow accumulation rate and δ15N- is nonlinear (Fig. 7b–c).
Even in the 5 cm EFD case, there is still an offset with the snow pit δ15N- depth profile below the active photic zone. To account for the offset, we investigated how the timing of snow deposition altered the δ15N- depth profile. Rather than assuming a constant accumulation rate of 6 cm yr−1 w.e., as in the 5 cm EFD case, we find that a variable snow accumulation rate, based on our observations from the snow pit, alters the depth of the summer and winter δ15N- peaks (Fig. 7b). Using the actual annual snow accumulation rate improves the model fit in the top 30 cm. Furthermore, the timing of the snow accumulation throughout the year has significant control over the amplitude of the seasonal δ15N- cycle. Snowfall at DML has a bimodal distribution with higher accumulation in austral autumn and early austral summer (Fig. S8). In Fig. 7d, we modified the timing of the snow accumulation during the year by depositing 90 % of the annual snowfall in (i) the first week of winter and (ii) the first week of summer, which represents the upper bound for snow accumulation in winter and summer, respectively. The remaining 10 % of the annual snowfall is distributed evenly across the rest of the weeks of the year. Summer snow accumulation results in a higher δ15N- enrichment compared to winter snow accumulation, as the exposure of summer layers to UV is longer, and thus photolysis is stronger. Therefore, the timing and rate of snowfall can explain the misalignment between snow pit observations and 5 cm EFD case simulation, which shifts the depth and amplitude of the δ15N- peaks in the depth profile.
On centennial to millennial timescales, the snow accumulation rate has varied in regions of Antarctica (e.g. Thomas et al., 2017), which could potentially modify the degree of post-depositional processing and thus impact the archival and temporal variability in δ15N- in ice cores. For example, the snow accumulation rate varied between 2.5 and 11 cm yr−1 w.e. over the last 1000 years at DML (Sommer et al., 2000). At DML, higher snow accumulation rates would result in lower mass concentrations and more depleted δ15N- values in the skin layer, thus reducing the recycling strength and lowering the sensitivity of the UV proxy recorded in the ice over time and vice versa. TRANSITS modelling predicts that the upper and lower bounds of δ15N- values in a 1000-year ice core from DML that has an accumulation rate between 2.5 and 11 cm yr−1 w.e. and e-folding depth of 5 cm to be between 30 ‰ and 140 ‰. Furthermore, δ15N- values could range between 40 ‰ and 50 ‰ depending on the timing of snowfall and extreme precipitation events, which are known to play a dominant role in snowfall variability across Antarctica (Turner et al., 2019). At DML, snow pit observations suggest that the variation in δ15N- between the polar day and polar night is 20 ‰. This seasonality is less than δ15N- values expected for changes in snow accumulation rates over time. Therefore, any variation in snow accumulation will need to be accounted for in order to observe decadal-, centennial-, and millennial-scale trends in δ15N-.
3.5.3 Sensitivity of ice core δ15N- signal to TCO
Figure 8 shows the sensitivity of δ15N- to variations in TCO. For each week, a constant amount of ozone (e.g. 100 DU) was added or subtracted from these present-day values. A decrease in TCO will increase UV radiation reaching the surface at an ice core site. As a result, stronger photolysis enhances loss, redistribution, and recycling from the snowpack and ultimately decreases the archived mass concentration. Furthermore, a decrease in TCO enriches the δ15N- signature as the snow is exposed to a greater UV dose. We predict that a change of 100 Dobson Units (DU), i.e. the amount that ozone decreases each spring as a result of stratospheric ozone destruction processes, will result in a 10 ‰ change in δ15N- at DML. The variability in δ15N- induced by TCO is less than the seasonal variability of δ15N- recorded in the snow pit (20 ‰) and less than the predicted variability in δ15N- due to changes in snow accumulation (110 ‰) or e-folding depth (100 ‰). As the above sensitivities have been evaluated individually, TCO depletion over many years may still be recoverable from ice core δ15N- if the other factors are constrained. For example, the e-folding depth at the DML site appears stable over the 8-year snow pit; the modelled δ15N- sensitivity of 100 ‰ represents an upper limit for changes in the e-folding depth ranging between 2 and 10 cm, and if the e-folding depth had changed recently, in an irregular manor, a regular annual cycle in δ15N- would not be evident (Fig. 4). Although additional studies of e-folding depth are required to confirm the variability in e-folding depth. The sensitivity of δ15N- to TCO is greater at Dome C than DML (Fig. 8) due to the longer duration of surface snow exposure to UV radiation, stronger recycling and greater enrichment of δ15N- in the photic zone. The sensitivity of δ15N- to recycling at DML is lower than expected from TRANSITS modelling for the same snow accumulation rate by Erbland et al. (2015), namely due to a lower e-folding depth than modelled, and thus the sensitivity of δ15N- as a UV proxy is also lower than expected (Fig. 8). In addition, the oxygen isotopic composition of (δ17O-) has been proposed as a proxy for stratospheric ozone at South Pole station (McCabe et al., 2007); however post depositional processes related to δ17O- need to be quantified to fully understand the sources and processes responsible for depositing and archiving the δ17O- signature in Antarctica.
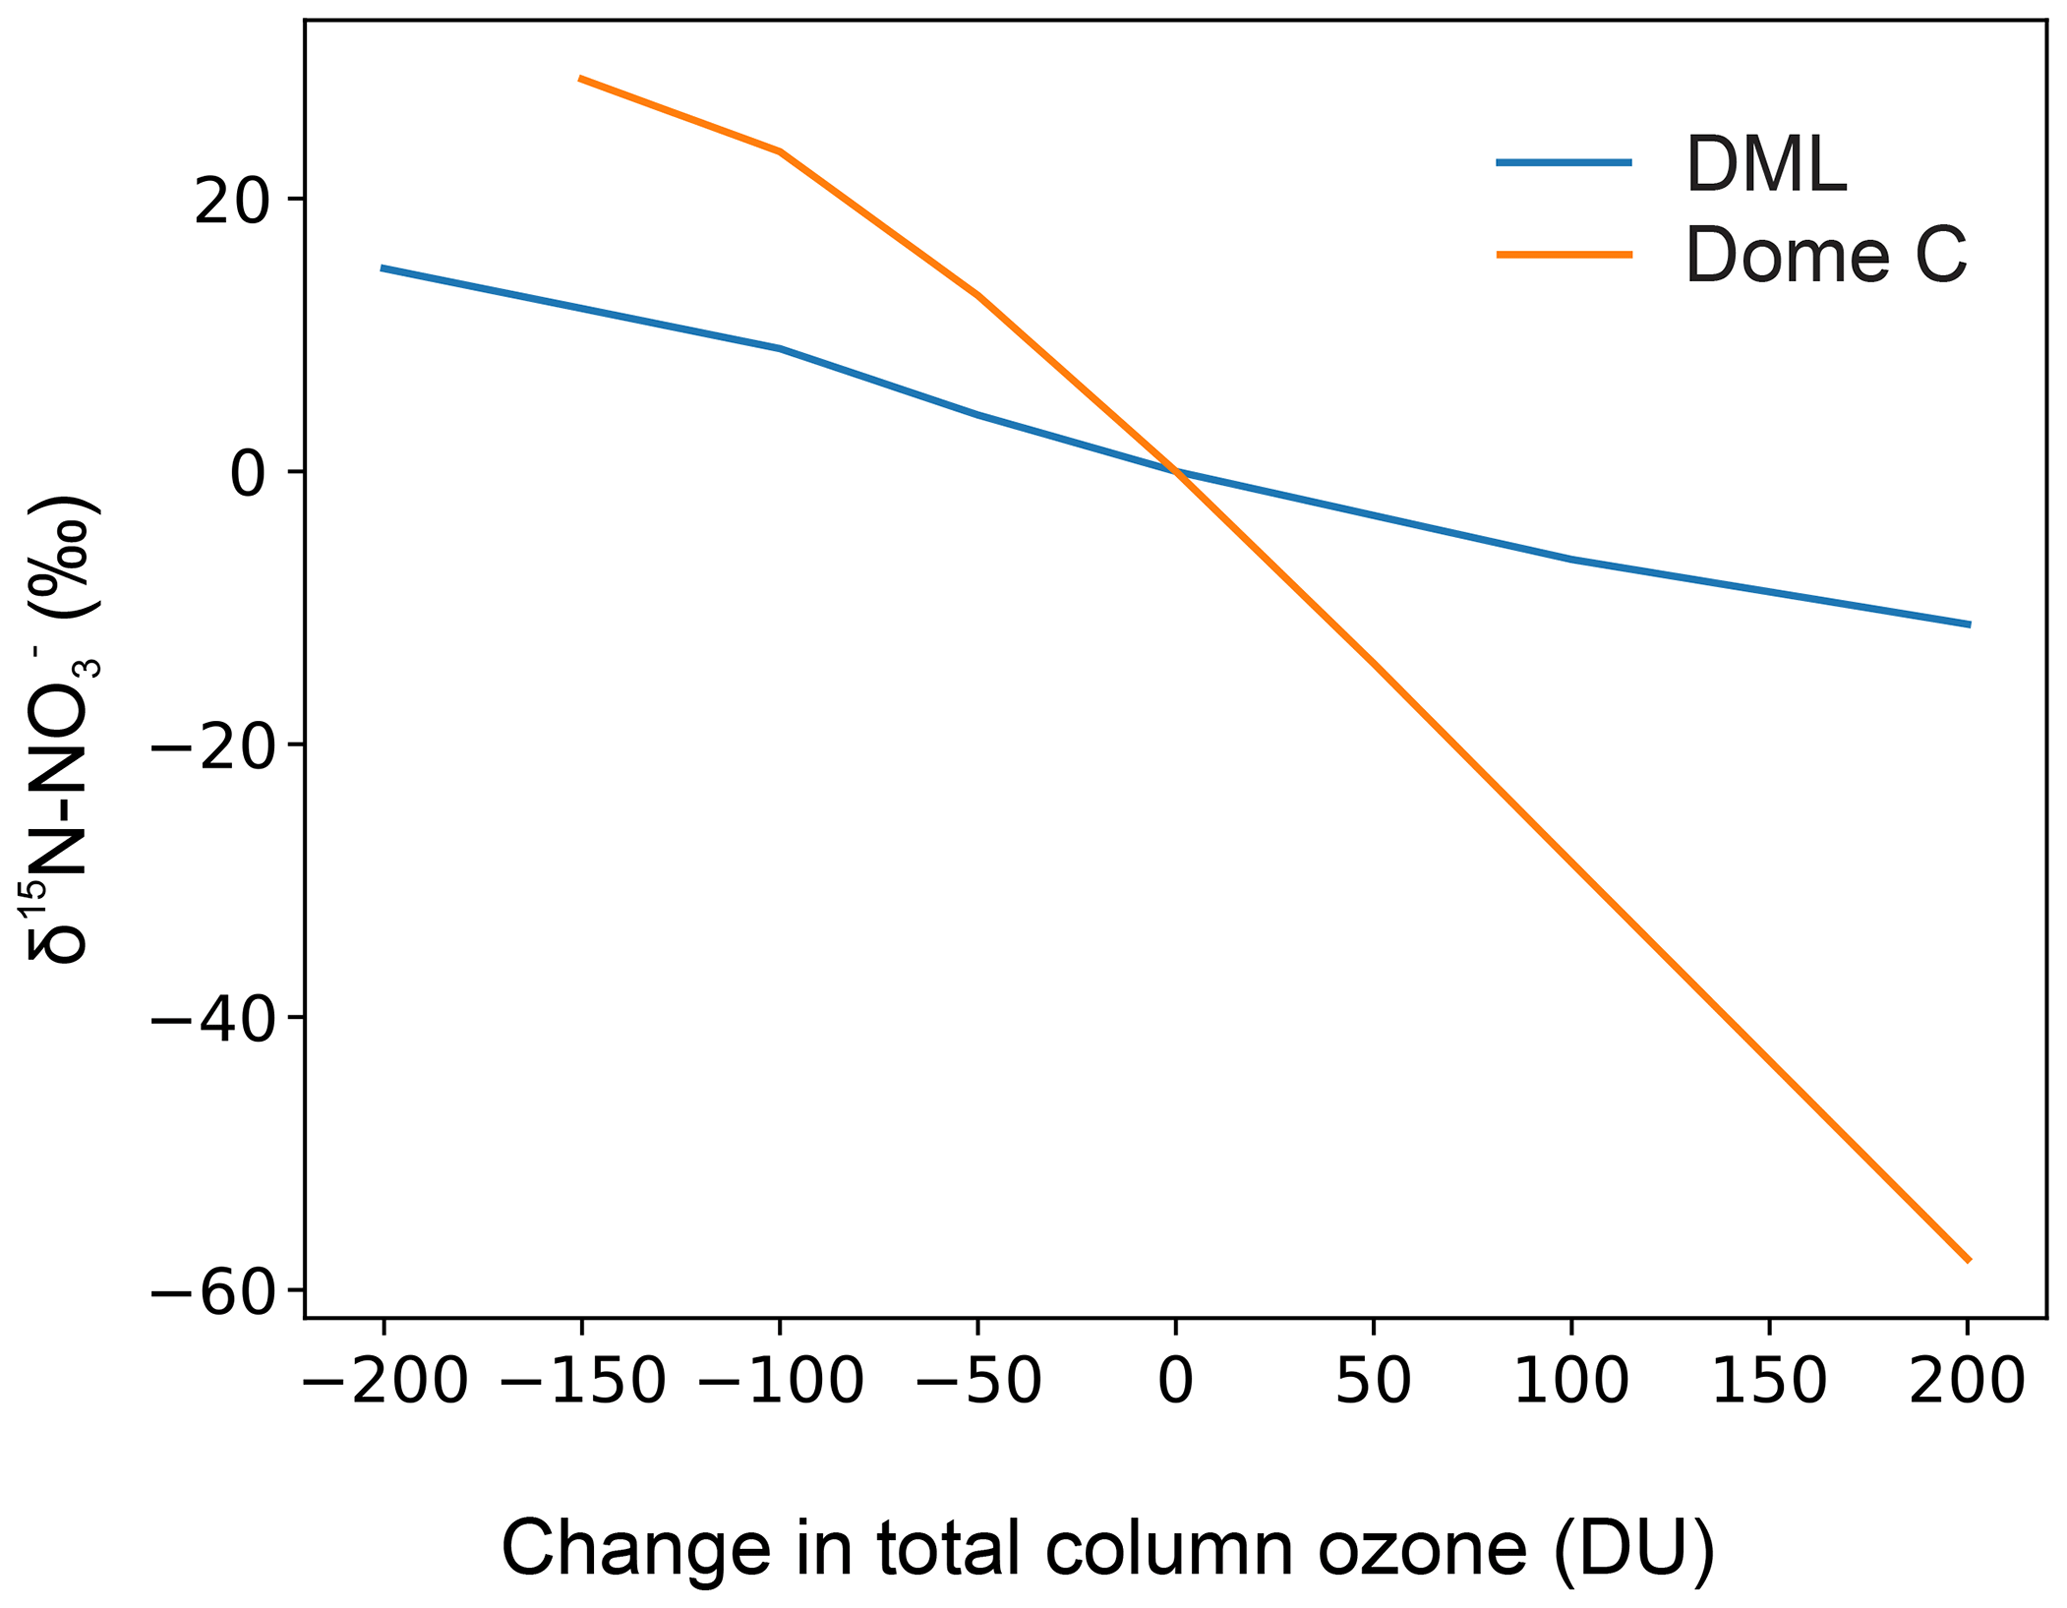
Figure 8Expected response of archived δ15N- to changes in total column ozone at Dronning Maud Land (DML) and Dome C. Calculated sensitives represent an upper range as the real ozone hole lasts from September to November before recovery and not as modelled using the entire sunlit season. Archived DML δ15N- values were simulated using the observed accumulation rate, e-folding depth of 5 cm (5 cm EFD case), and present-day TCO values. These TCO values, which were used in all our calculations, vary weekly and can be found in Table S4. For each week, a constant amount of ozone (e.g. 100 DU) was added or subtracted from these present-day values. Dome C data source: Erbland et al. (2015).
3.5.4 Implications for interpreting ice core δ15N-
Site-specific air–snow transfer studies provide an understanding of the mechanisms that archive δ15N- in ice cores, thus allowing for the interpretation of longer records of δ15N- from the site. Ice core records of archived mass concentrations and δ15N- at DML are a result of two uptake and loss cycles that occur in the top 15 cm during sunlit conditions. While we do not observe further redistribution of in layers deeper than the photic zone, any further diffusion within the firn or ice sections of an ice core can be constrained based on the temperature and snow accumulation rate at DML (Domine et al., 2008). This redistribution unlikely results in a loss of but could migrate to different layers, for example in acidic layers around volcanic horizons (Wolff, 1995).
There are a number of factors that will control the variability in the archived δ15N- signature in ice cores recovered from DML. The δ15N- signature in the snowpack is most sensitive to changes in the snow accumulation rate and e-folding depth, with snowfall timing and TCO playing a smaller role. The e-folding depth could change over time due to higher or lower dust or black carbon concentrations or a change in the snow grain size in a particular snow layer. The snow accumulation rate and e-folding depth could influence the archived δ15N- composition by up to 110 % and 100 %, respectively, over the last 1000 years. This magnitude is comparable to modelled enrichment in ice core δ15N- (0 ‰ to 363 ‰) due to photolysis-driven loss of at low-accumulation sites in Antarctica by Zatko et al. (2016), while the timing of snowfall and changes in TCO will have a smaller impact of 10 ‰ on archived δ15N-. Ice core δ15N- records at DML will be less sensitive to changes in UV than those at Dome C (Fig. 8); however the higher snow accumulation rate and more accurate dating at DML allows for higher resolution ice core δ15N- records. We acknowledge that in addition, other factors such as light-absorbing impurities (Zatko et al., 2013), local meteorology, source of emissions and transport of NOx and , atmospheric oxidant concentrations, and polar formation can influence the rate of recycling and export of snow-sourced NOx. We discussed above that atmospheric δ15N- values are unlikely to be influenced or sourced from snow exported upwind from the polar plateau due to the local meteorology at DML at least for the duration of the campaign. Yet these factors may have changed over time.
Given a variable snow accumulation rate and shallower e-folding depth, which we provide evidence for at DML, the TRANSITS model is able to reproduce our snow pit observations, justifying our previous assumption that photolysis is the main driver of post-depositional processes at DML. In fact, TRANSITS does such a good job at simulating recycling in Antarctica that we recommend that this tool is employed before the commencement of future ice core δ15N- studies to understand the sensitivity of the signal to various factors. Taking changes in snow accumulation into account, it may be possible to reconstruct past UV and TCO on longer timescales from the δ15N- signal in DML ice cores, provided other factors such as the e-folding depth have remained the same.
The nitrogen stable isotopic composition of is a powerful tool for disentangling post-depositional processes affecting ice core signals of at low-accumulation sites in Antarctica. At DML, post-depositional loss of is controlled predominantly by photolysis. Photolysis redistributes between the snowpack and atmosphere, resulting in an enrichment of δ15N- in the skin layer. Nitrate is recycled two times before it is archived in the snowpack below 15 cm and within 0.75 years. Once archived, the seasonal variabilities in δ15N- values and mass concentrations oscillate between −1 ‰ and 80 ‰ and 30 to 80 ng g−1, respectively. The e-folding depth at DML ranges between 2 and 5 cm, which is lower than previous observations at Dome C (10 and 20 cm). As constraints on e-folding depth are critical for calculating photolytic loss of snowpack and for interpreting δ15N- preserved in ice cores, additional studies of e-folding depth across a range of Antarctic sites would help determine key factors influencing this parameter. TRANSITS, a photolysis-driven model, can explain the observed snow depth profiles of δ15N- at DML constrained by an e-folding depth of 5 cm, the observed snow accumulation rate, and variable snowfall timing. TRANSITS sensitivity analysis showed that the δ15N- signature in the snowpack is most sensitive to changes in the e-folding depth (100 ‰ for an 8 cm change in e-folding depth) and the snow accumulation rate (100 ‰ for an 8.5 cm yr−1 w.e. change in annual snow accumulation rate), with snowfall timing (10 ‰ for a change in dominant snowfall season) and total column ozone (10 ‰ for a 100 DU change in TCO) playing a smaller role. The recycling process at DML is weaker than Dome C, largely because of the higher snow accumulation rate and lower e-folding depth. TRANSITS has now been tested at two sites in Antarctica, namely DML and Dome C, and we recommend applying this model to new ice core sites to understand the sensitivity of the δ15N- signal before embarking on new ice core projects. By accounting for variability in the snow accumulation rate and assuming a constant e-folding depth, it may be possible to reconstruct past UV radiation at ice core sites with very a low accumulation rate and low accumulation variability, as low accumulation variability will have little effect on δ15N- in comparison to the UV dose reaching the ground.
The dataset for the DML nitrate isotopic ratios and nitrate mass concentrations in aerosol, skin layer, and snow pits is available through the Polar Data Centre at https://doi.org/10.5285/1467b446-54eb-45c1-8a31-f4af21e60e60 (Winton et al., 2019a), and supporting data are also included as figures and tables in the Supplement.
The supplement related to this article is available online at: https://doi.org/10.5194/acp-20-5861-2020-supplement.
VHLW, JS, and MF designed the research. VHLW and MF and JS and NC collected samples at DML and Dome C, respectively. VHLW analysed the major ion data. VHLW, LH, and NC analysed the nitrate isotope data. AM and VHLW designed the TRANSITS experiments. AM performed the TRANSITS experiments. MMF did e-folding depth and snow emission flux calculations. VHLW prepared the paper with contributions from all coauthors.
The authors declare that they have no conflict of interest.
We would like to thank British Antarctic Survey (BAS) and Alfred Wegener Institute (AWI) staff for their field and logistics support at Halley Station and Kohnen Station, respectively. Technical support for nitrate isotope analysis at the Institut des Géosciences de l'Environnement (IGE), Grenoble, was provided by Joris Leglise, Ines Ollivier, and Ilan Bourgeois. We thank Joseph Erbland for providing the TRANSITS model. All winter-over personnel who collected the year-round Dome C samples in extreme conditions, year after year, are deeply acknowledged. In addition, we thank Emily Ludlow, Shaun Miller, Catriona Sinclair, Rebecca Tuckwell, and Neil Brough for technical support at BAS. Thanks to James France for discussions around the e-folding depth measurements and interpretation and to John Turner for discussions of the local meteorology. We acknowledge Utrecht University who supplied the AWS data for AWS9 at DML05/Kohnen (https://www.projects.science.uu.nl/iceclimate/aws/files_oper/oper_20632, last access: 29 March 2017), and the precipitation data from the RACMO2 model (https://doi.org/10/c2pv, van der Berg et al., 2019). We would like to thank Bodeker Scientific, funded by the New Zealand Deep South National Science Challenge, for providing the combined NIWA-BS total column ozone database. Wind roses were plotted using the openair package in R. We thank two anonymous reviewers whose suggestions improved the paper.
This project was supported by a National Environment Research Council (NERC) Standard Grant (NE/N011813/1) to Markus M. Frey. V. Holly L. Winton would like to thank the University of Cambridge Doctoral Training Programme (DTP) for funding a NERC Research Experience Project (REP) that contributed to this research. Field collection of samples at Dome C was made possible through the programme SUNITEDC/CAPOXI (grant 1011/1177) funded by the Institut Polaire Français IPEV. Joel Savarino and Nicolas Caillon thank the French National Research Agency (Investissements d’avenir grant ANR-15-IDEX-02 and EAIIST grant ANR-16-CE01-0011-01) and the INSU programme LEFE-CHAT for supporting the stable isotope laboratory. This is publication 1 of PANDA platform on which isotope analyses were performed. PANDA was partially funded by the LabEx OSUG@2020 (ANR10 LABX56).
This paper was edited by Markus Ammann and reviewed by two anonymous referees.
Abbatt, J. P.: Interaction of HNO3 with water-ice surfaces at temperatures of the free troposphere, Geophys. Res. Lett., 24, 1479–1482, 1997.
Berhanu, T. A., Meusinger, C., Erbland, J., Jost, R., Bhattacharya, S., Johnson, M. S., and Savarino, J.: Laboratory study of nitrate photolysis in Antarctic snow. II. Isotopic effects and wavelength dependence, J. Chem. Phys., 140, 244306, https://doi.org/10.1063/1.4882899, 2014.
Beyersdorf, A. J., Blake, D. R., Swanson, A., Meinardi, S., Rowland, F., and Davis, D.: Abundances and variability of tropospheric volatile organic compounds at the South Pole and other Antarctic locations, Atmos. Environ., 44, 4565–4574, 2010.
Bohlke, J. K., Gwinn, C. J., and Coplen, T. B.: New reference materials for nitrogen‐isotope‐ratio measurements, Geostandards Newsletter, 17, 159–164, 1993.
Böhlke, J. K., Mroczkowski, S. J. and Coplen, T. B.: Oxygen isotopes in nitrate: New reference materials for 18O: 17O: 16O measurements and observations on nitrate‐water equilibration, Rapid Commun. Mass Sp., 17, 1835–1846, 2003.
Blunier, T., Floch, G. L., Jacobi, H. W., and Quansah, E.: Isotopic view on nitrate loss in Antarctic surface snow, Geophys. Res. Lett., 32, L13501, https://doi.org/10.1029/2005GL023011, 2005.
Bock, J., Savarino, J., and Picard, G.: Air–snow exchange of nitrate: a modelling approach to investigate physicochemical processes in surface snow at Dome C, Antarctica, Atmos. Chem. Phys., 16, 12531–12550, https://doi.org/10.5194/acp-16-12531-2016, 2016.
Brucker, L., Picard, G., and Fily, M.: Snow grain-size profiles deduced from microwave snow emissivities in Antarctica, J. Glaciol., 56, 514–526, 2010.
Chan, H. G., King, M. D., and Frey, M. M.: The impact of parameterising light penetration into snow on the photochemical production of NOx and OH radicals in snow, Atmos. Chem. Phys., 15, 7913–7927, https://doi.org/10.5194/acp-15-7913-2015, 2015.
Chan, H. G., Frey, M. M., and King, M. D.: Modelling the physical multiphase interactions of HNO3 between snow and air on the Antarctic Plateau (Dome C) and coast (Halley), Atmos. Chem. Phys., 18, 1507–1534, https://doi.org/10.5194/acp-18-1507-2018, 2018.
Chance, K. and Kurucz, R. L.: An improved high-resolution solar reference spectrum for earth's atmosphere measurements in the ultraviolet, visible, and near infrared, J. Quant. Spectrosc. Ra., 111, 1289–1295, 2010.
Chu, L. and Anastasio, C.: Quantum yields of hydroxyl radical and nitrogen dioxide from the photolysis of nitrate on ice, J. Phys. Chem. A, 107, 9594–9602, 2003.
Davis, D., Chen, G., Buhr, M., Crawford, J., Lenschow, D., Lefer, B., Shetter, R., Eisele, F., Mauldin, L., and Hogan, A.: South Pole NOx chemistry: an assessment of factors controlling variability and absolute levels, Atmos. Environ., 38, 5375–5388, 2004a.
Davis, D., Eisele, F., Chen, G., Crawford, J., Huey, G., Tanner, D., Slusher, D., Mauldin, L., Oncley, S., and Lenschow, D.: An overview of ISCAT 2000, Atmos. Environ., 38, 5363–5373, 2004b.
Davis, D. D., Seelig, J., Huey, G., Crawford, J., Chen, G., Wang, Y., Buhr, M., Helmig, D., Neff, W., and Blake, D.: A reassessment of Antarctic plateau reactive nitrogen based on ANTCI 2003 airborne and ground based measurements, Atmos. Environ., 42, 2831–2848, 2008.
Delmonte, B., Winton, H., Baroni, M., Baccolo, G., Hansson, M., Andersson, P., Baroni, C., Salvatore, M. C., Lanci, L., and Maggi, V.: Holocene dust in East Antarctica: Provenance and variability in time and space, Holocene, 30, 546–558, https://doi.org/10.1177/0959683619875188, 2019.
Domine, F., Albert, M., Huthwelker, T., Jacobi, H.-W., Kokhanovsky, A. A., Lehning, M., Picard, G., and Simpson, W. R.: Snow physics as relevant to snow photochemistry, Atmos. Chem. Phys., 8, 171–208, https://doi.org/10.5194/acp-8-171-2008, 2008.
Dubowski, Y., Colussi, A., and Hoffmann, M.: Nitrogen dioxide release in the 302 nm band photolysis of spray-frozen aqueous nitrate solutions. Atmospheric implications, J. Phys. Chem. A, 105, 4928–4932, 2001.
Duce, R. A., Liss, P. S., Merrill, J. T., Atlas, E. L., Buat-Menard, P., Hicks, B. B., Miller, J. M., Prospero, J. M., Arimoto, R., Church, T. M., Ellis, W., Galloway, J. N., Hansen, L., Jickells, T. D., Knap, A. H., Reinhardt, K. H., Schneider, B., Soudine, A., Tokos, J. J., Tsunogai, S., Wollast, R., and Zhou, M.: The atmospheric input of trace species to the world ocean, Global Biogeochem. Cy., 5, 193–259, https://doi.org/10.1029/91gb01778, 1991.
Erbland, J., Vicars, W. C., Savarino, J., Morin, S., Frey, M. M., Frosini, D., Vince, E., and Martins, J. M. F.: Air–snow transfer of nitrate on the East Antarctic Plateau – Part 1: Isotopic evidence for a photolytically driven dynamic equilibrium in summer, Atmos. Chem. Phys., 13, 6403–6419, https://doi.org/10.5194/acp-13-6403-2013, 2013.
Erbland, J., Savarino, J., Morin, S., France, J. L., Frey, M. M., and King, M. D.: Air–snow transfer of nitrate on the East Antarctic Plateau – Part 2: An isotopic model for the interpretation of deep ice-core records, Atmos. Chem. Phys., 15, 12079–12113, https://doi.org/10.5194/acp-15-12079-2015, 2015.
France, J. and King, M.: The effect of measurement geometry on recording solar radiation attenuation in snowpack (e-folding depth) using fibre-optic probes, J. Glaciol., 58, 417–418, 2012.
France, J. L., King, M. D., Frey, M. M., Erbland, J., Picard, G., Preunkert, S., MacArthur, A., and Savarino, J.: Snow optical properties at Dome C (Concordia), Antarctica; implications for snow emissions and snow chemistry of reactive nitrogen, Atmos. Chem. Phys., 11, 9787–9801, https://doi.org/10.5194/acp-11-9787-2011, 2011.
Frey, M. M., Savarino, J., Morin, S., Erbland, J., and Martins, J. M. F.: Photolysis imprint in the nitrate stable isotope signal in snow and atmosphere of East Antarctica and implications for reactive nitrogen cycling, Atmos. Chem. Phys., 9, 8681–8696, https://doi.org/10.5194/acp-9-8681-2009, 2009.
Frey, M. M., Brough, N., France, J. L., Anderson, P. S., Traulle, O., King, M. D., Jones, A. E., Wolff, E. W., and Savarino, J.: The diurnal variability of atmospheric nitrogen oxides (NO and NO2) above the Antarctic Plateau driven by atmospheric stability and snow emissions, Atmos. Chem. Phys., 13, 3045–3062, https://doi.org/10.5194/acp-13-3045-2013, 2013.
Frey, M. M., Roscoe, H. K., Kukui, A., Savarino, J., France, J. L., King, M. D., Legrand, M., and Preunkert, S.: Atmospheric nitrogen oxides (NO and NO2) at Dome C, East Antarctica, during the OPALE campaign, Atmos. Chem. Phys., 15, 7859–7875, https://doi.org/10.5194/acp-15-7859-2015, 2015.
Freyer, H.: Seasonal variation of 15N∕14N ratios in atmospheric nitrate species, Tellus B, 43, 30–44, 1991.
Geng, L., Zatko, M. C., Alexander, B., Fudge, T., Schauer, A. J., Murray, L. T., and Mickley, L. J.: Effects of postdepositional processing on nitrogen isotopes of nitrate in the Greenland Ice Sheet Project 2 ice core, Geophys. Res. Lett., 42, 5346–5354, 2015.
Geng, L., Murray, L. T., Mickley, L. J., Lin, P., Fu, Q., Schauer, A. J., and Alexander, B.: Isotopic evidence of multiple controls on atmospheric oxidants over climate transitions, Nature, 546, 133–136, https://doi.org/10.1038/nature22340, 2017.
Göktas, F., Fischer, H., Oerter, H., Weller, R., Sommer, S., and Miller, H.: A glacio-chemical characterization of the new EPICA deep-drilling site on Amundsenisen, Dronning Maud Land, Antarctica, Ann. Glaciol., 35, 347–354, 2002.
Hastings, M., Jarvis, J., and Steig, E.: Anthropogenic impacts on nitrogen isotopes of ice-core nitrate, Science, 324, 1288–1288, 2009.
Hastings, M. G., Steig, E., and Sigman, D.: Seasonal variations in N and O isotopes of nitrate in snow at Summit, Greenland: Implications for the study of nitrate in snow and ice cores, J. Geophys. Res.-Atmos., 109, D20306, https://doi.org/10.1029/2004JD004991, 2004.
Hastings, M. G., Casciotti, K. L., and Elliott, E. M.: Stable isotopes as tracers of anthropogenic nitrogen sources, deposition, and impacts, Elements, 9, 339–344, 2013.
Hauglustaine, D., Granier, C., Brasseur, G., and Megie, G.: The importance of atmospheric chemistry in the calculation of radiative forcing on the climate system, J. Geophys. Res.-Atmos., 99, 1173–1186, 1994.
Helmig, D., Liptzin, D., Hueber, J., and Savarino, J.: Impact of exhaust emissions on chemical snowpack composition at Concordia Station, Antarctica, The Cryosphere, 14, 199–209, https://doi.org/10.5194/tc-14-199-2020, 2020.
Hoering, T.: The isotopic composition of the ammonia and the nitrate ion in rain, Geochim. Cosmochim. Ac., 12, 97–102, 1957.
Hofstede, C. M., van de Wal Roderik, S., Kaspers, K. A., Van Den Broeke, M. R., Karlöf, L., Winther, J.-G., Isaksson, E., Lappegard, G., Mulvaney, R., and Oerter, H.: Firn accumulation records for the past 1000 years on the basis of dielectric profiling of six cores from Dronning Maud Land, Antarctica, J. Glaciol., 50, 279–291, 2004.
Hofzumahaus, A., Lefer, B., Monks, P., Hall, S., Kylling, A., Mayer, B., Shetter, R., Junkermann, W., Bais, A., and Calvert, J.: Photolysis frequency of O3 to O(1D): Measurements and modeling during the International Photolysis Frequency Measurement and Modeling Intercomparison (IPMMI), J. Geophys. Res.-Atmos., 109, D08S90, https://doi.org/10.1029/2003JD004333, 2004.
Honrath, R., Peterson, M. C., Guo, S., Dibb, J. E., Shepson, P., and Campbell, B.: Evidence of NOx production within or upon ice particles in the Greenland snowpack, Geophys. Res. Lett., 26, 695–698, 1999.
Huey, L. G., Tanner, D., Slusher, D., Dibb, J. E., Arimoto, R., Chen, G., Davis, D., Buhr, M., Nowak, J., and Mauldin Iii, R.: CIMS measurements of HNO3 and SO2 at the South Pole during ISCAT 2000, Atmos. Environ., 38, 5411–5421, 2004.
Jacobi, H.-W., Weller, R., Jones, A., Anderson, P., and Schrems, O.: Peroxyacetyl nitrate (PAN) concentrations in the Antarctic troposphere measured during the photochemical experiment at Neumayer (PEAN'99), Atmos. Environ., 34, 5235–5247, 2000.
Jones, A., Weller, R., Minikin, A., Wolff, E., Sturges, W., McIntyre, H., Leonard, S., Schrems, O., and Bauguitte, S.: Oxidized nitrogen chemistry and speciation in the Antarctic troposphere, J. Geophys. Res.-Atmos., 104, 21355–21366, 1999.
Jones, A., Weller, R., Wolff, E., and Jacobi, H. W.: Speciation and rate of photochemical NO and NO2 production in Antarctic snow, Geophys. Res. Lett., 27, 345–348, 2000.
Jones, A., Weller, R., Anderson, P., Jacobi, H. W., Wolff, E., Schrems, O., and Miller, H.: Measurements of NOx emissions from the Antarctic snowpack, Geophys. Res. Lett., 28, 1499–1502, 2001.
Jones, A. E., Wolff, E. W., Ames, D., Bauguitte, S. J.-B., Clemitshaw, K. C., Fleming, Z., Mills, G. P., Saiz-Lopez, A., Salmon, R. A., Sturges, W. T., and Worton, D. R.: The multi-seasonal NOy budget in coastalAntarctica and its link with surface snowand ice core nitrate: results from theCHABLIS campaign, Atmos. Chem. Phys. Discuss., 7, 4127–4163, 2007.
Jones, A. E., Brough, N., Anderson, P. S., and Wolff, E. W.: HO2NO2 and HNO3 in the coastal Antarctic winter night: a “lab-in-the-field” experiment, Atmos. Chem. Phys., 14, 11843–11851, https://doi.org/10.5194/acp-14-11843-2014, 2014.
Keene, W. C., Pszenny, A. A., Galloway, J. N., and Hawley, M. E.: Sea-salt corrections and interpretation of constituent ratios in marine precipitation, J. Geophys. Res.-Atmos., 91, 6647–6658, 1986.
Kendall, C., Elliott, E. M., and Wankel, S. D.: Tracing anthropogenic inputs of nitrogen to ecosystems, Stable isotopes in ecology and environmental science, 2, 375–449, 2007.
Kukui, A., Loisil, R., Kerbrat, M., Frey, M., Gil Roca, J., Jourdain, B., Ancellet, G., Bekki, S., Legrand, M., and Preunkert, S.: OH and RO2 radicals at Dome C (East Antarctica): first observations and assessment of photochemical budget, EGU General Assembly, Vienna, Austria, 2013.
Lee, H.-M., Henze, D. K., Alexander, B., and Murray, L. T.: Investigating the sensitivity of surface-level nitrate seasonality in Antarctica to primary sources using a global model, Atmos. Environ., 89, 757–767, 2014.
Lee-Taylor, J. and Madronich, S.: Calculation of actinic fluxes with a coupled atmosphere–snow radiative transfer model, J. Geophys. Res.-Atmos., 107, 4796, https://doi.org/10.1029/2002JD002084, 2002.
Legrand, M. R. and Delmas, R. J.: Soluble impurities in four Antarctic ice cores over the last 30 000 years, Ann. Glaciol., 10, 116–120, 1988.
Le Meur, E., Magand, O., Arnaud, L., Fily, M., Frezzotti, M., Cavitte, M., Mulvaney, R., and Urbini, S.: Spatial and temporal distributions of surface mass balance between Concordia and Vostok stations, Antarctica, from combined radar and ice core data: first results and detailed error analysis, The Cryosphere, 12, 1831–1850, https://doi.org/10.5194/tc-12-1831-2018, 2018.
Li, D. and Wang, X.: Nitrogen isotopic signature of soil-released nitric oxide (NO) after fertilizer application, Atmos. Environ., 42, 4747–4754, https://doi.org/10.1016/j.atmosenv.2008.01.042, 2008.
Libois, Q., Picard, G., France, J. L., Arnaud, L., Dumont, M., Carmagnola, C. M., and King, M. D.: Influence of grain shape on light penetration in snow, The Cryosphere, 7, 1803–1818, https://doi.org/10.5194/tc-7-1803-2013, 2013.
Mariotti, A.: Atmospheric nitrogen is a reliable standard for natural 15N abundance measurements, Nature, 303, 685–687, 1983.
McCabe, J. R., Thiemens, M. H., and Savarino, J.: A record of ozone variability in South Pole Antarctic snow: Role of nitrate oxygen isotopes, J. Geophys. Res.-Atmos., 112, D12303, https://doi.org/10.1029/2006JD007822, 2007.
Meusinger, C., Berhanu, T. A., Erbland, J., Savarino, J., and Johnson, M. S.: Laboratory study of nitrate photolysis in Antarctic snow. I. Observed quantum yield, domain of photolysis, and secondary chemistry, J. Chem. Phys., 140, 244305, https://doi.org/10.1063/1.4882898, 2014.
Miller, D. J., Wojtal, P. K., Clark, S. C., and Hastings, M. G.: Vehicle NOx emission plume isotopic signatures: Spatial variability across the eastern United States, J. Geophys. Res.-Atmos., 122, 4698–4717, 2017.
Miller, D. J., Chai, J., Guo, F., Dell, C. J., Karsten, H., and Hastings, M. G.: Isotopic Composition of In Situ Soil NOx Emissions in Manure-Fertilized Cropland, Geophys. Res. Lett., 45, 12058–12066, 2018.
Morin, S., Savarino, J., Frey, M. M., Yan, N., Bekki, S., Bottenheim, J. W., and Martins, J. M.: Tracing the origin and fate of NOx in the Arctic atmosphere using stable isotopes in nitrate, Science, 322, 730–732, 2008.
Morin, S., Savarino, J., Frey, M. M., Domine, F., Jacobi, H. W., Kaleschke, L., and Martins, J. M.: Comprehensive isotopic composition of atmospheric nitrate in the Atlantic Ocean boundary layer from 65 S to 79 N, J. Geophys. Res.-Atmos., 114, D05303, https://doi.org/10.1029/2008JD010696, 2009.
Mosley-Thompson, E., Paskievitch, J. F., Gow, A. J., and Thompson, L. G.: Late 20th century increase in South Pole snow accumulation, J. Geophys. Res.-Atmos., 104, 3877–3886, 1999.
Mulvaney, R. and Wolff, E. W.: Evidence for winter/spring denitrification of the stratosphere in the nitrate record of Antarctic firn cores, J. Geophys. Res.-Atmos., 98, 5213–5220, 1993.
Mulvaney, R., Wagenbach, D., and Wolff, E.: Postdepositional change in snowpack nitrate from observation of year-round near-surface snow in coastal Antarctica, J. Geophys. Res.-Atmos., 103, 11021–11031, 1998.
Noro, K., Hattori, S., Uemura, R., Fukui, K., Hirabayashi, M., Kawamura, K., Motoyama, H., Takenaka, N., and Yoshida, N.: Spatial variation of isotopic compositions of snowpack nitrate related to post-depositional processes in eastern Dronning Maud Land, East Antarctica, Geochem. J., 52, e7–e14, https://doi.org/10.2343/geochemj.2.0519, 2018.
Oerter, H., Wilhelms, F., Jung-Rothenhäusler, F., Göktas, F., Miller, H., Graf, W., and Sommer, S.: Accumulation rates in Dronning Maud Land, Antarctica, as revealed by dielectric-profiling measurements of shallow firn cores, Ann. Glaciol., 30, 27–34, 2000.
Oncley, S., Buhr, M., Lenschow, D., Davis, D., and Semmer, S.: Observations of summertime NO fluxes and boundary-layer height at the South Pole during ISCAT 2000 using scalar similarity, Atmos. Environ., 38, 5389–5398, 2004.
Pasteris, D., McConnell, J. R., Edwards, R., Isaksson, E., and Albert, M. R.: Acidity decline in Antarctic ice cores during the Little Ice Age linked to changes in atmospheric nitrate and sea salt concentrations, J. Geophys. Res.-Atmos., 119, 5640–5652, 2014.
Reijmer, C. and Oerlemans, J.: Temporal and spatial variability of the surface energy balance in Dronning Maud Land, East Antarctica, J. Geophys. Res.-Atmos., 107, ACL 9-1–ACL 9-12, 2002.
Röthlisberger, R., Hutterli, M. A., Sommer, S., Wolff, E. W., and Mulvaney, R.: Factors controlling nitrate in ice cores: Evidence from the Dome C deep ice core, J. Geophys. Res.-Atmos., 105, 20565–20572, 2000.
Röthlisberger, R., Hutterli, M. A., Wolff, E. W., Mulvaney, R., Fischer, H., Bigler, M., Goto-Azuma, K., Hansson, M. E., Ruth, U., and Siggaard-Andersen, M.-L.: Nitrate in Greenland and Antarctic ice cores: a detailed description of post-depositional processes, Ann. Glaciol., 35, 209–216, 2002.
Savarino, J., Kaiser, J., Morin, S., Sigman, D. M., and Thiemens, M. H.: Nitrogen and oxygen isotopic constraints on the origin of atmospheric nitrate in coastal Antarctica, Atmos. Chem. Phys., 7, 1925–1945, https://doi.org/10.5194/acp-7-1925-2007, 2007.
Seinfeld, J. H. and Pandis, S. N.: From air pollution to climate change, Atmospheric Chemistry and Physics, Wiley, New York, 724–743, 1998.
Shi, G., Buffen, A. M., Hastings, M. G., Li, C., Ma, H., Li, Y., Sun, B., An, C., and Jiang, S.: Investigation of post-depositional processing of nitrate in East Antarctic snow: isotopic constraints on photolytic loss, re-oxidation, and source inputs, Atmos. Chem. Phys., 15, 9435–9453, https://doi.org/10.5194/acp-15-9435-2015, 2015.
Shi, G., Buffen, A., Ma, H., Hu, Z., Sun, B., Li, C., Yu, J., Ma, T., An, C., and Jiang, S.: Distinguishing summertime atmospheric production of nitrate across the East Antarctic Ice Sheet, Geochim. Cosmochim. Ac., 231, 1–14, 2018.
Shi, G., Chai, J., Zhu, Z., Hu, Z., Chen, Z., Yu, J., Ma, T., Ma, H., An, C., and Jiang, S.: Isotope fractionation of nitrate during volatilization in snow: a field investigation in Antarctica, Geophys. Res. Lett., 46, 3287–3297, 2019.
Silva, S., Kendall, C., Wilkison, D., Ziegler, A., Chang, C. C., and Avanzino, R.: A new method for collection of nitrate from fresh water and the analysis of nitrogen and oxygen isotope ratios, J. Hydrol., 228, 22–36, 2000.
Sofen, E. D., Alexander, B., Steig, E. J., Thiemens, M. H., Kunasek, S. A., Amos, H. M., Schauer, A. J., Hastings, M. G., Bautista, J., Jackson, T. L., Vogel, L. E., McConnell, J. R., Pasteris, D. R., and Saltzman, E. S.: WAIS Divide ice core suggests sustained changes in the atmospheric formation pathways of sulfate and nitrate since the 19th century in the extratropical Southern Hemisphere, Atmos. Chem. Phys., 14, 5749–5769, https://doi.org/10.5194/acp-14-5749-2014, 2014.
Sommer, S., Appenzeller, C., Röthlisberger, R., Hutterli, M. A., Stauffer, B., Wagenbach, D., Oerter, H., Wilhelms, F., Miller, H., and Mulvaney, R.: Glacio-chemical study spanning the past 2 kyr on three ice cores from Dronning Maud Land, Antarctica: 1. Annually resolved accumulation rates, J. Geophys. Res.-Atmos., 105, 29411–29421, https://doi.org/10.1029/2000jd900449, 2000.
Thibert, E. and Domine, F.: Thermodynamics and kinetics of the solid solution of HNO3 in ice, J. Phys. Chem. B, 102, 4432–4439, 1998.
Thomas, E. R., van Wessem, J. M., Roberts, J., Isaksson, E., Schlosser, E., Fudge, T. J., Vallelonga, P., Medley, B., Lenaerts, J., Bertler, N., van den Broeke, M. R., Dixon, D. A., Frezzotti, M., Stenni, B., Curran, M., and Ekaykin, A. A.: Regional Antarctic snow accumulation over the past 1000 years, Clim. Past, 13, 1491–1513, https://doi.org/10.5194/cp-13-1491-2017, 2017.
Traversi, R., Usoskin, I., Solanki, S., Becagli, S., Frezzotti, M., Severi, M., Stenni, B., and Udisti, R.: Nitrate in polar ice: a new tracer of solar variability, Sol. Phys., 280, 237–254, 2012.
Turner, J., Phillips, T., Thamban, M., Rahaman, W., Marshall, G. J., Wille, J. D., Favier, V., Winton, H., Thomas, E., and Wang, Z.: The Dominant Role of Extreme Precipitation Events in Antarctic Snowfall Variability, Geophys. Res. Lett., 46, 350–3511, https://doi.org/10.1029/2018GL081517, 2019.
van de Berg, W., van Wessem, M., van de Broeke, M., Turner, J., and Phillips, T.: Antarctic daily precipitation amounts for January 1979–July 2017 from the RACMO version 3p2 limited area atmospheric model, along with flags that indicate extreme precipitation events, UK Polar Data Centre, Natural Environment Research Council, UK Research & Innovation https://doi.org/10.5285/bbf12a6f-7d97-4951-9bd1-e4224e2abac9, 2019.
Van Meijgaard, E., Van Ulft, L., Van de Berg, W., Bosveld, F., Van den Hurk, B., Lenderink, G., and Siebesma, A.: The KNMI regional atmospheric climate model RACMO version 2.1, Koninklijk Nederlands Meteorologisch Instituut, 43, 2008.
Wagenbach, D., Legrand, M., Fischer, H., Pichlmayer, F., and Wolff, E.: Atmospheric near-surface nitrate at coastal Antarctic sites, J. Geophys. Res.-Atmos., 103, 11007–11020, 1998.
Warren, S. G.: Optical properties of snow, Rev. Geophys., 20, 67–89, 1982.
Weller, R. and Wagenbach, D.: Year-round chemical aerosol records in continental Antarctica obtained by automatic samplings, Tellus B, 59, 755–765, 2007.
Weller, R., Minikin, A., König-Langlo, G., Schrems, O., Jones, A., Wolff, E., and Anderson, P.: Investigating possible causes of the observed diurnal variability in Antarctic NOy, Geophys. Res. Lett., 26, 2853–2856, 1999.
Weller, R., Traufetter, F., Fischer, H., Oerter, H., Piel, C., and Miller, H.: Postdepositional losses of methane sulfonate, nitrate, and chloride at the European Project for Ice Coring in Antarctica deep-drilling site in Dronning Maud Land, Antarctica, J. Geophys. Res.-Atmos., 109, D07301, https://doi.org/10.1029/2003JD004189, 2004.
Weller, R., Legrand, M., and Preunkert, S.: Size distribution and ionic composition of marine summer aerosol at the continental Antarctic site Kohnen, Atmos. Chem. Phys., 18, 2413–2430, https://doi.org/10.5194/acp-18-2413-2018, 2018.
Wilhelms, F., Miller, H., Gerasimoff, M. D., Drücker, C., Frenzel, A., Fritzsche, D., Grobe, H., Hansen, S. B., Hilmarsson, S. Æ., Hoffmann, G., Hörnby, K., Jaeschke, A., Jakobsdóttir, S. S., Juckschat, P., Karsten, A., Karsten, L., Kaufmann, P. R., Karlin, T., Kohlberg, E., Kleffel, G., Lambrecht, A., Lambrecht, A., Lawer, G., Schärmeli, I., Schmitt, J., Sheldon, S. G., Takata, M., Trenke, M., Twarloh, B., Valero-Delgado, F., and Wilhelms-Dick, D.: The EPICA Dronning Maud Land deep drilling operation, Ann. Glaciol., 55, 355–366, https://doi.org/10.3189/2014AoG68A189, 2017.
Winton, V. H. L. W., Caillon, N., Hauge, L., Mulvaney, R., Rix, J., Tuckwell, R., Savarino, J., and Frey, M.: Ice core chemistry, density, conductivity, dust, snow accumulation rate, and stable nitrate isotopic composition of the 120 m ISOL-ICE ice core, Dronning Maud Land, Antarctica (Version 1.0) [Data set], UK Polar Data Centre, Natural Environment Research Council, UK Research & Innovation, https://doi.org/10.5285/9c972cfb-0ffa-4144-a943-da6eb82431d2, 2019a.
Winton, V. H. L. W., Frey, M., Hauge, L., Caillon, N., and Savarino, J.: Major ion chemistry and stable nitrate isotopic composition of aerosol, skin layer snow and snow pits at Dronning Maud Land, Antarctica (Version 1.0) [Data set], UK Polar Data Centre, Natural Environment Research Council, UK Research & Innovation, https://doi.org/10.5285/1467b446-54eb-45c1-8a31-f4af21e60e60, 2019b.
Wolff, E. W.: Nitrate in polar ice, in: Ice core studies of global biogeochemical cycles, Springer, 195–224, 1995.
Wolff, E. W., Jones, A. E., Martin, T. J., and Grenfell, T. C.: Modelling photochemical NOx production and nitrate loss in the upper snowpack of Antarctica, Geophys. Res. Lett., 29, 5-1–5-4, 2002.
Wolff, E. W., Jones, A. E., Bauguitte, S. J.-B., and Salmon, R. A.: The interpretation of spikes and trends in concentration of nitrate in polar ice cores, based on evidence from snow and atmospheric measurements, Atmos. Chem. Phys., 8, 5627–5634, https://doi.org/10.5194/acp-8-5627-2008, 2008.
Yu, Z. and Elliott, E. M.: Novel method for nitrogen isotopic analysis of soil-emitted nitric oxide, Environ. Sci. Technol., 51, 6268–6278, 2017.
Zatko, M., Geng, L., Alexander, B., Sofen, E., and Klein, K.: The impact of snow nitrate photolysis on boundary layer chemistry and the recycling and redistribution of reactive nitrogen across Antarctica and Greenland in a global chemical transport model, Atmos. Chem. Phys., 16, 2819–2842, https://doi.org/10.5194/acp-16-2819-2016, 2016.
Zatko, M. C., Grenfell, T. C., Alexander, B., Doherty, S. J., Thomas, J. L., and Yang, X.: The influence of snow grain size and impurities on the vertical profiles of actinic flux and associated NOx emissions on the Antarctic and Greenland ice sheets, Atmos. Chem. Phys., 13, 3547–3567, https://doi.org/10.5194/acp-13-3547-2013, 2013.