the Creative Commons Attribution 4.0 License.
the Creative Commons Attribution 4.0 License.
 | 12 May 2020
To what extents do urbanization and air pollution affect fog?
Shuqi Yan
Bin Zhu
Yong Huang
Jun Zhu
Hanqing Kang
Chunsong Lu
Tong Zhu
The remarkable development of China has resulted in rapid urbanization (urban heat island and dry island) and severe air pollution (aerosol pollution). Previous studies demonstrate that these two factors have either suppressing or promoting effects on fog, but what are the extents of their individual and combined effects? In this study, a dense radiation fog event in eastern China in January 2017 was reproduced by the Weather Research and Forecasting model coupled with Chemistry (WRF-Chem), and the individual and combined effects of urbanization and aerosols on fog (indicated by liquid water content – LWC) are quantitatively revealed. Results show that urbanization inhibits low-level fog, delays its formation and advances its dissipation due to higher temperatures and lower saturations. In contrast, upper-level fog could be enhanced because of the updraught-induced vapour convergence. Aerosols promote fog by increasing LWC, increasing droplet concentration and decreasing droplet effective radius. Further experiments show that the current pollution level in China could still be below the critical aerosol concentration that suppresses fog. Urbanization influences fog to a larger extent than aerosols do. When urbanization and aerosol pollution are combined, the much weaker aerosol-promoting effect is counteracted by the stronger urbanization-suppressing effect on fog. Budget analysis of LWC reveals that urban development (urbanization and aerosols) alters the LWC profile and fog structure mainly by modulating condensation–evaporation process. Our results infer that urban fog will be further reduced if urbanization keeps developing and air quality keeps deteriorating in the future.
- Article
(6348 KB) -
Supplement
(979 KB) - BibTeX
- EndNote


During the past 5 decades, China has achieved remarkable developments, accompanied by strong anthropogenic activities (rapid urbanization and severe air pollution). Urbanization and air pollution have significantly affected climate change, monsoons, air quality, fog, clouds and precipitation (e.g. Li et al., 2016, 2017). Previous studies have linked the changes in clouds and precipitation to urbanization and aerosols. Urbanization destabilizes the boundary layer, which triggers strong updraughts and invigorates convection (e.g. Rozoff et al., 2003; Shepherd, 2005). Aerosols modify the macroscopic, microphysics, thermodynamics and radiative properties of clouds through complicated pathways, which are called aerosol–radiation and aerosol–cloud interactions and have been systematically reviewed by Fan et al. (2016), Rosenfeld et al. (2014), Tao et al. (2012), etc. Fog can be viewed as a cloud (Leng et al., 2014) that occurs near the surface. Land use features and aerosol properties may instantly affect fog, so fog is more sensitive to anthropogenic activities than other types of clouds (Zhu and Guo, 2016). Previous studies have analysed the effects of urbanization and aerosols on fog, mostly in segregated manners.
Urbanization is featured with urban heat island (UHI) and dry island (UDI) effects. The urban surface has a lower albedo than rural surface, which reduces the reflected solar radiation and enhances heat storage. Urban expansion decreases the coverage of cropland, water bodies and forestland, which reduces the sources of water vapour. As a result, urban areas commonly experience higher temperatures and lower vapour contents. These conditions induce a lower relative humidity that is unfavourable for fog formation (Gu et al., 2019). At the long-term scale, urban fog days are reported to decrease significantly (e.g. Guo et al., 2016; LaDochy, 2005; Sachweh and Koepke, 1995; Shi et al., 2008; Yan et al., 2019). Although UHI and UDI inhibit near-surface fog, the upward motions can promote upper-level fog (Li et al., 2011; S. Niu et al., 2010). Surface roughness and thermal circulation cause strong updraughts (Rozoff et al., 2003), which transfer water vapour aloft and cause the wet-island phenomenon in the upper level (Kang et al., 2014). The fog at that altitude may be subsequently enhanced.
Aerosols exert sophisticated impacts on fog through direct (radiation) effects and indirect (microphysical) effects (Khain and Pinsky, 2018). Aerosols attenuate shortwave radiation, influencing PBL (planetary boundary layer) structure and the vertical profile of moisture and aerosols (Tie et al., 2017, 2019), which can alter the formation and dissipation condition of fog. Scattering aerosols block downwelling solar radiation in the daytime, thus delaying the dissipation and elongating the duration of fog (Shi et al., 2008; Maalick et al., 2016). Although they increase downwelling longwave radiation at night, scattering aerosols have negligible effects on the fog formation time (Stolaki et al., 2015; Maalick et al., 2016). The effect of absorbing aerosols like black carbon (BC) on fog depends on its residence height. If BC resides above the fog layer, BC causes a dome effect (Ding et al., 2016) which blocks solar radiation and prevents the dissipation of fog (Bott, 1991). If BC resides within the fog layer, BC heats fog droplets and accelerates the dissipation of fog (Maalick et al., 2016). The aerosol indirect effect on cloud is addressed as one of the most uncertain factors in the IPCC report (IPCC, 2013). This effect on fog is also complex and twofold, which is determined by aerosol concentration. Under saturation conditions, increasing aerosols commonly result in more cloud condensation nuclei (CCN). This promotes activation and condensation, yielding more but smaller droplets and increasing cloud water content (Fan et al., 2018; Rosenfeld et al., 2008). These changes have two kinds of positive feedback on fog (Maalick et al., 2016): more droplets cause stronger radiative cooling at fog top and enhance condensation (Jia et al., 2018), and smaller droplet size inhibits sedimentation and the depletion of cloud water (Zhang et al., 2014). However, if aerosol concentration exceeds a certain threshold, this promoting effect disappears (Quan et al., 2011) or even turns into a suppressing effect due to the strong vapour competition (Guo et al., 2017; Koren et al., 2008; Liu et al., 2019; Rangognio et al., 2009; Wang et al., 2015). Additionally, large-scale aerosol pollution can change weather patterns and affect large-scale fog formation conditions (F. Niu et al., 2010). Ding et al. (2019) found that the dome effects of BC induce a land–sea thermal contrast and generate a cyclonic anomaly over coastal areas. This anomaly results in more vapour transported inland and enhances advection–radiation fog.
Our recent observational work (Yan et al., 2019) indicated a decreasing trend in fog days, and the inhibiting effects of urbanization outweigh the promoting effects of aerosols on fog during the mature urbanization stage. This study aims to quantitatively confirm the roles of urbanization and aerosols in a dense fog event by an online-coupled synoptic and air quality model, the Weather Research and Forecasting model coupled with Chemistry (WRF-Chem). This event is radiation fog event with weak synoptic forcing (detailed in Sect. 3.1), so the effects of urbanization and aerosols should be obvious. Determining the quantitative extents of the urbanization effect, aerosol effect and their combined effect is an interesting topic, which has rarely been studied previously to the best of our knowledge. This work is expected to facilitate the understanding of how anthropogenic activities affect the natural environment, fog (cloud) physics and aerosol–cloud interactions near the surface.
In this study, urbanization mainly refers to UHI and UDI induced by anthropogenic heating and land use change with the corresponding surface property changes (e.g. surface albedo, surface roughness, surface flux), excluding the increasing aerosol pollution caused by urban expansion. Air pollution refers to aerosols and is indicated by anthropogenic emissions because aerosol concentration is highly proportional to emission intensity. Liquid water content (LWC) and cloud–fog droplet number concentration (Nd) are two important parameters representing fog intensity and visibility. Following previous studies (e.g. Ding et al., 2019; Gu et al., 2019; Jia et al., 2018; Maalick et al., 2016; Yang et al., 2019), we use LWC as the indicator of fog to reveal different characteristics of fog in different experiments. This study is organized as follows. The data, model and methods are described in Sect. 2. Section 3.1 overviews the fog event and provides preliminary evidence of how urban development affects fog. Section 3.2 evaluates the model performance. Section 3.3–3.5 analyses the urbanization, aerosol and combined effects on fog. Section 3.6 discusses the rationality and reliability of the results. Section 4 concludes the findings of this study.
2.1 Data
The first set of data are the hourly automatic weather station data from the Shouxian National Climate Observatory (SX; 32.4∘ N, 116.8∘ E; 23 m) that are used to evaluate the model performance. SX is a rural site surrounded by vast croplands and is approximately 30 km away from the nearest large city, Huainan (Fig. 1b). The data include horizontal visibility, temperature, relative humidity, wind direction and speed. The second set of data are the Himawari 8 satellite data that are used to represent fog area (https://www.eorc.jaxa.jp/ptree/index.html, last access: 6 May 2020). Fog area is mainly indicated by the albedo at three visible bands: red (band 3, 0.64 µm), green (band 2, 0.51 µm) and blue (band 1, 0.47 µm). The third set of data are the 3-hourly data from the Meteorological Information Comprehensive Analysis and Process System (MICAPS) (Li et al., 2010) that are also used to represent the fog area. The fourth set of data are the land use data from the Moderate Resolution Imaging Spectroradiometer Land Cover Type (MCD12Q1) Version 6 data (https://lpdaac.usgs.gov/products/mcd12q1v006, last access: 6 May 2020) in 2017, the same year as the simulation period. The data are resampled from 500 m to 30 arcsec (approximately 1 km) and used to replace the geological data of the WRF model.
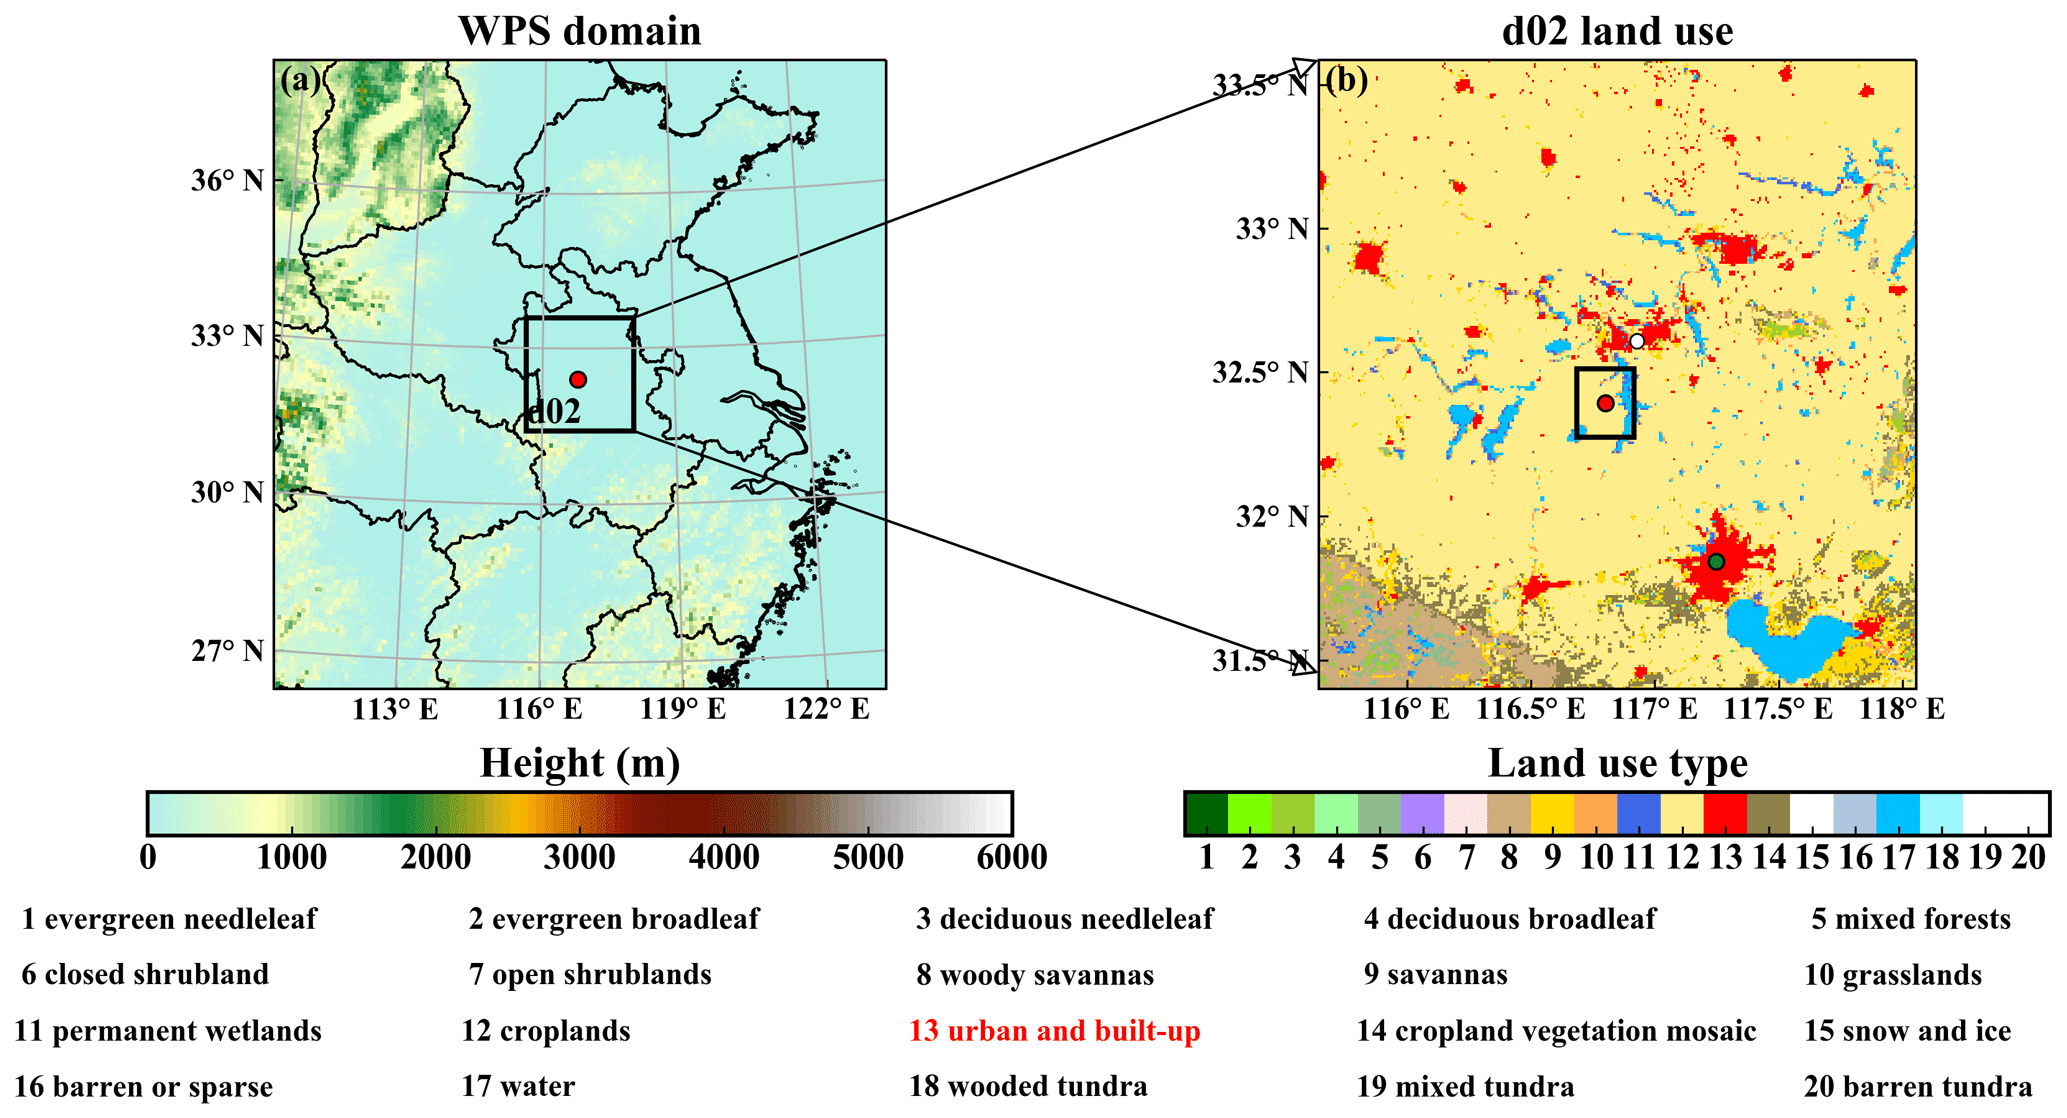
Figure 1(a) The WRF domain overlaid with terrain height. (b) The land use distribution of domain d02. The green dot is Hefei, the capital of Anhui Province. The white dot is Huainan. The two red dots are the SX site. The land use and emissions of the 22 km × 26 km black box in the centre of (b) will be altered in the sensitivity experiments.
2.2 Model configuration
The model used in this study is the WRF-Chem (V3.9.1.1) model. It is an online-coupled mesoscale synoptic and air quality model that considers the sophisticated interactions among various dynamic, physical and chemical processes (Chapman et al., 2009; Fast et al., 2006). WRF, or WRF-Chem, has been successfully used in simulating fog events (Jia and Guo, 2012, 2015; Jia et al., 2018) and exploring aerosol–cloud interactions (Fan et al., 2018). Two nest domains are set up (Fig. 1). The d01 domain has a size of 217×223 grids and a resolution of 6 km, covering the entire fog area of this event (Fig. 2a). The d02 domain has a size of115×121 grids and a resolution of 2 km, covering SX and the adjacent areas. The land use data are replaced by MCD12Q1 data, which represent the latest condition.

Figure 2The performance of the simulated fog zone at 08:00 on 3 January 2017. (a) Himawari 8 RGB composite cloud image overlaid with the MICAPS observation sites (light red dots) at which fog was observed (relative humidity >90 % and VIS <1 km). (b) Simulated LWP distribution. Only LWC values below 1500 m are integrated. The blue dots are the SX site. The two dashed rectangles in (a) are the sub-regions of interest in Fig. 3.
Fog simulation is highly sensitive to vertical grids (Gultepe et al., 2007). A fine vertical resolution with a proper lowest model level can better resolve turbulence, thus yielding a reasonable fog structure (Yang et al., 2019). Here, 42 vertical levels are established with the first five η values of 1.000, 0.999, 0.998, 0.997 and 0.996. There are 25 levels below the boundary layer (approximately 1500 m), and the lowest model level is approximately 8 m.
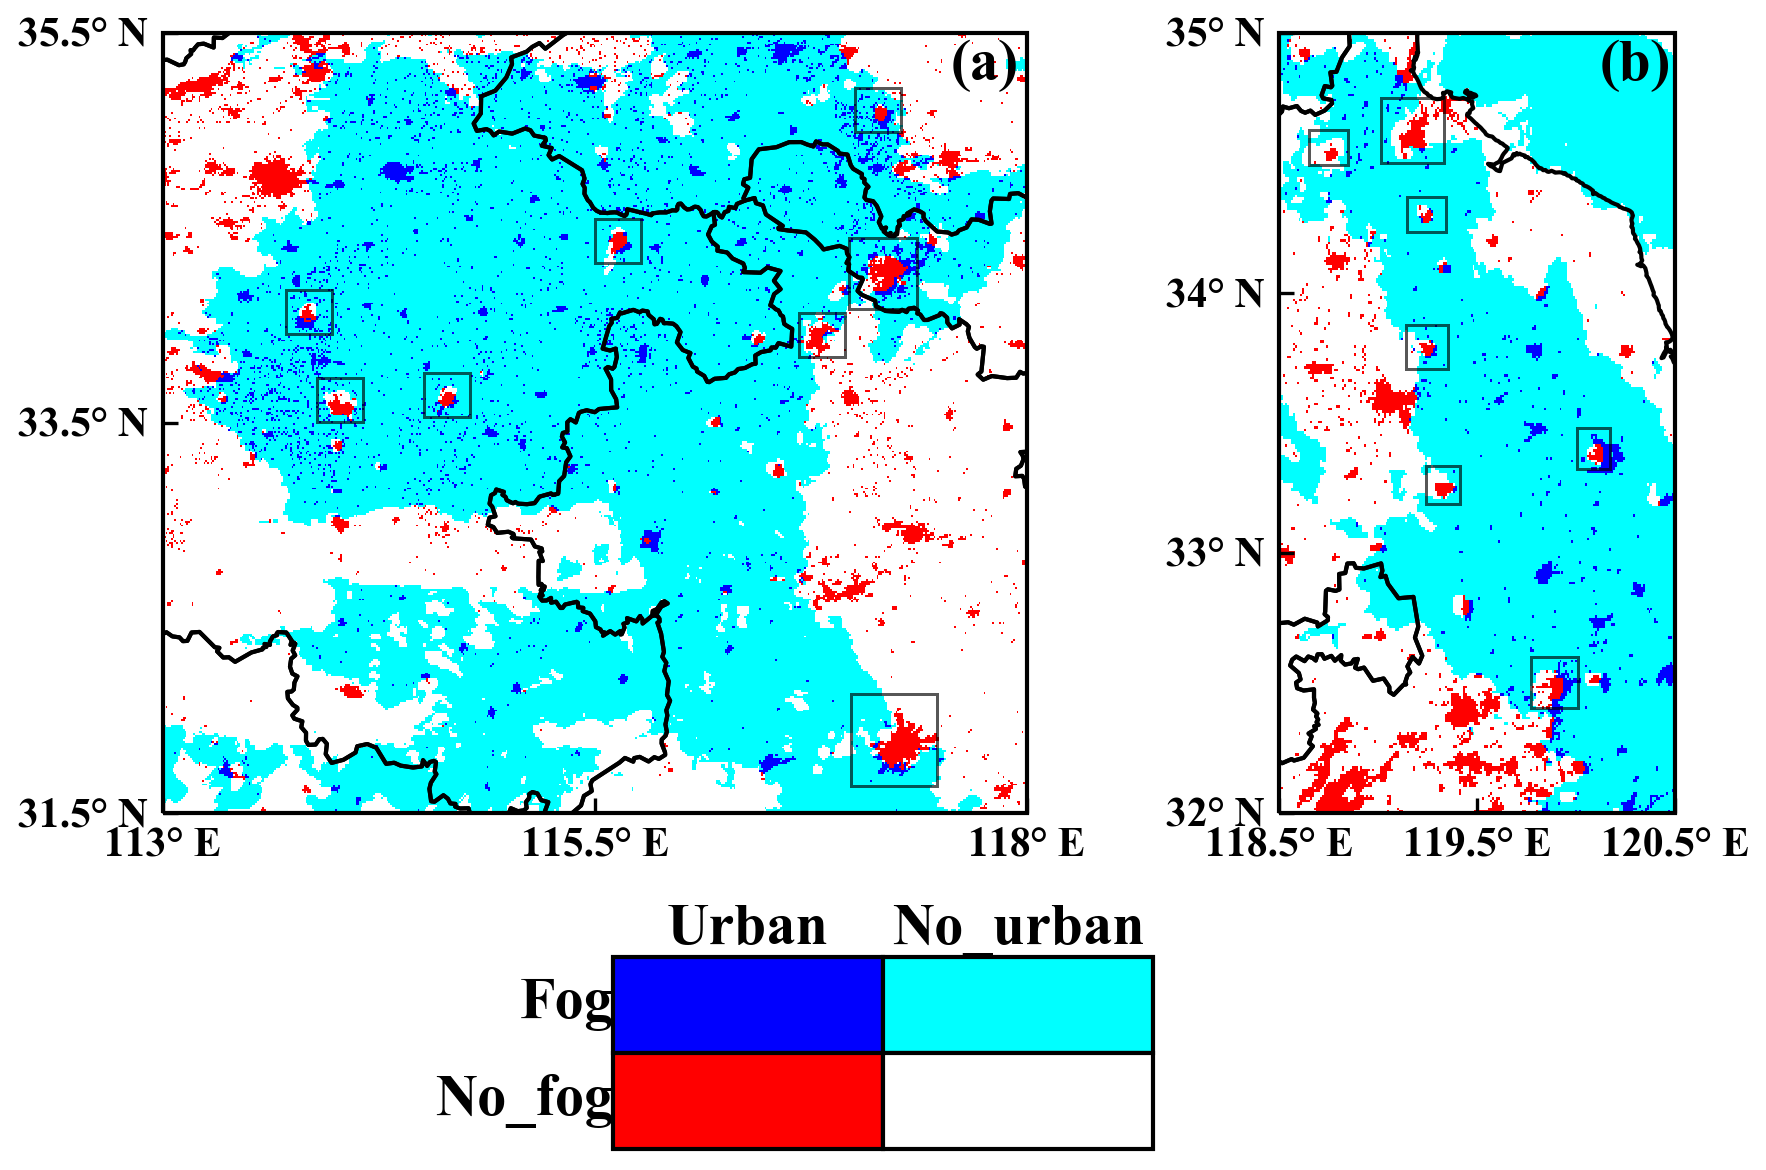
Figure 3Two sub-regions (a, b) with obvious fog holes in the Himawari 8 image at 11:00 on 3 January 2017. The fog zone, which is represented by albedo >0.45 (at 0.64 µm) and brightness temperature >266 K (at 12.4 µm) (Di Vittorio and Emery, 2002), is marked with cold colours (blue or cyan). The urban areas are marked with dark blue or red. The red and white pixels surrounded or semi-surrounded by cold colours are fog holes, and among these pixels, the red pixels indicate the fog holes over urban areas. Some of the cities with fog holes are marked by rectangles.
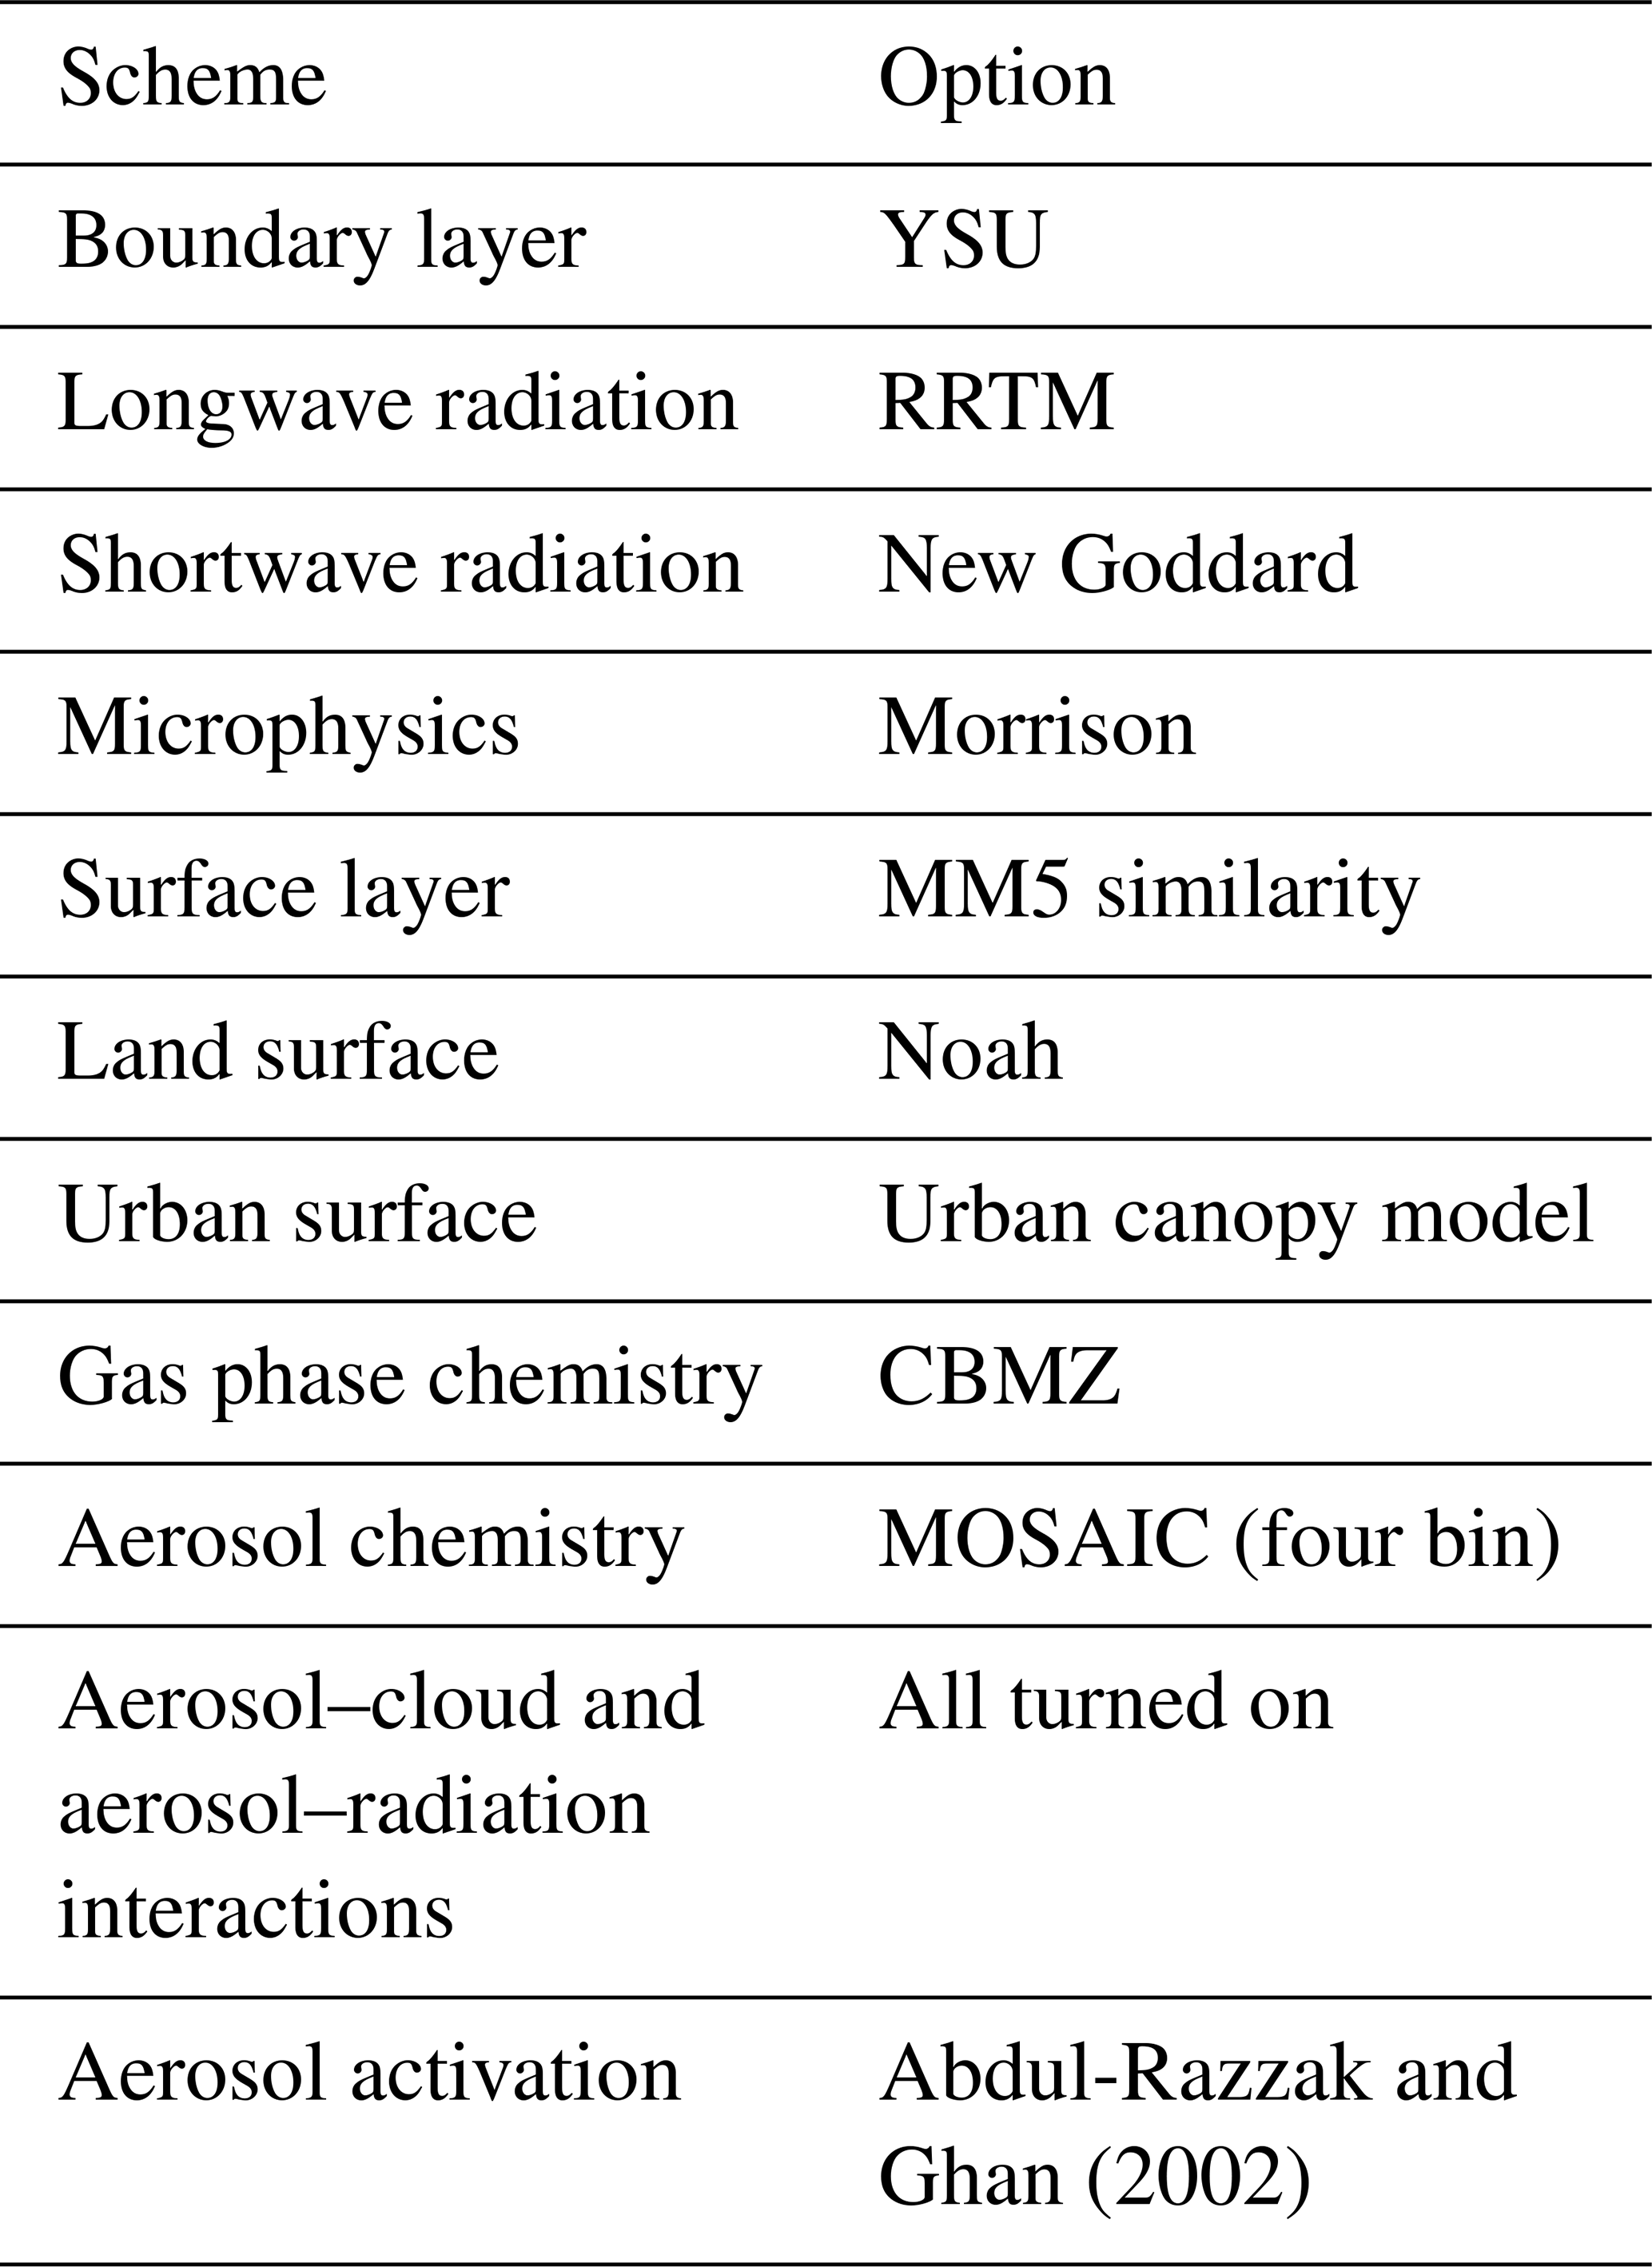
Fog simulation is also sensitive to physical schemes (Gu et al., 2019). Through numerous experiments, radiation, microphysics and boundary schemes are found to significantly influence the model performance, and the boundary layer scheme plays a decisive role (Chaouch et al., 2017). The radiation schemes are the RRTM (rapid radiative transfer model) longwave scheme and the Goddard shortwave scheme. The microphysical scheme is the Morrison double-moment scheme (Morrison et al., 2005). The boundary layer scheme is the Yonsei University (YSU) 1.5-order closure non-local scheme, which yields better results than any other schemes. The major schemes are listed in Table 1.
The model is driven by the highest-resolution product (0.125∘, approximately 13 km) of ECMWF data (https://apps.ecmwf.int/datasets/data/interim-full-daily/levtype=sfc/, last access: 6 May 2020). The anthropogenic emissions are derived from the Multi-resolution Emission Inventory for China (MEIC) database (http://www.meicmodel.org, last access: 6 May 2020). The simulation starts on 1 January 2017 at 08:00 and ends on 3 January 2017 at 14:00, with the first 24 h as the spin-up period (all the times here are in local time).
2.3 Sensitivity experiments
The study site is SX because only its visibility is observed hourly and is a multiple of 1 m, which is suitable for evaluating the model performance. To investigate the effects of urbanization and aerosols on fog, we change the land use and emission intensity around SX. Four experiments, i.e. u0e0, u3e0, u0e3 and u3e3, are designed. u0e0 is the base experiment, with no urbanization and weak emission at SX. u3e0 is set as the urbanization condition. u0e3 is set as the polluted condition. u3e3 is set as the urban development condition (urbanization and pollution coexist). The experiment settings are listed in Table 2.
Table 2Settings of sensitive experiments. “N” represents no changes.
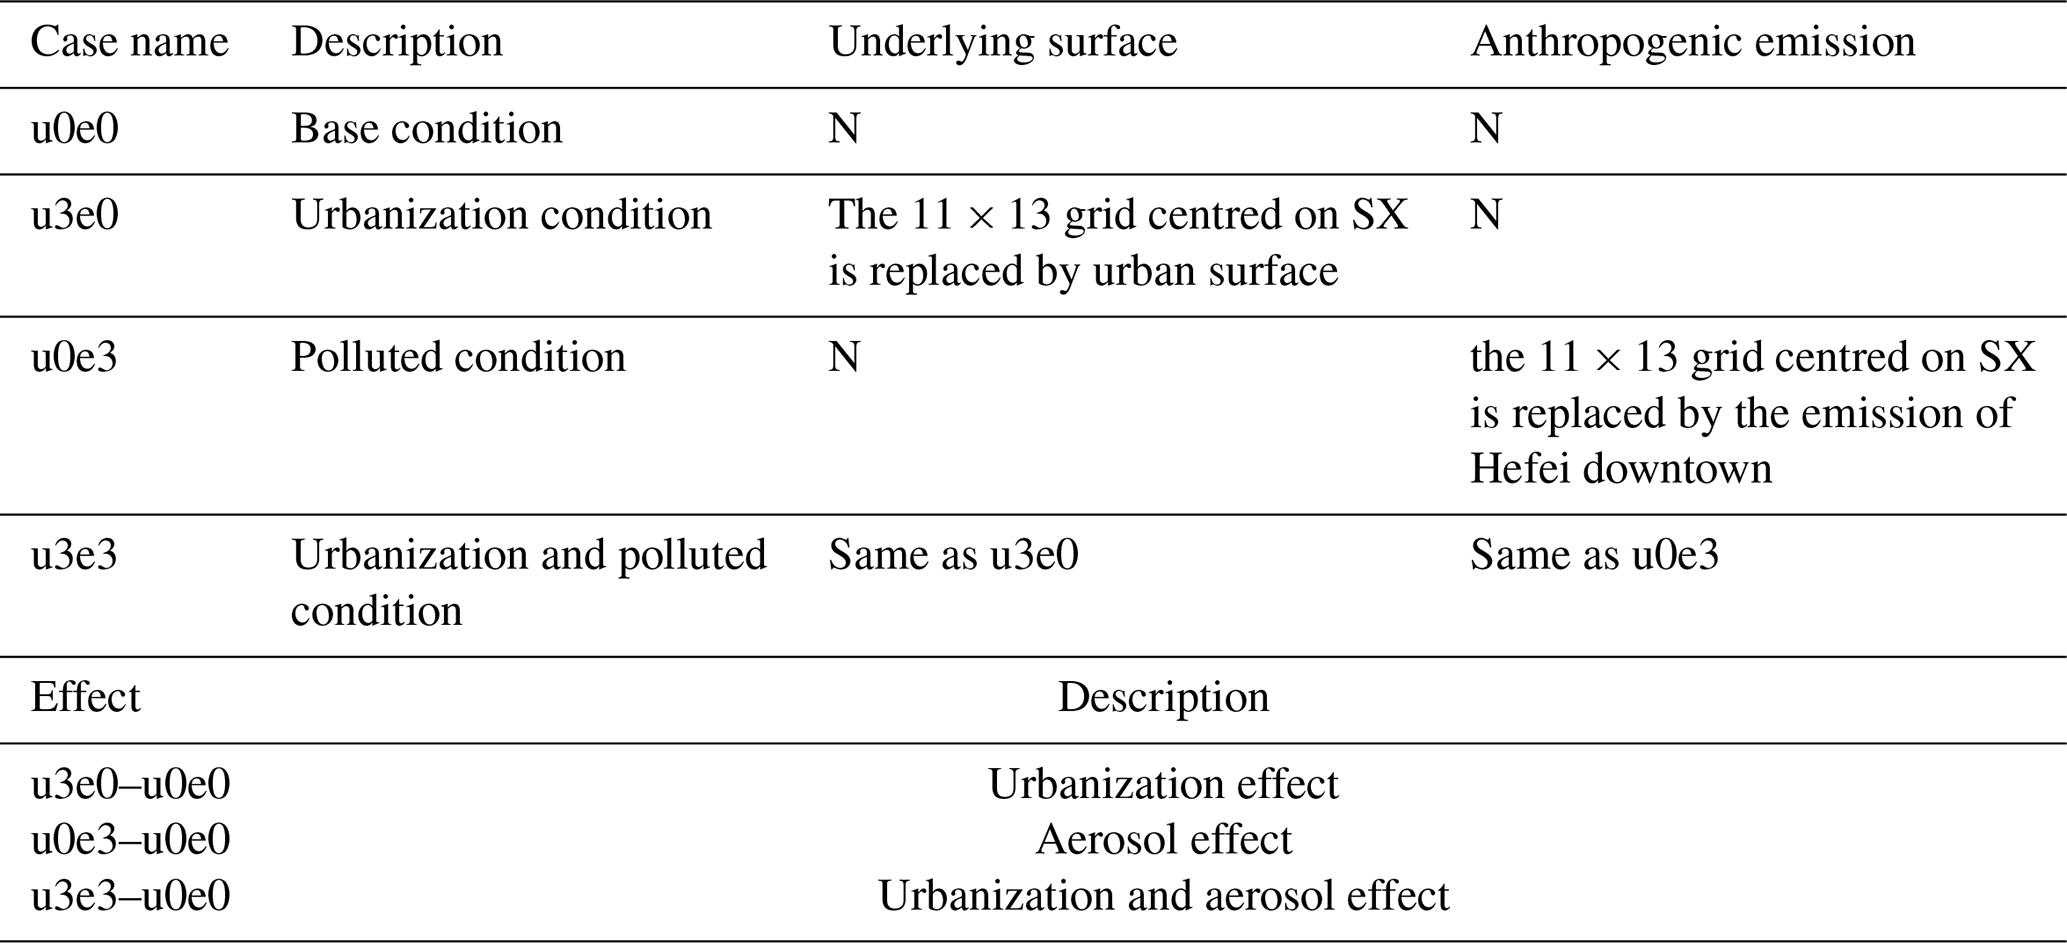
On the setting of the urbanized condition, we replace the land use of SX with that of Hefei, the most urbanized city and the capital of Anhui Province. The downtown of Hefei has a built area of approximately 570 km2. Therefore, the 11×13 box centred on SX (572 km2) is replaced by the urban surface in the u3e0 and u3e3 experiments to represent the urbanization condition.
The downtown of Hefei has much higher emissions than SX. For example, the PM2.5 emission rate of Hefei is 40 times higher than that of SX. To represent the polluted condition, the emission intensity of the aforementioned box is set to be equal to that of downtown Hefei in the u0e3 and u3e3 experiments.
2.4 Calculating visibility
The LWC is the proxy of fog as mentioned above. Since the LWC is not observed, and visibility (VIS) is related to LWC, the VIS is used to assess the model performance. VIS is not diagnosed by the model and can be parameterized by the function of LWC, Nd or droplet effective radius (Re). Equations (1) (Kunkel, 1983) and (2) (Gultepe et al., 2006) are two parameterization methods:
Another parameterization method is based on the Mie theory (Gultepe et al., 2017). VIS is inversely proportional to atmospheric extinction at visible wavelengths. The extinction coefficient of cloud water (βc) is
where ρa (ρw) is the air (water) density (in kg m−3), LWC is in grams per kilogram (g kg−1), Re is in micrometres (µm) and Qext is the extinction efficiency, which is assumed to be 2 for cloud droplets.
The atmospheric extinction (β) is also largely contributed to by aerosols (βa) and other types of hydrometeors. The model diagnoses βa at 550 nm. No other types of hydrometeors occur in this fog case, so we assume . Then VIS is determined by the Koschmieder rule (Koschmieder, 1924):
During the fog period (Fig. 4 shaded zone), the three methods nearly yield the same results (Fig. S1 in the Supplement), so the last method is used to calculate the simulated VIS.
3.1 Overview of the fog event
3.1.1 Formation condition and lifetime
From 1 to 6 January 2017, eastern China is dominated by zonal circulation, with a weak trough, ridge, pressure gradient and atmospheric diffusion (Zhang and Ma, 2017). Under this stable weather pattern, the accumulation of pollutants and water vapour promotes the occurrence of fog–haze events. From the evening of 2 January to noon of 3 January, a dense fog event occurs in wide regions of eastern China. The fog reaches its peak at 08:00 on 3 January, covering southern Hebei, eastern Henan, western Shandong, Anhui, Jiangsu and Shanghai (Fig. 2a). Figure 4a shows the temporal variation in visibility at SX. The fog forms at 18:00 on 2 January and dissipates at 12:40 on 3 January. This is radiation fog which is promoted by strong radiative cooling at night and weak easterly water vapour transport from the northwestern Pacific (Zhu et al., 2019).
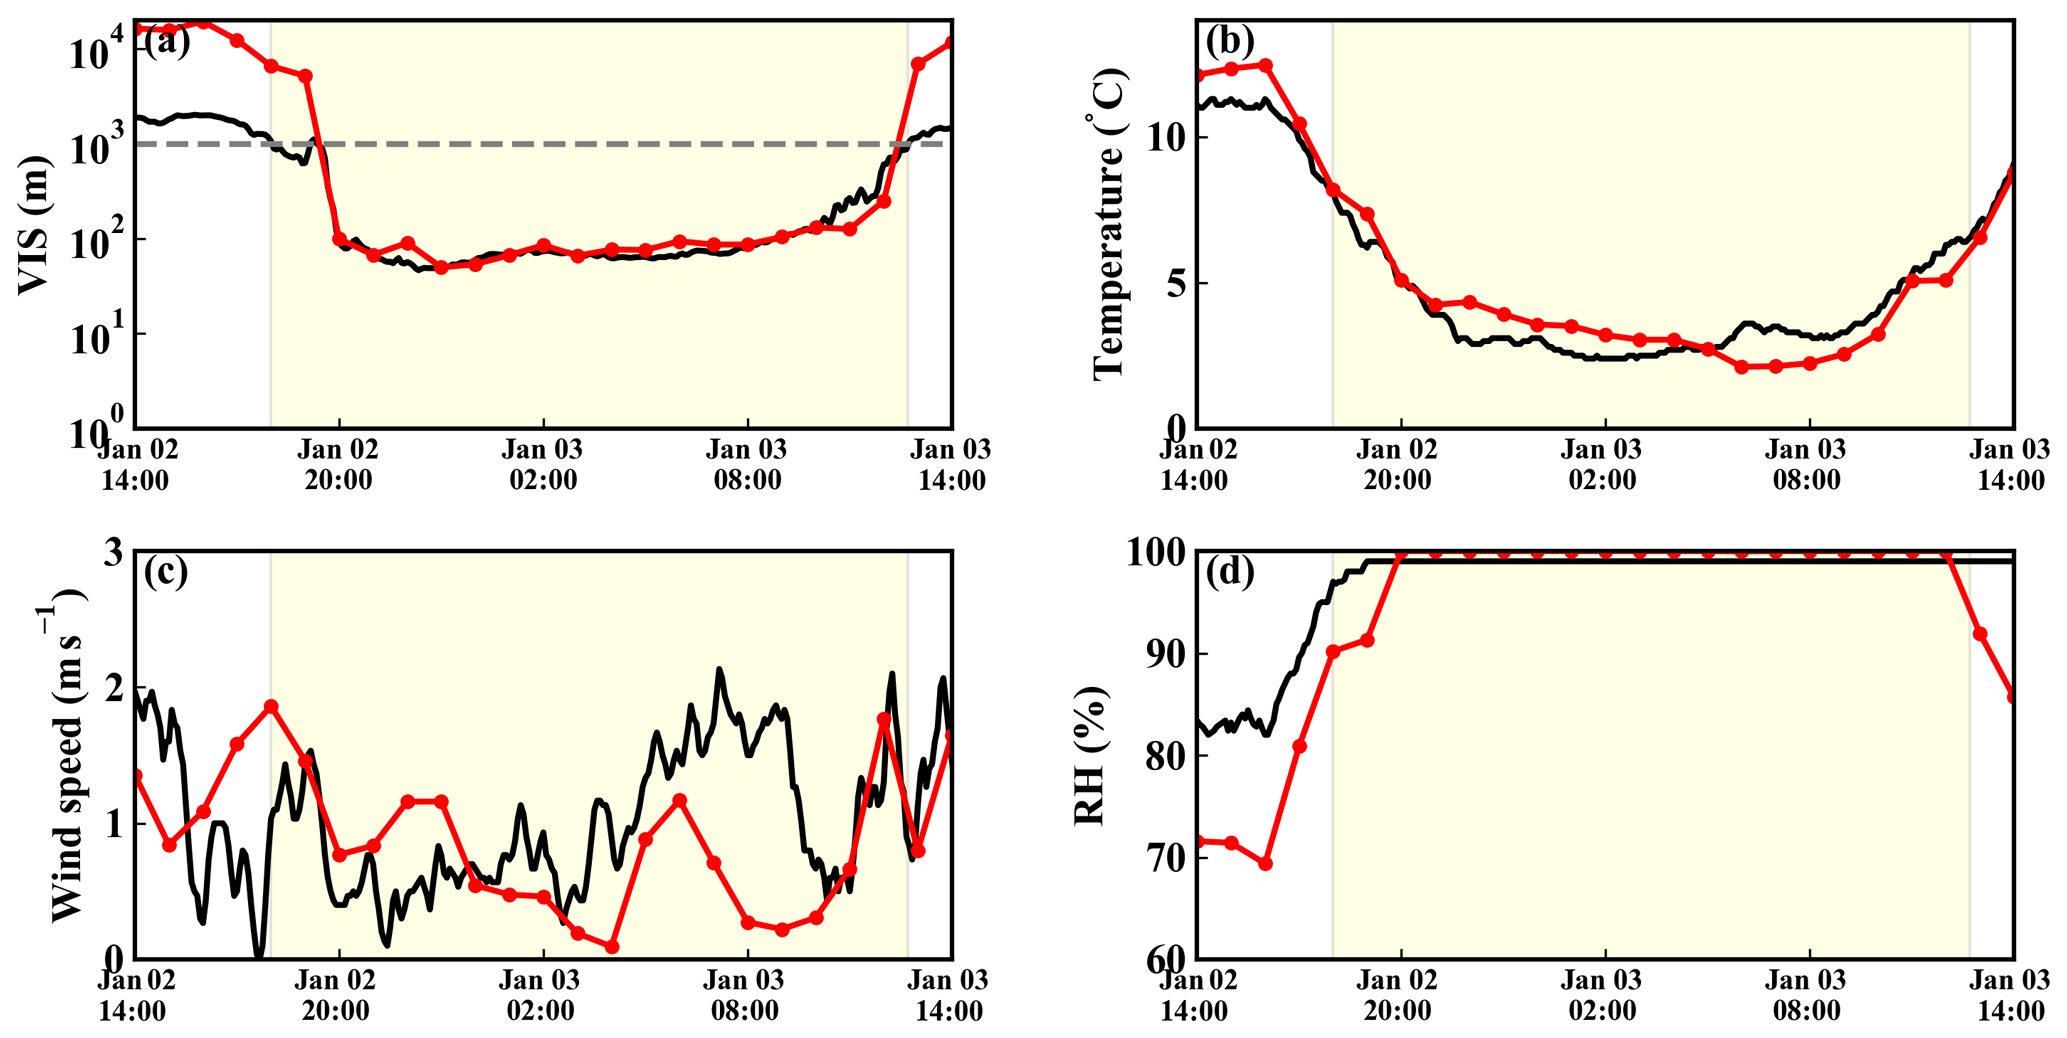
Figure 4The performance of the simulated meteorological parameters at the SX site. (a) VIS, (b) air temperature, (c) 10 min average wind speed and (d) relative humidity (RH). The red dotted lines represent the model results, and the black lines are the observations. The fog period (VIS <1 km and RH >90 %) is shaded in light yellow.
3.1.2 Preliminary evidence of urban development affecting fog
Lee (1987) and Sachweh and Koepke (1995) observed “fog holes” over urban areas on satellite images. Here, the fog hole means the low liquid water path (LWP) region within the fog region, which is visualized as pixels with weak fog (high visibility) or clear sky surrounded by dense fog. These holes demonstrate that urban development (urbanization and aerosols) has a clearing effect on fog. In this fog event, fog holes are also present over urban areas in the Himawari 8 image at 11:00 on 3 January (Fig. 3). We hypothesize that urbanization could have profound effects on fog by reducing the LWP or advancing the dissipation of fog, and the role of aerosols on fog is weaker than that of urbanization.
3.2 Model evaluation and simulations
The model performance is evaluated by comparing the fog spatial coverage. Satellite cloud image and modelled LWP (>2 g m−2) can represent the observed and simulated fog zone, respectively (Jia et al., 2018). Figure 2 shows the Himawari 8 visible cloud image and the simulated LWP distribution at 08:00. The light white pixels and light red dots indicate the observed fog area. The model captures the fog in southern Hebei, eastern Henan, western Shandong, Anhui, Jiangsu and Shanghai well.
The model performance is also evaluated by comparing the visibility and other basic parameters at the SX site (Fig. 4). Seen from the visibility, the simulated fog forms at 19:30, 1.5 h later than the observation, and dissipates at 12:20, 30 min earlier than the observation. During the fog period, the simulated visibility agrees well with the observation. The other parameters such as temperature, wind speed and relative humidity are also effectively reproduced by the model, with relative small root-mean-square errors (RMSEs) of 0.8 K, 0.7 m s−1 and 5.9 %, respectively. Overall, the model captures the spatial feature and temporal evolution of the fog well.
3.3 Urbanization effects
From different sensitivity experiments (u3e0, u0e3 and u3e3), we can deduce the extents of the separate or combined effects of urbanization and aerosols on fog. Figure 5 compares the LWC between u0e0 and u3e0. The general results are as follows: (1) before 02:00, urbanization leads to a decreasing LWC in all layers. Fog forms on the surface at 22:30 in u3e0, 3 h later than in u0e0. (2) After 02:00, the LWC decreases in the low level while it increases in the upper level. Fog dissipates at 10:50 in u3e0, 1.5 h earlier than in u0e0. To better explain the LWC difference, its profiles are shown in Fig. 6. At 23:00, although fog formed in u3e0, the fog is rather weak compared with u0e0, which is caused by the higher temperature (Fig. 6f) and lower saturation associated with UHI and UDI. At 02:00, fog develops in u3e0, but its intensity (the value of LWC) cannot reach the same level as that in u0e0.

Figure 5Time–height distribution of the LWC (g kg−1) in (a) u0e0 and (b) u3e0, and (c) is the urbanization effect (u3e0 minus u0e0) on LWC. The two white curves in (c) are the LWP. The black contour lines in (c) are the difference of vertical velocity (cm s−1) (u3e0 minus u0e0). Only the lines after 00:00 are shown for clarity.
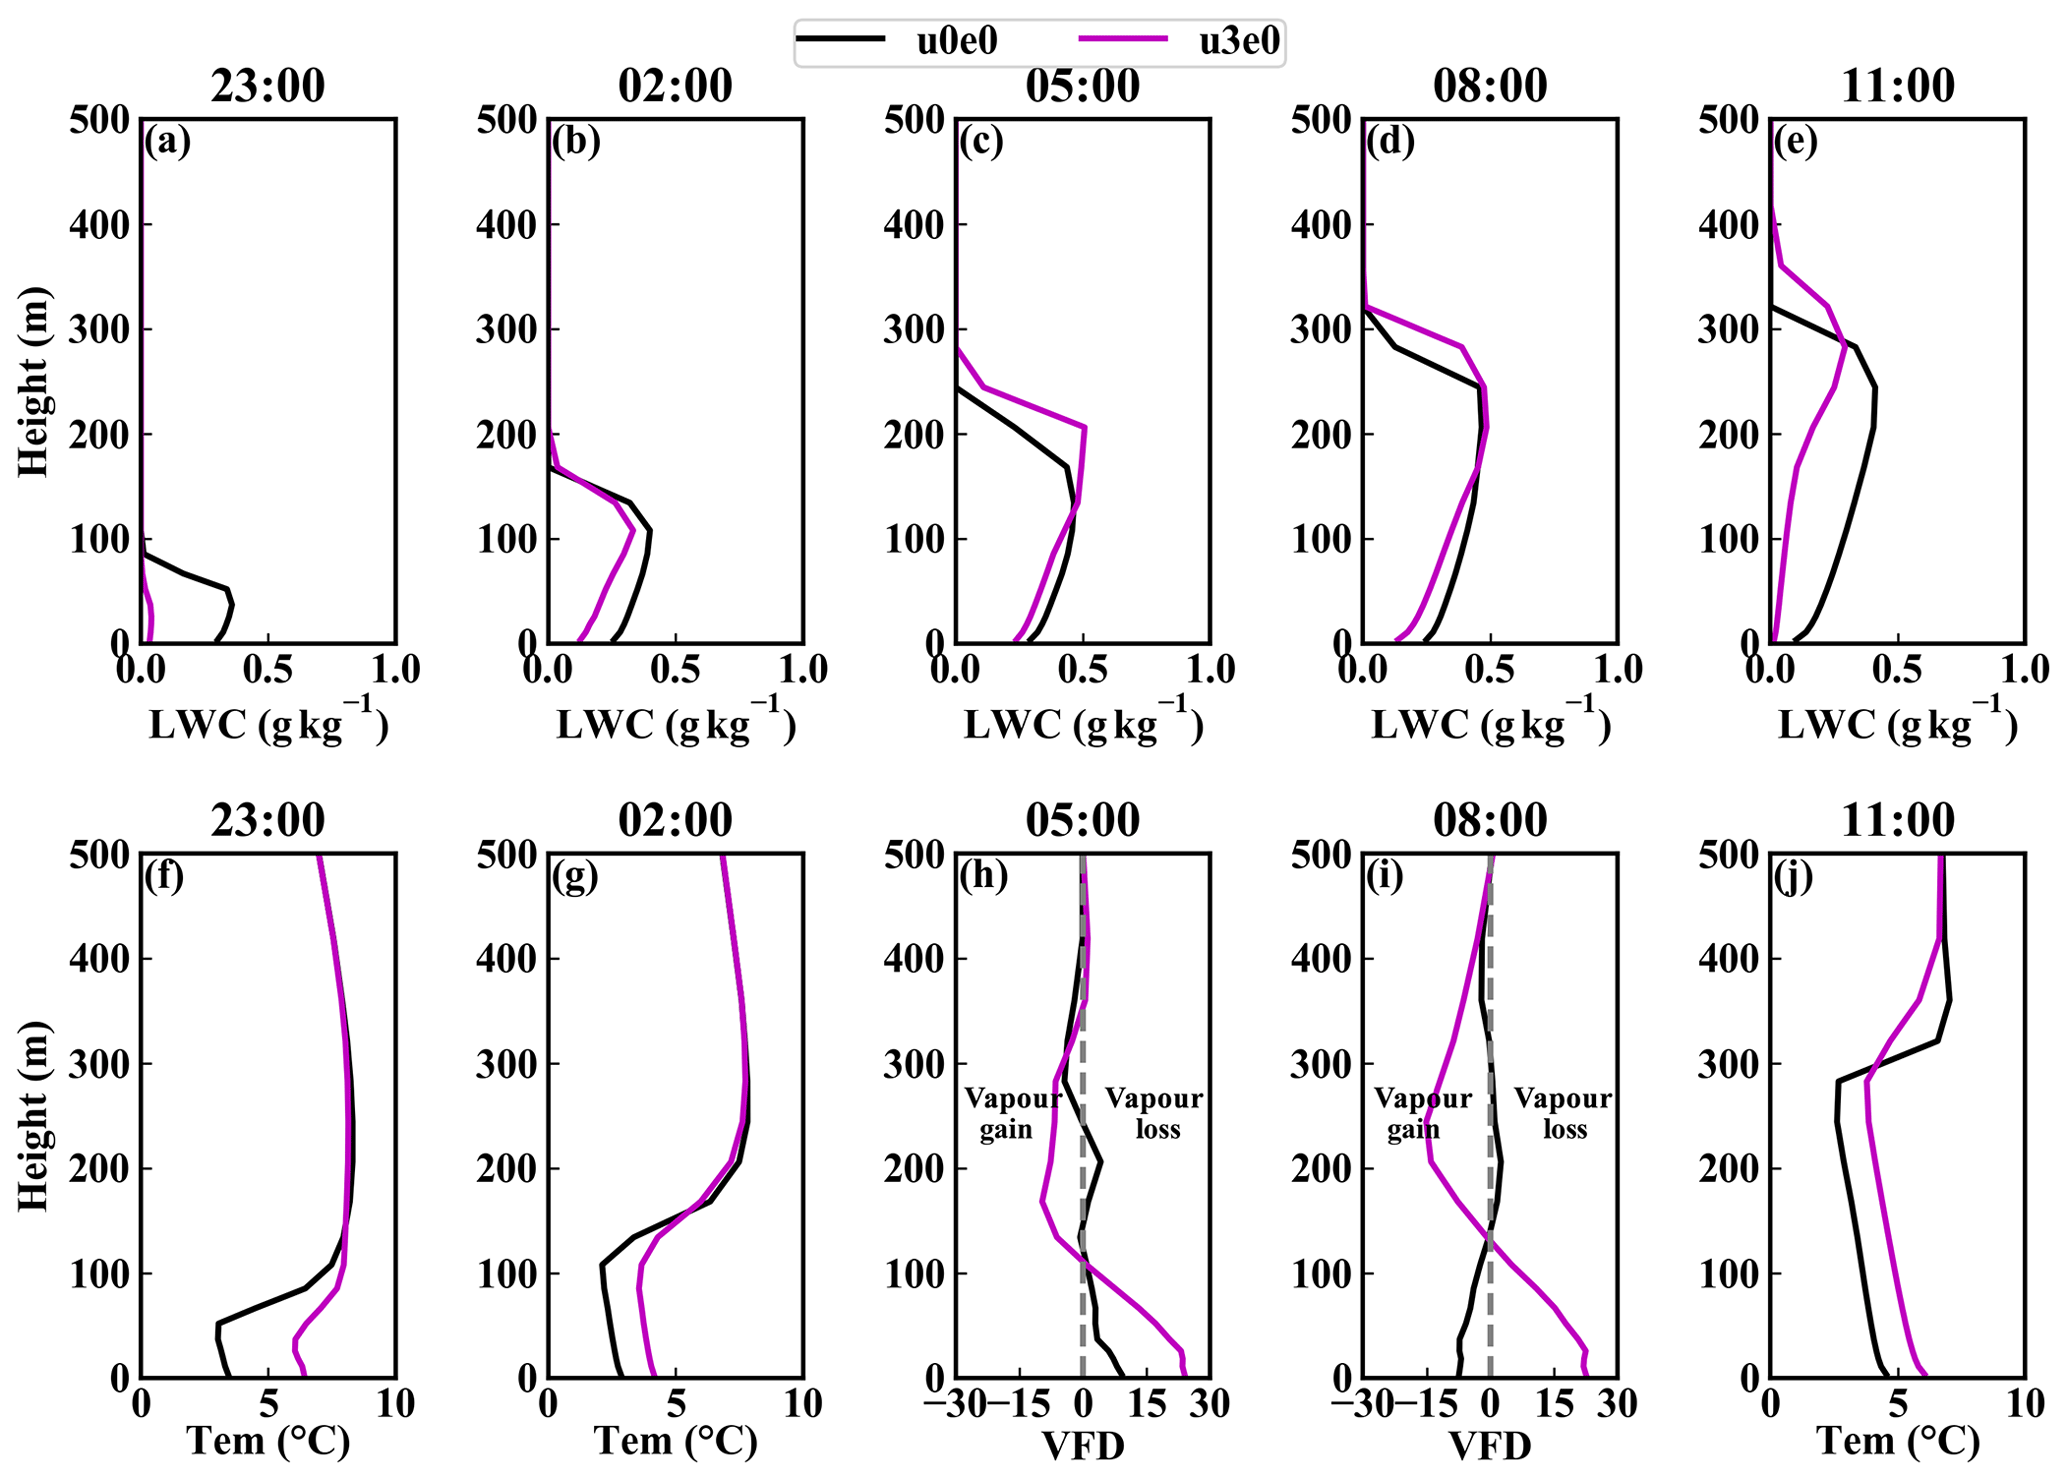
Figure 6Profiles of the LWC (a–e), temperature (Tem) (f, g, j) and vertical vapour flux divergence (VFD) (h, i) (g h−1 m−2 hPa−1) in u0e0 and u3e0 at different times.
An interesting phenomenon is the opposite change of LWC in the low level and upper level after 02:00. This phenomenon can be explained by the role of updraughts. The increasing roughness length and extra warming in urban conditions could trigger horizontal wind convergence (Fig. S2) and the enhanced updraughts (Fig. 5c). The stronger updraughts in u3e0 affect condensation via two possible pathways: (1) the vertical transport of vapour and vertical convergence–divergence redistribute water vapour and affect condensation or (2) the adiabatic cooling promotes condensation. The role of the first pathway is measured by vertical vapour flux divergence . At 05:00, u3e0 shows a stronger vapour convergence above 110 m (Fig. 6h), and the LWC increases above 130 m (Fig. 6c). At 08:00, u3e0 shows a stronger vapour convergence above 130 m (Fig. 6i), and the LWC increases above 170 m (Fig. 6d). Therefore, it is possible that the adiabatic cooling and updraught-induced vapour flux convergence increase the vapour content and promote condensation in the upper level, while the fog in the low level is suppressed by the divergence of vapour flux. At 11:00, fog disappears at the ground in u3e0, likely due to the higher temperature (Fig. 6j). In summary, the UHI, UDI and updraughts alter the profile of LWC and reduce the LWP most of the time (Fig. 5c), and the decreasing LWP in the daytime can explain why fog holes occur above urban areas (Fig. 3).
3.4 Aerosol effects
Figure 7 compares the LWC between u0e0 and u0e3. The formation time, dissipation time of fog and fog top show almost no changes. The LWC increases at almost all layers in the polluted condition. Accordingly, the LWP also increases (Fig. 7c). It is probable that the current pollution level of China always promotes fog occurrence. To testify whether u0e3 is below the transition point that suppresses fog, eight additional experiments (D10, D7.5, D5, D2.5, M2.5, M5, M7.5 and M10) are performed. These experiments are the same as u0e3, except that the emissions around SX (the black box in Fig. 1b) are multiplied (the “M” prefix) or divided (the “D” prefix). For example, M2.5 means multiplying by 2.5; D10 means dividing by 10.
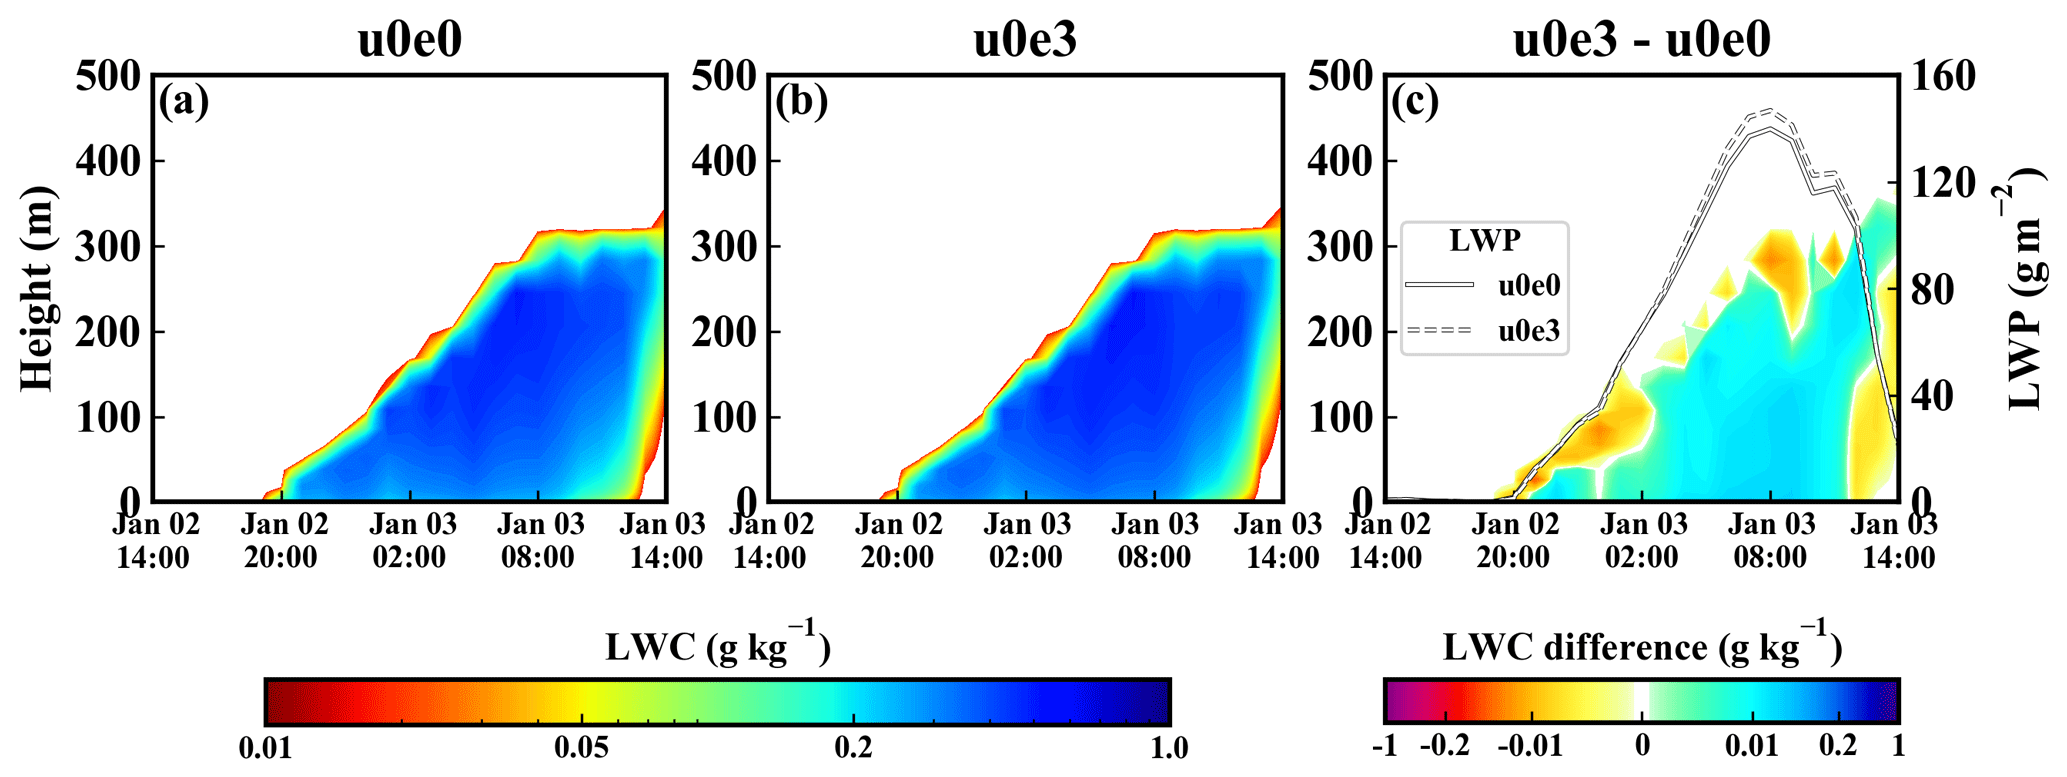
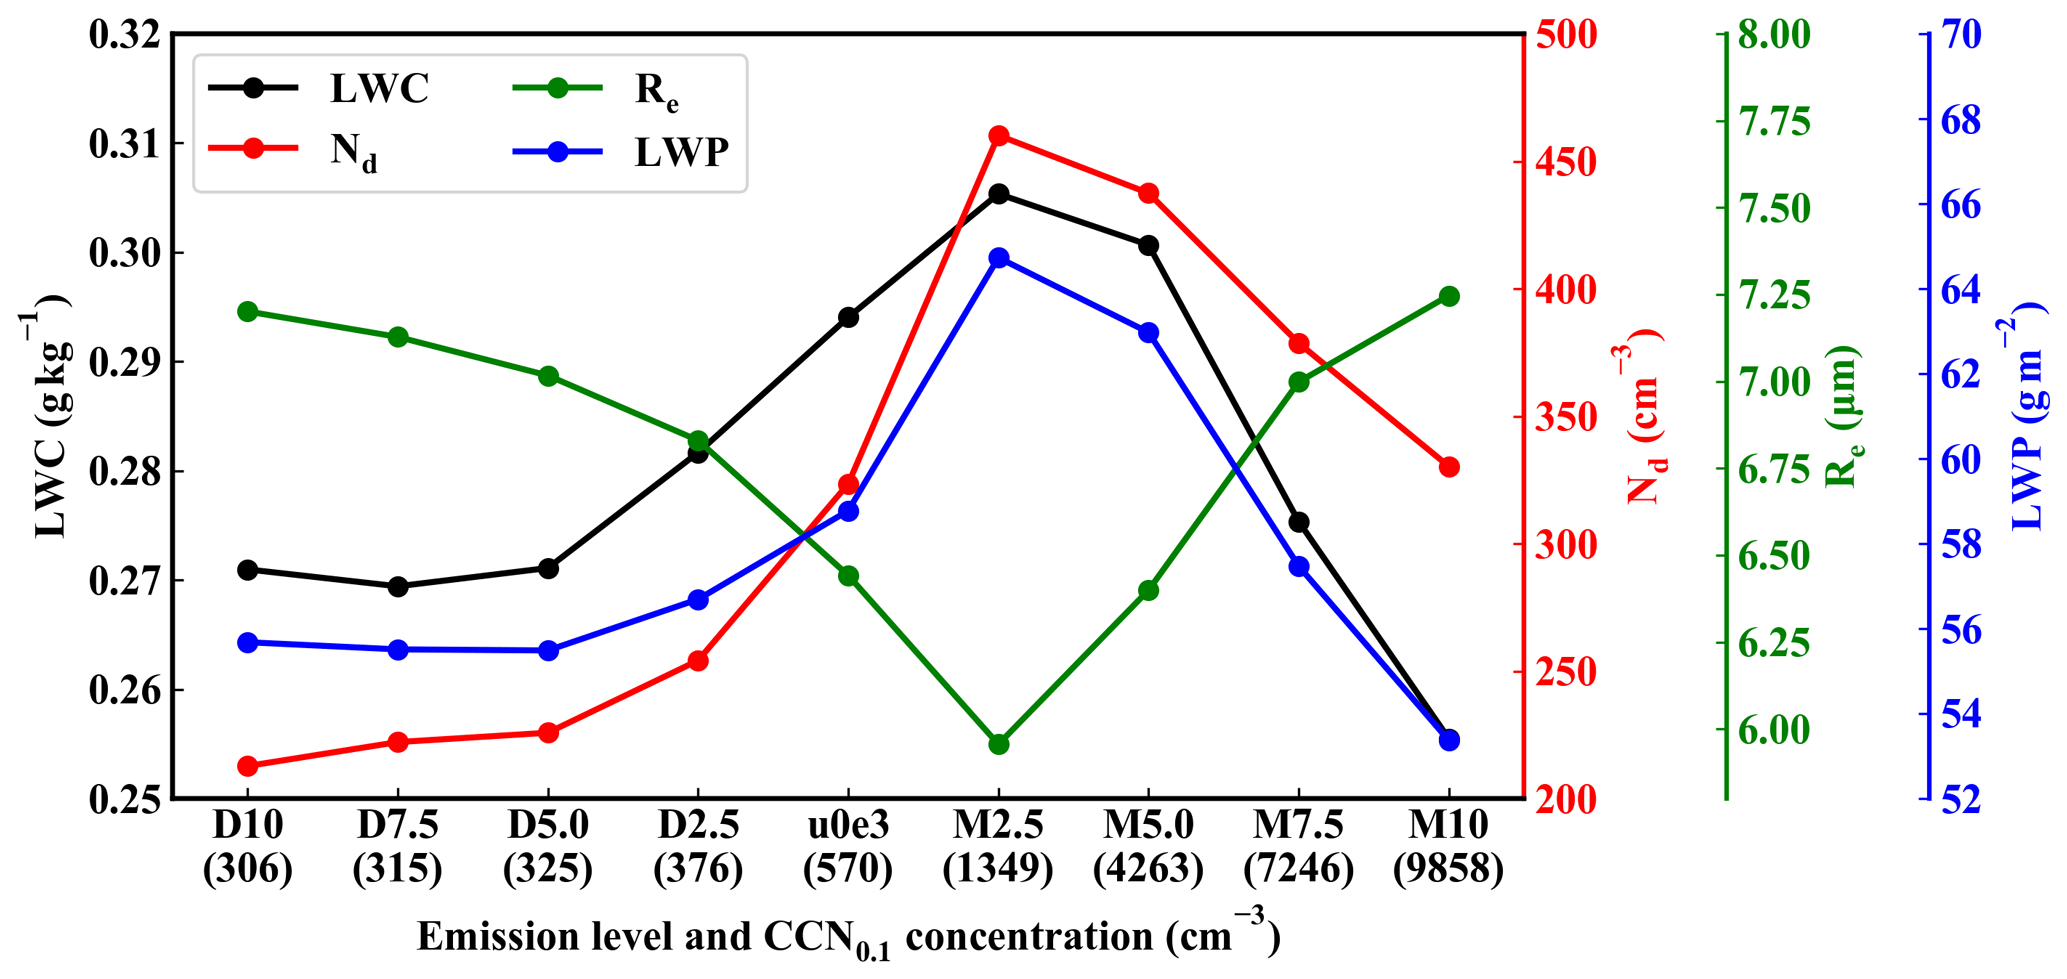
Figure 8Relationships of the microphysical parameters (LWC, Nd, Re and LWP) with emission level and CCN0.1 concentrations. These parameters are the time–height averages (time average for the LWP) in fog.
Figure 8 compares the LWC, Nd, Re and LWP among the nine emission-variant experiments. The variation shape of the four parameters demonstrates that the model is able to simulate the dual effects of aerosols. Below u0e3, the four parameters monotonically vary with emission level or CCN concentration, indicating that aerosol pollution could always promote fog. This phenomenon is because stronger emissions produce more aerosols and CCN. Under saturation conditions, the larger amount of CCN boost activation and yield a higher Nd. The higher Nd reduces Re and inhibits autoconversion and sedimentation (Twomey, 1977); thus, this situation decreases the depletion of fog water and increases the LWC. This promoting effect has been confirmed by previous model studies (e.g. Maalick et al., 2016; Stolaki et al., 2015) and observations (e.g. Chen et al., 2012; Goren and Rosenfeld, 2012). The CCN0.1 concentration of u0e3 (570 cm−3) is lower than that of the turning point (experiment M2.5) (1349 cm−3), possibly indicating that the current pollution level in China (u0e3) is still located in the promoting regime rather than the suppressing regime of fog occurrence.
Rosenfeld et al. (2008) revealed that the turning point in convective clouds is CCN0.4=1200 cm−3. The CCN0.4 of u0e3 is 6023 cm−3, which seems to suppress fog. Aerosols affect convective clouds through two competing mechanisms: (1) invigorating convection by promoting vapour condensation and (2) suppressing convection by blocking solar radiation and reducing surface heat flux. Under polluted conditions (AOD >0.3 or CCN0.4>1200 cm−3), the suppressing effect outweighs the invigoration effect, so the turning point occurs (Koren et al., 2008; Rosenfeld et al., 2008). This suppressing effect does not exist in fog because fog commonly formed at night. Therefore, the turning point in fog might occur later than that in convective clouds. On the North China Plain, where air pollution is thought to be more serious, a case study by WRF-Chem also indicates that fog properties (e.g. LWC, Nd and LWP) increase monotonically when emission intensity varies by 0.05-fold to 1-fold (Jia et al., 2018).
3.5 Combined effects of urbanization and aerosols
Figure 9 compares the LWC between u0e0 and u3e3. The u3e3-induced change is quite similar to but not the same as the u3e0-induced change. The time–height averages of absolute change of LWC induced by u3e0, u0e3 and u3e3 are 0.120, 0.019 and 0.124 g kg−1, respectively. This result indicates that urbanization affects fog to a larger extent than aerosols do; when urbanization and aerosols are combined, the effect of aerosols is indiscernible. The LWP is also significantly suppressed in the daytime, and the promoting effect of aerosols in Fig. 7c is indiscernible in Fig. 9c. To further explain the changes in LWC, we perform budget analysis of the LWC to determine which physical processes are the dominant contributors.
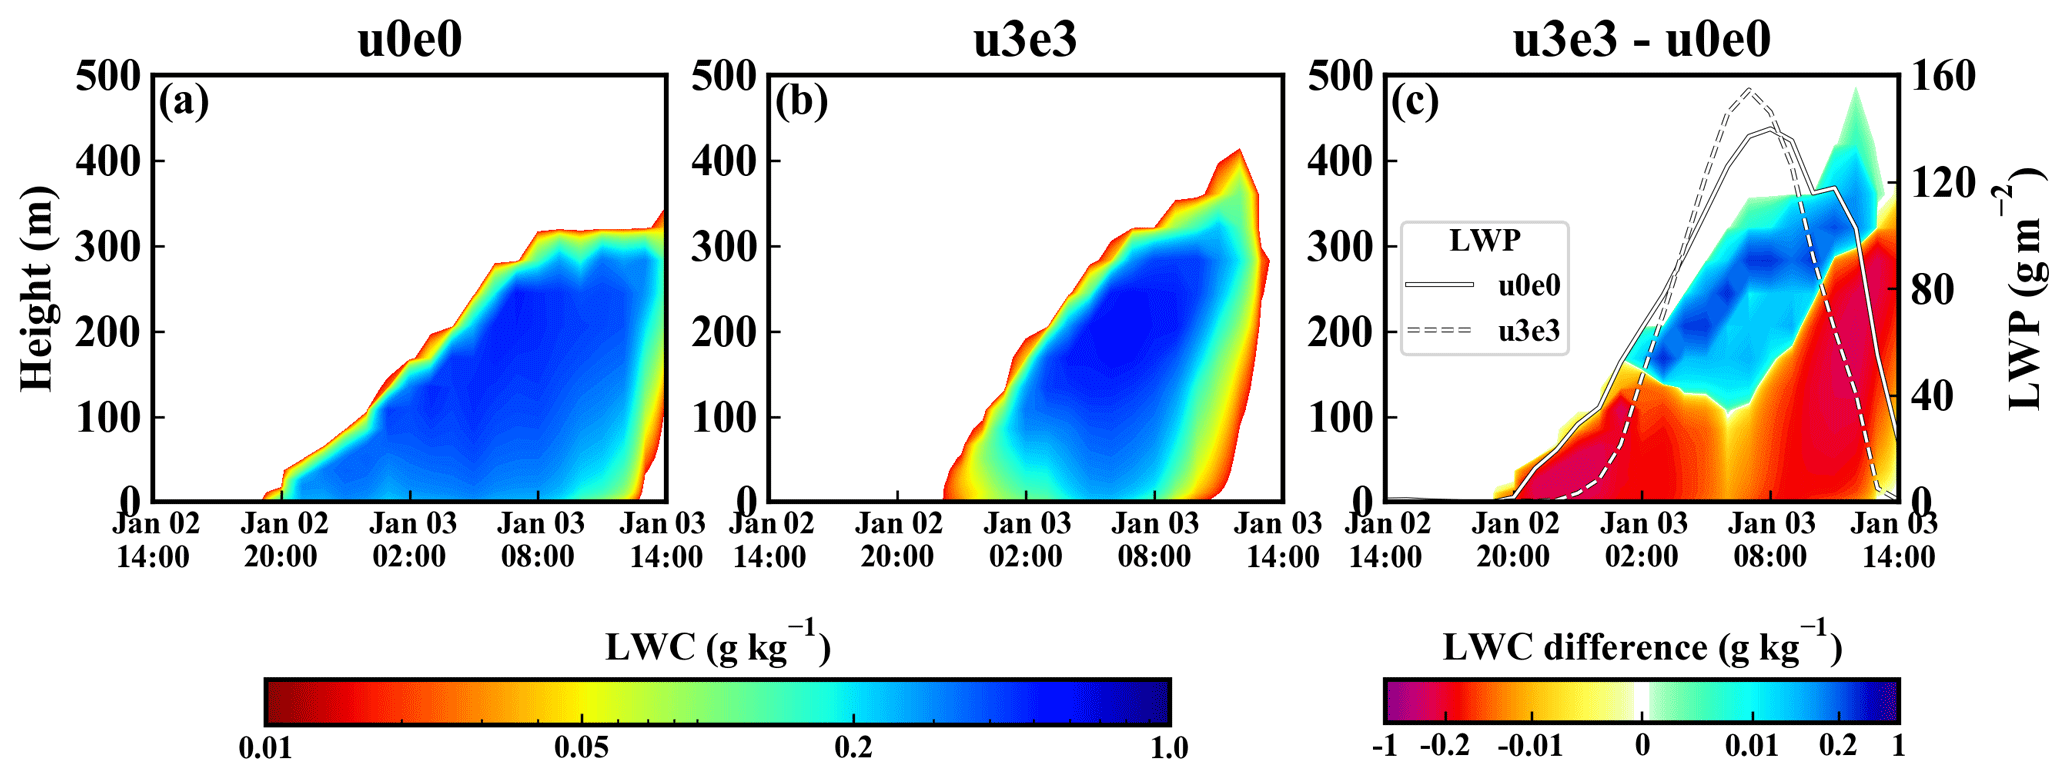
Figure 9Similar to Fig. 5 but for the combined effect of urbanization and aerosols (u3e3 minus u0e0).
In WRF, the budget of LWC is composed of the following items:
where qc is LWC, and the subscripts denote advection, boundary layer, microphysical and cumulus processes, respectively.
The microphysical tendency is further decomposed into the following items:
where the subscripts denote cold-phase processes, autoconversion, accretion, sedimentation and condensation–evaporation, respectively.
All the processes regarding precipitation and cold phase (the cumu, cold, auto and accr subscripts) are not analysed because no precipitation occurs, and the temperature is above 0 ∘C in the simulated fog (figure not shown). Summing the integral of microphysical (condensation–evaporation and sedimentation), boundary layer and advection tendencies with respect to time is equal to LWC, so the contributions of other physical processes can be safely ignored.
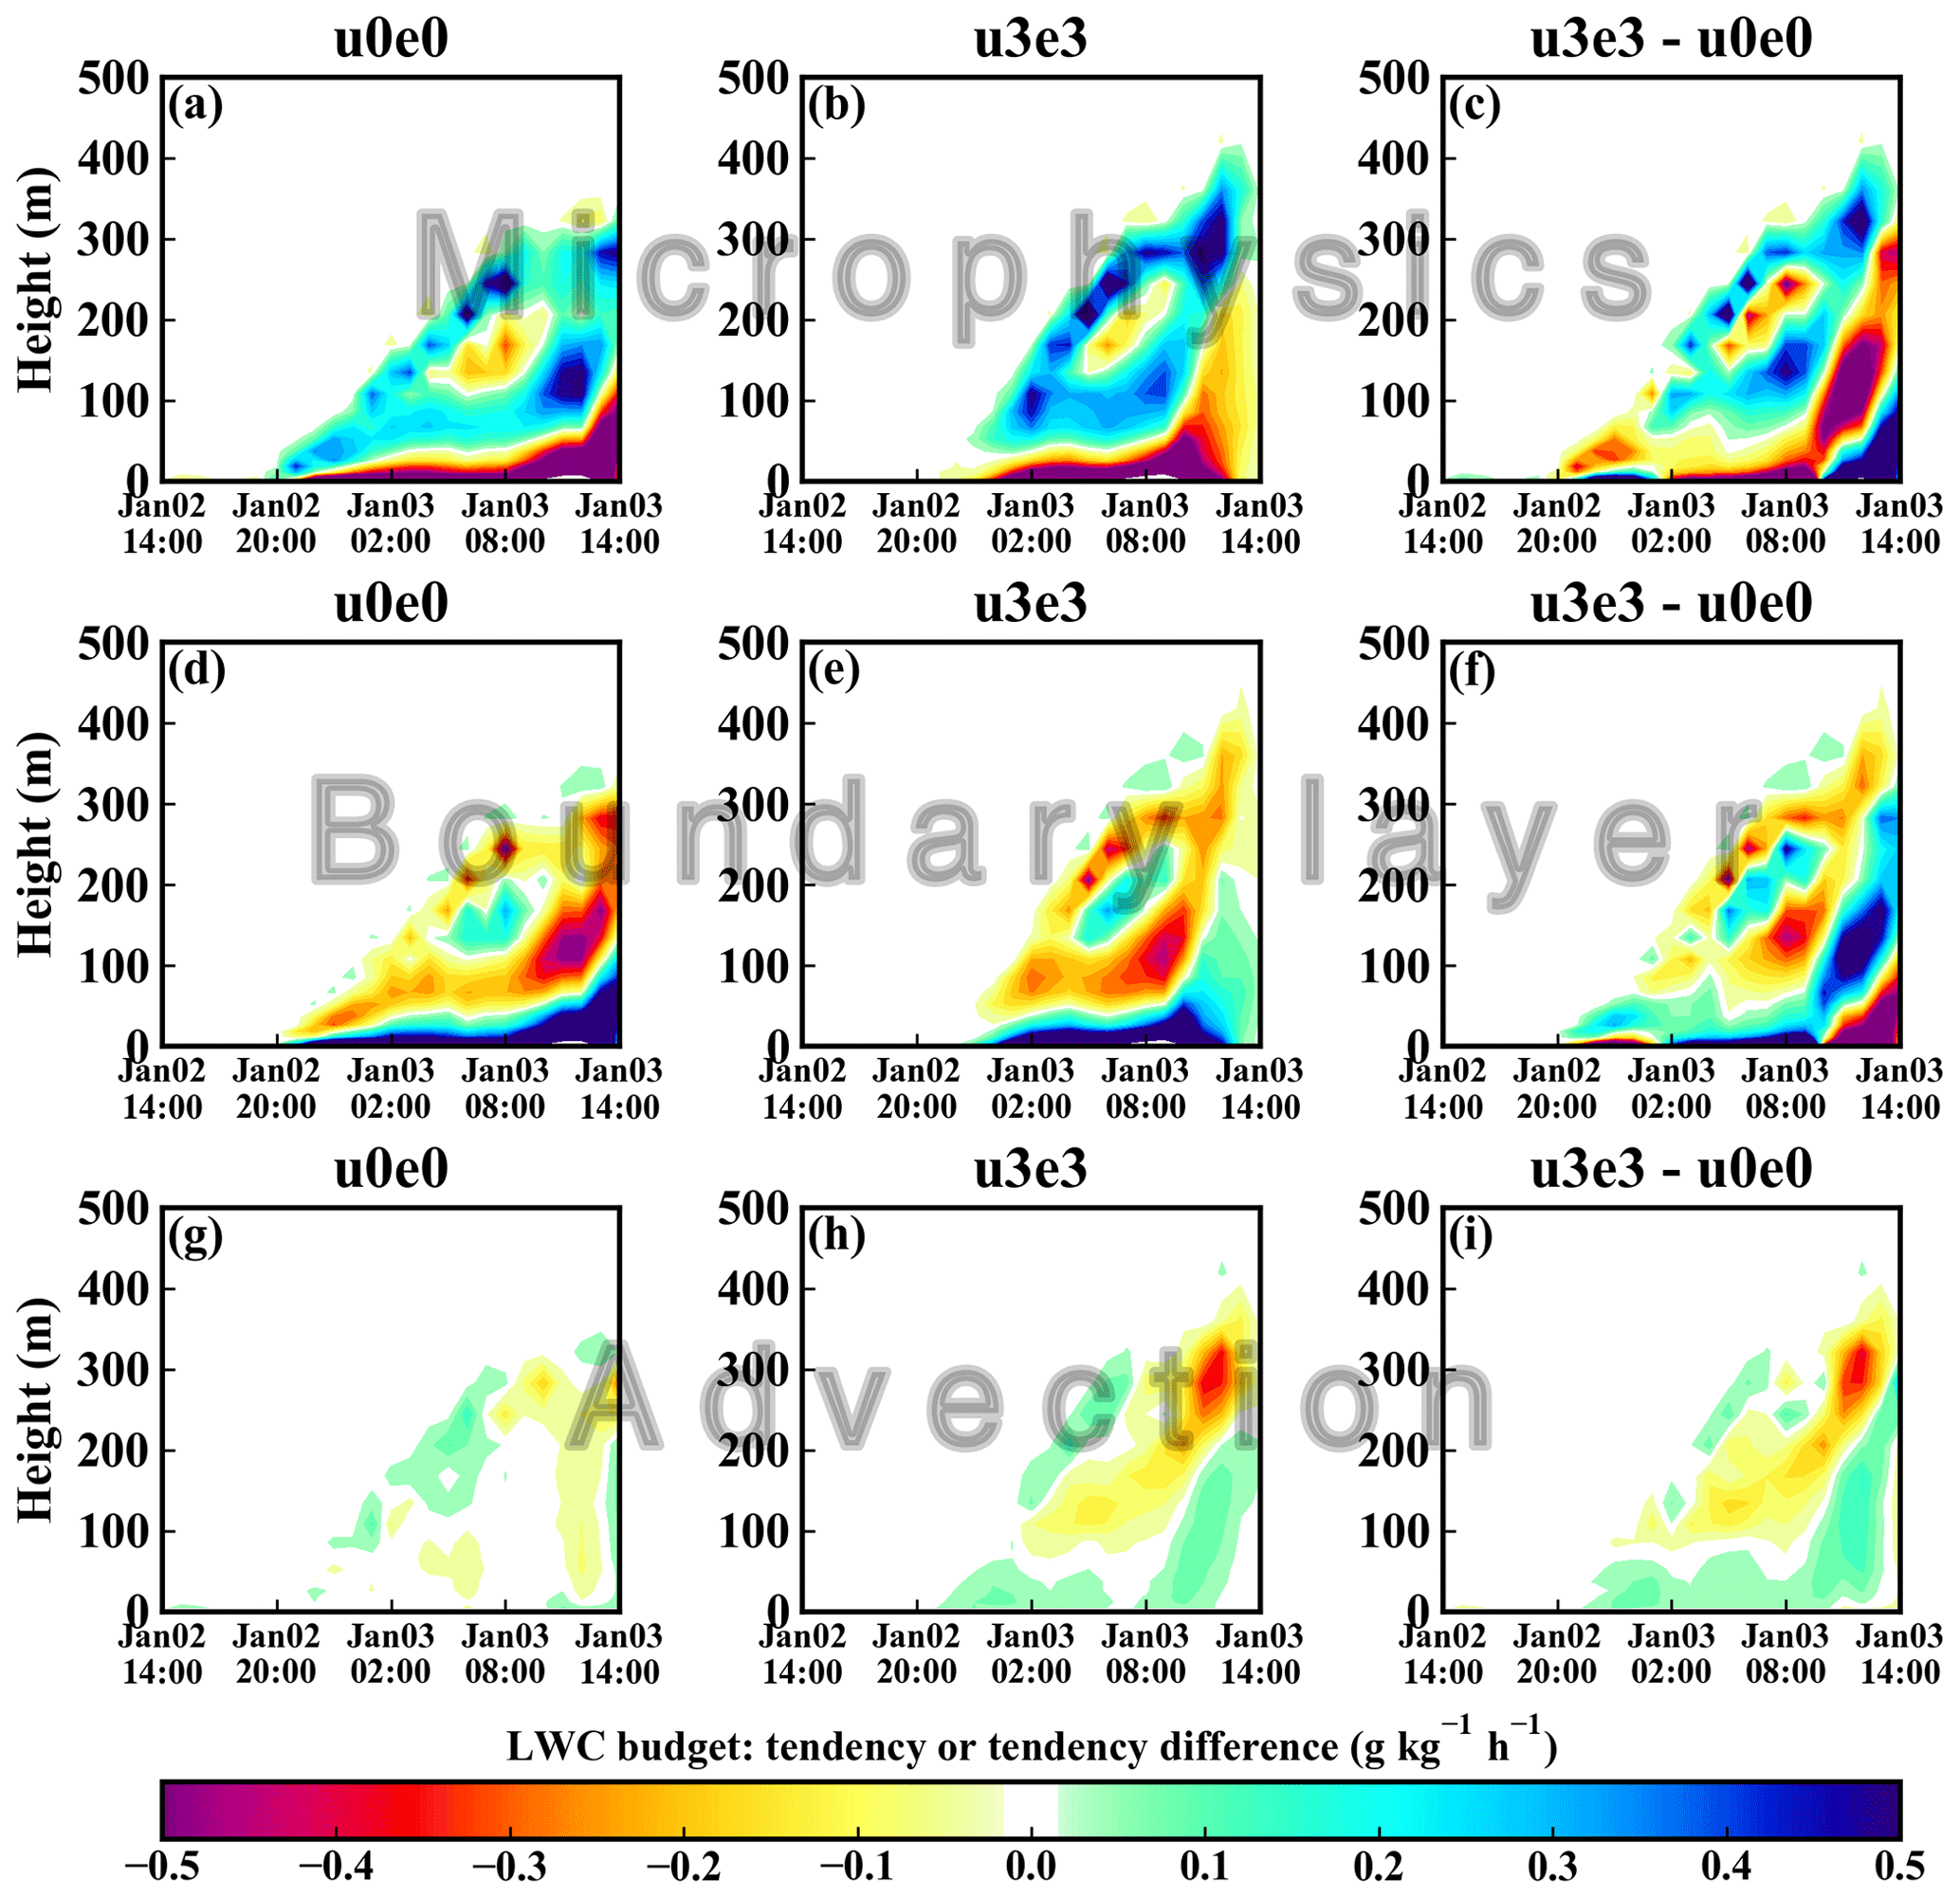
Figure 10The combined effect of urbanization and aerosols (u3e3 minus u0e0) on various items of the LWC budget. The three rows are the tendencies (g kg−1 h−1) of the microphysical, boundary layer and advection processes.
We can also infer that the extents to which the various physical processes affect fog through the sensitivity experiments (u3e0, u0e3 and u3e3). Additional aerosols weakly influence these processes (Fig. S3, right column) and subsequently result in weak LWC change (Fig. 7c). Compared with aerosols, the urbanization effect is much more considerable (Fig. S4, right column); it dominantly accounts for the variation in physical tendencies from u0e0 to u3e3 (Fig. 10, right column). In the u3e3 condition, urban development (urbanization and aerosols) induces different magnitudes of changes in different physical tendencies. The relative magnitudes are 52.1 %, 38.3 % and 9.6 % for the microphysical, boundary layer and advection processes, respectively, indicating that microphysics is most susceptible to urban development and contributes most to the LWC change. Among various microphysical processes, condensation–evaporation contributes most (72.7 %) to the change in microphysical tendency (Fig. 11, right column). The above results indicate that urban development affects the LWC mainly by modulating the condensation–evaporation process. Since the u3e3 condition still witnesses higher temperatures and stronger updraughts (figure not shown), the notable variation in condensation–evaporation tendency induced by u3e3 can also be attributed to the predominant role of UHI, UDI and updraughts. The mechanism has been analysed in Sect. 3.3.
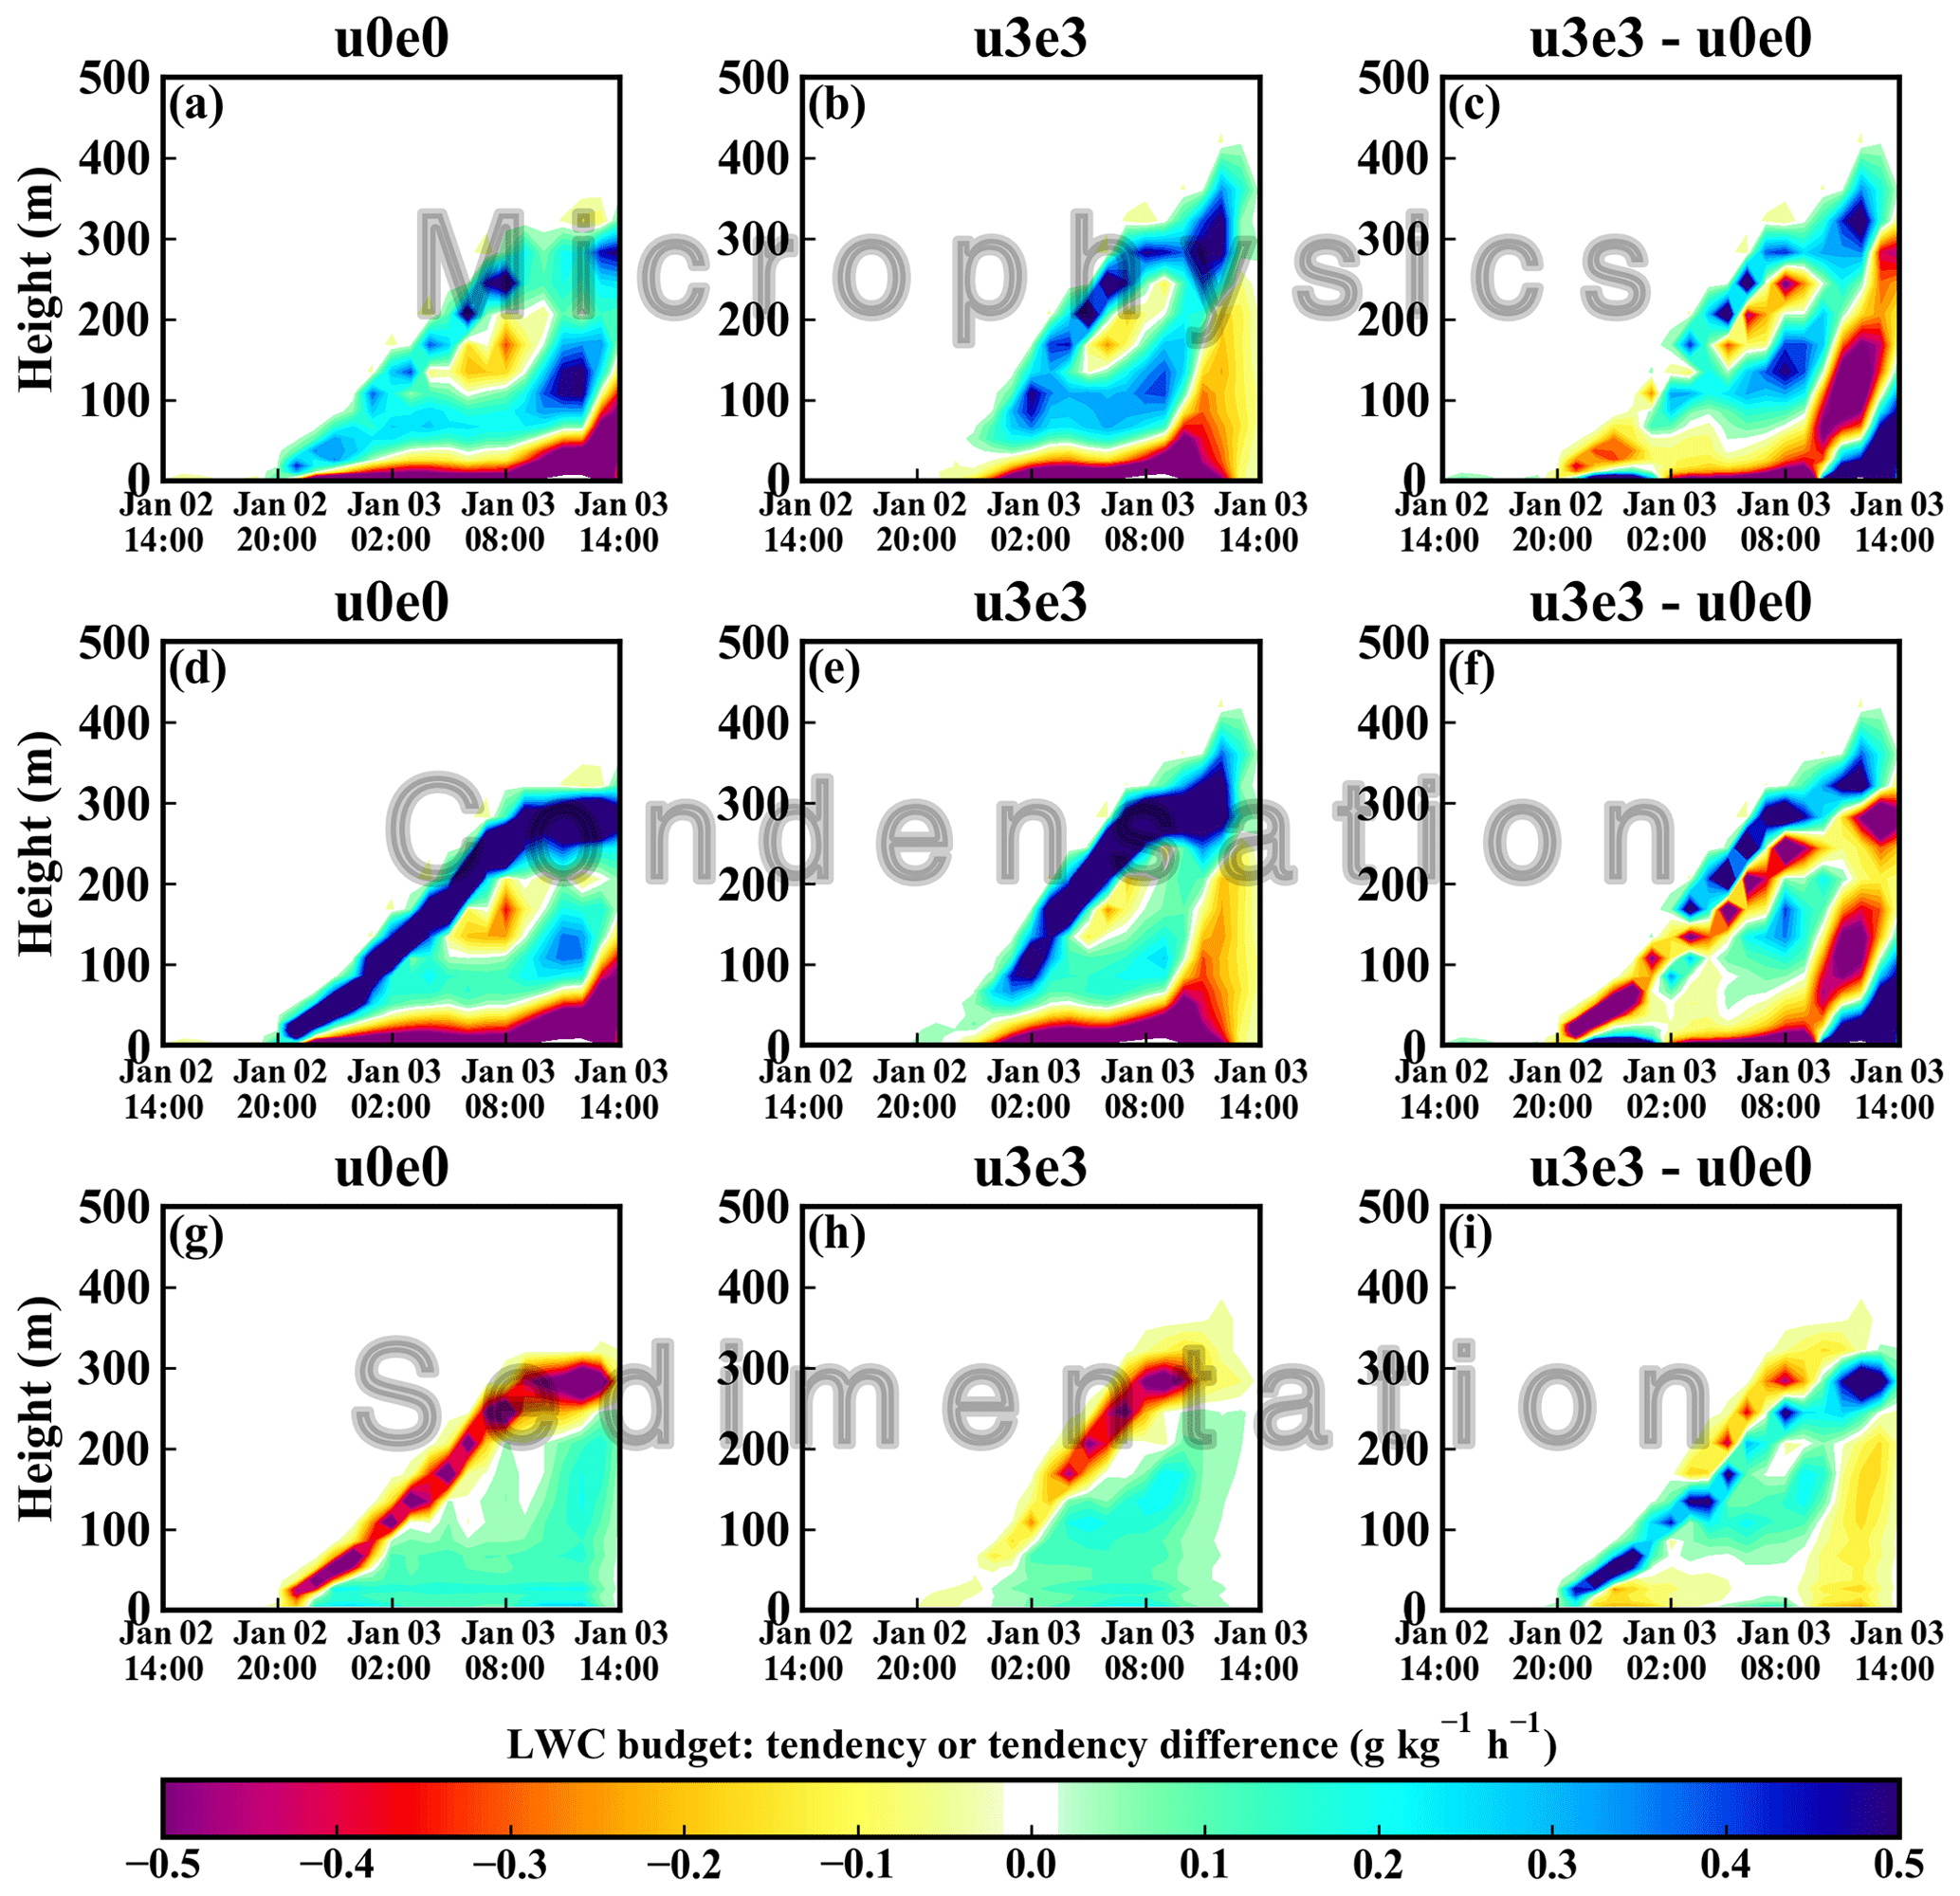
Figure 11The combined effect of urbanization and aerosols (u3e3 minus u0e0) on various items of the microphysical tendency. The three rows are the tendencies (g kg−1 h−1) of the microphysical, condensation–evaporation and sedimentation processes.
3.6 Discussions
As mentioned above, urbanization influences fog to a larger extent than aerosols do; the LWC in fog does not vary substantially with pollution level. This section discusses the rationality and reliability of our results through mechanism analysis and observational evidence.
The sensitivity of cloud properties to aerosols depends on aerosol concentration and saturation environment. In convective clouds with intense upward motions and high saturations, the response of cloud properties to additional aerosols is significant (“aerosol-limited regime”) (Fan et al., 2018). However, in fog with much weaker updraughts and lower saturations, this response could be more sensitive to vapour content rather than aerosol concentration (“vapour-limited regime”). It possibly implies that the LWC in fog varies slightly with pollution level but considerably with the saturation condition that related to urbanization. Our results reveal that the time–height average LWC varies within the extent of 0.07 g kg−1 when emission intensity varies within 2 orders of magnitude (Fig. 8). This relative weak response of the LWC to the pollution level is also reported by Jia et al. (2018).
In terms of observational evidence, Yan et al. (2019) revealed that fog days in polluted regions of eastern China have decreased since the 1990s. Through quantitative analysis, the promoting effects of aerosols are weakening, while the suppressing effects of urbanization are enhancing and dominantly cause this decrease. Sachweh and Koepke (1995) also claimed that the hindering effects of urbanization outweigh the promoting effects of aerosols on fog in southern Germany. Additionally, satellite images present discernible fog holes above urban areas (Fig. 3) (Lee, 1987; Sachweh and Koepke, 1995). Therefore, the above observational evidence supports the model results that the promoting effect of aerosols is counteracted by the hindering effect of urbanization. We believe that the results can also be applied to other large cities in China because these cities commonly witness strong UHI, UDI and severe air pollution.
A dense radiation fog event occurred in eastern China from 2 to 3 January 2017. Satellite images show that fog holes occur over urban areas, demonstrating the remarkable effects of urbanization and air pollution on fog. Hence, the mechanism is investigated by WRF-Chem. The model captures the spatial coverage and temporal evolution of the fog well. Furthermore, the separate and combined effects of urbanization (refers to UHI and UDI) and air pollution (refers to aerosols) on fog (indicated by the LWC) are revealed, and the extents of these effects are quantitatively determined. Results show the following.
-
Urbanization redistributes the LWC profile by the UHI, UDI effect and updraughts. The updraughts may be caused by surface roughness and extra warming. The UHI and UDI suppress low-level fog, delay its formation by 3 h and advance its dissipation by 1.5 h. However, the upper-level fog could be enhanced due to the updraught-induced adiabatic cooling and vapour flux convergence. Urbanization reduces the LWP most of the time, and this reduction in the daytime can explain why fog holes are present above urban areas on satellite images.
-
Aerosols promote fog mainly by changing microphysical properties. The increasing emissions (aerosol concentration) produce more CCN and fog droplets, which decrease Re and inhibits sedimentation, thus leading to a higher LWC. Further sensitivity experiments show that the current pollution level in China could still be below the critical aerosol concentration that suppresses fog. The macroscopic properties such as fog top and lifetime remain nearly unchanged.
-
The role of urbanization far overweighs that of aerosols. Therefore, when they act together, the urbanization effect is dominant, and the aerosol effect is indiscernible. Budget analysis of LWC shows that increasing aerosols influence various physical processes to a lesser extent, while urbanization influences these processes to a larger extent, eventually leading to a substantial LWC change in the urban development condition (urbanization and aerosols). In this condition, the comparisons among various physical processes reveal that microphysics dominates the change in LWC, and condensation–evaporation dominates the change in microphysical tendency. This result highlights the importance of the condensation–evaporation process in modulating the LWC profile and fog structure.
-
Mechanism analysis and the observational evidence support our key finding that urbanization influences fog to a much larger extent than aerosol pollution does. Therefore, we believe our results are reasonable and robust in radiation fog events without strong synoptic forcings, and the results can also be applied to other large cities in China due to the similar urban development patterns. This study is expected to facilitate a better understanding of how anthropogenic activities affect the natural environment, fog (cloud) physics and aerosol–cloud interactions near the surface. We can also infer the future change of fog occurrence. Under the traditional urban development pattern, i.e. that in which urbanization keeps developing and air quality keeps deteriorating, urban fog occurrence will be further reduced.
Some of the data repositories have been listed in Sect. 2. The other data, model outputs and codes can be accessed by contacting Bin Zhu via binzhu@nuist.edu.cn.
The supplement related to this article is available online at: https://doi.org/10.5194/acp-20-5559-2020-supplement.
SY performed the model simulation, data analysis and paper writing. BZ proposed the idea, supervised this work and revised the paper. YH provided the observation data at the SX site. JZ processed the observation data. HK offered help with the model simulation. CL and TZ also contributed to the paper revision.
The authors declare that they have no conflict of interest.
We are grateful to the High Performance Computing Center of Nanjing University of Information Science and Technology for doing the numerical calculations in this work on its blade cluster system. We thank American Journal Experts (AJE) for the English language editing.
This research has been supported by the National Key Research and Development Program (grant no. 2016YFA0602003) and the National Natural Science Foundation of China (grant nos. 91544229, 41575148, 41605091).
This paper was edited by Xiaohong Liu and reviewed by three anonymous referees.
Abdul-Razzak, H. and Ghan, S. J.: A parameterization of aerosol activation 3. Sectional representation, J. Geophys. Res., 107, AAC-1–AAC 1-6, https://doi.org/10.1029/2001jd000483, 2002.
Bott, A.: On the influence of the physico-chemical properties of aerosols on the life cycle of radiation fogs, J. Aerosol. Sci., 21, 1–31, https://doi.org/10.1007/BF00119960, 1991.
Chaouch, N., Temimi, M., Weston, M., and Ghedira, H.: Sensitivity of the meteorological model WRF-ARW to planetary boundary layer schemes during fog conditions in a coastal arid region, Atmos. Res., 187, 106–127, https://doi.org/10.1016/j.atmosres.2016.12.009, 2017.
Chapman, E. G., Gustafson Jr., W. I., Easter, R. C., Barnard, J. C., Ghan, S. J., Pekour, M. S., and Fast, J. D.: Coupling aerosol-cloud-radiative processes in the WRF-Chem model: Investigating the radiative impact of elevated point sources, Atmos. Chem. Phys., 9, 945–964, https://doi.org/10.5194/acp-9-945-2009, 2009.
Chen, Y.-C., Christensen, M. W., Xue, L., Sorooshian, A., Stephens, G. L., Rasmussen, R. M., and Seinfeld, J. H.: Occurrence of lower cloud albedo in ship tracks, Atmos. Chem. Phys., 12, 8223–8235, https://doi.org/10.5194/acp-12-8223-2012, 2012.
Ding, A. J., Huang, X., Nie, W., Sun, J. N., Kerminen, V.-M., Petäjä, T., Su, H., Cheng, Y. F., Yang, X.-Q., Wang, M. H., Chi, X. G., Wang, J. P., Virkkula, A., Guo, W. D., Yuan, J., Wang, S. Y., Zhang, R. J., Wu, Y. F., Song, Y., Zhu, T., Zilitinkevich, S., Kulmala, M., and Fu, C. B.: Enhanced haze pollution by black carbon in megacities in China, Geophys. Res. Lett., 43, 2873–2879, https://doi.org/10.1002/2016gl067745, 2016.
Ding, Q., Sun, J., Huang, X., Ding, A., Zou, J., Yang, X., and Fu, C.: Impacts of black carbon on the formation of advection–radiation fog during a haze pollution episode in eastern China, Atmos. Chem. Phys., 19, 7759–7774, https://doi.org/10.5194/acp-19-7759-2019, 2019.
Di Vittorio, A. V. and Emery, W. J.: An automated, dynamic threshold cloud-masking algorithm for daytime AVHRR images over land, IEEE T. Geosci. Remote, 40, 1682–1694, https://doi.org/10.1109/TGRS.2002.802455, 2002.
Fan, J., Wang, Y., Rosenfeld, D., and Liu, X.: Review of Aerosol–Cloud Interactions: Mechanisms, Significance, and Challenges, J. Atmos. Sci., 73, 4221–4252, https://doi.org/10.1175/JAS-D-16-0037.1, 2016.
Fan, J., Rosenfeld, D., Zhang, Y., Giangrande, S. E., Li, Z., and Machado, L. A. T.: Substantial convection and precipitation enhancements by ultrafine aerosol particles, Science, 359, 411–418, https://doi.org/10.1126/science.aan8461, 2018.
Fast, J. D., Gustafson, W. I., Easter, R. C., Zaveri, R. A., Barnard, J. C., Chapman, E. G., Grell, G. A., and Peckham, S. E.: Evolution of ozone, particulates, and aerosol direct radiative forcing in the vicinity of Houston using a fully coupled meteorology-chemistry-aerosol model, J. Geophys. Res., 111, D21305, https://doi.org/10.1029/2005jd006721, 2006.
Goren, T. and Rosenfeld, D.: Satellite observations of ship emission induced transitions from broken to closed cell marine stratocumulus over large areas, J. Geophys. Res.-Atmos., 117, D17206, https://doi.org/10.1029/2012JD017981, 2012.
Gu, Y., Kusaka, H., van Doan, Q., and Tan, J.: Impacts of urban expansion on fog types in Shanghai, China: Numerical experiments by WRF model, Atmos. Res., 220, 57–74, https://doi.org/10.1016/j.atmosres.2018.12.026, 2019.
Gultepe, I., Müller, M. D., and Boybeyi, Z.: A New Visibility Parameterization for Warm-Fog Applications in Numerical Weather Prediction Models, J. Appl. Meteorol. Clim., 45, 1469–1480, https://doi.org/10.1175/jam2423.1, 2006.
Gultepe, I., Tardif, R., Michaelides, S. C., Cermak, J., Bott, A., Bendix, J., Müller, M. D., Pagowski, M., Hansen, B., Ellrod, G., Jacobs, W., Toth, G., and Cober, S. G.: Fog Research: A Review of Past Achievements and Future Perspectives, Pure Appl. Geophys., 164, 1121–1159, https://doi.org/10.1007/s00024-007-0211-x, 2007.
Gultepe, I., Milbrandt, J. A., and Zhou, B.: Marine fog: A review on microphysics and visibility prediction, in: Marine Fog: Challenges and Advancements in Observations, Modeling, and Forecasting, edited by: Koračin, D. and Dorman, C., Springer, Cham, Switzerland, 50 pp., 2017.
Guo, J., Su, T., Li, Z., Miao, Y., Li, J., Liu, H., Xu, H., Cribb, M., and Zhai, P.: Declining frequency of summertime local-scale precipitation over eastern China from 1970 to 2010 and its potential link to aerosols, Geophys. Res. Lett., 44, 5700–5708, https://doi.org/10.1002/2017GL073533, 2017.
Guo, T., Zhu, B., Kang, Z., Gui, H., and Kang, H.: Spatial and temporal distribution characteristic of fog days and haze days from 1960∼2012 and impact factors over the Yangtze River Delta Region, China Environmental Science, 36, 961–969, https://doi.org/10.3969/j.issn.1000-6923.2016.04.001, 2016 (in Chinese).
IPCC: Climate change 2013: The physical science basis, Contribution of Working Group I to the Fifth Assessment Report of the Intergovernmental Panel on Climate Change, edited by: Stocker, T. F., Qin, D., Plattner, G., Tignor M., Allen, S. K., Boschung, J., Nauels, N., Xia, Y., Bex, V., and Midgley, P. M., Cambridge University Press, Cambridge, UK and New York, NY, USA, 1585 pp., 2013.
Jia, X. and Guo X.: Impacts of Anthropogenic Atmospheric Pollutant on Formation and Development of a Winter Heavy Fog Event, Chinese Journal of Atmospheric Sciences, 36, 995–1008, https://doi.org/10.3878/j.issn.1006-9895.2012.11200, 2012 (in Chinese).
Jia, X. and Guo, X.: Impacts of Secondary Aerosols on a Persistent Fog Event in Northern China, Atmospheric and Oceanic Science Letters, 5, 401–407, https://doi.org/10.1080/16742834.2012.11447022, 2015.
Jia, X., Quan, J., Zheng, Z., Liu, X., Liu, Q., He, H., and Liu, Y.: Impacts of anthropogenic aerosols on fog in North China Plain, J. Geophys. Res.-Atmos., 124, 252–265, https://doi.org/10.1029/2018jd029437, 2018.
Kang, H., Zhu, B., Zhu, T., Sun, J., and Ou, J.: Impact of Megacity Shanghai on the Urban Heat-Island Effects over the Downstream City Kunshan, Bound.-Lay. Meteorol., 152, 411–426, https://doi.org/10.1007/s10546-014-9927-1, 2014.
Khain, A. P. and Pinsky, M.: Modeling: A Powerful Tool for Cloud Investigation, in: Physical processes in clouds and cloud modeling, Cambridge University Press, Cambridge, UK and New York, NY, USA, 98 pp., 2018.
Koren, I., Martins, J. V., Remer, L. A., and Afargan, H.: Smoke invigoration versus inhibition of clouds over the Amazon, Science, 321, 946–949, https://doi.org/10.1126/science.1159185, 2008.
Koschmieder, H.: Therie der horizontalen sichtweite, Beitr. Phys. d. freien Atm., 12, 171–181, 1924.
Kunkel, B. A.: Parameterization of Droplet Terminal Velocity and Extinction Coefficient in Fog Models, J. Appl. Meteorol., 23, 34–41, https://doi.org/10.1175/1520-0450(1984)023<0034:PODTVA>2.0.CO;2, 1983
LaDochy, S.: The Disappearance of Dense Fog in Los Angeles: Another Urban Impact?, Phys. Geogr., 26, 177–191, https://doi.org/10.2747/0272-3646.26.3.177, 2005.
Lee, T. F.: Urban clear islands in California central valley fog, Mon. Weather Rev., 115, 1794–1796, https://doi.org/10.1175/1520-0493(1987)115<1794:UCIICC>2.0.CO;2, 1987.
Leng, C., Zhang, Q., Zhang, D., Xu, C., Cheng, T., Zhang, R., Tao, J., Chen, J., Zha, S., Zhang, Y., Li, X., Kong, L., and Gao, W.: Variations of cloud condensation nuclei (CCN) and aerosol activity during fog–haze episode: a case study from Shanghai, Atmos. Chem. Phys., 14, 12499–12512, https://doi.org/10.5194/acp-14-12499-2014, 2014.
Li, Y., Cao, L., Gao, S., and Luo, B.: The Current Stage and Development of MICAPS, Meteorological Monthly, 36, 50–55, 2010 (in Chinese).
Li, Z., Yang, J., Shi, C., and Pu, M.: Urbanization Effects on Fog in China: Field Research and Modeling, Pure Appl. Geophys., 169, 927–939, https://doi.org/10.1007/s00024-011-0356-5, 2011.
Li, Z., Lau, W. K. M., Ramanathan, V., Wu, G., Ding, Y., Manoj, M. G., Liu, J., Qian, Y., Li, J., Zhou, T., Fan, J., Rosenfeld, D., Ming, Y., Wang, Y., Huang, J., Wang, B., Xu, X., Lee, S. S., Cribb, M., Zhang, F., Yang, X., Zhao, C., Takemura, T., Wang, K., Xia, X., Yin, Y., Zhang, H., Guo, J., Zhai, P. M., Sugimoto, N., Babu, S. S., and Brasseur, G. P.: Aerosol and monsoon climate interactions over Asia, Rev. Geophys., 54, 866–929, https://doi.org/10.1002/2015RG000500, 2016.
Li, Z., Guo, J., Ding, A., Liao, H., Liu, J., Sun, Y., Wang, T., Xue, H., Zhang, H., and Zhu, B.: Aerosol and boundary-layer interactions and impact on air quality, Natl. Sci. Rev., 4, 810–833, https://doi.org/10.1093/nsr/nwx117, 2017.
Liu, H., Guo, J., Koren, I., Altaratz, O., Dagan, G., Wang, Y., Jiang, J, H., Zhai, P., and Yung, Y. L.: Non-Monotonic Aerosol Effect on precipitation in Convective Clouds over tropical oceans, Sci. Rep., 9, 1–7, https://doi.org/10.1038/s41598-019-44284-2, 2019.
Maalick, Z., Kühn, T., Korhonen, H., Kokkola, H., Laaksonen, A., and Romakkaniemi, S.: Effect of aerosol concentration and absorbing aerosol on the radiation fog life cycle, Atmos. Environ., 133, 26–33, https://doi.org/10.1016/j.atmosenv.2016.03.018, 2016.
Morrison, H., Curry, J. A., and Khvorostyanov, V. I.: A new double-moment microphysics parameterization for application in cloud and climate models. Part I: Description, J. Atmos. Sci., 62, 1665–1677, https://doi.org/10.1175/JAS3446.1, 2005.
Niu, F., Li, Z., Li, C., Lee, K., and Wang, M.: Increase of wintertime fog in China: Potential impacts of weakening of the Eastern Asian monsoon circulation and increasing aerosol loading, J. Geophys. Res., 115, D00K20, https://doi.org/10.1029/2009jd013484, 2010.
Niu, S., Lu, C., Yu, H., Zhao, L., and Lü, J.: Fog research in China: An overview, Adv. Atmos. Sci., 27, 639–662, https://doi.org/10.1007/s00376-009-8174-8, 2010.
Quan, J., Zhang, Q., He, H., Liu, J., Huang, M., and Jin, H.: Analysis of the formation of fog and haze in North China Plain (NCP), Atmos. Chem. Phys., 11, 8205–8214, https://doi.org/10.5194/acp-11-8205-2011, 2011.
Rangognio, J., Tulet, P., Bergot, T., Gomes, L., Thouron, O., and Leriche, M.: Influence of aerosols on the formation and development of radiation fog, Atmos. Chem. Phys. Discuss., 9, 17963–18019, https://doi.org/10.5194/acpd-9-17963-2009, 2009.
Rosenfeld, D., Lohmann, U., Raga, G. B., O'Dowd, C. D., Kulmala, M., Fuzzi, S., Reissell, A., and Andreae, M. O.: Flood or drought: how do aerosols affect precipitation?, Science, 321, 1309–1313, https://doi.org/10.1126/science.1160606, 2008.
Rosenfeld, D., Andreae, M. O., Asmi, A., Chin, M., de Leeuw, G., Donovan, D. P., Kahn, R., Kinne, S., Kivekäs, N., Kulmala, M., Lau, W., Schmidt, K. S., Suni, T., Wagner, T., Wild, M., and Quaas, J.: Global observations of aerosol-cloud-precipitation-climate interactions, Rev. Geophys., 52, 750–808, https://doi.org/10.1002/2013RG000441, 2014.
Rozoff, C. M., Cotton, W. R., and Adegoke, J. O.: Simulation of St. Louis, Missouri, Land Use Impacts on Thunderstorms, J. Appl. Meteorol., 42, 716–738, https://doi.org/10.1175/1520-0450(2003)042<0716:SOSLML>2.0.CO;2, 2003.
Sachweh, M. and Koepke, P.: Radiation fog and urban climate, Geophys. Res. Lett., 22, 1073–1076, https://doi.org/10.1029/95gl00907, 1995.
Shepherd, J. M.: A Review of Current Investigations of Urban-Induced Rainfall and Recommendations for the Future, Earth Interact., 9, 1–27, https://doi.org/10.1175/ei156.1, 2005.
Shi, C., Roth, M., Zhang, H., and Li, Z.: Impacts of urbanization on long-term fog variation in Anhui Province, China, Atmos. Environ., 42, 8484–8492, https://doi.org/10.1016/j.atmosenv.2008.08.002, 2008.
Stolaki, S., Haeffelin, M., Lac, C., Dupont, J. C., Elias, T., and Masson, V.: Influence of aerosols on the life cycle of a radiation fog event. A numerical and observational study, Atmos. Res., 151, 146–161, https://doi.org/10.1016/j.atmosres.2014.04.013, 2015.
Tao, W. K., Chen, J. P., Li, Z., Wang, C., and Zhang, C.: Impact of aerosols on convective clouds and precipitation, Rev. Geophys., 50, 6837, https://doi.org/10.1029/2011RG000369, 2012.
Tie, X., Huang, R., Cao, J., Zhang, Q., Cheng, Y., Su, H., Chang, D., Pöschl, U., Hoffmann, T., Dusek, U., Li, G., Worsnop, D., and O'Dowd, C.: Severe Pollution in China Amplified by Atmospheric Moisture, Sci. Rep. 7, 15760, https://doi.org/10.1038/s41598-017-15909-1, 2017.
Tie, X., Long, X., Li, G., Zhao, S., Cao, J., and Xu, J.: Ozone enhancement due to the photodissociation of nitrous acid in eastern China, Atmos. Chem. Phys., 19, 11267–11278, https://doi.org/10.5194/acp-19-11267-2019, 2019.
Twomey, S. A.: The Influence of Pollution on the Shortwave Albedo of Clouds, J. Atmos. Sci., 34, 1149–1154, https://doi.org/10.1175/1520-0469(1977)034<1149:tiopot>2.0.co;2, 1977.
Wang, F., Guo, J., Zhang, J., Huang, J., Min, M., Chen, T., Liu, H., Deng, M., and Li, X.: Multi-sensor quantification of aerosol-induced variability in warm clouds over eastern China, Atmos. Environ., 113, 1–9, https://doi.org/10.1016/j.atmosenv.2015.04.063, 2015.
Yan, S., Zhu, B., and Kang, H.: Long-term fog variation and its impact factors over polluted regions of East China, J. Geophys. Res.-Atmos., 124, 1741–1754, https://doi.org/10.1029/2018JD029389, 2019.
Yang, Y., Hu, X., Gao, S., and Wang, Y.: Sensitivity of WRF simulations with the YSU PBL scheme to the lowest model level height for a sea fog event over the Yellow Sea, Atmos. Res., 215, 253–267, https://doi.org/10.1016/j.atmosres.2018.09.004, 2019.
Zhang, N. and Ma, X.: Analysis of the June 2018 Atmospheric Circulation and Weather, Meteorological Monthly, 43, 508–512, https://doi.org/10.7519/j.issn.1000-0526.2017.04.014, 2017 (in Chinese).
Zhang, X., Musson-Genon, L., Dupont, E., Milliez, M., and Carissimo, B.: On the Influence of a Simple Microphysics Parametrization on Radiation Fog Modelling: A Case Study During ParisFog, Bound.-Lay. Meteorol., 151, 293–315, https://doi.org/10.1007/s10546-013-9894-y, 2014.
Zhu, B. and Guo, T.: Review of the Impact of Air Pollution on Fog, Advances in Meteorological Science and Technology, 6, 56–63, 2016 (in Chinese).
Zhu, J., Zhu, B., Huang, Y., An, J., and Xu, J.: PM2.5 vertical variation during a fog episode in a rural area of the Yangtze River Delta, China, Sci. Total Environ., 685, 555–563, https://doi.org/10.1016/j.scitotenv.2019.05.319, 2019.