the Creative Commons Attribution 4.0 License.
the Creative Commons Attribution 4.0 License.
 | 30 Apr 2020
The influence of water vapor anomalies on clouds and their radiative effect at Ny-Ålesund
Kerstin Ebell
Ulrich Löhnert
Marion Maturilli
Christoph Ritter
The occurrence of events with increased and decreased integrated water vapor (IWV) at the Arctic site Ny-Ålesund, their relation to cloud properties, and the surface cloud radiative effect (CRE) is investigated. For this study, we used almost 2.5 years (from June 2016 to October 2018) of ground-based cloud observations processed with the Cloudnet algorithm, IWV from a microwave radiometer (MWR), long-term radiosonde observations, and backward trajectories FLEXTRA. Moist and dry anomalies were found to be associated with North Atlantic flows and air transport within the Arctic region, respectively. The amount of water vapor is often correlated to cloud occurrence, presence of cloud liquid water, and liquid water path (LWP) and ice water path (IWP). In turn, changes in the cloud properties cause differences in surface CRE. During dry anomalies, in autumn, winter, and spring, the mean net surface CRE was lower by 2–37 W m−2 with respect to normal conditions, while in summer the cloud-related surface cooling was reduced by 49 W m−2. In contrast, under moist conditions in summer the mean net surface CRE becomes more negative by 25 W m−2, while in other seasons the mean net surface CRE was increased by 5–37 W m−2. Trends in the occurrence of dry and moist anomalies were analyzed based on a 25-year radiosonde database. Dry anomalies have become less frequent, with rates for different seasons ranging from −12.8 % per decade to −4 % per decade, while the occurrence of moist events has increased at rates from 2.8 % per decade to 6.4 % per decade.
- Article
(4706 KB) -
Supplement
(357 KB) - BibTeX
- EndNote


It is well known that during the past three decades the Arctic climate has been drastically changing. The change in the annual near-surface temperature over the Arctic region has been found to be a factor of 2 to 3 larger compared to the global average (IPCC, 2007; Solomon et al., 2007; Wendisch et al., 2017). In the period from 1998 to 2012, the temperature increase in the Arctic was persistent and in contrast to the “hiatus” in global warming discussed in a number of studies (Wei et al., 2016; Huang et al., 2017).
This amplification of warming in the Arctic is caused by several feedback mechanisms. Among them are the reduced sea-ice extent and high sea surface temperature (Serreze et al., 2011; Hegyi and Taylor, 2018), changes in atmospheric circulation (Maturilli and Kayser, 2017a; Overland et al., 2016; Overland and Wang, 2016; Wu, 2017) and energy transport (Graversen and Burtu, 2016; Hwang et al., 2011), surface albedo effect (Graversen et al., 2014), increased greenhouse effect of water vapor, and clouds (Yoshimori et al., 2017).
The analysis of contemporary climate models shows that on average the mean cloud feedback is one of the major mechanisms opposing the Arctic amplification from a top-of-atmosphere (TOA) perspective with a relatively small contribution to the warming at the surface (Pithan and Mauritsen, 2014). Modeling of the cloud impact on the Arctic amplification is still uncertain (Pithan and Mauritsen, 2014; Hwang et al., 2011; Taylor et al., 2013) due to a large number of microphysical processes (Morrison et al., 2012), complex relations between clouds, and other feedback mechanisms of the Arctic climate (Graversen and Burtu, 2016; Hwang et al., 2011). As a result, some models underestimate the amount of super-cooled liquid water (Sandvik et al., 2007; Nomokonova et al., 2019a), which may lead to a bias in the surface temperature ranging from −7.8 to 0 ∘C (Kay et al., 2016; Miller et al., 2017).
Properties of Arctic clouds are significantly affected by air masses transported from the mid-latitudes (Graversen and Burtu, 2016; Hwang et al., 2011). A number of studies have already related the air transport and atmospheric rivers to the amount of water vapor, cloud properties, and the radiation budget (Hwang et al., 2011; Boisvert et al., 2016; Mortin et al., 2016; Sedlar and Tjernström, 2017; Hegyi and Taylor, 2018). Hegyi and Taylor (2018) reported that the episodes of poleward atmospheric water vapor transport are associated with periods of increased water vapor and cloud cover resulting in enhanced downwelling longwave surface fluxes and reduced surface cooling efficiency. A limited number of studies show that air transportation patterns may influence phase partitioning and the amount of liquid in Arctic clouds (Qiu et al., 2018; Tjernström et al., 2019).
A number of studies focus on observations at Ny-Ålesund located in the Svalbard region (Wendisch et al., 2019; Maturilli et al., 2013; Maturilli and Ebell, 2018; Yeo et al., 2018), an Arctic area where air masses transported from the lower latitudes bring more moisture in comparison to the rest of the Arctic (Dahlke and Maturilli, 2017; Mewes and Jacobi, 2019). The Svalbard region is also located in the area with the highest warming temperature trend in the Arctic (Susskind et al., 2019). Ny-Ålesund is located on the coastline of Svalbard, and thus its climate is significantly influenced by diabatic heating from the warm ocean (Serreze et al., 2011; Mewes and Jacobi, 2019) and by the surrounding orography (Maturilli and Kayser, 2017a).
Dahlke and Maturilli (2017) analyzed the air mass transport in Ny-Ålesund in winter seasons from 1996 to 2016. The authors showed an increasing air mass transport through the North Atlantic pathway and reducing flow from the north. Yeo et al. (2018) investigated how the advection of warm and cold air masses affects cloudiness, longwave fluxes at the surface, and near-surface temperature at Ny-Ålesund during winter. The authors analyzed a 10 d period in February with alternating warm and cold conditions related to distinct circulation patterns. During cold periods Yeo et al. (2018) observed a reduced cloudiness and downwelling longwave flux of 200–230 W m−2. In contrast, warm periods were associated with cloud occurrence close to 100 % and enhanced downwelling longwave flux of 300 W m−2. Since the author studied only a short period, an analysis of longer cloud observations is still needed.
In this study the main scientific question is twofold, namely how periods of increased and decreased integrated water vapor (IWV) influence cloud appearance at Ny-Ålesund and how this influence affects the cloud radiative effect. Even though only IWV is considered in this study, cloud formation and development also depend on a number of other factors such as aerosol load and chemical composition (Baustian et al., 2012; Murray et al., 2012; Wex et al., 2019), dynamics (Korolev and Field, 2008; Schmidt et al., 2014), influence of surface layer (Morrison et al., 2012) and local orographic effects (Houze, 2012), and other processes. The analysis of these factors is out of the scope of this study. We used ground-based cloud observations at Ny-Ålesund. Instrumentation and data products used in this study are presented in Sect. 2. The definition of warm and/or cold and moist and/or dry anomalous periods is described in Sect. 3. In Sect. 4, the occurrence of different types of clouds, cloud properties, and their radiative effect are analyzed and related to the anomalous periods of IWV and atmospheric temperature. Finally, the discussion of the results and the summary are given in Sect. 5.
This study is based on thermodynamic and cloud measurements from a set of passive and active remote sensors continuously running at the AWIPEV observatory, operated by the Alfred Wegener Institute Helmholtz Centre for Polar and Marine Research (AWI) and the French Polar Institute Paul-Émile Victor (PEV). Within the Transregional Collaborative Research Center TRR 172 (AC)3 on Arctic Amplification, the instrumentation at the AWIPEV was complemented by a Doppler cloud radar in June 2016. The analyzed period ranges from June 2016 to October 2018, when continuous cloud radar observations were available at the AWIPEV observatory. In addition to ground-based observations, we also used a number of observation and modeling products characterizing clouds, air transportation, and radiation budget. Most of instrumentation and products are the same as in Nomokonova et al. (2019a) and, therefore, only briefly described in the following section.
2.1 Microwave radiometer observations
The humidity and temperature profiler (HATPRO; Rose et al., 2005) has been operated at the AWIPEV station since 2011. HATPRO is a 14-channel microwave radiometer that measures brightness temperatures (TBs) at K-band (22.24–31.40 GHz) and at V-band (51.26–58 GHz) frequencies with a temporal resolution of 1–2 s. The TBs measured at K-band are used for retrievals of the integrated water vapor (IWV), liquid water path (LWP), and humidity profiling. The V-band channels are located along the oxygen absorption complex at 60 GHz and are used for vertical temperature profiling. For this study we used temperature profiles, IWV, and LWP retrieved as described in Löhnert and Crewell (2003). The retrievals were recently adapted for an operation at Ny-Ålesund (Nomokonova et al., 2019a). HATPRO measures continuously but cannot provide reliable information during rain conditions when the radome of the instrument is wet. In these cases, data are flagged and excluded from the analysis.
2.2 Ceilometer
Since 2011 a Vaisala ceilometer CL51 has been operated at the AWIPEV observatory (Maturilli and Ebell, 2018). The ceilometer emits pulses at 905 nm wavelength and measures atmospheric backscatter with a temporal resolution of about 10 s and a vertical resolution of 10 m. The maximum profiling range is 15 km.
The ceilometer is sensitive to the surface area of the scatterers and is thus strongly affected by high concentrations of particles like cloud droplets and aerosols (Hogan et al., 2006). On the one hand, it is thus well suited to detect liquid layers and cloud base heights. On the other hand, the near-infrared signal is significantly attenuated by liquid layers. Therefore, the ceilometer often cannot detect cloud particles above the lowest liquid layer when optical depth exceeds a value of around 3. Therefore, for this study we used a cloud base height which is the lowest altitude of cloud boundary detected by ceilometer.
2.3 Cloudnet products
The Cloudnet algorithm suite (Illingworth et al., 2007) running at Ny-Ålesund combines observations from a Doppler cloud radar, Vaisala ceilometer CL51 (Maturilli and Ebell, 2018), HATPRO, and thermodynamic profiles from a numerical weather prediction (NWP) model.
In this study we used the target categorization, which is a standard product of Cloudnet. This product has a temporal and vertical resolution of 30 s and 20 m, respectively. The Cloudnet categorization was used for the cloud classification as described in Nomokonova et al. (2019a). In addition, based on the target categorization for cloud regions with ice particles we calculated the ice water content (IWC) based on radar reflectivity factor Z and environment temperature according to Hogan et al. (2006). More detailed descriptions of the used Cloudnet products and their uncertainties are given in Nomokonova et al. (2019a).
2.4 Radiosonde observations
Radiosondes at the AWIPEV station have been launched at least once per day since 1993 (Maturilli and Kayser, 2017a). Since June 2006 the radiosonde data have been routinely processed by a GRUAN version 2 data processing algorithm (Sommer et al., 2012; Maturilli and Kayser, 2017a). More details on the radiosonde dataset can be found in Maturilli and Kayser (2016, 2017b). In the present study the radiosonde data for the period from 1993 to 2018 were used to analyze the long-term changes in IWV. Values of IWV retrieved from a microwave radiometer (MWR) were compared with ones derived from radiosondes for the period from 2011 to 2017 when both observations were available. The IWV from MWR was averaged over 15 min intervals after radiosonde launch. The results of the comparison are shown in the Supplement (Fig. S1) and are in good agreement with the root mean squared difference of 0.56 kg m−2.
2.5 Surface cloud radiative effect
The surface cloud radiative effect (denoted as CRE throughout the study), which was analyzed for the different humidity conditions, was derived from the broadband radiative transfer calculations by Ebell et al. (2020) with the Rapid Radiative Transfer Model for General Circulation Models (RRTMG) (Mlawer et al., 1997; Barker et al., 2003) for the analyzed period at Ny-Ålesund. The model provides vertically resolved shortwave (SW) and longwave (LW) upward and downward fluxes and heating rates. In this study CRE is calculated as follows:
where F↓ and F↑ are downwelling and upwelling all-sky fluxes at the surface, respectively. F↓clr and F↑clr are surface downwelling and upwelling fluxes, which would be the case if the sky were cloud free. LW, SW, and net fluxes from the model are used in Eq. (1) for the calculation of LW, SW, and net CRE, respectively. Ebell et al. (2020) estimated the uncertainties in CRE using 10 min averaged fluxes observed by the baseline surface radiation network (BSRN). The uncertainties in CRE depend on averaging time. For time periods ranging from days to months, which are analyzed in this study, the uncertainties are estimated to be smaller than 6.4, 2.0, and 6.7 W m−2 for SW, LW, and net CRE, respectively.
2.6 Back trajectories FLEXTRA
In order to analyze which patterns in air transportation are related to episodes of warm and/or cold and moist and/or dry conditions at Ny-Ålesund, we used the output of the three-dimensional FLEXTRA trajectory model version 3.0 (Stohl et al., 1995; Stohl and Seibert, 1998; Stohl, 1998). The calculations of the trajectories are based on operational analysis data from an NWP model by the European Centre for Medium-Range Weather Forecasts (ECMWF), with the initialized analyses every 6 h (at 00:00, 06:00, 12:00, and 18:00 UTC) and a horizontal resolution of 1.125∘. The temporal resolution of the back trajectories is 3 h. We used FLEXTRA files (see https://projects.nilu.no//ccc/trajectories/, last access: 29 April 2020, for detailed information) generated for the Zeppelin Station (78.9∘ N 11.88∘ E), with an arrival height of 1500 m and going back 6 d. Since Ny-Ålesund is surrounded by up to 1000 m high mountains, the arrival height of 1500 m altitude was chosen in order to avoid orographic effects in the large-scale air transport.
In this study we analyze 6 h periods with distinct values of temperature and IWV. In order to decide whether a period is associated with a particularly high (low) value of water vapor and temperature, we use a dataset of 6-hourly mean values of IWV and temperature at 1450 m from HATPRO for the period from 2011 to 2018 (this period is used as reference throughout the study). The 1450 m HATPRO range bin was chosen to account for the large-scale transport rather than local effects which are related to the orography around Ny-Ålesund (Maturilli and Kayser, 2017a). This altitude is also the closest to the arrival height of the FLEXTRA back trajectories. Since the atmospheric conditions vary throughout a year, we calculated the 10th and 90th percentiles of the temperature and IWV for each month using the reference dataset (Fig. 1). The percentiles of IWV and 1450 m temperature are used as thresholds for the event classification. If a 6 h period has a mean IWV value below the 10th or above the 90th percentile, it is considered as dry (“−IWV”) or moist (“+IWV”), respectively. Otherwise it is assumed that the value of water vapor for this period is normal (“IWV”). Similarly, the 1450 m temperature periods “−T” and “+T” were defined. As many studies consider water vapor as a driver of changes in radiative properties of the Arctic atmosphere, we use IWV as an indicator of anomalous periods. A normal period is denoted as “IWV” and an anomalous period is one with “−IWV” (dry anomaly) or “+IWV” (moist anomaly), regardless of which temperature class the period has.

Figure 1Monthly percentiles of 6-hourly (a) mean temperature at 1450 m and (b) IWV from microwave radiometer at Ny-Ålesund from 2011 to 2018 are used as criteria for the determination of periods of decreased (below 10th percentile, blue line) and increased (above 90th percentile, yellow line) T and IWV. Red line corresponds to the 50th percentile.
4.1 Consistency check of the defined anomaly periods with existing studies
A number of studies have shown that positive and negative anomalies in IWV often result from horizontal transport of air masses from mid-latitudes and Arctic latitudes, respectively (Maturilli and Kayser, 2017a; Dahlke and Maturilli, 2017; Mewes and Jacobi, 2019; Wu, 2017). Therefore, in order to evaluate the definition of anomalous conditions at Ny-Ålesund given in Sect. 3, paths of air masses were analyzed. We identified all 6-hourly periods with an anomaly class from June 2016 to October 2018. For each 6-hourly period we found a FLEXTRA back trajectory with time when it reaches Ny-Ålesund corresponding to the beginning of the 6-hourly period. Figure 2 shows 6 d trajectories with the end point in Ny-Ålesund for “−IWV” and “+IWV” anomalies in different seasons. As expected, the occurrence of moist anomalies (“+IWV”, red lines in Fig. 2) is associated with the air transport from the south, while the dry anomalies (“−IWV”, blue lines in Fig. 2) are related to the air coming from the north. There is a slight difference between the seasons. In winter (December, January, and February) and spring (March, April, and May), dry air typically comes from north of Russia over the North Pole region and northern Greenland. In summer (June, July, and August), dry anomalies are associated with air coming from the northern part of Canada and Greenland. In autumn (September, October, and November) during dry anomalies air masses come from the areas north of Greenland and Russia. Wet anomalies are mostly driven by the air advected from the North Atlantic. In autumn and summer, a large part of moist events originates from the Scandinavian region and Barents Sea. The transport pathways for “−T −IWV” and “+T +IWV” events (not shown) are generally similar to those of “−IWV” and “+IWV”, respectively, which is in agreement with the results found by Mewes and Jacobi (2019), who showed that the air transport from the North Atlantic sector is typically associated with a positive temperature anomaly, while the transport from Siberia and the North Pacific is connected to a negative temperature anomaly in the Arctic.

Figure 2Backward trajectories (6 d) for the periods of +IWV and −IWV anomalies arriving at Ny-Ålesund at ∼1500 m from June 2016 to October 2018. The black star shows the location of Ny-Ålesund. Numbers in brackets show the number of back trajectories available for the corresponding anomaly class. Note that the numbers might be different from those provided in Table 1 due to the lower availability of the back trajectories pathways.
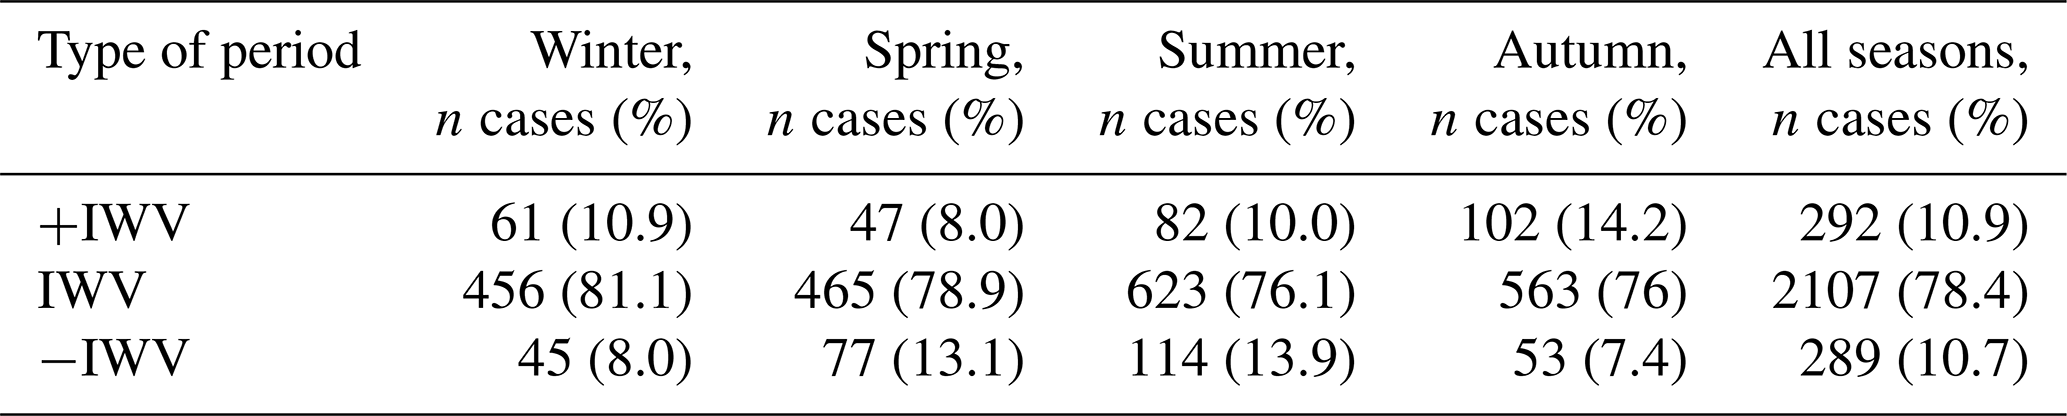
Table 1 summarizes the occurrence of different types of periods for the analyzed period from June 2016 to October 2018. The occurrence of moist anomalies in winter and summer for the analyzed period is nearly the same as for the reference period, when, according to our definition, the occurrence of moist and dry anomalies was 10 %. In spring and autumn the occurrence is 8 % and 14.2 %, respectively. The increase in occurrence of moist anomalies during the polar night season of 2016–2017 was recently reported by Hegyi and Taylor (2018). The authors analyzed the whole Arctic region and related the increase to more frequent moisture intrusions from the Atlantic and Pacific regions. Our results show that the occurrence of dry anomalies is about 8 % for winter and autumn. In spring and summer, dry anomalies were observed about 13 % of the time. Periods with the “+T +IWV” anomaly take a major part (about 67 %) of all moist anomalous cases (not shown). In contrast, occurrence of “−T −IWV” periods is only about 35 % of all dry anomalies in all seasons except winter, when the occurrence is almost 90 % (not shown). Thus, the dry anomalies are not regularly accompanied by a negative anomaly in temperature, while the opposite is valid for moist anomalies. Since the number of cases for temperature anomalies (“+T +IWV” and “−T −IWV”) is relatively low, these types of anomalies were not considered for the further analysis.
Table 1Number of 6-hourly periods with increased (“+IWV”) and decreased (“−IWV”) IWV for the whole period of cloud observations from 2016 to 2018 and for different seasons. “IWV” corresponds to periods with normal IWV values, regardless which T class the period has. The percentage (%) values are with respect to all 6-hourly periods included in the study. See text for more details.
4.2 Cloud occurrence and phase
In this section we show how the anomalous conditions are related to cloud occurrence. Figure 3 shows the frequency of occurrence (FOC) of different cloud types during anomalous and normal conditions. Clouds are present in 70 %–80 % of cases with normal values of IWV. Among them about a half are multilayer clouds (MC).
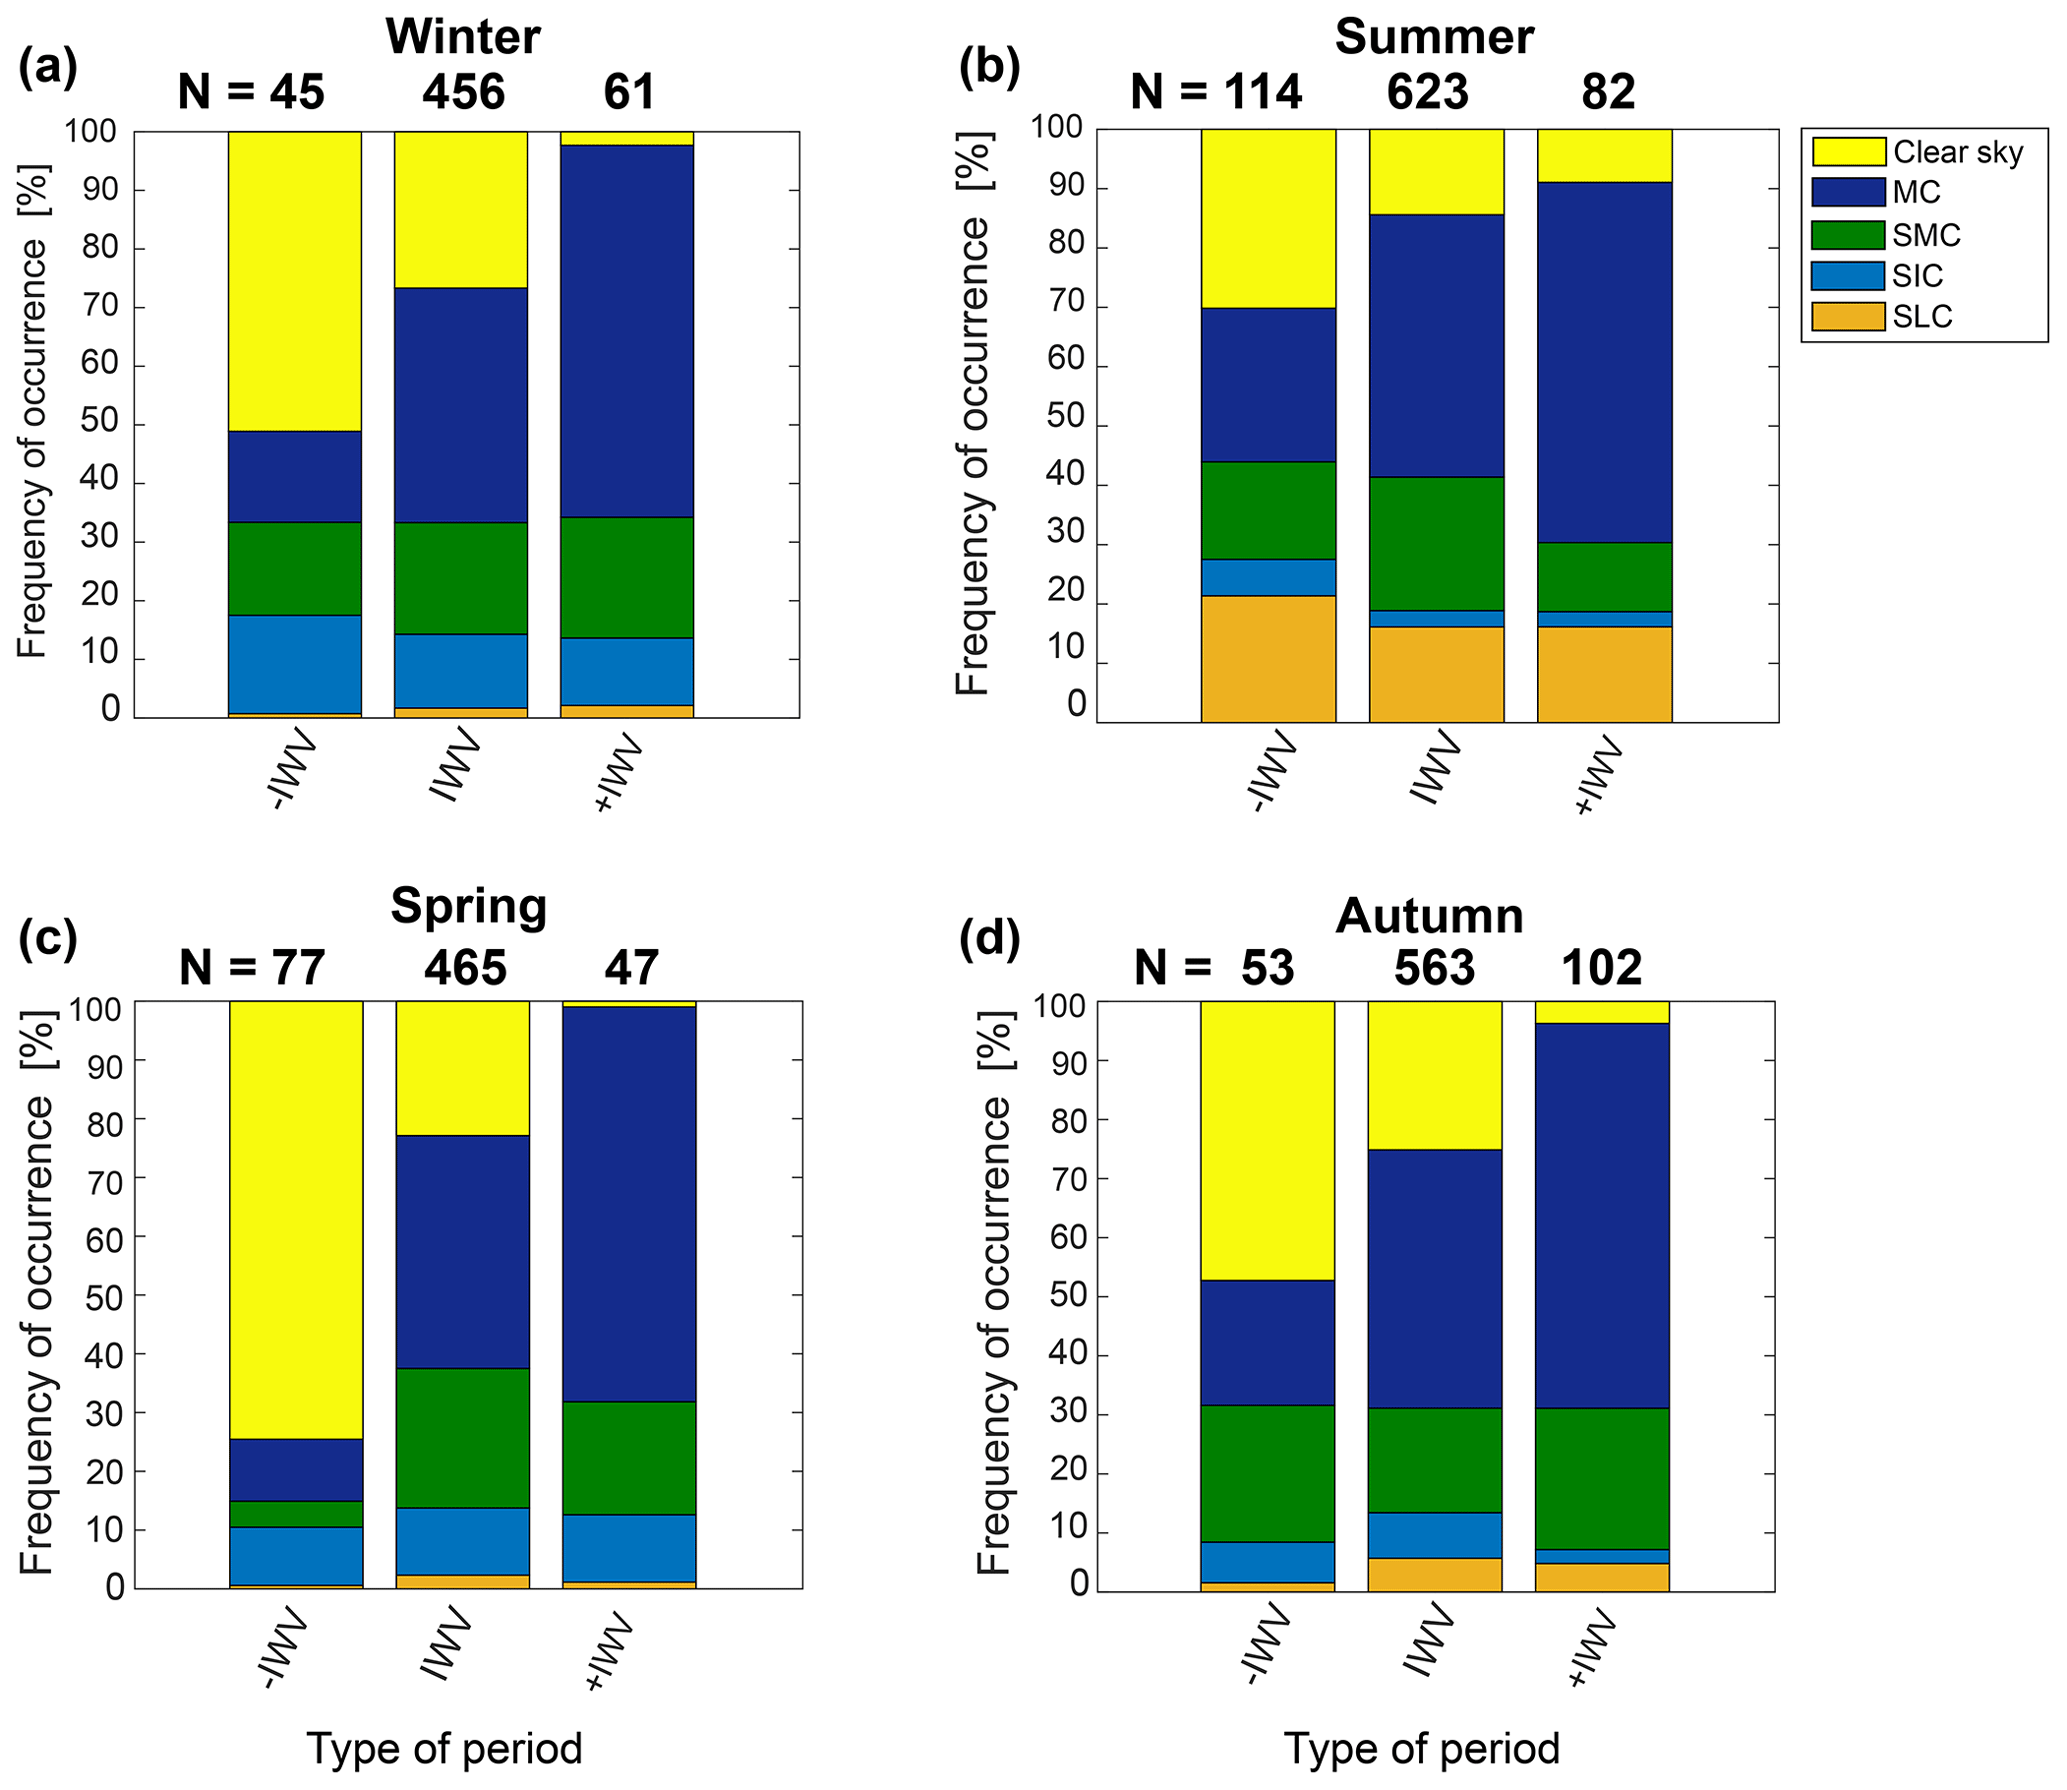
Figure 3Frequency of occurrence of different cloud types for different anomaly periods for winter (a), summer (b), spring (c), and autumn (d). The frequency is normalized to the total number of cases of each anomaly type period. Numbers at the top of bars for each anomaly type show the number of periods included in the corresponding anomaly type based on a 6-hourly mean IWV and 1450 m temperature. MC denotes multilayer clouds; SMC, SIC, and SLC stand for single-layer mixed phase, ice, and liquid clouds, respectively.
In dry anomalous events, the FOC of clouds ranges from 26 % in spring to 70 % in summer. The decrease in the FOC of clouds is mostly caused by less frequent MC, whose occurrence in “−IWV” conditions drops by a factor of 2 to 4. Higher availability of water vapor (“+IWV”) leads to an increase in FOC of clouds up to 90 %–99 %. The increase is mostly caused by changes in MC, while the FOC of single-layer clouds (SC) is not much affected.
Since the phase composition of clouds affects SW and LW radiative properties of clouds (Ebell et al., 2020), we also analyzed the occurrence of different types of hydrometeors in the atmospheric column (Fig. 4). In general, profiles with liquid phase (sum of green and orange columns in Fig. 4) occur more often during moist periods and less often during dry periods. The FOC of liquid-containing profiles during “+IWV” and “−IWV” was characterized by the change of more than +30 % and −30 % relative to normal conditions. In summer the increase in FOC of liquid-containing profiles between moist and normal periods is less pronounced (8 %). The increase in FOC of clouds in “+IWV” events was mostly related to higher occurrence of MC.
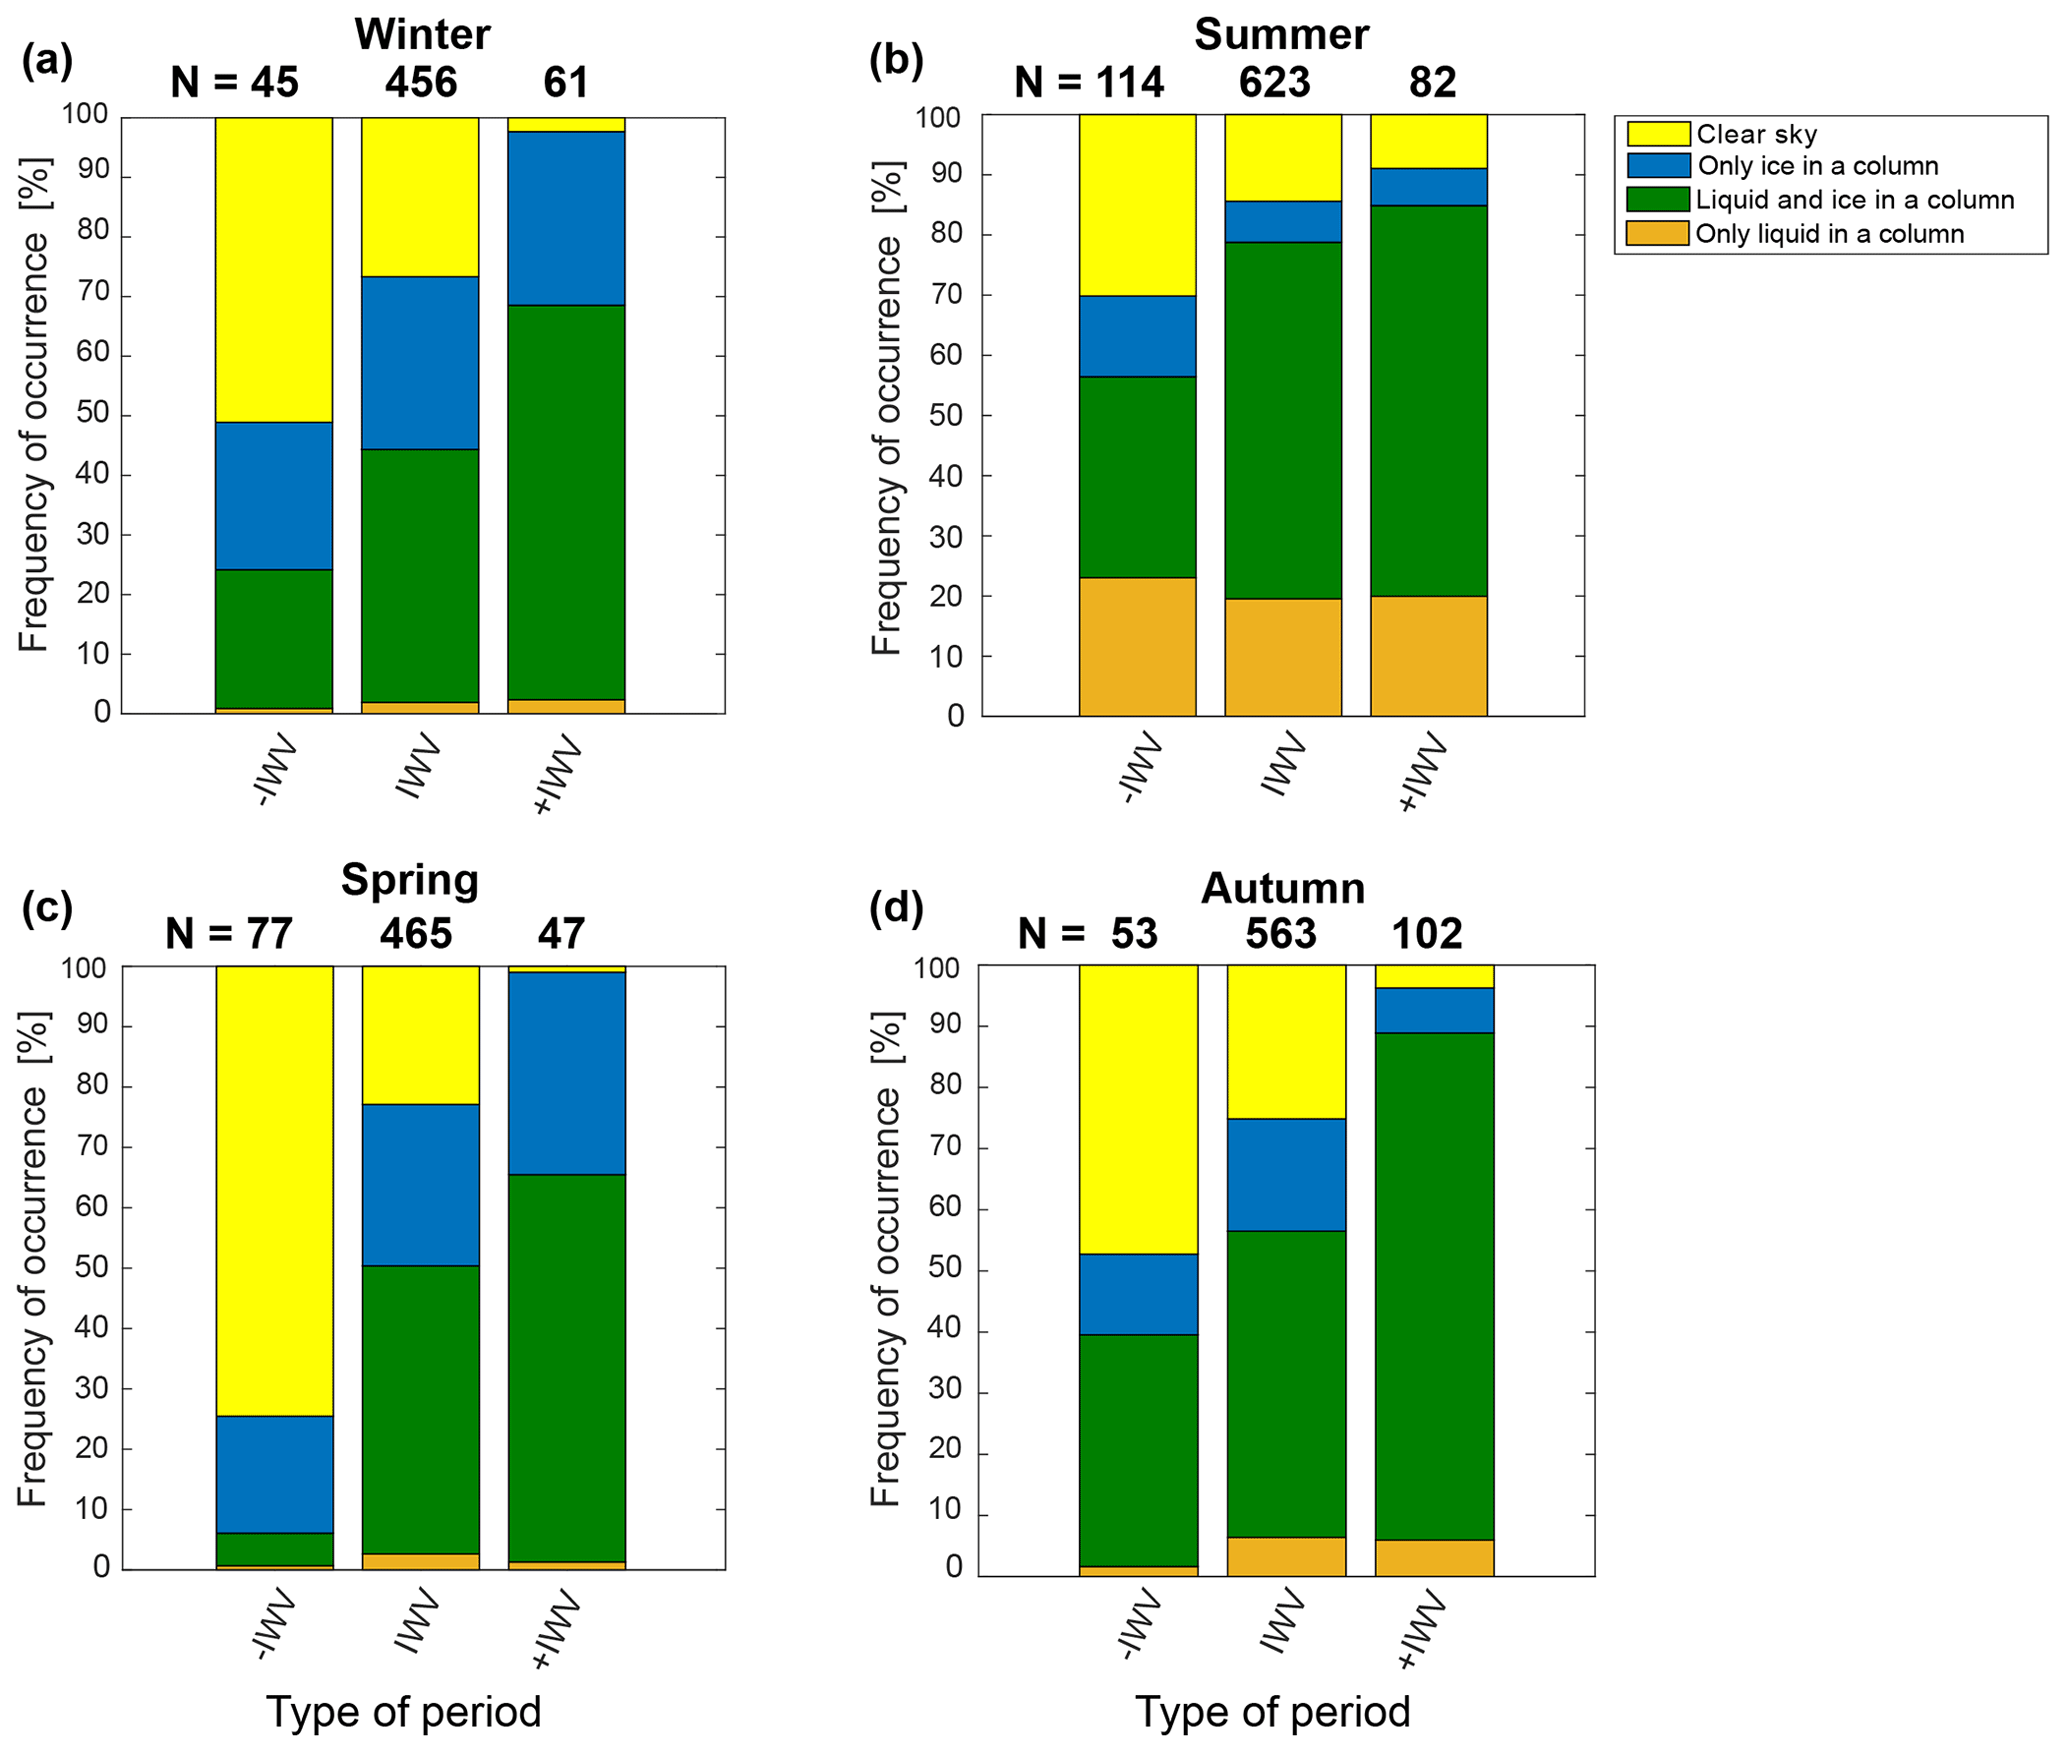
Figure 4Frequency of occurrence of different types of hydrometeors during different anomaly periods for winter (a), summer (b), spring (c), and autumn (d). Numbers at the top of bars for each anomaly type show the number of periods included in the corresponding anomaly type based on a 6-hourly mean IWV and 1450 m temperature.
Ice-containing profiles (sum of blue and green columns in Fig. 4) occur more often under “+IWV” conditions and less during “−IWV”. The change in ice-containing profiles is mostly defined by the change in profiles with both liquid and ice (green columns in Fig. 4), since the FOC of the pure ice phase (blue columns in Fig. 4) varies only slightly with changes in IWV. Profiles with both liquid and ice phases (green columns in Fig. 4) have the median cloud top height and temperature of 1.6 km and −15 ∘C (not shown), respectively. In the case of pure ice profiles (blue columns in Fig. 4) the cloud top height and temperature are 3 km and −31 ∘C, respectively. Thus, ice-containing clouds occurring at higher altitudes are apparently less affected by IWV anomalies. Gallagher et al. (2018), who investigated the influence of atmospheric circulations on cloud composition in Greenland, similarly showed that moist (dry) conditions lead to an increase (decrease) in the occurrence of mixed-phase clouds, which are the dominant type of liquid-containing clouds in the Arctic (Shupe et al., 2006). Gallagher et al. (2018) also noted that ice clouds are not constrained by circulation types to the same degree as mixed-phase clouds.
4.3 Liquid and ice water path
Moist and dry anomalies influence not only the cloud occurrence and composition but also water content. We therefore link LWP and IWP to the different types of anomalies (Fig. 5). Note that LWP and IWP were only calculated for liquid-containing and ice-containing profiles, respectively. Clear sky cases were not included in the statistics of LWP and IWP.
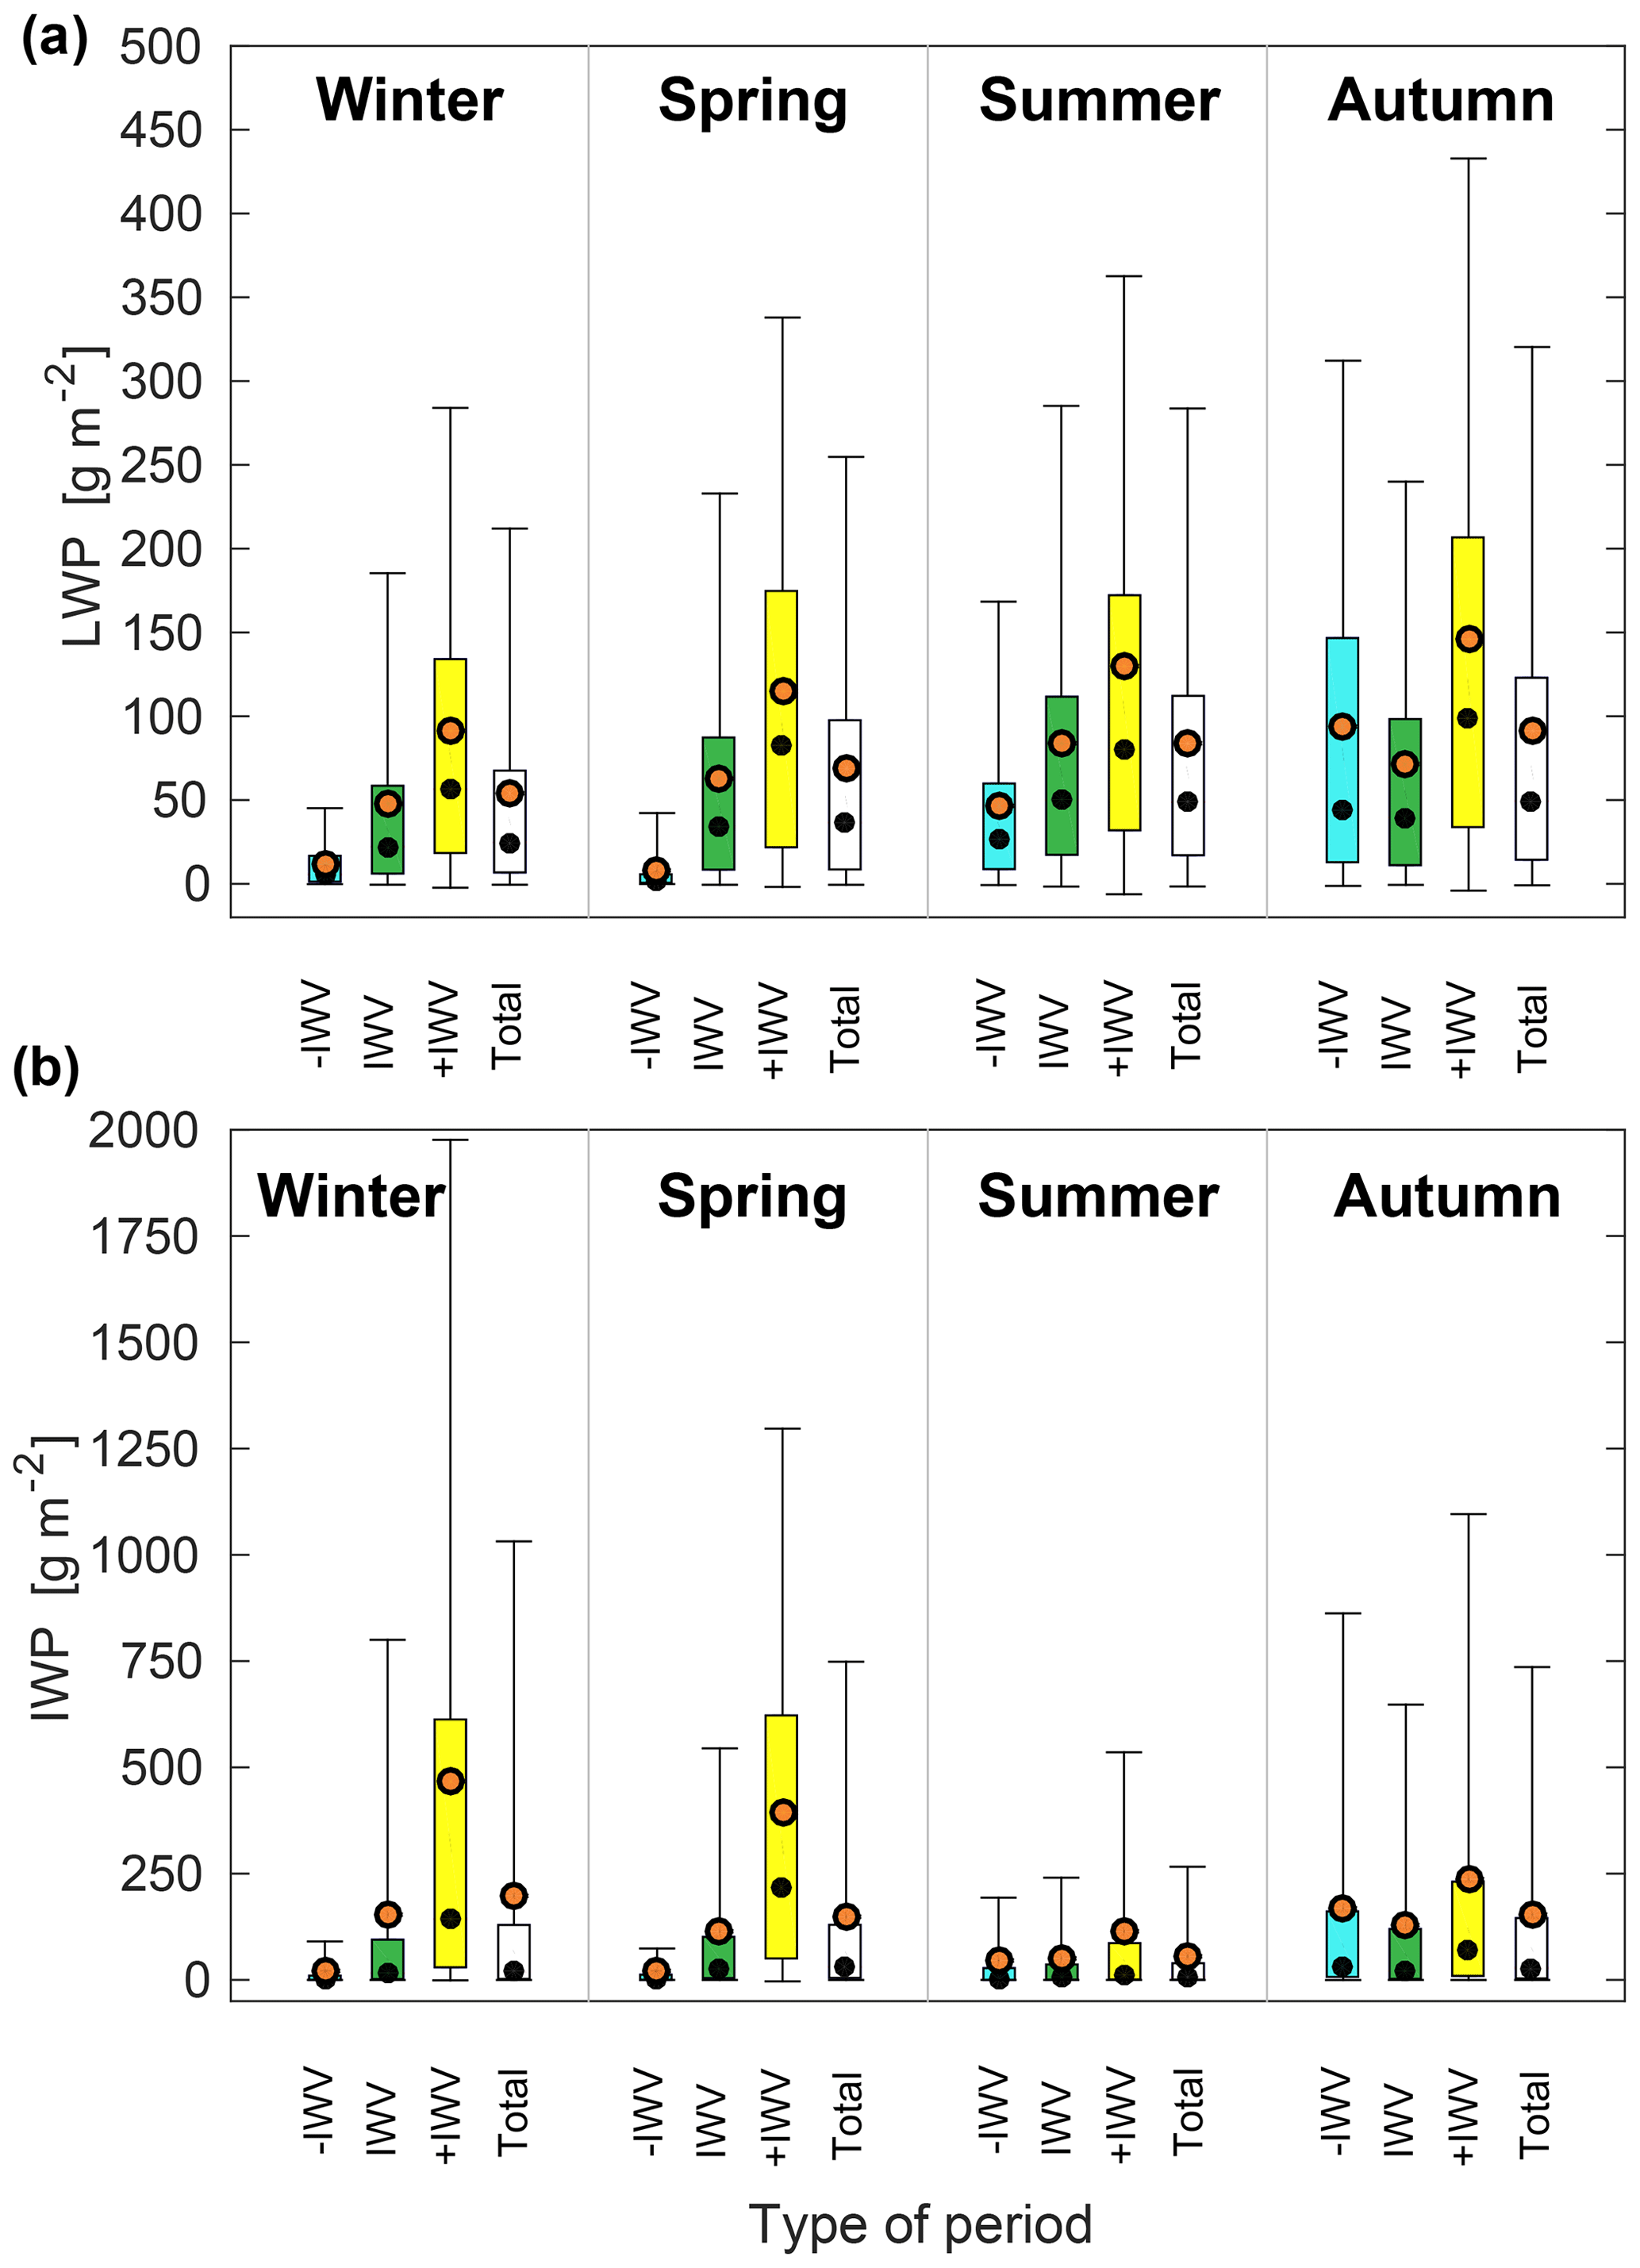
Figure 5LWP (a) and IWP (b) for different anomaly periods and different seasons. Boxes indicate the 25th and 75th percentiles. Upper and lower whiskers show the 95th and 5th percentiles. The white boxes include all cases within a season. Mean (median) values are shown by the orange in black (black) circle marker.
Following the changes in the occurrence of liquid-containing and ice-containing clouds, LWP and IWP increase under moist conditions and decrease under dry conditions. The “+IWV” anomalies cause an increase in mean LWP by a factor of 1.5–2.0 relative to normal conditions and also increase the variability in LWP. During dry anomalies, mean LWP is significantly lower and does not exceed 12 g m−2 in winter and spring. In summer and autumn during dry conditions mean LWP is not higher than 94 g m−2. Gallagher et al. (2018) recently showed that atmospheric circulation types associated with enhanced water vapor in Greenland often led to increased LWP. The authors also showed that the opposite is valid for dry conditions, when decreased values of LWP are more likely.
Moist anomalies correspond to an increase in mean IWP by a factor of 3 relative to normal conditions in winter and spring, and by a factor of 2 in summer and autumn. In winter and spring, dry conditions decrease mean IWP by an order of magnitude, which may be related to a strong reduction in the occurrence of ice-containing clouds and less efficient ice particle growth during “−IWV” events. In contrast, during summer and autumn, mean IWP is reduced by a factor of 1.3.
Thus, the results reveal a strong impact of the anomalous periods on LWP and IWP, particularly in winter and spring. Even though mean IWP values during normal conditions are nearly the same in winter and autumn, relative changes in IWP caused by dry and moist anomalies differ drastically between the two seasons. In winter, wet and dry conditions lead to a 3-fold increase and 10-fold decrease, respectively. In autumn the increase in mean IWP is about factor of 2 during wet conditions, and during dry conditions the mean IWP does not decrease. Since the anomaly type cannot fully explain this effect, it is probably also related to other factors such as differences in aerosol load, the impact of local effects due to the surrounding orography, and an influence of the ocean. For instance, the seasonal change in the aerosol type affects the activation ability of cloud condensation nuclei (CCN) and ice nuclei (IN) efficiency in the Svalbard region, which in turn influences the cloud formation. In addition, the reduction in sea ice around the Svalbard archipelago and on the fjords may lead to more evaporation and therefore affect cloud conditions. Since Ny-Ålesund is surrounded by mountains up to 800 m, the air flow is influenced by the local orography in the lowest 1 km altitudes (Maturilli and Kayser, 2017a) and, thus, might have an impact on cloud formation and on cloud properties. Note that the influence of local effects and aerosols is not analyzed within this study.
4.4 Surface cloud radiative effect
In the previous sections, we showed that water vapor anomalies affect cloudiness and the amount of liquid and ice in a column which will also influence the CRE at the surface at Ny-Ålesund. Figure 6 summarizes the surface SW, LW, and net CRE for different anomaly periods. Values of LW CRE at Ny-Ålesund from June 2016 to October 2018 are in the range from 0 to 85 W m−2 and agree with the cloud occurrence and amount of liquid in a column (Ebell et al., 2020). The large variability of LW CRE distributions (Fig. 6a) is explained by their bimodality (Shupe and Intrieri, 2004) as follows: clear sky cases and profiles with ice only are characterized by no or low LW CRE, while for liquid containing clouds LW CRE is typically high with values from 50 to 85 W m−2 (Ebell et al., 2020). The upper limit of LW CRE corresponds to clouds with LWP > 50 g m−2 and/or IWP > 150 g m−2 (Miller et al., 2015; Ebell et al., 2020).
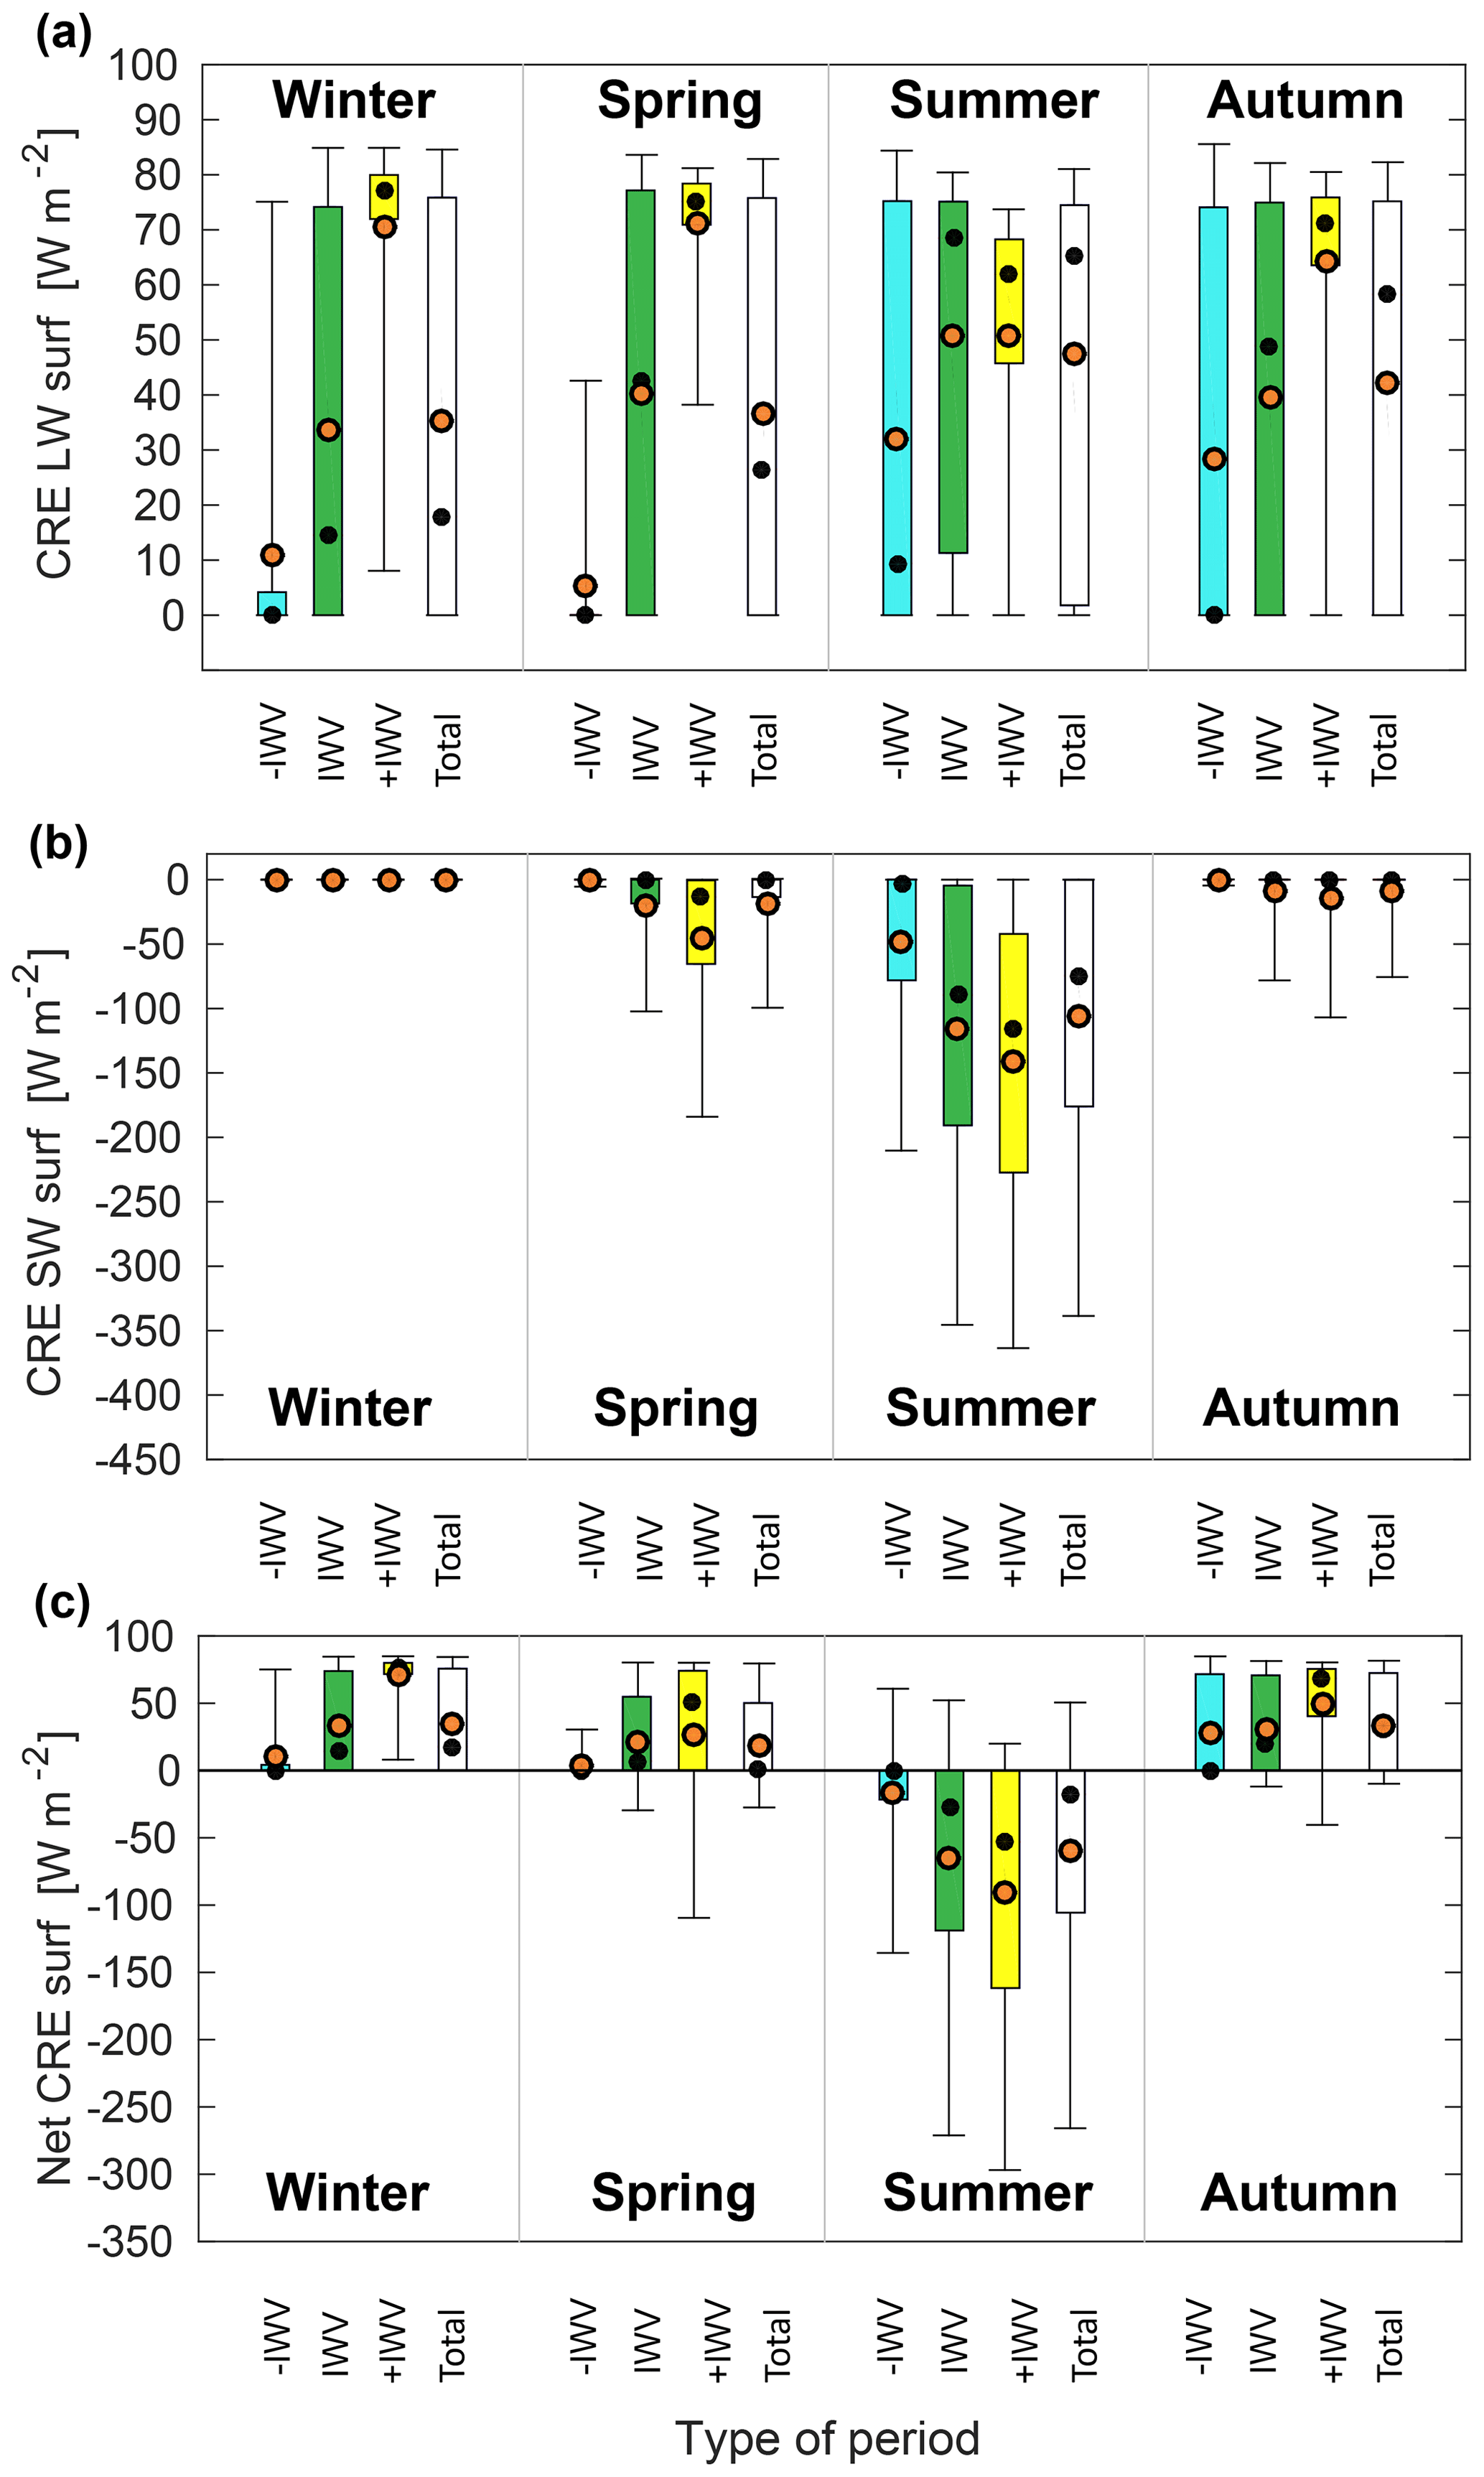
Figure 6LW (a), SW (b), and net cloud radiative effect (c) at the surface for different anomaly periods and different seasons. Boxes indicate the 25th and 75th percentiles. Upper and lower whiskers show the 95th and 5th percentiles. The white boxes include all cases within a season. Mean (median) values are shown by the orange in black (black) circle marker.
During moist anomalies the mean LW CRE increased to 60–70 W m−2 in winter, spring, and autumn. Thus, the mean LW CRE, enhanced under moist anomalies in winter, spring, and autumn, can exceed the typical mean LW CRE in summer (Fig. 6a, white box). This increase in mean LW CRE due to moist anomalies in winter, spring, and autumn is associated with high cloud occurrence, which mostly exceeds 90 % under moist conditions. In addition, “+IWV” cases are typically characterized by high mean LWP and IWP exceeding 90 and 200 g m−2, respectively. In contrast to other seasons, in summer the mean LW CRE during moist anomalies is not higher than under normal conditions due to several factors. First, cloud occurrence does not change much between normal and moist conditions in summer. Second, in summer the clouds often emit LW radiation as black bodies, and therefore an increase in LWP and/or IWP does not essentially affect their LW radiation. Moreover, a similar LW CRE in summer between moist and normal conditions may be caused by the influence of water vapor in the presence of optically thick clouds as was previously described by Cox et al. (2015). The authors analyzed data from radiative transfer simulations and observations obtained at Barrow, Summit, and Eureka. They found that the increase in amount of atmospheric water vapor particularly between a cloud and the surface diminishes the impact of the infrared radiance emitted from the cloud due to more absorption and emission by water vapor itself. They showed that at constant temperature for higher relative humidity LW CRE is typically lower because of less cloud emission passing to the surface through the atmosphere below the clouds. Ebell et al. (2020) identified a similar effect at Ny-Ålesund, where the decrease in LW CRE at the surface for higher IWV corresponds to clouds with LWP exceeding 300 g m−2. In general, relative humidity at Ny-Ålesund is high in summer (Maturilli and Kayser, 2017a; Nomokonova et al., 2019a). Moreover, in “+IWV” cases we would expect even higher values of relative humidity.
Dry anomalies correspond to a reduction of the mean LW CRE to 5–11 W m−2 in winter and spring and to 29–32 W m−2 in summer and autumn. Hence, the dependence of the mean LW CRE on IWV is more pronounced in winter and spring than in autumn and especially in summer. Such behavior, though, is not directly related to changes in IWV itself but rather to coupling of the changes in IWV to cloud properties. As it was previously shown, dry anomalies are associated with reduced cloud occurrence, amount of liquid-containing clouds, LWP, and IWP, while increased values of these parameters are related to moist periods. In summer the cloud properties during dry anomalies do not change as strongly with respect to normal conditions compared to other seasons, which may reflect the smaller corresponding change in LW CRE.
Besides the influence of cloud occurrence and microphysical properties, the LW CRE also depends on the altitude at which clouds occur. Shupe and Intrieri (2004) and Dong et al. (2010) showed that the LW CRE increases with decreasing cloud base height (CBH). Shupe and Intrieri (2004) show that Arctic clouds with bases below (above) 3 km have median LW CRE around 45 (20) W m−2. Figure 7 shows CBH measured by the ceilometer for the analyzed period. Note that due to the instrument limitations (see Sect. 2.2), which are related to the attenuation of the ceilometer signal in optically thick clouds, only the lowest CBH was taken into account. Throughout a year, CBH is mostly below 2 km. During moist and dry anomalies CBH either does not change or decreases slightly, which may cause an increase in LW CRE. However, Yeo et al. (2018), who analyzed the dependence of LW fluxes measured at Ny-Ålesund on CBH, showed that the mean LW CRE of clouds within the lowest 2 km does not differ by more than 10 W m−2. Only dry anomalies in spring and moist anomalies in summer are related to higher CBH. Taking into account low cloud occurrence during dry conditions in spring, the increase in CBH should not change LW CRE much. In summer the increase in CBH during moist conditions could be another factor (in addition to the effect of water vapor described above) preventing an increase in LW CRE.

Figure 7Cloud base height of liquid-containing clouds for different anomaly periods and different seasons. Boxes indicate the 25th and 75th percentiles. Upper and lower whiskers show the 95th and 5th percentiles. The white boxes include all cases within a season. Mean (median) values are shown by the orange in black (black) circle marker.
The SW CRE is only significant when the sun is above the horizon. Thus, the strongest SW CRE can be found in summer. Under normal conditions in summer and spring the mean SW CRE is −115 and −19 W m−2, respectively. An absolute change in CRESW can generally be caused by three main factors, namely cloud properties, solar zenith angle (SZA), and surface albedo (α). Since the FOC of clouds, LWP, and IWP varies only slightly, the 6-fold difference in the mean SW CRE in spring and summer is rather only associated with the changes in surface albedo and SZA.
A number of studies have already shown that the surface albedo can alter the SW CRE at the surface (Shupe and Intrieri, 2004; Miller et al., 2015, 2017; Ebell et al., 2020). Ebell et al. (2020) found that at Ny-Ålesund the surface albedo exceeds 0.8 when the surface is covered by snow and is below 0.15 in bare tundra. For the analyzed period, the change in the mean surface albedo between normal conditions and anomalies does not exceed ±0.05 in spring and ±0.1 in summer and autumn. Shupe and Intrieri (2004) showed that SW CRE is nearly proportional to 1−α. The changes in SW CRE between normal and anomalous conditions caused by the variability in the surface albedo should thus exceed 30 % in spring and 15 % in summer and autumn.
In addition to the surface albedo, the SW CRE at the surface depends on SZA (Minnett, 1999; Miller et al., 2018). Ebell et al. (2020) showed that in Ny-Ålesund the lowest SZA, which corresponds to the highest position of the sun, is in summer with the minimum of 55∘ in June. In spring values of SZA are larger. Shupe and Intrieri (2004) have found that for SZA higher than 70∘ the shortwave cooling effect of clouds decreases due to a rapid decrease in solar insolation. When the sun is high in the sky, the shading effect of the clouds becomes stronger (Shupe and Intrieri, 2004).
There are two ways SZA can influence differences in SW CRE between anomalous and normal cases, namely (1) an anomaly can have a dominant daytime of occurrence, while normal conditions are uniformly distributed over a day, and (2) an anomaly can concentrate in a certain part of a season. In order to check for changes in SW CRE between anomalous and normal cases caused by diurnal cycles of SZA, we checked whether anomalies have a dominant time of occurrence. We found that for the analyzed period normal and anomalous cases were nearly uniformly distributed among 6-hourly periods (Fig. S2, Supplement), and therefore time of a day is neglected in the following analysis. In order to mitigate the remaining effects of SZA due to the sparse distribution of anomalies over seasons we adopt the approach of Sengupta et al. (2003) and calculate the normalized SW CRE at the surface as follows:
where CRESW is the surface SW CRE, and and are downwelling and upwelling SW fluxes at the surface that would be if the sky were cloud free. Since the effects of SZA are mitigated in nCRESW, the variability in mean nCRESW for different anomalies is mainly determined by the cloud properties and the surface albedo.
Table 2 shows that under normal conditions the mean nCRESW is −0.31 and −0.59 in spring and summer, respectively. Dry conditions increase the mean nCRESW to −0.4 and −0.1 in spring and summer, respectively. In moist events the mean nCRESW decreases below −0.6.
Table 2Absolute and relative changes in CRESW, nCRESW, and surface albedo (α) related to dry and moist anomalies. The absolute changes are calculated as a difference between anomalous and normal cases. The relative changes are shown in brackets and are given in percentages with respect to normal conditions. Mean values of CRESW (in W m−2), nCRESW, and α during normal condition are shown in the rightmost column labeled “Normal conditions”.
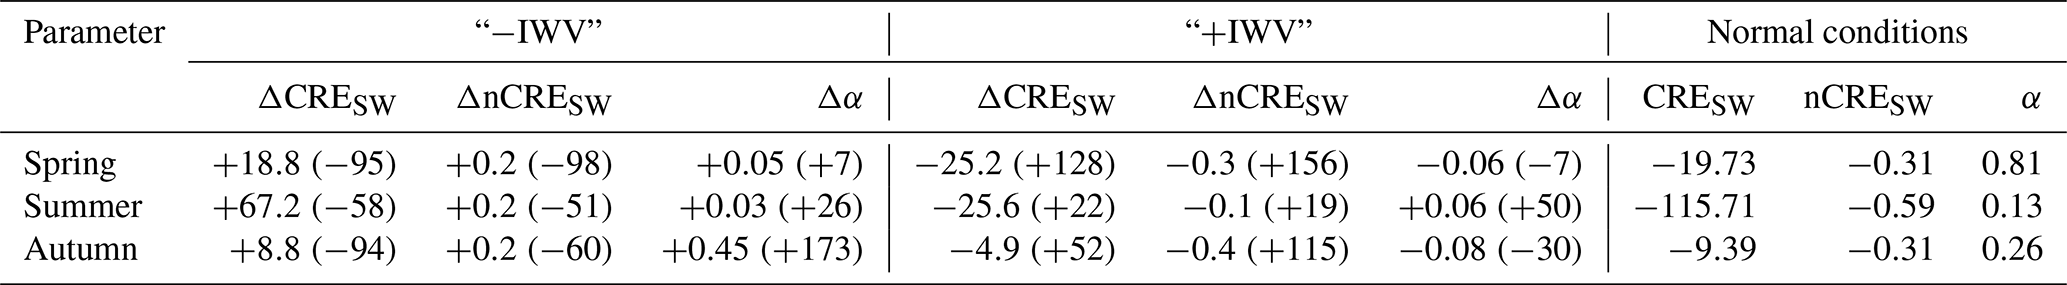
The relative change in CRESW is insusceptible to differences in SZA but only when anomaly cases are uniformly distributed over a season. If anomaly cases are uniformly distributed over a season, we expect no difference in surface albedo between anomaly and normal conditions. Thus, similar relative changes in CRESW, nCRESW, and near-zero change in the surface albedo indicate similar SZA conditions for anomaly and normal cases. In contrast, if anomaly cases are not distributed uniformly over a season, the diversion of changes in CRESW and nCRESW would show that anomaly cases were sparsely distributed over a season.
In Table 2 we summarize changes in CRESW, nCRESW, and the surface albedo related to dry and moist anomalies. The results show that dry cases are related to positive absolute changes in SW CRE, thus pointing to less efficient SW surface cooling by clouds relative to normal conditions. The largest difference of 67.2 W m−2 is in summer, when the clouds can produce the strongest SW shading (Shupe and Intrieri, 2004; Ebell et al., 2020). In spring and summer CRESW and nCRESW change by nearly the same factor, and the absolute change in the surface albedo does not exceed 0.05. Similar relative changes in CRESW, nCRESW and near-zero absolute change in the surface albedo indicate that the difference in the mean SW CRE is mainly caused by changes in cloud properties and not by SZA. In autumn CRESW changed by −94 %, while nCRESW changed by −60 %. The difference in the relative changes indicates that it is caused by differences in SZA because dry autumn cases were not uniformly distributed over the season. The absolute change in the surface albedo was 0.45. Thus, the difference in SW CRE between dry and normal cases in autumn was caused by all three factors, i.e., cloud properties, SZA, and the surface albedo. The direction of the changes in CRESW is consistent with Shupe and Intrieri (2004), who showed that an increase in the surface albedo corresponds to a reduction in the cloud-induced surface SW cooling.
During moist anomalies SW CRE is more negative than for normal conditions. In summer the relative changes in CRESW and nCRESW are similar, and the surface albedo is not altered by more than 0.06. Therefore, we conclude that the change in the mean SW CRE of −25.6 W m−2 is mainly caused by cloud properties. In spring and autumn during moist conditions the absolute change in the surface albedo is also relatively low. Nevertheless, the relative changes in CRESW and nCRESW differ. This indicates that the absolute change in the mean SW CRE is likely caused not only by cloud properties but also by SZA.
Gallagher et al. (2018) showed an effect of moist and dry anomalies on CRE. The authors analyzed the Summit site in Greenland, where typical IWV values are in the order of 1–3 kg m−2 (Pettersen et al., 2018) and thus smaller than at Ny-Ålesund (see Fig. 1). Gallagher et al. (2018) used data from 2011 to 2015. The authors found that the southern transport pattern, associated with increase in IWV by 0.69 kg m−2, leads to a change in LW and SW CRE of +13 and −3 W m−2, respectively, relative to corresponding typical values. Since Gallagher et al. (2018) did not analyze seasons separately, we also averaged our results over the whole analyzed period in order to compare the results. For Ny-Ålesund we found mean differences between “+IWV” and “IWV” for LW and SW CRE of +21.2 and −10.2 W m−2, respectively. In contrast, a northern circulation pattern in Greenland leads to a decrease in IWV by 0.34 kg m−2 and changes LW and SW CRE by −6.1 and 0.1 W m−2 (Gallagher et al., 2018), respectively. Our results for Ny-Ålesund are −21.5 and 21.6 W m−2, respectively. Note that the absolute values may differ because of a more humid environment in Svalbard or differences in cloud properties. Nevertheless, the sign of the LW CRE change is the same. The SW CRE values are difficult to compare due to differences in SZA and surface albedo. For instance, the change in SW CRE at the Summit Station could be closer to 0 due to the high albedo in Greenland throughout a year, while at Ny-Ålesund the surface albedo is less than 0.15 in summer (Ebell et al., 2020).
Figure 6c depicts the net CRE for the anomaly types. As was reported by Curry et al. (1996), due to the absence of sunlight in the Arctic region during the polar night the LW CRE is dominant, and the Arctic clouds warm the surface. Therefore, the mean net CRE in autumn and winter is mostly defined by LW CRE.
In summer and spring, both LW and SW contribute to the mean net CRE resulting in −71.5 and 24.7 W m−2 under normal conditions, respectively. Dry conditions correspond to less positive LW and less negative SW CRE, which lead to the mean net CRE of −19 and 4.3 W m−2 in summer and spring, respectively. During moist periods LW CRE increases relative to normal conditions in spring and does not change much in summer, while SW CRE becomes more negative in both seasons. Thus, the mean net CRE under moist conditions in spring changes to 31.5 and to −101 W m−2 in summer.
4.5 Trends in anomaly occurrence
Since IWV anomalies show a strong impact on cloud properties and their radiative effect, the next question is how the occurrence of dry and moist conditions at Ny-Ålesund has changed in the last decades. The MWR observations at Ny-Ålesund are only available from 2011, and, therefore, cannot be used for such a long-term analysis. Instead, the radiosonde observations were used for the estimation of the occurrence of “−IWV” and “+IWV” events for the time frame from 1993 to 2018. Note that 6 h averaged values of IWV from MWR used for the previous analysis cannot be obtained from radiosondes. Therefore, we estimated the IWV value for each radiosonde profile and classified the profile using the thresholds defined in Sect. 1 based on MWR data. The representativeness and variability of IWV values obtained from MWR for the reference period from 2011 to 2018 was checked with respect to the long-term radiosonde record. The monthly values of IWV derived from radiosondes for the periods from 1993 to 2018 and from 2011 to 2018 were compared with ones derived from MWR HATPRO. The results are in good agreement and summarized in Fig. S3 in the Supplement. The monthly IWV for the longer period (1993–2018) is closer to the one from MWR HATPRO period with a root mean square deviation (RMSD) of the 10th and 90th percentiles of 0.6 and 0.5 kg m−2, respectively. Slightly higher monthly values of IWV from radiosondes were found for the same period as for MWR HATPRO (2011–2018) with RMSD of 0.4 and 1.2 kg m−2 for 10th and 90th percentiles, respectively.
Figure 8 shows the frequency of occurrence of moist and dry anomalies for each season for the time period from 1993 to 2018. According to a two-sided t test, dry and moist anomalies in all seasons show significant trends with a 95 % confidence level except for moist anomalies in spring. Dry anomalies have significant negative trends in all seasons, which are especially pronounced in autumn and winter with values of −10.7 % per decade and −12.9 % per decade respectively. These trends might be associated with changes in atmospheric circulation found by Dahlke and Maturilli (2017) for the Svalbard region. The frequency of the occurrence of dry events in spring and summer also exhibits negative trends but at less strong rates of −6.8 % per decade and −4 % per decade, respectively. The largest positive trends for “+IWV” cases were found for winter and autumn with values of 5.6 % per decade and 6.4 % per decade, respectively. Our results are in line with Mewes and Jacobi (2019), who showed that in winter the occurrence of North Atlantic and North Pacific pathways has increased and decreased, respectively. Air masses originating from the North Atlantic are typically associated with increased surface temperature and IWV in the Svalbard region, whereas those originating from the North Pacific are linked to a decrease in surface temperature and IWV (Dahlke and Maturilli, 2017).
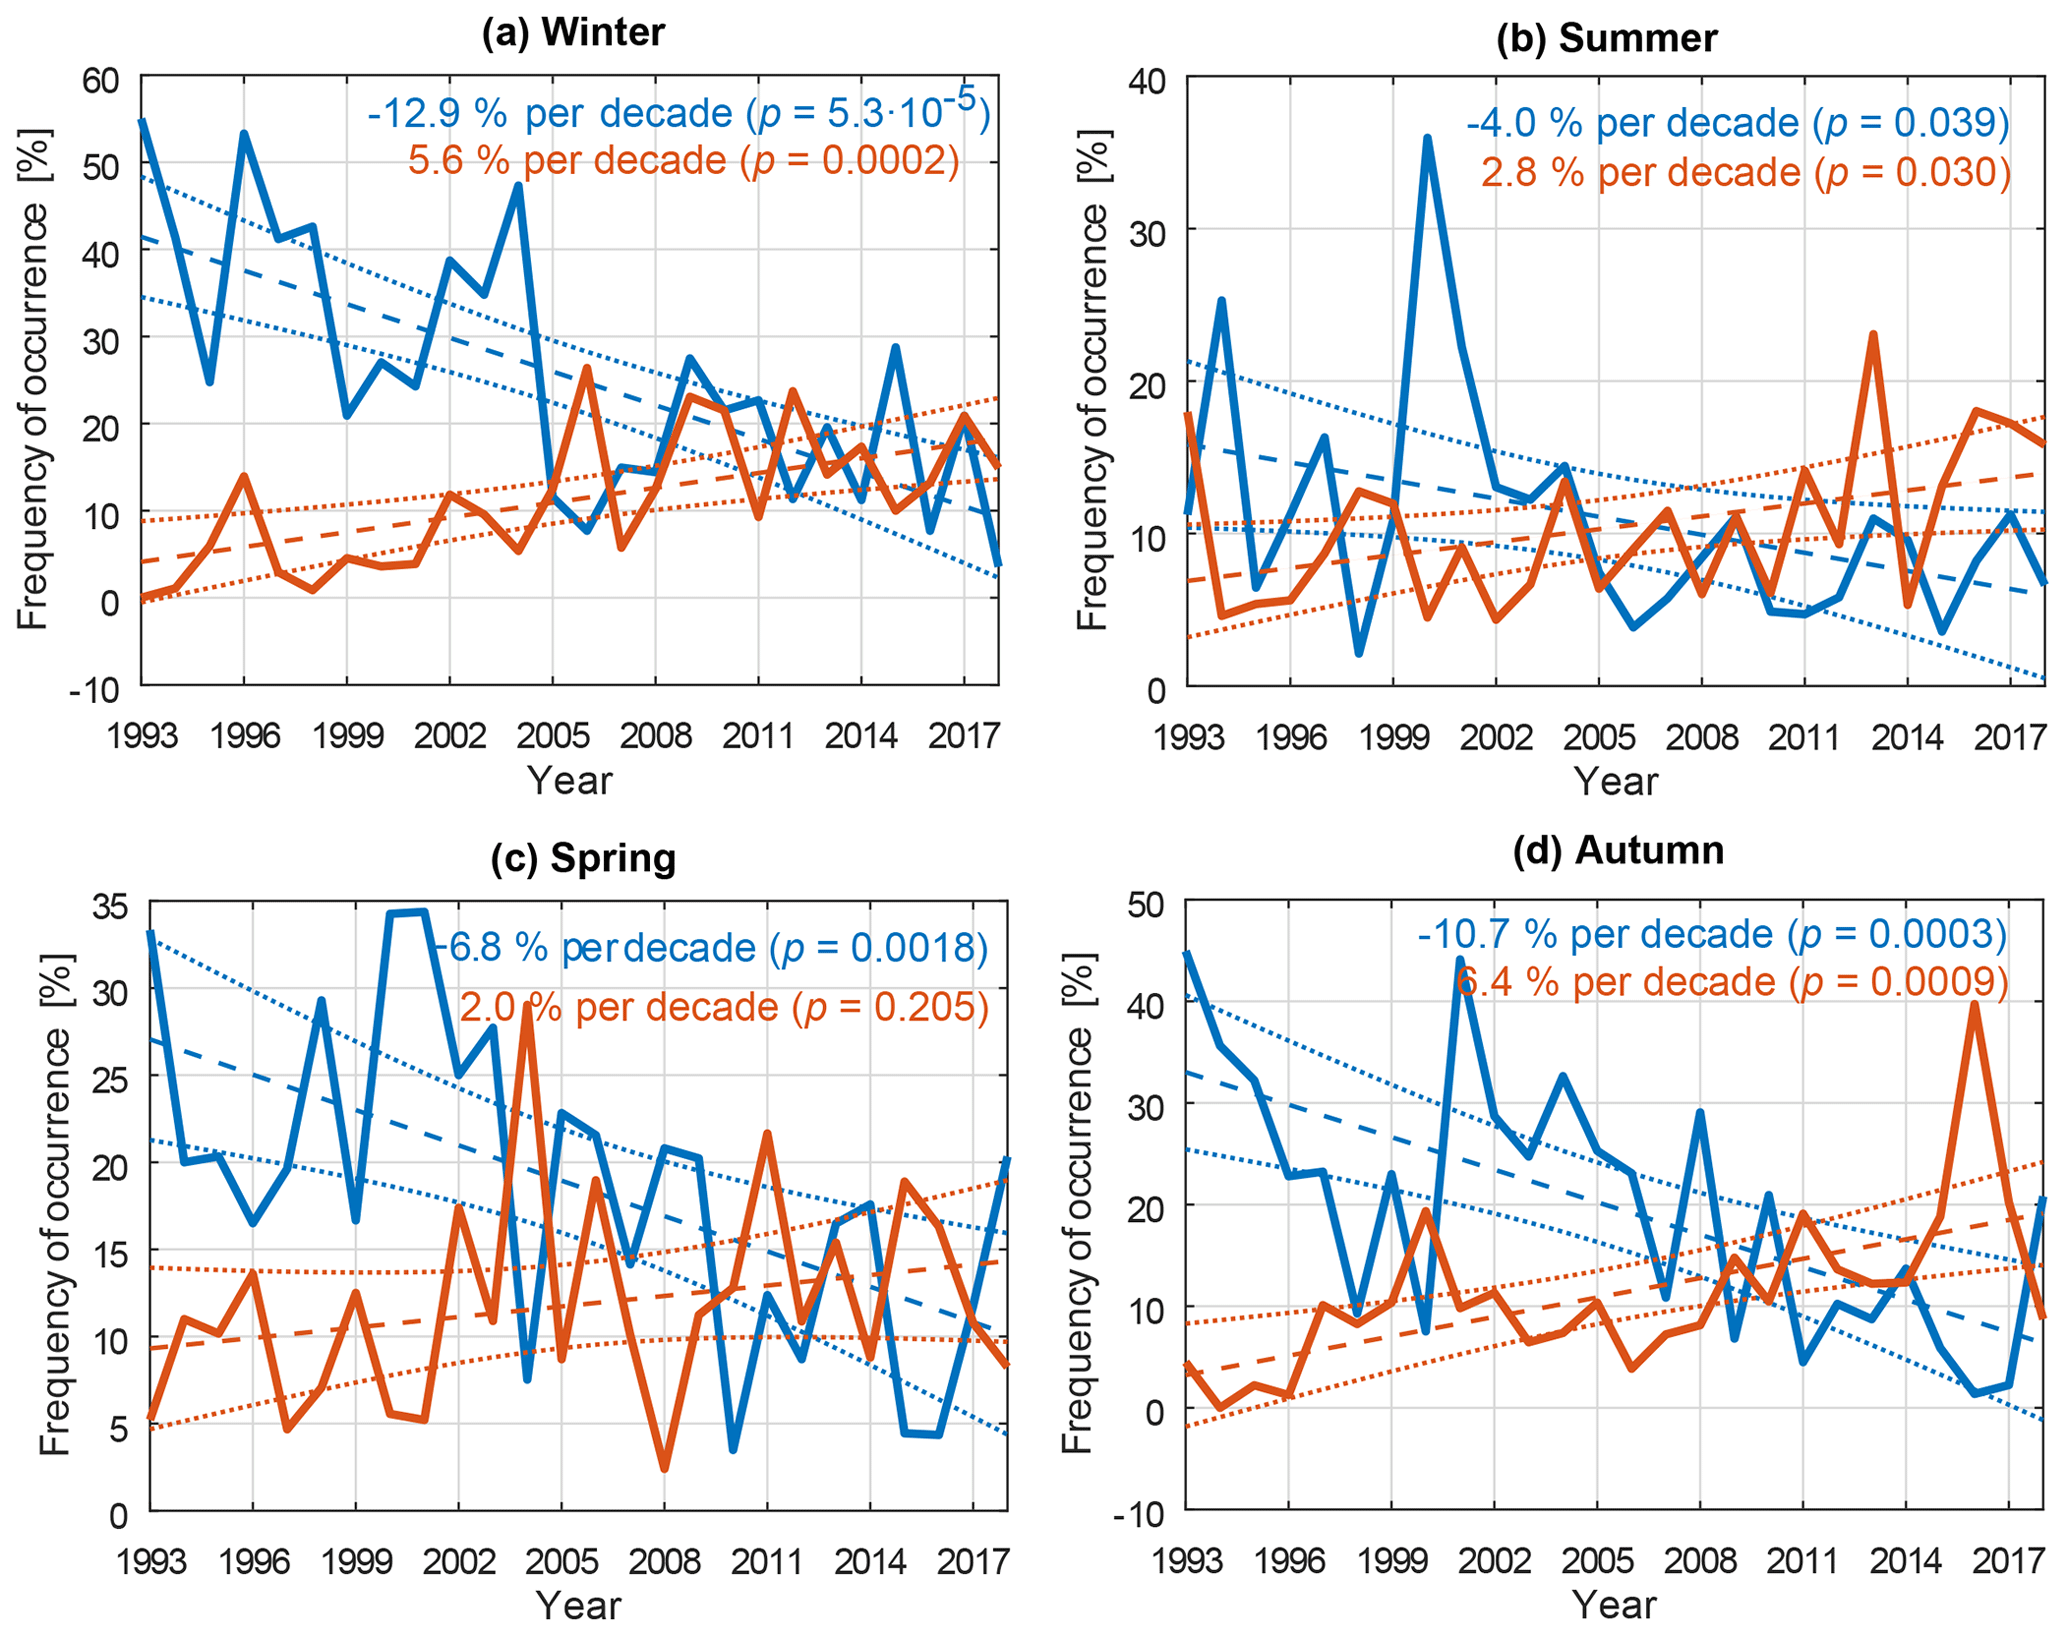
Figure 8Frequency of the occurrence of moist (“+IWV”, red line) and dry (“−IWV”, blue line) events using radiosonde data from 1993 to 2018 for different seasons (winter a, summer b, spring c, and autumn d). The red and blue lines correspond to the frequency of the occurrence of dry and moist events, respectively. The dashed lines show the linear trend. Dotted lines show the 95th confident intervals for the trends derived by the bootstrap resampling method. The significance (p value) of the two-sided t test at 95 % level is shown in brackets.
Another possible contributor to the trends in IWV is a change in moisture fluxes. Boisvert et al. (2015) estimated that the contribution of the moisture flux to IWV is on average about 10 % in the Arctic region. The authors mention that the main driver of the changes in the moisture flux is the sea-ice cover. Therefore, changes in the sea-ice coverage around the archipelago of Svalbard might impact the occurrence of moist and dry events. A reduction of sea-ice coverage leads to more evaporation and allows for an increased moisture transport at the location. Boisvert et al. (2015) compared changes in sea-ice coverage and vertical moisture fluxes over the Arctic Ocean based on the Atmospheric Infrared Sounder (AIRS) for the period from 2003 to 2013. The authors found that areas to the north and east of Svalbard have exhibited a significant increase in moisture fluxes and IWV, which were consistent with the sea-ice decline. In contrast, the area to the west of Svalbard (where Ny-Ålesund is located) has shown a decrease in the moisture flux rate despite the decrease in the sea-ice extent. At the same time the authors found that IWV has increased even though the moisture flux rate has decreased. Therefore, Boisvert et al. (2015) concluded that for this area the increase in IWV might be associated with the air transport from lower latitudes rather than evaporation. Beside the changes of the sea-ice coverage around the Svalbard archipelago a reduction of the local fjord ice cover has an impact on the local climate (Isaksen et al., 2016; Dahlke et al., 2020) and therefore might also lead to a change in occurrence of anomalous atmospheric conditions at Ny-Ålesund.
This study is devoted to the analysis of anomalous atmospheric conditions in terms of IWV at Ny-Ålesund. The main focus is on the impact of anomalous moisture conditions on cloud properties and their CRE. Within this work, anomalies are defined as a deviation of 6 h averaged IWV and/or temperatures below and above 10th and 90th percentile of the corresponding parameter over the reference period from 2011 to 2018. Different anomaly types were related to air flows using back trajectories FLEXTRA and cloud observations from Cloudnet. The output of the Rapid Radiative Transfer Model recently applied by Ebell et al. (2020) to the Ny-Ålesund observations was used to associate the anomaly types to a variation in CRE. The main findings of this work are listed below.
-
Moist events often occur when air masses come from the North Atlantic, which is in agreement with previous studies (Maturilli and Kayser, 2017a; Dahlke and Maturilli, 2017; Wu, 2017; Mewes and Jacobi, 2019). An analysis of the seasonal variability of transport pathways shows that in autumn and summer a large part of moist events originates from the Scandinavian region and Barents Sea. A total of 67 % of moist anomalies at Ny-Ålesund are accompanied by a strong temperature increase.
-
Moist anomalies are associated with more cloud-related surface SW cooling, which is increased by 25 W m−2 compared to normal conditions in spring and summer. In winter, spring, and autumn the mean LW CRE rises from 35–41 W m−2 under normal conditions to 64–71 W m−2 during moist events. The changes in LW and SW CRE are related to a high cloud occurrence of up to 90 %–99 %. In addition, in comparison to normal conditions “+IWV” cases are characterized by an increase in LWP and IWP with a factor of 2–3 and mean values of 90 and 200 g m−2, respectively. In summer, mean LW CRE did not change during “+IWV” periods relative to normal conditions. Moist anomalies in this season are related only to a slight increase in cloudiness. In addition, a large part of clouds in summer is relatively opaque clouds and, therefore, an increase in LWP does not affect LW CRE.
-
Moist conditions increase the mean net CRE at the surface in autumn, winter, and spring by 5–37 W m−2 with respect to normal conditions. This change is mostly defined by cloud radiative properties in LW, which are related to enhanced cloudiness, LWP, and IWP. In summer the net CRE is dominated by the SW CRE and, therefore, moist conditions show stronger cloud-related surface cooling.
-
Long-term radiosonde observations show that moist anomalies become more frequent. The trend varies for different seasons from 2.8 % per decade to 6.4 % per decade being the largest in winter.
-
Dry periods in Ny-Ålesund are mainly related to air masses originating from latitudes north of the Arctic Circle, which is consistent with previous studies (Maturilli and Kayser, 2017a; Dahlke and Maturilli, 2017; Wu, 2017; Mewes and Jacobi, 2019). In winter and spring, dry conditions are associated with a low pressure system over the Barents Sea causing a northerly flow to the Svalbard region. This is in agreement with the results from Mewes and Jacobi (2019), who showed that in winter this northerly air mass transport to the Svalbard region is related to the North Pacific pathway, which causes cold anomalies for the Svalbard region. Our results show that 43 % of dry anomalies at Ny-Ålesund are accompanied by cold anomalies.
-
Dry anomalies are linked to less cloud-related surface SW cooling. In spring and summer during dry anomaly periods, the mean SW CRE is less pronounced. Compared to normal conditions, changes in SW CRE were 19 and 67 W m−2 in spring and summer, respectively. The weaker SW cooling effect by clouds is associated with lower cloudiness and LWP in dry cases. Under dry anomalies, cloud occurrence ranges from 26 % in spring to 70 % in summer, which is on average about 30 % lower than during normal conditions. The decrease is mostly caused by the reduction of multilayer clouds (by a factor of 2 to 4) and particular liquid-containing clouds. However, the difference between mean SW CRE in summer and spring is not only related to changes in clouds but is also caused by the variability of SZA and the surface albedo.
-
The LW warming effect by clouds at the surface is reduced during dry anomalies with respect to normal cases by 25–35 W m−2 in winter and spring, and by 11–19 W m−2 in summer and autumn, respectively. Dry conditions reduce the mean net CRE by 2–37 W m−2 in autumn, winter, and spring. During dry conditions in summer, there is an increase in the mean net CRE by 49 m−2.
-
Long-term radiosonde observations show that the occurrence of dry anomalies declines at rates from −12.9 % per decade to −4 % per decade with the largest trend in winter.
Taking into account the link between anomaly types, cloud properties, and CRE (Figs. 3–6), we conclude that during the last 25 years the changes in the occurrence of dry and moist anomalies at Ny-Ålesund may have led to an increase in cloud occurrence, LWP, and IWP in all seasons. This, in turn, could have enhanced the cloud-related surface warming in autumn, winter, and spring and the cloud-related surface cooling in summer. If the trends of anomaly occurrence continue in the future, we expect that CRE will become more positive in autumn, winter, and spring and more negative in summer.
These results show some aspects of how atmospheric conditions, which often are driven by large-scale air transportation, may influence cloud properties and their radiative effect at Ny-Ålesund. This information is essential to understanding the feedback mechanism in the Arctic climate better. As we indicated in this study, the significant trends in the occurrence of anomalous conditions are expected to lead to changes in cloud properties and their radiative effect. Nevertheless, qualitative estimates of these changes are challenging since a long-term Cloudnet dataset at Ny-Ålesund is currently not available. Therefore, the cloud measurements are planned to be continued within the (AC)3 project.
The radiosonde data were taken from the PANGAEA information system: https://doi.org/10.1594/PANGAEA.845373 (Maturilli and Kayser, 2016), https://doi.org/10.1594/PANGAEA.875196 (Maturilli and Kayser, 2017b), https://doi.org/10.1594/PANGAEA.879767 (Maturilli, 2017a), https://doi.org/10.1594/PANGAEA.879820 (Maturilli, 2017b), https://doi.org/10.1594/PANGAEA.879822 (Maturilli, 2017c), and https://doi.org/10.1594/PANGAEA.879823 (Maturilli, 2017d). The Cloudnet data are available at the Cloudnet website (http://devcloudnet.fmi.fi/, Cloudnet, 2020). The FLEXTRA data are available at the NILU website (https://projects.nilu.no//ccc/trajectories/, FLEXTRA, 2020). The HATPRO MWR data are available in the website of the PANGAEA information system: https://doi.org/10.1594/PANGAEA.902140 (Nomokonova et al., 2019b), https://doi.org/10.1594/PANGAEA.902142 (Nomokonova et al., 2019c), https://doi.org/10.1594/PANGAEA.902143 (Nomokonova et al., 2019d), https://doi.org/10.1594/PANGAEA.902096 (Nomokonova et al., 2019e), https://doi.org/10.1594/PANGAEA.902098 (Nomokonova et al., 2019f), https://doi.org/10.1594/PANGAEA.902099 (Nomokonova et al., 2019g), https://doi.org/10.1594/PANGAEA.902145 (Nomokonova et al., 2019h), https://doi.org/10.1594/PANGAEA.902146 (Nomokonova et al., 2019i), and https://doi.org/10.1594/PANGAEA.902147 (Nomokonova et al., 2019j).
The supplement related to this article is available online at: https://doi.org/10.5194/acp-20-5157-2020-supplement.
TN applied the statistical algorithm, performed the analysis, and prepared and wrote the manuscript. KE, UL, and MM contributed with research supervision, discussions of the results, and the manuscript review. KE applied the RRTMG for Ny-Ålesund to derive vertically resolved SW and LW fluxes. MM provided the long-term radiosonde dataset. CR provided instrumentation data for this study.
The authors declare that they have no conflict of interest.
This article is part of the special issue “Arctic mixed-phase clouds as studied during the ACLOUD/PASCAL campaigns in the framework of (AC)3 (ACP/AMT/ESSD inter-journal SI)”. It is not associated with a conference.
We gratefully acknowledge the funding by the Deutsche Forschungsgemeinschaft (DFG, German Research Foundation) – Project-ID 268020496 – TRR 172, within the Transregional Collaborative Research Center “ArctiC Amplification: Climate Relevant Atmospheric and SurfaCe Processes, and Feedback Mechanisms (AC)3” in subproject E02. We acknowledge the team of the AWIPEV Research Base in Ny-Ålesund for helping us in operating the cloud radar, MWR, ceilometer, and launching radiosondes. We gratefully acknowledge the Aerosols, Clouds, and Trace gases Research InfraStructure (ACTRIS), and particularly Ewan O'Connor for the application of the Cloudnet algorithm to the Ny-Ålesund dataset. NILU is acknowledged for providing the FLEXTRA trajectories (https://www.nilu.no/trajectories, last access: 29 April 2020) used in this study. We thank two reviewers and the coeditor for the constructive suggestions that improved the paper.
This research has been supported by the Deutsche Forschungsgemeinschaft (DFG, German Research Foundation) (project no. 268020496 – TRR 172).
This paper was edited by Timo Vihma and reviewed by two anonymous referees.
Barker, H. W., Stephens, G. L., Partain, P. T., Bergman, J. W., Bonnel, B., Campana, K., Clothiaux, E. E., Clough, S., Cusack, S., Delamere, J., Edwards, J., Evans, K. F., Fouquart, Y., Freidenreich, S., Galin, V., Hou, Y., Kato, S., Li, J., Mlawer, E., Morcrette, J. J., O'Hirok, W., Räisänen, P., Ramaswamy, V., Ritter, B., Rozanov, E., Schlesinger, M., Shibata, K., Sporyshev, P., Sun, Z., Wendisch, M., Wood, N., and Yang, F.: Assessing 1D atmospheric solar radiative transfer models: Interpretation and handling of unresolved clouds, J. Climate, 16, 2676–2699, https://doi.org/10.1175/1520-0442(2003)016<2676:ADASRT>2.0.CO;2, 2003. a
Baustian, K. J., Cziczo, D. J., Wise, M. E., Pratt, K. A., Kulkarni, G., Hallar, A. G., and Tolbert, M. A.: Importance of aerosol composition, mixing state, and morphology for heterogeneous ice nucleation: A combined field and laboratory approach, J. Geophys. Res.-Atmos., 117, D06217, https://doi.org/10.1029/2011JD016784, 2012. a
Boisvert, L. N., Wu, D. L., and Shie, C.-L.: Increasing evaporation amounts seen in the Arctic between 2003 and 2013 from AIRS data, J. Geophys. Res.-Atmos., 120, 6865–6881, https://doi.org/10.1002/2015JD023258, 2015. a, b, c
Boisvert, L. N., Petty, A. A., and Stroeve, J. C.: The Impact of the Extreme Winter 2015/16 Arctic Cyclone on the Barents-Kara Seas, Mon. Weather Rev., 144, 4279–4287, https://doi.org/10.1175/MWR-D-16-0234.1, 2016. a
Cloudnet: Cloudnet.fmi.fi, available at: http://devcloudnet.fmi.fi/, last access: 29 April 2020. a
Cox, C. J., Walden, V. P., Rowe, P. M., and Shupe, M. D.: Humidity trends imply increased sensitivity to clouds in a warming Arctic, Nat. Commun., 6, 10117, https://doi.org/10.1038/ncomms10117, 2015. a
Curry, J. A., Schramm, J. L., Rossow, W. B., and Randall, D.: Overview of Arctic Cloud and Radiation Characteristics, J. Climate, 9, 1731–1764, https://doi.org/10.1175/1520-0442(1996)009<1731:OOACAR>2.0.CO;2, 1996. a
Dahlke, S. and Maturilli, M.: Contribution of Atmospheric Advection to the Amplified Winter Warming in the Arctic North Atlantic Region, Adv. Meteorol., 2017, 4928620, https://doi.org/10.1155/2017/4928620, 2017. a, b, c, d, e, f, g
Dahlke, S., Hughes, N., Wagner, P., Gerland, S., Wawrzyniak, T., Ivanov, B., and Maturilli, M.: The observed recent surface air temperature development across Svalbard and concurring footprints in local sea ice cover, Int. J. Climatol., 1–20, https://doi.org/10.1002/joc.6517, online first, 2020. a
Dong, X., Xi, B., Crosby, K., Long, C. N., Stone, R. S., and Shupe, M. D.: A 10 year climatology of Arctic cloud fraction and radiative forcing at Barrow, Alaska, J. Geophys. Res.-Atmos., 115, D17212, https://doi.org/10.1029/2009JD013489, 2010. a
Ebell, K., Nomokonova, T., Maturilli, M., and Ritter, C.: Radiative effect of clouds at Ny-Alesund, Svalbard, as inffered from ground-based remote sensing observations, J. Applied Meteorol. Clim., 59, 3–22, https://doi.org/10.1175/JAMC-D-19-0080.1, 2020. a, b, c, d, e, f, g, h, i, j, k, l, m
FLEXTRA: FLEXTRA trajectories, available at: https://projects.nilu.no//ccc/trajectories/, last access: 29 April 2020. a
Gallagher, M. R., Shupe, M. D., and Miller, N. B.: Impact of Atmospheric Circulation on Temperature, Clouds, and Radiation at Summit Station, Greenland, with Self-Organizing Maps, J. Climate, 31, 8895–8915, https://doi.org/10.1175/JCLI-D-17-0893.1, 2018. a, b, c, d, e, f, g
Graversen, R. G. and Burtu, M.: Arctic amplification enhanced by latent energy transport of atmospheric planetary waves, Q. J. Roy. Meteor. Soc., 142, 2046–2054, https://doi.org/10.1002/qj.2802, 2016. a, b, c
Graversen, R. G., Langen, P. L., and Mauritsen, T.: Polar Amplification in CCSM4: Contributions from the Lapse Rate and Surface Albedo Feedbacks, J. Climate, 27, 4433–4450, https://doi.org/10.1175/JCLI-D-13-00551.1, 2014. a
Hegyi, B. M. and Taylor, P. C.: The Unprecedented 2016–2017 Arctic Sea Ice Growth Season: The Crucial Role of Atmospheric Rivers and Longwave Fluxes, Geophys. Res. Lett., 45, 5204–5212, https://doi.org/10.1029/2017GL076717, 2018. a, b, c, d
Hogan, R. J., Mittermaier, M. P., and Illingworth, A. J.: The Retrieval of Ice Water Content from Radar Reflectivity Factor and Temperature and Its Use in Evaluating a Mesoscale Model, J. Appl. Meteorol. Clim., 45, 301–317, https://doi.org/10.1175/JAM2340.1, 2006. a, b
Houze, R. A. J.: Orographic effects on precipitating clouds, Rev. Geophys., 50, RG1001, https://doi.org/10.1029/2011RG000365, 2012. a
Huang, J., Zhang, X., Zhang, Q., Lin, Y., Hao, M., Luo, Y., Zhao, Z., Yao, Y., Chen, X., Wang, L., Nie, S., Yin, Y., Xu, Y., and Zhang, J.: Recently amplified arctic warming has contributed to a continual global warming trend, Nat. Clim. Change, 7, 875–879, https://doi.org/10.1038/s41558-017-0009-5, 2017. a
Hwang, Y.-T., Frierson, D. M. W., and Kay, J. E.: Coupling between Arctic feedbacks and changes in poleward energy transport, Geophys. Res. Lett., 38, L17704, https://doi.org/10.1029/2011GL048546, 2011. a, b, c, d, e
Illingworth, A. J., Hogan, R. J., O'Connor, E., Bouniol, D., Brooks, M. E., Delanoé, J., Donovan, D. P., Eastment, J. D., Gaussiat, N., Goddard, J. W. F., Haeffelin, M., Baltink, H. K., Krasnov, O. A., Pelon, J., Piriou, J.-M., Protat, A., Russchenberg, H. W. J., Seifert, A., Tompkins, A. M., van Zadelhoff, G.-J., Vinit, F., Willén, U., Wilson, D. R., and Wrench, C. L.: Cloudnet, B. Am. Meteorol. Soc., 88, 883–898, https://doi.org/10.1175/BAMS-88-6-883, 2007. a
IPCC: IPCC 2007. The scientific basis. Contribution of Working Group I to the Third Assessment Report of the Intergovernmental Panel on Climate Change, Cambridge, Cambridge University Press, 2007. a
Isaksen, K., Nordli, Å., Førland, E. J., Łupikasza, E., Eastwood, S., and Niedźwiedź, T.: Recent warming on Spitsbergen – Influence of atmospheric circulation and sea ice cover, J. Geophys. Res.-Atmos., 121, 11913–11931, https://doi.org/10.1002/2016JD025606, 2016. a
Kay, J. E., Bourdages, L., Miller, N. B., Morrison, A., Yettella, V., Chepfer, H., and Eaton, B.: Evaluating and improving cloud phase in the Community Atmosphere Model version 5 using spaceborne lidar observations, J. Geophys. Res.-Atmos., 121, 4162–4176, https://doi.org/10.1002/2015JD024699, 2016. a
Korolev, A. and Field, P. R.: The Effect of Dynamics on Mixed-Phase Clouds: Theoretical Considerations, J. Atmos. Sci., 65, 66–86, https://doi.org/10.1175/2007JAS2355.1, 2008. a
Löhnert, U. and Crewell, S.: Accuracy of cloud liquid water path from ground‐based microwave radiometry 1. Dependency on cloud model statistics, Radio Sci., 38, 8041, https://doi.org/10.1029/2002RS002654, 2003. a
Maturilli, M.: High resolution radiosonde measurements from station Ny-Ålesund (2017-04), PANGAEA, https://doi.org/10.1594/PANGAEA.879767, 2017a. a
Maturilli, M.: High resolution radiosonde measurements from station Ny-Ålesund (2017-05), PANGAEA, https://doi.org/10.1594/PANGAEA.879820, 2017b. a
Maturilli, M.: High resolution radiosonde measurements from station Ny-Ålesund (2017-06), PANGAEA, https://doi.org/10.1594/PANGAEA.879822, 2017c. a
Maturilli, M.: High resolution radiosonde measurements from station Ny-Ålesund (2017-07), PANGAEA, https://doi.org/10.1594/PANGAEA.879823, 2017d. a
Maturilli, M. and Ebell, K.: Twenty-five years of cloud base height measurements by ceilometer in Ny-Ålesund, Svalbard, Earth Syst. Sci. Data, 10, 1451–1456, https://doi.org/10.5194/essd-10-1451-2018, 2018. a, b, c
Maturilli, M. and Kayser, M.: Homogenized radiosonde record at station Ny-Ålesund, Spitsbergen, 1993–2014, PANGAEA, https://doi.org/10.1594/PANGAEA.845373, 2016. a, b
Maturilli, M. and Kayser, M.: Arctic warming, moisture increase and circulation changes observed in the Ny-Ålesund homogenized radiosonde record, Theoretical and Applied Climatology, 130, 1–17, https://doi.org/10.1007/s00704-016-1864-0, 2017a. a, b, c, d, e, f, g, h, i, j
Maturilli, M. and Kayser, M.: Homogenized radiosonde record at station Ny-Ålesund, Spitsbergen, 2015–2016, PANGAEA, https://doi.org/10.1594/PANGAEA.875196, 2017b. a, b
Maturilli, M., Herber, A., and König-Langlo, G.: Climatology and time series of surface meteorology in Ny-Ålesund, Svalbard, Earth Syst. Sci. Data, 5, 155–163, https://doi.org/10.5194/essd-5-155-2013, 2013. a
Mewes, D. and Jacobi, C.: Heat transport pathways into the Arctic and their connections to surface air temperatures, Atmos. Chem. Phys., 19, 3927–3937, https://doi.org/10.5194/acp-19-3927-2019, 2019. a, b, c, d, e, f, g, h
Miller, N. B., Shupe, M. D., Cox, C. J., Walden, V. P., Turner, D. D., and Steffen, K.: Cloud Radiative Forcing at Summit, Greenland, J. Climate, 28, 6267–6280, https://doi.org/10.1175/JCLI-D-15-0076.1, 2015. a, b
Miller, N. B., Shupe, M. D., Cox, C. J., Noone, D., Persson, P. O. G., and Steffen, K.: Surface energy budget responses to radiative forcing at Summit, Greenland, The Cryosphere, 11, 497–516, https://doi.org/10.5194/tc-11-497-2017, 2017. a, b
Miller, N. B., Shupe, M. D., Lenaerts, J. T. M., Kay, J. E., de Boer, G., and Bennartz, R.: Process-Based Model Evaluation Using Surface Energy Budget Observations in Central Greenland, J. Geophys. Res.-Atmos., 123, 4777–4796, https://doi.org/10.1029/2017JD027377, 2018. a
Minnett, P. J.: The Influence of Solar Zenith Angle and Cloud Type on Cloud Radiative Forcing at the Surface in the Arctic, J. Climate, 12, 147–158, https://doi.org/10.1175/1520-0442-12.1.147, 1999. a
Mlawer, E. J., Taubman, S. J., Brown, P. D., Iacono, M. J., and Clough, S. A.: Radiative transfer for inhomogeneous atmospheres: RRTM, a validated correlated-k model for the longwave, J. Geophys. Res.-Atmos., 102, 16663–16682, https://doi.org/10.1029/97JD00237, 1997. a
Morrison, H., de Boer, G., Feingold, G., Harrington, J., Shupe, M. D., and Sulia, K.: Resilience of persistent Arctic mixed-phase clouds, Nat. Geosci., 5, 11–17, https://doi.org/10.1038/ngeo1332, 2012. a, b
Mortin, J., Svensson, G., Graversen, R. G., Kapsch, M.-L., Stroeve, J. C., and Boisvert, L. N.: Melt onset over Arctic sea ice controlled by atmospheric moisture transport, Geophys. Res. Lett., 43, 6636–6642, https://doi.org/10.1002/2016GL069330, 2016. a
Murray, B. J., O'Sullivan, D., Atkinson, J. D., and Webb, M. E.: Ice nucleation by particles immersed in supercooled cloud droplets, Chem. Soc. Rev., 41, 6519–6554, https://doi.org/10.1039/C2CS35200A, 2012. a
Nomokonova, T., Ebell, K., Löhnert, U., Maturilli, M., Ritter, C., and O'Connor, E.: Statistics on clouds and their relation to thermodynamic conditions at Ny-Ålesund using ground-based sensor synergy, Atmos. Chem. Phys., 19, 4105–4126, https://doi.org/10.5194/acp-19-4105-2019, 2019a. a, b, c, d, e, f
Nomokonova, T., Ritter, C., and Ebell, K.: Integrated water vapor of HATPRO microwave radiometer at AWIPEV, Ny-Ålesund (2016), PANGAEA, https://doi.org/10.1594/PANGAEA.902140, 2019b. a
Nomokonova, T., Ritter, C., and Ebell, K.: Integrated water vapor of HATPRO microwave radiometer at AWIPEV, Ny-Ålesund (2017), PANGAEA, https://doi.org/10.1594/PANGAEA.902142, 2019c. a
Nomokonova, T., Ritter, C., and Ebell, K.: Integrated water vapor of HATPRO microwave radiometer at AWIPEV, Ny-Ålesund (2018), PANGAEA, https://doi.org/10.1594/PANGAEA.902143, 2019d. a
Nomokonova, T., Ritter, C., and Ebell, K.: Liquid water path of HATPRO microwave radiometer at AWIPEV, Ny-Ålesund (2016), PANGAEA, https://doi.org/10.1594/PANGAEA.902096, 2019e. a
Nomokonova, T., Ritter, C., and Ebell, K.: Liquid water path of HATPRO microwave radiometer at AWIPEV, Ny-Ålesund (2017), PANGAEA, https://doi.org/10.1594/PANGAEA.902098, 2019f. a
Nomokonova, T., Ritter, C., and Ebell, K.: Liquid water path of HATPRO microwave radiometer at AWIPEV, Ny-Ålesund (2018), PANGAEA, https://doi.org/10.1594/PANGAEA.902099, 2019g. a
Nomokonova, T., Ritter, C., and Ebell, K.: Temperature profile of HATPRO microwave radiometer at AWIPEV, Ny-Ålesund (2016), PANGAEA, https://doi.org/10.1594/PANGAEA.902145, 2019h. a
Nomokonova, T., Ritter, C., and Ebell, K.: Temperature profile of HATPRO microwave radiometer at AWIPEV, Ny-Ålesund (2017), PANGAEA, https://doi.org/10.1594/PANGAEA.902146, 2019i. a
Nomokonova, T., Ritter, C., and Ebell, K.: Temperature profile of HATPRO microwave radiometer at AWIPEV, Ny-Ålesund (2018), PANGAEA, https://doi.org/10.1594/PANGAEA.902147, 2019j. a
Overland, J. E. and Wang, M.: Recent Extreme Arctic Temperatures are due to a Split Polar Vortex, J. Climate, 29, 5609–5616, https://doi.org/10.1175/JCLI-D-16-0320.1, 2016. a
Overland, J. E., Dethloff, K., Francis, J. A., Hall, R. J., Hanna, E., Kim, S.-J., Screen, J. A., Shepherd, T. G., and Vihma, T.: Nonlinear response of mid-latitude weather to the changing Arctic, Nat. Clim. Change, 6, 992–999, https://doi.org/10.1038/nclimate3121, 2016. a
Pettersen, C., Bennartz, R., Merrelli, A. J., Shupe, M. D., Turner, D. D., and Walden, V. P.: Precipitation regimes over central Greenland inferred from 5 years of ICECAPS observations, Atmos. Chem. Phys., 18, 4715–4735, https://doi.org/10.5194/acp-18-4715-2018, 2018. a
Pithan, F. and Mauritsen, T.: Arctic amplification dominated by temperature feedbacks in contemporary climate models, Nat. Geosci., 7, 181–184, https://doi.org/10.1038/ngeo2071, 2014. a, b
Qiu, S., Xi, B., and Dong, X.: Influence of Wind Direction on Thermodynamic Properties and Arctic Mixed-Phase Clouds in Autumn at Utqiaġvik, Alaska, J. Geophys. Res.-Atmos., 123, 9589–9603, https://doi.org/10.1029/2018JD028631, 2018. a
Rose, T., Crewell, S., Löhnert, U., and Simmer, C.: A network suitable microwave radiometer for operational monitoring of the cloudy atmosphere, Atmos. Res., 75, 183–200, https://doi.org/10.1016/j.atmosres.2004.12.005, 2005. a
Sandvik, A., Biryulina, M., Kvamstø, N. G., Stamnes, J. J., and Stamnes, K.: Observed and simulated microphysical composition of arctic clouds: Data properties and model validation, J. Geophys. Res.-Atmos., 112, D05205, https://doi.org/10.1029/2006JD007351, 2007. a
Schmidt, J., Ansmann, A., Bühl, J., Baars, H., Wandinger, U., Müller, D., and Malinka, A. V.: Dual-FOV Raman and Doppler lidar studies of aerosol-cloud interactions: Simultaneous profiling of aerosols, warm-cloud properties, and vertical wind, J. Geophys. Res.-Atmos., 119, 5512–5527, https://doi.org/10.1002/2013JD020424, 2014. a
Sedlar, J. and Tjernström, M.: Clouds, warm air, and a climate cooling signal over the summer Arctic, Geophys. Res. Lett., 44, 1095–1103, https://doi.org/10.1002/2016GL071959, 2017. a
Sengupta, M., Clothiaux, E. E., Ackerman, T. P., Kato, S., and Min, Q.: Importance of Accurate Liquid Water Path for Estimation of Solar Radiation in Warm Boundary Layer Clouds: An Observational Study, J. Climate, 16, 2997–3009, https://doi.org/10.1175/1520-0442(2003)016<2997:IOALWP>2.0.CO;2, 2003. a
Serreze, M. C., Barrett, A. P., and Cassano, J. J.: Circulation and surface controls on the lower tropospheric air temperature field of the Arctic, J. Geophys. Res.-Atmos., 116, D07104, https://doi.org/10.1029/2010JD015127, 2011. a, b
Shupe, M. D. and Intrieri, J. M.: Cloud Radiative Forcing of the Arctic Surface: The Influence of Cloud Properties, Surface Albedo, and Solar Zenith Angle, J. Climate, 17, 616–628, https://doi.org/10.1175/1520-0442(2004)017<0616:CRFOTA>2.0.CO;2, 2004. a, b, c, d, e, f, g, h, i
Shupe, M. D., Matrosov, S. Y., and Uttal, T.: Arctic Mixed-Phase Cloud Properties Derived from Surface-Based Sensors at SHEBA, J. Atmos. Sci., 63, 697–711, https://doi.org/10.1175/JAS3659.1, 2006. a
Solomon, S., Qin, D., Manning, M., Chen, Z., Marquis, M., Averyt, K. B., Tignor, M., and Miller, H. L.: Intergovernmental Panel on Climate Change, in: Climate Change 2007: The Physical Science Basis. Contribution of Working Group I to the Fourth Assessment Report of the Intergovernmental Panel on Climate Change, edited by: Solomon, S., Qin, D., Manning, M., Chen, Z., Marquis, M., Averyt, K. B., Tignor, M., and Miller, H. L., Cambridge University Press, Cambridge, UK and New York, NY, USA, 2007. a
Sommer, M., Dirksen, R., and Immler, F.: RS92 GRUAN Data Product Version 2 (RS92-GDP.2), GRUAN Lead Centre, https://doi.org/10.5676/GRUAN/RS92-GDP.2, 2012. a
Stohl, A.: Computation, accuracy and applications of trajectories – A review and bibliography, Atmos. Environ., 32, 947–966, https://doi.org/10.1016/S1352-2310(97)00457-3, 1998. a
Stohl, A. and Seibert, P.: Accuracy of trajectories as determined from the conservation of meteorological tracers, Q. J. Roy. Meteor. Soc., 124, 1465–1484, https://doi.org/10.1002/qj.49712454907, 1998. a
Stohl, A., Wotawa, G., Seibert, P., and Kromp-Kolb, H.: Interpolation Errors in Wind Fields as a Function of Spatial and Temporal Resolution and Their Impact on Different Types of Kinematic Trajectories, J. Appl. Meteorol., 34, 2149–2165, https://doi.org/10.1175/1520-0450(1995)034<2149:IEIWFA>2.0.CO;2, 1995. a
Susskind, J., Schmidt, G. A., Lee, J. N., and Iredell, L.: Recent global warming as confirmed by AIRS, Environ. Res. Lett., 14, 044030, https://doi.org/10.1088/1748-9326/aafd4e, 2019. a
Taylor, P. C., Cai, M., Hu, A., Meehl, J., Washington, W., and Zhang, G. J.: A Decomposition of Feedback Contributions to Polar Warming Amplification, J. Climate, 26, 7023–7043, https://doi.org/10.1175/JCLI-D-12-00696.1, 2013. a
Tjernström, M., Shupe, M. D., Brooks, I. M., Achtert, P., Prytherch, J., and Sedlar, J.: Arctic Summer Airmass Transformation, Surface Inversions, and the Surface Energy Budget, J. Climate, 32, 769–789, https://doi.org/10.1175/JCLI-D-18-0216.1, 2019. a
Wei, T., Ding, M., Wu, B., Lu, C., and Wang, S.: Variations in temperature-related extreme events (1975–2014) in Ny-Ålesund, Svalbard, Atmos. Sci. Lett., 17, 102–108, https://doi.org/10.1002/asl.632, 2016. a
Wendisch, M., Brückner, M., Burrows, J. P., Crewell, S., Dethloff, K., Lüpkes, C., Macke, A., Notholt, J., Quaas, J., Rinke, A., and Tegen, I.: Understanding causes and effects of rapid warming in the Arctic, EOS, 98, 22–26, https://doi.org/10.1029/2017EO064803, 2017. a
Wendisch, M., Macke, A., Ehrlich, A., Lüpkes, C., Mech, M., Chechin, D., Dethloff, K., Velasco, C. B., Bozem, H., and Brückner, M.: The Arctic Cloud Puzzle: Using ACLOUD/PASCAL Multiplatform Observations to Unravel the Role of Clouds and Aerosol Particles in Arctic Amplification, B. Am. Meteorol. Soc., 100, 841–871, https://doi.org/10.1175/BAMS-D-18-0072.1, 2019. a
Wex, H., Huang, L., Zhang, W., Hung, H., Traversi, R., Becagli, S., Sheesley, R. J., Moffett, C. E., Barrett, T. E., Bossi, R., Skov, H., Hünerbein, A., Lubitz, J., Löffler, M., Linke, O., Hartmann, M., Herenz, P., and Stratmann, F.: Annual variability of ice-nucleating particle concentrations at different Arctic locations, Atmos. Chem. Phys., 19, 5293–5311, https://doi.org/10.5194/acp-19-5293-2019, 2019. a
Wu, B.: Winter Atmospheric Circulation Anomaly Associated with Recent Arctic Winter Warm Anomalies, J. Climate, 30, 8469–8479, https://doi.org/10.1175/JCLI-D-17-0175.1, 2017. a, b, c, d
Yeo, H., Park, S.-J., Kim, B.-M., Shiobara, M., Kim, S.-W., Kwon, H., Kim, J.-H., Jeong, J.-H., Park, S. S., and Choi, T.: The observed relationship of cloud to surface longwave radiation and air temperature at Ny-Ålesund, Svalbard, Tellus B, 70, 1–10, https://doi.org/10.1080/16000889.2018.1450589, 2018. a, b, c, d
Yoshimori, M., Abe-Ouchi, A., and Laîné, A.: The role of atmospheric heat transport and regional feedbacks in the Arctic warming at equilibrium, Clim. Dynam., 49, 3457–3472, https://doi.org/10.1007/s00382-017-3523-2, 2017. a
- Abstract
- Introduction
- Instrumentation and data products
- Definition of periods with increased and/or decreased moisture and temperature
- Results and discussion
- Summary and conclusion
- Data availability
- Author contributions
- Competing interests
- Special issue statement
- Acknowledgements
- Financial support
- Review statement
- References
- Supplement