the Creative Commons Attribution 4.0 License.
the Creative Commons Attribution 4.0 License.
 | 22 Apr 2020
Influence of vessel characteristics and atmospheric processes on the gas and particle phase of ship emission plumes: in situ measurements in the Mediterranean Sea and around the Arabian Peninsula
Siddika Celik
Frank Drewnick
Friederike Fachinger
James Brooks
Eoghan Darbyshire
Jean-Daniel Paris
Philipp G. Eger
Jan Schuladen
Ivan Tadic
Nils Friedrich
Dirk Dienhart
Bettina Hottmann
Horst Fischer
John N. Crowley
Hartwig Harder
Stephan Borrmann
A total of 252 emission plumes of ships operating in the Mediterranean Sea and around the Arabian Peninsula were investigated using a comprehensive dataset of gas- and submicron-particle-phase properties measured during the 2-month shipborne AQABA (Air Quality and Climate Change in the Arabian Basin) field campaign in summer 2017. The post-measurement identification of the corresponding ship emission events in the measured data included the determination of the plume sources (up to 38 km away) as well as the plume ages (up to 115 min) and was based on commercially available historical records of the Automatic Identification System. The dispersion lifetime of chemically inert CO2 in the ship emission plumes was determined as 70±15 min, resulting in levels indistinguishable from the marine background after 260±60 min. Emission factors (EFs) as quantities that are independent of plume dilution were calculated and used for the investigation of influences on ship emission plumes caused by ship characteristics and the combustion process as well as by atmospheric processes during the early stage of exhaust release and during plume ageing. Combustion efficiency and therefore emission factors of black carbon and NOx were identified to depend mostly on the vessel speed and gross tonnage. Moreover, larger ships, associated with higher engine power, were found to use fuel with higher sulfur content and have higher gas-phase SO2, particulate sulfate, particulate organics, and particulate matter EFs. Despite the independence of EFs of dilution, a significant influence of the ambient wind speed on the particle number and mass EFs was observed that can be traced back to enhanced particle coagulation in the case of slower dilution and suppressed vapour condensation on particles in the case of faster dilution of the emission plume. Atmospheric reactions and processes in ship emission plumes were investigated that include NOx and O3 chemistry, gas-to-particle conversion of NOx and SO2, and the neutralisation of acids in the particle phase through the uptake of ambient gas-phase ammonia, the latter two of which cause the inorganic particulate content to increase and the organic fraction to decrease with increasing plume age. The results allow for us to describe the influences on (or processes in) ship emission plumes quantitatively by parameterisations, which could be used for further refinement of atmospheric models, and to identify which of these processes are the most important ones.
- Article
(7073 KB) -
Supplement
(615 KB) - BibTeX
- EndNote


Globalisation and international trade as one of its essential components are expected to grow in the longer term. Currently, ships carry about 90 % of the world's trade by volume (Smith et al., 2015). This is mainly due to cost reasons, because ships are considered to be an energy-efficient means of transport of passengers and goods in comparison to on-road vehicles and aircraft (Jonsson et al., 2011). Thus, shipping represents an indispensable and expanding mode of transport as an international economic factor (Chen et al., 2018).
Historically, there was no extensive legislative regulation of air pollutant emissions caused by maritime traffic, as most of the time (ocean-going) ships operate far away from areas of human habitation (Juwono et al., 2013; Moldanová et al., 2013). Therefore, especially large ocean-going vessels burn inexpensive residual diesel fuel as a cost-saving measure (Juwono et al., 2013). This fuel usually has a high sulfur content of up to 4.5 wt %, whereas the sulfur content of diesel fuel used for road traffic in most European countries is 4500 times lower, i.e. 10 ppm(m) (Fridell et al., 2008). In this context, since 1973 the International Maritime Organization (IMO) has set and periodically tightened binding regulations for maritime pollutant emissions with the MARPOL convention. Special legally binding restrictions for the emissions of NOx (= NO+NO2) and SOx (= SO2+SO3) as well as of particulate matter (PM) caused by ships exist for so-called emission control areas (ECAs; IMO, 2019). However, concerning environmental protection these regulations are not yet extensive enough. On a global scale approximately 2.2 % of anthropogenic CO2 emissions, 15 % of anthropogenic NOx emissions, and 5 % to 8 % of anthropogenic SOx emissions are related to ocean-going vessels (Corbett et al., 2007; Nunes et al., 2017; Metz et al., 2007).
When considering the significant anthropogenic influence of shipping on the atmosphere on a regional and global scale and the associated negative influences on air quality and climate, the investigation of the gas and particle phase of ship emission plumes gains increasing importance from both ecological and epidemiological points of view (Diesch et al., 2013; Juwono et al., 2013). In the literature, experimental studies can be classified as follows:
-
exhaust sampling of a large number of operating vessels from stationary (e.g. at harbours or shore sites) or mobile (e.g. research vessel or aircraft) measurement platforms (e.g. Williams et al., 2009; Jonsson et al., 2011; Alföldy et al., 2013; Diesch et al., 2013);
-
multiple sampling and tracking of the emissions of a few individual operating vessels using a research vessel or aircraft (e.g. Sinha et al., 2003; Chen et al., 2005; Cappa et al., 2014);
-
on-board studies conducted on an operating vessel (e.g. Agrawal et al., 2008; Moldanová et al., 2009, 2013);
-
measurements with a test rig in a laboratory (e.g. Petzold et al., 2008).
These studies give a broad overview of emission factors (EFs) and their variability for a variety of species of the aerosol gas and particle phase. EFs relate the quantity of emitted species to the amount of burned fuel and are therefore independent of the emission plumes' dilution. However, so far these investigations have provided neither extensive knowledge of the parameters causing the observed variability nor information on the extent to which these parameters affect the emissions. On-board and test rig studies could be partially exempted from this statement, but they do not offer information on ship emission plumes on a large selection of ships or under real-world conditions, respectively. Moreover, previous experimental studies provide little information on atmospheric processing and the ageing of ship emission plumes because in most cases ship emission plumes were investigated that were emitted at less than 5 km distance from the measurement site and were less than 15 min old when they reached the site (Alföldy et al., 2013; Diesch et al., 2013). In addition, the measurement conditions in these studies (e.g. time of day, meteorology, ships' operating conditions) only vary to a minor extent. Furthermore, previous studies usually cover a small number of species in ship emission plumes, which makes it difficult to investigate processes running in parallel that can be traced to the same cause (e.g. to atmospheric ageing or to the combustion process).
The AQABA (Air Quality and Climate Change in the Arabian Basin) field campaign provides an extensive and diverse dataset to investigate ship emission plumes, emitted at various horizontal distances from the measurement location and therefore of different ages. For a variety of species of the aerosol gas and particle phase, data have been collected on-board the research vessel Kommandor Iona during this 2-month field campaign in summer 2017. The research vessel's route led from southern France through the Mediterranean Sea and around the Arabian Peninsula to Kuwait and went the same way back. Given the large geographic and temporal coverage of the field campaign, the dataset contains information on the emissions of a diversity of vessels of different size, speed, type, etc. that were measured under various atmospheric conditions regarding meteorology and solar radiation.
The aim of this study is to investigate ship plumes emitted in the Mediterranean Sea and around the Arabian Peninsula using time-resolved measurements of aerosol gas- and particle-phase species that were recorded during the AQABA field campaign. For this purpose, ship emission plumes were determined and characterised according to their age, transport distance, and source vessel using historical Automatic Identification System (AIS) data. Plume quantities of identified ship emission plumes, especially EFs, were calculated in order to investigate them with respect to the following influencing parameters:
-
Fuel quality. How does the fuel sulfur content influence the quantity of emitted species?
-
Ship parameters and combustion process. How does, for example, the ship velocity (and thus the engine load) affect the combustion efficiency? What are the effects of the exhaust system's size and thus of the exhaust's residence time in it.
-
Meteorology and solar radiation. How do atmospheric dilution, transport, and ageing affect the characteristics of ship emission plumes?
2.1 AQABA field campaign
The AQABA field campaign took place from 24 June to 3 September 2017 on the research vessel Kommandor Iona that served as measurement platform. Figure 1 shows the route of the research vessel during the field campaign. The first leg started at the seaport of Toulon, proceeding consecutively through the Mediterranean Sea, the Suez Canal, the Red Sea, the Gulf of Aden, the Arabian Sea, the Gulf of Oman, and the Persian Gulf, and ended on 31 July when reaching the harbour of Kuwait. The second leg comprised the reverse route from Kuwait back to Toulon. Time series for a variety of species of the aerosol gas and particle phase were measured with a high time resolution (between 1 s and 1 min depending on the measured variable), including both background air and events from individual ship emission plumes. The main objectives of the AQABA field campaign were to gain knowledge of the influences of natural and anthropogenic emissions on air quality and climate and to investigate the interaction of the terrestrial and marine ecological systems.
Table 1Overview of quantities measured during the AQABA field campaign that were used in this study, along with the respective measurement instruments, size ranges with the corresponding particle losses, and time resolutions. The given particle transport losses (estimated using the Particle Loss Calculator, von der Weiden et al., 2009) represent upper limits, as particle losses within the size ranges are lower than at their boundaries. Acronyms are introduced in Sect. 2.2. The term n/a means not applicable.

a Mobility and c vacuum aerodynamic diameter. b PM1 covers only particles with diameters of up to 350 nm, as larger particles were not observed in the ship emission plumes. d Modified version of the commercially available instrument. e Effective time resolution is 170 s. f The photolysis rate was calculated using wavelength-resolved actinic flux data measured by the spectral radiometer.
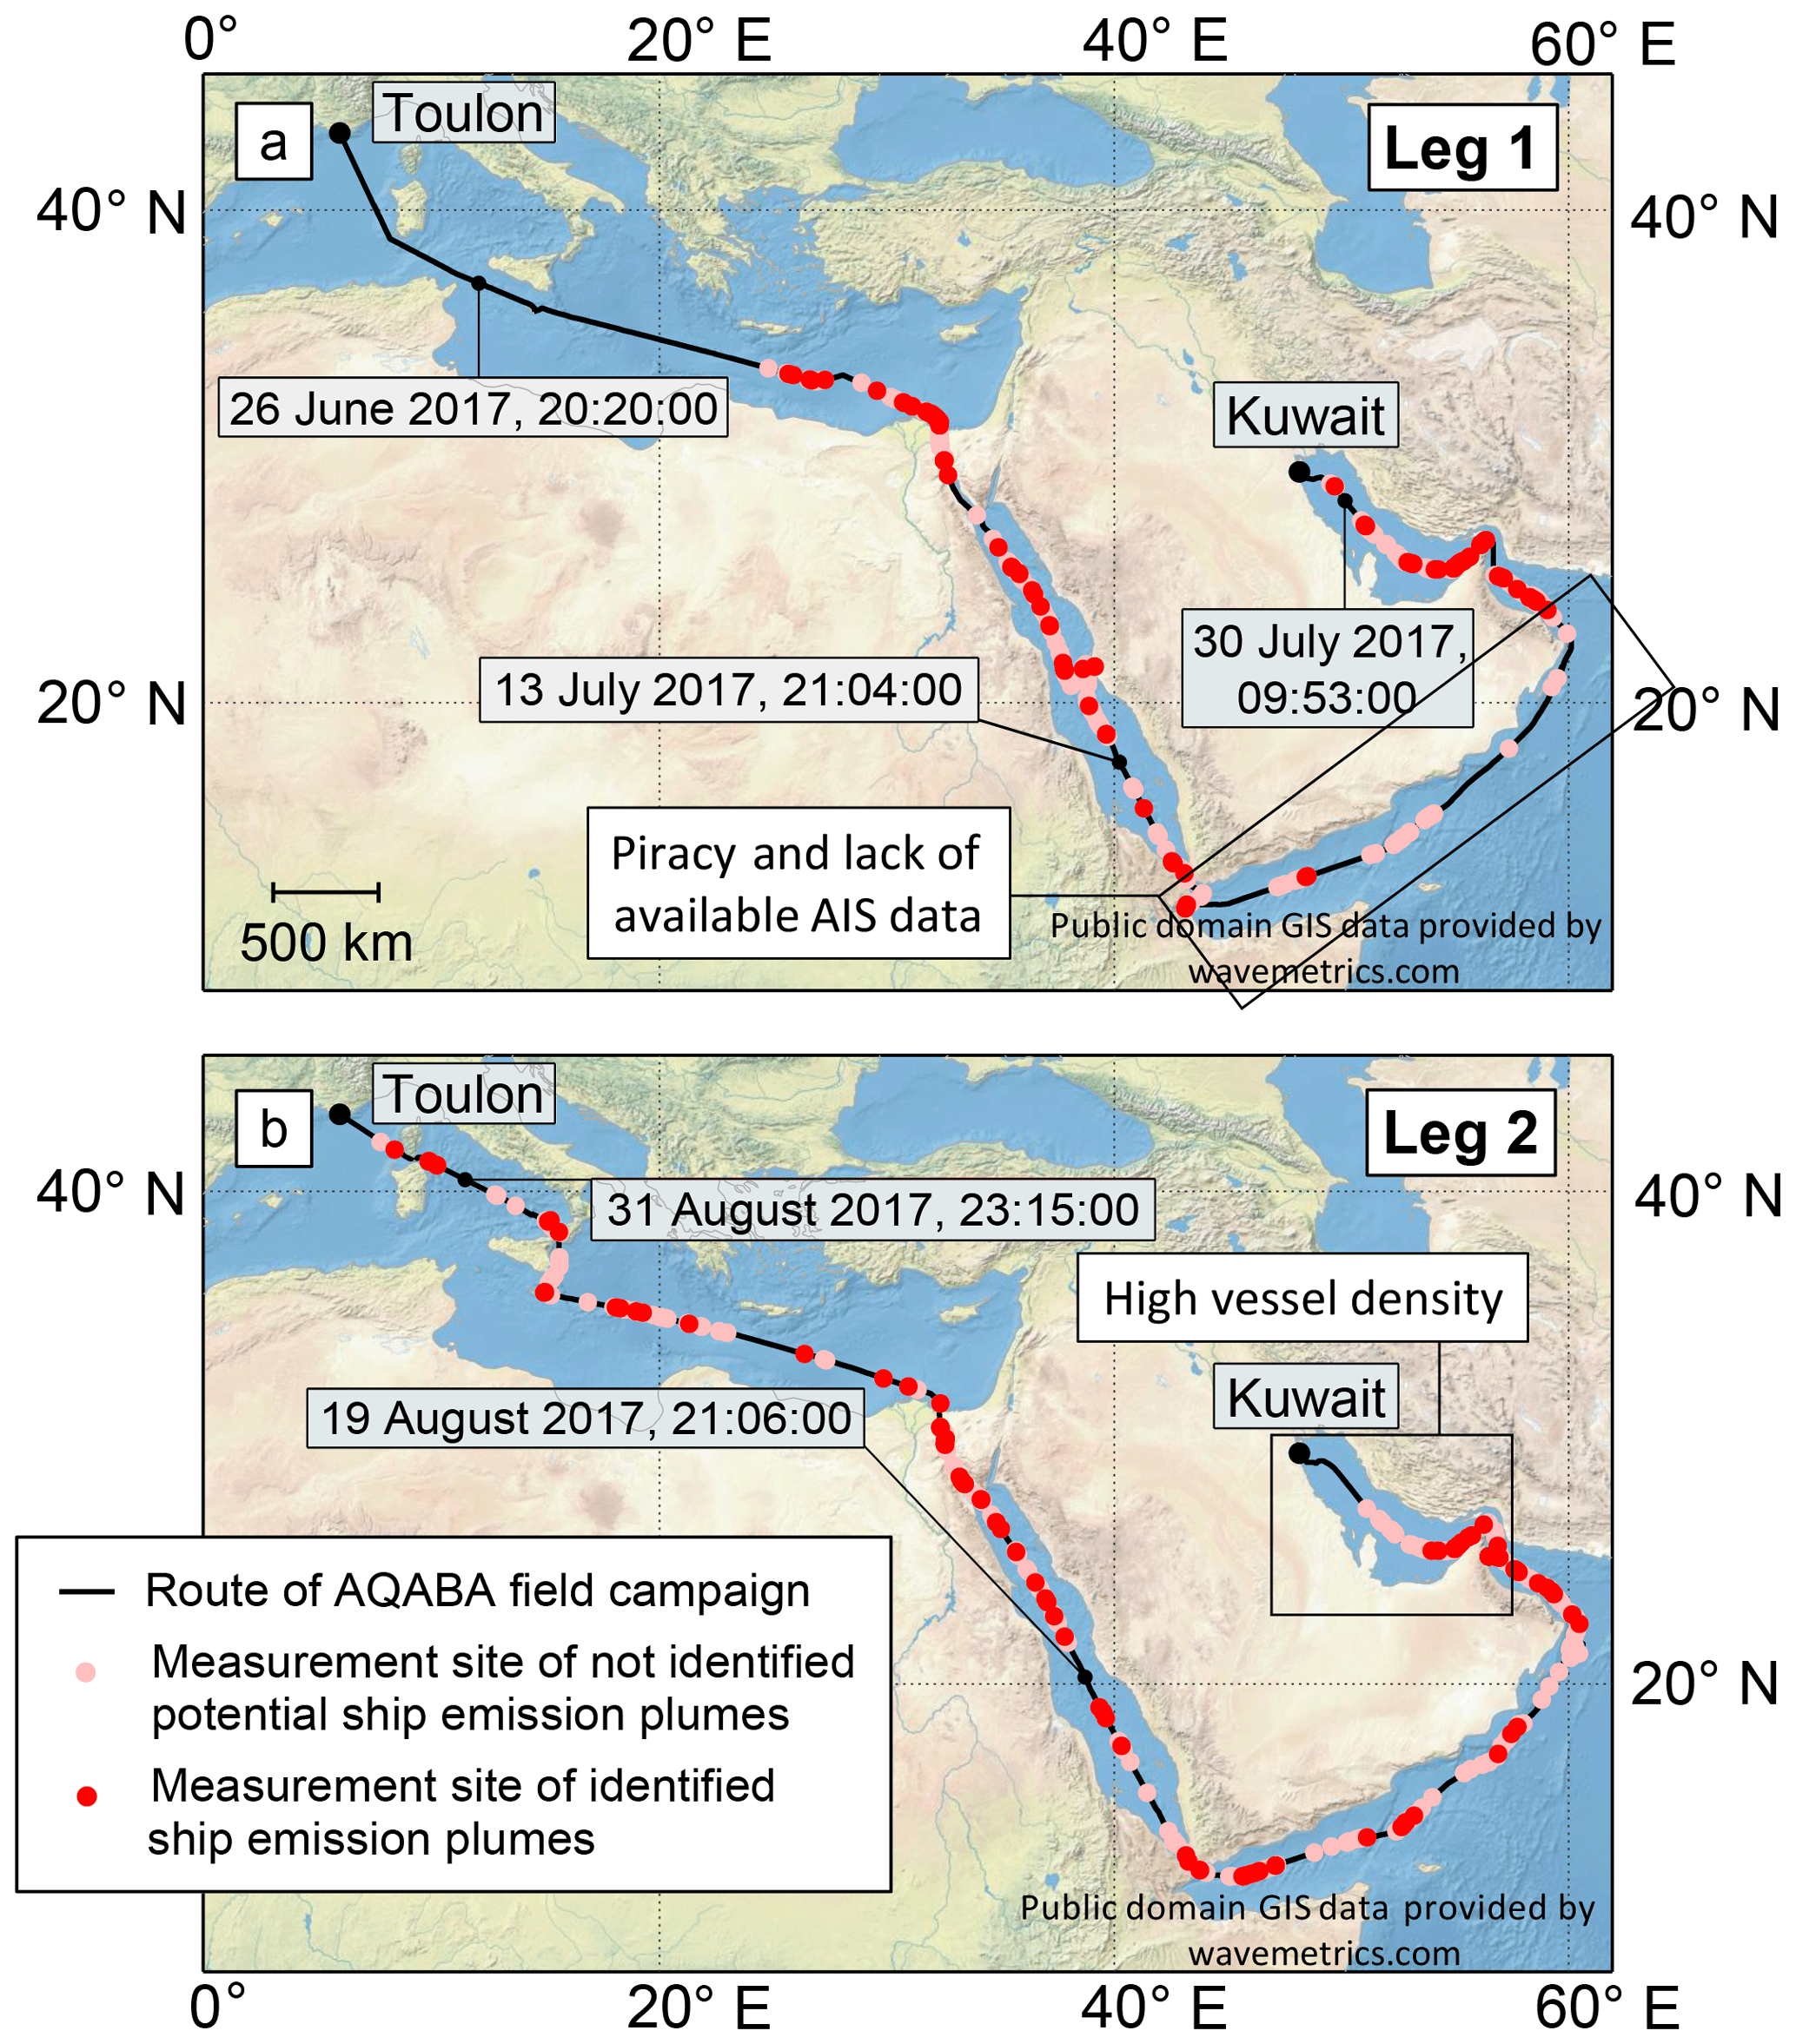
Figure 1Route of the research vessel Kommandor Iona during the AQABA field campaign on leg 1 (a) and 2 (b) with time labels (UTC) for selected geographic positions. The measurement locations of identified and potential but unidentified ship emission plumes are marked. The Gulf of Aden and the Arabian Sea as well as the Persian Gulf are indicated as areas where the vessel identification was difficult.
2.2 Instrumentation for shipborne in situ measurements during AQABA
For the purpose of the AQABA field campaign, five measurement containers equipped with measurement instruments were installed on the Kommandor Iona, and the sampling of outdoor air was realised through appropriate inlet systems for each of the instruments. Table 1 gives an overview of the measurement instruments that were used for this study. In general, the processing of data (timestamp UTC) included calibrations, corrections (e.g. of the time delay due to the transport time of sampled air through the inlet system), the removal of unusable data (e.g. due to malfunctioning instruments), and the removal of data contaminated by sampling the ship's own exhaust. All presented particle- and gas-phase data were scaled to a pressure of p=1013.25 hPa and a temperature of T=20 ∘C.
Particle-phase measurements. The instruments used to measure particle-phase data are described in detail by Drewnick et al. (2012). For the measurement of aerosol particles, a self-regenerating silica gel aerosol dryer with two parallel, switchable columns was integrated between the sampling inlet, located approximately 12 m above sea level, and the corresponding instruments. One of the columns was in use to dry the sampled ambient aerosol (relative humidity (RH) behind the aerosol dryer was typically ≤40 %), while the other one was regenerated at the same time by heating and flushing it with dry air. The sampling through the columns was switched between the two once per day. Particle loss due to the whole inlet system, estimated for the relevant size ranges (see Table 1; von der Weiden et al., 2009), was largely negligible. Concentrations of non-refractory submicron particle chemical components, namely particulate sulfate (), particulate nitrate (), particulate ammonium (), particulate chloride (Cl−), and total particulate organics, were determined with a high-resolution time-of-flight aerosol mass spectrometer (HR-ToF-AMS; DeCarlo et al., 2006) using the medium mass resolution mode (“V–mode”) with a 30 s time resolution. The ionisation efficiency of the instrument as well as the relative ionisation efficiencies of and was determined via regular calibrations throughout the campaign. The atomic O ∕ C and H ∕ C ratios were calculated according to Aiken et al. (2008) using the high-resolution mass spectra. Averaged data with a 10 s time resolution were used in the cases of all following particle-phase data. An Aethalometer measured black carbon (BC) concentrations in PM1 via light absorption (λ=880 nm) through on-line filter-sampled aerosol particles. Due to malfunctions, the instrument was exchanged for an identical one once during the field campaign. A default C factor of 1.57 was applied to account for multiple scattering within the filter (Drinovec et al., 2015). Temperature fluctuations due to the on- and off-switching of the air conditioning system in the measurement container caused periodic fluctuations in the measured BC concentration. These fluctuations were taken into account by always averaging over full fluctuation periods when calculating average concentrations as described in Sect. 2.4. Polycyclic aromatic hydrocarbon (PAH) mass concentrations on PM1 particles were detected with a PAH monitor. Particle number concentrations (PNCs) are given both by an ultrafine water-based condensation particle counter (CPC) and by the integrals of the size-resolved PNCs over the whole size range of a fast mobility particle sizer (FMPS). PNCs used for this study were calculated by averaging the data from both instruments. In addition, the FMPS provides the particle number (PN) size distributions. As the ship emission plumes measured during the AQABA field campaign showed particles exclusively in the (lower) size range of the FMPS, these data were used to calculate PM1 particle mass concentrations from the FMPS-derived total particle volume concentration (VFMPS), assuming spherical particles and an average particle density of 1.53 g cm−3 calculated using the mass concentrations of AMS species and BC (ρAMS+BC). The calculated PM1 particle mass concentrations were corrected for under-measurement in the upper size range of the FMPS (> 130 nm; Levin et al., 2015) by scaling them with a factor of Fcorr=1.85, which was derived from comparison with size distribution data from a concurrently measuring optical particle counter (OPC; Grimm model 1.109):
While VFMPS represents actually measured data for each plume event, Fcorr and ρAMS+BC are the average correction factor for the under-measurement in the upper FMPS channels and the average particle density, determined from AMS and BC measurements for the whole field campaign. The overall uncertainty in the resulting PM1 concentrations is estimated to be 35 %. The main modes of the number size distributions were found to be exclusively in the lower size range (< 130 nm; see Sect. 3.2) and were therefore not affected by the under-measurement in the larger size bins.
Gas-phase measurements. CO and CO2 concentrations were detected by means of a cavity ring-down spectrometer (CRDS) calibrated with cylinders bracketing ambient concentrations and traceable to World Meteorological Organization (WMO) standards. An iodide chemical ionisation quadrupole mass spectrometer (iodide CI-QMS) was used to measure SO2 concentrations (Eger et al., 2019). An ozone monitor was used to detect O3 concentrations based on light absorption at 254 nm, and a formaldehyde monitor was used to detect HCHO concentrations based on the Hantzsch reaction (Nash, 1953). NO and NO2 concentrations were measured with a two-channel chemiluminescence detector (CLD, modified version of the commercial instrument; see Table 1). NOx mixing ratios were detected by a two-channel thermal dissociation CRDS (TD-CRDS) which is a modified version of the instrument described by Thieser et al. (2016). Some of the gas-phase data, especially those of the nitrogen oxides, show periodic gaps of a 1 to 2 min duration due to periodic background measurements or calibrations. These affected in some cases the detected ship emission events. If possible, the affected events were reconstructed using the remaining parts of the time series by either linear or Gaussian fits, depending on the expected shape of the missing part of the peak.
Auxiliary data. A shipborne automatic weather station provided meteorological quantities (ambient temperature T, atmospheric pressure p, wind speed, wind direction, and RH) as well as via GPS the geographic location of the research vessel. A CCD spectral radiometer provided the photolysis rate constants JO1D (Meusel et al., 2016).
2.3 Identification and determination of ship emission plumes, their sources, and their ages
Since ships are point sources of pollutant emissions and usually the closest sources on the open sea, transient concentration peaks of a few minutes' duration in the AQABA dataset were considered to be potential ship emission events. The AQABA dataset contains a total of 815 of these potential single ship emission events for which the measurement locations (latitude and longitude) and measurement times were determined referring in each case to the event maximum. Using these data, commercially available historical AIS data were requested from MarineTraffic (MarineTraffic, 2019) in order to try to identify the vessels that caused the emission events (see Fig. 2). For this purpose, data on all vessels were requested which were in a 40 km×40 km area around the measurement location during a time frame of ±15 min around the peak observation time. Two AIS records were requested for each of these vessels, the first one complying with the time and location restrictions and as close as possible to the measurement time and the second “previous” one being recorded at least 20 min beforehand. The second AIS record was included to check the consistency of a vessel's track within the box determined by its velocity and course (i.e. all of the following calculations were performed for both AIS records of each ship candidate, and the end results were compared). Besides that, a previous vessel position might be closer to the sought emission time as the emission of a plume occurs earlier than its detection. The requested AIS records included the following information: vessel identification number (Maritime Mobile Service Identity, MMSI) and date and time, as well as vessel position, speed, and course. From the MMSI numbers of identified ships, vessel parameters like vessel name, type, gross tonnage (GT, a dimensionless measure for the vessel size), and engine power were obtained from the databases of MarineTraffic (MarineTraffic, 2019), FleetMon (FleetMon, 2019), and Equasis (Equasis, 2019).
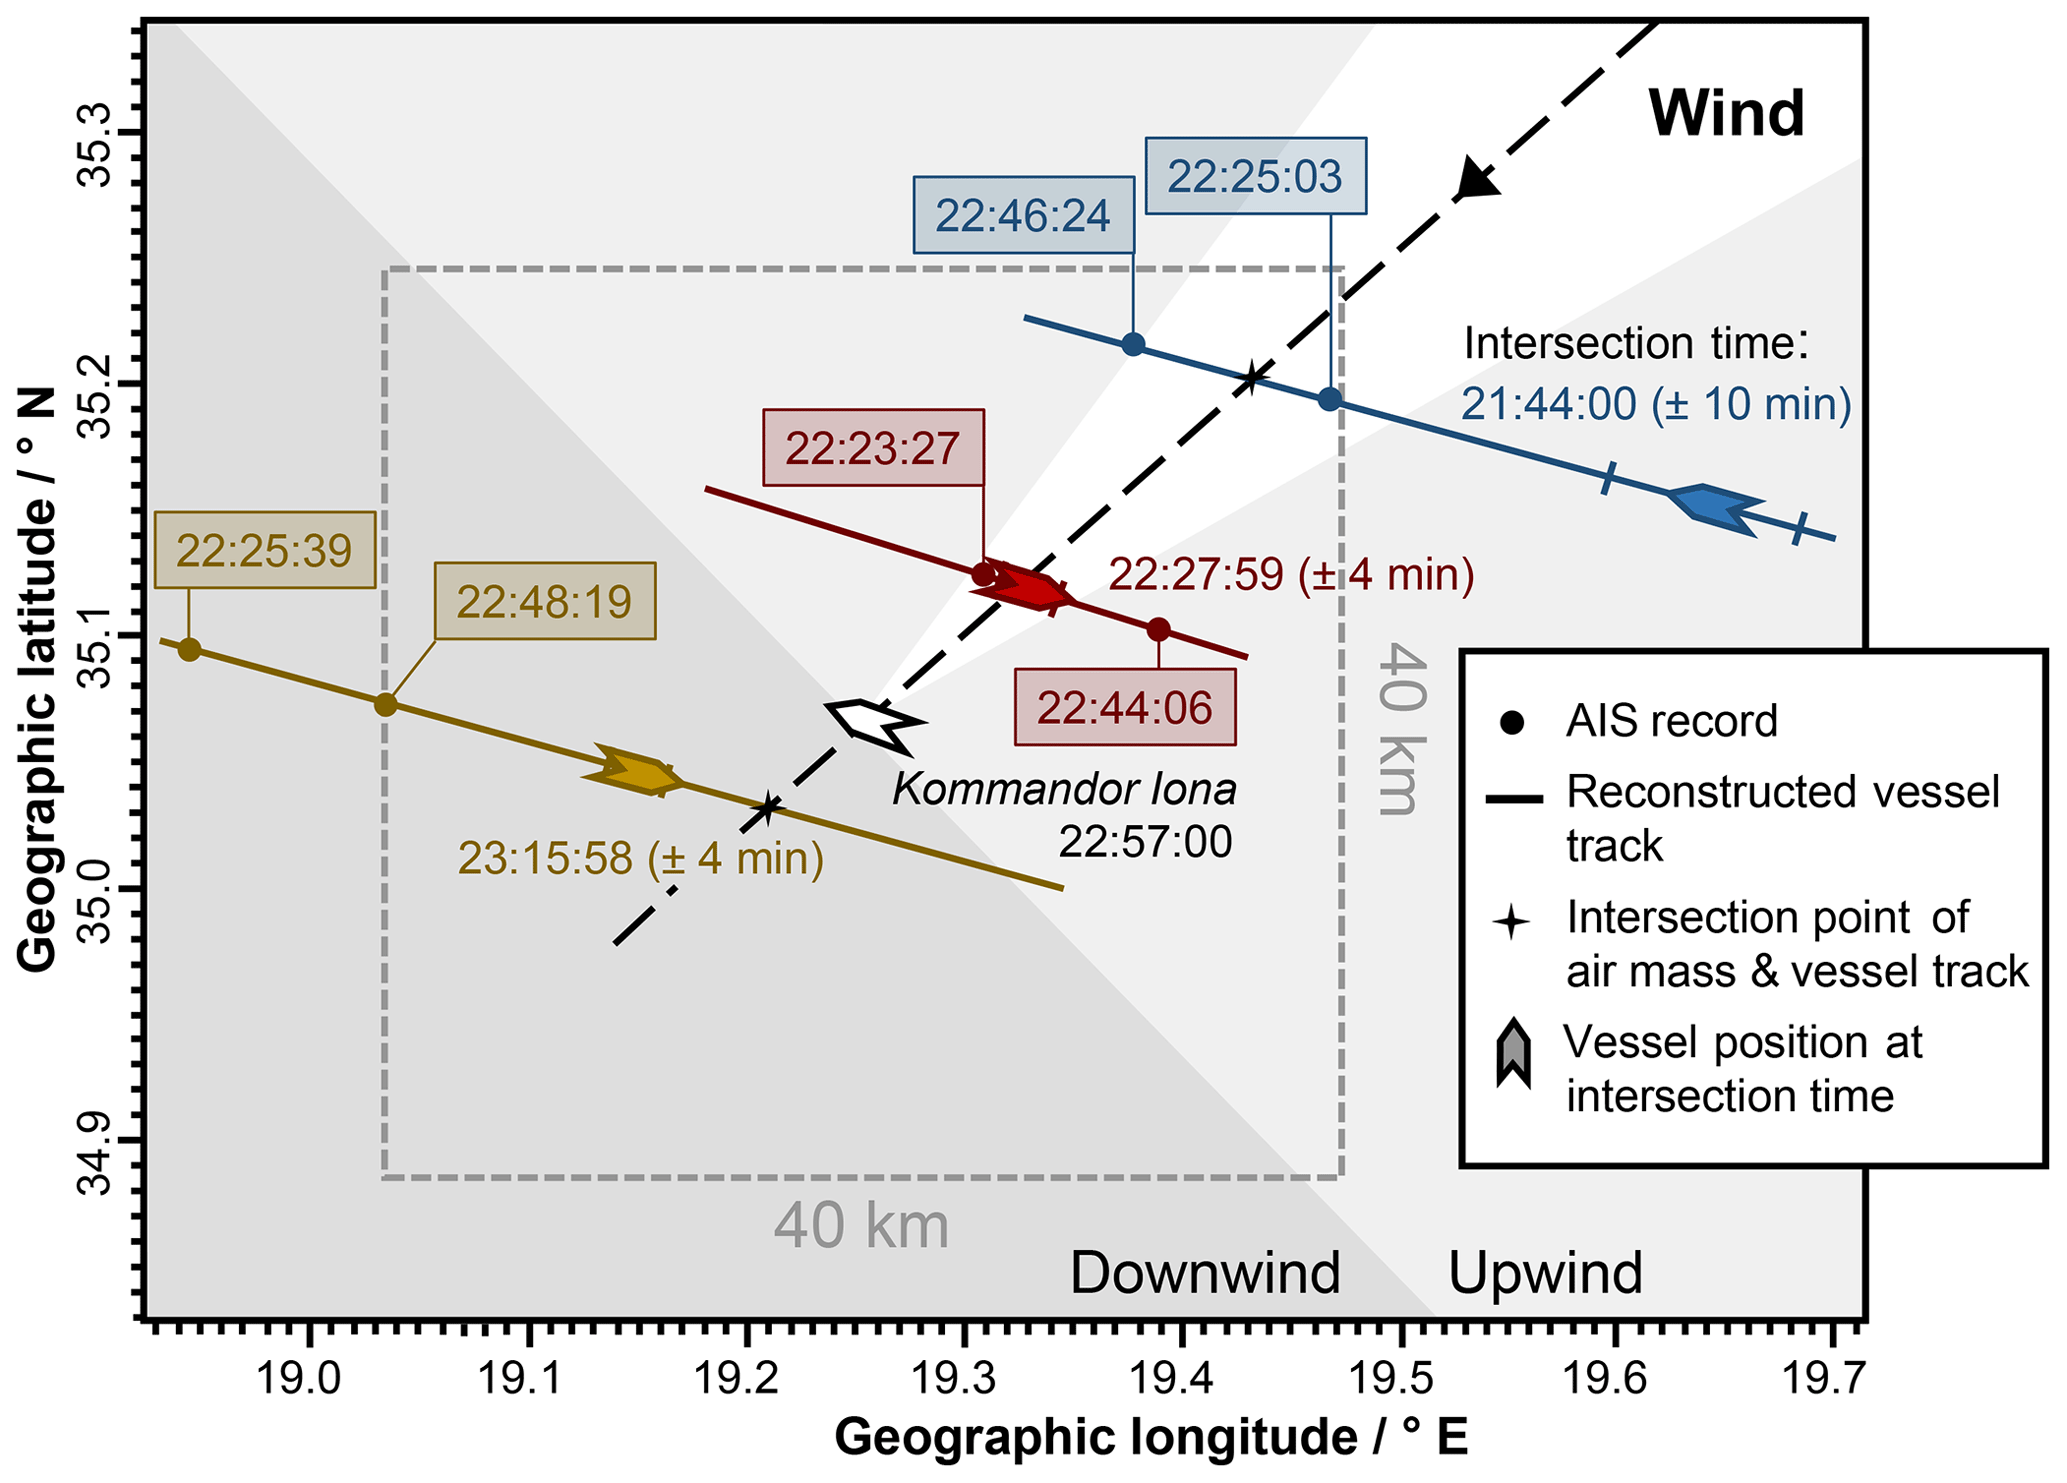
Figure 2Illustration of the method for the identification of ship emission plumes based on an example event. Vessels to be taken into account had to be in a 40 km×40 km area around the measurement location during a time interval of 30 min considering the plume measurement time as the interval centre. Two AIS records (positions indicated by dots on the vessel tracks) were requested after the AQABA field campaign from the AIS database for each of these vessels, the first one complying with the specified area and time restrictions and the second previous one recorded at least 20 min before the first one. Presented are the results of the calculations based on the measurement time and location, the average wind data, their uncertainties, and the available AIS records. The areas downwind (dark grey) and upwind (light grey) of the measurement location refer to the average wind direction (dashed line; uncertainty is indicated by the white area). The uncertainties in the intersection times and in the corresponding vessel positions (ship markers on the vessel tracks) are based on the uncertainties in the wind speed. In this specific case, the vessel Cape Flamingo (red) was identified as the emission source.
For 648 of the 815 potential ship emission plumes, a total of about 20 000 AIS records were available according to the restrictions. The identification of the vessel corresponding to a potential ship emission event by using these AIS vessel data was carried out with the aid of a self-developed software tool, which performed all routine calculations (see Supplement, Sect. S1) to reduce the manual effort and avoid routine calculation errors.
In a first step, average wind data were calculated for each event using the meteorological quantities recorded on-board the Kommandor Iona. An averaging interval of 5 min was applied for the analysis. Additionally, averaging intervals of 3 and 10 min were used for checking the consistency of results for the below-described calculations; in cases of inconsistent average wind data and therefore inconsistent results the potential ship emission event was not further analysed. The average wind speed was given by the arithmetic mean, and the average wind direction was calculated according to directional statistics (Eq. S1 in the Supplement; Mardia and Jupp, 2000). As the raw data points of both the wind speed and direction were considered as error-free, the uncertainty in the average wind speed was given by the standard deviation and the uncertainty in the average wind direction through Gaussian error propagation of Eq. (S1).
In a next step, the position where the track of the probed air mass (assumed to have arrived from the average wind direction) intersects the (past or future) track of the vessel candidate (see Fig. 2) was calculated by means of trigonometric navigational equations (Veness, 2019; Tseng and Chang, 2014; Eqs. S2 to S12). For this purpose, Earth was approximated as a sphere and the air mass and the potential source vessel were assumed to move on great circles (see Fig. S1 in the Supplement). The right intersection point (out of the two possible) of these two great circles is the one closer to the measurement location.
With this potential emission site (the intersection point calculated as above) the distances to the measurement location and to the record position of the considered AIS data point were calculated by means of the haversine formula (Eq. S13; Veness, 2019). Using these distances, the wind and vessel speed, the measurement time, and the record time of the AIS data point, the times were calculated when the air mass and the vessel candidate were at the intersection point. The time when the air mass was at the intersection point has an uncertainty (calculated via Gaussian error propagation) which is mainly due to the uncertainty in the wind speed. The main uncertainty associated with the time when the vessel was at the intersection point is related to the uncertainty in the wind direction and is given by the time required for the vessel to pass the calculated wind sector (wind direction ± uncertainty, white area in Fig. 2). In the case that both time intervals (for air mass and vessel at the intersection point) overlap, the candidate vessel was identified as the source of an emission event and the determination of the age and travel distance of the ship's emission plume was possible. Exceptional cases, namely the case of a stationary vessel (e.g. at anchor), the case of a ship course that was (anti-)parallel to the wind direction, and the case of wind velocities close to zero, were taken into consideration (see Supplement for details). Individual uncertainties in both the ages and the transport distances of ship emission plumes were estimated from the uncertainties described above and the discrepancy between the results of these calculations for the two AIS records of the identified ship. In general, smaller uncertainties were found in the transport distance (on average 16 %) than in the age (on average 20 %) as the distance was fixed by the vessel track in one direction, whereas the variability in the wind speed affects directly the uncertainty in the determined age of a ship emission plume.
Out of the initially 815 potential ship emission events, it was possible to determine the source vessel for 252 ship emission events (see Fig. 1); 156 of these were sampled during daylight hours and 96 during nighttime hours. There are several reasons for unsuccessful ship identifications: the identification of more than one vessel as a potential source in areas with high vessel density, the lack of AIS data on vessels (e.g. in areas where only satellite AIS data with a low time resolution are available, because vessels had turned off their AIS signal due to piracy, or because of missing MMSI numbers in the case of, for example, small fishing vessels), or other nearby emission sources (e.g. coastal industrial plants, offshore oil rigs). The identified ship emission plumes had an age between 1 and 115 min and were transported from less than 1 up to 38 km (see Fig. S3); the most frequently encountered plumes had an age of about 20 min and were transported about 4 km. Of the identified ships, 22 % were oil tankers (world fleet 11 %), 14 % bulk carriers (world fleet 12 %), 19 % container vessels (world fleet 5 %), 8 % general cargo vessels (world fleet 21 %), and 37 % other types of vessels (world fleet 51 %; data for world fleet from UNCTAD, 2019). Due to regional economic conditions, especially oil tankers and container vessels were observed more frequently compared to the world fleet, whereas small vessels falling into the category of other types of vessels were found less frequently probably because of missing AIS identification.
2.4 Quantification of plume characteristics
The quantification of characteristics of ship emission plumes was performed using a software tool that was written to perform all calculations, reducing the manual effort and the risk of mistakes.
The average excess (above atmospheric background) concentrations of the particle number and mass as well as of the species listed in Table 1 were calculated for the 252 ship emission events that were identified. For each ship emission event, two background intervals, one before and one after the event, and one interval including the event itself were defined (see Fig. S4 for a graphical illustration), with interval limits set as close as possible to the event and with approximately equal interval lengths. This was achieved by comparing the event in each variable's time series to the event in the time series of the PNC, which is the most complete and significant one regarding the identified ship emission events. Accordingly, the intervals have the same width for each measured quantity of an emission event but differ in adjustments due to minor time shifts. The mean background was calculated from the average values derived for the two background intervals and subtracted from the average event concentration to obtain the average excess concentration in the plume. Periodic fluctuations in the measured BC concentration and data gaps during a ship emission event were taken into account as described in Sect. 2.2. In general, calculated average excess concentrations below the detection limit (LOD , with σbg being the standard deviation of the background and n the number of measurement points within the ship emission event interval) were excluded from further analysis.
The average excess concentration of a species or the particle number or mass concentration in an expanding ship emission plume changes with time in the first place due to dilution (Petzold et al., 2008; Kim et al., 2009). Emission factors that are independent of the dilution were calculated following Eq. (2) (Diesch et al., 2013):
where x is the excess quantity of a gas- or particle-phase species, is the carbon mass fraction in CO2 and wC = 0.865 kg C (kg fuel)−1 (Diesch et al., 2013) is the mass fraction of carbon in marine diesel fuel. EFx is given in grams or number per kilogram of burned fuel; [x] is in micrograms per cubic metre in the case of mass concentrations (NOx is given as NO2) and in 1012 # per cubic centimetre in the case of number concentrations, and [CO2] is in milligrams per cubic metre. Here, it is assumed that both x and CO2 experience dilution in the same way and that the concentration of chemically inert CO2 in an expanding ship emission plume is affected exclusively by plume dilution, so it remains proportional to the amount of burned fuel (Corbett et al., 1999). Furthermore, it is assumed that fuel carbon is completely emitted as CO2 (CO2 balance method), i.e. that the fraction of other carbon species like CO, CH4, volatile organic compounds (VOCs), and particulate carbon in a ship emission plume is negligible compared to CO2. The amount of x is related in the EF to the amount of burned fuel via the mass fraction of carbon in marine diesel fuel (Diesch et al., 2013; Sinha et al., 2003). Strictly speaking, emission factors should refer to the time of emission, which is possible only in cases of conservative plume characteristics that do not change during plume expansion in the atmosphere (Petzold et al., 2008). In this study, emission factors are also used for the investigation of atmospheric processes (except plume dilution) and ageing, which results in apparent emission factors at the point of measurement.
Based on the exponential decrease in the average excess concentration of CO2 during the expansion of the ship emission plumes, an average plume dispersion time constant (i.e. the e-folding time) of 70±15 min was determined (see Fig. S5 for [CO2](t)). From the decrease in excess CO2 concentration during transport, it takes on average 260±60 min to reach the detection limit of the excess CO2 concentration, i.e. the time required for the plume to become indistinguishable from the background. Chen et al. (2005) report that plume dispersion results in a ship's emission event older than 3 h being indistinguishable from the background level, in good agreement with our findings. According to Petzold et al. (2008) it takes less than 24 h until a ship emission plume is completely mixed with the marine boundary layer (MBL).
Average particle number size distributions of ship emission plumes were calculated proceeding in the same way as average excess concentrations were calculated and using the same background and ship emission event intervals as used for the PNC. From log-normal fits to the resulting excess particle number size distributions, in each case the count median diameter (CMD), the geometric standard deviation (GSD), and the width of the distribution, referring to 1 geometric standard deviation, were obtained. The determination of the width followed Eq. (3) (Hinds, 1999):
We define here the expression “potential photochemical processing” of the ship emission plume as the product of the average measured photolysis rate JO1D during the plume transport and the plume age t (→JO1D ⋅t) in Hertz times seconds, which is used as a proxy for potential photochemical processing of plume components in the atmosphere. The relative uncertainty in this quantity is on average 27 % considering the average relative uncertainty in the plume age and the relative measurement uncertainty in JO1D. Measured OH concentrations were not used as a measure of photochemical processing due to insufficient data coverage and because they are more affected by local influences than the photolysis rate and therefore, more so than the latter, describe merely the situation at the research vessel's position rather than within the plume. A better measure for photochemical processing would be the modelled OH concentrations along the plume transport path. However, this modelling is well beyond the scope of this work.
Using the measured mass concentrations of particulate organics ([organics]) and the atomic O ∕ C and H ∕ C ratios for the organic aerosol during plume and background measurements, the O ∕ C ratios for the plume contribution were calculated (Eq. 6) from the average mass concentrations of oxygen and carbon for both the background (B) and for the ship emission event (emission + background, EB). The mass concentrations of O and C were calculated from the mass fraction of oxygen and carbon in the organic aerosol, determined from the measured atomic O ∕ C and H ∕ C ratios, following Eqs. (4) and (5):
where mx is the (measured) total mass and Mx the atomic weight of the respective species x. For these calculations we assume that particulate organics consist only of oxygen, hydrogen, and carbon. To check for consistency, the H ∕ C ratio was calculated analogously and found to always show the expected reverse behaviour of the O ∕ C ratio.
The fuel sulfur content (wt % fuel S) was calculated according to Diesch et al. (2013) by using the EFs of SO2 and and assuming that the fraction of other sulfur species like SO3 and gas-phase H2SO4 is negligible in the ship emission plumes.
The modified combustion efficiency was calculated based on the approximation that the fraction of carbon species like CH4, VOCs, and particulate carbon in a ship emission plume is negligible compared to CO2, so the modified combustion efficiency is given by the ratio of the average excess CO2 concentration to the sum of the average excess concentrations of CO2 and CO (Ward and Radke, 1993).
Frequency distributions of all calculated quantities are given in Fig. S6.
Table 2Correlations and corresponding fit parameters and correlation coefficients (Pearson's R) referring to dependencies in ship emission plumes presented in Figs. 3 to 10. N: number of available raw (not binned) data points.
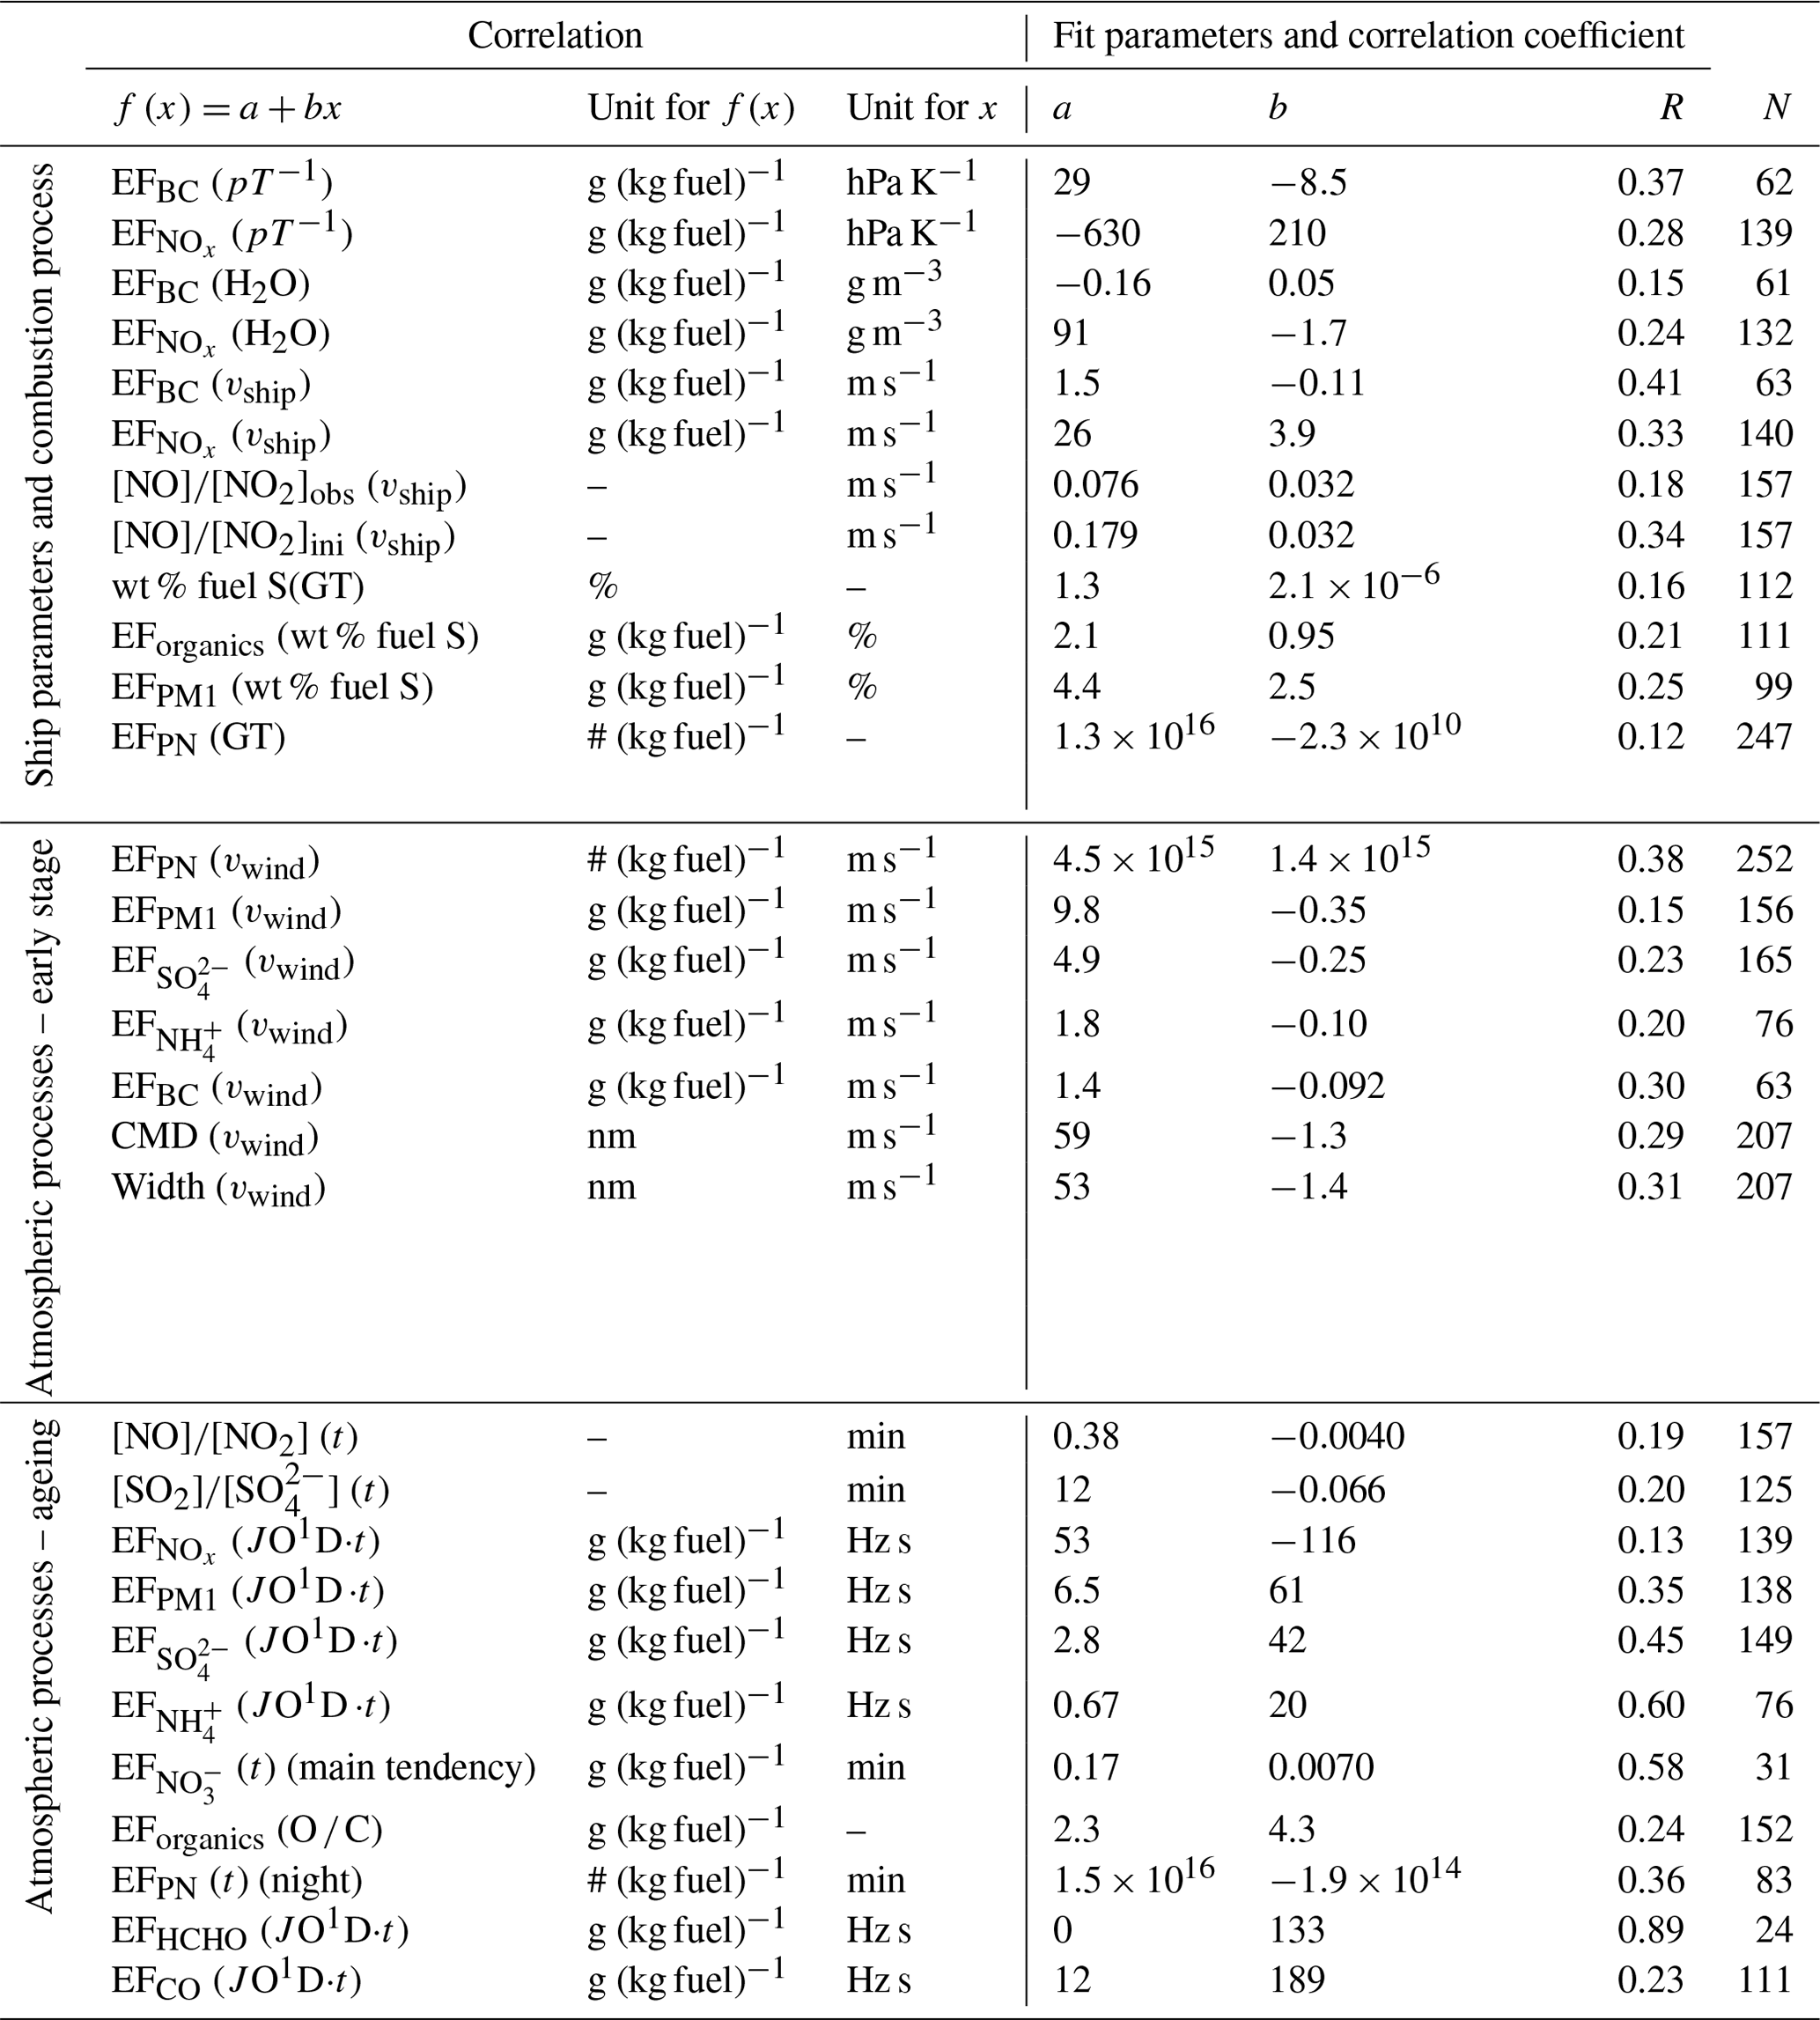
Parallel measurements of multiple variables which are associated with ship emission plumes and observation of such plumes under very different conditions (e.g. plume age, meteorological conditions, source vessel characteristics) allow for the investigation of factors which might influence the characteristics of ship emission plumes. For this purpose, we investigated the relationship between plume characteristics and various factors (above-mentioned measurement conditions) by correlation analysis, which, contrary to Lagrangian measurements of individual ship plumes during transport away from the source, provide ensemble-averaged information on emission or transformation characteristics of plume properties. As several different factors can influence individual plume characteristics, the correlation plots always show a relatively strong degree of scatter, which led us to bin them, such that the same number of data points (at least 5 and a maximum of 32) was included in each bin, resulting in non-equidistantly distributed bins. The slope and intercept did not significantly change when using binned data instead of raw data. Therefore, fit parameters for the correlation of raw data are presented in Table 2, while in the figures usually the binned data are shown for clarity. In the cases where raw data are presented their relative uncertainties combine the estimated quantification (Sect. 2.4) and measurement uncertainties, whereas in the cases of binned data, error bars include in addition 1 standard deviation of the data distributions in each bin. Using bin-averaged data or linear regressions strongly reduces the influence of additional influencing factors on the individual data points and, to a large degree, provides information on the dependence of the respective plume feature on the influencing factor under investigation. To extract the influence of several influencing external factors on plume characteristics, separate correlation plots for each of these factors were generated.
In the following sections we first discuss the influences of ship-related properties on the emission characteristics before we present the influences of the early stage of expansion and of chemical processing during transport. Finally, we use averages of emission factors for comparison with data from the literature.

Figure 3Influences of combustion conditions on ship emission plumes. The dependencies of the NOx and BC emission factors on the ratio between atmospheric pressure and ambient temperature (a) and on ambient water vapour concentration (b) are demonstrated. Additionally, the dependencies of the NOx and BC emission factors as well as of the NO to NO2 ratio of average excess concentrations on the vessel speed are presented (c). The correlations between the NOx and BC emission factors and the vessel gross tonnage are shown (d). Error bars present the combination of estimated quantification and measurement uncertainties and 1 standard deviation of the data distributions in each bin. The corresponding fit parameters and correlation coefficients are listed in Table 2.
3.1 Influences of ship properties and the combustion process on ship emission plumes
Influence of combustion conditions. The ship emission plumes of the AQABA dataset enabled us to extract information regarding the influence of combustion conditions. In general, more efficient fuel combustion results in increased NOx (especially NO) emissions owing to the enhanced oxidation of atmospheric nitrogen that occurs at higher combustion temperatures. It also leads to decreased soot particle (here BC) emissions as a consequence of more efficient oxidation of fuel carbon (Corbett et al., 1999; Juwono et al., 2013; Pokhrel and Lee, 2015). The fuel combustion efficiency depends primarily on the oxygen-to-fuel mixing ratio in the combustion chamber (Khalid, 2013), but increased ambient temperature and absolute humidity as well as reduced ambient pressure can also result in deteriorated combustion efficiencies of diesel engines, associated with elevated soot and reduced NOx emissions (Bermudez et al., 2017; Chang et al., 2017; Rajewski, 2018). Even though the use of turbochargers and intercoolers in marine diesel engines should minimise the influence of ambient conditions on the combustion process, we found indications of combustion efficiency dependence on such variables. With increasing ambient pressure p and decreasing temperature T, as well as for an increase in the p ∕ T ratio (Fig. 3a), a reduction of the BC emission factor by more than a factor of 2 over the range of observations and a general increase in the NOx emission factor were observed; both are indications of improved combustion efficiency (see below). Likewise, deteriorated combustion efficiency with increasing ambient absolute humidity is suggested by the observed dependencies of the BC and NOx emission factors on ambient water vapour concentration (Fig. 3b).
Another important parameter for combustion efficiency is the combustion temperature: with increasing combustion temperature, combustion is more efficient, but more nitrogen oxides are produced. Furthermore, reduced oxidation of NO to NO2 in the oxygen-deficient exhaust gas, which occurs after efficient combustion in the propulsion system, results in an increase in the NO to NO2 ratio with increasing combustion efficiency (Rößler et al., 2017). According to the literature, a higher vessel speed, engine load, or engine power causes a higher peak combustion temperature in the engine system and thus more efficient fuel combustion (Cappa et al., 2014; Sinha et al., 2003). In agreement with this, we find a 3-fold increase in the measured NO to NO2 ratio and an almost 3-fold increase in the NOx emission factor over the range of observed vessel speeds from 0 to ∼10 m s−1 (see Fig. 3c). Here, it must be noted that other external parameters also influence the NO to NO2 ratio, like atmospheric processing during plume transport as shown in Sect. 3.3 and Fig. 7a. To account for this ageing effect, we calculated initial NO to NO2 ratios for each ship emission plume (i.e. the ratio that would have been observed close to the point of emission), using the respective plume age and the plume age dependence of the NO to NO2 ratio as provided in Table 2. The resulting dependence of the NO to NO2 ratio on the vessel speed, taken from the correlation plots (Figs. 7a and S13) is provided in Table 2 for both the observed ratios ([NO] ∕ [NO2]obs) and the calculated initial ratios ([NO] ∕ [NO2]ini). The slopes of both regressions are identical, showing that additional influences on this ratio largely average out when binning the data or calculating the linear fits.
As a consequence of improved combustion, the BC emission factor also decreased to a degree similar to that of the NO to NO2 ratio, acquiring at a vessel speed of 10 m s−1 about one-third of the value at 0 m s−1. On-board electric power is usually generated by an auxiliary engine, which results in emissions from stationary vessels (vship∼0 m s−1; Pokhrel and Lee, 2015; Williams et al., 2009). For very slow vessels, the relative contribution of this auxiliary engine to the overall emissions becomes especially significant.
While a similar dependence of the NOx emission factor on the engine power was observed (presented in Fig. S7), the dependence of combustion-efficiency-related EFs on ship size (gross tonnage) is more complex. While for small ships the combustion efficiency seems to increase (increasing NOx EF, decreasing BC EF) with increasing gross tonnage, which was also observed by Diesch et al. (2013) and Williams et al. (2009), a plateau is reached at about a gross tonnage of 50 000, and for very large vessels (GT > 150 000) the combustion efficiency seems to deteriorate again without any obvious reason for doing so (see Fig. 3d). For vessels in the optimum size range, the better combustion efficiency, compared to the very small ships, results in about 50 % lower BC emissions and more than doubled NOx emissions per kilogram of burned fuel.

Figure 4Influences of fuel quality on ship emission plumes. The correlation between the weight percentage of fuel sulfur and the ships' gross tonnage (a) and the dependencies of the particulate organic as well as the PM1 emission factors on the weight percentage of fuel sulfur (b) are shown. The fit parameters and correlation coefficients are listed in Table 2.
Influence of fuel quality. The influences of fuel quality on ship emission plumes were investigated with regard to fuel sulfur content. Diesel fuel used for shipping is in general a blend of refined fuel and residual oil (Mohd Noor et al., 2018). For economic reasons, large ocean-going vessels often burn cheap heavy fuel oil (HFO) that is highly contaminated with sulfur, ash, asphaltenes, and metals (Corbett et al., 1999; Buffaloe et al., 2014). High-quality but expensive marine gas oil (MGO) and marine diesel oil (MDO) are usually only used for the operation of small vessels and vessels operating in ECAs or in coastal areas (Buffaloe et al., 2014; Cappa et al., 2014). Our dataset suggests a general increase in the fuel sulfur content, calculated from the emission factors of SO2 and , with increasing ship size (see Fig. 4a) and therefore more frequent usage of cheap HFO in the larger vessels.
In order to minimise corrosive effects from the high sulfur content in the fuel, ship engine systems are designed to operate at high exhaust flow rates and temperatures, avoiding formation of SO3, condensation of water vapour, and formation of sulfuric acid (Pirjola et al., 2014; Moldanová et al., 2009). Furthermore, lubricating oil serves not only as protection against wear but also as neutraliser for corrosive species like sulfuric acid in the exhaust system. For these reasons, lubricating-oil consumption and as a consequence emissions of organic particulate matter depend on fuel quality (Lack et al., 2009; Juwono et al., 2013; Cappa et al., 2014; Chu-Van et al., 2018). We found almost a doubling of organic aerosol EFs (and of total PM1 EFs) over the range of observed fuel sulfur content from 0.5 wt % to 2.5 wt % (see Fig. 4b), showing the significant indirect influence of fuel sulfur content on ship emission characteristics.
Coagulation in the exhaust system. Generally, coagulation of particles, which reduces particle number concentrations without changing particle mass concentrations, occurs more efficiently at higher particle number concentration levels. Longer residence times within the exhaust system, as typically occurs in larger ships, should therefore result in lower particle number concentrations due to enhanced coagulation effects. In agreement with this, we observe a reduction in the particle number EF with increasing ship size (see Fig. 5), similar to the observations by Diesch et al. (2013). Additional influences on the particle number EF are caused by coagulation in ambient air, either during plume emission from the stack (Sect. 3.2, Fig. 6b) or during plume transport (Sect. 3.3, Fig. 9c). In the correlation shown in Fig. 5, these influences are largely averaged out by using binned data.
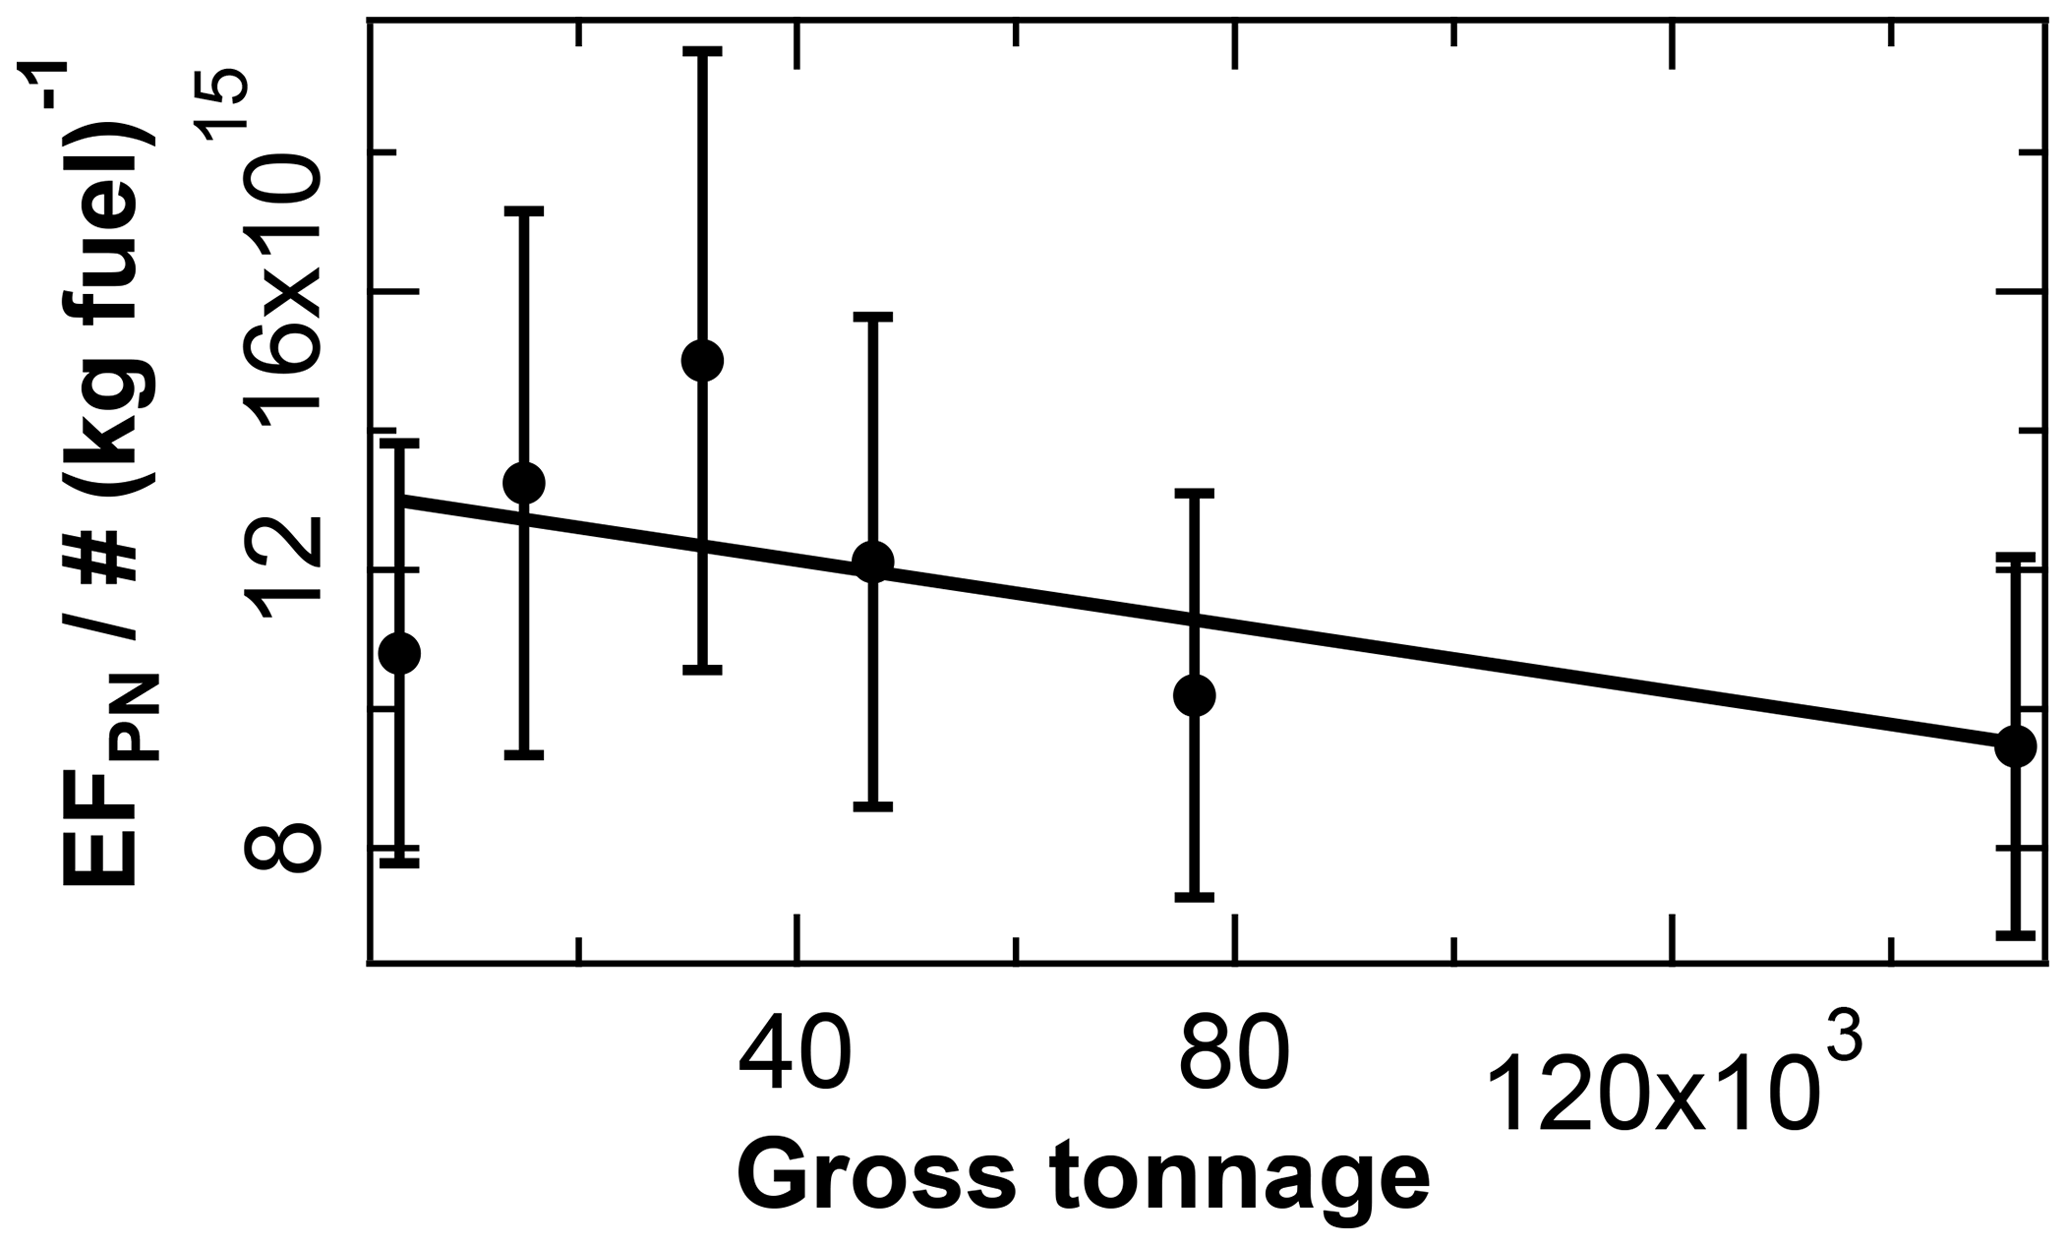
Figure 5Influence of the exhaust system's size (in terms of gross tonnage) on ship emission plumes. The particle number EF is plotted versus the gross tonnage of the ship. The fit parameters and correlation coefficient are listed in Table 2.
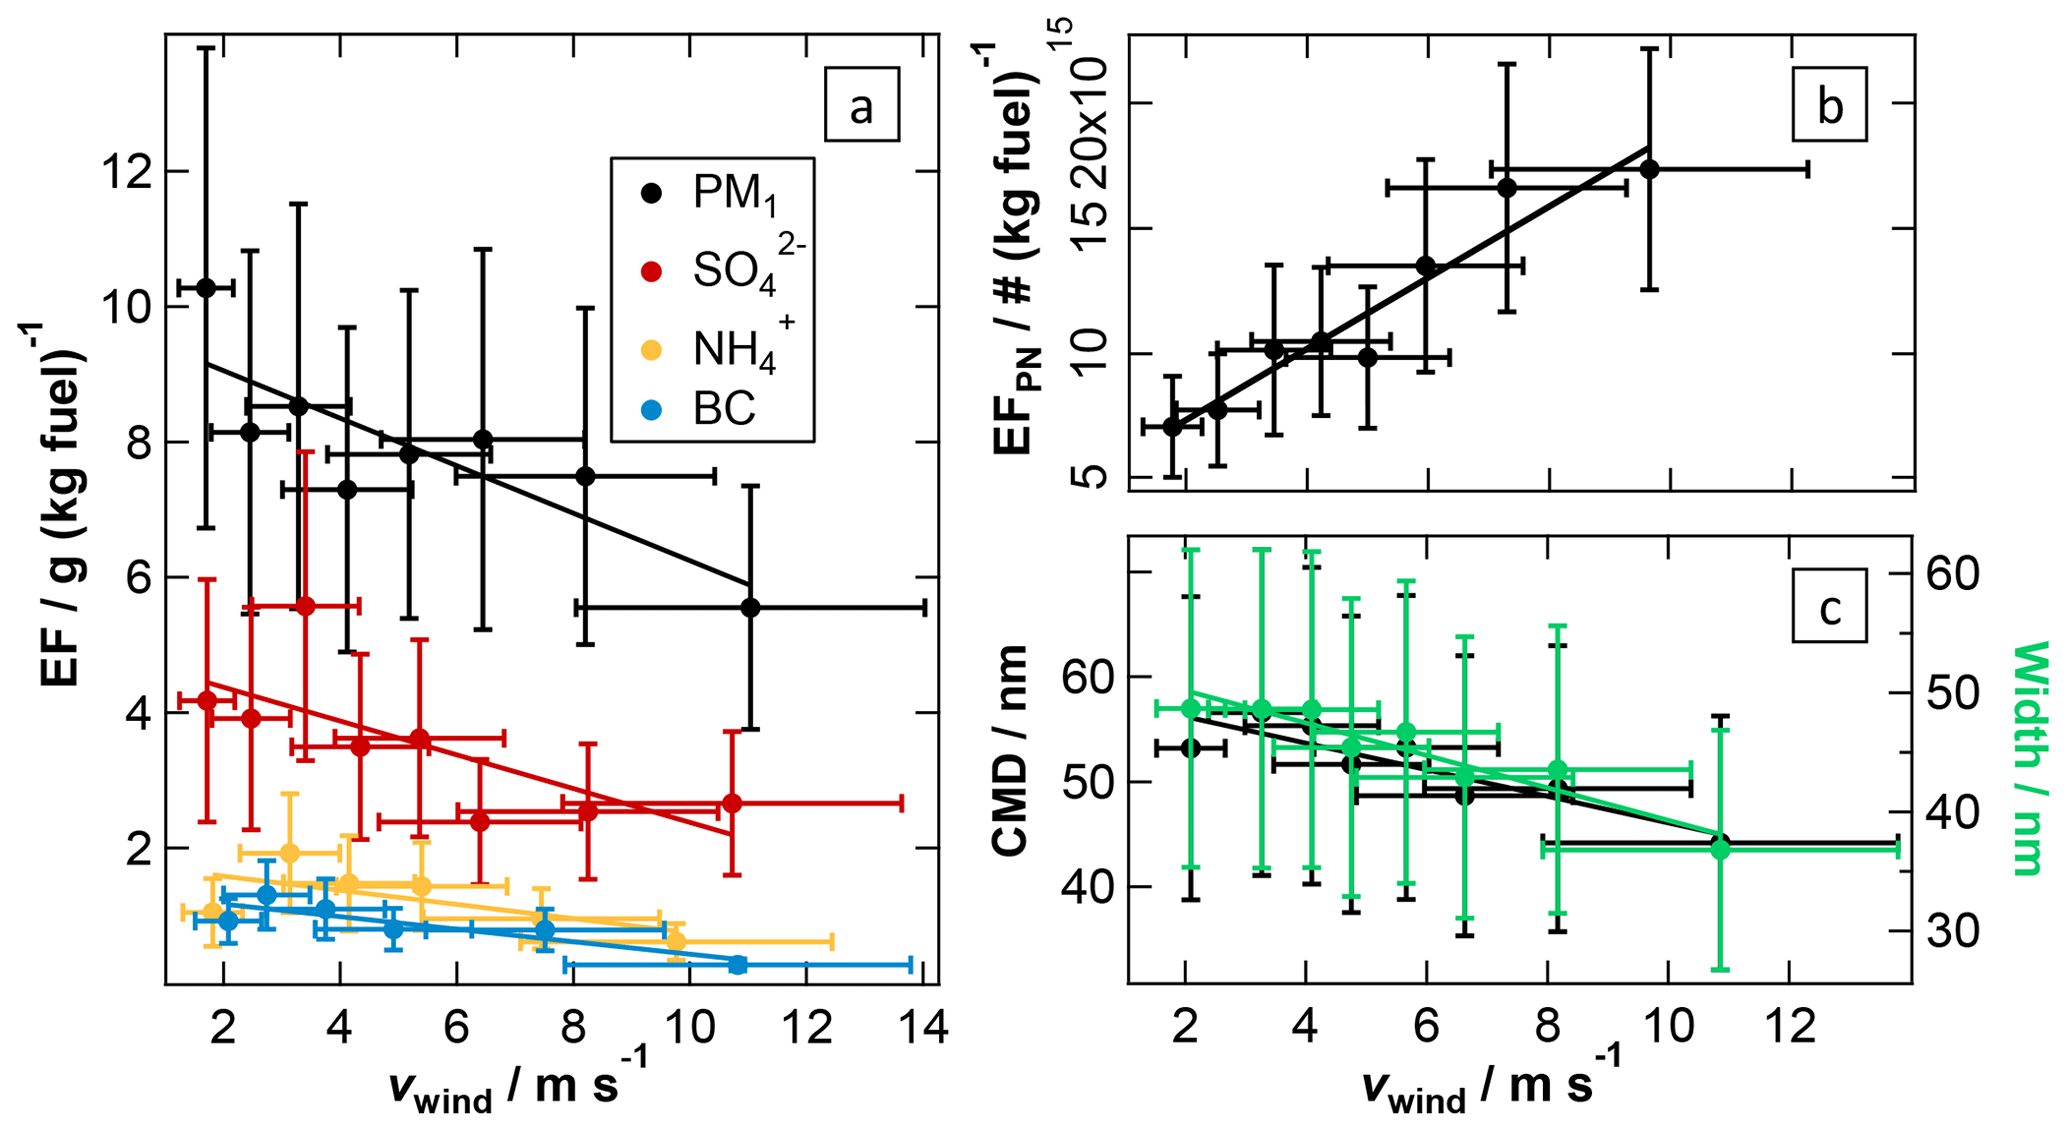
Figure 6Effect of dilution during the early stage of plume release on ship emission plumes. PM1, , , BC (a) and particle number emission factors (b) as well as the CMD and width of the particle number size distribution (c) are plotted versus the wind speed. The fit parameters and correlation coefficients are listed in Table 2.
3.2 Influences during the early stage of expansion of ship emission plumes
Effect of wind speed. As previously mentioned, coagulation reduces the particle number concentration more efficiently when the latter is high. This is especially the case during transport of exhaust within the exhaust system of the ships. Emission into ambient air causes a sudden dilution of the exhaust, which quickly quenches coagulation. However, even for a given particle number concentration at the location of emission, the level of further coagulation depends on the concentration level in the transported plume, which is expected to depend on the ambient wind speed, as it influences the degree of dilution in this phase of emission. In addition, lower concentration levels result in reduced condensation of vapours in the cooled exhaust gas (Hinds, 1999). Both effects can be clearly observed in our ship emission plume data as shown in Fig. 6: with increasing wind speed (stronger dilution) particle mass emission factors are reduced (less condensation) while particle number emission factors strongly increase (less coagulation). Over the range of observed ambient wind speeds from about 2 up to ∼12 m s−1 we observe a reduction of the PM1 emissions per kilogram of burned fuel by about 40 %, which is similarly reflected in the EFs of condensing species like sulfate; due to the neutralisation of sulfuric acid with ambient ammonia (NH3), the ammonium EF shows the same behaviour (see Fig. 6a). However, there is no obvious reason why the EF for BC is also reduced at higher wind speed, indicating that, apart from condensation, another unknown effect might also play a role; potentially reduced apparent BC concentrations due to reduced co-condensed aerosol mass in the Aethalometer might explain parts of this increase. For the particle number emission factor the dilution effect is even more pronounced: over this range of wind speeds the number of particles emitted per unit of fuel increases more than 3-fold (Fig. 6b).
The effect of reduced coagulation and condensation at higher wind speeds is also reflected in the observed particle size distributions: at higher wind speeds the particles in the emission plume are smaller than they are under less windy conditions (see Fig. 6c). Also the width of the particle size distribution is smaller at higher wind speeds and more dominated by the combustion mode particles that, according to Petzold et al. (2008), mainly consist of BC and organic material. Note that in this study we only found apparently monomodal size distributions of particles in the ship emission plumes (see Fig. S8).
3.3 Atmospheric processes during transport of ship emission plumes
Due to the large range of observed plume ages, the ship emission plumes of the AQABA dataset contain information about the influence of atmospheric ageing on plume characteristics. The investigation of atmospheric processing and ageing using EFs and average excess plume concentration ratios is possible as these quantities already account for plume dilution effects. We will mainly focus on gas-to-particle conversion and associated chemical reactions in ship emission plumes during atmospheric ageing.

Figure 7Atmospheric processing of nitrogen and sulfur species in ship emission plumes. The conversion of NO into NO2 (a) as well as the conversion of SO2 into (b) during plume ageing is demonstrated through the development of the average excess-concentration ratios. Additionally, the decrease in NOx and increase in PM1, , and with increasing potential photochemical processing of ship emission plumes (measured and calculated JO1D integrated over the plume transport time) are shown using the development of the apparent emission factors as indicators (c). The fit parameters and correlation coefficients are listed in Table 2.
Nitrogen oxide processing. Atmospheric processing of emitted nitrogen oxides is driven by O3 as well as OH, HO2, and RO2 radicals and affects both the partitioning between NO and NO2 and the conversion of NOx into nitric acid and finally nitrate aerosol.
NO, the major NOx component in ship exhaust systems (ca. 95 %; Song et al., 2003; Williams et al., 2009), depletes ambient O3 and is, as initial NO concentrations in the exhaust are far larger than ambient O3 concentrations, partially converted into NO2 rapidly after emission from the ship stack, causing NO2 fractions on the order of the former ambient O3 in young plumes. Song et al. (2003) modelled the dispersion and chemical evolution of ship emission plumes in the MBL with a Lagrangian plume model, based on defined background photochemical input parameters and estimates for the ship's NOx emissions, and observed a rapid establishment of the NO2 to NOx ratio in ship emission plumes after O3 titration during daylight hours. We observe that the NO to NO2 ratio decreases quickly down to 0.2 (i.e. one-third of the ratio measured in the youngest plume age bin) during the first half hour of atmospheric transport of ship plumes emitted during the daytime. The photochemical equilibrium seems to be established when reaching this ratio, and we do not find a subsequent change in it in the range of transport times covered by this study (up to 115 min, Fig. 7a). The partial recovery of the ozone level over time (see Fig. S9) suggests the presence of reactive organic compounds.
Further oxidation of NO2 in the ageing plume involves hydroxyl radicals as well as ozone. Directly after exhaust release, the OH radical production is strongly suppressed due to the lack of precursors (e.g. ozone) and increases (during daylight hours) in the ageing plume with the recovery of O3 and mixing of MBL air into the plume. In addition, during the first stages of plume ageing, depending on local NOx concentration and therefore on the dilution of the ship exhaust, the much more abundant HO2 radical is converted increasingly into OH without consuming O3 (Reaction R1) so that the OH radical concentration in the plume is enhanced (Song et al., 2003).
Besides that, the concentration of N2O5, present essentially only at nighttime, increases with increasing NOx concentration in the ship emission plume (Song et al., 2003).
These two effects cause the lifetime of NOx in ageing ship emission plumes to be shortened compared to processes in the surrounding MBL during the day (Reaction R2) and night (Reactions R3 to R5; Chen et al., 2005; Song et al., 2003). As a consequence of these processes, NOx is increasingly consumed as the plume ages. We found a removal of almost half of the nitrogen oxides from the emission plume within the observed range of short-wavelength UV radiation exposures (potential photochemical processing; see Fig. 7c); at the same time nitric acid and – depending on partitioning between gas and particle phase – nitrate-containing aerosol are produced (see Fig. S10). Regarding the emission factor (not differentiated by daytime and nighttime data), most data points follow a correlation with a very low increase in the apparent , with generally very low apparent possibly due to the high ambient temperatures during this study, favouring the partitioning of this species into the gas phase. However, a second branch with a larger slope was found that could not be explained by the available data or information (including ambient temperature, day and night differences, or measurement location).
Oxidation of SO2. As described earlier, diesel engine systems primarily emit fuel sulfur as SO2 so that, in principle, particulate sulfate is not formed until the release of the exhaust into the atmosphere (Pirjola et al., 2014; Moldanová et al., 2009). Following the emission into ambient air, SO2 is oxidised by OH radicals and finally partitions into the particle phase mainly as H2SO4 (see Reactions R6 to R8; Lovejoy et al., 1996), which was concluded in previous studies from the absence of and a significant fraction of sulfate-bound water in the particle phase (Petzold et al., 2008; Pokhrel and Lee, 2015; Schneider et al., 2007).
We found the conversion of SO2 to to be promoted by high water vapour concentration, i.e. absolute humidity (see Fig. S11a), which is consistent with Reaction (R8). Conversion of SO2 into sulfate aerosol was observed to reduce the SO2 to ratio by a factor of 2 within the ageing times covered in this study (see Fig. 7b). This is accompanied by a strong increase in the sulfate EF and, due to neutralisation with ammonia mixed into the plume during atmospheric dilution, by an increase in the ammonium EF. As a consequence, the PM1 EF increases over time (see Fig. 7c). The formation of secondary inorganic aerosol during plume transport therefore doubles the initial PM1 emission from the ships within the covered range of potential photochemical processing (see the next paragraph for the contribution of secondary organic aerosol). No accumulation of SO3 or H2SO4 in the gas phase is expected to occur in the process as the calculated weight percentage of fuel sulfur derived from the EFs of SO2 and does not show a discernable dependency on the plume age (see Fig. S11b); i.e. there is no indication of any missing sulfur.
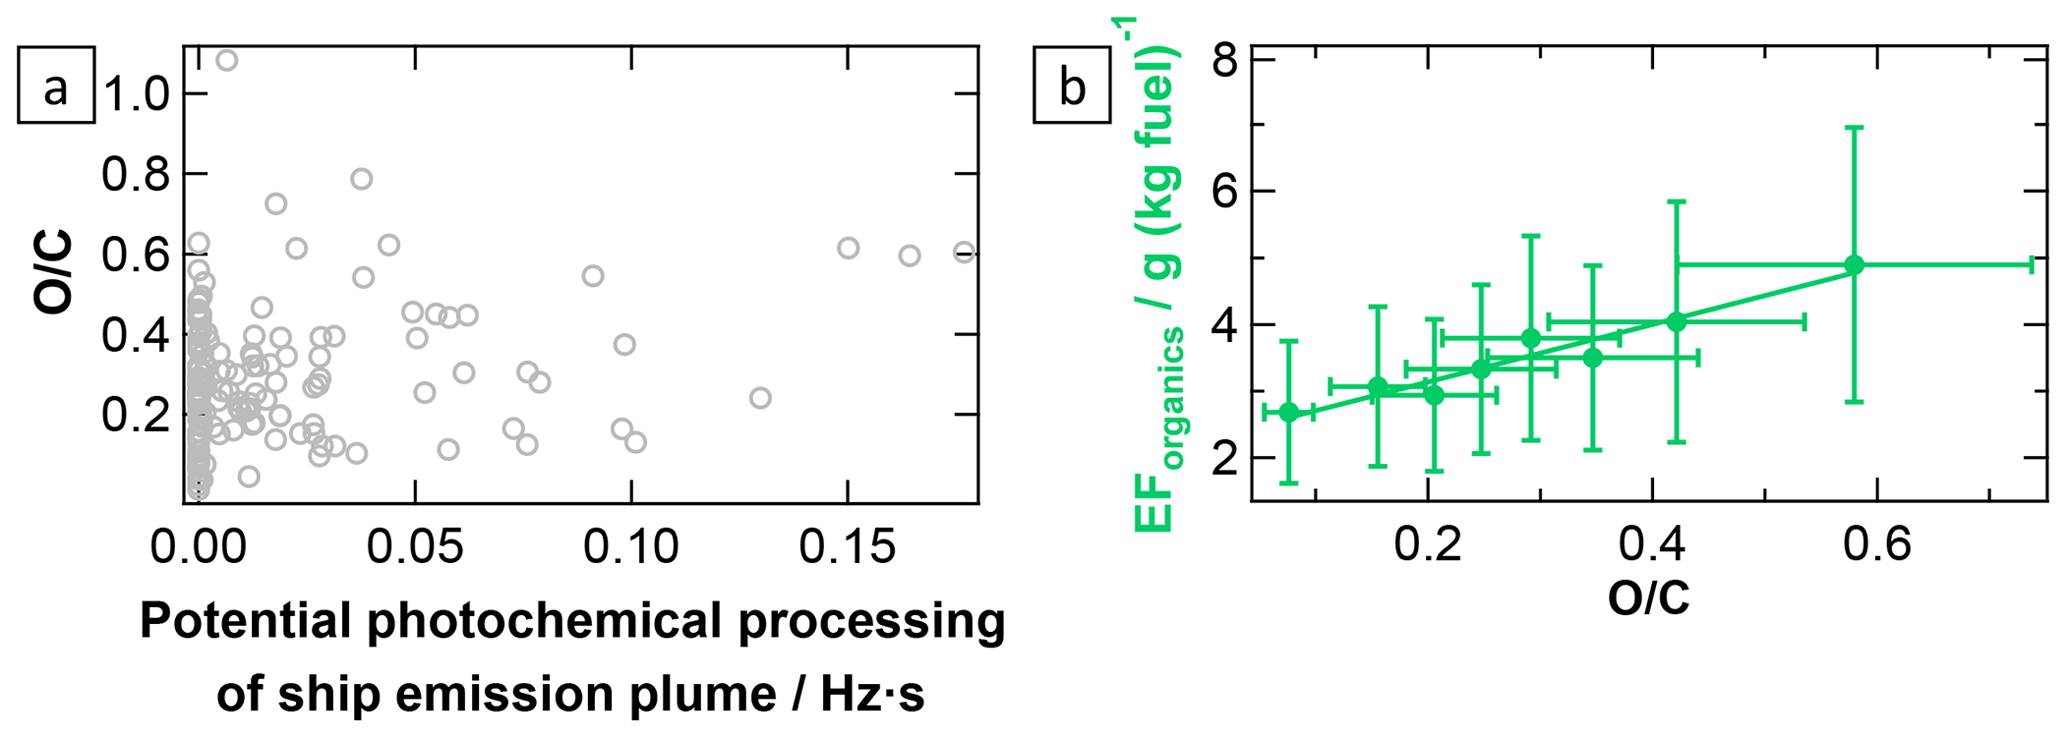
Figure 8Development of particulate organics and their oxidation level during atmospheric ageing of ship emission plumes. The correlation between the O ∕ C ratio (rel. uncertainty (combined rel. quantification and measurement uncertainties): 48 %) and the potential photochemical plume processing (avg. rel. uncertainty: 27 %; measured and calculated JO1D integrated over the plume transport time) (a) as well as the correlation between the apparent emission factor of particulate organics and the O ∕ C ratio (b) are shown. The fit parameters and correlation coefficient are listed in Table 2.
Formation of secondary organic aerosol. Even though VOCs were measured during the AQABA field campaign, they were not included in the investigation of ship emission plumes because the (potential) ship emission events were not reflected in the corresponding VOC time series. Moreover, unlike the mass of particulate inorganic species in the plume aerosol, the mass of particulate organics does not increase significantly during photochemical ageing (see Fig. S12). The same is true for the O ∕ C ratio, which also does not show a clear sign of ageing of organic material within the observed range of short-wavelength UV radiation exposure (see Fig. 8a). However, the particulate organic EF and the O ∕ C ratio show a positive correlation (see Fig. 8b), generally suggesting an increase in organic particulate mass, potentially through oxidation of gas-phase organic material during plume transport.
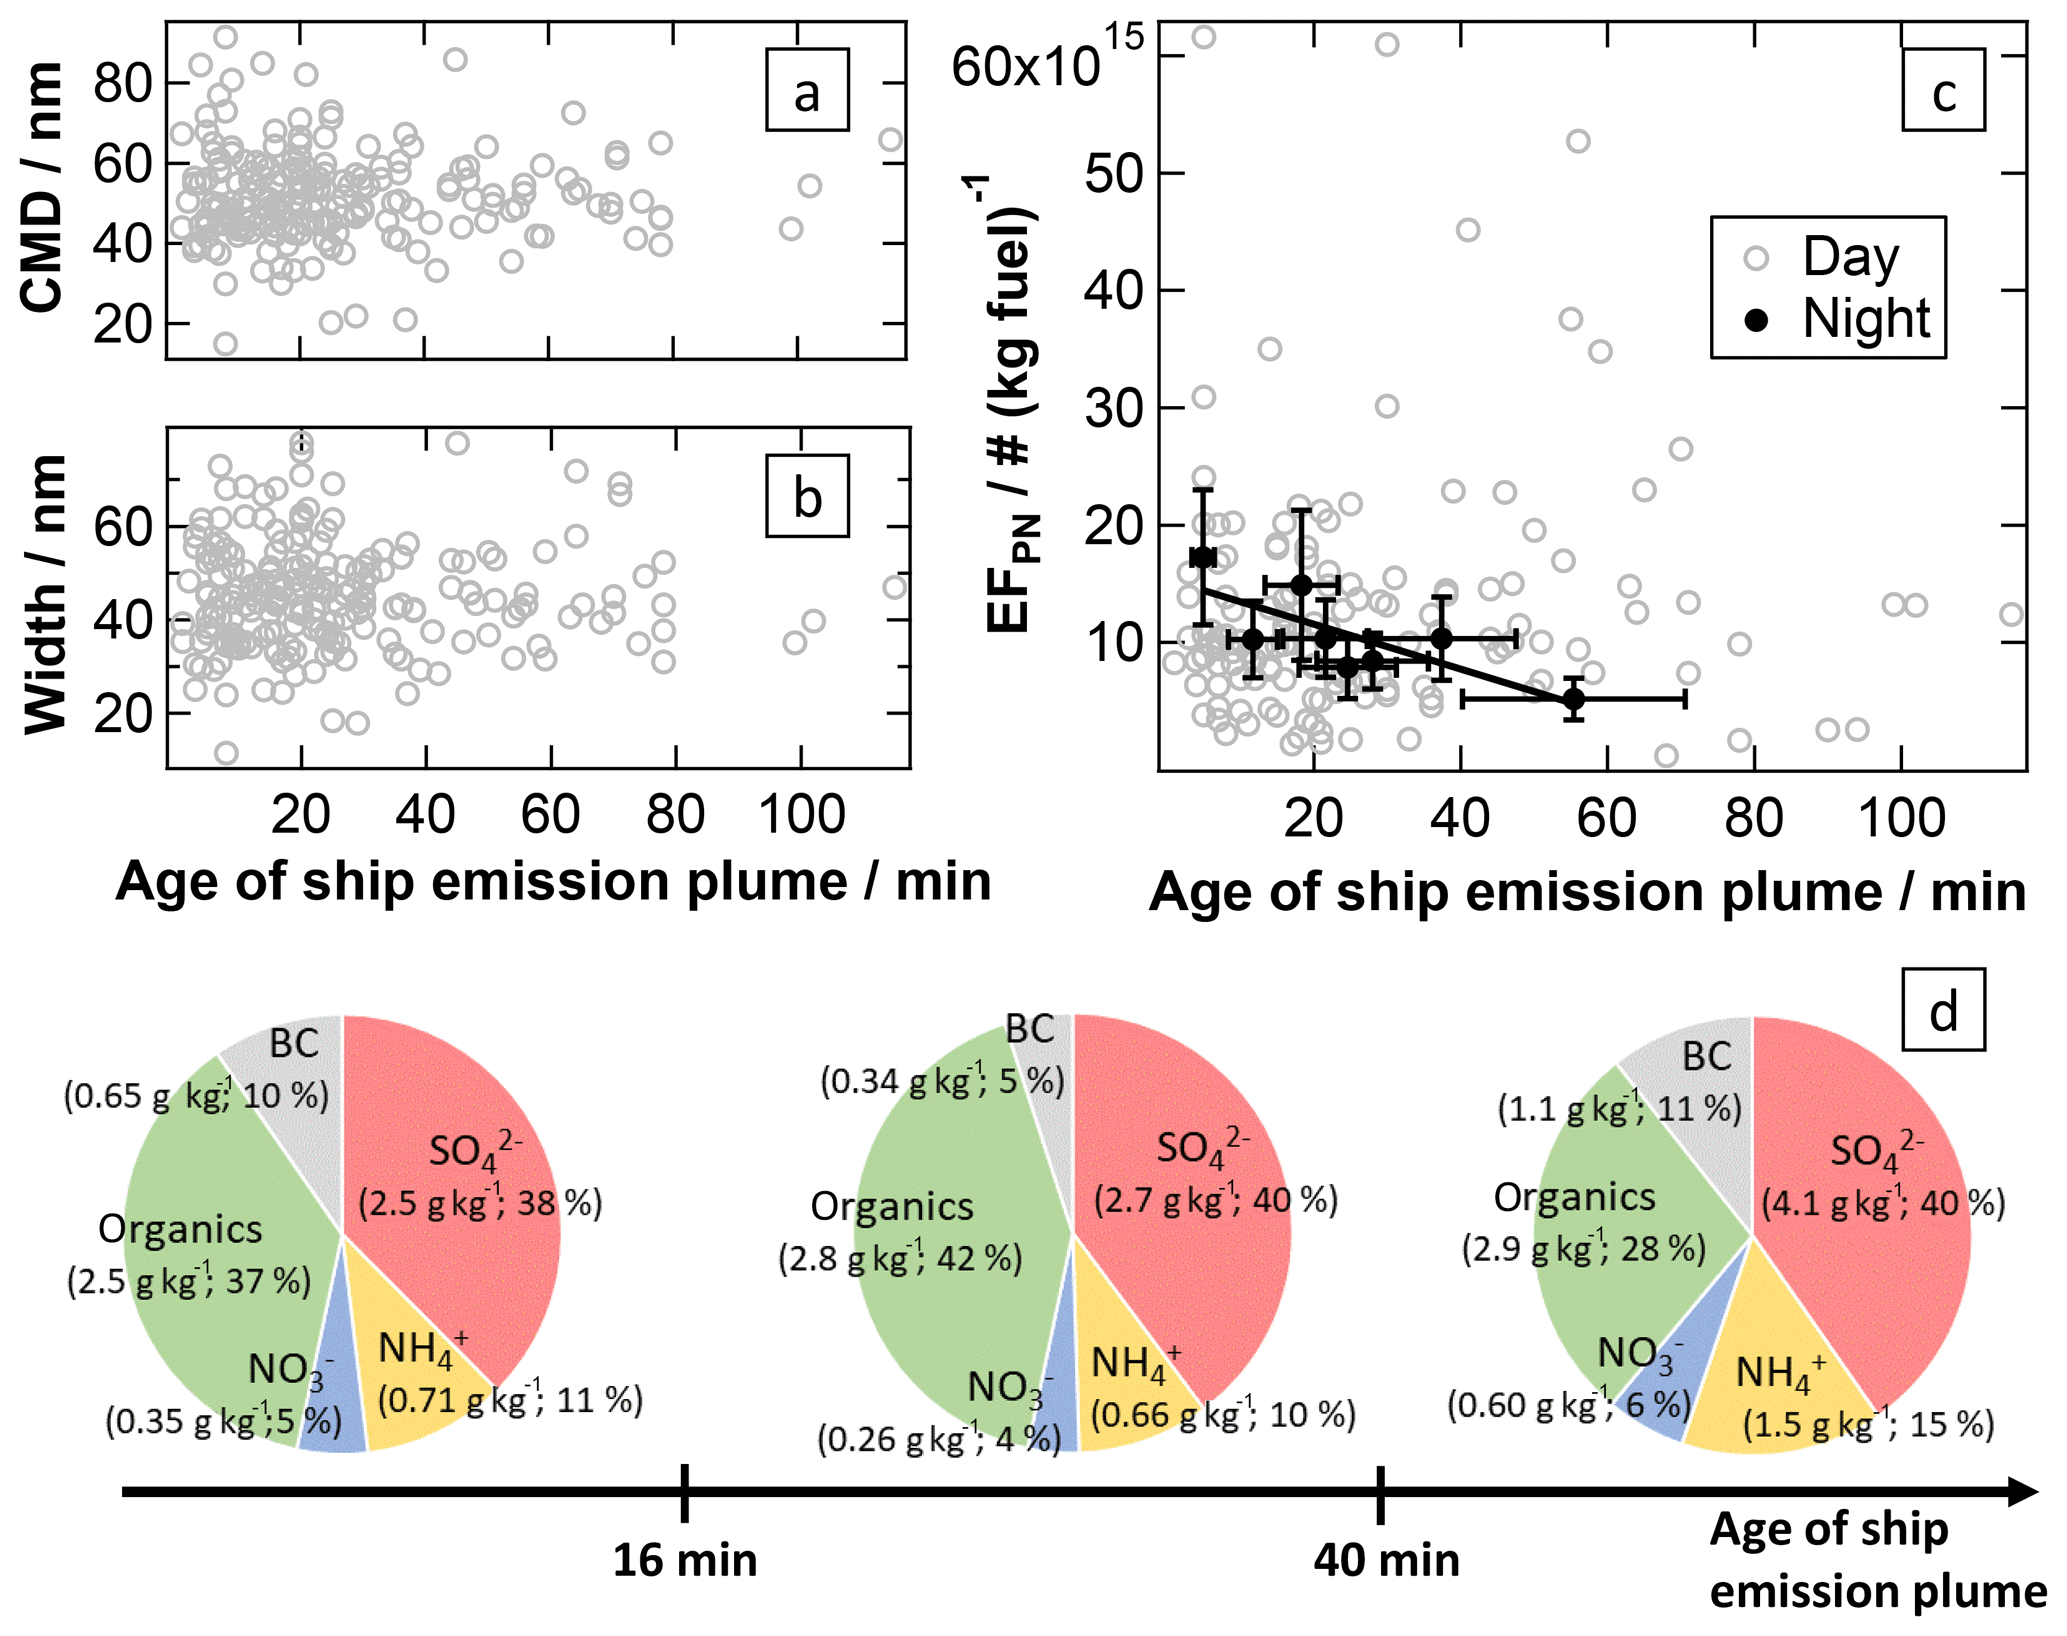
Figure 9Influences of atmospheric processing on the particle-phase characteristics of ship emission plumes. The CMD (rel. uncertainty: 27 %) (a) and width (rel. uncertainty: 27 %) (b) of the particle number size distribution and the apparent particle number emission factor (rel. uncertainty: 26 %) (c) are plotted against the age of the ship emission plume (avg. rel. uncertainty: 20 %). The fit parameters and correlation coefficient are listed in Table 2. Additionally, the typical chemical composition (calculated from median EFs) of the particle phase is given for ship emission plumes younger than 16 min, between 16 and 40 min of age, and older than 40 min (d).
Development of aerosol composition and neutralisation of inorganic acids. As discussed in the sections above, the chemical composition of aerosol particles in ship emission plumes depends on various factors. Combustion conditions mainly influence BC emissions; fuel quality (with sulfur content affecting the consumption of lubricating agent) has an effect on organic aerosol components in the plume, and atmospheric processes mainly generate additional secondary inorganic aerosol components, which also partially depend on fuel sulfur content. To investigate the changes in chemical composition of the plume aerosol particles, we calculated typical particle compositions for three different plume age intervals including approximately the same number of data points, using the medians of the respective emission factors: for plumes younger than 16 min, for plume ages between 16 and 40 min, and for plumes older than 40 min (see Fig. 9d). The processes during plume ageing are reflected in these relative compositions: the organic fraction contributes increasingly less and the inorganic fraction increasingly more to the particle phase. This is due to strong increases in the inorganic emission factors during plume transport, while the organic EF increases only very slightly. When looking separately at the plume development during the daytime and nighttime, we find these effects to be much stronger during the day compared to the night (see Fig. S14), consistent with photochemical processes contributing to the formation of secondary inorganic aerosol components. We emphasise that the relatively low number of data points for some species during individual plume age intervals and large scatter of emission factors due to other influences result in some of the variability observed in the relative composition of the particle phase. As shown in Fig. 7c, the photochemical formation of particulate sulfuric acid is accompanied by an increase in particulate ammonium due to (partial) neutralisation of sulfuric and nitric acid, associated with the formation of particulate ammonium (bi)sulfate and ammonium nitrate. This is a consequence of ammonia being mixed into the diluting plume from the marine background air. If we take into account that 3 equiv. of NH3 neutralise 1 equiv. H2SO4 and 1 equiv. HNO3 in the particle phase, the average degree of neutralisation increases from 61 % for plumes younger than 16 min to 69 % for plumes between 16 and 40 min of age up to 95 % for plumes older than 40 min.
Other trace gases – formation and degradation of HCHO. Formaldehyde (HCHO) has previously been observed in ship emission plumes and was explained by enhanced photochemical formation from background CH4 (Lowe and Schmidt, 1983) due to higher OH concentrations in the plume, from VOC oxidation (Marbach et al., 2009), or from direct emission from the ships due to incomplete combustion (Williams et al., 2009). Our observations show that the apparent HCHO emission factors increase along with photochemical ageing of the plume (see Fig. 10), in agreement with photochemical formation processes. The regression intercept (i.e. the EF for negligible potential photochemical plume processing), however, is not significantly different from zero HCHO emissions and therefore does not suggest direct emissions of HCHO by the ships (see Table 2).
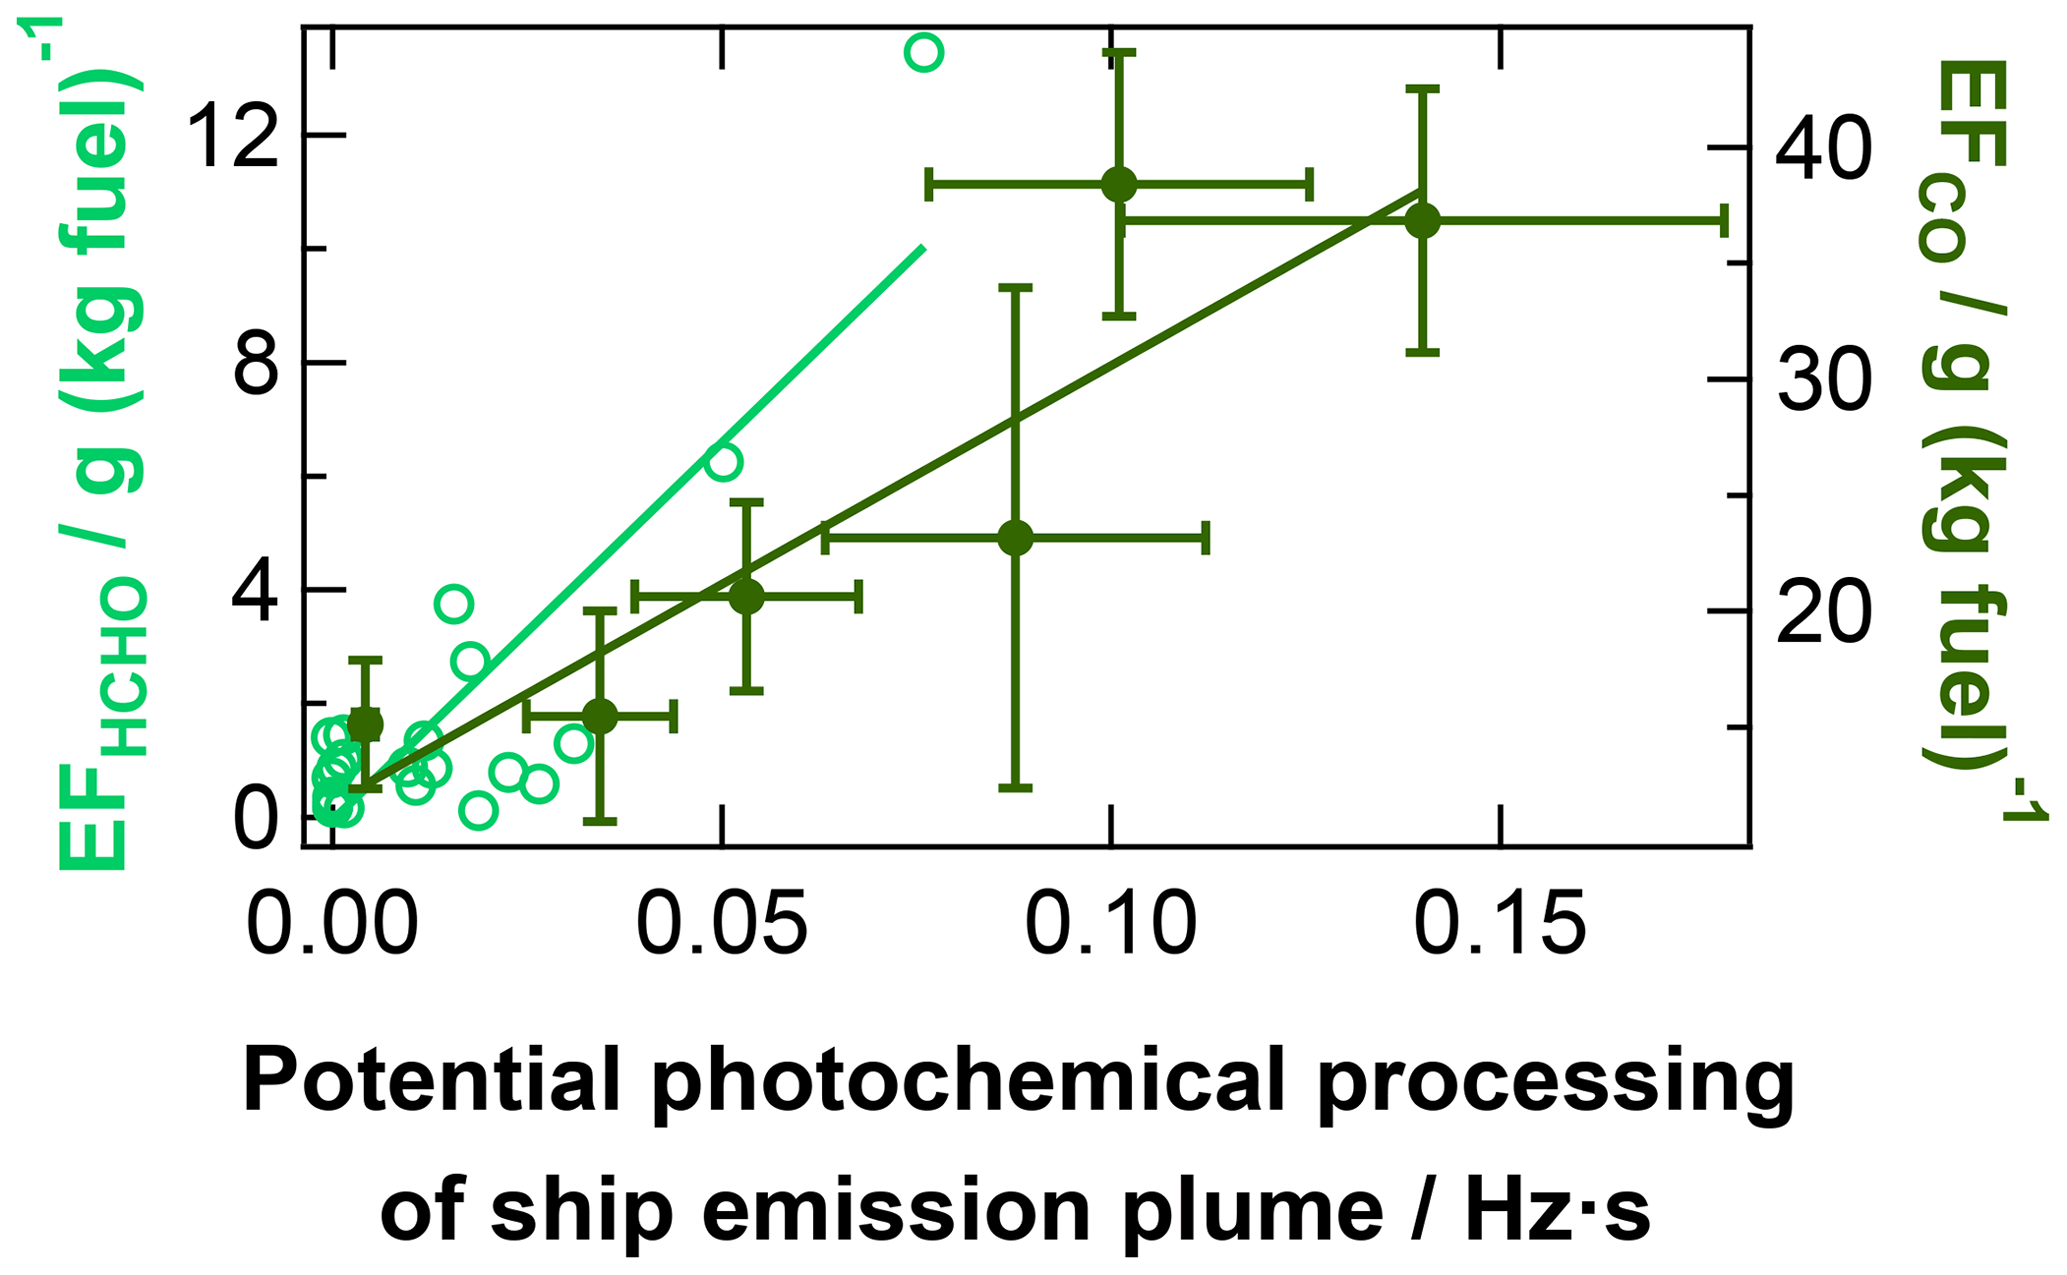
Figure 10Influence of atmospheric processing on HCHO (rel. uncertainty: 29 %) and CO in ship emission plumes observed during AQABA. For both cases, the development of the apparent emission factor with increasing potential photochemical plume processing (avg. rel. uncertainty: 27 %; measured or calculated JO1D integrated over the plume transport time) is presented. The fit parameters and correlation coefficients are listed in Table 2.
Atmospheric decomposition of HCHO in the troposphere (Reactions R9 to R12) occurs within a few hours under daylight conditions and leads to the formation of CO in the ageing plume (Lowe and Schmidt, 1983).
As a consequence of these processes, we observe an increase in the apparent CO emission factor in the photochemically ageing plume (see Fig. 10), which results in apparently 2–4 times higher apparent CO emission factors in the aged plume compared to the actual emissions from the ship stacks due to incomplete combustion of the fuel. The direct CO emissions from the ships can therefore only be determined from aged plumes by accounting for this CO increase during plume ageing (see correlation function in Table 2).
Development of particle size and number concentration in the ageing plume. As discussed above, the particle mass in the ship plumes increases mainly due to the formation of (NH4)2SO4 during atmospheric ageing, and the mass of particulate organics increases slightly through oxidation. In addition, coagulation of particles in the plume should result in fewer but larger particles. However, we observe neither a growth of particles nor an increase in the width of the size distribution with increasing plume age (see Fig. 9a and b). A reason for this might be that for spherical particles the particle diameter scales only with the third root of the particle mass, and therefore the resulting small increase in particle size might not be observable within the large variability due to other influencing factors. Another explanation could be that especially soot particles in freshly emitted diesel exhaust usually show an irregular shape with a fractal dimension well below 3, which may collapse when vapour condenses onto the particles forming less fractal and more compact (more spherical) particles. This effect causes an increase in the particle mass without resulting in an equivalent increase in the measured particle size (here, mobility diameter; Pagels et al., 2009).
As illustrated in Fig. 9c, we do not observe a dependence of the particle number EF on the plume age during daylight hours, whereas a decrease is observed for ship emission plumes that were detected during the nighttime. In general, there are mainly two opposite effects that change the particle number concentration in an expanding plume over time (dilution excluded): coagulation and new particle formation. The particle number concentration decrease during nighttime transport could be due to coagulation within the plume. This effect could be outbalanced or at least superimposed by new particle formation during the daytime. However, the large scatter in the daytime particle number EF shows that there are strong additional factors influencing this plume property, and detailed microphysical modelling studies are needed to disentangle the different processes and elucidate their relative importance.
Table 3Overview of average quantities of identified ship emission plumes of the AQABA dataset and comparison with plume quantities presented in the literature. The second row contains a brief study description shown as measurement site/measurement platform/number of investigated ship emission plumes.
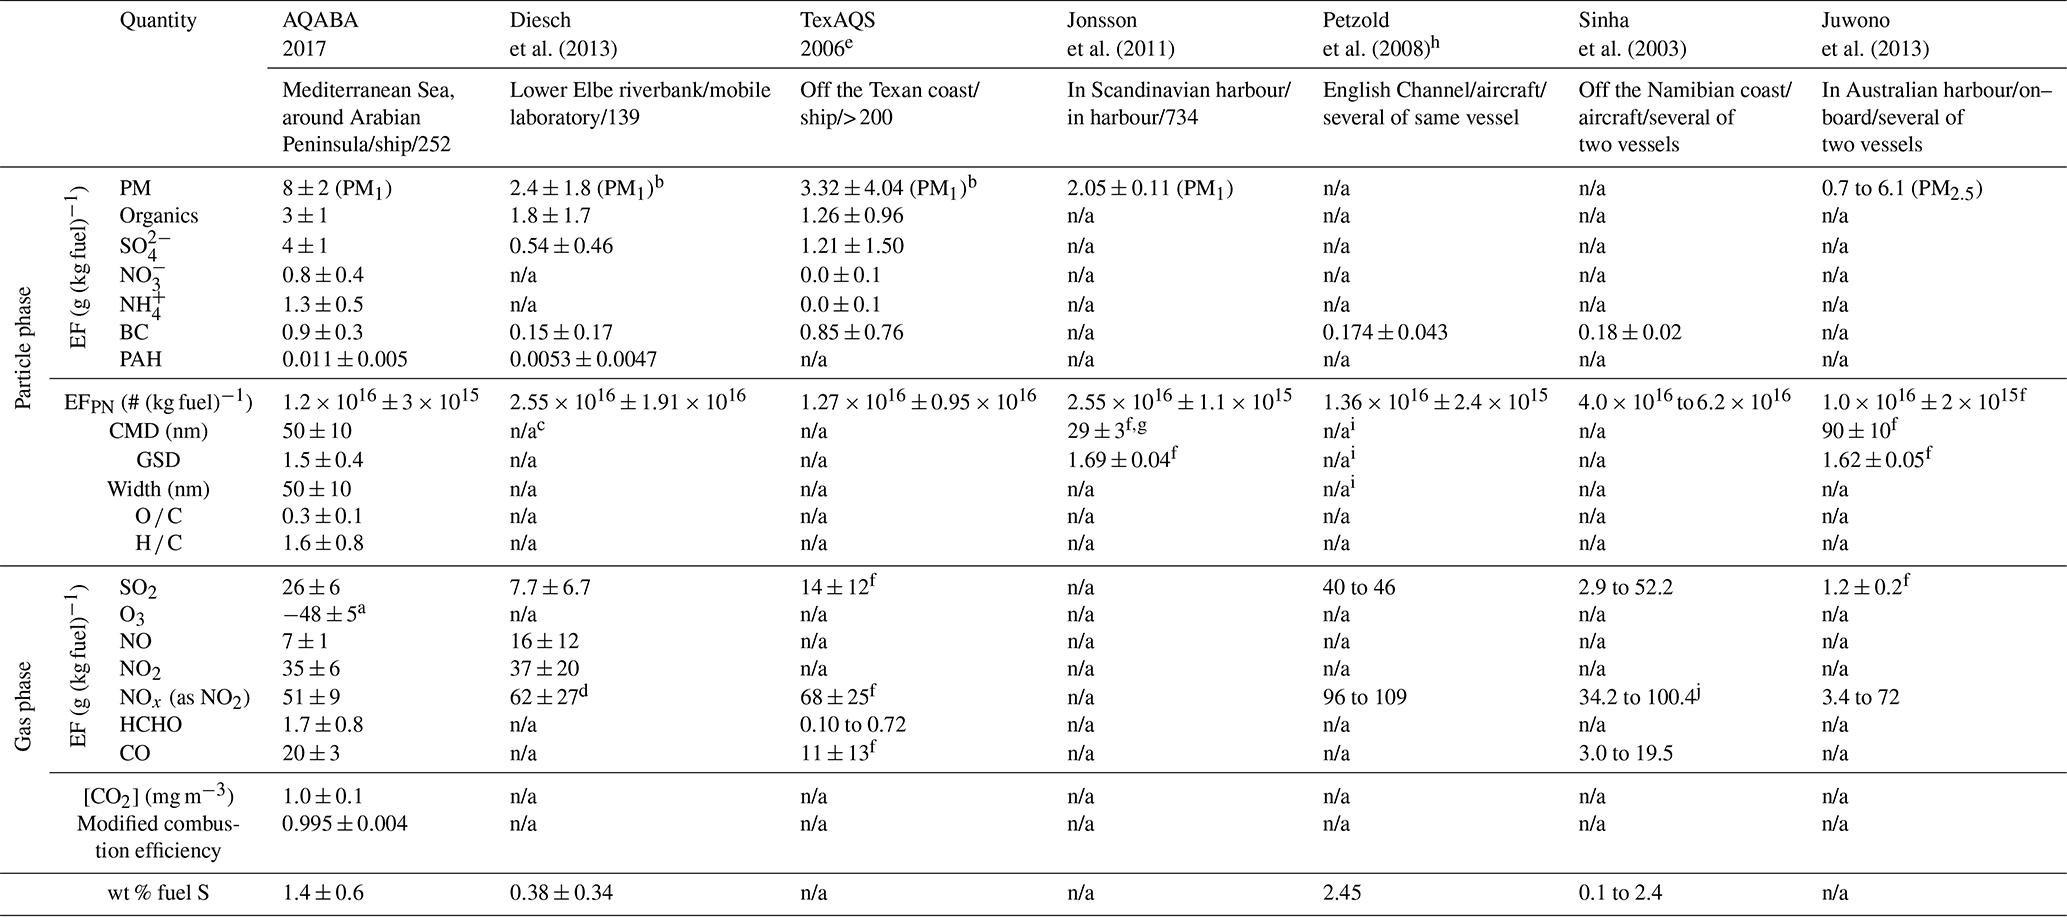
a Average reduction of O3 background level during a ship emission event when considering plume dilution and referring to the amount of burned fuel. b PM EF is given by the sum of EFs of AMS species and of BC. c Count mode is on average 35±15 nm. d NOx EF was given as sum of EFs of NO and NO2. e TexAQS: Texas Air Quality Study. Particle-phase data are provided by Lack et al. (2009) and gas-phase data by Williams et al. (2009). f Average of available data. g Value is derived from the average geometric mean diameter and the GSD according to Hinds (1999). h Tracking of one single ship emission plume. i Bimodal size distribution observed. j NOx EF was given as NO EF and converted into NOx EF as NO2 EF by weighting the NO EF with .
3.4 Average ship emission plume quantities and comparison with literature data
For comparison with data available in the literature, we calculated average emission factors, particle size distribution data, and ratios of plume components for all ship emission plumes of the AQABA dataset (Table 3). Diesch et al. (2013), Lack et al. (2009), and Williams et al. (2009) as well as Jonsson et al. (2011) report the results of studies conducted in ECAs that include a large sample of measured ship emission plumes (> 100), whereas Petzold et al. (2008; in ECA), Sinha et al. (2003; not in ECA), and Juwono et al. (2013; not in ECA) investigated individual ship emission plumes of a small number of ships (one or two) under various operating conditions.

Figure 11Qualitative overview of the observed dependencies of ship plume characteristics on ship parameters and conditions during the combustion process as well as on atmospheric processing immediately after plume release and during plume ageing.
In general, the average apparent particle mass emission factors (both for total PM and for individual species) from this present study are significantly higher (by a factor of ca. 1.5 to 4) than those previously reported in the literature, which is primarily due to the fact that the AQABA field campaign did not take place in an ECA and that a significant number of atmospherically aged and processed ship emission plumes with thus higher particle mass concentrations (see Sect. 3.3) were analysed. Therefore, particle mass emission factors that are inferred for the time of emission (fitting parameters a in Table 2) are lower than average apparent EFs and thus closer to (but still somewhat above) listed literature data. The average BC emission factor determined for the identified ship emission plumes of the AQABA dataset is in good agreement with the data given by Lack et al. (2009). Buffaloe et al. (2014; not included in Table 3) focused on the investigation of BC in 135 individual emission plumes of 71 different ships operating off the Californian coast (an ECA) and report a lower average BC emission factor of (0.31±0.31) g (kg fuel)−1, though still higher than EFBC derived from other studies (Table 3) which are more in the range of 0.2 g (kg fuel)−1. As we have shown (Sect. 3.1, Fig. 3), EFBC strongly depends on the gross tonnage of the emitting vessel, with the lowest EFBC found for a gross tonnage of ∼50 000 with ∼0.25 g (kg fuel)−1, which is closer to the range observed in previous studies. Therefore, the observed differences could be due to different fleet compositions in the various studies, although other influences like different average ship speeds (compare Fig. 3b) are also likely to play a role. Unlike the average particle mass emission factors, the average particle number emission factor from our study is consistent with the listed literature data. As particle coagulation is mainly relevant during the early stage of plume expansion, when the local PNC is high, plume ageing on the considered timescale is not a strongly influencing factor in the particle number (PN) emission factor.
As EFs of many trace gases mainly depend on vessel characteristics and fuel quality, data available in the literature can vary significantly. Sinha et al. (2003) conducted a study off the Namibian coast, and for a tanker that was assumed to burn MDO (0.1 wt % fuel S) they report an SO2 emission factor of (2.9±0.2) g (kg fuel)−1 and for a container vessel that was assumed to burn HFO (2.4 wt % fuel S) an SO2 emission factor of (52.2±3.7) g (kg fuel)−1. The average SO2 emission factor ((26±6) g (kg fuel)−1) and the average weight percentage of fuel sulfur (1.4 wt % fuel S) of our study are in good agreement with the averaged data of both vessels from their measurements as our study covers a broad range of fuel sulfur content. The same statement as that for the particle mass emission factors regarding higher values due to plume ageing is true for the average apparent HCHO and CO emission factors as the analysis shows that these species were also formed during the ageing of the ship emission plumes. The average modified combustion efficiency presented in Table 3 was determined by using the CO emission factors that were related to the time of emission via the slope of the linear correlation (Table 2) and calculating the average of these values, while for all other values in this table the actually observed concentrations were used.
A variety of gas- and particle-phase species in 252 ship emission plumes measured in the Mediterranean Sea and around the Arabian Peninsula during the 2-month shipborne AQABA field campaign in summer 2017 were investigated. For this purpose, a method based on commercially available historical AIS records that include ship position, course, and velocity was developed and applied to identify the ship emission plumes and characterise them with respect to their source and age by reconstructing the intersection point of the source vessel track and the track of measured air masses. Observed ship emission plumes were up to 115 min old and transported up to 38 km. Based on the time-dependent exponential decay of the average excess plume concentration of the chemically inert CO2 in ship emission plumes, a dispersion lifetime of 70±15 min and a dilution down to a level indistinguishable from background within 260±60 min were determined. Emission factors (EFs) of the particle number and of particle- and gas-phase species masses in ship emission plumes were calculated as quantities that account for plume dilution and refer to the amount of burned fuel. These EFs were used to investigate the influences on the emission plume characteristics caused by ship parameters and the combustion process as well as by atmospheric effects during the early stage of exhaust release and during plume ageing in order to address the following scientific questions. Figure 11 gives an overview of the observed processes and how they affect plume characteristics.
How do parameters such as the ship velocity affect the combustion efficiency? We observed more efficient fuel combustion at higher ambient pressure-to-temperature ratios (i.e. higher O2-to-fuel mixing ratios in the combustion chamber) and for ships with higher velocities as well as for vessels with medium size gross tonnages. This was reflected in the BC emission factor being lower and was accompanied by larger NOx emission factors. Additionally, it was found that more efficient fuel combustion causes a higher initial ratio of NO to NO2 (see Figs. 3 and S13).
How does the fuel sulfur content influence the quantity of emitted species? We found that larger vessels, that typically burn lower-grade fuel, emit more SO2 and, due to the higher consumption of lubricating oil as a corrosion preventive, more organic aerosol and thus promote the formation of more PM during atmospheric processing of the corresponding emission plumes (see Fig. 4).
What are the effects of the exhaust system's size and thus of the exhaust's residence time within the pipes? It was shown that larger vessels emit fewer particles by number per kilogram of burned fuel, likely due to their longer exhaust system that favours particle coagulation before the coagulation process is quenched when the exhaust is released into ambient air (see Fig. 5).
How do atmospheric dilution, transport, and ageing affect the characteristics of ship emission plumes? We observed that ambient wind speed, which affects the dilution of the emission plume at the ship stack exit, significantly influences the particle number concentration (PNC): a lower wind speed results in less diluted plumes and thus promotes particle coagulation as well as vapour condensation and as a consequence causes a lower PNC EF accompanied by larger particles and a higher particle mass EF. Furthermore, due to the long plume ageing intervals covered in this study, we were able to observe and quantify atmospheric reactions and processes like O3 reduction and recovery accompanied by the conversion between NO and NO2; the photochemical formation of HCHO and CO; the formation of secondary aerosol, namely the oxidation of NOx to and of SO2 to ; and the neutralisation of acids in the particle phase through the uptake of NH3 from ambient air. It was shown that the organic fraction which we mainly trace back to lubricating oil from the ship engine system contributes increasingly less and the inorganic fraction increasingly more to the particle phase with plume ageing, although higher O ∕ C ratios were found for higher particulate organic EFs, indicating the increase in particulate organics mass through atmospheric oxidation (see Figs. 6 to 9).
From this study, the wind velocity was identified as the strongest factor influencing the PN emission factor as well as the median diameter and width of the particle number size distribution. Particulate organics and SO2 emission factors were mainly influenced by fuel sulfur content, strongly associated with vessel gross tonnage. The largest influence on the apparent EFs of inorganic particle-phase species (except BC), the PM1, as well as on the apparent CO and HCHO emission factors was found to be atmospheric ageing. Finally, the ship velocity was identified to dominate the BC and NOx emission factors.
The quantification of observed influences on or processes in ship emission plumes by parameterisation will help to refine models in this research field. However, detailed numerical simulation studies are required to describe the relevant microphysical and chemical processes quantitatively.
The data used in this study are archived and distributed through the KEEPER service of the Max Planck Digital Library (https://keeper.mpdl.mpg.de, last access: 19 April 2020) and have been available from August 2019 to all scientists agreeing to the AQABA protocol.
The supplement related to this article is available online at: https://doi.org/10.5194/acp-20-4713-2020-supplement.
SC performed the analysis of ship emission plumes during the AQABA field campaign and wrote the manuscript. FD supervised this study. Aerosol particle measurements and data were provided by FD, FF, JB, ED, SB, and HC. JP contributed CO and CO2 measurements and data. O3, SO2, and NOx measurements and data were provided by PGE, NF, and JC, and JO1D values were measured by JS. IT, DD, BH, and HF provided NO, NO2, and HCHO measurements and data. HH took responsibility for the scientific coordination of the field campaign on-board the research vessel. All authors contributed to data interpretation and manuscript revision and approved the submitted version.
The authors declare that they have no conflict of interest.
The authors are grateful to Thomas Böttger, Philipp Schumann, Claus Koeppel, and Marcel Dorf for technical support in the preparation and conduction of the AQABA field campaign. They thank Uwe Parchatka for supporting the NO and NO2 measurements during the field campaign. Michael Anfield from MarineTraffic is acknowledged for fruitful support in the identification of AIS data. The Max Planck Society covered the majority of the costs for the field campaign; the University of Manchester is acknowledged for financial support for data analysis.
The article processing charges for this open-access publication were covered by the Max Planck Society.
This paper was edited by Anna Jones and reviewed by Mingxi Yang and one anonymous referee.
Agrawal, H., Malloy, Q. G. J., Welch, W. A., Wayne Miller, J., and Cocker, D. R.: In–use gaseous and particulate matter emissions from a modern ocean going container vessel, Atmos. Environ., 42, 5504–5510, https://doi.org/10.1016/j.atmosenv.2008.02.053, 2008.
Aiken, A. C., DeCarlo, P. F., Kroll, J. H., Worsnop, D. R., Huffman, J. A., Docherty, K. S., Ulbrich, I. M., Mohr, C., Kimmel, J. R., Sueper, D., Sun, Y., Zhang, Q., Trimborn, A., Northway, M., Ziemann, P. J., Canagaratna, M. R., Onasch, T. B., Alfarra, M. R., Prevot, A. S. H., Dommen, J., Duplissy, J., Metzger, A., Baltensperger, U., and Jimenez, J. L.: O∕C and OM/OC Ratios of Primary, Secondary, and Ambient Organic Aerosols with High–Resolution Time–of–Flight Aerosol Mass Spectrometry, Environ. Sci. Technol., 42, 4478–4485, https://doi.org/10.1021/es703009q, 2008.
Alföldy, B., Lööv, J. B., Lagler, F., Mellqvist, J., Berg, N., Beecken, J., Weststrate, H., Duyzer, J., Bencs, L., Horemans, B., Cavalli, F., Putaud, J.-P., Janssens-Maenhout, G., Csordás, A. P., Van Grieken, R., Borowiak, A., and Hjorth, J.: Measurements of air pollution emission factors for marine transportation in SECA, Atmos. Meas. Tech., 6, 1777–1791, https://doi.org/10.5194/amt-6-1777-2013, 2013.
Bermudez, V., Serrano, J. R., Piqueras, P., Gomez, J., and Bender, S.: Analysis of the role of altitude on diesel engine performance and emissions using an atmosphere simulator, Int. J. Engine Res., 18, 105–117, https://doi.org/10.1177/1468087416679569, 2017.
Buffaloe, G. M., Lack, D. A., Williams, E. J., Coffman, D., Hayden, K. L., Lerner, B. M., Li, S.-M., Nuaaman, I., Massoli, P., Onasch, T. B., Quinn, P. K., and Cappa, C. D.: Black carbon emissions from in-use ships: a California regional assessment, Atmos. Chem. Phys., 14, 1881–1896, https://doi.org/10.5194/acp-14-1881-2014, 2014.
Cappa, C. D., Williams, E. J., Lack, D. A., Buffaloe, G. M., Coffman, D., Hayden, K. L., Herndon, S. C., Lerner, B. M., Li, S.-M., Massoli, P., McLaren, R., Nuaaman, I., Onasch, T. B., and Quinn, P. K.: A case study into the measurement of ship emissions from plume intercepts of the NOAA ship Miller Freeman, Atmos. Chem. Phys., 14, 1337–1352, https://doi.org/10.5194/acp-14-1337-2014, 2014.
Chang, Y., Mendrea, B., Sterniak, J., and Bohac, S. V.: Effect of Ambient Temperature and Humidity on Combustion and Emissions of a Spark-Assisted Compression Ignition Engine, J. Eng. Gas Turb. Power, 139, 51501-1–51501-7, https://doi.org/10.1115/1.4034966, 2017.
Chen, D., Zhao, N., Lang, J., Zhou, Y., Wang, X., Li, Y., Zhao, Y., and Guo, X.: Contribution of ship emissions to the concentration of PM2.5: A comprehensive study using AIS data and WRF/Chem model in Bohai Rim Region, China, Sci. Total Environ., 611, 1476–1486, https://doi.org/10.1016/j.scitotenv.2017.07.255, 2018.
Chen, G., Huey, L. G., Trainer, M., Nicks, D., Corbett, J., Ryerson, T., Parrish, D., Neuman, J. A., Nowak, J., Tanner, D., Holloway, J., Brock, C., Crawford, J., Olson, J. R., Sullivan, A., Weber, R., Schauffler, S., Donnelly, S., Atlas, E., Roberts, J., Flocke, F., Hübler, G., and Fehsenfeld, F.: An investigation of the chemistry of ship emission plumes during ITCT 2002, J. Geophys. Res., 110, 1–15, https://doi.org/10.1029/2004JD005236, 2005.
Chu-Van, T., Ristovski, Z., Pourkhesalian, A. M., Rainey, T., Garaniya, V., Abbassi, R., Jahangiri, S., Enshaei, H., Kam, U.-S., Kimball, R., Kimball, R., Yang, L., Zare, A., Bartlett, H., and Brown, R. J.: On–board measurements of particle and gaseous emissions from a large cargo vessel at different operating conditions, Environ. Pollut., 237, 832–841, https://doi.org/10.1016/j.envpol.2017.11.008, 2018.
Corbett, J. J., Fischbeck, P. S., and Pandis, S. N.: Global nitrogen and sulfur inventories for oceangoing ships, J. Geophys. Res., 104, 3457–3470, https://doi.org/10.1029/1998JD100040, 1999.
Corbett, J. J., Winebrake, J. J., Green, E. H., Kasibhatla, P., Eyring, V., and Lauer, A.: Mortality from Ship Emissions: A Global Assessment, Environ. Sci. Technol., 41, 8512–8518, https://doi.org/10.1021/es071686z, 2007.
DeCarlo, P. F., Kimmel, J. R., Trimborn, A., Northway, M. J., Jayne, J. T., Aiken, A. C., Gonin, M., Fuhrer, K., Horvath, T., Docherty, K. S., Worsnop, D. R., and Jimenez, J. L.: Field–deployable, high–resolution, time–of–flight aerosol mass spectrometer, Anal. Chem., 78, 8281–8289, https://doi.org/10.1021/ac061249n, 2006.
Diesch, J.-M., Drewnick, F., Klimach, T., and Borrmann, S.: Investigation of gaseous and particulate emissions from various marine vessel types measured on the banks of the Elbe in Northern Germany, Atmos. Chem. Phys., 13, 3603–3618, https://doi.org/10.5194/acp-13-3603-2013, 2013.
Drewnick, F., Böttger, T., von der Weiden-Reinmüller, S.-L., Zorn, S. R., Klimach, T., Schneider, J., and Borrmann, S.: Design of a mobile aerosol research laboratory and data processing tools for effective stationary and mobile field measurements, Atmos. Meas. Tech., 5, 1443–1457, https://doi.org/10.5194/amt-5-1443-2012, 2012.
Drinovec, L., Močnik, G., Zotter, P., Prévôt, A. S. H., Ruckstuhl, C., Coz, E., Rupakheti, M., Sciare, J., Müller, T., Wiedensohler, A., and Hansen, A. D. A.: The ”dual-spot” Aethalometer: an improved measurement of aerosol black carbon with real-time loading compensation, Atmos. Meas. Tech., 8, 1965–1979, https://doi.org/10.5194/amt-8-1965-2015, 2015.
Eger, P. G., Helleis, F., Schuster, G., Phillips, G. J., Lelieveld, J., and Crowley, J. N.: Chemical ionization quadrupole mass spectrometer with an electrical discharge ion source for atmospheric trace gas measurement, Atmos. Meas. Tech., 12, 1935–1954, https://doi.org/10.5194/amt-12-1935-2019, 2019.
Equasis: Homepage, available at: http://www.equasis.org/EquasisWeb/public/HomePage, last access: 29 March 2019.
FleetMon: Homepage, available at: https://www.fleetmon.com/, last access: 29 March 2019.
Fridell, E., Steen, E., and Peterson, K.: Primary particles in ship emissions, Atmos. Environ., 42, 1160–1168, https://doi.org/10.1016/j.atmosenv.2007.10.042, 2008.
Hinds, W. C.: Aerosol Technology: Properties, Behavior, and Measurement of Airborne Particles, Wiley–Interscience: New York, 1999.
IMO: Homepage, available at: http://www.imo.org/en/Pages/Default.aspx, last access: 12 March 2019.
Jonsson, Å. M., Westerlund, J., and Hallquist, M.: Size–resolved particle emission factors for individual ships, Geophys. Res. Lett., 38, 1–5, https://doi.org/10.1029/2011GL047672, 2011.
Juwono, A. M., Johnson, G. R., Mazaheri, M., Morawska, L., Roux, F., and Kitchen, B.: Investigation of the airborne submicrometer particles emitted by dredging vessels using a plume capture method, Atmos. Environ., 73, 112–123, https://doi.org/10.1016/j.atmosenv.2013.03.024, 2013.
Khalid, A.: Effect of Ambient Temperature and Oxygen Concentration on Ignition and Combustion Process of Diesel Spray, Asian J. Sci. Res., 6, 434–444, https://doi.org/10.3923/ajsr.2013.434.444, 2013.
Kim, H. S., Song, C. H., Park, R. S., Huey, G., and Ryu, J. Y.: Investigation of ship-plume chemistry using a newly-developed photochemical/dynamic ship-plume model, Atmos. Chem. Phys., 9, 7531–7550, https://doi.org/10.5194/acp-9-7531-2009, 2009.
Lack, D. A., Corbett, J. J., Onasch, T., Lerner, B., Massoli, P., Quinn, P. K., Bates, T. S., Covert, D. S., Coffman, D., Sierau, B., Herndon, S., Allan, J., Baynard, T., Lovejoy, E., Ravishankara, A. R., and Williams, E.: Particulate emissions from commercial shipping: Chemical, physical, and optical properties, J. Geophys. Res., 114, 1–16, https://doi.org/10.1029/2008JD011300, 2009.
Levin, M., Gudmundsson, A., Pagels, J. H., Fierz, M., Mølhave, K., Löndahl, J., Jensen, K. A., and Koponen, I. K.: Limitations in the Use of Unipolar Charging for Electrical Mobility Sizing Instruments: A Study of the Fast Mobility Particle Sizer, Aerosol Sci. Technol., 49, 556–565, https://doi.org/10.1080/02786826.2015.1052039, 2015.
Lovejoy, E. R., Hanson, D. R., and Huey, L. G.: Kinetics and Products of the Gas–Phase Reaction of SO3 with Water, J. Phys. Chem., 100, 19911–19916, https://doi.org/10.1021/jp962414d, 1996.
Lowe, D. C. and Schmidt, U.: Formaldehyde (HCHO) measurements in the nonurban atmosphere, J. Geophys. Res., 88, 10844–10858, https://doi.org/10.1029/JC088iC15p10844, 1983.
Marbach, T., Beirle, S., Platt, U., Hoor, P., Wittrock, F., Richter, A., Vrekoussis, M., Grzegorski, M., Burrows, J. P., and Wagner, T.: Satellite measurements of formaldehyde linked to shipping emissions, Atmos. Chem. Phys., 9, 8223–8234, https://doi.org/10.5194/acp-9-8223-2009, 2009.
Mardia, K. V. and Jupp, P. E.: Directional statistics, Wiley, Chichester, UK, 2000.
MarineTraffic: Homepage, available at: https://www.marinetraffic.com/, last access: 26 March 2019.
Metz, B., Davidson, O. R., Bosch, P. R., Dave, R., and Meyer, L. A. (Eds): Climate Change 2007: Mitigation, Contribution of Working Group III to the Fourth Assessment Report of the Intergovernmental Panel on Climate Change, IPCC, Cambridge University Press, Cambridge, United Kingdom and New York, NY, USA, 325 pp., 2007.
Meusel, H., Kuhn, U., Reiffs, A., Mallik, C., Harder, H., Martinez, M., Schuladen, J., Bohn, B., Parchatka, U., Crowley, J. N., Fischer, H., Tomsche, L., Novelli, A., Hoffmann, T., Janssen, R. H. H., Hartogensis, O., Pikridas, M., Vrekoussis, M., Bourtsoukidis, E., Weber, B., Lelieveld, J., Williams, J., Pöschl, U., Cheng, Y., and Su, H.: Daytime formation of nitrous acid at a coastal remote site in Cyprus indicating a common ground source of atmospheric HONO and NO, Atmos. Chem. Phys., 16, 14475–14493, https://doi.org/10.5194/acp-16-14475-2016, 2016.
Mohd Noor, C. W., Noor, M. M., and Mamat, R.: Biodiesel as alternative fuel for marine diesel engine applications: A review, Renew. Sust. Energ. Rev., 94, 127–142, https://doi.org/10.1016/j.rser.2018.05.031, 2018.
Moldanová, J., Fridell, E., Popovicheva, O., Demirdjian, B., Tishkova, V., Faccinetto, A., and Focsa, C.: Characterisation of particulate matter and gaseous emissions from a large ship diesel engine, Atmos. Environ., 43, 2632–2641, https://doi.org/10.1016/j.atmosenv.2009.02.008, 2009.
Moldanová, J., Fridell, E., Winnes, H., Holmin-Fridell, S., Boman, J., Jedynska, A., Tishkova, V., Demirdjian, B., Joulie, S., Bladt, H., Ivleva, N. P., and Niessner, R.: Physical and chemical characterisation of PM emissions from two ships operating in European Emission Control Areas, Atmos. Meas. Tech., 6, 3577–3596, https://doi.org/10.5194/amt-6-3577-2013, 2013.
Nash, T.: The colorimetric estimation of formaldehyde by means of the Hantzsch reaction, Biochem. J., 55, 416–421, https://doi.org/10.1042/bj0550416, 1953.
Nunes, R. A. O., Alvim–Ferraz, M. C. M., Martins, F. G., and Sousa, S. I. V.: Assessment of shipping emissions on four ports of Portugal, Environ. Pollut., 231, 1370–1379, https://doi.org/10.1016/j.envpol.2017.08.112, 2017.
Pagels, J., Khalizov, A. F., McMurry, P. H., and Zhang R. Y.: Processing of Soot by Controlled Sulphuric Acid and Water Condensation – Mass and Mobility Relationship, Aerosol Sci. Tech., 43, 629–640, https://doi.org/10.1080/02786820902810685, 2009.
Petzold, A., Hasselbach, J., Lauer, P., Baumann, R., Franke, K., Gurk, C., Schlager, H., and Weingartner, E.: Experimental studies on particle emissions from cruising ship, their characteristic properties, transformation and atmospheric lifetime in the marine boundary layer, Atmos. Chem. Phys., 8, 2387–2403, https://doi.org/10.5194/acp-8-2387-2008, 2008.
Pirjola, L., Pajunoja, A., Walden, J., Jalkanen, J.-P., Rönkkö, T., Kousa, A., and Koskentalo, T.: Mobile measurements of ship emissions in two harbour areas in Finland, Atmos. Meas. Tech., 7, 149–161, https://doi.org/10.5194/amt-7-149-2014, 2014.
Pokhrel, R. and Lee, H.: Estimation of air pollution from the OGVs and its dispersion in a coastal area, Ocean Eng., 101, 275–284, https://doi.org/10.1016/j.oceaneng.2015.04.023, 2015.
Rajewski, A.: Evaluating internal combustion engine's performance, Wärtsilä Technical Journal 2/2018, 18–23, 2018.
Rößler, M., Koch, T., Janzer, C., and Olzmann, M.: Mechanisms of the NO2 Formation in Diesel Engines, MTZ Worldw., 78, 70–75, https://doi.org/10.1007/s38313-017-0057-2, 2017.
Schneider, J., Hock, N., Weimer, S., and Borrmann, S.: Nucleation Particles in Diesel Exhaust: Composition Inferred from In Situ Mass Spectrometric Analysis, Environ. Sci. Technol., 39, 6153–6161, https://doi.org/10.1021/es049427m, 2007.
Sinha, P., Hobbs, P. V., Yokelson, R. J., Christian, T. J., Kirchstetter, T. W., and Bruintjes, R.: Emissions of trace gases and particles from two ships in the southern Atlantic Ocean, Atmos. Environ., 37, 2139–2148, https://doi.org/10.1016/S1352-2310(03)00080-3, 2003.
Smith, T. W. P., Jalkanen, J. P., Anderson, B. A., Corbett, J. J., Faber, J., Hanayama, S., O'Keeffe, E., Parker, S., Johansson, L., Aldous, L., Raucci, C., Traut, M., Ettinger, S., Nelissen, D., Lee, D. S., Ng, S., Agrawal, A., Winebrake, J. J., Hoen, M., Chesworth, S., and Pandey, A.: Third IMO Greenhouse Gas Study 2014, International Maritime Organization, London, UK, 2015.
Song, C. H., Chen, G., Hanna, S. R., Crawford, J., and Davis, D. D.: Dispersion and chemical evolution of ship plumes in the marine boundary layer: Investigation of chemistry, J. Geophys. Res., 108, 1–18, https://doi.org/10.1029/2002JD002216, 2003.
Thieser, J., Schuster, G., Schuladen, J., Phillips, G. J., Reiffs, A., Parchatka, U., Pöhler, D., Lelieveld, J., and Crowley, J. N.: A two-channel thermal dissociation cavity ring-down spectrometer for the detection of ambient NO2, RO2NO2 and RONO2, Atmos. Meas. Tech., 9, 553–576, https://doi.org/10.5194/amt-9-553-2016, 2016.
Tseng, W.-K. and Chang, W.-J.: Analogues between 2D Linear Equations and Great Circle Sailing, J. Navigation, 67, 101–112, https://doi.org/10.1017/S0373463313000532, 2014.
UNCTAD: Merchand fleet by flag of registration and by type of ship, available at: https://unctadstat.unctad.org/wds/TableViewer/tableView.aspx?ReportId=93, last access: 30 March 2019.
Veness, C.: Movable Type Scripts: Calculate distance, bearing and more between Latitude/Longitude points, Movable Type Ltd, available at: https://www.movable-type.co.uk/scripts/latlong.html, last access: 30 March 2019.
von der Weiden, S.-L., Drewnick, F., and Borrmann, S.: Particle Loss Calculator – a new software tool for the assessment of the performance of aerosol inlet systems, Atmos. Meas. Tech., 2, 479–494, https://doi.org/10.5194/amt-2-479-2009, 2009.
Ward, D. E. and Radke, L. F.: Emissions measurements from vegetation fires: A comparative evaluation of methods and results, in: Fire in the Environment: The Ecological, Atmospheric, and Climatic Importance of Vegetation Fires, edited by: Crutzen, P. J. and Goldammer, J. G., Environmental Sciences Research Report 13, Wiley, Chichester, 53–76, 1993.
Williams, E. J., Lerner, B. M., Murphy, P. C., Herndon, S. C., and Zahniser, M. S.: Emissions of NOx, SO2, CO, and HCHO from commercial marine shipping during Texas Air Quality Study (TexAQS) 2006, J. Geophys. Res., 114, 1–14, https://doi.org/10.1029/2009JD012094, 2009.