the Creative Commons Attribution 4.0 License.
the Creative Commons Attribution 4.0 License.
 | 20 Apr 2020
Seasonal source variability of carbonaceous aerosols at the Rwanda Climate Observatory
August Andersson
Elena N. Kirillova
Stefano Decesari
Langley DeWitt
Jimmy Gasore
Katherine E. Potter
Ronald G. Prinn
Maheswar Rupakheti
Jean de Dieu Ndikubwimana
Julius Nkusi
Bonfils Safari
Sub-Saharan Africa (SSA) is a global hot spot for aerosol emissions, which affect the regional climate and air quality. In this paper, we use ground-based observations to address the large uncertainties in the source-resolved emission estimation of carbonaceous aerosols. Ambient fine fraction aerosol was collected on filters at the high-altitude (2590 m a.s.l.) Rwanda Climate Observatory (RCO), a SSA background site, during the dry and wet seasons in 2014 and 2015. The concentrations of both the carbonaceous and inorganic ion components show a strong seasonal cycle, with highly elevated concentrations during the dry season. Source marker ratios, including carbon isotopes, show that the wet and dry seasons have distinct aerosol compositions. The dry season is characterized by elevated amounts of biomass burning products, which approach ∼95 % for carbonaceous aerosols. An isotopic mass-balance estimate shows that the amount of the carbonaceous aerosol stemming from savanna fires may increase from 0.2 µg m−3 in the wet season up to 10 µg m−3 during the dry season. Based on these results, we quantitatively show that savanna fire is the key modulator of the seasonal aerosol composition variability at the RCO.
- Article
(1701 KB) - Full-text XML
-
Supplement
(544 KB) - BibTeX
- EndNote


Sub-Saharan Africa (SSA) currently faces major challenges with respect to sustainable development, including industrial development, agriculture, fresh water supply, climate change, energy resources, and air pollution (IPCC, 2014; UNDP, 2018). These challenges are linked, either directly or indirectly, to aerosol emissions. Aerosols offset the ongoing regional climate warming in SSA, shift monsoon and precipitation patterns, and are detrimental to the air quality (IPCC, 2013; WHO, 2016). Ambient air pollution in SSA is estimated to cause 563 000 premature deaths annually, making it one of the main causes of mortality in the region (Bauer et al., 2019). However, the level of scientific understanding of the overall health and climate impact of aerosols is still low, owing to the complex aerosol life cycle during which emissions, transformations, and sinks are associated with large uncertainties, in particular given their vast physical and chemical complexity. A major limiting factor regarding improving our understanding of these effects in SSA is the limited number of in situ observations (Williams et al., 2007; Cais et al., 2011; Kulmala, 2018; López-Ballesteros et al., 2018).
A major source of aerosol emissions in SSA is dry season regional fires, which are clearly visible from space (Fig. 1). These are occasionally ignited naturally by lightning strikes, but they are mainly lit by humans. There is evidence that slash-and-burn agriculture in SSA has been a common practice for thousands of years (Bird and Cali, 1998; Archibald et al., 2012). This long-term anthropogenic perturbation is a significant modulator of current ecosystem structure. A number of studies have specifically focused on characterizing emissions of aerosols and gases from African fires, e.g., the Southern African Regional Science Initiative Project (SAFARI 2000) that was conducted between 1999 and 2001 (Swap et al., 2003). Ground- and airborne chemical characterization from this and other campaigns suggest a rather distinct aerosol chemical composition, including elevated BC, K+, and concentrations (Table 1).
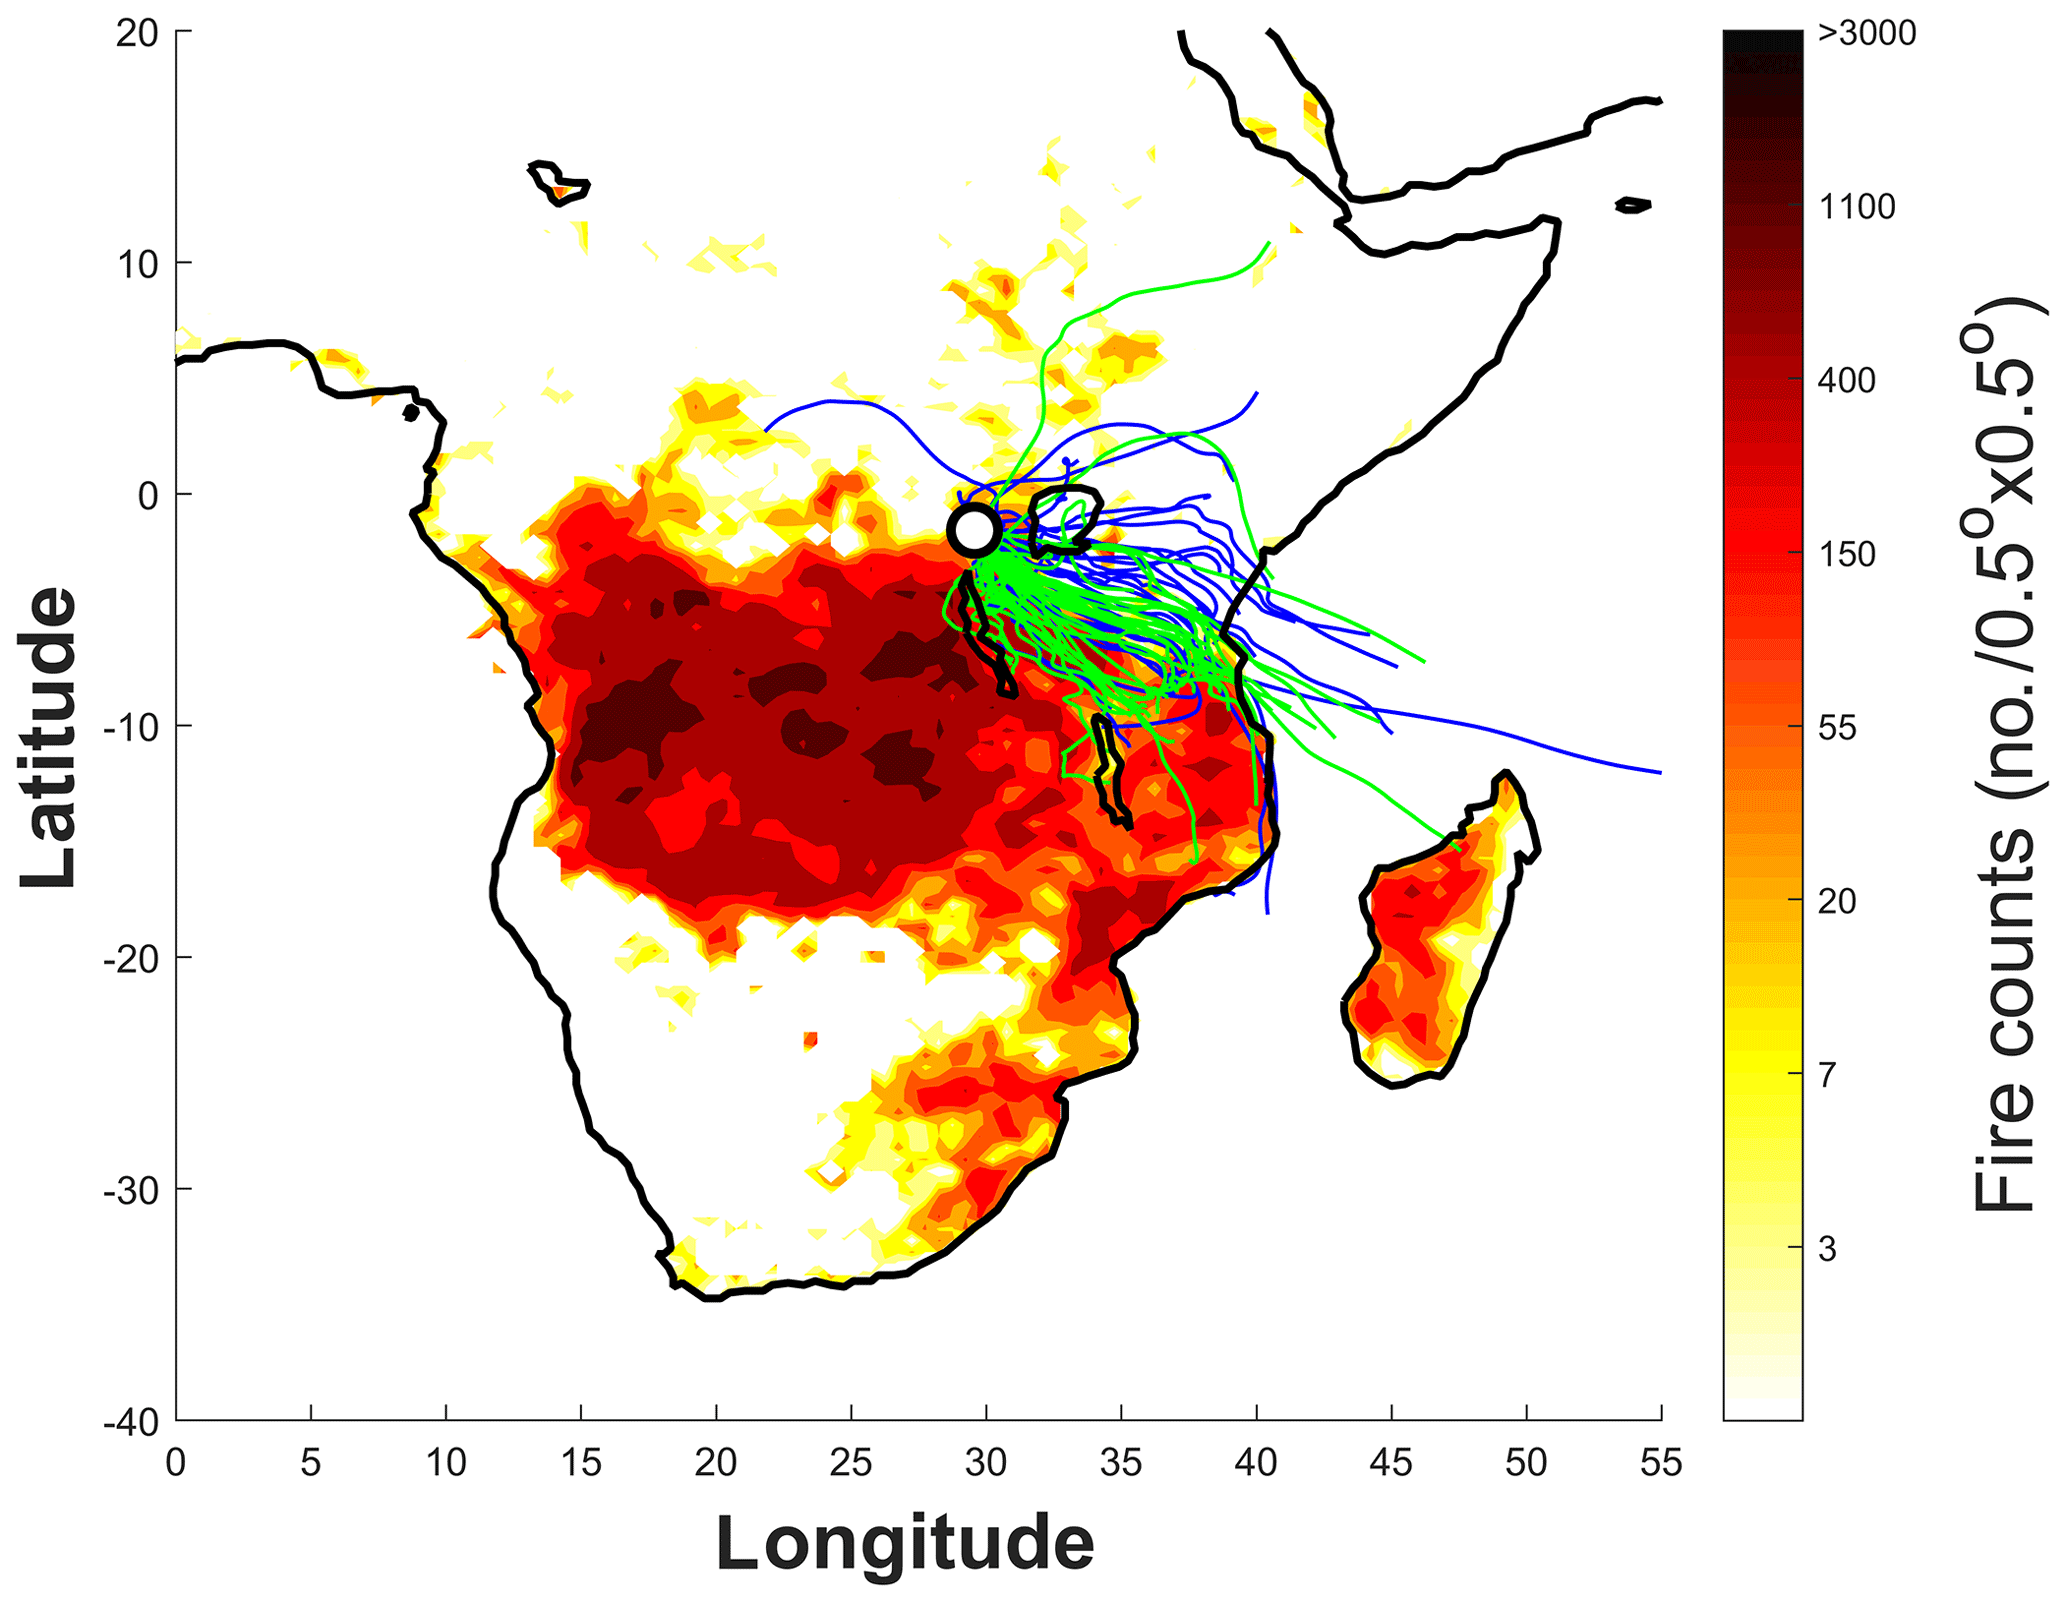
Figure 1Fire counts and air mass back-trajectories for the October 2014 to September 2015 campaign at the Rwanda Climate Observatory (RCO, white circle with black outline). The fire counts are from the Fire Information for Resource Management System (FIRMS) derived from the NASA Moderate Resolution Imaging Spectroradiometer (MODIS) satellite product for June–July–August (JJA), 2015. The thin lines represent (04:00 CAT, central African time) 5 d air mass back-trajectories arriving at RCO 100 m above ground level (a.g.l.; 2690 m above sea level, a.s.l.). The blue lines correspond to what we refer to as the “wet” seasons (October–November 2014 and April–May 2015), whereas the green lines represent the dry JJA season.
Table 1Concentrations of carbonaceous aerosol (µgC m−3) and inorganic ions (µg m−3) in fine aerosol from ground-based and airborne measurements over sub-Saharan Africa (“bkg” represents background).

a Present study. b Mkoma et al. (2014). c Gao et al. (2003). d Formenti et al. (2003). e Kirchstetter et al. (2003). f Sinha et al. (2003). g Maenhaut et al. (1996). h Puxbaum et al. (2000). i Brito et al. (2018). j Tiitta et al. (2014). k Aurela et al. (2016). NA – not available.
Carbonaceous aerosols, which are often quantified as total carbon (TC), are generally divided into two main components: black carbon (BC; here we use elemental carbon, EC, to quantify the amount of BC) and organic carbon (OC). Although they overlap to some extent, these two pools generally have distinct atmospheric life cycles and environmental effects. Formed from incomplete combustion, sunlight-absorbing BC contributes to regional warming and is a particularly detrimental component in air pollution with respect to human health (WHO, 2012; UNEP/WMO, 2012; IPCC, 2013; Bond et al., 2013). BC is chemically inert to atmospheric reactions; thus, its lifetime is mainly determined by deposition. OC is also emitted from incomplete combustion (however, with different emission factors), but it is of non-combustion origin and is formed in the air via secondary processes. OC is thought to have an overall cooling effect on the climate (IPCC, 2013). As it is more chemically reactive, the OC pool has a more complex atmospheric life cycle to some extent, with continuous heterogenous chemistry rendering the lifetime dependent on both precipitation and chemical transformations. Emissions from SSA fires are expected to contribute to a significant part of the global TC atmospheric burden (Liousse et al., 2014).
In general, the actual environmental impact of TC on SSA is poorly constrained. Bottom-up emission projections suggest that the TC emissions from SSA are expected to increase rapidly during the coming decades, perhaps reaching 50 % of the global burden by 2030 (Liousse et al., 2014). To quantify and evaluate such model predictions, as well as to characterize the overall aerosol composition, it is valuable to conduct measurements at regional background sites. Dual carbon isotope characterization (Δ14C and δ13C) of TC at background sites in South and East Asia and the Arctic has been shown to be a valuable tool for quantitatively constraining the emissions from different sources (Gustafsson et al., 2009; Andersson et al., 2015; Sheesley et al., 2012; Kirillova et al., 2014; Winiger et al., 2019).
In this paper, we present dual carbon isotope constraints of TC, along with the chemical characterization of inorganic ions and different carbonaceous pools, from a study conducted at the Rwanda Climate Observatory (RCO) from October 2014 to September 2015. A key objective of the study was to estimate the relative contributions from major TC source categories at this regionally representative site in the SSA. In particular, we investigated the source variability associated with the seasonal variations between the prevailing wet and dry monsoon seasons in the region as well as the contributions from savanna fires.
2.1 Field site and regional meteorology
The sampling site, the Rwanda Climate Observatory (RCO), is located on the top of Mt. Mugogo, in mountainous western Rwanda. (1.586∘ S, 29.566∘ E; 2590 m a.s.l. and 5 m a.g.l.). The station was established as a collaboration between the Massachusetts Institute of Technology (MIT; USA) and the Rwandan Government in 2013. The station is described in more detail by DeWitt et al. (2019). RCO is an Advanced Global Atmospheric Gases Experiment (AGAGE) network site (for full list of instruments see http://agage.mit.edu, last access: 17 April 2020).
The meteorology of Rwanda is governed by the East African monsoon, with peak rainfalls in April and November. Thus, there are two dry seasons: December–January–February (DJF) and the main dry season in June–July–August (JJA). The dry seasons in SSA are characterized by extensive biomass burning. During JJA the fires mainly occur to the south of Rwanda (Fig. 1). Savannas are the main biomes in SSA, covering ∼65 % of the landmass, and are the main source of fire emissions (Cahoon et al., 1992). Located in a highly elevated region, Rwanda is, broadly speaking, surrounded by savanna regions, except to the west, where the tropical rainforests of Africa are located.
2.2 Filter sampling
Quartz filter samples (Millipore, 150 mm diameter) were collected with a high-volume sampler operating at 30 m3 h−1 using a PM2.5 inlet (DH-77, DIGITEL Elektronik AG, Switzerland). Nighttime only (01:00 to 06:00 CAT) sampling was conducted to minimize the effects of local emissions and daytime local atmospheric chemistry and to increase the likelihood of capturing the regional, free troposphere, signals. This strategy is supported by high temporal resolution investigations of the diurnal cycle of, e.g., BC (DeWitt et al., 2019). Each sample was collected over a period of 7 d. The samples were pre-combusted in aluminum foil envelopes (400 ∘C for 5 h) and were treated with special attention to minimize contamination. The samples were subsequently shipped to Stockholm University for chemical analysis and isolation for carbon isotope analysis. The samples were stored in freezers both on site and at Stockholm University. Field blanks were collected on a monthly basis. The present campaign covers the period from October 2014 to September 2015. However, the period from December 2014 to April 2015 is missing due to a lightning strike that damaged the instrument. Thus, this study presents results from the analysis of filter samples (in total 25) collected for the periods that cover the beginning of the 2014 fall rainy season (October–November), the end of the spring 2015 rainy season (April–May), and the dry 2015 summer season (June–September). We jointly refer the October–November 2014 and the April–May 2015 periods as the wet seasons.
2.3 Concentration analysis
The concentrations of elemental carbon (EC – mass-based tracer for black carbon) and organic carbon (OC) were determined with a thermal–optical instrument (Sunset Laboratory Inc., Tigard, Oregon, USA) using the NIOSH 4050 protocol (Birch and Cary, 1996; Table S1 in the Supplement). Pretreatment using acid fumigation with 1M HCl ensured the efficient removal of carbonates. A glucose solution was used to calibrate the flame ionization detector (FID) response of the instrument, and the long-term performance of the instrument was checked by running National Institute of Standards and Technology (NIST) Standard Reference Materials (SRM) standards. All of the concentrations were blank corrected, and the field blank input was 2 % for OC and 0 % for EC on average. The average relative standard deviation of the triplicate analysis was 5 % for OC and 7 % for EC.
Water-soluble organic carbon (WSOC) was extracted from filter subsamples in ultrapure Milli-Q water by shaking for 1.5 h. The extracts were filtered using 0.45 µm cutoff polytetrafluoroethylene syringe filters (Minisart-SRP 10, Sartorius Stedim Biotech, Germany). The concentration of WSOC was quantified in the filtered solutions as the difference between total water-soluble carbon and water-soluble inorganic carbon using a high-temperature catalytic oxidation instrument TOC-5000A (Shimadzu, Japan). The samples were neither acidified nor purged, in order to avoid the loss of volatile organic compounds. The accuracy of the measurement ranges from 7 % (70 µg L−1) for 1 mg L−1 of carbon solution to 3 % for concentrations higher than 2 mg L−1 of carbon (corresponding to 60 µg L−1). All of the measurements were blank corrected. WSOC field blanks corresponded to an average of 0.5 %. The average relative standard deviation of the triplicate analysis was 10 %.
The concentrations of water-soluble inorganic anions were determined by ion chromatography using a Dionex ICS-2000 system. Anions were separated using an IonPac AG11 2 mm × 50 mm Dionex guard column, an IonPac AS11 2 mm × 250 mm Dionex separation column, and an ASRS 300 self-regenerating suppressor. A solution of KOH was used as eluent. Cations were separated using an IonPac CG16 3 mm × 50 mm Dionex guard column, an IonPac CS11 3 mm × 250 mm Dionex separation column, and a CSRS 300 self-regenerating suppressor. The analysis of cations was performed using 30 mM solution of methanesulfonic acid (MSA) as eluent. Field blanks constituted 3 % of NO3−, 2 % of , and 1 % of and K+ ion concentrations on average. The triplicate analysis showed the average relative standard deviation of 2 % for NO3− and K+, 5 % for , and 6 % for .
2.4 Isotope analysis
Approximately every second sample (n=12) was selected for carbon isotope (Δ14C and δ13C) analysis of total carbon (TC = OC + EC; Table S1). The filter samples were combusted using the Sunset analyzer (total carbon protocol), and the evolved CO2 was collected in glass vials using a liquid nitrogen cryo-trap (Andersson et al., 2015). The vials were subsequently shipped to the National Ocean Sciences Accelerator Mass Spectrometry (NOSAMS) facility at the Woods Hole Oceanographic Institute (Falmouth, Massachusetts, USA) for analysis of the dual carbon isotope signatures. The Δ14C signature was measured using accelerator mass spectrometry (AMS), while the δ13C signature was measured using an isotope ratio mass spectrometer (IRMS).
2.5 Source Apportionment
The Δ14C signature allows for differentiation between the relative contributions of biogenic ∕ biomass burning and fossil sources. The biogenic ∕ biomass burning fraction (fbio) may be calculated using isotopic mass-balance ():
The fossil endmember is −1000 ‰, as it is completely depleted in 14C. The biomass endmember is more complex. For annual plants it is fairly straightforward: the biomass Δ14C signature equals the Δ14C value of CO2 for that year (∼ +20 ‰ for 2014/2015, Graven, 2015; Turnbull et al., 2017). For more long-lived species (e.g., trees), the Δ14C signature is the average of the atmospheric CO2 values (weighted by yearly carbon accumulation) over the plants' lifetime. Therefore, bottom-up estimation of Δ14Cbio requires information regarding the plant distribution in the area of interest and the annual bioaccumulation of carbon for the different plants. As an alternative, we use the combined Δ14C signature of dissolved organic carbon (DOC) in three of the regions' major rivers, the Congo, the Zambezi, and the Tana, to obtain a regional Δ14Cbio of ‰, which is well within the expected range of a mixture of annual and multiyear plants (Marwick et al., 2015; Wild et al., 2019; Winiger et al., 2019).
The vegetation in SSA may be divided into two main photosynthetic classes: C3 plants and C4 plants (see discussion in Sect. 3.5). These two groups have distinct δ13C signatures, which allow for isotope-based separation. We may then resolve three source classes by combining Δ14C and δ13C – C3 plants, C4 plants, and fossil – via isotopic mass-balance (Andersson et al., 2015):
Endmember variability may significantly influence the calculated source fractional contributions (Andersson, 2011). For a discussion on the specific endmember ranges used here, see Sect. 3.5.
In Eq. (2), the isotopic data are treated as independent. However, here we find that there is a dependence between the isotope ratios and the TC concentrations; thus, Δ14C(i) ∼ , where A and B are constants, and i is the sample index (Fig. 5). This is known as a Keeling relation, and it is discussed in more detail in Sect. 3.4. The relation holds for both Δ14C (R2=0.85, p<0.01) and δ13C, whereas the correlation is weaker for δ13C (R2=0.55, p<0.1). A method for using correlations within the framework of Bayesian source apportionment has recently been developed (Martens et al., 2019). The rationale is based on both statistical concepts and the averaging expected from atmospheric mixing. The endmember ranges used in the calculations are from isolated sources, but during long-range transport the variability within a given source, e.g., savanna fires, will be reduced. Using correlations between data points, a means for accounting for the mixing is obtained, and more realistic source fraction estimates are derived. When using the estimated source fractions to back-calculate the isotope signatures, the agreement is good compared with direct fits (Figs. 5, S2). A sensitivity analysis is discussed in Sect. 3.5 (Fig. S3)
Thus, to account for the correlations in the dataset, we add a second constraint in the source apportionment calculations that is based on the relation to the TC concentrations:
Here, instead of fitting a source vector (, ffossil, ) for each individual data pair, we fit two vectors – a slope and an intercept of the line – to all data points. This clearly offers the advantage of have fewer fitting parameters. We emphasize that the strength of the correlation of the isotope signatures relative to 1∕TC is naturally incorporated into this relation; hence, the lower correlation of δ13C with respect to 1∕TC imposes weaker constraints on the calculated source fractions compared with Δ14C.
The source fractions were computed using numerical Markov chain Monte Carlo simulations, implemented in MATLAB, version 2015b, using 1 000 000 iterations with a burn-in (initial search phase) of 10 000 and a data thinning of 10 (removing stepwise correlations). The stochastic perturbation parameter was adjusted in order to obtain an acceptance ratio of 0.23, which has been suggested to be optimal for Metropolis–Hastings algorithms (Roberts et al., 1997). For this setup, the variability in the numerically estimated parameters, e.g., the standard deviation of the relative source fraction, is lower than 1 % of the mean value, suggesting good convergence (Winiger et al., 2017).
2.6 Air mass back-trajectories and remote sensing
Using the NOAA Hybrid Single Particle Lagrangian Integrated Trajectory (HYSPLIT) model, 10 d air mass back-trajectories at an arrival height of 2690 m a.s.l. (100 m a.g.l.) and 3090 m a.s.l. (500 m a.g.l.) were calculated (Fig. 1, Fig. S1 in the Supplement). Remote sensing fire-spot detections were retrieved from the NASA Fire Information for Resource Management Services (FIRMS) database, based on retrievals from the Moderate Resolution Imaging Spectroradiometer (MODIS) satellite product.
3.1 Back-trajectory analysis
Air mass back-trajectory analysis shows that the air masses arriving at the Rwanda Climate Observatory (RCO) during the filter collection periods are generally from the east/southeast (Figs. 1, S1). There is some overlap between the wet and boreal summer dry seasons, but there is a seasonal switch overall: the wet seasons air masses are from a more easterly origin (e.g., Uganda, Kenya, and Tanzania), whereas the dry season air masses are from more southeasterly directions (e.g., Burundi, Tanzania, and the Democratic Republic of Congo). During the dry season there are extensive fires to the south of RCO, mainly to the southwest (Democratic Republic of Congo and Angola). However, the air masses also pass over regions with comparably high fire activities in the southeast, mainly in Tanzania. Nevertheless, we emphasize that back-trajectory analysis is challenging in mountainous regions (e.g., Winiger et al., 2019), and the actual geographical footprints are expected to be broader, e.g., due to the propagating effects of turbulence. Here, we interpret the back-trajectories qualitatively to visualize overall air mass transport patterns.
3.2 Concentrations of fine aerosol components
During the present campaign, the PM2.5 carbonaceous and inorganic ion components show a strong seasonal variability, with elevated levels during the dry JJA season (Fig. 2, Table S1). The dry ∕ wet season ratios for TC, EC, WSOC, , , , and K+ were 4.2, 7.0, 4.1, 12.6, 3.0, 3.2, and 8.8, respectively (Table 1). The sea-salt contributions to the ions are generally estimated to be less than 1 %, using corrections with sodium ions (Blanchard and Woodcock, 1980). Here, we report the actual concentrations to facilitate direct comparisons with previous studies (Table 1). Overall, these differences reflect differences in the aerosol atmospheric lifetime, air mass transport pathways, and emission seasonality (e.g., fires). Elevated ratios of EC and K+ suggests an increased influence from biomass burning during the dry season. , which displays the largest seasonal shift, is often associated with oxidized NOx from traffic emissions or lightning strikes; however, it is also typically elevated in emissions from savanna fires (Table 1; e.g., Gao et al., 2003; Formenti et al., 2003).
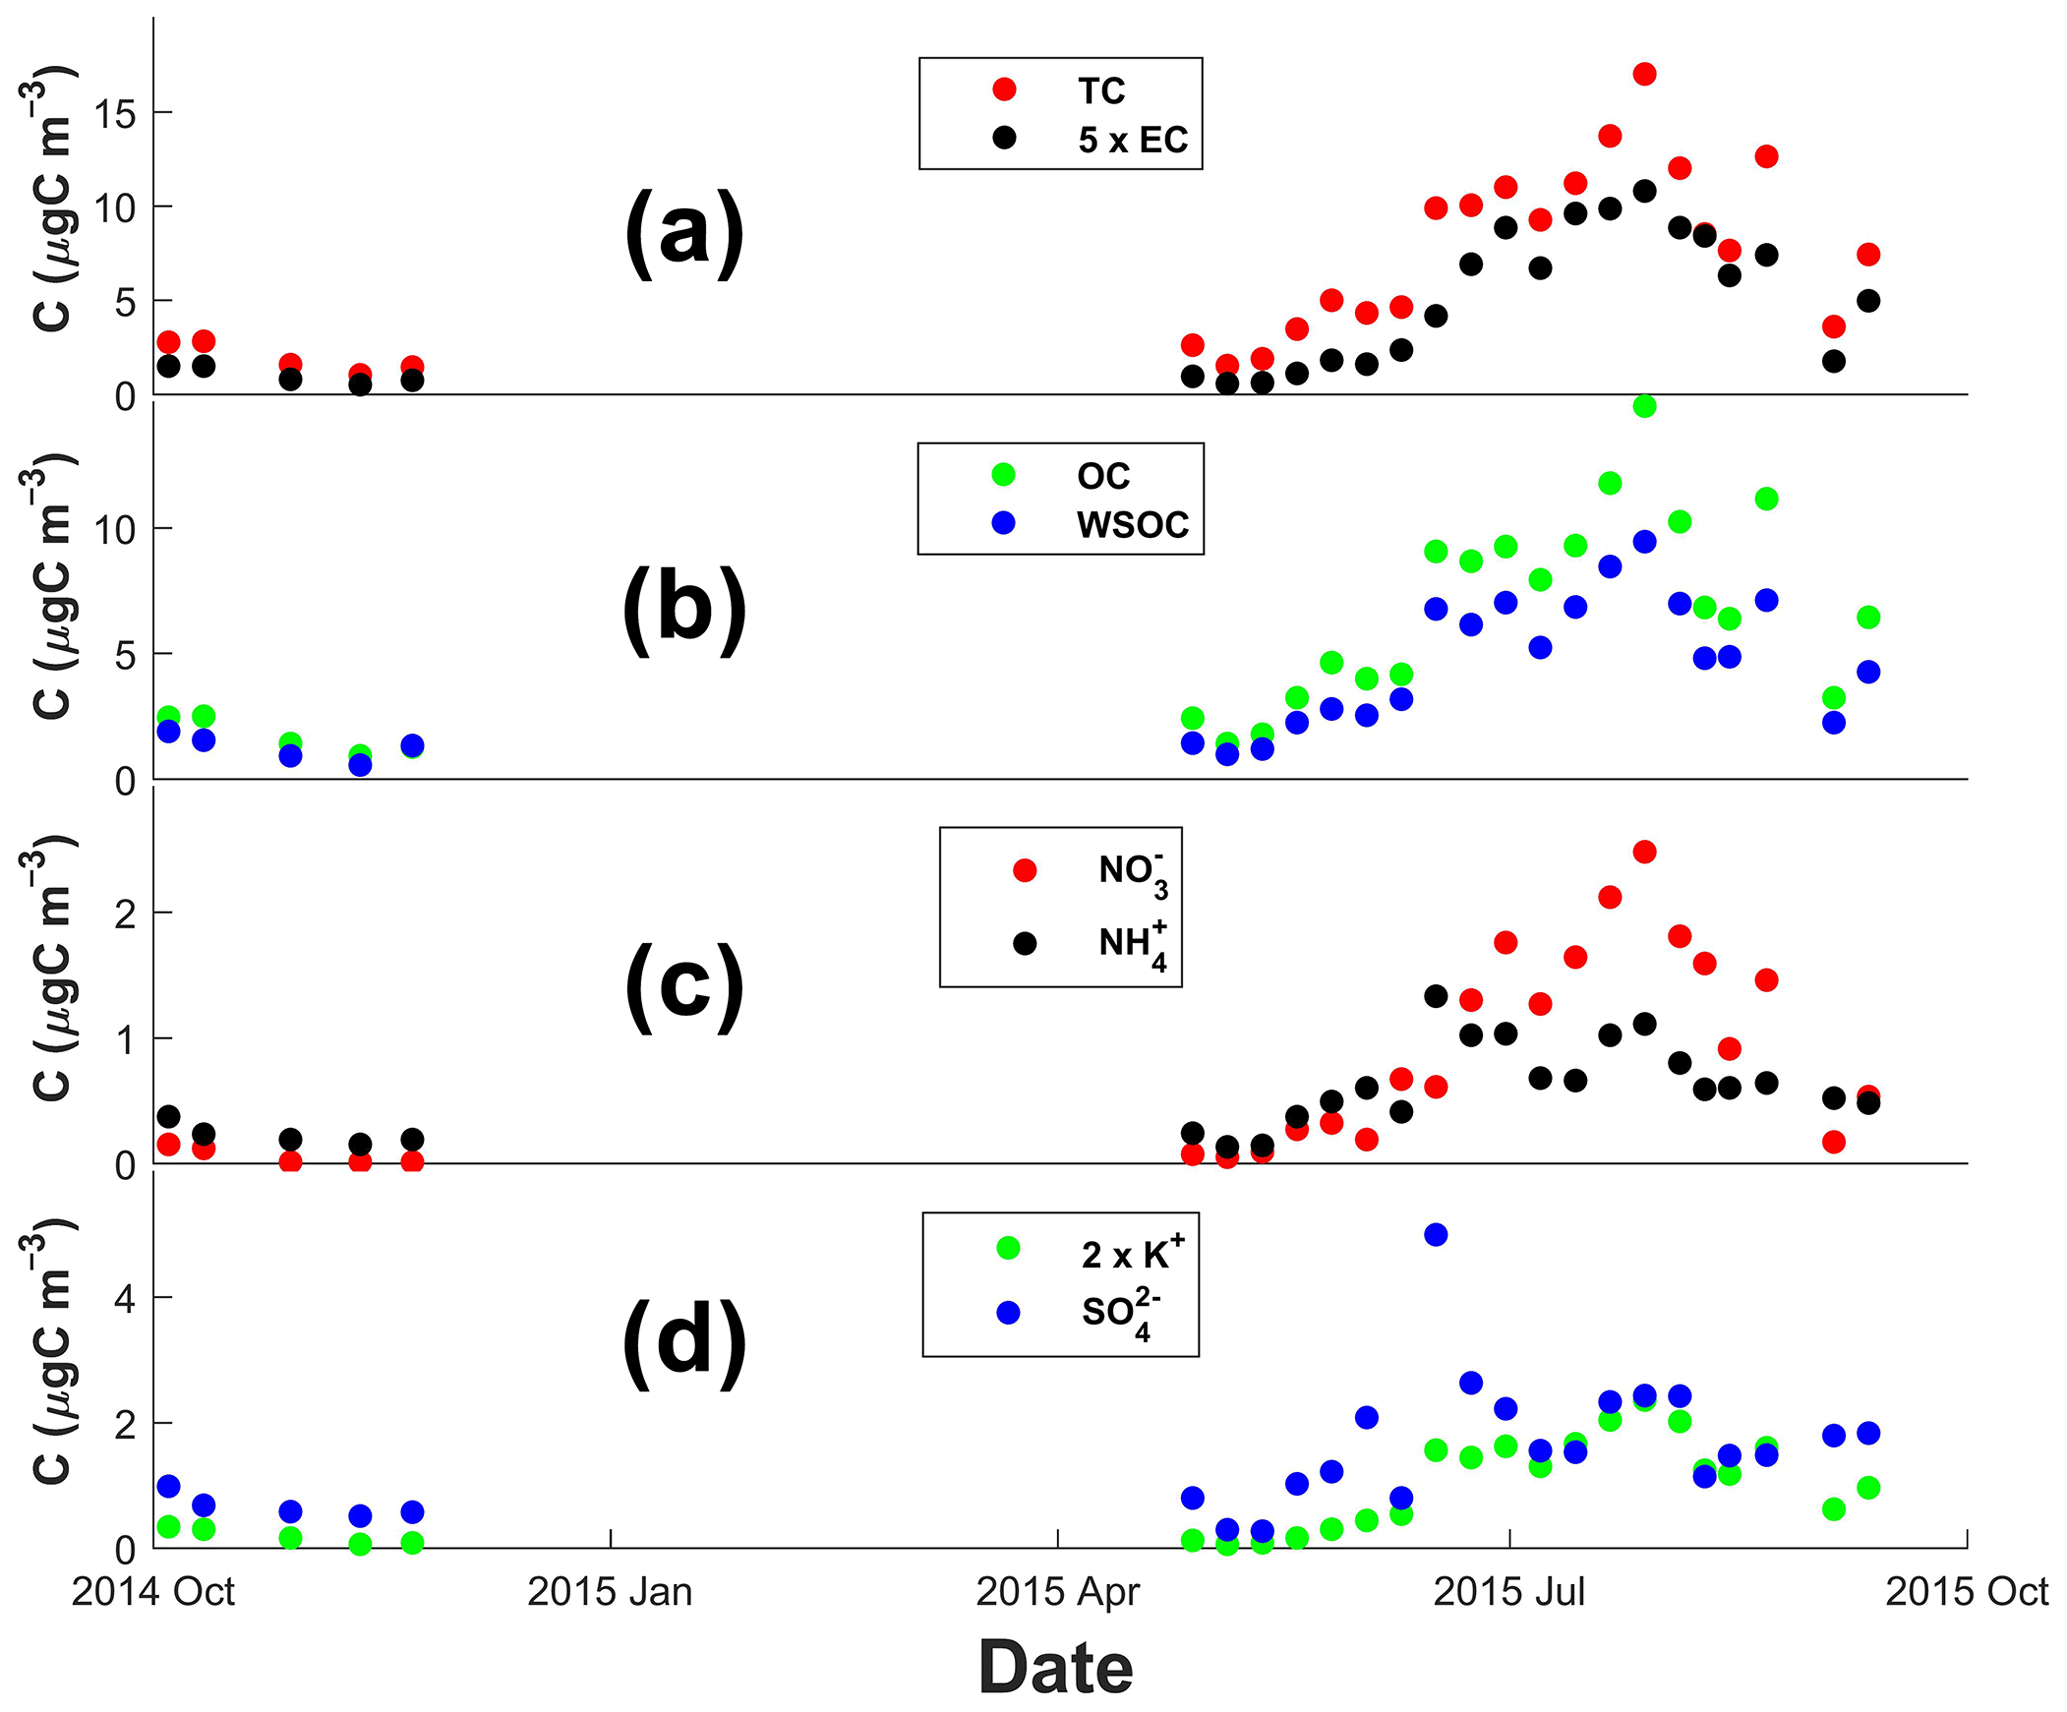
Figure 2The time dependence of the concentrations of carbonaceous aerosols (TC denotes total carbon; EC denotes elemental carbon; OC denotes organic carbon; WSOC denotes water-soluble organic carbon) and inorganic ions in PM2.5 from October 2014 to September 2015 at the Rwanda Climate Observatory. Panel (a) shows TC and EC, panel (b) shows OC and WSOC, panel (c) shows and , and panel (d) shows K+ and . Instruments were hit by lightning, resulting in a data gap from November 2014 to April 2015. For visual clarity, the concentrations of EC were multiplied by 5, and the concentrations of K+ were multiplied by 2.
The dry season concentrations of carbonaceous aerosol components and inorganic ions reported here show good overall agreement with the concentrations observed in dry season rural and aged savanna fire air masses (Table 1). The BC values are in the same range as those observed at Mt. Kenya (0.72±0.06 µgC m−3, Gatari and Boman, 2003). During the atmospheric aging of a biomass plume, the values of OC, EC, and K+ decrease by a factor of 2–3, whereas other components are relatively unaffected (Table 1). However, the effects appear variable compared with savanna fires in South Africa (Gao et al., 2003).
The RCO is situated not far from the Nyiragongo and Nyamuragira volcanoes in the eastern Democratic Republic of Congo. High spatial resolution (13×24 km2) satellite monitoring of the SO2 levels shows near-constant emissions from these volcanoes over the time period covering the present campaign, which likely affected the observed sulfate levels (Barrière et al., 2017). Here we observe a spike in sulfate levels (∼5 µg m−3) during the week starting on the 13 June 2015 (Fig. 2) but with no clear linkage to an increase in volcanic SO2 emissions.
3.3 Source marker ratios and correlations
Overall, the ratios of different aerosol components provide insights into sources or atmospheric processes. Here, the EC∕TC ratio shows a distinct seasonality (Fig. 3, Table S1). More commonly analyzed, however, is the OC∕EC ratio (calculated as ), which shows elevated levels during the wet season (11±3) compared with the dry season (7±3; Table S1). The OC∕EC ratio is sometimes used as a marker for biomass burning, but it is highly influenced by burning conditions such as flaming or smoldering fires. In addition, it is highly impacted by atmospheric processes such as secondary organic aerosol (SOA) formation or photochemical aging (e.g., Dasari et al., 2019). The dry season values observed here are similar to those that have been observed in background air at other dry season sub-Saharan African sites (Table 1).
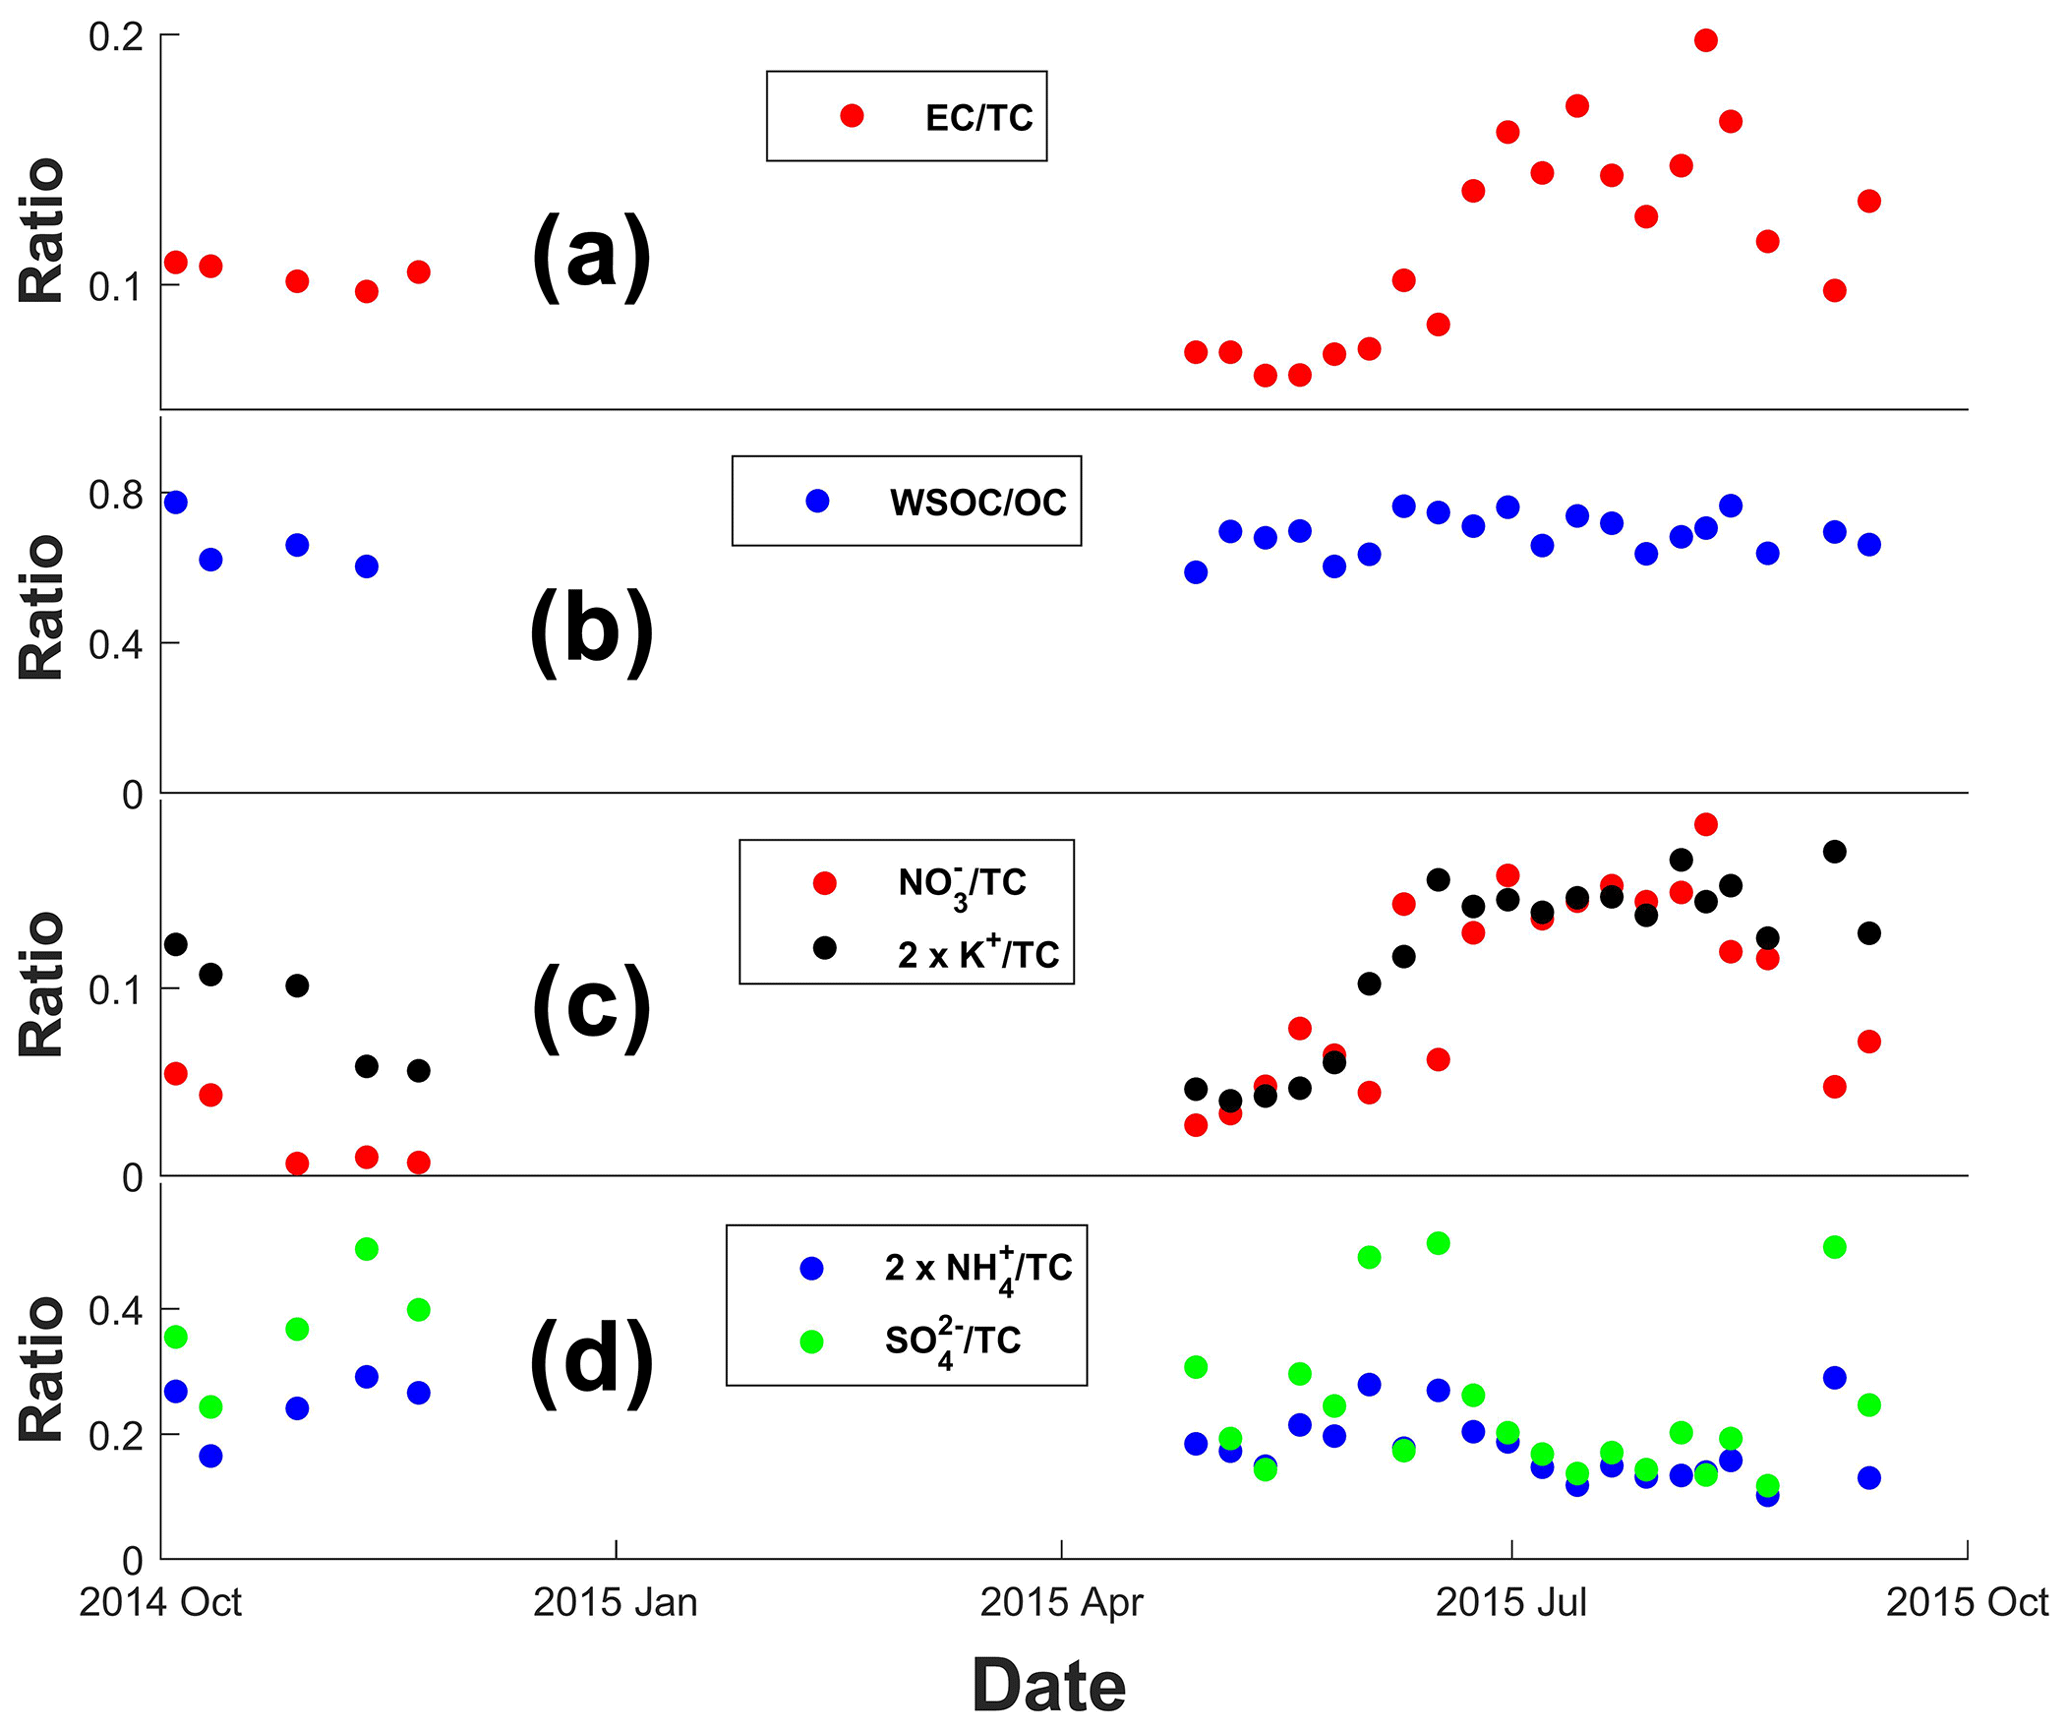
Figure 3The time dependence of ratios of carbonaceous aerosols (EC denotes elemental carbon; OC denotes organic carbon; WSOC denotes water-soluble organic carbon) and inorganic ions relative to total carbon (TC) in PM2.5 from October 2014 to September 2015 at the Rwanda Climate Observatory. Panel (a) shows the EC∕TC ratio, panel (b) shows the WSOC∕OC ratio, panel (c) shows the and ratios, and panel (d) shows the and ratios. Instruments were hit by lightning, resulting in a data gap from November 2014 to April 2015. The concentrations of the and ratios were multiplied by 2 for visual clarity.
Similarly, the and ratios are also elevated during the wet seasons (Fig. 3), whereas they decrease during the dry seasons, suggesting a different source profile compared with EC, K+, and , including potential volcanic input from SO2. In contrast, the WSOC∕OC ratio shows no clear seasonality, indicating small differences in sources and atmospheric processing of water-soluble and water-insoluble organic components during the year. TC correlates with K+ (an R2 of 0.95 and p<0.01) and (an R2 of 0.95 and p<0.01), suggesting that the incomplete combustion regime during the present campaign is governed by biomass emissions, e.g., savanna burning. Based on these results, these ratios qualitatively suggest that the aerosol regime at RCO is strongly influenced by the occasional input of biomass burning products during the boreal dry season.
3.4 Carbon isotopes
Radiocarbon (Δ14C) and stable carbon (δ13C) provide detailed information regarding the sources and atmospheric processing of carbonaceous aerosols. Here, we investigated the signatures of TC for roughly every second sample during the campaign. The Δ14C marker is not influenced by atmospheric processing and may be used to directly compute the relative contributions of fossil and biomass ∕ biogenic sources with high precision, Eq. (1). The Δ14C signature shows an oscillation over the seasons, ranging between −84 ‰ in November 2014 and +30 ‰ in July 2015 (Fig. 4, Table S1). Thus, during the JJA season, the Δ14C signature exceeds the signature for atmospheric CO2 (+20 ‰, Graven, 2015; Turnbull et al., 2017).
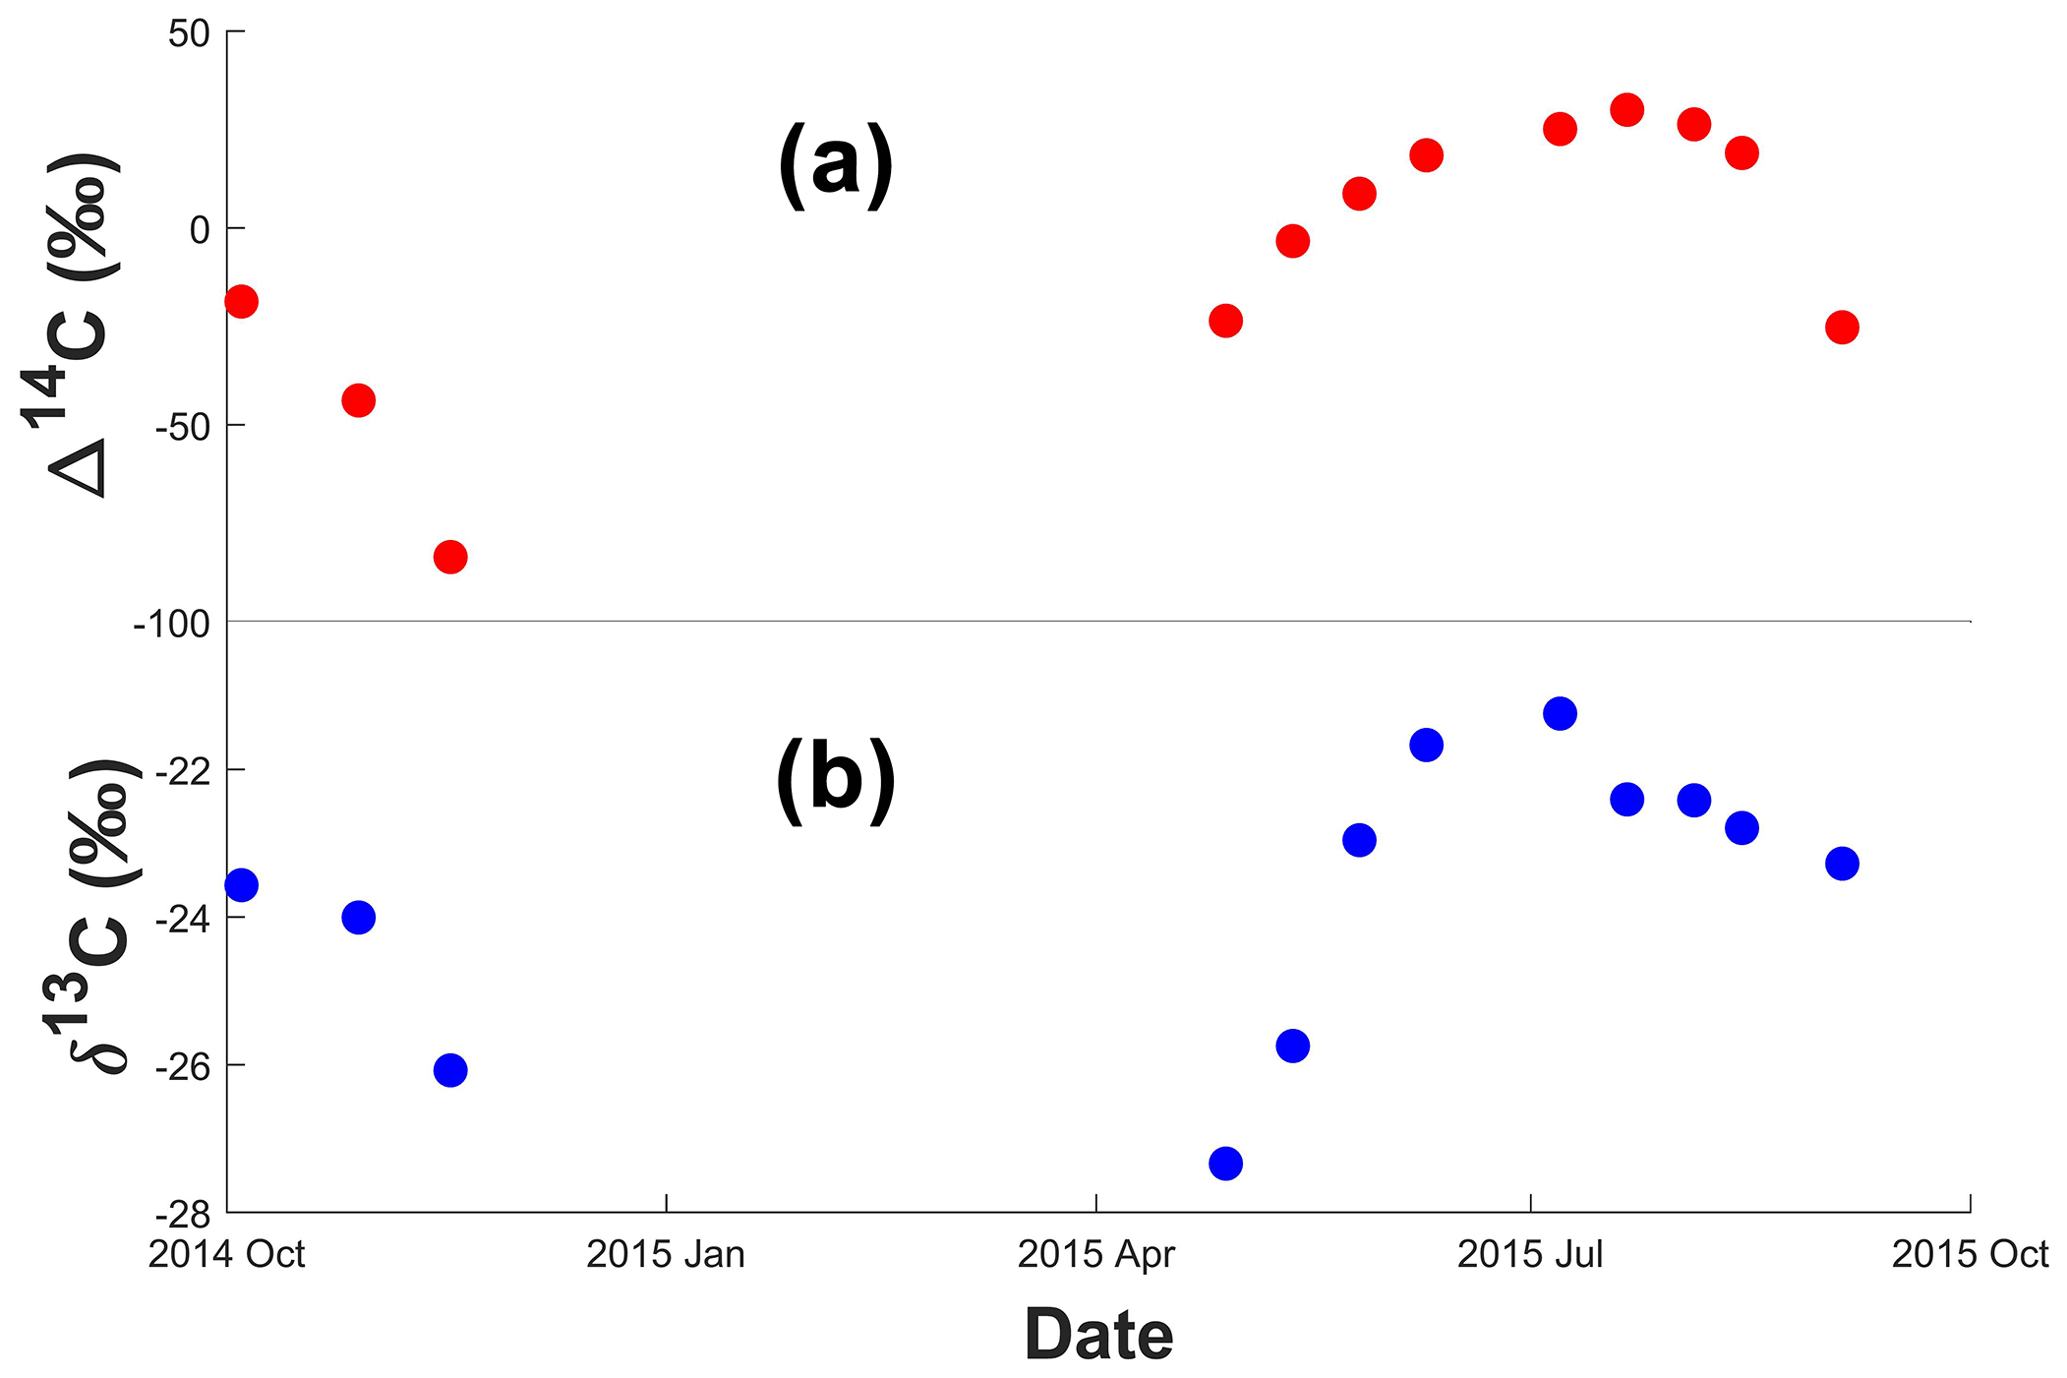
Figure 4Dual carbon isotope data for TC vs. time. Panel (a) shows Δ14C, and panel (b) shows δ13C. The uncertainties for Δ14C are below 50 ‰, and the uncertainties for δ13C are below ∼0.2 ‰. Instruments were hit by lightning, resulting in a data gap from November 2014 to April 2015.
Using Eq. (1), the percentage biomass ∕ biogenic TC for the Δ14C = +30 ‰ sample is 97 %. During the wet season, the percentage derived from fossil sources reaches 13 %, which possibly points to a more local derivation. Δ14C correlates with 1∕TC (an R2 of 0.85 and p<0.01), which suggests that the variability in concentrations can be explained as a two-component mixture: a stable background and a temporally fluctuating source (Keeling, 1958; Fig. 5a). This inverse relation gives a Δ14C of ‰ as TC approaches infinity, showing that the non-background component is of biogenic ∕ biomass burning origins. The Δ14C signatures for TC reported here are generally higher than for monitoring sites in South and East Asia (Sheesley et al., 2012; Kirillova et al., 2014; Bikkina et al., 2016).
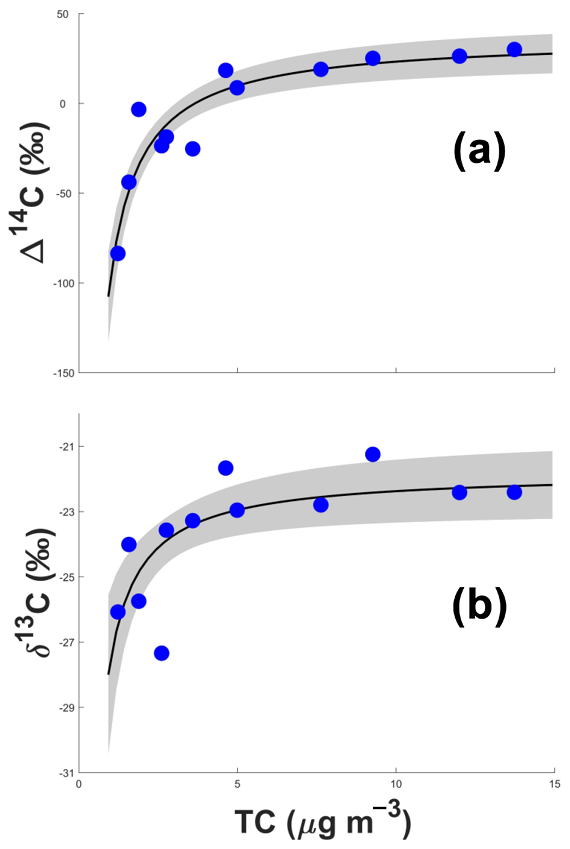
Figure 5Interrelations of carbon isotope signatures and TC (blue circles). Panel (a) shows Δ14C vs. TC, and panel (b) shows δ13C vs. TC. The black line is the mean fit of the equation Δ14C, , using Markov chain Monte Carlo simulations, where A and B are fitting parameters. For Δ14C, A is ‰ µg m−3 and B is 37±6 ‰. For δ13C, A is ‰ and B is ‰ µg m−3. The gray shaded areas display the 1σ spread of the fit.
In contrast to Δ14C, the δ13C value is influenced by both atmospheric processes (i.e., kinetic isotope effects, KIEs) and source signatures. Here, the δ13C value shows a similar pattern relative to the Δ14C value: it is depleted in 13C (min δ13C of−27 ‰) during wet seasons and higher during the dry season (max δ13C of −21 ‰) (Fig. 4b). The correlation with respect to 1∕TC (an R2 of 0.55 and p<0.1) is weaker than that for Δ14C (Fig. 5b). The direct fossil vs. biomass source correlation from the Δ14C Keeling curve is also driving the δ13C signatures, but the higher variability is explained by larger endmember variability and the potential influence of KIEs (see Sect. 3.5). An overall enrichment in 13C has been found in aged air masses in South Asia, especially for WSOC (Kirillova et al., 2013; Dasari et al., 2019), although less so for TC. In fact, the enrichment of 13C in WSOC often appears to be counteracted by a decrease in water-insoluble OC (e.g., Yan et al., 2017; Fang et al., 2017).
The TC δ13C values, and their seasonal trend, are similar to those previously observed in fine aerosols at a rural site in Tanzania (May–August 2011; Mkoma et al., 2014). However, the temporal trend appears shifted in the RCO samples from values of around −25 ‰ to around 22 ‰ in mid-May. At the Tanzanian site, a similar shift occurs in mid-June. In addition to the complications of comparing measurements conducted at different sites during different years, there is good agreement in the δ13C values, and the temporal offset may be explained by variability in the position of the intertropical convergence zone. Similarly, the δ13C value for TC at a savanna woodland site in Zambia, observed during August–September 2000, was ‰ (Billmark et al., 2005), while values between −19.3 ‰ and −23.6 ‰ were observed at sites in Côte d'Ivoire (Cachier et al., 1985).
3.5 Carbon isotope-based source apportionment
By combining the Δ14C and the δ13C values, we can resolve three major sources of TC at the RCO using isotopic mass-balance, Eq. (2). However, there are some important considerations to this approach: first, the δ13C value is not an exclusive source marker and is also affected by atmospheric processing (e.g., photochemical oxidation and secondary formation); second, the main source categories must be defined and distinguishable using carbon isotopes; and third, the source values of the isotope signatures, the endmembers, and their natural variability need to be established.
As mentioned, the δ13C value of bulk TC appears to be considerably less affected by atmospheric processing compared with subcomponents, such as WSOC. Here, the temporal variation of the δ13C value is qualitatively similar to that of the Δ14C value (Fig. 4). As Δ14C is not affected by atmospheric reactions, this suggests that source variability is a key driver of the δ13C variability. Furthermore, the WSOC∕OC ratio is virtually constant throughout the year (Fig. 3); the WSOC∕OC ratio has been found to be highly affected by atmospheric processing and related to shifting δ13C (Kirillova et al., 2013; Yan et al., 2017; Fang et al., 2017; Dasari et al., 2019). Here, we therefore assume that the δ13C ratio of TC is not strongly perturbed by atmospheric processing during long-range transport and may, thus, be used as a source marker. Nevertheless, we explore the potential influence of the KIEs, as well as endmember variability, on the source apportionment results in a sensitivity analysis.
Turning to potential sources, there is a multitude of potential source categories for TC in SSA. However, many of these falls into broad categories with similar carbon isotope signatures. Around the world, the applications of dual carbon isotope source apportionment techniques in ambient TC has mainly identified/considered six broad source categories: C3 plants, C4 plants, liquid fossil fuels (e.g., traffic), coal combustion (solid fossil), gas flaring (gaseous fossil), and marine emissions (Winiger et al., 2019; Andersson et al., 2015; Kirillova et al., 2013). Overall, the practice of coal combustion in SSA is expected to be much less frequent than in, for example, South and East Asia; therefore, we do not consider this source further. In addition, marine emissions are not expected to have a large influence at RCO, which is supported by the low estimates of marine contributions to the inorganic ions (<1 %). For gas flaring, there are potential distant sources around the Arabian Peninsula and off the west coast of Africa, in the Gulf of Guinea. However, given the distances to the RCO station and the prevailing wind directions, emissions from flaring are not expected to affect the site, while the δ13C signatures for gas flaring are strongly depleted in 13C (δ13C < −38 ‰; Winiger et al., 2017) and even a small contribution would shift the observed values significantly.
The remaining three main source categories are the two biomass sources of C3 (e.g., trees) and C4 plants (e.g., sugarcane and certain grasses) and liquid fossil fuels (Fig. 6). Aerosols from liquid fossil fuel sources have a Δ14Cfossil of −1000 ‰ (completely depleted in 14C) and a δ13Cfossil of ‰ (Widory, 2006; Andersson et al., 2015). The Δ14C of biomass was established in Sect. 2.4 as ‰. The δ13C of C3 plants in general is ‰ (Bender, 1971; O'Leary, 1988). However, for aerosols generated from C3 plants, this value may be either enriched (e.g., ∼0.5 ‰ biomass burning) or depleted (e.g., ∼0 ‰ to 4 ‰ during SOA formation) (Turekian, 1998; Das et al., 2010; Mkoma et al., 2014; Aguilera and Whigham, 2018). In any case, the numerical spread in the δ13C value of these different sources is largely overlapping with that of the raw materials; therefore, we use this value here. The δ13C of C4-plant materials is ‰ (Bender, 1971; O'Leary, 1988; Turekian et al., 1998). However, during incomplete combustion, the may be reduced by a factor ranging from 0 ‰ to 7 ‰, which is largely dependent on burning conditions and species (Martinelli, 2002; Das et al., 2010; Aguilera and Whigham, 2018). Accounting for such effects in source apportionment is a challenge, especially as the reported values are ranges and not mean and variability; thus, they are highly influenced by potential outliers. Here, we use a method discussed in Andersson et al. (2015) to address the issue of the statistical analysis of ranges by assuming that the total range corresponds to the 95 % confidence intervals of a normal distribution. This corresponds to the range of 4 times the standard deviation, yielding ‰, while the mean is ‰. Combining this with the variability of the of pure C4 plants we obtain the following: : ‰, where ‰2. These values are also what is obtained by numerical estimation of the convolution of a normal distribution ( ‰, σ=1.2 ‰) with a uniform distribution ([] ‰), adding to the strength of the statistical representation.
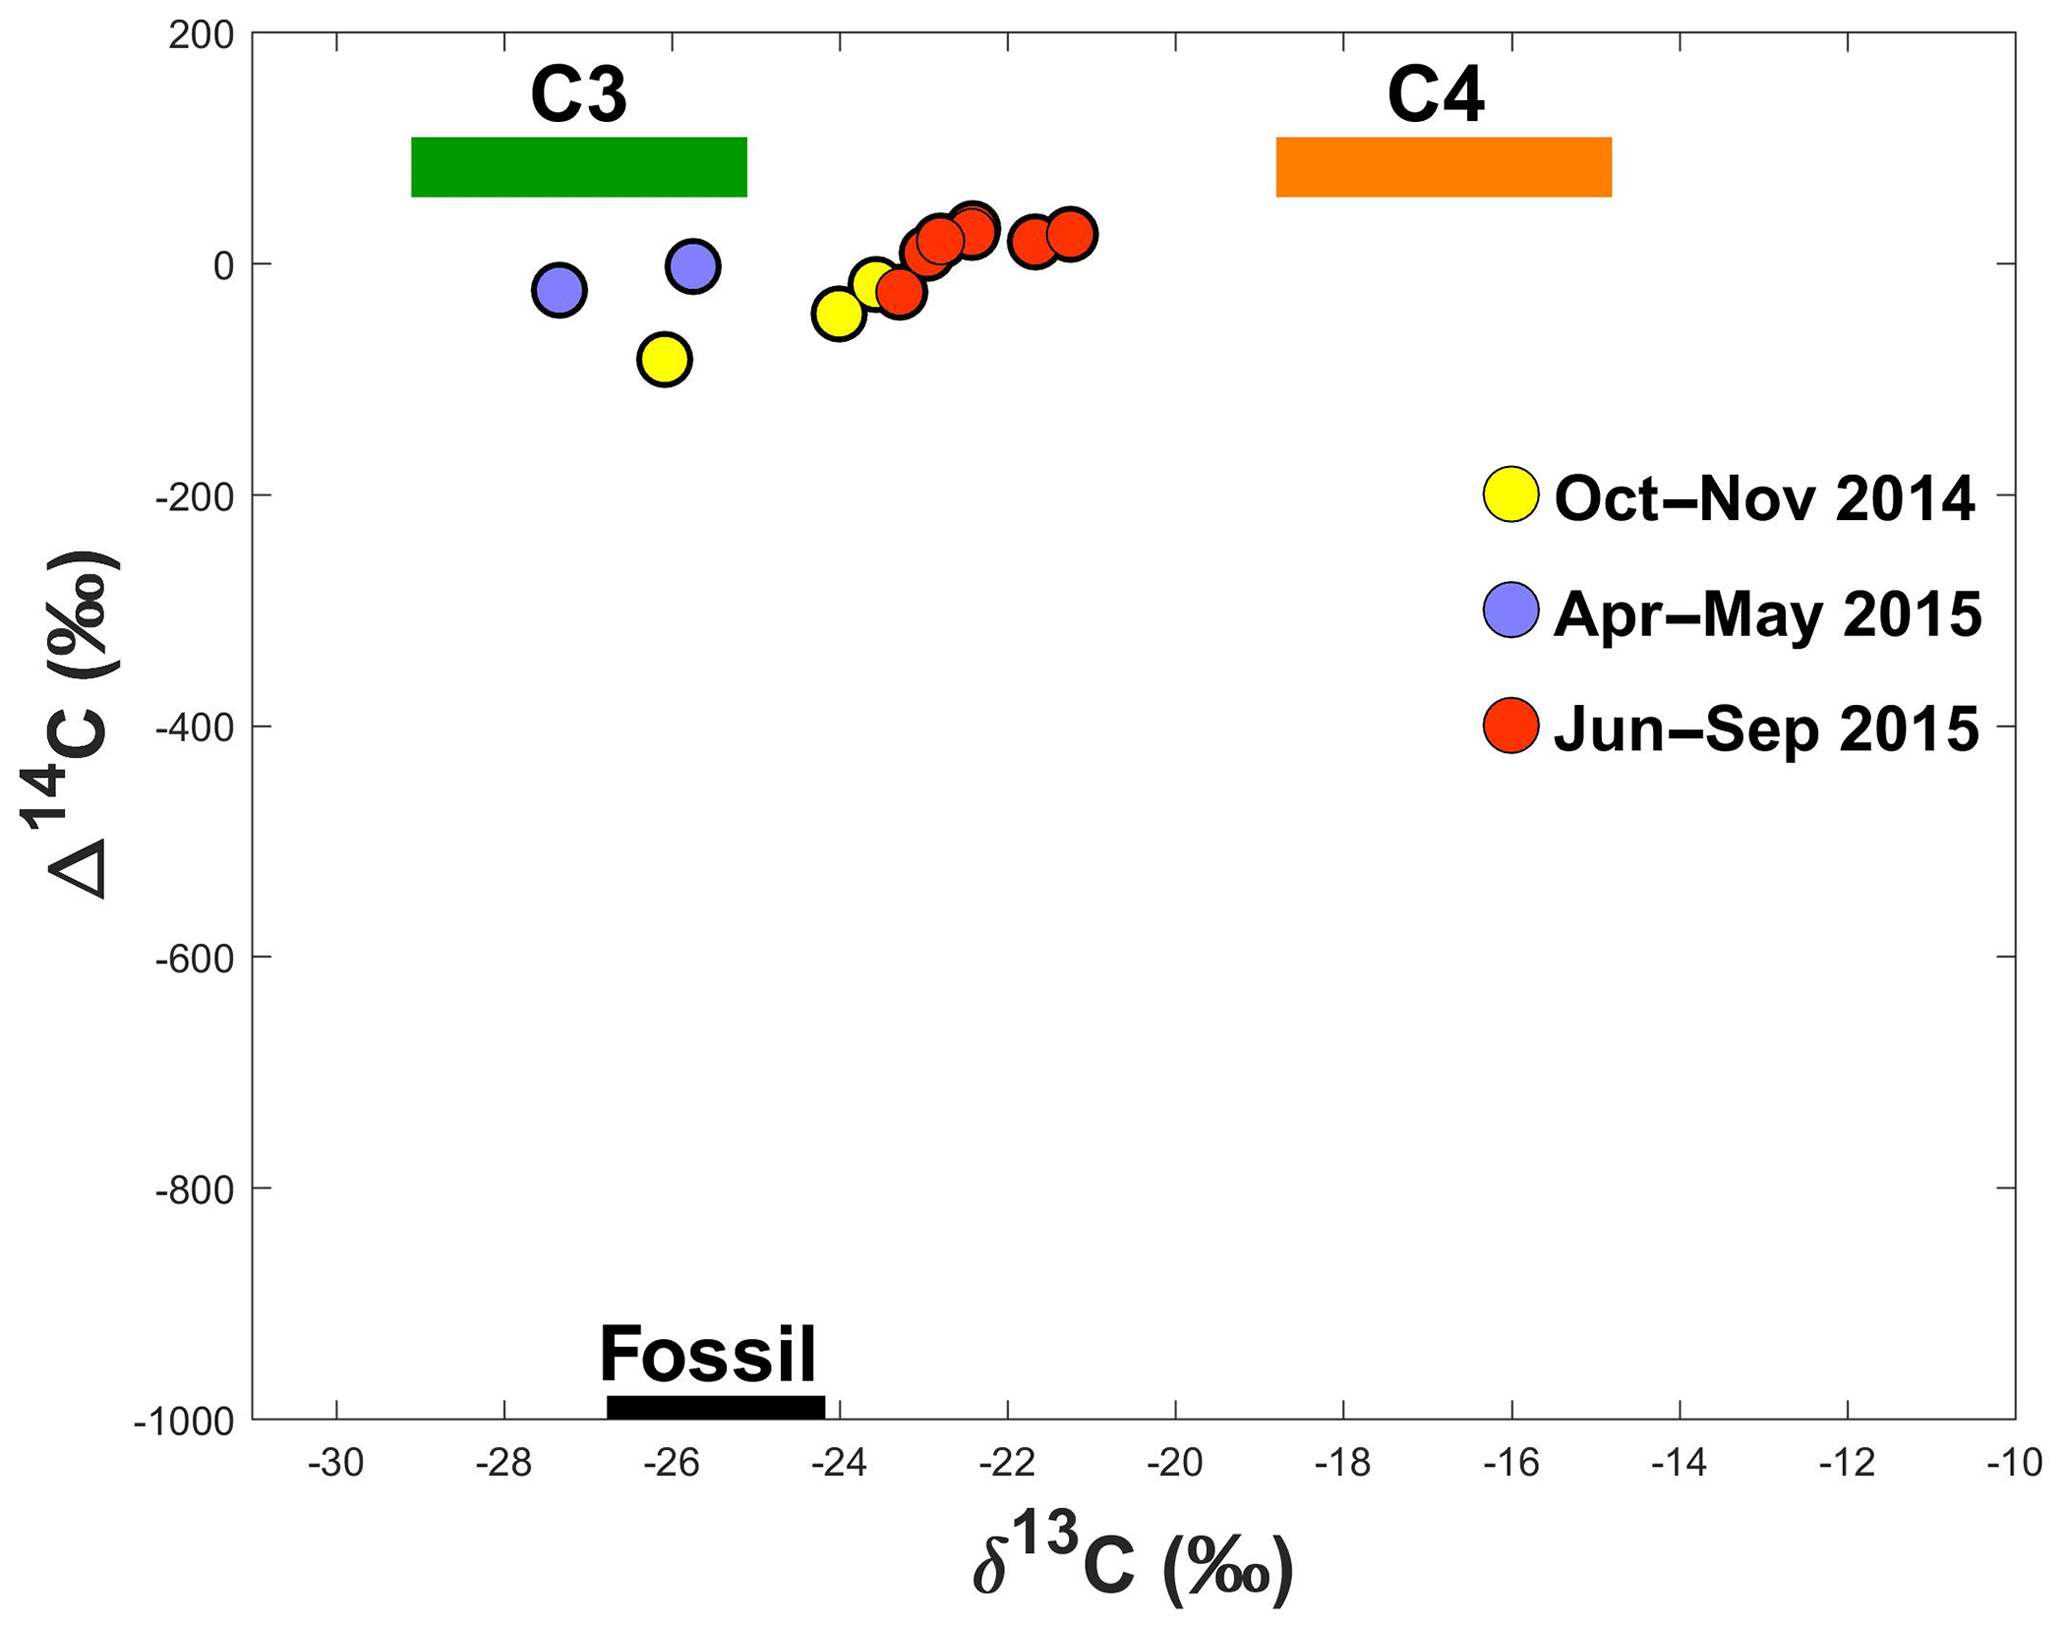
Figure 6Dual carbon (Δ14C vs. δ13C) isotope plot of TC. Blue circles represent October–November 2014 (wet), yellow circles represent April–May 2015 (wet), and red circles represent June–September 2015 (dry). The boxes represent the endmember ranges (mean ± SD; see Sect. 3.5 for details) of the three main sources: C3 plants (green), C4 plants (orange), and fossil (black).
The fractional source contributions of fossil fuel, C3, and C4 to TC are computed using Eqs. (2) and (3) (Fig. 7). It is well established that the accurate estimation of the fractional source contributions requires explicit incorporation of the endmember variability, and we use a Bayesian framework driven by Markov chain Monte Carlo simulations for this purpose (Andersson, 2011; Andersson et al., 2015). To estimate the influence of the intra-endmember mixing during atmospheric transport, we use the correlations of the isotopes with TC within the Bayesian framework (see Sect. 2.5) to account for the endmember averaging during atmospheric transport (Martens et al., 2019; Fig. 5). The resulting fractional contributions display a large variability when comparing wet and dry conditions (Fig. 7a, Table S2). The dry season is characterized by relatively higher C4-plant contributions, whereas the relative contributions of fossil fuels and C3 plants increase during the wet seasons. Back-calculating the isotope signatures from the computed source fractions from the MCMC simulations essentially reproduces the Keeling relations relative to 1∕TC (Figs. 5, S2). To check the influence of the number of data points used in the Keeling-based MCMC, we computed comparative scenarios where every third data point was used (starting at data point 1, 2, and 3, respectively) (Fig. S3). The standard deviations for the calculated are doubled on average when only every third point is used (5 % vs. 10 %), showing how correlations between multiple data points aid in constraining the sources.
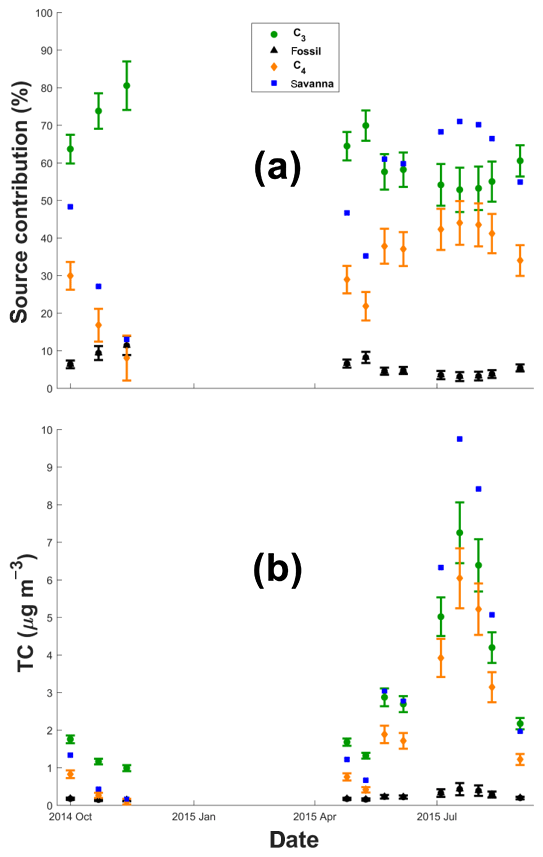
Figure 7Carbon isotope source-segregated fractions and concentrations of TC vs. time computed with the “best endmember scenario”. (a) Relative source contributions (%) of C3 plants (green circles), C4 plants (orange diamonds), and fossil (black triangles). Estimated savanna contributions are shown using blue squares. (b) Source-segregated concentrations of TC of C3 plants (green circles), C4 plants (orange diamonds), and fossil (black triangles). The error bars (standard deviations) were calculated using Markov chain Monte Carlo simulations.
As the δ13C endmembers are not well constrained (in particular for C4 plants), we also employed a sensitivity analysis with respect to endmembers and the potential influence of the KIEs (Tables S2, S3, S4, S5; Figs. S4, S5, S6). In addition to the abovementioned best estimate scenario, we tested two scenarios: a “minimum KIE scenario” with zero KIE ( of ‰) and a “maximum KIE scenario” with a depletion of 5.9 ‰ ( of ‰). The maximum KIE scenario was established such that the ) ratio would be 62 % as TC approach infinity, which amounts to 100 % savanna contributions, see Eq. (4). As expected, these scenarios significantly shift the estimated relative C4 contributions, resulting in a total range of the sample period averages of 24 % (min KIE; min 6 %, max 32 %) to 42 % (max KIE; min 10 %, max 58 %), thereby providing lower and upper bounds (Figs. S4, S5; Tables S3, S4). The corresponding value for our best estimate is 32 % (max 44 %, min 8 %). In addition, we investigated a scenario with a 3 ‰ depletion of the fossil endmember (δ13Cfossil of ‰). As the fossil contribution is low overall, as determined by Δ14C, and as Δ14C constrains the fossil contribution independently of the δ13C data, this shift has no significant influence on the computed source fractions of 6 % (max 11 %, min 3 %; Fig. S6; Table S5). Overall, we stress that these three sensitivity test scenarios represent extreme limits, and the a priori least biased scenario is the initially outlined best scenario.
By combining the estimated fractional source contributions with the TC concentrations, we can estimate the concentrations from the different sources (Fig. 7b), revealing a more accentuated source variability. The average dry-to-wet ratios of the TC to C3 plants, C4 plants, and fossil fuels are 3, 5, and 2, respectively.
Savannas are the main biome supporting C4 plants in SSA. For East African savannas, δ13C data suggest that ∼62 % () of the net primary production (NPP) is from C4 plants (the rest mainly stems from C3 plants; Lloyd et al., 2008). Thus, one may assume that the source characteristics of TC emitted from savanna burning should represent this plant-signature distribution. However, the aerosol emissions modulate the NPP activity through emission factors (EF). The uncertainties of EFs from different biomass burning activities are generally large and overlapping (Andreae, 2019). As a first approximation, we use to estimate the fractional contribution of savanna emissions to TC (fsavanna) as follows:
where i is the sample index.
This analysis shows that the dry season carbonaceous aerosol regime is dominated by savanna fire emissions reaching up to 71 % (Fig. 7, Table S2). These results agree with the elevated levels of EC, K+, and during the dry season (Table S1).
In this paper, we find that the aerosol composition of the emissions affecting the Rwanda Climate Observatory (RCO) may be described as a two-state source mixture: a regional/local background signal modulated by savanna fire emissions. Multiple studies have shown that savanna fires strongly influence the aerosol regime in SSA. Here, we estimate the savanna fire contributions for carbonaceous aerosols to range from 13 % (wet season; TCsavanna of 0.2 µg m−3) to 71 % (dry season; TCsavanna of 9.7 µg m−3) at RCO (Fig. 7). The savanna fires are believed to be mainly lit by humans and, although these activities have possibly been ongoing throughout the Holocene, they strongly perturb the regional ecosystems, climate, and air quality (e.g., Bird and Cali, 1998; Archibald et al., 2012). The annual SSA savanna carbon budget represents a net CO2 source to the atmosphere (Williams, 2007; Cais et al., 2011; Valentini et al., 2014; Palmer et al., 2019). Therefore, finding more sustainable alternatives to the slash-and-burn practices in SSA could possibly turn the region into a carbon sink. For instance, the implementation of early dry season burning may be a possible strategy (Lipset-Moore et al., 2018). Savanna fire mitigation would also improve the regional air quality and stabilize precipitation patterns (Hodnebrog et al., 2015; Heft-Neal et al., 2018; Bauer et al., 2019).
Nevertheless, the current level of scientific understanding of the impact of savanna burning on the environmental system is poor, as are the couplings/responses to climate change, population growth, urbanization, and other key socioeconomic and environmental challenges for sustainable development in SSA (e.g., IPCC, 2014; Liousse et al., 2014; Brandt et al., 2017; UNDP, 2018). Savanna burning mitigation, or shifts in fire regime due to climate change, may change the present steady state in unpredictable ways (e.g., Abreu et al., 2017). To better constrain the multiple environmental impacts of savanna burning in SSA, the comparably few ongoing ground-based in situ observations should be expanded and solidified (Williams et al., 2007; Cais et al., 2011; Kulmala, 2018; López-Ballesteros et al., 2018). For instance, observations of source-segregated aerosol concentrations provide multiple opportunities for advancing our knowledge of environmental processes relevant to SSA, including providing means for testing chemical-transport models; examining the relative importance of cooling vs. warming (e.g., BC) aerosols; ground-truthing remote sensing products; and detailed monitoring of the expected rapid change over the coming decades, including the effects of climate warming, population growth, and urbanization.
The chemical and isotopic data, as well as the MCMC-derived relative source contributions of C3 plants, C4 plants, and fossil, and the corresponding source-segregated TC concentrations are provided in the Supplement.
The supplement related to this article is available online at: https://doi.org/10.5194/acp-20-4561-2020-supplement.
AA wrote the paper, set up the PM2.5 high-volume sampler at RCO, and analyzed the data. ENK and SD conducted the carbonaceous aerosol quantifications and isolations for isotopes, and carried out the ion chromatography analysis. JG worked with the instruments, including helping with or leading installation, and provided feedback on data analysis. KEP was instrumental in setting up the RCO and carried out most of the initial instrument installation. HLD served as the RCO station chief scientist for 3 years. JN and JdDN worked as technical coordinators of the project at different times and facilitated the operations of the station as well as providing feedback on analysis. BS was our University of Rwanda liaison as the head of the master's program in atmospheric and climate science. RGP is the head of the AGAGE network, is the MIT liaison to the RCO, and was essential in the setup of the observatory and scientific analysis. All authors commented on the paper.
The authors declare that they have no conflict of interest.
We thank the generous MIT alumni donors of the Rwanda-MIT Climate Observatory Project and the MIT Center for Global Change Science. We also thank the Government of Rwanda and the Rwanda Ministry of Education. Furthermore, we wish to acknowledge the essential contributions of the Mugogo station technical experts, Theobard Habineza, Modeste Mugabo, Olivier Shyaka, and Gaston Munyampundu, and RBA technician Yves Fidele, without whom running this station would be impossible. August Andersson acknowledges project grants from the Swedish Research council (project nos. 348-2013-114 and 2017-05687). Elena N. Kirillova acknowledges the People Programme (Marie Curie Actions) of the European Union's Seventh Framework Programme (FP7/2007–2013; under REA grant agreement no. 623386). We acknowledge the use of data and imagery from LANCE FIRMS operated by NASA's Earth Science Data and Information System (ESDIS) with funding provided by NASA Headquarters. We also gratefully acknowledge the NOAA Air Resources Laboratory (ARL) for the provision of the HYSPLIT transport and dispersion model and/or READY website (http://www.ready.noaa.gov, last access: 17 April 2020) used in this publication.
This research has been supported by the Swedish Research Council (grant nos. 348-2013-114 and 2017-05687) and the European Commission, Seventh Framework Programme (HIMALAYABROWNCARBON; grant no. 623386).
The article processing charges for this open-access
publication were covered by Stockholm University.
This paper was edited by Alex Huffman and reviewed by four anonymous referees.
Abreu, R. C., Hoffmann, W. A., Vasconcelos, H. L., Pilo, N. A., Rossatto, D. R., and Durigan, G.: The biodiversity cost of carbon sequestration in tropical savanna, Sci. Adv., 3, e1701284, https://doi.org/10.1126/sciadv.1701284, 2017.
Aguilera, J. and Whigham, L. D.: Using the 13C∕12C carbon isotope ratio to characterize the emission sources of airborne particulate matter: a review of literature, Isot. Environ. Healt. S., 54, 573–587, https://doi.org/10.1080/10256016.2018.1531854, 2018.
Andersson, A.: A systematic examination of a random sampling strategy for source apportionment calculations, Sci. Tot. Environ., 412–413, 232–238, https://doi.org/10.1016/j.scitotenv.2011.10.031, 2011.
Andersson, A., Deng, J., Du, K., Zheng, M., Yan, C., Sköld, M., and Gustafsson, Ö.: Regionally-varying combustion sources of the January 2013 severe haze events over Eastern China, Environ. Sci. Technol., 49, 2038–2043, https://doi.org/10.1021/es503855e, 2015.
Andreae, M. O.: Emission of trace gases and aerosols from biomass burning – an updated assessment, Atmos. Chem. Phys., 19, 8523–8546, https://doi.org/10.5194/acp-19-8523-2019, 2019.
Archibald, S., Staver, A. C., and Levin, S. A.: Evolution of human-driven fire regimes in Africa, P. Natl. Acad. Sci. USA, 109, 847–852, https://doi.org/10.1073/pnas.1118648109, 2012.
Aurela, M., Beukes, J. P., van Zyl, P., Vakkari, V., Teinilä, K., Saarikoski, S., and Laakso, L.: The composition of ambient and fresh biomass: burning aerosols at a savannah site, South Africa, South Afr. J. Sci., 112, 1–8, https://doi.org/10.17159/sajs.2016/20150223, 2016.
Barrière, J., Oth, A., Theys, N., d'Oreye, N., and Kervyn, F.: Long-term monitoring of long-period seismicity and space-based SO2 observation at African lava lake volcanoes Nyiarango and Nyamulagira (DR Congo), Grophys. Res. Lett., 44, 6020–6029, https://doi.org/10.1002/2017GL073348, 2017.
Bauer, S. E., Im, U., Mezuman, K., and Gao, C. Y.: Desert dust, industrialization, and agricultural fires: health impacts of outdoor air pollution in Africa, J. Geophys. Res., 124, 4104–4120, https://doi.org/10.1029/2018JD029336, 2019.
Bender, M. M.: Variations in the 13C∕12C ratios of plants in relation to the pathway of photosynthetic carbon dioxide fixation, Phytochem., 10, 1239–1244, https://doi.org/10.1016/S0031-9422(00)84324-1, 1971.
Bikkina, S., Andersson, A., Sarin, M. M., Sheesley, R. J., Kirillova, E., Rengarajan, R., Sudheer, A. K., Ram, K., and Gustafsson, Ö.: Dual isotope characterization of total organic carbon in wintertime carbonaceous aerosols for northern India, J. Geophys. Res., 121, 4797–4809, https://doi.org/10.1002/2016JD024880, 2016.
Billmark, K. A., Swap, R. A., and Macko, S. A.: Stable isotope and GC/MS characterization African aerosols, South African J. Sci., 101, 177–170, 2005.
Birch, M. E. and Cary, R. A.: Elemental carbon-based method for monitoring occupational exposures to particulate diesel exhaust, Aerosol Sci. Tech., 25, 221–241, https://doi.org/10.1080/02786829608965393, 1996.
Bird, M. I. and Cali, J. A.: A million-year record of fire in sub-Saharan Africa, Nature, 394, 767–769, https://doi.org/10.1038/29507, 1998.
Blanchard, D. C. and Woodcock, A. H.: The production, concentration, and vertical distribution of the sea-salt aerosol, Ann. N.Y. Acad. Sci., 338, 330–347, https://doi.org/10.1111/j.1749-6632.1980.tb17130.x, 1980.
Bond, T. C., Doherty, S. J., Fahey, D. W., Forster, P. M., Berntsen, T., DeAngelo, B. J., Flanner, M. G., Ghan, S., Kärcher, B., Koch, D., Kinne, S., Kondo, Y., Quinn, P. K., Sarofim, M. C., Schultz, M. G., Schultz, M., Venkataram, C., Zhang, H., Zhang, S., Bellouin, N., Guttikunda, S. K., Hopke, P. K., Jacbonson, M. Z., Kaiser, J. W., Klimont, Z., Lohmann, U., Schwarz, J. P., Shindell, D., Storelvmo, T., Warren, S. G., and Zender, C. S.: Bounding the role of black carbon in the climate system: A systematic assessment, J. Geophys. Res., 118, 5380–5552, https://doi.org/10.1002/jgrd.50171, 2013.
Brandt, M., Rasmussen, K., Penuelas, J., Tian, F. J., Schurgers, G., Verger, A., Mertz, O., Palerm, J. R. B., and Fensholt, R.: Human population growth offsets climate-driven increase in woody vegetation in sub-Saharan Africa, Nature Ecol. Evol., 1, 0081, https://doi.org/10.1038/s41559-017-0081, 2017.
Brito, J., Freney, E., Dominutti, P., Borbon, A., Haslett, S. L., Batenburg, A. M., Colomb, A., Dupuy, R., Denjean, C., Burnet, F., Bourriane, T., Deroubaix, A., Sellegri, K., Borrmann, S., Coe, H., Flamant, C., Knippertz, P., and Schwarzenboeck, A.: Assessing the role of anthropogenic and biogenic sources on PM1 over southern West Africa using aircraft measurements, Atmos. Chem. Phys., 18, 757–772, https://doi.org/10.5194/acp-18-757-2018, 2018.
Cachier, H., Buat-Menard, P., Fontuge, M., and Ranhcer, J.: Source terms and source strengths of the carbonaceous aerosol in the tropics, J. Atmos. Chem., 3, 469–489, https://doi.org/10.1007/BF00053872, 1985.
Cahoon, D. R., Stocks, B. J., Levine, J. S., Cofer III, W. R., and O'Neil, K. P.: Seasonal distribution of African savanna fires, Nature, 359, 812–815, https://doi.org/10.1038/359812a0, 1992.
Cais, P., Bombelli, A., Williams, M., Piao, S. L., Chave, J., Ryan, C. M., Henry, M., Brender, P., and Valentini, R.: The carbon balance of Africa: synthesis of recent research studies, Philos. T. R. Soc. A, 369, 2038–2057, https://doi.org/10.1098/rsta.2010.0328, 2011.
Das, O., Wang, Y., and Hsieh, Y.-P.: Chemical and carbon isotopic characteristics of ash and smoke derived from burning of C3 and C4 grasses, Org. Geochem., 41, 263–269, https://doi.org/10.1016/j.orggeochem.2009.11.001, 2010.
Dasari, S., Andersson, A., Bikkina, S., Holmstrand, H., Budhavant, K., Sateesh, S., Asmi, E., Kesti, J., Backman, J., Salam, A., Singh Bisht, D., Tiwari, S., Hameed, S., and Gustafsson, Ö.: Photochemical degradation affects the light absorption of water-soluble brown carbon in the South Asian outflow, Sci. Adv., 5, eaau8066, https://doi.org/10.1126/sciadv.aau8066, 2019.
DeWitt, H. L., Gasore, J., Rupakheti, M., Potter, K. E., Prinn, R. G., Ndikubwimana, J. D. D., Nkusi, J., and Safari, B.: Seasonal and diurnal variability in O3, black carbon, and CO measured at the Rwanda Climate Observatory , Atmos. Chem. Phys., 19, 2063–2078, https://doi.org/10.5194/acp-19-2063-2019, 2019.
Fang, W., Andersson, A., Zheng, M., Lee, M., Holmstrand, H., Kim, S.-W., Du, K., and Gustafsson, Ö.: Divergent evolution of carbonaceous aerosols during dispersal of East Asian haze, Sci. Rep.-UK, 7, 10422, https://doi.org/10.1038/s41598-017-10766-4, 2017.
Formenti, P., Elbert, W., Maenhaut, W., Haywood, J., Osborne, S., and Andreae, M. O.: Inorganic and carbonaceous aerosols during the Southern African Regional Science Initiative (SAFARI 2000) experiment: Chemical characteristics, physical properties, and emission data for smoke from African biomass burning, J. Geophys. Res., 108, 8488, https://doi.org/10.1029/2002JD002408, 2003.
Gao, S., Hegg, D. A., Hobbs, P. V., Kirchstetter, T. W., Magi, B. I., and Sadilek, M.: Water-soluble organic components in aerosols associated with savanna fires in southern Africa: Identification, evolution and distribution, J. Geophys. Res., 108, 8491, https://doi.org/10.1029/2002JD002324, 2003.
Gatari, M. J. and Boman, J.: Black carbon and total carbon measurements at urban and ruralt sites in Kenya, East Africa, Atmos. Environ., 8, 1149–1154, https://doi.org/10.1016/S1352-2310(02)01001-4, 2003.
Graven, H.: Impact of fossil fuel emissions on atmospheric radiocarbon and various applications of radiocarbon over this century, P. Natl. Acad. Sci. USA, 112, 9542–9545, https://doi.org/10.1073/pnas.1504467112, 2015.
Gustafsson, Ö., Kruså, M., Zencak, Z., Sheesley, R. J., Granat, L., Engström, E., Praveen, P. S., Rao, P. S. P., Leck, C., and Rodhe, H.: Brown clouds over South Asia: Biomass or fossil fuel combustion?, Science, 323, 495–498, https://doi.org/10.1126/science.1164857, 2009.
Heft-Neal, S., Burney, J., Bendavid, E., and Burke, M.: Robust relationship between air quality and infant mortality in Africa, Nature, 559, 254–258, https://doi.org/10.1038/s41586-018-0263-3, 2018.
Hodnebrog, Ø., Myhre, G., Forster, P. M., Sillman, J., and Samset, B. H.: Local biomass burning is a dominant cause of the observed precipitation reduction in southern Africa, Nat. Commun., 7, 11236, https://doi.org/10.1038/ncomms11236, 2015.
IPCC (Inter-Governmental Panel for Climate Change): AR5 Climate Change 2013: The physical science basis, Cambridge Press, USA, ISBN 978-1107661820, 2013.
IPCC (Inter-Governmental Panel for Climate Change): AR5 Climate Change 2014: Impacts, adaptation and vulnerability, Cambridge Press, USA, ISBN 978-1-107-68386-0, 2014.
Keeling, C. D.: The concentration and isotopic abundances of atmospheric carbon dioxide in rural areas, Geochim. Cosmochim. Ac., 13, 322–334, https://doi.org/10.1016/0016-7037(58)90033-4, 1958.
Kirchstetter, T. W., Novakov, T., Hobbes, P. V., and Magi, B.: Airborne measurements of carbonaceous aerosols in southern Africa during the dry biomass season, J. Geophys. Res., 108, 8476, https://doi.org/10.1029/2002JD002171, 2003.
Kirillova, E. N., Andersson, A., Sheesley, R. J., Kruså, M., Praveen, P. S., Budhavant, K., Safai, P. D., Rao, P. S. P., and Gustafsson, Ö.: 13C and 14C-based study of sources and atmospheric processing of water-soluble organic carbon (WSOC) in South Asian aerosols, J. Geophys. Res., 118, 621–626, https://doi.org/10.1002/jgrd.50130, 2013.
Kirillova, E. N., Andersson, A., Han, J., Lee, M., and Gustafsson, Ö.: Sources and light absorption of water-soluble organic carbon aerosols in the outflow from northern China, Atmos. Chem. Phys., 14, 1413–1422, https://doi.org/10.5194/acp-14-1413-2014, 2014.
Kulmala, M.: Build a global Earth Observatory, Nature, 553, 21–23, 2018.
Liousse, C., Assamoi, E., Criqui, C., and Rosset, R.: Explosive growth in African combustion emissions from 2005 to 2030, Environ. Res. Lett., 9, 035003, https://doi.org/10.1088/1748-9326/9/3/035003, 2014.
Lipset-Moore, G. J., Wolff, N., and Game, E. T.: Emissions mitigation opportunities for savanna countries from early dry season fire management, Nat. Commun., 9, 2247, https://doi.org/10.1038/s41467-018-04687-7, 2018.
Lloyd, J., Bird, M. I., Vellen, L., Miranda, A. C., Veenendaal, E. M., Djagbletey, G., Miranda, H. S., Cook, G., and Faruqhar, G. D.: Contributions of woody and herbacoues vegetation to tropical savanna ecosystem productivity: a quasi-global estimate, Tree Physiol., 28, 451–468, https://doi.org/10.1093/treephys/28.3.451, 2008.
López-Ballesteros, A., Beck, J., Bombelli, A., Grieco, E., Lorenkova, E. K., Merbold, L., Brümmer, C., Hugo, W., Scholes, R., Vackar, D., Vermeulen, A., Acosta, M., Butterbach-Bahl, K., Helmschrot, J., Kim, D.-G., Jones, M., Jorch, V., Pavleka, M., Skjelvan, I., and Saunders, M.: Towards a feasible and representative pan-African research infrastructure network for GHG observations, Environ. Res. Lett., 13, 085003, https://doi.org/10.1088/1748-9326/aad66c, 2018.
Maenhaut, W., Salma, I., Cafmeyer, J., Annegarn, H. J., and Andreae, M. O.: Regional atmospheric aerosols composition and sources in the eastern Transvaal, South Africa, and impact of biomass burning, J. Geophys. Res., 101, 23631–23650, 1996.
Martens, J., Wild, B., Pearce, C., Tesi, T., Andersson, A., Bröder, L., O'Regan, M., Jakonsson, M., Sköld, M., Gemery, L., Cronin, T. M., Semiletov, I., Dudarev, O. V., and Gustafsson, Ö.: Remobilization of Old Permafrost Carbon to Chukchi Sea Sediments During the End of the Last Deglaciation, Global Biogeochem. Cy., 33, 2–14, https://doi.org/10.1029/2018GB005969, 2019.
Martinelli, L. A., Camargo, P. B., Lara, L. B. L. S., Victoria, R. L., and Artaxo, P.: Stable carbon and nitrogen isotopic composition of bulk aerosol particles in a C4 plant landscape of southeast Brazil, Atmos. Environ., 36, 2427–2432, https://doi.org/10.1016/S1352-2310(01)00454-X, 2002.
Marwick, T. R., Tamooh, F., Teofuru, C. R., Borget, A. V., Darchambeau, F., and Bouillon, S.: The age of river-transported carbon: global perspective, Global Biogeochem. Cy., 29, 122–137, https://doi.org/10.1002/2014GB004911, 2015.
Mkoma, S. L., Kawamura, K., Tachibana, E., and Fu, P.: Stable carbon and nitrogen isotopic compositions of tropical atmospheric aerosols: sources and contribution from burning of C3 and C4 plants to organic aerosols, Tellus B, 66, 1–12, https://doi.org/10.3402/tellusb.v66.20176, 2014.
O'Leary, M. H.: Carbon isotopes in photosynthesis, Bioscience, 38, 328–336, https://doi.org/10.2307/1310735, 1988.
Palmer, P. I., Feng, L., Chevallier, F., Bösch, H., and Somkuti, P.: Net carbon emissions from African biosphere dominate pan-tropical atmospheric CO2 signal, Nat. Commun., 10, 3344, https://doi.org/10.1038/s41467-019-11097-w, 2019.
Puxbaum, H., Rendl, J., Allabashi, R., Otter, L., and Scholes, M. C.: Mass balance of the atmospheric aerosol in a South African savanna (Nylsvley, May 1997), J. Geophys. Res., 105, 20697–20706, 2000.
Roberts, G. O., Gelman, A., and Gilks, W. R.: Weak convergence and optimal scaling of random walk Metropolis algorithms, Ann. Appl. Probab., 7, 110–120, 1997.
Sheesley, R. J., Kirllova, E. N., Andersson, A., Kruså, M., Praveen, P. S., Budhavant, K., Safai, P. D., Rao, P. S. P., and Gustafsson, Ö.: Year-round radiocarbon-based source apportionment of carbonaceous aerosols at two background sites in South Asia, J. Geophys. Res., 117, D10202, https://doi.org/10.1029/2011JD017161, 2012.
Sinha, P., Hobbs, P. V., Yokelson, R. J., Bertschi, I. T., Blake, D. R., Simpson, I. J., Gao, S., Kirchstetter, T. W., and Novakov, T.: Emissions of trace gases and particles from savanna fires in southern Africa, J. Geophys. Res., 108, 8487, https://doi.org/10.1029/2002JD002325, 2003.
Swap, R. J., Annegard, H. J., Suttles, J. T., King, M. D., Platnick, S., Privette, J. L., and Scholes, R. J.: Africa burning: A thematic analysis of the Southern African regional science initiative (SAFARI 2000), J. Geophys. Res., 108, 8465, https://doi.org/10.1029/2003JD003747, 2003.
Tiitta, P., Vakkari, V., Croteau, P., Beukes, J. P., van Zyl, P. G., Josipovic, M., Venter, A. D., Jaars, K., Pienaar, J. J., Ng, N. L., Canagaratna, M. R., Jayne, J. T., Kerminen, V.-M., Kokkola, H., Kulmala, M., Laaksonen, A., Worsnop, D. R., and Laakso, L.: Chemical composition, main sources and temporal variability of PM1 aerosols in southern African grassland, Atmos. Chem. Phys., 14, 1909–1927, https://doi.org/10.5194/acp-14-1909-2014, 2014.
Turekian, V. C., Macko, S., Swap, R. J., and Garstang, M.: Causes of bulk carbon and nitrogen isotopic fractionations in the products of vegetation burns: laboratory studies, Chem. Geol., 152, 181–192, https://doi.org/10.1016/S0009-2541(98)00105-3, 1998.
Turnbull, J. C., Mikaloff Fletcher, S. E., Ansell, I., Brailsford, G. W., Moss, R. C., Norris, M. W., and Steinkamp, K.: Sixty years of radiocarbon dioxide measurements at Wellington, New Zealand: 1954–2014, Atmos. Chem. Phys., 17, 14771–14784, https://doi.org/10.5194/acp-17-14771-2017, 2017.
UNDP (United Nations Development Programme): 2018 Africa Sustainable Development Report: Towards a transformed and resilient continent, ECA Printing and Publishing Uni, Addis Ababa, ISBN 978-92-1-125134-0, 2018.
UNEP/WMO (United Nations Environment Programme/World Meteorological Organization): Integrated assessment of black carbon and tropospheric ozone, UNON Publishing Services Section, Nairobi, ISBN 978-92-807-3142-2, 2012.
Valentini, R., Arneth, A., Bombelli, A., Castaldi, S., Cazzolla Gatti, R., Chevallier, F., Ciais, P., Grieco, E., Hartmann, J., Henry, M., Houghton, R. A., Jung, M., Kutsch, W. L., Malhi, Y., Mayorga, E., Merbold, L., Murray-Tortarolo, G., Papale, D., Peylin, P., Poulter, B., Raymond, P. A., Santini, M., Sitch, S., Vaglio Laurin, G., van der Werf, G. R., Williams, C. A., and Scholes, R. J.: A full greenhouse gases budget of Africa: synthesis, uncertainties, and vulnerabilities, Biogeosciences, 11, 381–407, https://doi.org/10.5194/bg-11-381-2014, 2014.
WHO (World Health Organization): Health effects of black carbon, WarlichDruck RheinAhr GmbH, Germany, ISBN 978-92-890-0265-3, 2012.
WHO (World Health Organization): Ambient air pollution: A global assessment of exposure and burden of disease, WHO Document Production Services, Geneva, Switzerland, ISBN 978-92-415-1135-3, 2016.
Widory, D.: Combustibles, fuels and their combustion products: A view through carbon isotopes, Combust. Theor. Model., 10, 831–841, https://doi.org/10.1080/13647830600720264, 2006.
Wild, B., Andersson, A., Bröder, L., Vonk, J., Hugelius, G., McClelland, J. W., Song, W., Raymond, P. A., and Gustafsson, Ö.: Rivers across the Siberian Arctic unearth the patterns of carbon release from thawing permafrost, P. Natl. Acad. Sci. USA, 116, 10280–10285, https://doi.org/10.1073/pnas.1811797116, 2019.
Williams, C. A., Hanan, N. P., Neff, J. C., Scholes, R. J., Berry, J. A., Denning, S. A., and Baker, D. F.: Africa and the global carbon cycle, Carbon Bal. Manag., 2, 1–13, https://doi.org/10.1186/1750-0680-2-3, 2007.
Winiger, P., Andersson, A., Eckhardt, S., Stohl, A., Semiletov, I. P., Dudarev, O. V., Charkin, A., Shakova, N., Klimont, Z., Heyes, C., and Gustafsson, Ö.: Siberian Arctic black carbon sources constrained by model and observation, P. Natl. Acad. Sci. USA, 114, E1054–E1061, https://doi.org/10.1073/pnas.1613401114, 2017.
Winiger, P., Barrett, T. E., Sheesley, R. J., Huang, L., Sharma, S., Barrie, L. A., Yttri, K. E., Evangeliou, N., Eckhardt, S., Stohl, A., Klimont, Z., Heyes, C., Semiletov, I. P., Dudarev, O. V., Charkin, A., Shakhova, N., Holmstrand, H., Andersson, A., and Gustafsson, Ö.: Source apportionment of circum-Arctic atmospheric black carbon from isotopes and modelling, Sci. Adv., 5, eaau8052, https://doi.org/10.1126/sciadv.aau8052, 2019.
Yan, C., Zheng, M., Bosch, C., Andersson, A., Desyaterik, Y., Sullivan, A. P., Collett, J. L., Zhao, B., Wang, S., He, K., and Gustafsson, Ö.: Important fossil source contribution to brown carbon in Beijing during Winter, Sci. Rep.-UK, 7, 43182, https://doi.org/10.1038/srep43182, 2017.