the Creative Commons Attribution 4.0 License.
the Creative Commons Attribution 4.0 License.
 | 07 Apr 2020
Dehydration and low ozone in the tropopause layer over the Asian monsoon caused by tropical cyclones: Lagrangian transport calculations using ERA-Interim and ERA5 reanalysis data
Bärbel Vogel
Rolf Müller
Gebhard Günther
Felix Ploeger
Qian Li
Jinqiang Zhang
Zhixuan Bai
Holger Vömel
Martin Riese
Low ozone and high water vapour mixing ratios are common features in the Asian summer monsoon (ASM) anticyclone; however, low ozone and low water vapour values were observed near the tropopause over Kunming, China, within the ASM using balloon-borne measurements performed during the SWOP (sounding water vapour, ozone, and particle) campaign in August 2009 and 2015. Here, we investigate low ozone and water vapour signatures in the upper troposphere and lower stratosphere (UTLS) using FengYun-2D, FengYun-2G, and Aura Microwave Limb Sounder (MLS) satellite measurements and backward trajectory calculations. Trajectories with kinematic and diabatic vertical velocities were calculated using the Chemical Lagrangian Model of the Stratosphere (CLaMS) trajectory module driven by both ERA-Interim and ERA5 reanalysis data.
All trajectory calculations show that air parcels with low ozone and low water vapour values in the UTLS over Kunming measured by balloon-borne instruments originate from the western Pacific boundary layer. Deep convection associated with tropical cyclones over the western Pacific transports ozone-poor air from the marine boundary layer to the cold tropopause region. Subsequently, these air parcels are mixed into the strong easterlies on the southern side of the Asian summer monsoon anticyclone. Air parcels are dehydrated when passing the lowest temperature region (< 190 K) at the convective outflow of tropical cyclones. However, trajectory calculations show different vertical transport via deep convection depending on the employed reanalysis data (ERA-Interim, ERA5) and vertical velocities (diabatic, kinematic). Both the kinematic and the diabatic trajectory calculations using ERA5 data show much faster and stronger vertical transport than ERA-Interim primarily because of ERA5's better spatial and temporal resolution, which likely resolves convective events more accurately. Our findings show that the interplay between the ASM anticyclone and tropical cyclones has a significant impact on the chemical composition of the UTLS during summer.
- Article
(27598 KB) - Companion paper
- BibTeX
- EndNote


The Asian summer monsoon (ASM) anticyclone plays an important role in transporting air masses from the troposphere into the stratosphere (e.g. Chen et al., 2012; Garny and Randel, 2016; Randel et al., 2010; Vogel et al., 2019). Air masses within the ASM anticyclone are impacted by surface sources from the western Pacific, India, Southeast Asia, and the Tibetan Plateau (Bergman et al., 2013; Park et al., 2008; Tissier and Legras, 2016; Vogel et al., 2015). Recently, Höpfner et al. (2019) have reported observations that indicate upward transport from ground sources of ammonia (NH3) to greater altitudes with subsequent formation of ammonium nitrate (NH4NO3) during further ascent in the ASM anticyclone. This is further confirmed by satellite observations of air pollution from biomass burning (e.g. carbon monoxide, hydrogen cyanide, ethane) which clearly support the idea of convective uplift from the surface to the tropopause layer within the ASM anticyclone (Park et al., 2008; Chen et al., 2012; Bergman et al., 2013; Yan and Bian, 2015). Using trajectory calculations, Chen et al. (2012) demonstrate that 38 % of the air masses at tropopause height within the ASM region are from the western Pacific region and South China Sea. Bergman et al. (2013) also show that 36.1 % of air parcels at 100 hPa in the monsoon region originate from the western Pacific based on diabatic trajectory calculations.
Convection in tropical cyclones (e.g. typhoons in the western Pacific) can lift air masses from the marine boundary layer into the tropopause layer (Li et al., 2017; Minschwaner et al., 2015; Pan et al., 2016; Vogel et al., 2014). Tropospheric ozone can be decomposed by halogen-induced photochemical reactions in the tropical marine boundary layer (von Glasow et al., 2002). As a result, low ozone values are distributed over at least several thousand kilometres over the tropical oceans (Read et al., 2008a). Low ozone values are sometimes measured in the upper troposphere within typhoons or hurricanes (Cairo et al., 2008; Fu et al., 2013), due to fast vertical transport caused by tropical cyclones. Minschwaner et al. (2015) find that Hurricane Henriette uplifted air with low ozone from the boundary layer in the central and eastern Pacific to the upper troposphere with subsequent transport to Socorro (North America) according to balloon-borne ozonesonde and satellite measurements. Newton et al. (2018), using aircraft measurements in Guam, show that low ozone values (20 ppbv) in the tropical tropopause layer (TTL) are caused by deep convection, which has lifted ozone-poor boundary layer air to the TTL over the western Pacific in 2014.
The lowest temperatures in the TTL are often found over the western Pacific. When air parcels are transported horizontally via the lowest temperature tropopause region (cold trap) over the western Pacific in winter, dehydration occurs (Holton and Gettelman, 2001). Read et al. (2008b), using model calculations and Aura Microwave Limb Sounder (MLS) measurements, show that water vapour is controlled by the lowest temperature in the TTL, i.e. by in situ freeze-drying.
In situ observations from the Soundings of Ozone and Water in the Equatorial Region (SOWER) campaign in winter show a clear correspondence between dry air parcels and low temperatures during advection in the TTL over the western Pacific (Hasebe et al., 2007). The match technique was applied to quantify the features of dehydration or hydration for air parcels in the TTL (Hasebe et al., 2013; Inai et al., 2013). The relative humidity with respect to ice (RHi) of 146±19 %, a threshold of ice nucleation, indicates the development of ice clouds. Dehydration is ongoing until RHi decreases to 75±23 % between 350 and 360 K (Inai et al., 2013). Cold-trap dehydration is accompanied by slow ascent in the TTL and quasi-horizontal advection between 360 and 380 K (Hasebe et al., 2013). Lagrangian trajectory simulations also show that water vapour mixing ratios transported into the stratosphere from the South China Sea and Philippine Sea are lower than those transported from the South Asian subcontinent, the southern slope of the Himalayas, and the Tibetan Plateau (Wright et al., 2011). Deep convection contributes to low-temperature regions in the subtropical lower stratosphere and leads to a dry stratosphere (Randel et al., 2015).
Low water vapour mixing ratios below 2 ppmv were observed at the cold point tropopause (370–380 K) during the Stratospheric-Climate Links with Emphasis on the Upper Troposphere and Lower Stratosphere (SCOUT-O3) aircraft campaign in November and December 2005 over Darwin, Australia (Schiller et al., 2009). These low water vapour mixing ratios are primarily determined by effective freezing-drying near the tropopause caused by deep convection associated with the cumulonimbus system Hector.
Li et al. (2017) found that tropical cyclones that occurred over the western Pacific uplifted marine boundary layer air masses with low ozone to the ASM anticyclone, using balloon measurements and trajectory calculations. In general, typhoons decrease ozone values near the tropopause over the western Pacific. However, hitherto the variability of water vapour concentrations in the upper troposphere and lower stratosphere (UTLS) region has not been analysed in detail. Using balloon-borne measurements, MLS data, and the Chemical Lagrangian Model of the Stratosphere (CLaMS) trajectory calculations, we investigate how tropical cyclones impact water vapour structures in the UTLS region over Kunming. This paper is organized as follows: Sect. 2 describes the balloon measurement data and the trajectory calculations with the CLaMS model. In Sect. 3, we present two case studies where dehydration is found in the measurements. A comparison of diabatic and kinematic trajectory calculations driven by both ERA-Interim and ERA5 reanalysis data is presented as well. A summary is given in the final section.
2.1 Balloon-borne measurements
Vertical profiles of temperature, ozone, and water vapour were measured over Kunming (25.01∘ N, 102.65∘ E, above sea level (a.s.l.) 1889 m), China, in August 2009 and 2015 during the SWOP (sounding water vapour, ozone, and particle) campaign (e.g. Bian et al., 2012; Li et al., 2017, 2018). In 2009, 11 balloons were launched during the period 7–13 August; 7 and 4 balloons were launched in the daytime and at night (around 10:00 and 22:30 local time, UTC+8). Detailed information about the launches is provided by Bian et al. (2012, see Table S1). In 2015, 12 balloons were launched around 22:30 (local time, UTC+8) from 3 to 18 August. Profiles of temperature, pressure, relative humidity, and winds were measured by Vaisala RS80 radiosondes in 2009 and iMet radiosondes in 2015. Profiles of ozone and water vapour mixing ratios were measured by an electrochemical concentration cell (ECC) ozonesonde (Komhyr et al., 1995) and a cryogenic frost point hygrometer (CFH) (Vömel et al., 2007), respectively. Data are transmitted to the Kunming ground receiving station and are recorded each second within ∼100 min. The ozone and water vapour precision in the troposphere is 10 % and 5 %, respectively (Vömel et al., 2016).
The (saturation) water vapour mixing ratio is calculated from the (ambient) frost point temperature using the Hyland–Wexler equation (Hyland and Wexler, 1983) for liquid water and from the Goff–Gratch equation (Goff and Gratch, 1946; Murphy and Koop, 2005) for ice water. The match technique, means that the same air parcel is observed more than once (Hasebe et al., 2013; Inai et al., 2013). Then the difference of water vapour values between these observation times was applied to quantify the features of dehydration or hydration for air parcels during horizontal advection in the TTL.
Ozone profiles for Naha (26.21∘ N, 127.69∘ E; a.s.l. 28.1 m), Okinawa Island, Japan, during the period of 2008–2017 were obtained from the World Ozone and Ultraviolet Radiation Data Centre (Naja and Akimoto, 2004). Naha station is located approximately 2500 km east of Kunming, and these two sites are nearly on the same zonal line. Profiles on 4 August 2009, 05:30 UTC, and on 5 August 2015 from Naha are presented in Sect. 3.1.2 and 3.2.2, respectively.
The upper air soundings of Chenzhou, Ganzhou, Xiamen, Taipei, and Ishigakijima (also known as Ishigaki Island) in August 2009 and Haikou, Wuzhou, Hong Kong, Shantou, Laoag, and Ishigakijima in August 2015 were used in this paper. The data were downloaded from the University of Wyoming. Balloons were launched routinely twice a day at 00:00 and 12:00 UTC. They provide profiles of temperature, pressure, relative humidity, and wind vector from the surface to 30 km.
2.2 Satellite data
Microwave Limb Sounder (MLS) measurements are used to validate ozone and water vapour profiles in the tropopause layer over the western Pacific. MLS level 2 version 4.2x standard atmospheric product data are used for 4 August 2009 and the period of 31 July–10 August 2015. The MLS provides ozone with 10 pressure levels ranging from 261 to 46 hPa (9.5–21.5 km) along the orbit track (Livesey et al., 2018). Precision on individual ozone profiles is within 5 % or better in the lower stratosphere and is approximately 15 %–25 % at 100 hPa, with poor behaviour at low latitudes in the upper troposphere. The mean deviation is lower than 20 % between the MLS and the ECC ozone values in the upper troposphere over the Tibetan Plateau (Shi et al., 2017).
The FengYun-2D (“Feng and Yun” means “winds and clouds” in Chinese), or FY-2D in acronym form, and FY-2G are the geostationary meteorological satellite series of China, organized and operated by the National Satellite Meteorological Center of the CMA (China Meteorological Administration). FY-2D was launched on 8 December 2006 and carried a payload with a five-channel Stretched Visible and Infrared Spin Scan Radiometer (S-VISSR) to track cloud motion. Long-wave infrared (10.3–11.3 µm) with a spatial resolution of 5 km is used to detect cloud movement. Here, we used the FY-2D blackbody brightness temperature product to determine the cloud top temperature. FY-2G was launched on 31 December 2014 and carried a S-VISSR. The brightness temperature was also used.
2.3 Trajectory calculations based on ERA-Interim and ERA5 reanalysis data
Diabatic and kinematic backward trajectories along two balloons' ascending paths over Kunming on 8 August 2009 and 10 August 2015 were calculated using the CLaMS trajectory module (McKenna et al., 2002; Konopka et al., 2004; Pommrich et al., 2014). The CLaMS kinematic trajectory calculations employ pressure (p) as the vertical coordinate and omega (ω) as vertical velocity. In contrast, the diabatic trajectory calculations employ a hybrid σ-potential temperature coordinate (Pommrich et al., 2014) and the diabatic vertical velocity derived from total heating rates. Note that above , hence throughout the stratosphere and upper troposphere, the vertical coordinate is just potential temperature. Diabatic calculations have important advantages (total diabatic heating rates including clear-sky radiative heating, cloud radiative effects, latent heat release, and turbulent and diffusive heat transport; Fueglistaler et al., 2009) for the upper troposphere and stratosphere (e.g. Ploeger et al., 2010, 2011; Schoeberl et al., 2003; Schoeberl and Dessler, 2011). The dynamic fields from the European Centre for Medium-Range Weather Forecasts (ECMWF) interim reanalysis (ERA-Interim) (Dee et al., 2011) and ECMWF's next-generation reanalysis ERA5 (Hersbach and Dee, 2016) are used to drive the CLaMS trajectories. ERA-Interim input data are recorded on a grid every 6 h, on 60 hybrid levels from about 1013.25 to 0.1 hPa. The vertical resolution in the UTLS is ∼1–1.5 km. The ERA5 input data are provided on a grid every hour on 137 hybrid levels from the surface to 0.01 hPa, with ∼400–500 m vertical resolution in the UTLS region. The ERA5 data have a much higher spatial and temporal resolution than ERA-Interim, especially in the upper troposphere and lower stratosphere (Hoffmann et al., 2019, as shown in Fig. 1). The horizontal wind fields show similar structure at 150 hPa between ERA-Interim and ERA5 reanalysis data (Fig. A1 in the Appendix). The vertical velocities from ERA5 show finer spiral structures than ERA-Interim vertical velocities at 150 hPa in regions of tropical cyclones (Fig. 1). Stronger negative ω in ERA5 corresponds to ascending motion around the convection centres associated with tropical cyclones as shown in the right column of Fig. 1. The outflow of deep convection is clearly much stronger on 6 August 2009 than on other days based on ERA5 reanalysis data.
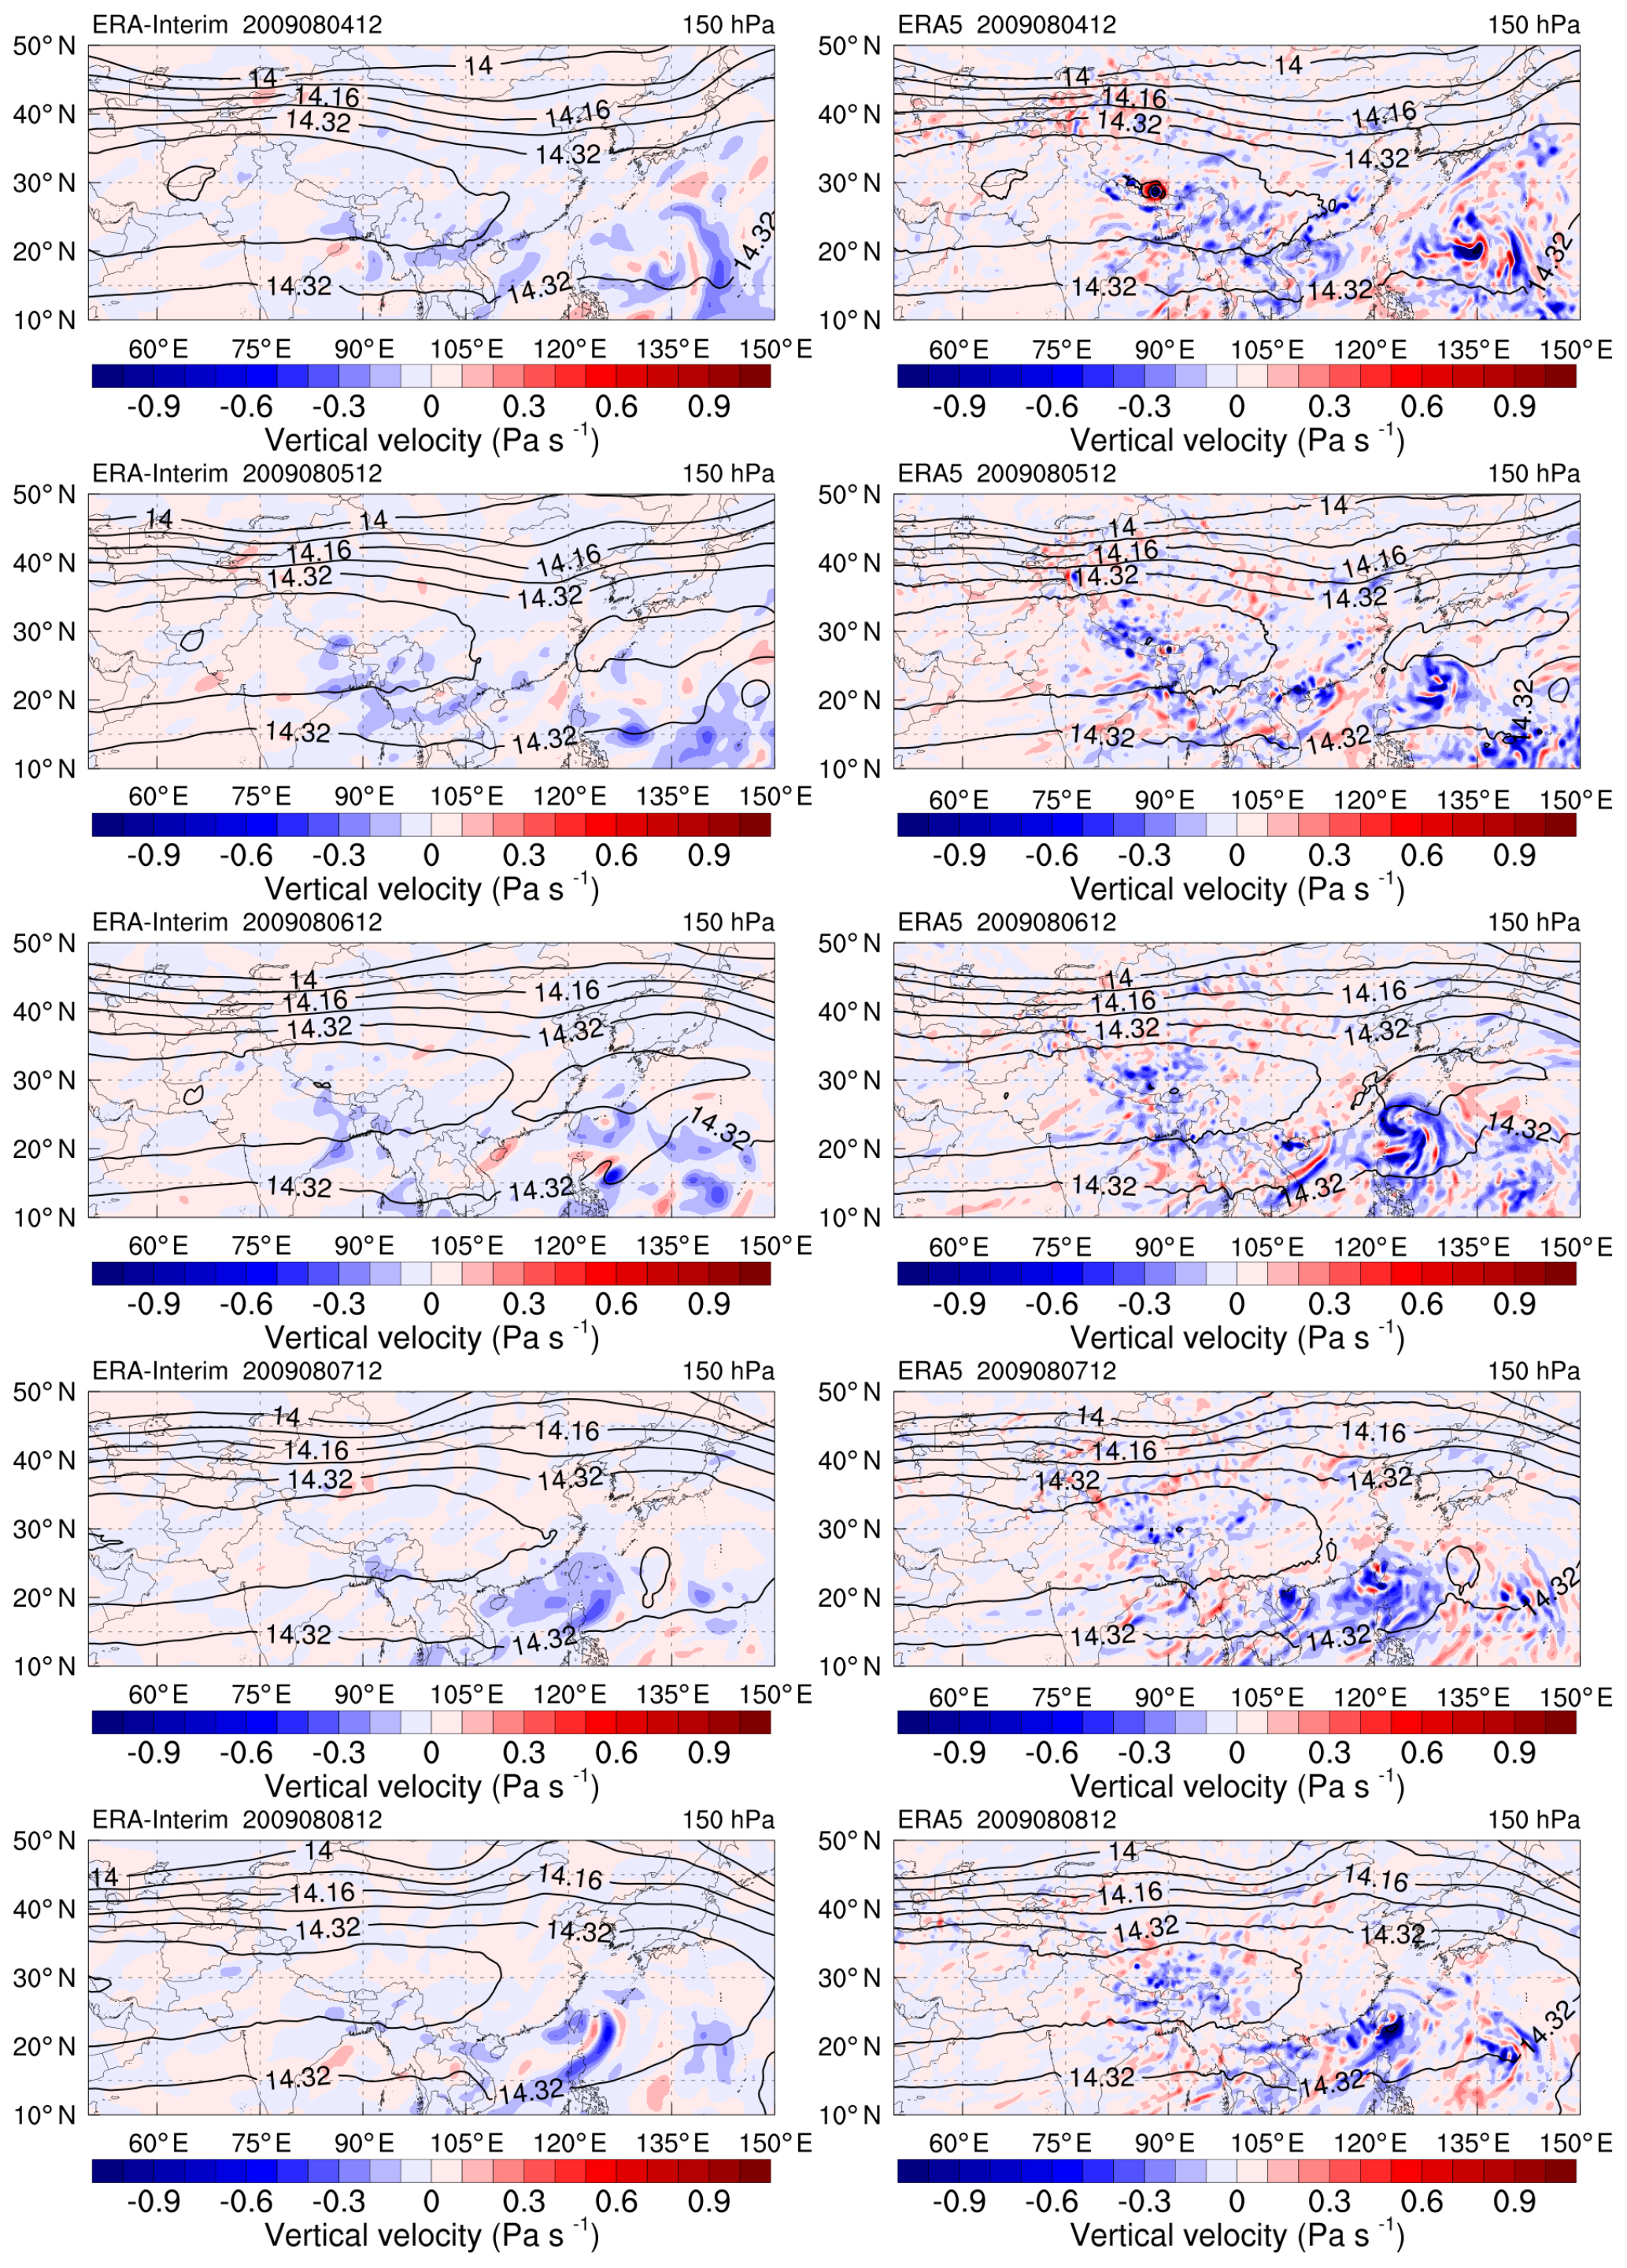
Figure 1Geopotential height (black lines, gpkm) and vertical ω velocities (shaded, Pa s−1) at 150 hPa on 4, 5, 6, 7, and 8 August 2009 from ERA-Interim (left) and ERA5 (right).
3.1 Case 1: 8 August 2009
All vertical profiles of temperature, ozone, and water vapour mixing ratios over Kunming in August 2009 are shown in Fig. 2. The minimum temperature of 192.3 K occurs on 8 August (Fig. 2a). The World Meteorological Organization (WMO) tropopause (WMO, 1957) potential temperature on 8 August is located at 381.3 K. Ozone mixing ratios in the upper troposphere ranged from 40 to 120 ppbv in August 2009. Ozone mixing ratios observed on 8 August show low values in the potential temperature layer between 376 and 384 K, with a minimum value of 35 ppbv around 378 K (Fig. 2b). Simultaneously, water vapour near the tropopause on 8 August is also very low, around 2.5 ppmv at 378 K (Fig. 2c). Low ozone and low water vapour mixing ratios near the tropopause on 8 August are strongly correlated, marked by the shaded regions in Fig. 2. The ozone and water vapour around 378 K are lower by 70 % and 40 % in contrast to the monthly mean value, respectively (Fig. A2). Low ozone (60 ppbv) and low water vapour (6 ppmv) values are also observed at another layer near 365 K on 8 August 2009. The relative difference for ozone and water vapour is about −40 % (Fig. A2). The detailed information for this low ozone and water vapour layer is shown in Appendix A. Note that Bian et al. (2012) highlight these low ozone and low water vapour values using the same observation data. They argue that the rapid convective uplift and the low temperature near the tropopause are the reason for these coinciding low ozone and low water vapour values. However, they only offer limited explanation on the detailed reasons which are investigated and discussed in the following subsections.
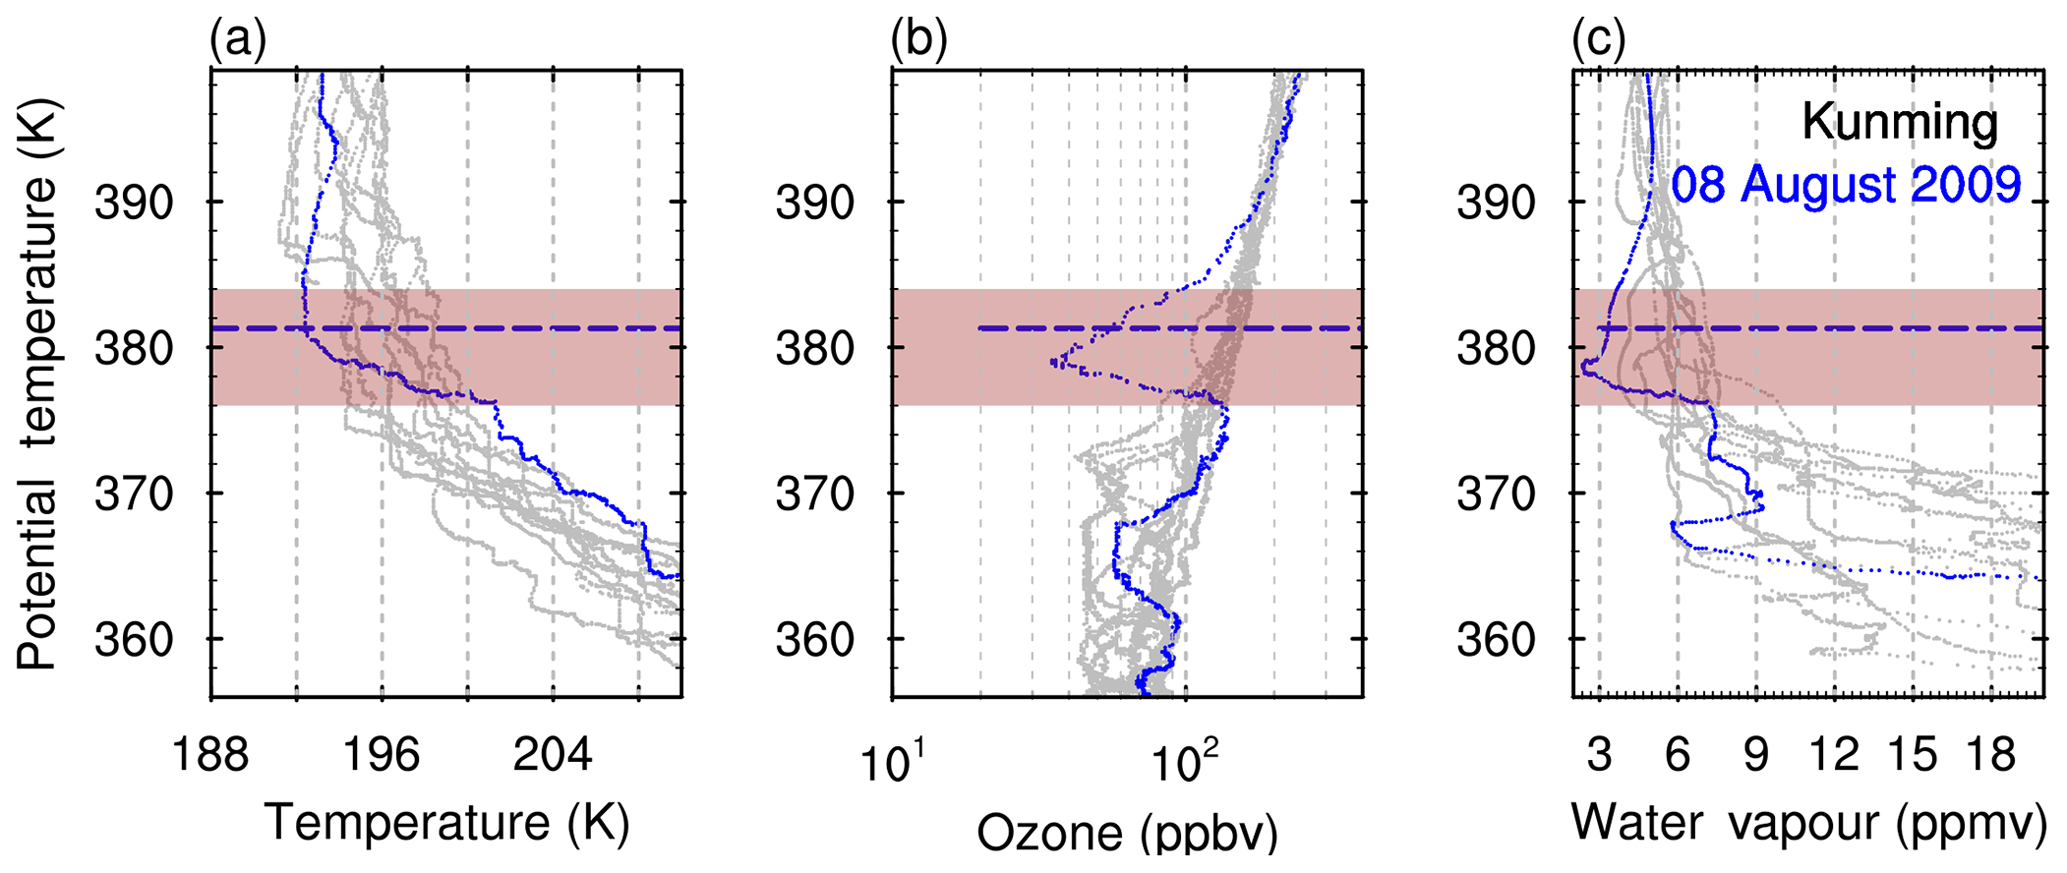
Figure 2All vertical profiles of (a) temperature, (b) ozone mixing ratios (OMRs), and (c) water vapour over Kunming in August 2009. The profile on 8 August is marked as a blue line. The horizontal blue dashed line marks the lapse-rate tropopause on 8 August. The shaded region denotes the low ozone and low water vapour mixing ratios region.
3.1.1 Background meteorology
Figure 3 shows the 5 d average (4–8 August 2009) of the geopotential height isolines (>16.7 gpkm) at the 100 hPa pressure level with the temperature (shaded), horizontal wind vector, and tracks of Typhoon Morakot from the ERA-Interim reanalysis data. Isolines are used to denote the scope of the ASM anticyclone. Morakot formed early on 2 August, within a monsoon trough about 1000 km east of the Philippines. Morakot moved westward since 4 August and arrived at the south of Naha on 6 August. During the period 4–8 August 2009, the southeastern edge of the ASM anticyclone was located above the top of the typhoon and covered the lowest temperature region (<192 K). Similar results can also be obtained from the ERA5 analysis data (not shown).
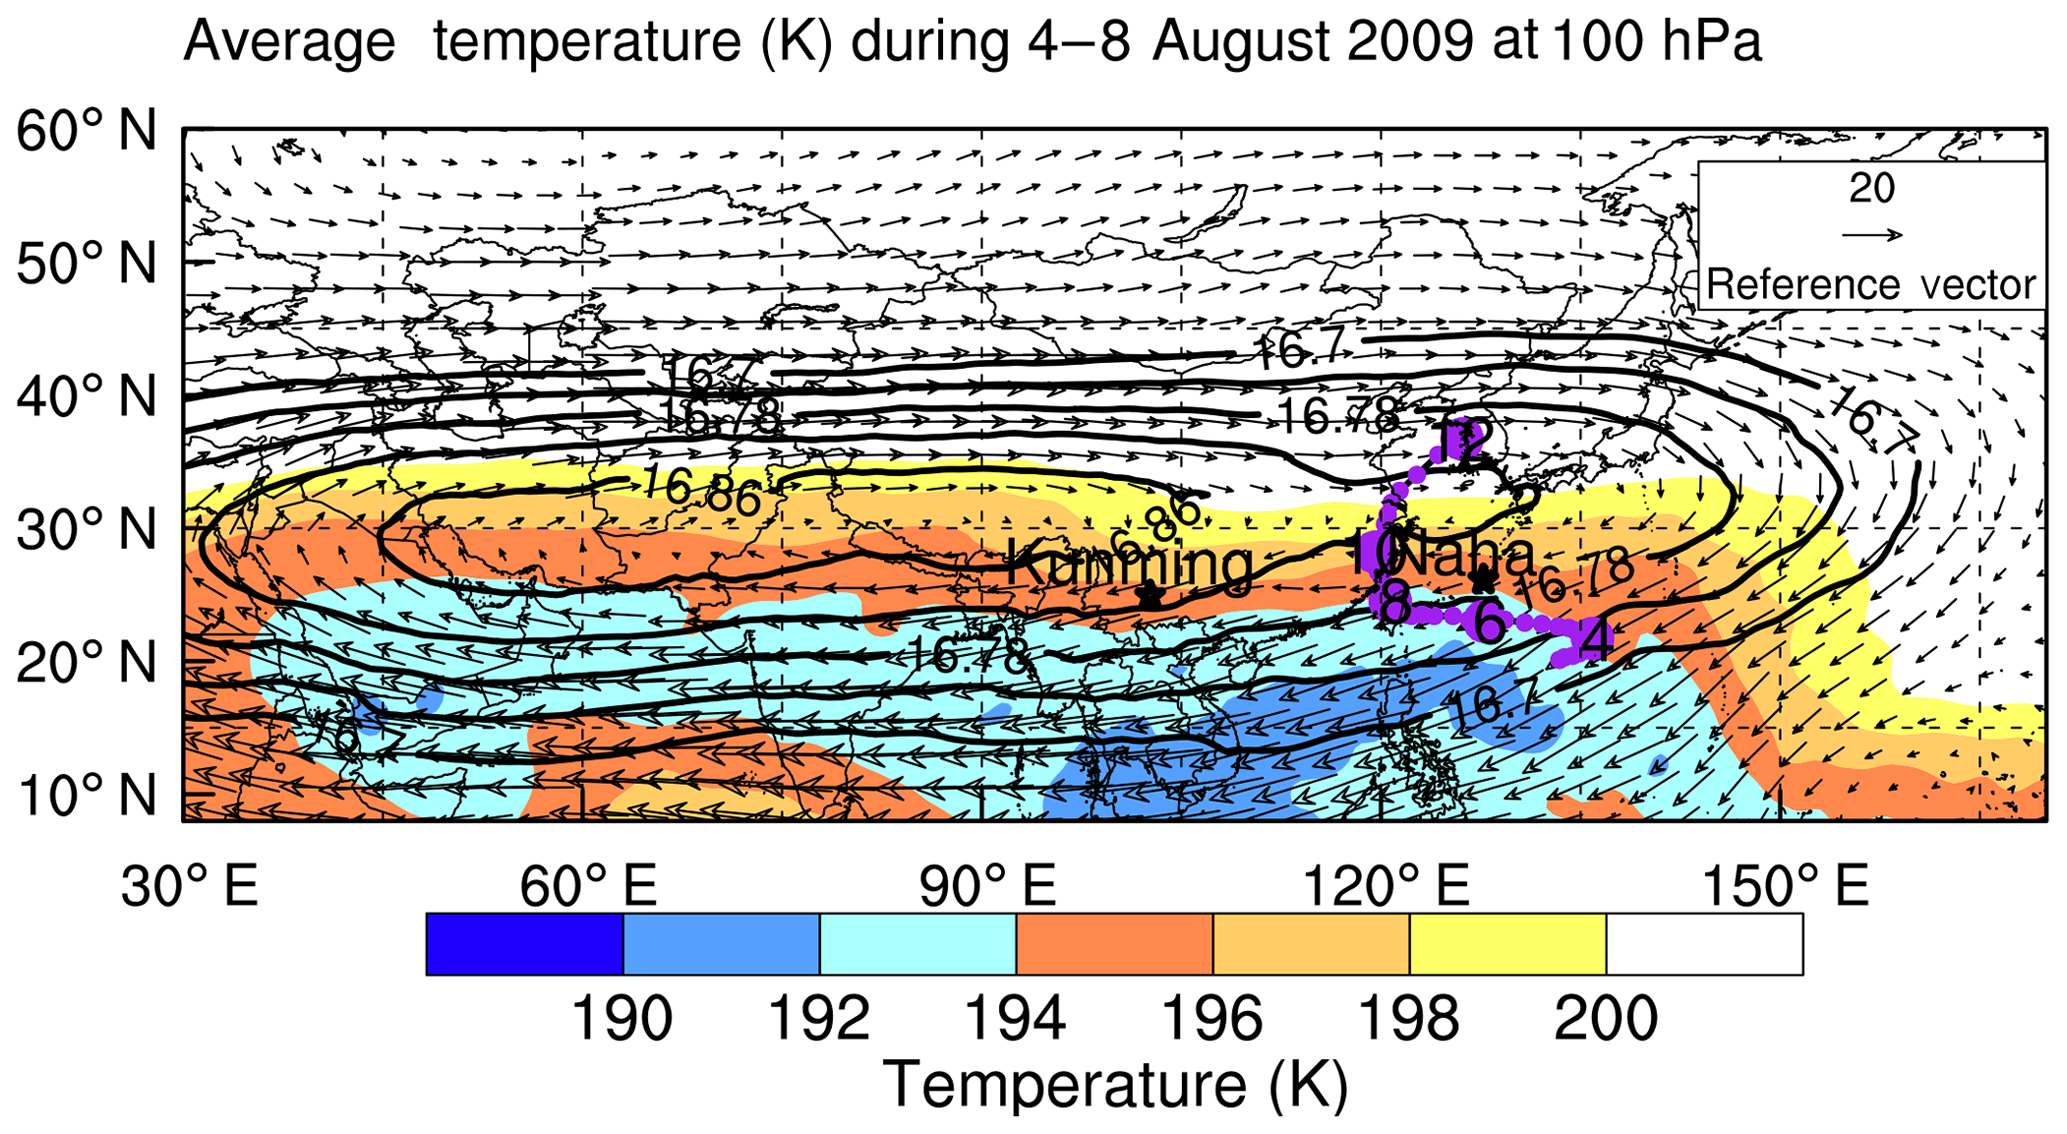
Figure 3(a) The 5 d average (4–8 August) of geopotential height (black lines, >16.70 gpkm), temperature (shaded, K), and wind speed (vectors, m s−1) from ERA-Interim at the 100 hPa pressure with the tracks of Typhoon Morakot (purple dots). The numbers in purple dots indicate days in August 2009. The black stars mark the locations of Naha and Kunming.
3.1.2 Low ozone in the tropopause layer
A balloon was launched in Naha, Japan, on 4 August 2009 before the Typhoon Morakot passed through this site. Low ozone values (35 ppbv) appeared at the layer between 360 and 370 K (Fig. 4a). The observed mean ozone value of 10 years (2008–2017) in this layer is about 80–120 ppbv. The balloon on 8 August in Kunming also captured the extremely low ozone structure but at the layer between ∼376–384 K. The altitude of the low ozone appearing in Kunming on 8 August is higher than that in Naha on 4 August 2009. Low ozone values near the tropopause within the ASM anticyclone were also found in Lhasa in 2013 (Li et al., 2017), which are caused by the combination of the rapid vertical transport from typhoon convection and the horizontal transport at the edge of the ASM anticyclone. The ERA-Interim and ERA5 temperature and ozone data were interpolated to the balloon tracks on 8 August. Compared to balloon observation, the ERA5 temperature profile shows a lower value than ERA-Interim temperature on 8 August 2009. Both the ERA-Interim and ERA5 ozone profiles show large positive deviations in the tropopause layer with respect to observations.
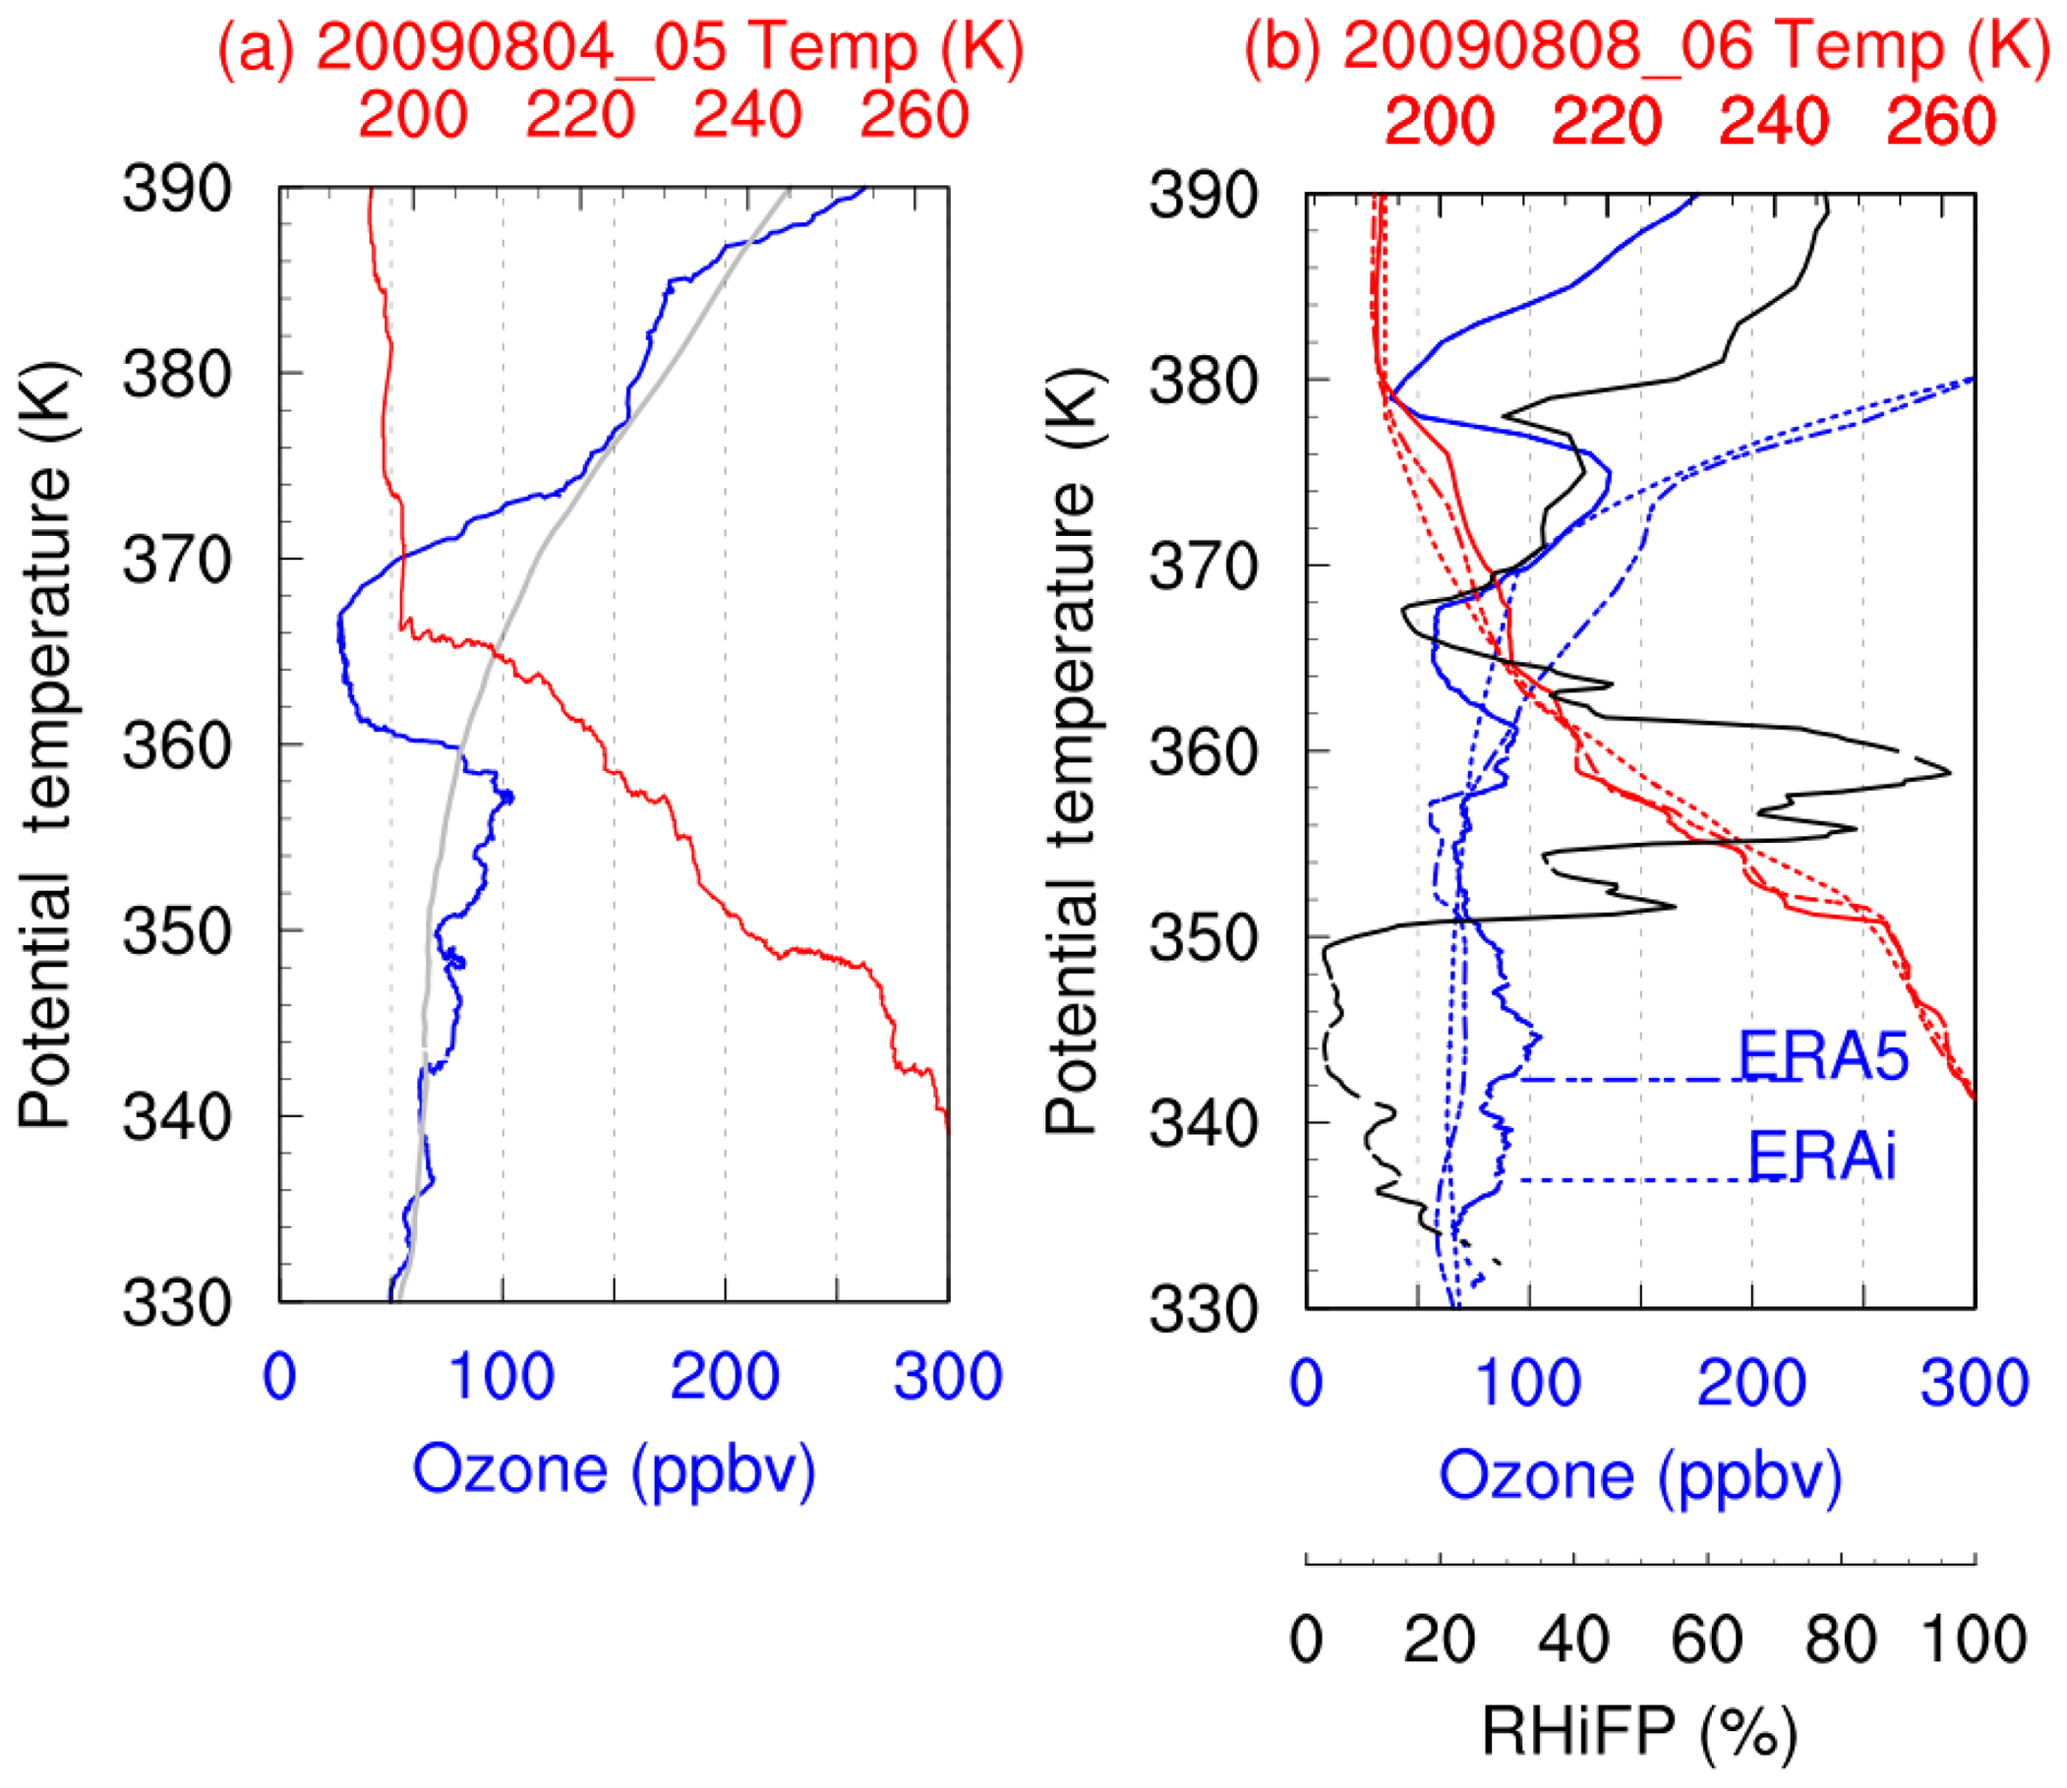
Figure 4Profiles of ozone (blue), mean ozone (grey), relative humidity from CFH (RHiFP, black), and temperature (red) in (a) Naha on 4 August and (b) Kunming on 8 August (solid line: observation; dashed line: ERA-Interim; dash-dotted line: ERA5).
3.1.3 Low temperatures and dehydration in the western Pacific
Figure 5 shows 7 d backward trajectories of air parcels with low ozone and low water vapour between 376 and 384 K initialized on 8 August 2009 in Kunming. A comparison of diabatic and kinematic trajectory calculations is shown based on ERA-Interim and ERA5 reanalysis data. Air parcels originating from the western Pacific were transported to the tropopause layer under significant influence of typhoon convection and then affected by the easterly wind flow at the south flank of the ASM anticyclone. Subsequently, air parcels moved horizontally via Naha, Ishigakijima, Taipei, Xiamen, Ganzhou, and Chenzhou and then to Kunming according to backward trajectories projected on the map (Fig. 5a–d). The convection associated with Typhoon Morakot transported ozone-poor air from the marine boundary layer to the tropopause layer; these low ozone values were captured as these air parcels moved westward to Naha and Kunming. Trajectories from ERA-Interim and ERA5 reanalysis data show the lowest temperature region (<190 K) in the tropopause layer over Taiwan and Ishigakijima except the ERA-Interim kinematic trajectories. The main difference of the backward trajectories is the vertical transport over the western Pacific, where tropical cyclones may occur (Fig. 5e–h). Large-scale slow descent processes (∼1–2 K d−1) can only be seen clearly from ERA-Interim kinematic trajectories (Fig. 5e). This is consistent with Ploeger et al. (2011), who showed much stronger vertical dispersion for ERA-Interim kinematic trajectories. Although all of the backward trajectories display the vertical transport within deep convection, the timescale and the strength of air parcels' vertical transport processes are different according to the backward trajectories as a function of time and isentrope. The timescale of the vertical transport from the lower troposphere to the tropopause layer based on ERA-Interim diabatic trajectories is about 4 d from 1 to 5 August (Fig. 5f). In contrast, the vertical transport timescale based on the ERA5 kinematic and diabatic trajectory calculations is 2 d around 4–5 August (Fig. 5g and h). Both the kinematic and diabatic trajectories from ERA5 display faster vertical transport than ERA-Interim. It is very likely that ERA5 resolves more convective events (e.g. Fig. 1), due to its better spatial and temporal resolution. Hoffmann et al. (2019) have also shown that tropical cyclones are represented better in ERA5, compared to ERA-Interim reanalysis data.
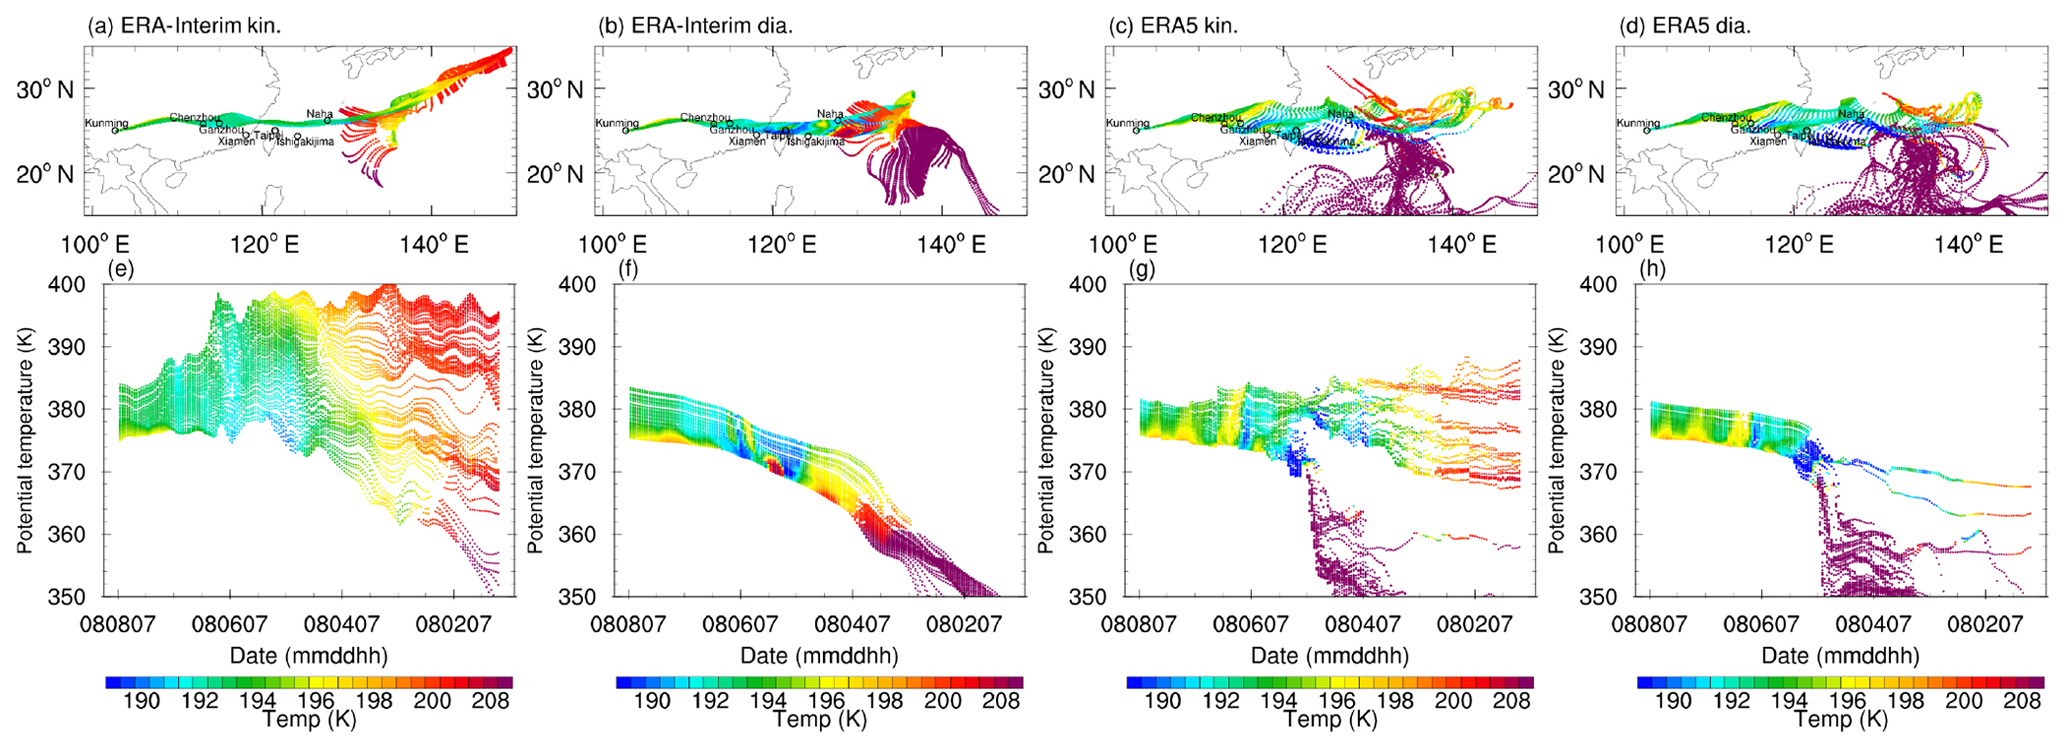
Figure 5ERA-Interim kinematic (a, e) and diabatic (b, f) as well as ERA5 kinematic (c, g) and diabatic (d, h) 7 d backward trajectories for air parcels started along the measured balloon profile between 376 and 384 K colour-coded by temperature in (a–d) a longitude–latitude cross section and (e–h) as a function of time vs. potential temperature.
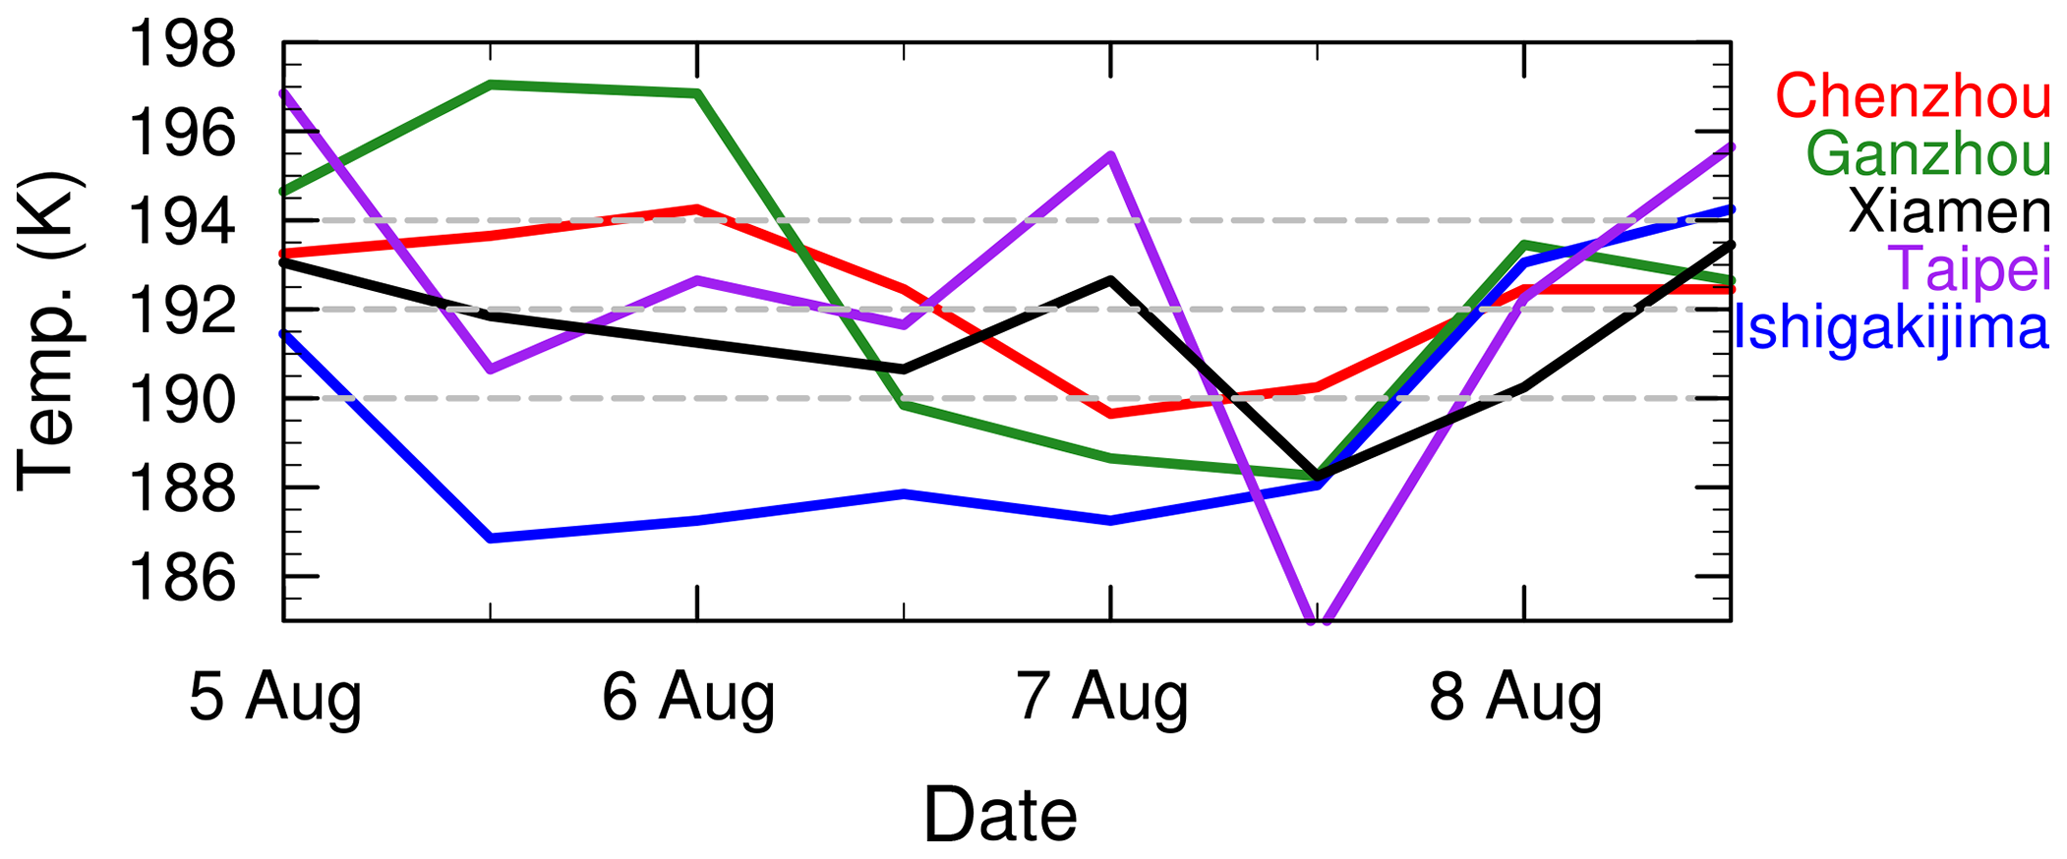
Figure 6The time series of the lowest temperature in the tropopause layer for Chenzhou, Ganzhou, Xiamen, Taipei, and Ishigakijima.
The time series of the lowest temperature from Chenzhou, Ganzhou, Xiamen, Taipei, and Ishigakijima are shown in Fig. 6 based on upper air soundings. The balloon measurement at Taipei captured the lowest temperature (186 K) during the period 5–7 August 2009 near the tropopause. ERA-Interim kinematic trajectories missed the lowest temperature values compared to the upper air soundings and do not show the strong updraught in tropical cyclones. Therefore, ERA-Interim kinematic trajectories will not be considered further in the following.
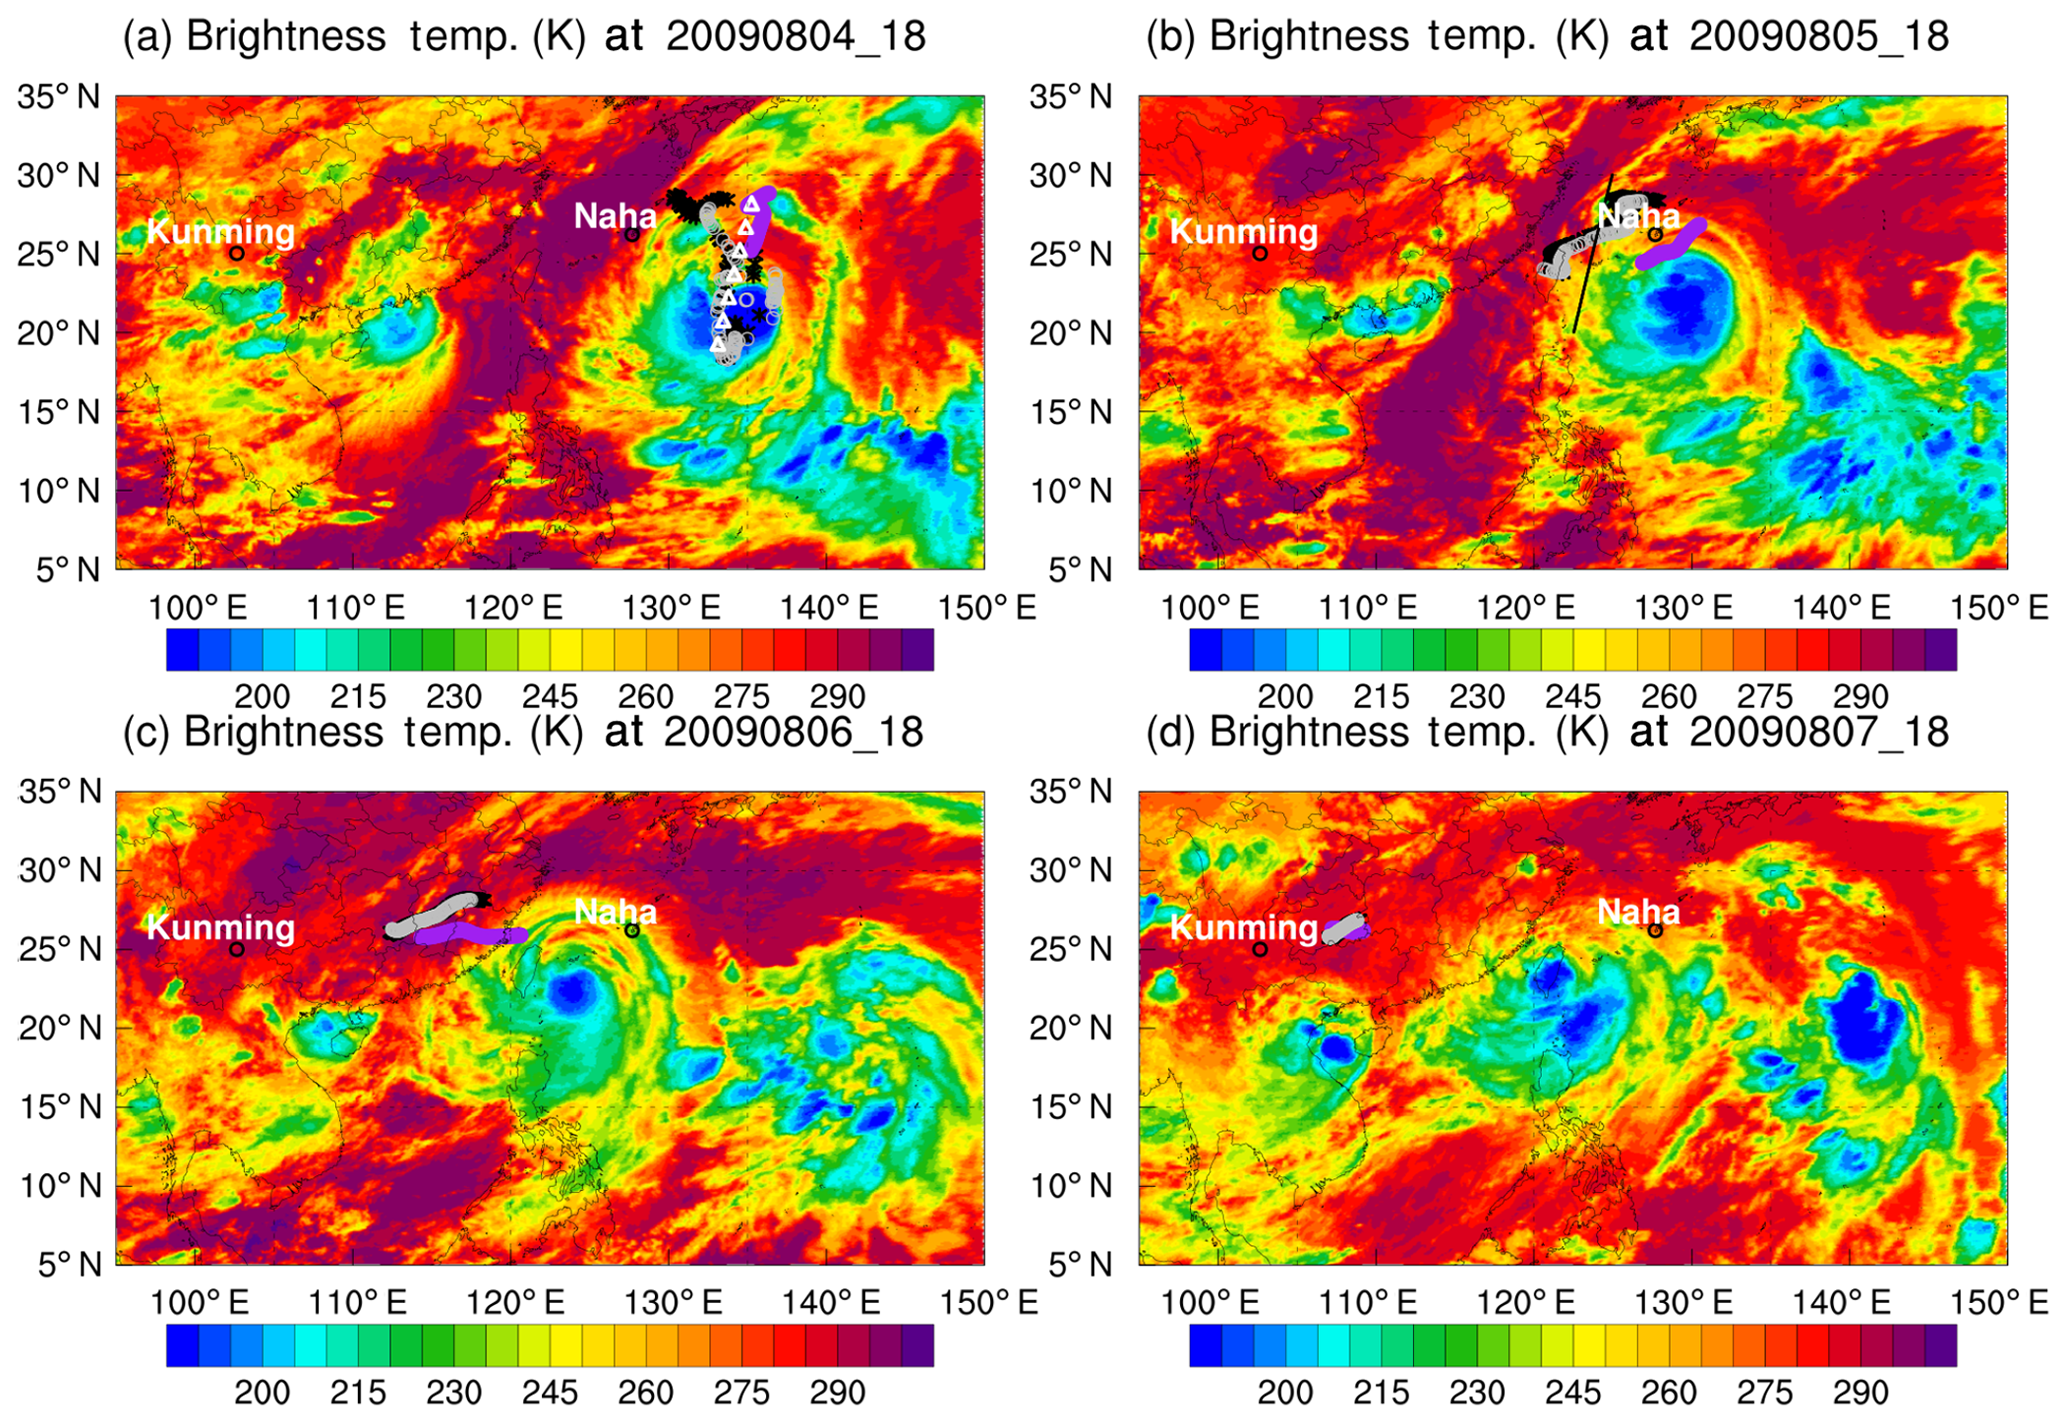
Figure 7Brightness temperature (K) from the IR channel of FY-2D on (a) 4 August, 18:00 UTC; (b) 5 August, 18:00 UTC; (c) 6 August, 18:00 UTC; and (d) 7 August 2015, 18:00 UTC, with air parcels' locations based on backward trajectories (grey circles: ERA5 diabatic; black asterisk: ERA5 kinematic; purple circles: ERA-Interim diabatic). White triangles mark the MLS tracks (a) and the black line denotes the ground track of CALIPSO (b).
Figure 7 shows the blackbody brightness temperature from the infrared radiation (IR) channel of FY-2D. The blue colour marks the low brightness temperature region, which means that deep convection with a high cloud top occurred in the centre of a tropical cyclone. Air parcels were located right above deep convection of Typhoon Morakot on 4 August according to the ERA5 kinematic and diabatic trajectories (Fig. 7a). The ERA-Interim diabatic trajectories were located further at the northern edge of the typhoon. One day later, all trajectories arrived at the Naha site over the western Pacific region (Fig. 7b). Air parcels continue to move westward towards Kunming under clear-sky conditions during the last two days (Fig. 7c and d).

Figure 8The time evolution of (a, b) the temperature (blue dots) and brightness temperature from FY-2D (grey dots), (c, d) the saturation water vapour mixing ratio (SMR), and (e, f) relative humidity over ice (RHi) along 4 d backward trajectories of air parcels on 376–384 K from (a, c, e) ERA-Interim and (b, d, f) ERA5 diabatic trajectories. The red dots in c and d denote the water vapour mixing ratio from MLS (left-hand side) and balloon observation (right-hand side).
In order to investigate the variation of water vapour mixing ratios at the top of the typhoon convection, Fig. 8a and b show the temperature along the 4 d backward trajectories of air parcels at 376–384 K on 8 August 2009 with the brightness temperature from FY-2D (grey dots). The y axis of Fig. 8 represents a vertical altitude coordinate (decreasing temperatures). The brightness temperature was interpolated from FY-2D onto the locations of air parcels from the ERA-Interim and ERA5 diabatic trajectory calculations and was used to describe the cloud top temperature. ERA-Interim diabatic trajectories show that air parcels were located right above the deep convection according to the brightness temperature from FY-2D from 5 August, 00:00 UTC, to 6 August, 12:00 UTC (Fig. 8a). Compared to ERA-Interim trajectories, ERA5 diabatic trajectory calculations show different results, in particular that the brightness temperature from FY-2D is lower than air parcels' temperature (187 K) on 4 August (Fig. 8b). In other words, the cloud top is higher than the air parcels' altitude. As a result, these air parcels will not be used for analysing the water vapour variation. The saturation water vapour mixing ratio (SMR) is estimated using the temperature along the backward trajectories of air parcels according to the Goff–Gratch equation (Goff and Gratch, 1946; Murphy and Koop, 2005). The minimum SMR appears on 5 August, at 12:00 UTC, corresponding to the lowest temperature region (Fig. 8c and d). Before air parcels enter the lowest temperature region, several profiles of water vapour from the MLS satellite near to the air parcels' locations (Fig. 7a) are used with the mean value of 5±0.3 ppmv marked with a red dot (left-hand side) of Fig. 8c and d on 4 August, 17:30 UTC, at 100 hPa. Three days later, the mean water vapour mixing ratio of the same air parcels are about 3 ppmv, marked with a red dot (right-hand side). The minimum water vapour mixing ratio observed by CFH is approximately 2.7 ppmv in Kunming on 8 August, after air parcels pass through the lowest temperature region from 5 August, 07:00 UTC, to 6 August, 12:00 UTC, in 2009. Although MLS water vapour profiles usually show mean values of a 3–4 km wide vertical layer, the value corroborates that air parcels become dry, with water vapour mixing ratios decreasing from 5 to 3 ppmv. The relative humidity over ice (RHi) is calculated by dividing the water vapour mixing ratio from the CFH by the SMR (Fig. 8e and f). If we assume that air parcels retain the water vapour mixing ratio when it had been observed by the CFH instrument on board the balloon payload, air parcels have experienced supersaturation (RHi up to 180 %) over the lowest temperature region according to ERA5 diabatic trajectories. ERA-Interim diabatic trajectories missed supersaturation, mainly due to higher temperatures along the trajectories of air parcels. CALIPSO total attenuated backscatter shows cirrus at the altitude of 17 km on 5 August around 18:00 UTC (not shown). The thin cirrus, in turn, provides evidence that dehydration is occurring over the lowest temperature region. As a conclusion, ice formation and drying processes during the Lagrangian air parcel history contribute to the low water vapour mixing ratios found over Kunming in August 2009.
3.2 Case 2: 10 August 2015
Vertical profiles of temperature, ozone, and water vapour measured over Kunming in August 2015 are shown in Fig. 9. The potential temperature of the lapse-rate tropopause on 10 August 2015 is about 383.7 K. The tropopause height in Kunming is usually higher than in the other regions at the same latitude, because of its location within the ASM anticyclone (Bian et al., 2012). On 10 August, the temperature between 365 and 376 K shows higher values than on other days. Ozone mixing ratios in August 2015 show a good agreement near the tropopause, except for 10 and 11 August, when much lower ozone mixing ratios are recorded. The ozone vertical profile observed on 10 August 2015 shows extremely low ozone mixing ratios between 364 and 390 K, with a minimum value of 22 ppbv around 368 K. Similarly low ozone values were measured on 11 August 2015, with a minimum ozone value of 30 ppbv near 373 K. Low ozone values near the tropopause in 2015 are lower than the values observed on 8 August 2009. The variability of water vapour near the tropopause is smaller, with values from 4 to 18 ppmv. On 10 August, water vapour mixing ratios are as low as 5 ppmv around 380 K. Unfortunately, water vapour mixing ratios on 11 August are not useful after quality control, because the CFH instrument entered a thick cloud (Fig. 9). Therefore, we only focus on the low ozone and low water vapour values (shaded range) near the tropopause on 10 August 2015.
3.2.1 Background meteorology
Figure 10 shows the 6 d average (5–10 August 2015) of the geopotential height isolines (>16.7 km) at 100 hPa with the temperature, horizontal wind vector, and the tracks of Typhoon Soudelor. Typhoon Soudelor formed as a depression on 29 July 2015 over the middle of the Pacific. It became strong during the period of 3–8 August, reaching peak intensity on 3 August as a Category 5 on the Saffir–Simpson hurricane wind scale. On 9 August 2015, Soudelor degraded to a tropical depression. Soudelor was the most intense tropical cyclone of the 2015 Pacific typhoon season. The tracks of Typhoon Soudelor are just right below the southeast edge of the ASM anticyclone during the period of 6–10 August. These circumstances create favourable conditions for air parcels on top of the typhoon to be transported into the southern flank of the ASM anticyclonic circulation.
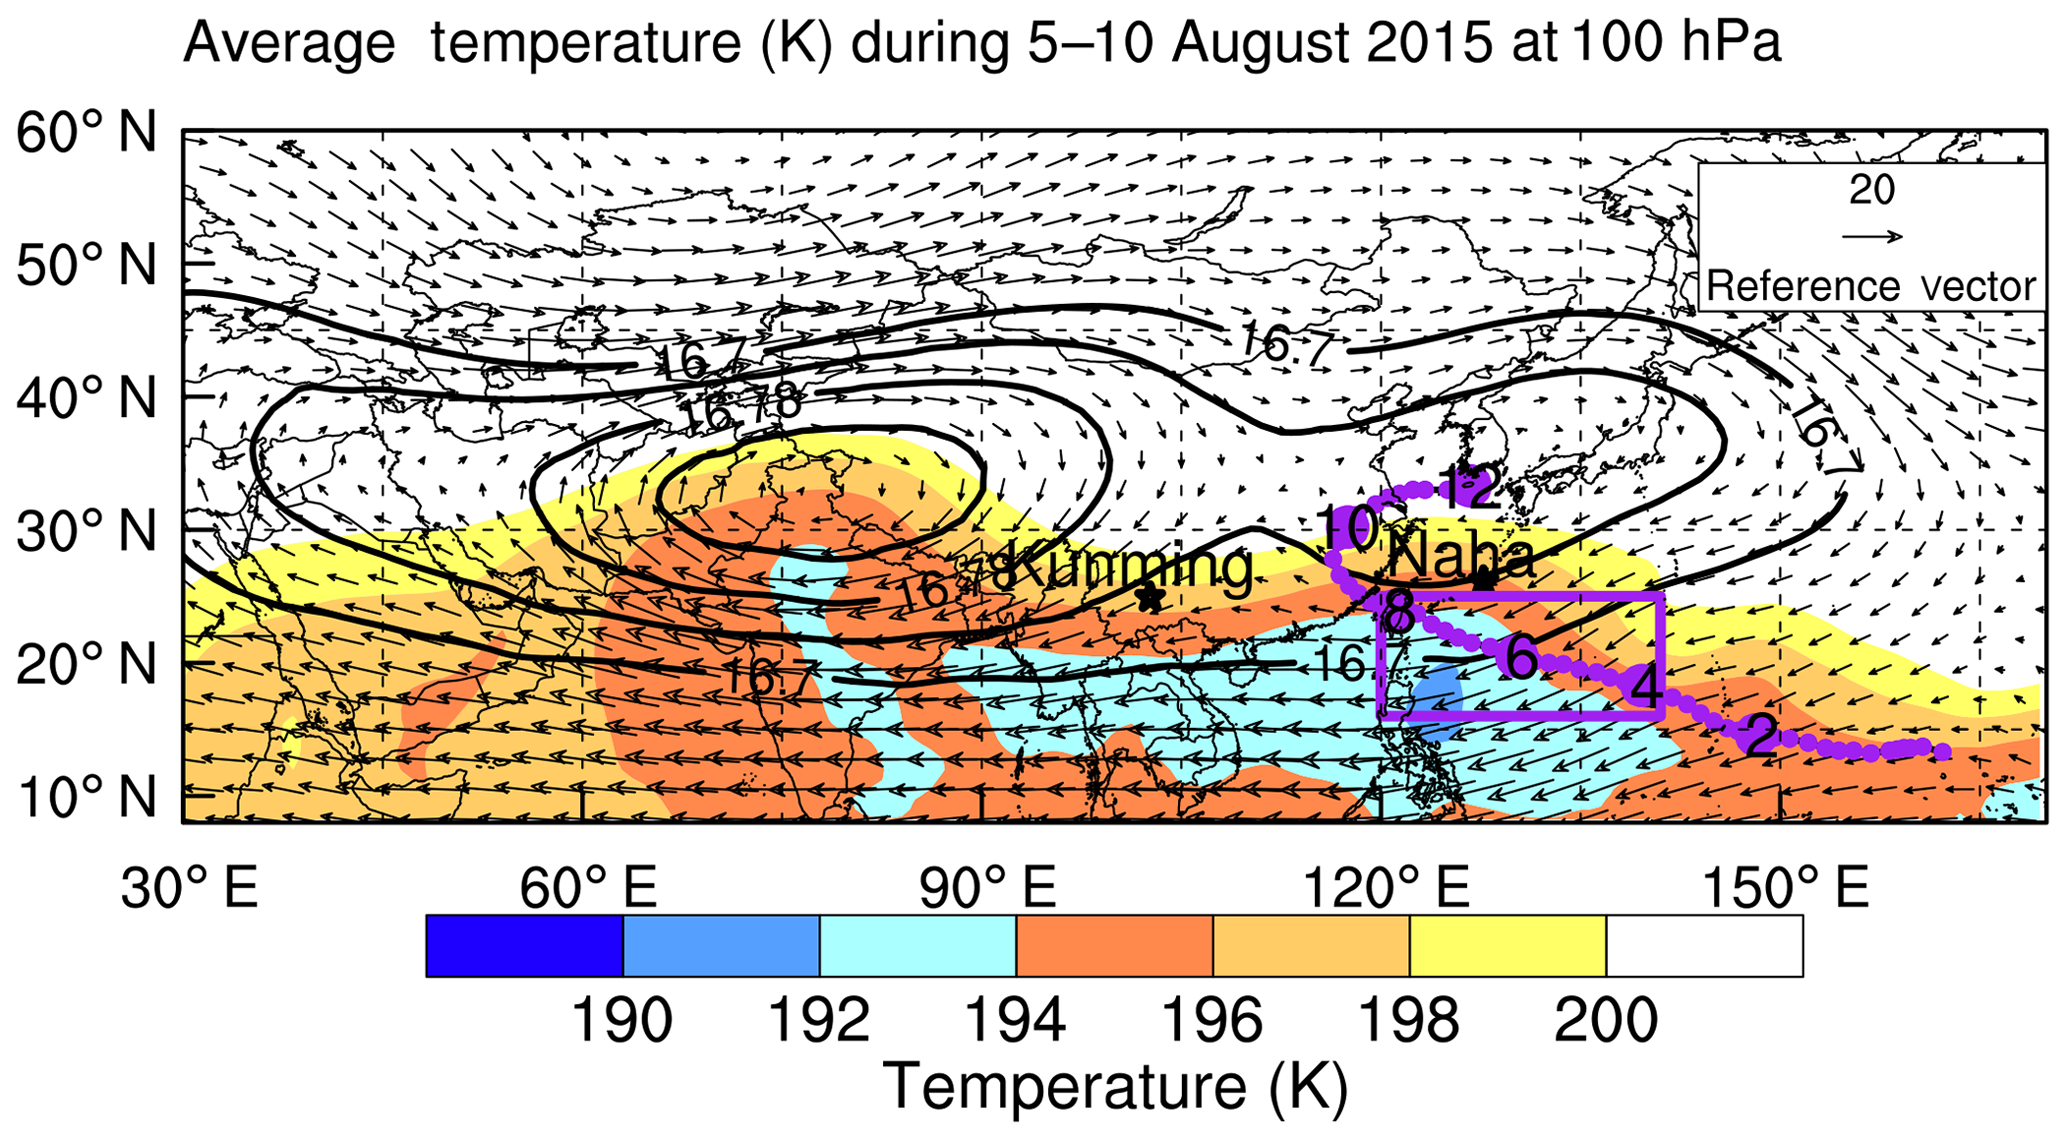
Figure 10As Fig. 3 but for the case in August 2015 and Typhoon Soudelor.
3.2.2 Low ozone in the tropopause layer
Figure 11a shows the mean ozone profile in the rectangle region bounded by purple line in Fig. 10 measured on 31 July, 2, 4, 6, 8, and 10 August by the MLS. On 31 July and 2 August, the rectangle region was without any influence of Typhoon Soudelor. Ozone profiles from the MLS show that the ozone concentration near the tropopause is approximately 50 ppbv at 350 K. In contrast, MLS measurements show that the ozone concentration in the upper troposphere (352–370 K) is about 20 ppbv during the passage of Typhoon Soudelor on 4, 6, and 8 August. Ozone values quickly return to a normal value (∼50 ppbv) during the post-typhoon period on 10 August.
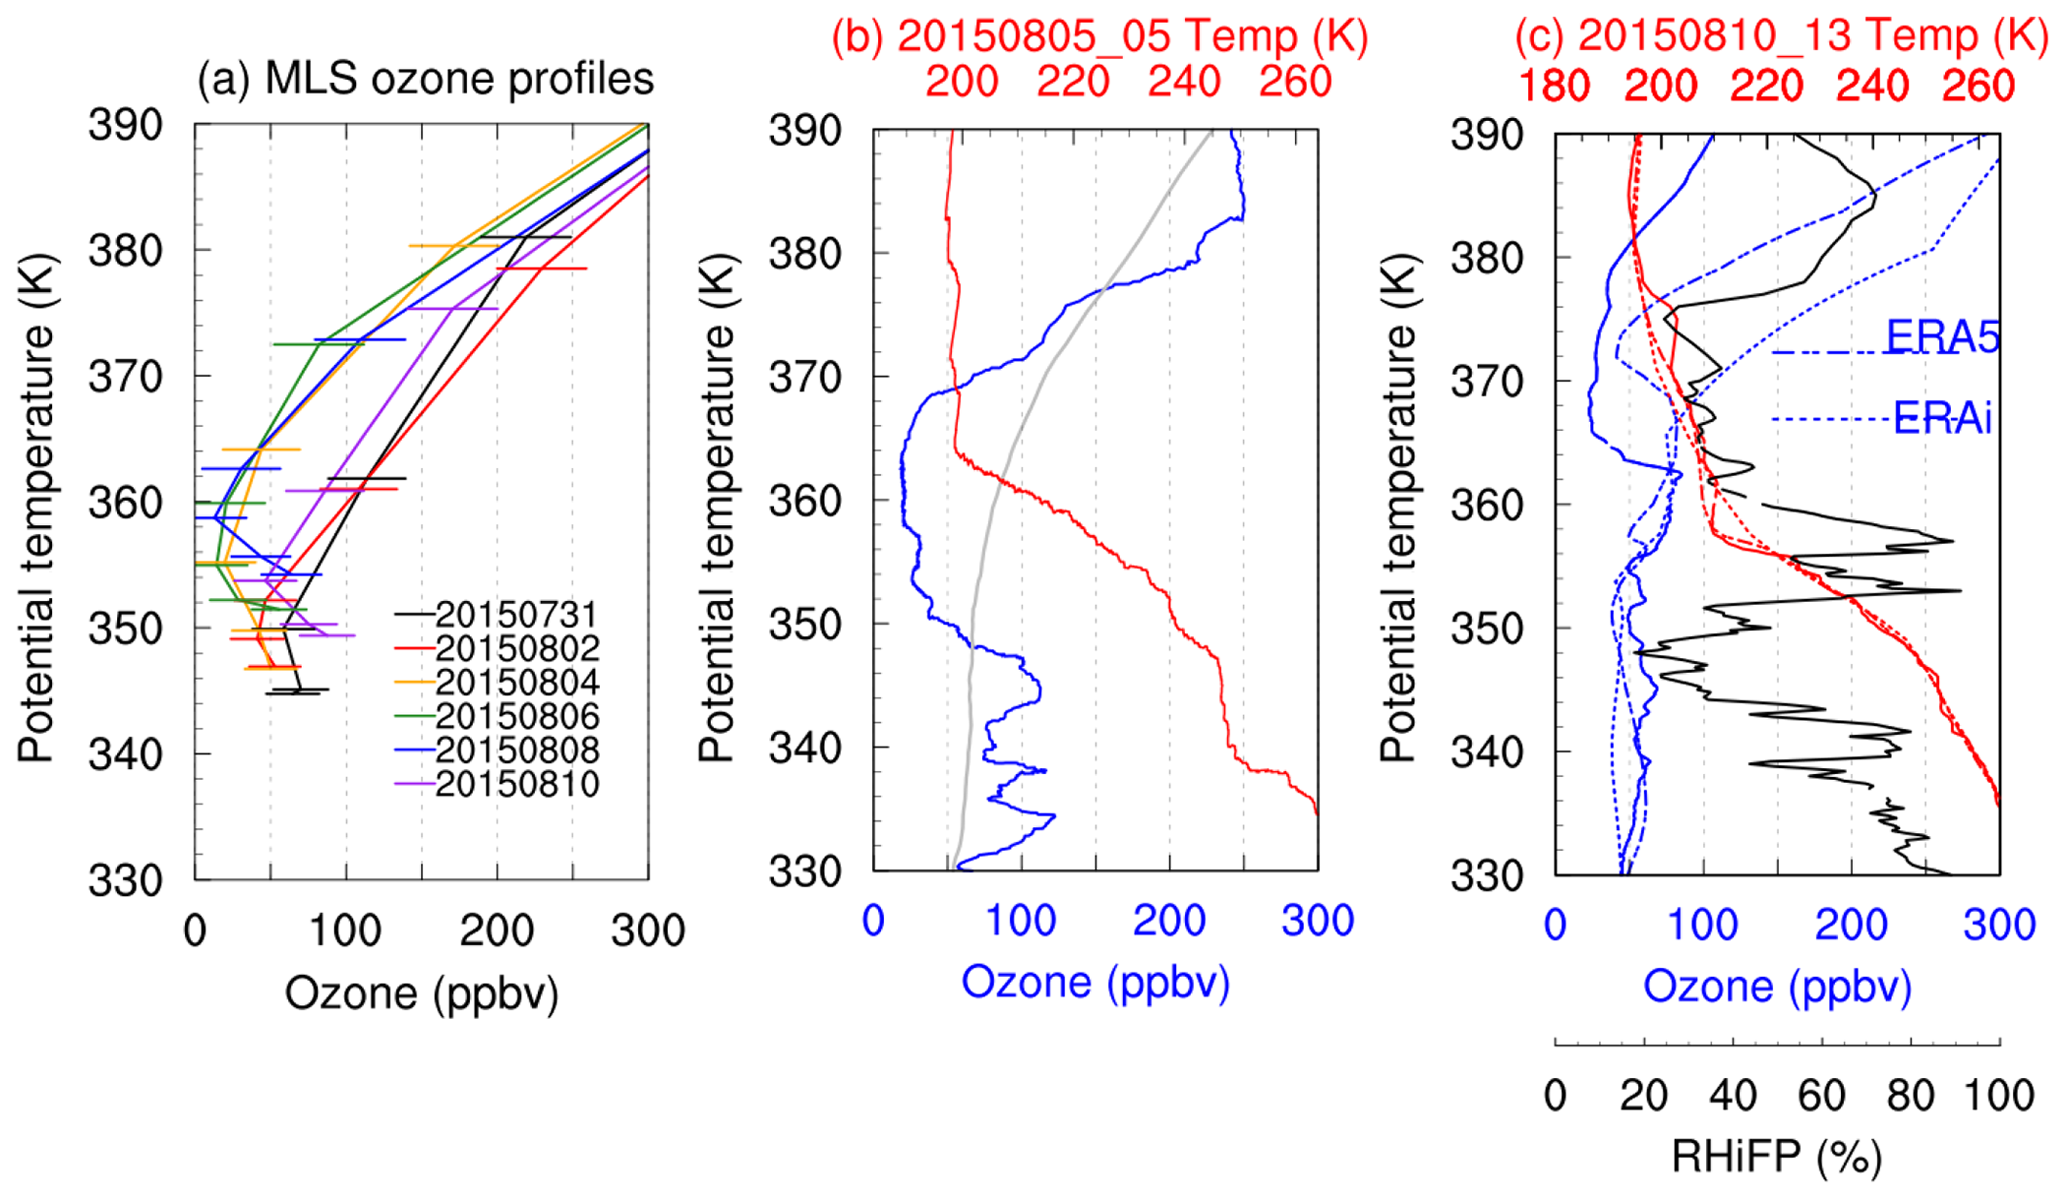
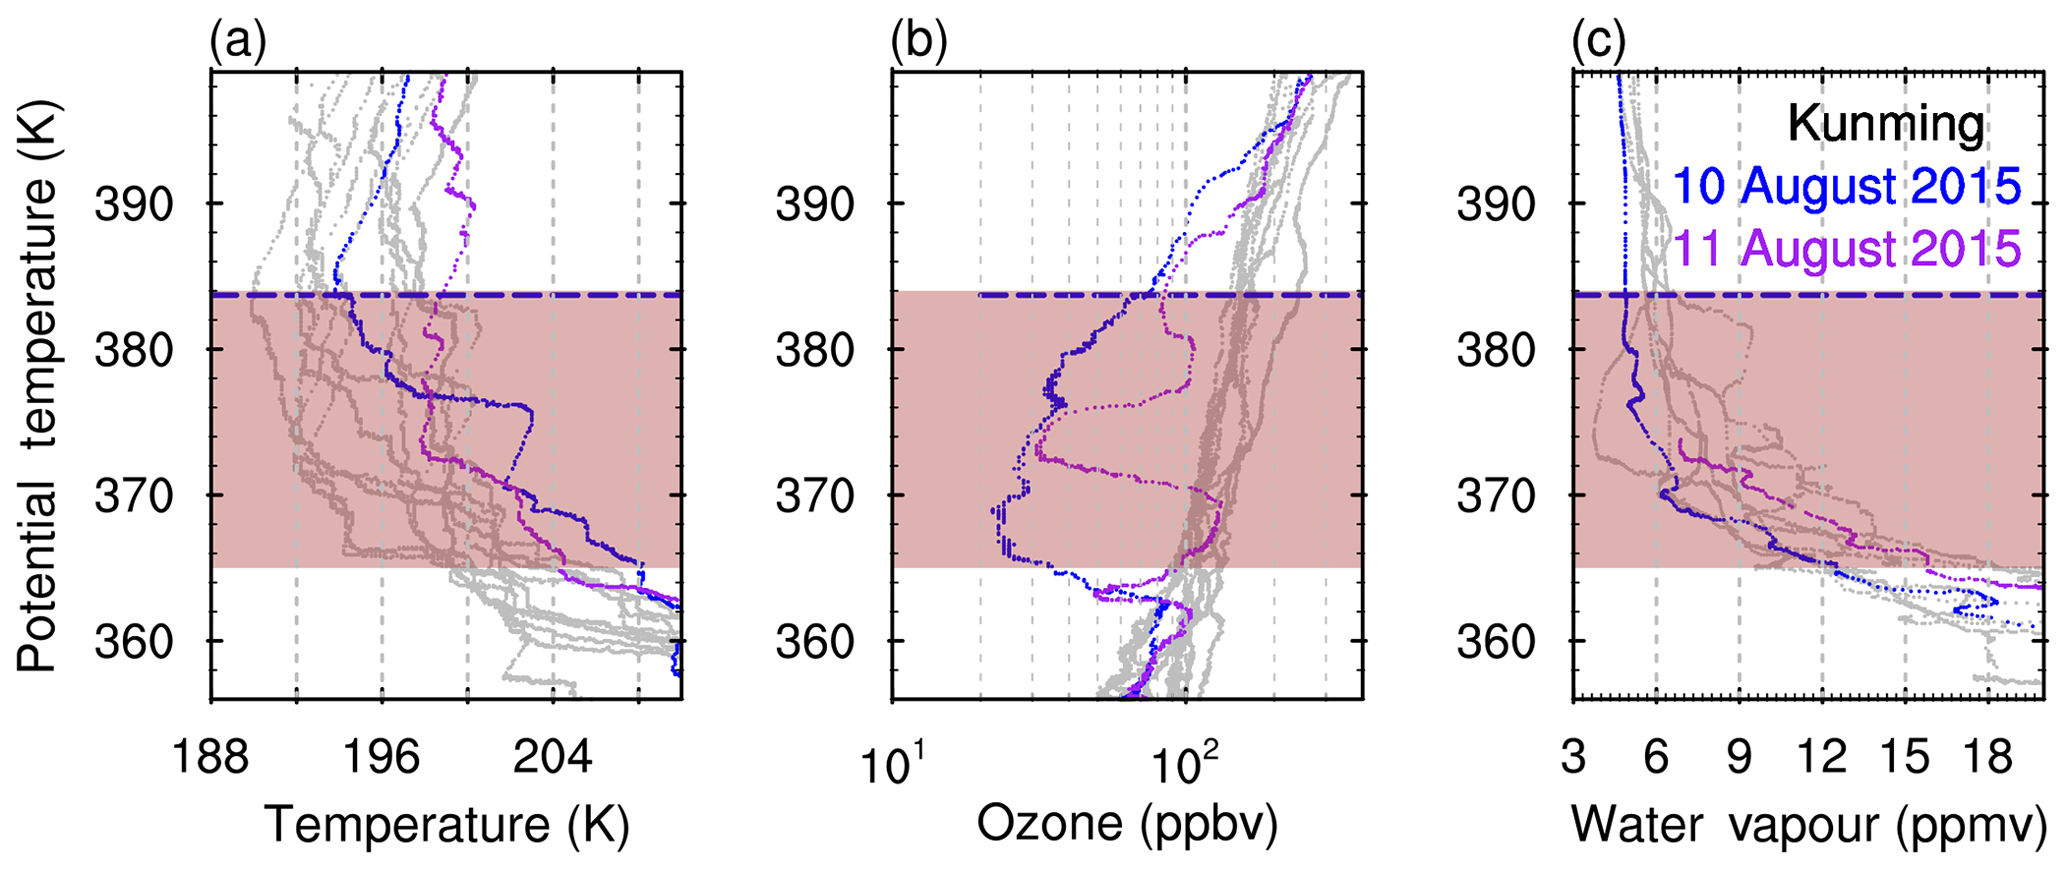
Figure 11(a) Mean ozone profiles measured from MLS satellite data before, during, and after Soudelor passed through the purple rectangle region of Fig. 10. Profiles of ozone (blue), mean ozone (grey), RHiFP (black), and temperature (red) in (b) Naha and (c) Kunming. Solid line: observation; dashed line: ERA-Interim; dash-dotted line: ERA5.
A balloon was launched at the Naha site, Japan, on 5 August 2015 before Typhoon Soudelor passed through. As Fig. 11b shows, low ozone values (22 ppbv) appeared between 352 and 368 K. This further confirms that deep convection associated with the Typhoon Soudelor can uplift air parcels from the boundary layer with low ozone to the tropopause layer. Balloon measurements on 10 August over Kunming captured extremely low ozone between ∼363 and 382 K (∼14.5–17.5 km) with mixing ratios around 22 ppbv as shown in Fig. 11c. The ozone and water vapour at 363–382 K are lower by 80 % and 20 % compared to the monthly mean value, respectively (Fig. A5). Temperatures and ozone from the ERA-Interim and ERA5 reanalysis data were interpolated to the balloon ascent profile. The temperatures from ERA-Interim, ERA5, and from the radiosonde agree very well in the free troposphere and in the lower stratosphere. However, the temperatures from ERA-Interim and ERA5 differ from the radiosonde measurements at the tropopause. The ERA5 ozone profile is in better agreement with ozonesonde measurements in Kunming, especially in the tropopause region, compared to ERA-Interim in August 2015.
A comparison of diabatic and kinematic trajectory calculations is shown based on ERA-Interim and ERA5 reanalysis in Fig. 12. Air parcels from the western Pacific, merged in the easterly wind flow at the southern flank of the ASM anticyclone, via Naha, Ishigakijima, Laoag, Shantou, Hong Kong, Wuzhou, and Haikou, and then were transported to Kunming within 5 d (Fig. 12a–d). Both the kinematic and diabatic trajectories from the ERA-Interim and ERA5 reanalysis data show the lowest temperature region (<190 K) over southern China during the period 7–9 August. Only the ERA5 kinematic trajectories show the typical spiral structure of tropical cyclones (Fig. 12c).
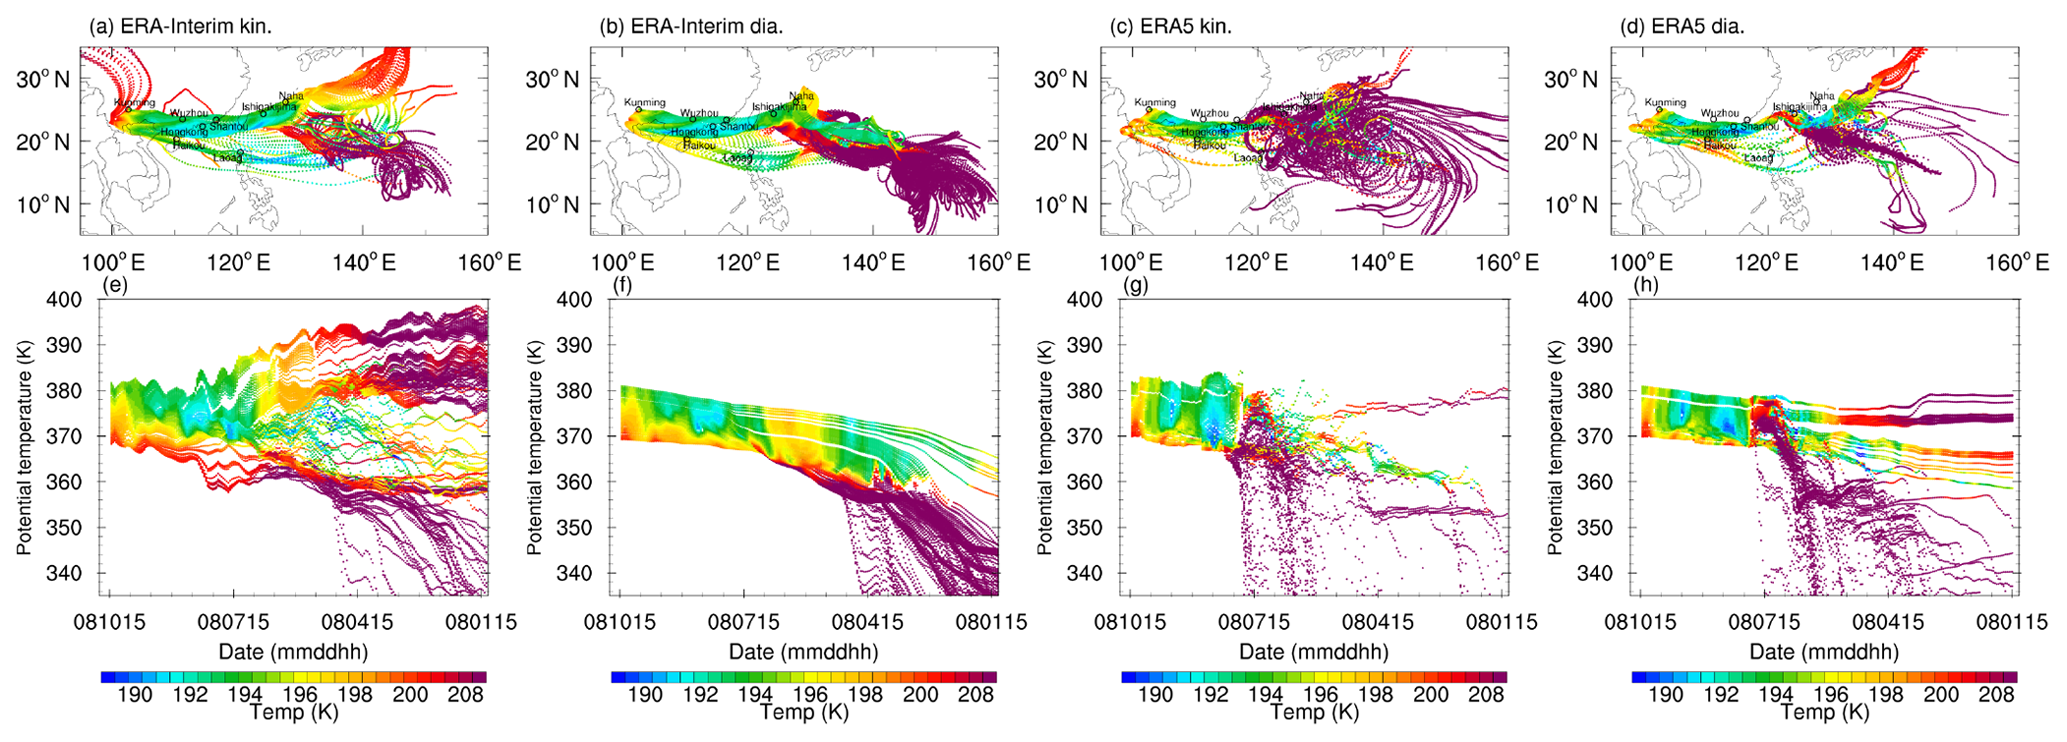
Figure 12As Fig. 5 but for the case on 10 August 2015.
The main difference between the backward trajectories based on ERA-Interim and ERA5 originates from the vertical transport over the western Pacific, where Typhoon Soudelor occurred (Fig. 12e–h). Although all of the backward trajectory calculations show vertical transport within the deep convection, the timescale and the strength of air parcels' transport are very different. The timescale for the vertical transport from the lower troposphere to the tropopause layer is about 4 d (1–4 August) based on ERA-Interim kinematic and diabatic trajectories. In contrast the timescale is 2 d (6–7 August) based on the ERA5 kinematic and diabatic trajectories. Both the kinematic and diabatic trajectories from ERA5 show faster vertical transport than ERA-Interim backward trajectories. The time series of the lowest temperature from Haikou, Wuzhou, Hong Kong, Shantou, Laoag, and Ishigakijima are shown based on upper air soundings (Fig. 13). Balloon measurements in Haikou captured the lowest temperature (187 K) during 7–8 August 2015 near the tropopause. Upper air soundings from Ishigakijima, Laoag, Shantou, Hong Kong, and Wuzhou also show the lowest temperature tropopause layer (190–194 K) during 6–10 August 2015.
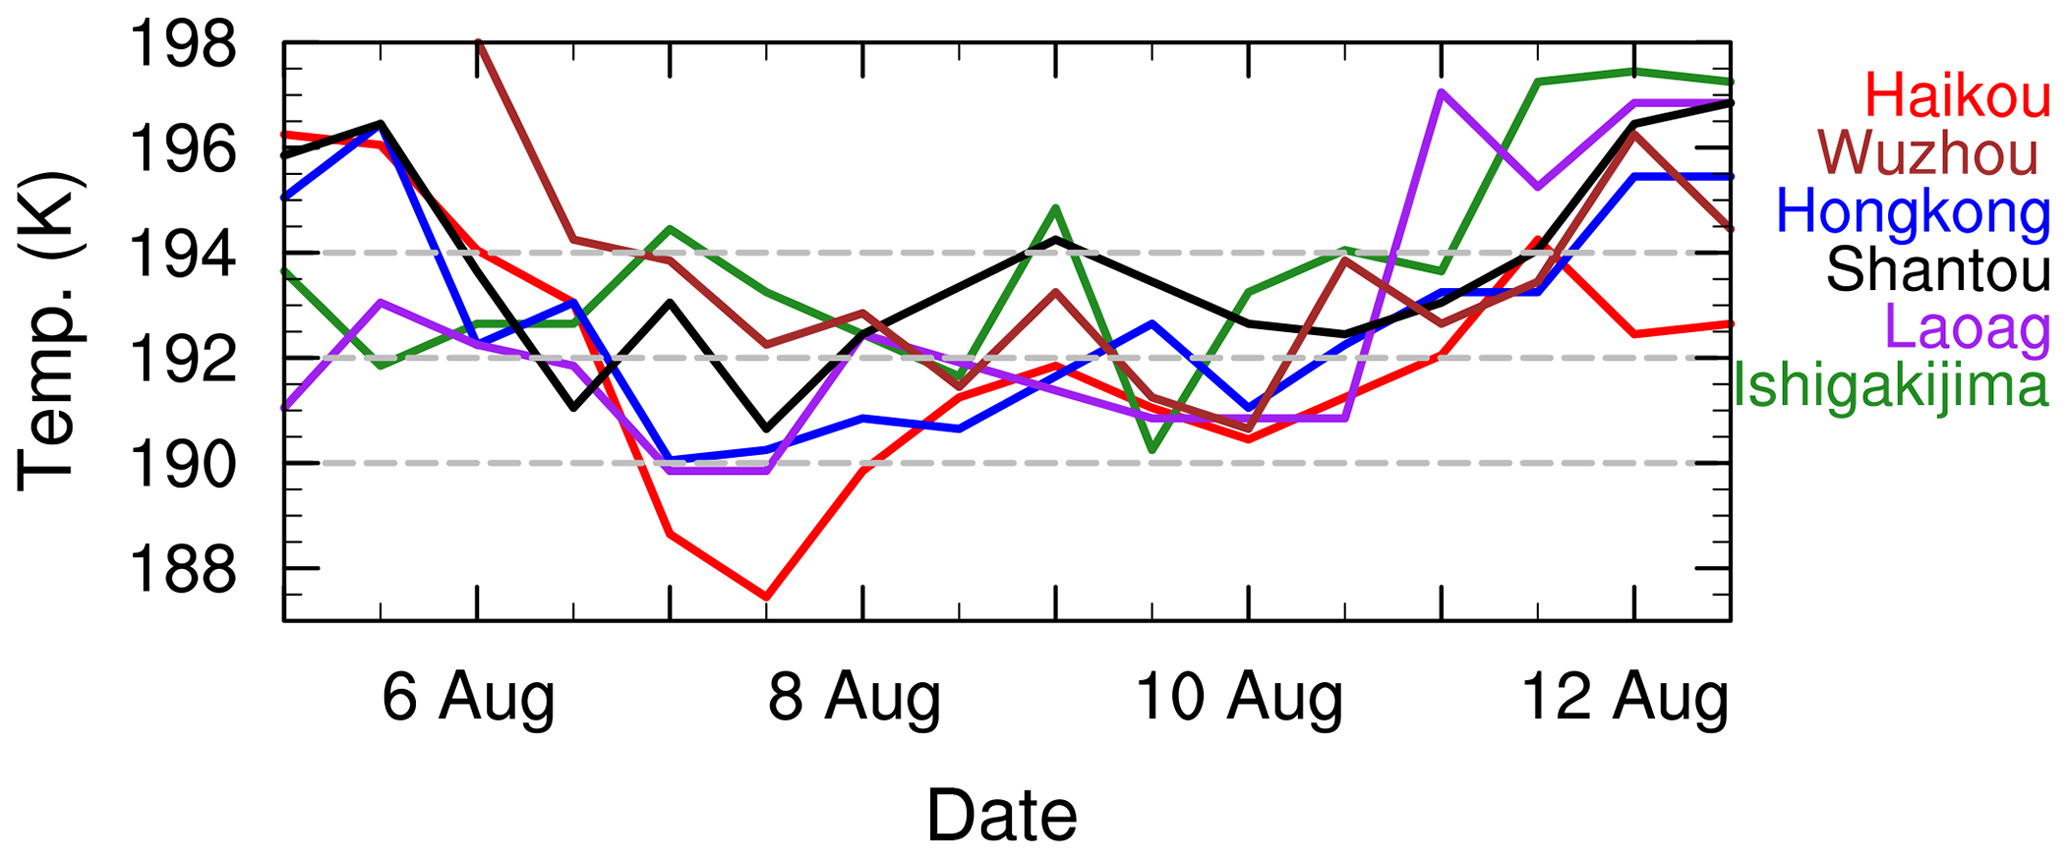
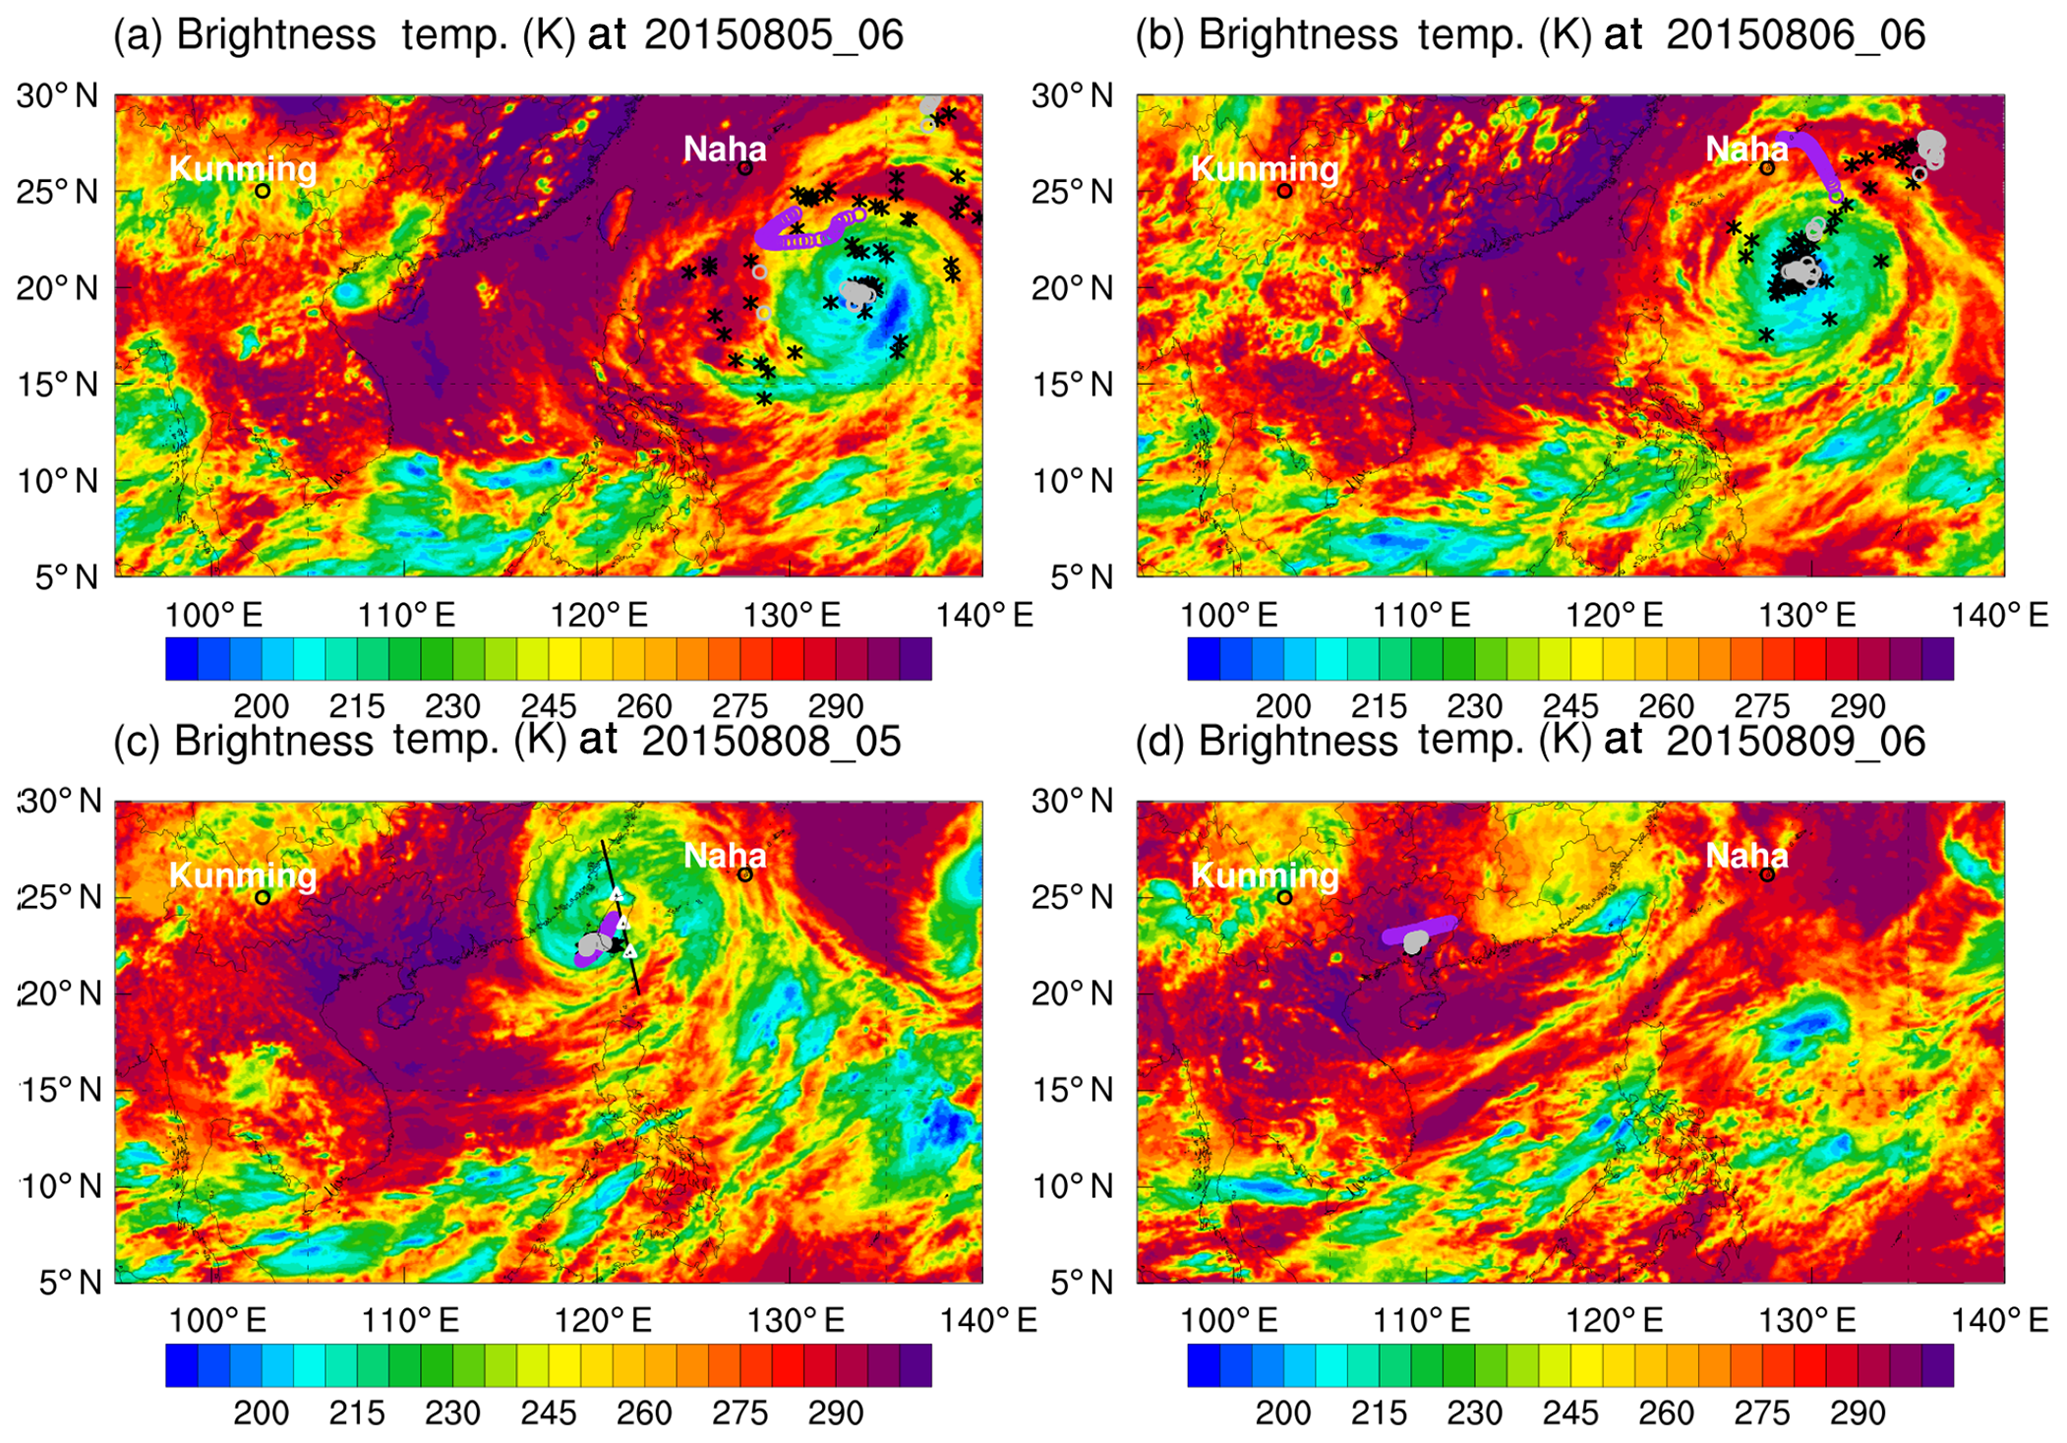
Figure 14Brightness temperature from the FY-2G satellite on (a) 5 August, (b) 6 August, (c) 8 August, and (d) 9 August 2015 with backward trajectories (grey circles: ERA5 diabatic; black asterisk: ERA5 diabatic; purple circles: ERA-Interim diabatic) for air parcels with low ozone and low water vapour.
3.2.3 Dehydration based on the ERA-Interim and ERA5 reanalysis data
Figure 14 displays the brightness temperature from the FY-2G satellite with air parcels' locations at the corresponding time based on ERA-Interim diabatic trajectory calculations and ERA5 kinematic and diabatic trajectories. On 5 August, Naha was located at the northern edge of Typhoon Soudelor (Fig. 14a). A balloon launched at Naha captured the low ozone mixing ratios in the TTL as Fig. 11b shows. On 6 August, air parcels from ERA5 kinematic and diabatic trajectory calculations were located above the centre of Soudelor (Fig. 14b). Some of the air parcels from the ERA-Interim diabatic trajectory calculations were still located at the edge of Typhoon Soudelor. Air parcels moved westward toward Kunming on 8 August (Fig. 14c), and the lowest brightness temperature is 190 K above Taiwan. On 9 August, air parcels arrived in Kunming under clear-sky conditions (Fig. 14d).
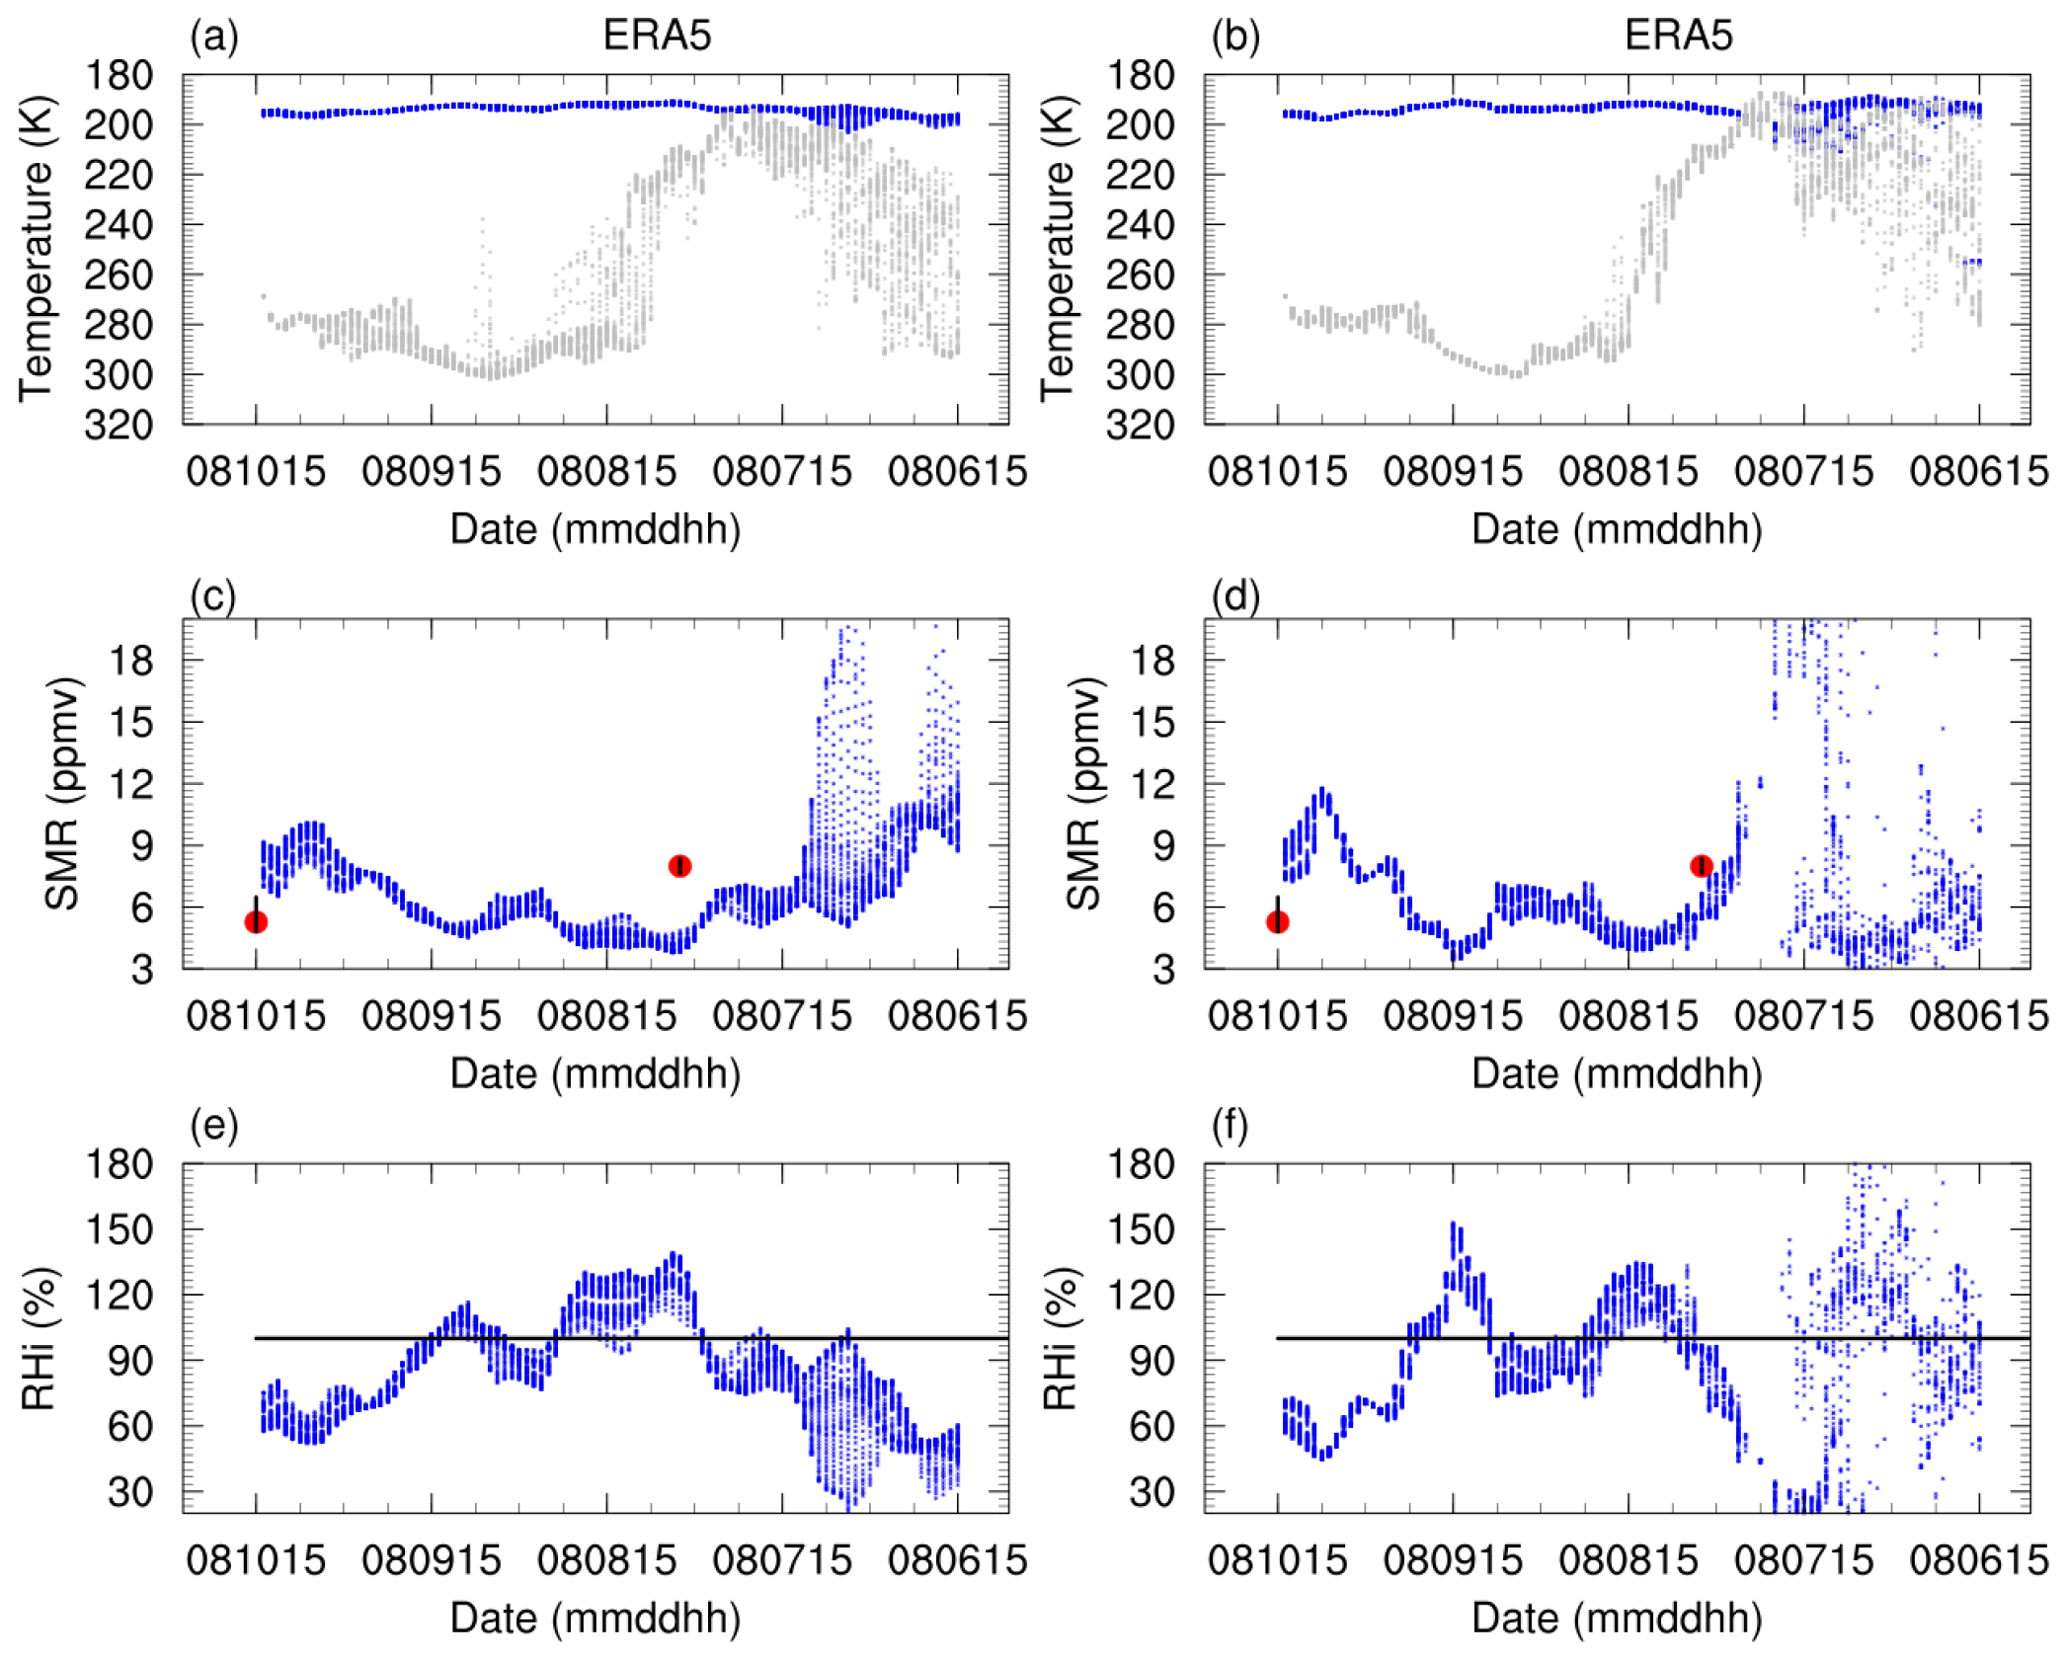
Figure 15a and b show the temperature along the 4 d backward trajectories for air parcels at 374–381 K on 10 August 2015 with the brightness temperature from FY-2G. From 00:00 UTC on 7 August to 12:00 UTC on 8 August, the air parcels are located at the top of the deep convection associated with Typhoon Soudelor according to the FY-2G brightness temperature (Fig. 15a and b). Before air parcels enter the lowest temperature region, the water vapour mixing ratios from the MLS satellite are 7±0.3 ppmv at 05:30 UTC on 8 August at 100 hPa (Fig. 15c and d). Two days later, the water vapour mixing ratios observed by CFH are approximately 5 ppmv in Kunming (red dot on right-hand side of Fig. 15); hence they significantly decreased after the air parcels passed through the lowest temperature region from 05:00 UTC to 21:00 UTC on 8 August 2015. The RHi is calculated from the observed water vapour mixing ratios (CFH on 10 August) divided by the SMR (Fig. 15e and f). Air parcels experienced supersaturation during the lowest temperature period based on ERA5 diabatic trajectory calculations. Freezing and drying processes contribute to the variability of water vapour mixing ratios observed over Kunming in August 2015 again as for the case in 2009.
The low ozone and low water vapour mixing ratios near the tropopause measured on 8 August 2009 and 10 August 2015 in Kunming are investigated using balloon measurements, satellite measurements, and CLaMS simulations. MLS ozone and water vapour measurements and trajectory calculations from the CLaMS model confirm that the vertical transport is largely caused by tropical cyclones, whereas the horizontal transport is caused by the ASM anticyclone. The interplay between tropical cyclones and the ASM anticyclone exerts a major influence on transporting the ozone-poor western Pacific boundary air to the tropopause layer and even to the ASM anticyclone region. This interplay is consistent with an earlier study by Li et al. (2017) analysing low ozone values in Lhasa measured in August 2013. The deep convective clouds associated with tropical cyclones have considerable implications on ozone in the UTLS (Fu et al., 2013; Li et al., 2017) and in consequence other chemical species, such as the hydroxyl radical (Rex et al., 2014).
The lowest temperatures at the tropopause over the western Pacific ocean mainly drive the dehydration process. As a result, air parcels become dry when they pass the low-temperature region before entering the stratosphere. Holton and Gettelman (2001) called this “the cold trap in winter”. Our case studies show that the low temperature (<190 K) at the outflow of deep convective clouds associated with tropical cyclones causes freeze-drying in the tropopause layer during the summer season at the southeastern edge of the ASM. This result is consistent with results of Holton and Gettelman (2001) demonstrating the low temperatures in winter, with the lowest temperatures also occurring over the western Pacific and causing freeze-drying in the winter tropopause layer. Besides tropical cyclones, other potential mechanisms (wave activity) can also contribute to dehydration in the tropopause layer (Fujiwara et al., 2012).
Our observations further confirm previous studies (Hasebe et al., 2013; Inai et al., 2013; Wright et al., 2011) showing that air masses emanating from the South China Sea and Philippine Sea become particularly dry when they pass through the lowest temperature regions around the tropopause over the western Pacific. We found that the easterly winds on the southern flank of the ASM anticyclone transport these air masses with low ozone and low water vapour to the west over a distance of approximately 2000 km to Kunming. This observation is different from the features of low ozone and high water vapour in the ASM anticyclone (Park et al., 2007). The trajectory calculations using ERA5 data show faster and stronger vertical transport than those based on ERA-Interim reanalysis data. The ERA5 wind field appears to represent convective updraughts and tropical cyclones much better than ERA-Interim, due to ERA5's better spatial and temporal resolution. This is consistent with the stronger vertical transport in ERA5 compared to ERA-Interim reanalysis data. ERA5 backward trajectories show stronger dispersion of temperature values than ERA-Interim trajectories, by comparing the ERA-Interim and ERA5 reconstructed SMRmin with the water vapour mixing ratio observed by CFH (Fig. B1).
The interplay between tropical cyclones and the ASM anticyclone has the potential to impact the long-term trends of ozone, water vapour, and even optically thin cirrus near the tropopause, particularly under climate change conditions, when the occurrence of tropical cyclones is expected to increase.
Figure A1 compares the geopotential height and horizontal wind speeds at 150 hPa on 4, 5, and 6 August 2009 between ERA-Interim and ERA5 reanalysis data. The geopotential height from ERA-Interim and ERA5 data shows a similar pattern. The horizontal wind fields also show the same pattern, but the ERA5 wind fields display more small-scale structures.
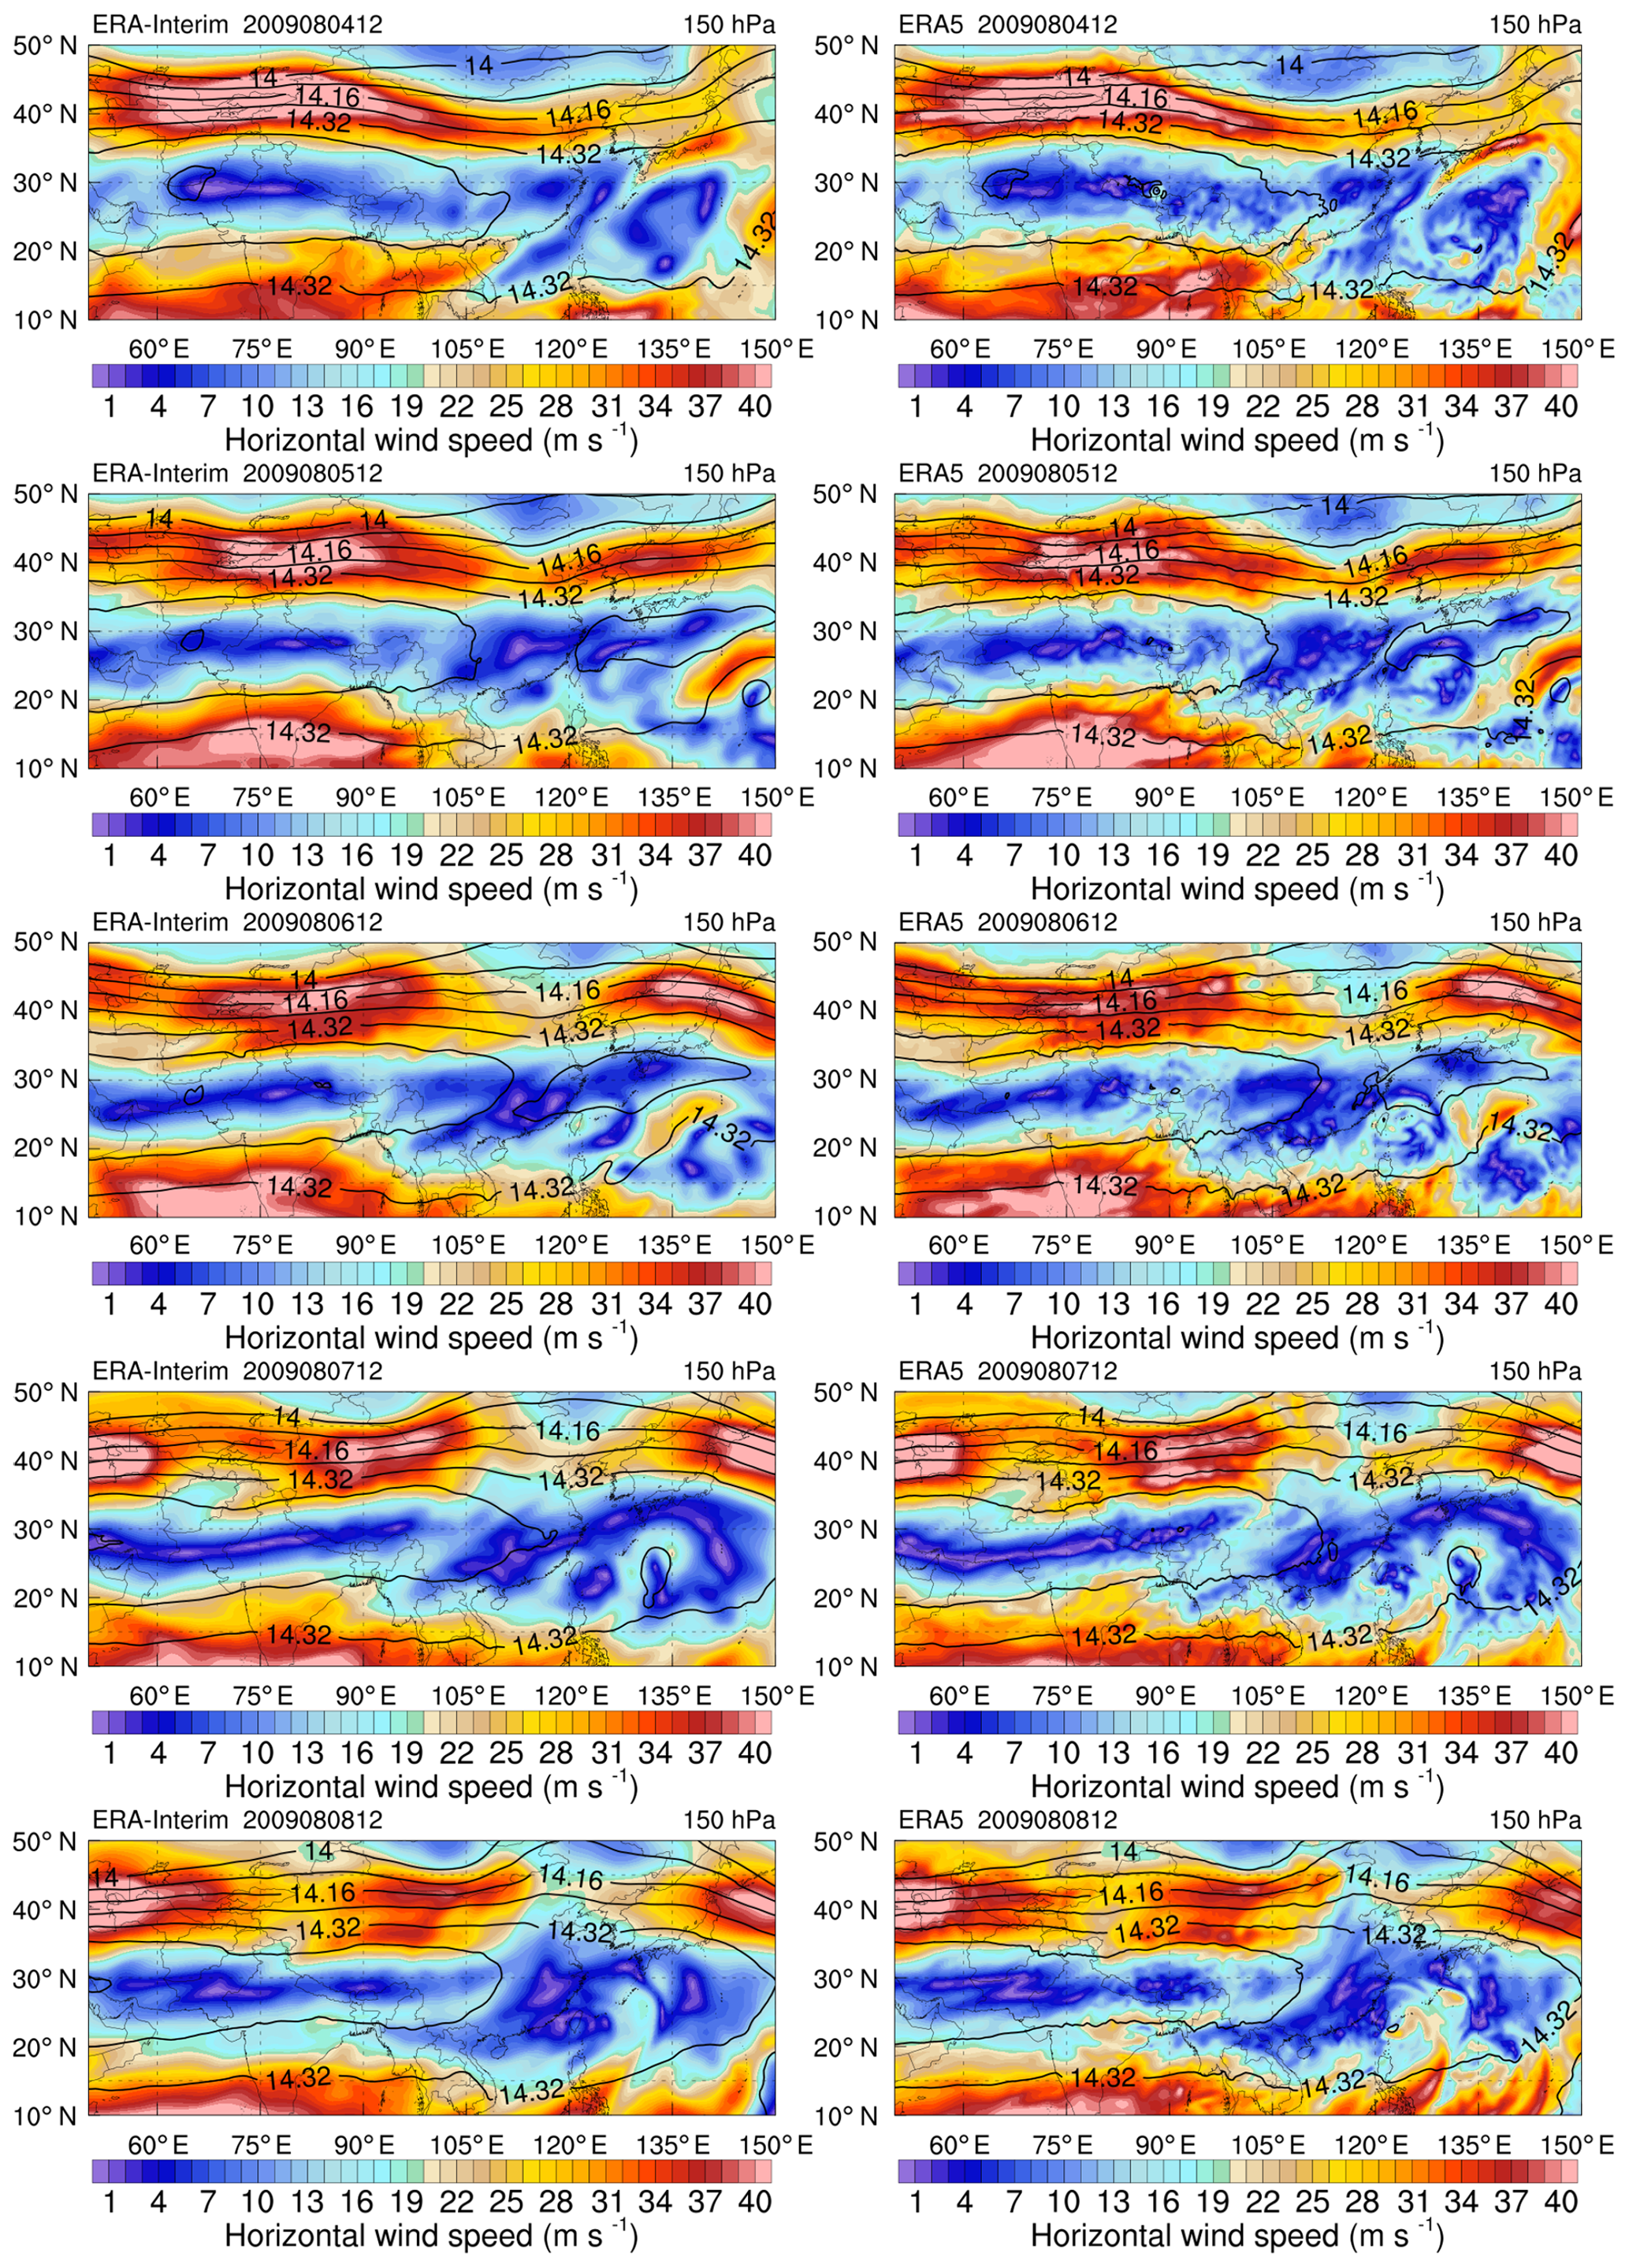
Figure A1Geopotential height (black lines, gpkm) and horizontal wind speeds (shaded, m s−1) at 150 hPa on 4, 5, 6, 7, and 8 August 2009 from ERA-Interim (left) and ERA5 (right).
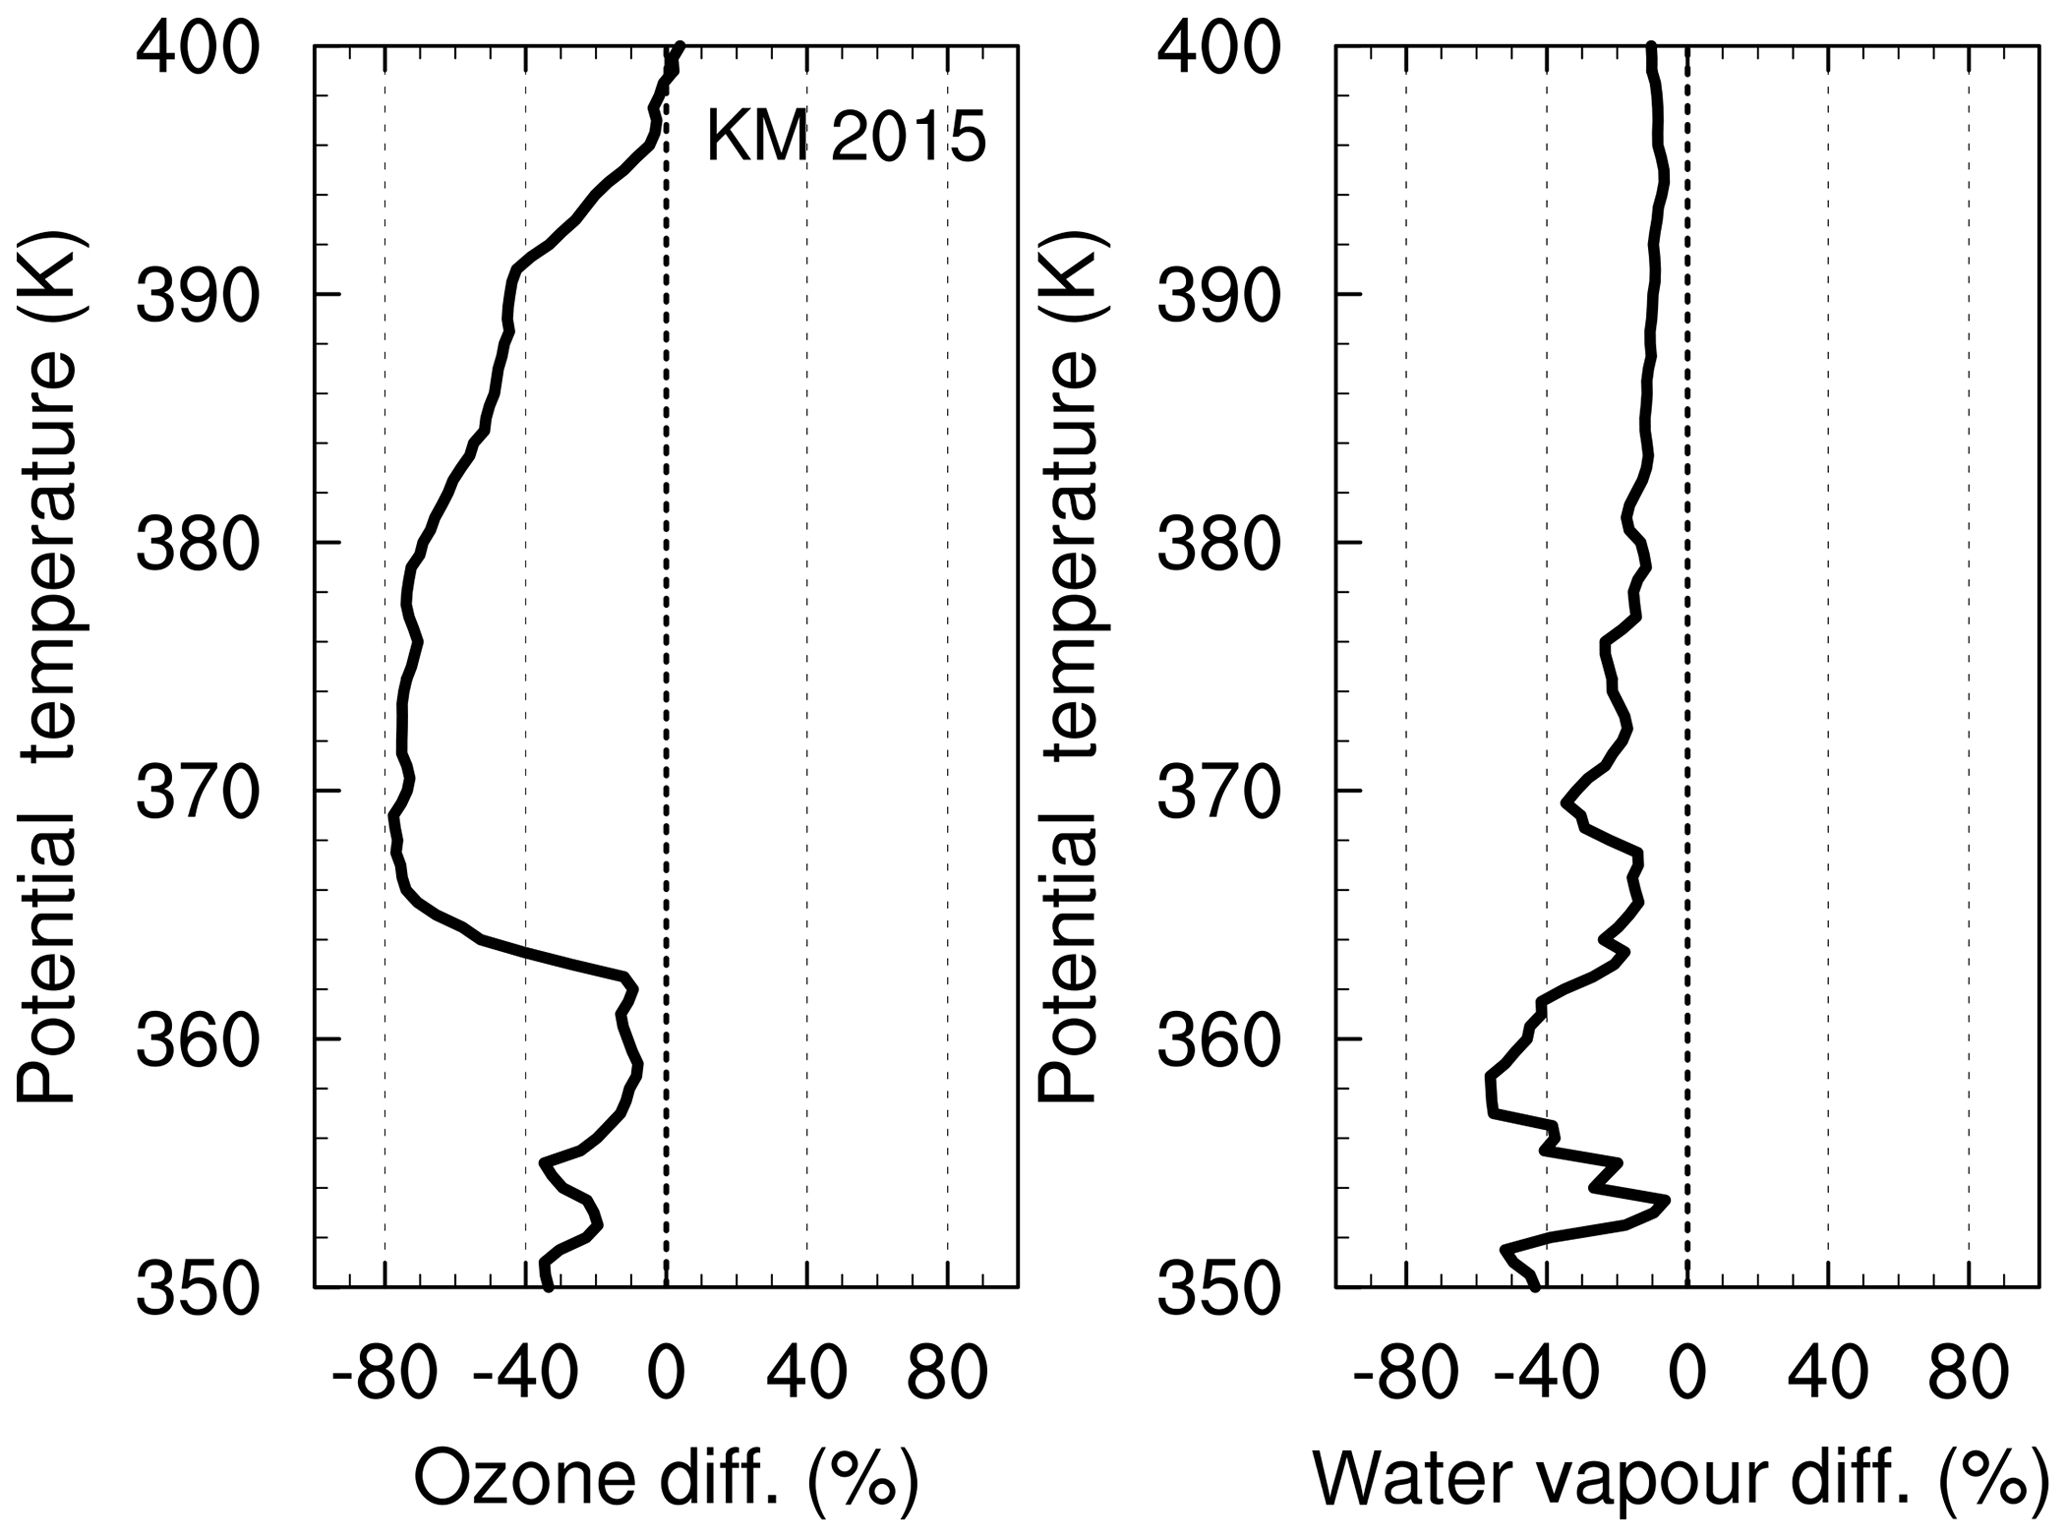
Figure A2 shows the relative difference (observation minus monthly mean value divided by monthly mean value) for ozone and water vapour on 8 August 2009. The differences mainly occurred at layers of 364–367 and 376–384 K with 40 %. The ERA-Interim diabatic trajectories for air parcels at 364–367 K are shown in Fig. A3. Air parcels from the western Pacific moved around the ASM anticyclone and then were transported to Kunming within 10 d. The possible source region and transport pathway for air parcels at 364–367 K are different from air parcels at 376–384 K. The tropical storm Goni transported the air parcels from the marine boundary layer to the tropopause during the period of 30 July and 1 August 2009. Figure A4 shows the time evolution of the temperature, the saturation water vapour mixing ratio (SMR), and relative humidity over ice (RHi) along 10 d backward trajectories of air parcels on 364–367 K from ERA-Interim diabatic trajectories.
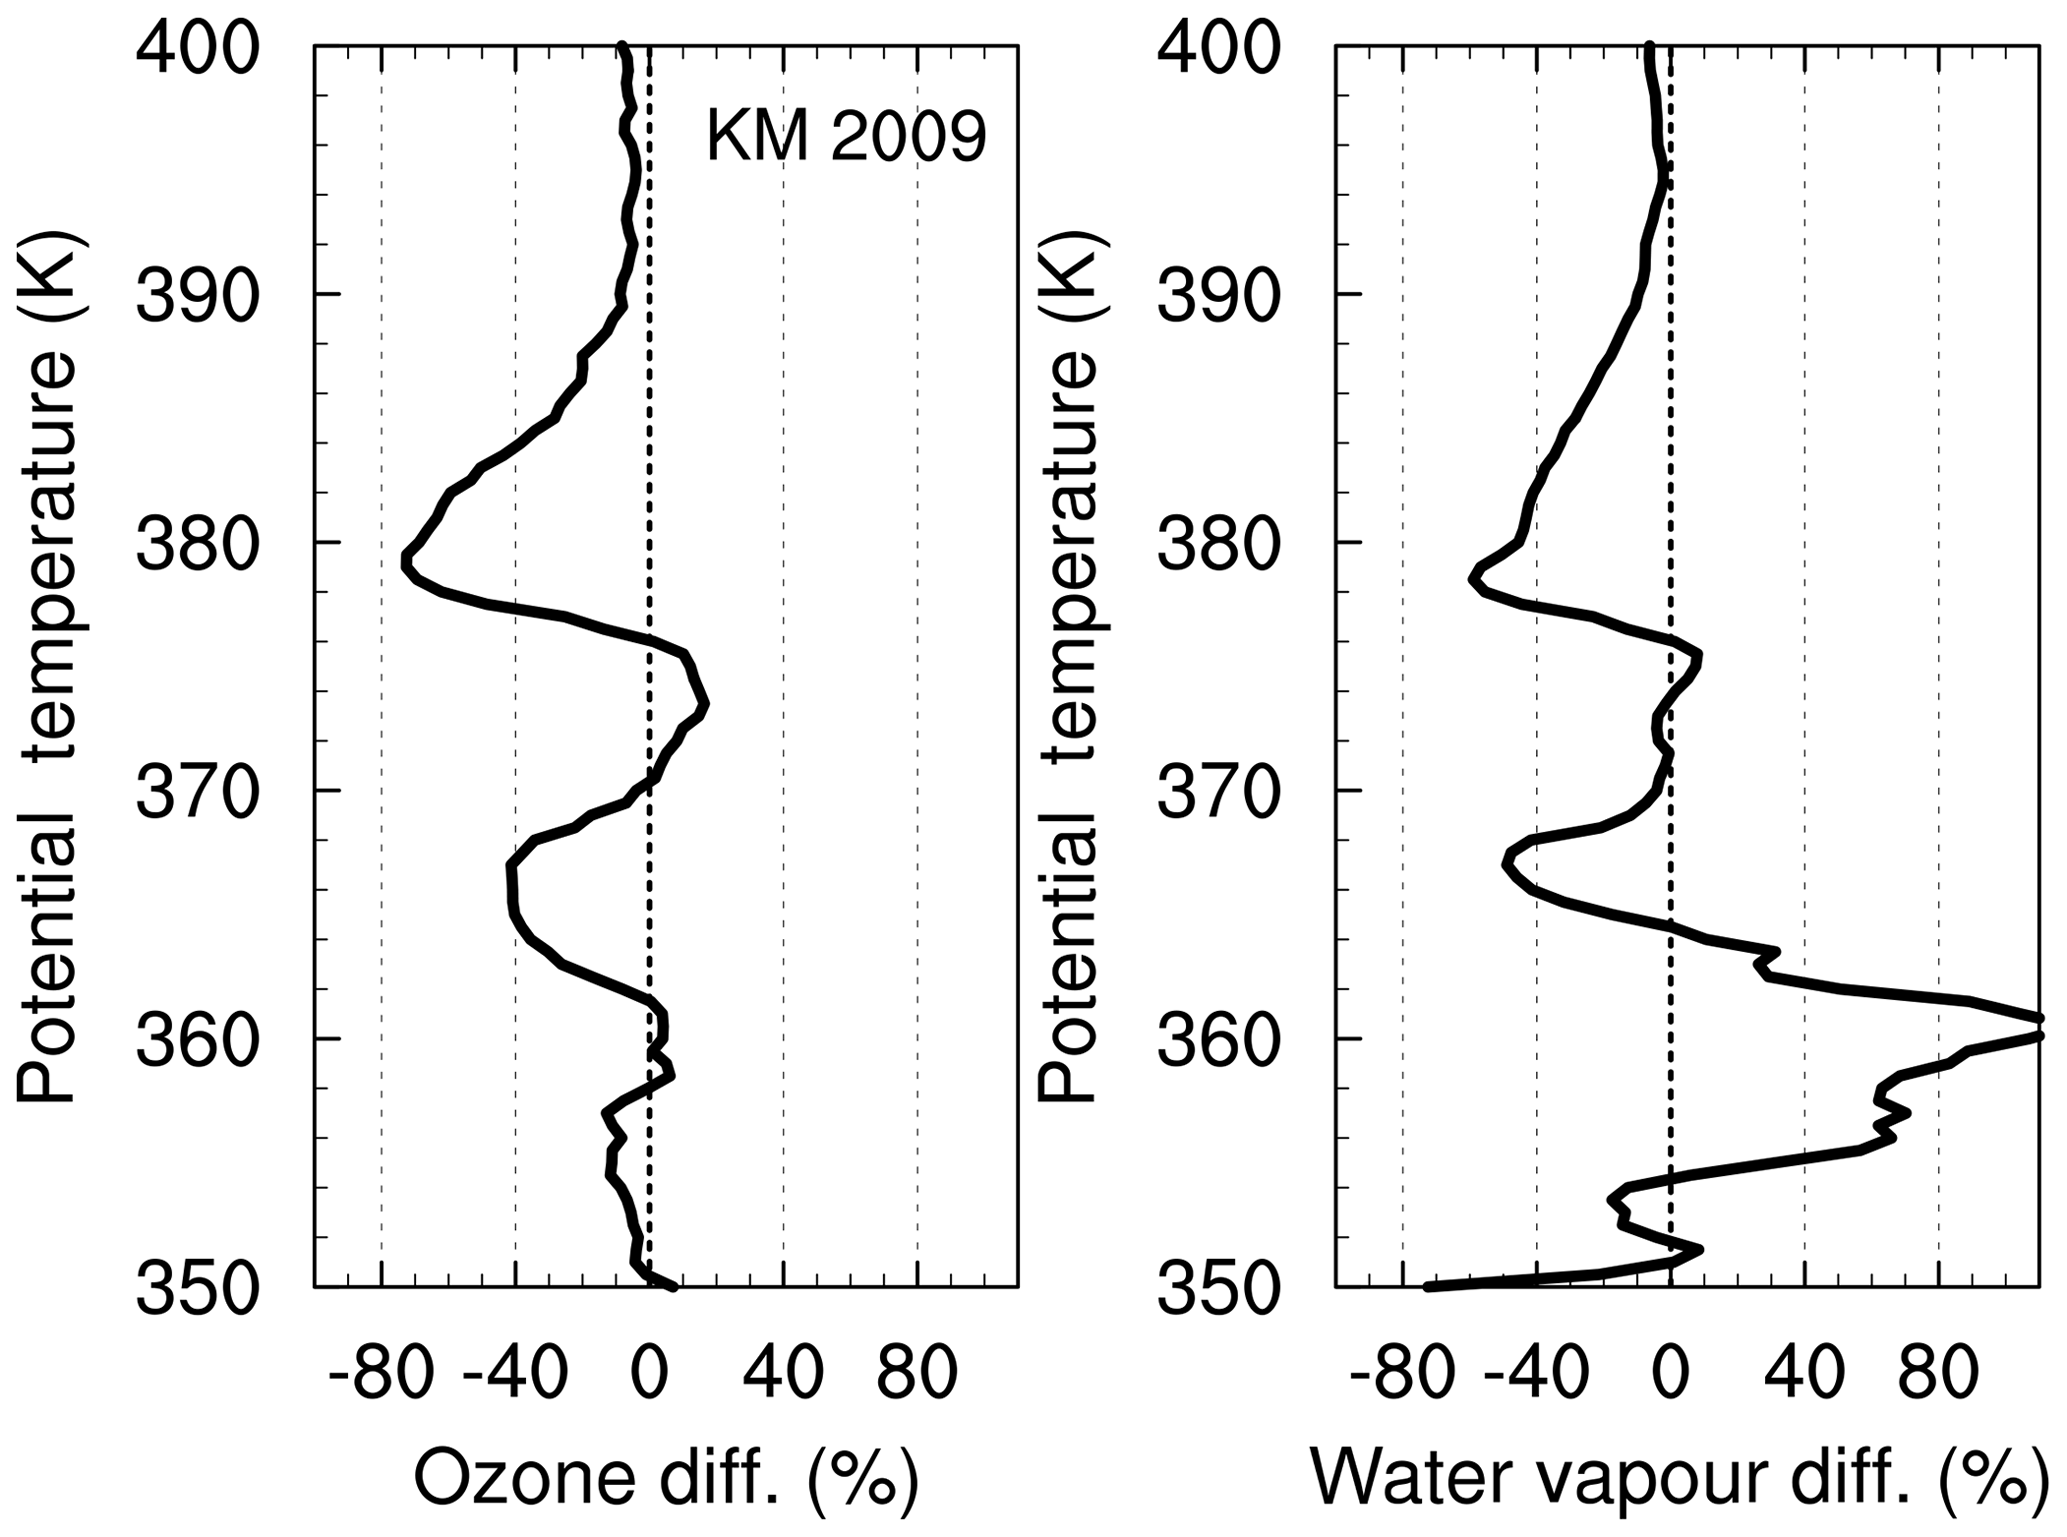
Figure A2Ozone and water vapour relative difference on 8 August 2009 for the climatological mean value for August 2009.
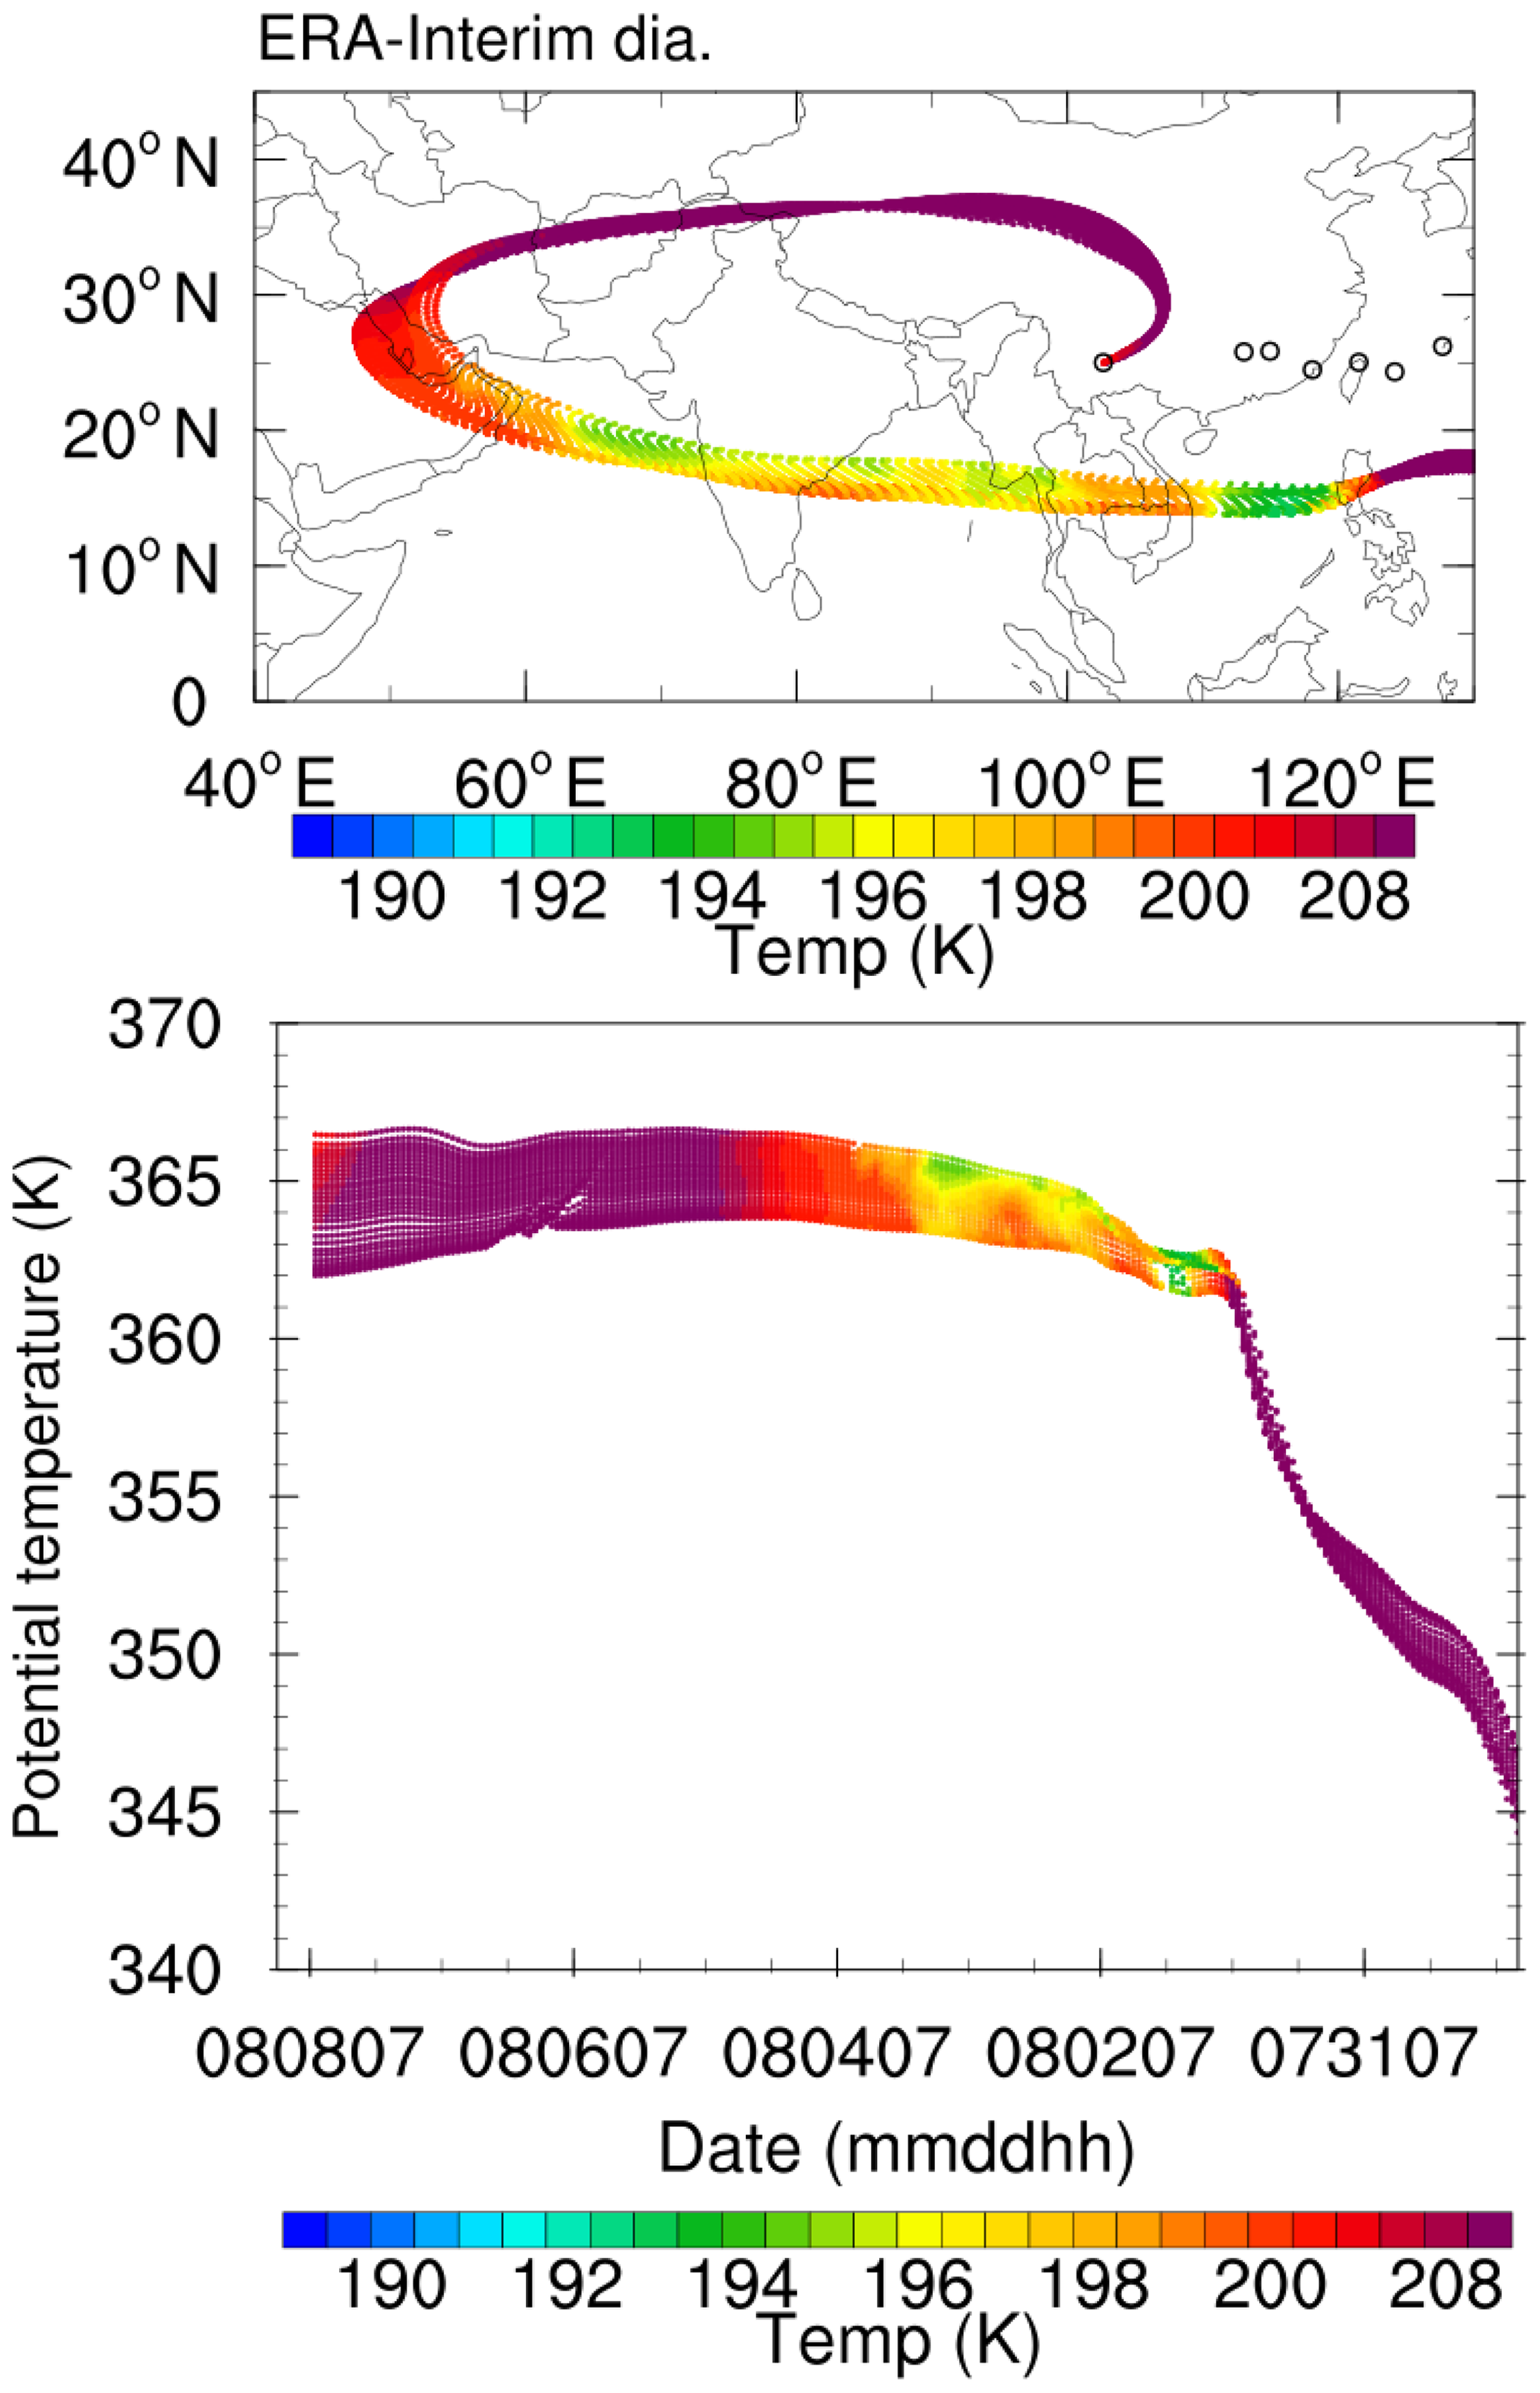
Figure A3ERA-Interim diabatic trajectories for air parcels started along the measured balloon profile between 364 and 367 K colour-coded by temperature in (top) a longitude–latitude cross section and (bottom) as a function of time vs. potential temperature.
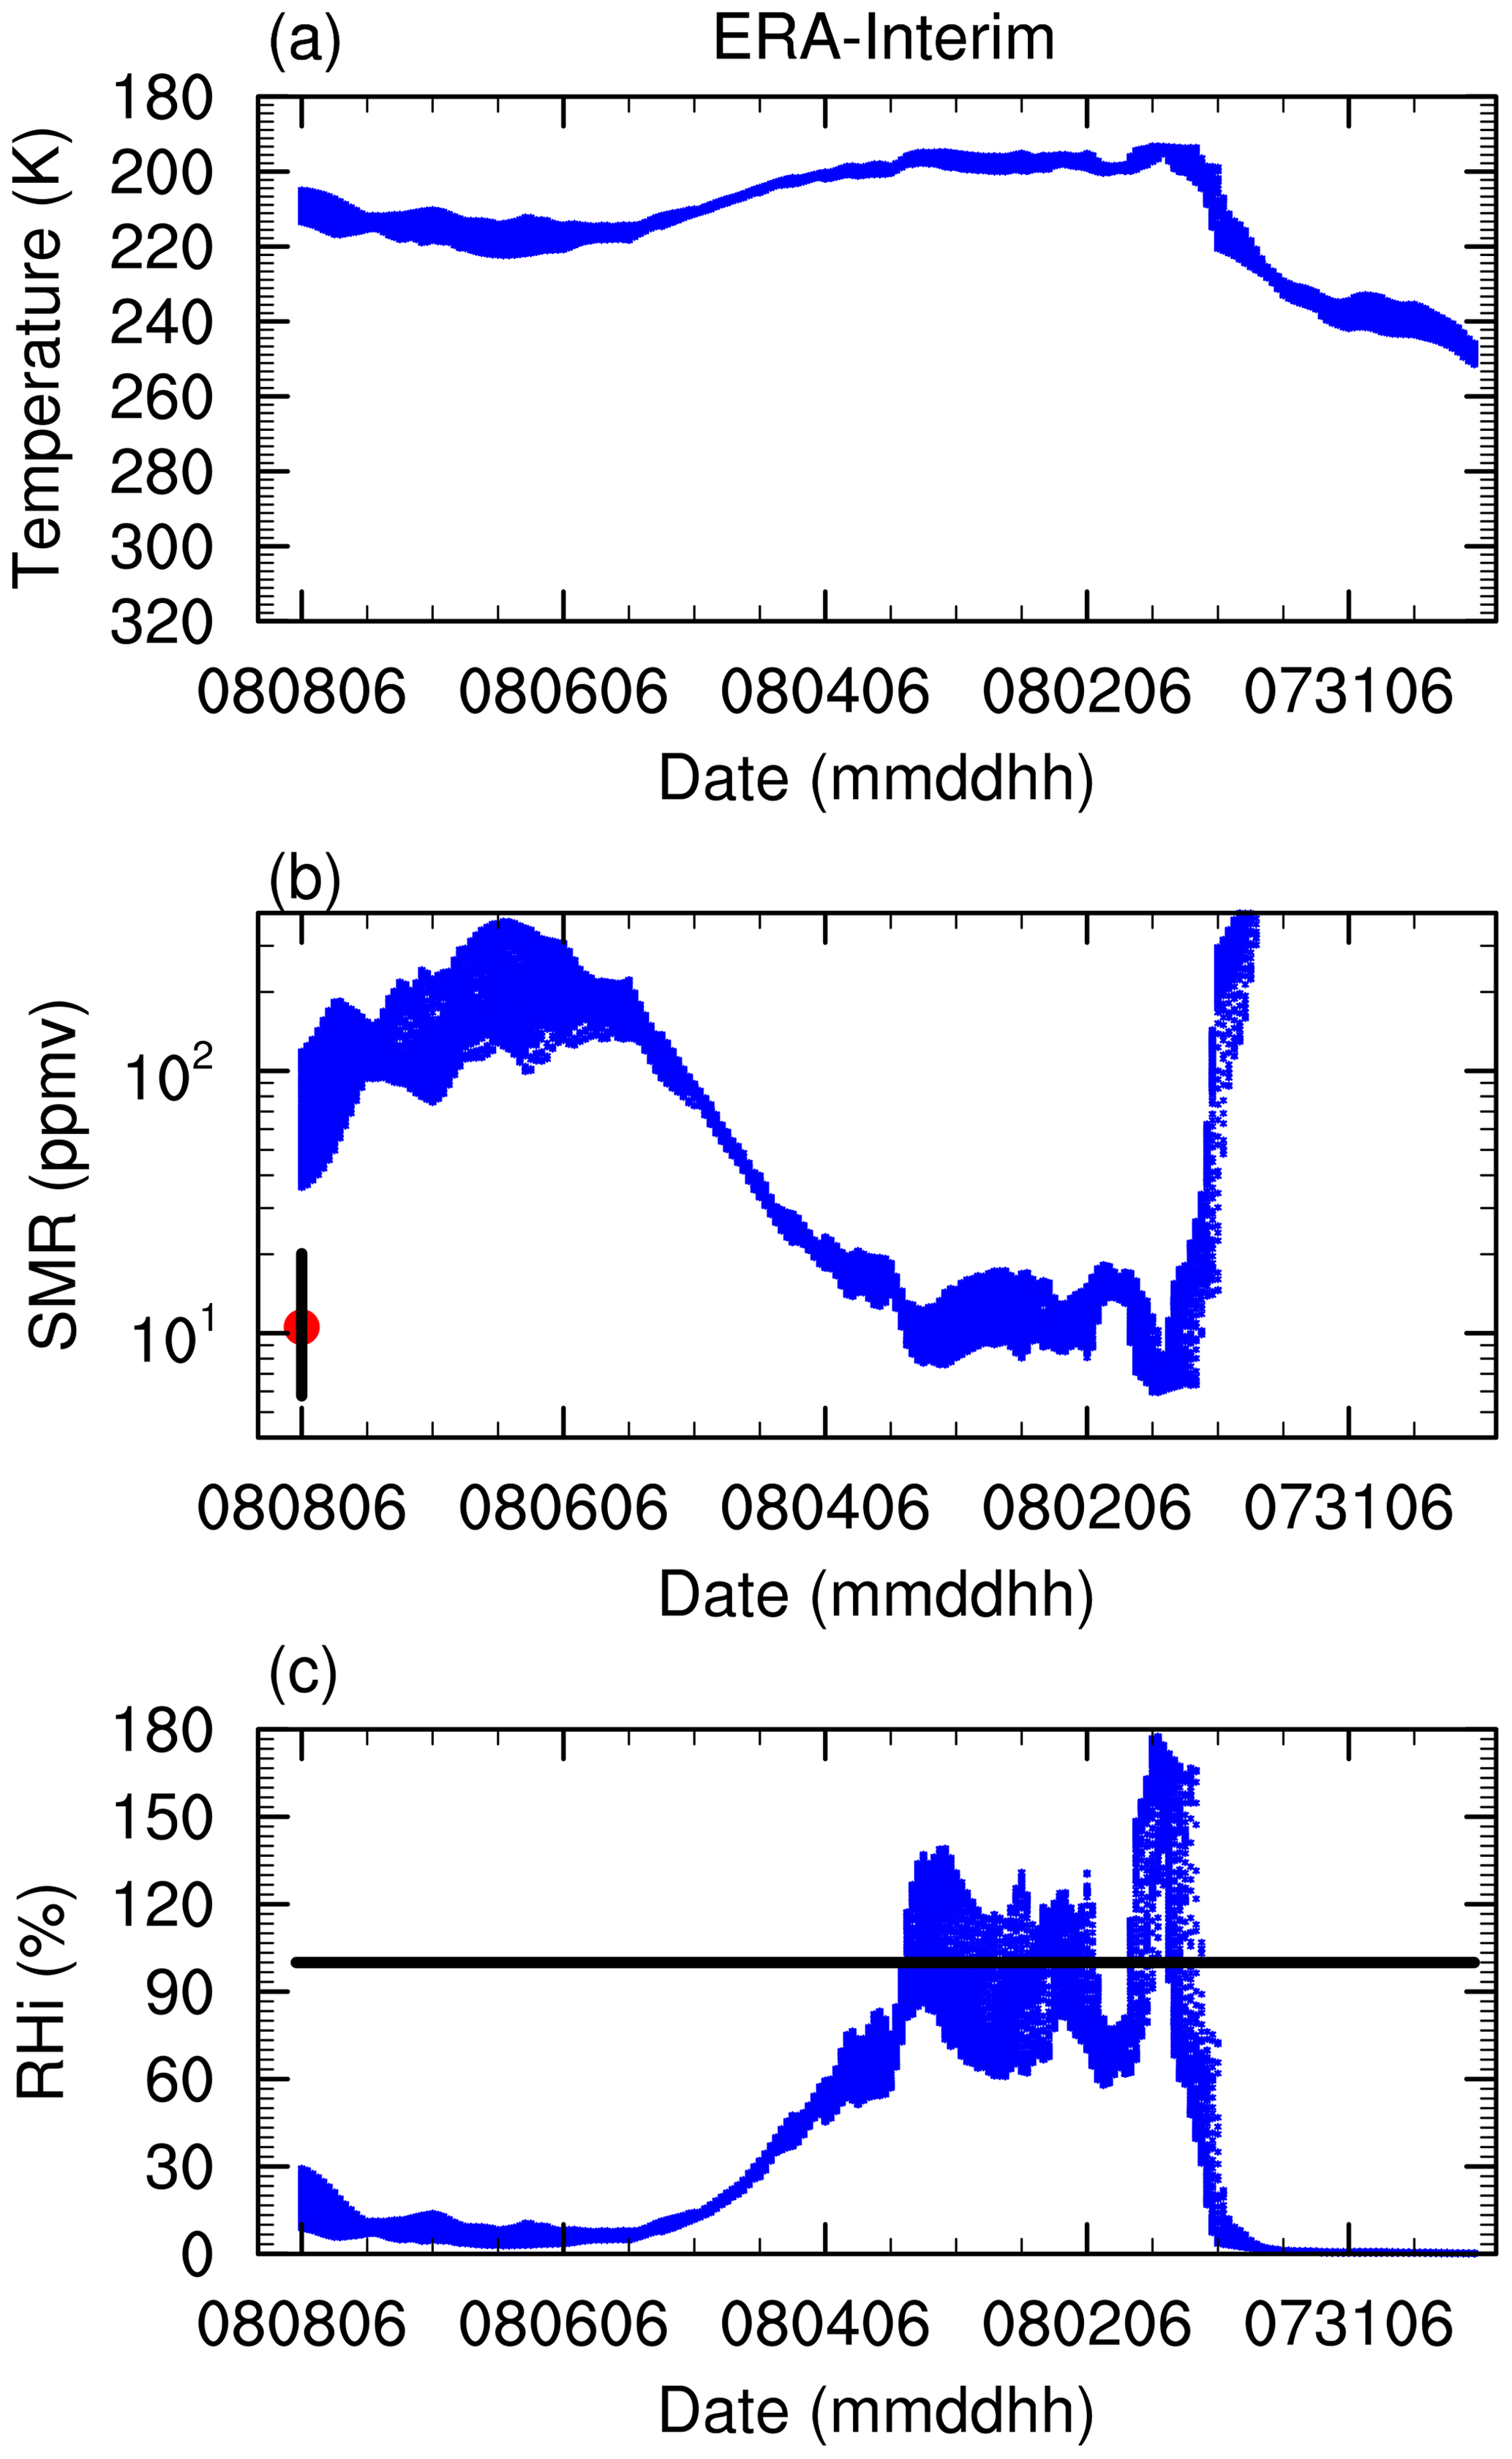
Figure A4The time evolution of the temperature (blue dots), the saturation water vapour mixing ratio (SMR), and relative humidity over ice (RHi) along 8 d backward trajectories of air parcels on 364–367 K from ERA-Interim diabatic trajectories.
The authors calculated an ensemble of trajectories for nine points around the observation site for cases 1 and 2. The minimum SMR for each trajectory is selected before the air parcel met the cloud as Fig. B1 shows. For the 2009 case, the 1σ standard deviation of reconstructed water vapour of the ensemble of backward trajectories in the region of interest (378–384 K) agrees well with observations. ERA5 reconstructed water vapour is below observed water vapour but still in the 1σ standard deviation range. For the 2015 case, for both ERA-Interim and ERA5 the range of reconstructed water vapour is below the observations in the region of interest (376–382 K). However, in the region of interest the variability of reconstructed water vapour of ERA5 ensemble trajectories is much higher than ERA-Interim trajectories. This demonstrates the stronger dispersion of temperature values along ERA5 backward trajectories caused by the high resolution of ERA5 data. In contrast, ERA-Interim trajectories going through nearly the same cold point temperature yield a much lower variability of reconstructed water vapour.
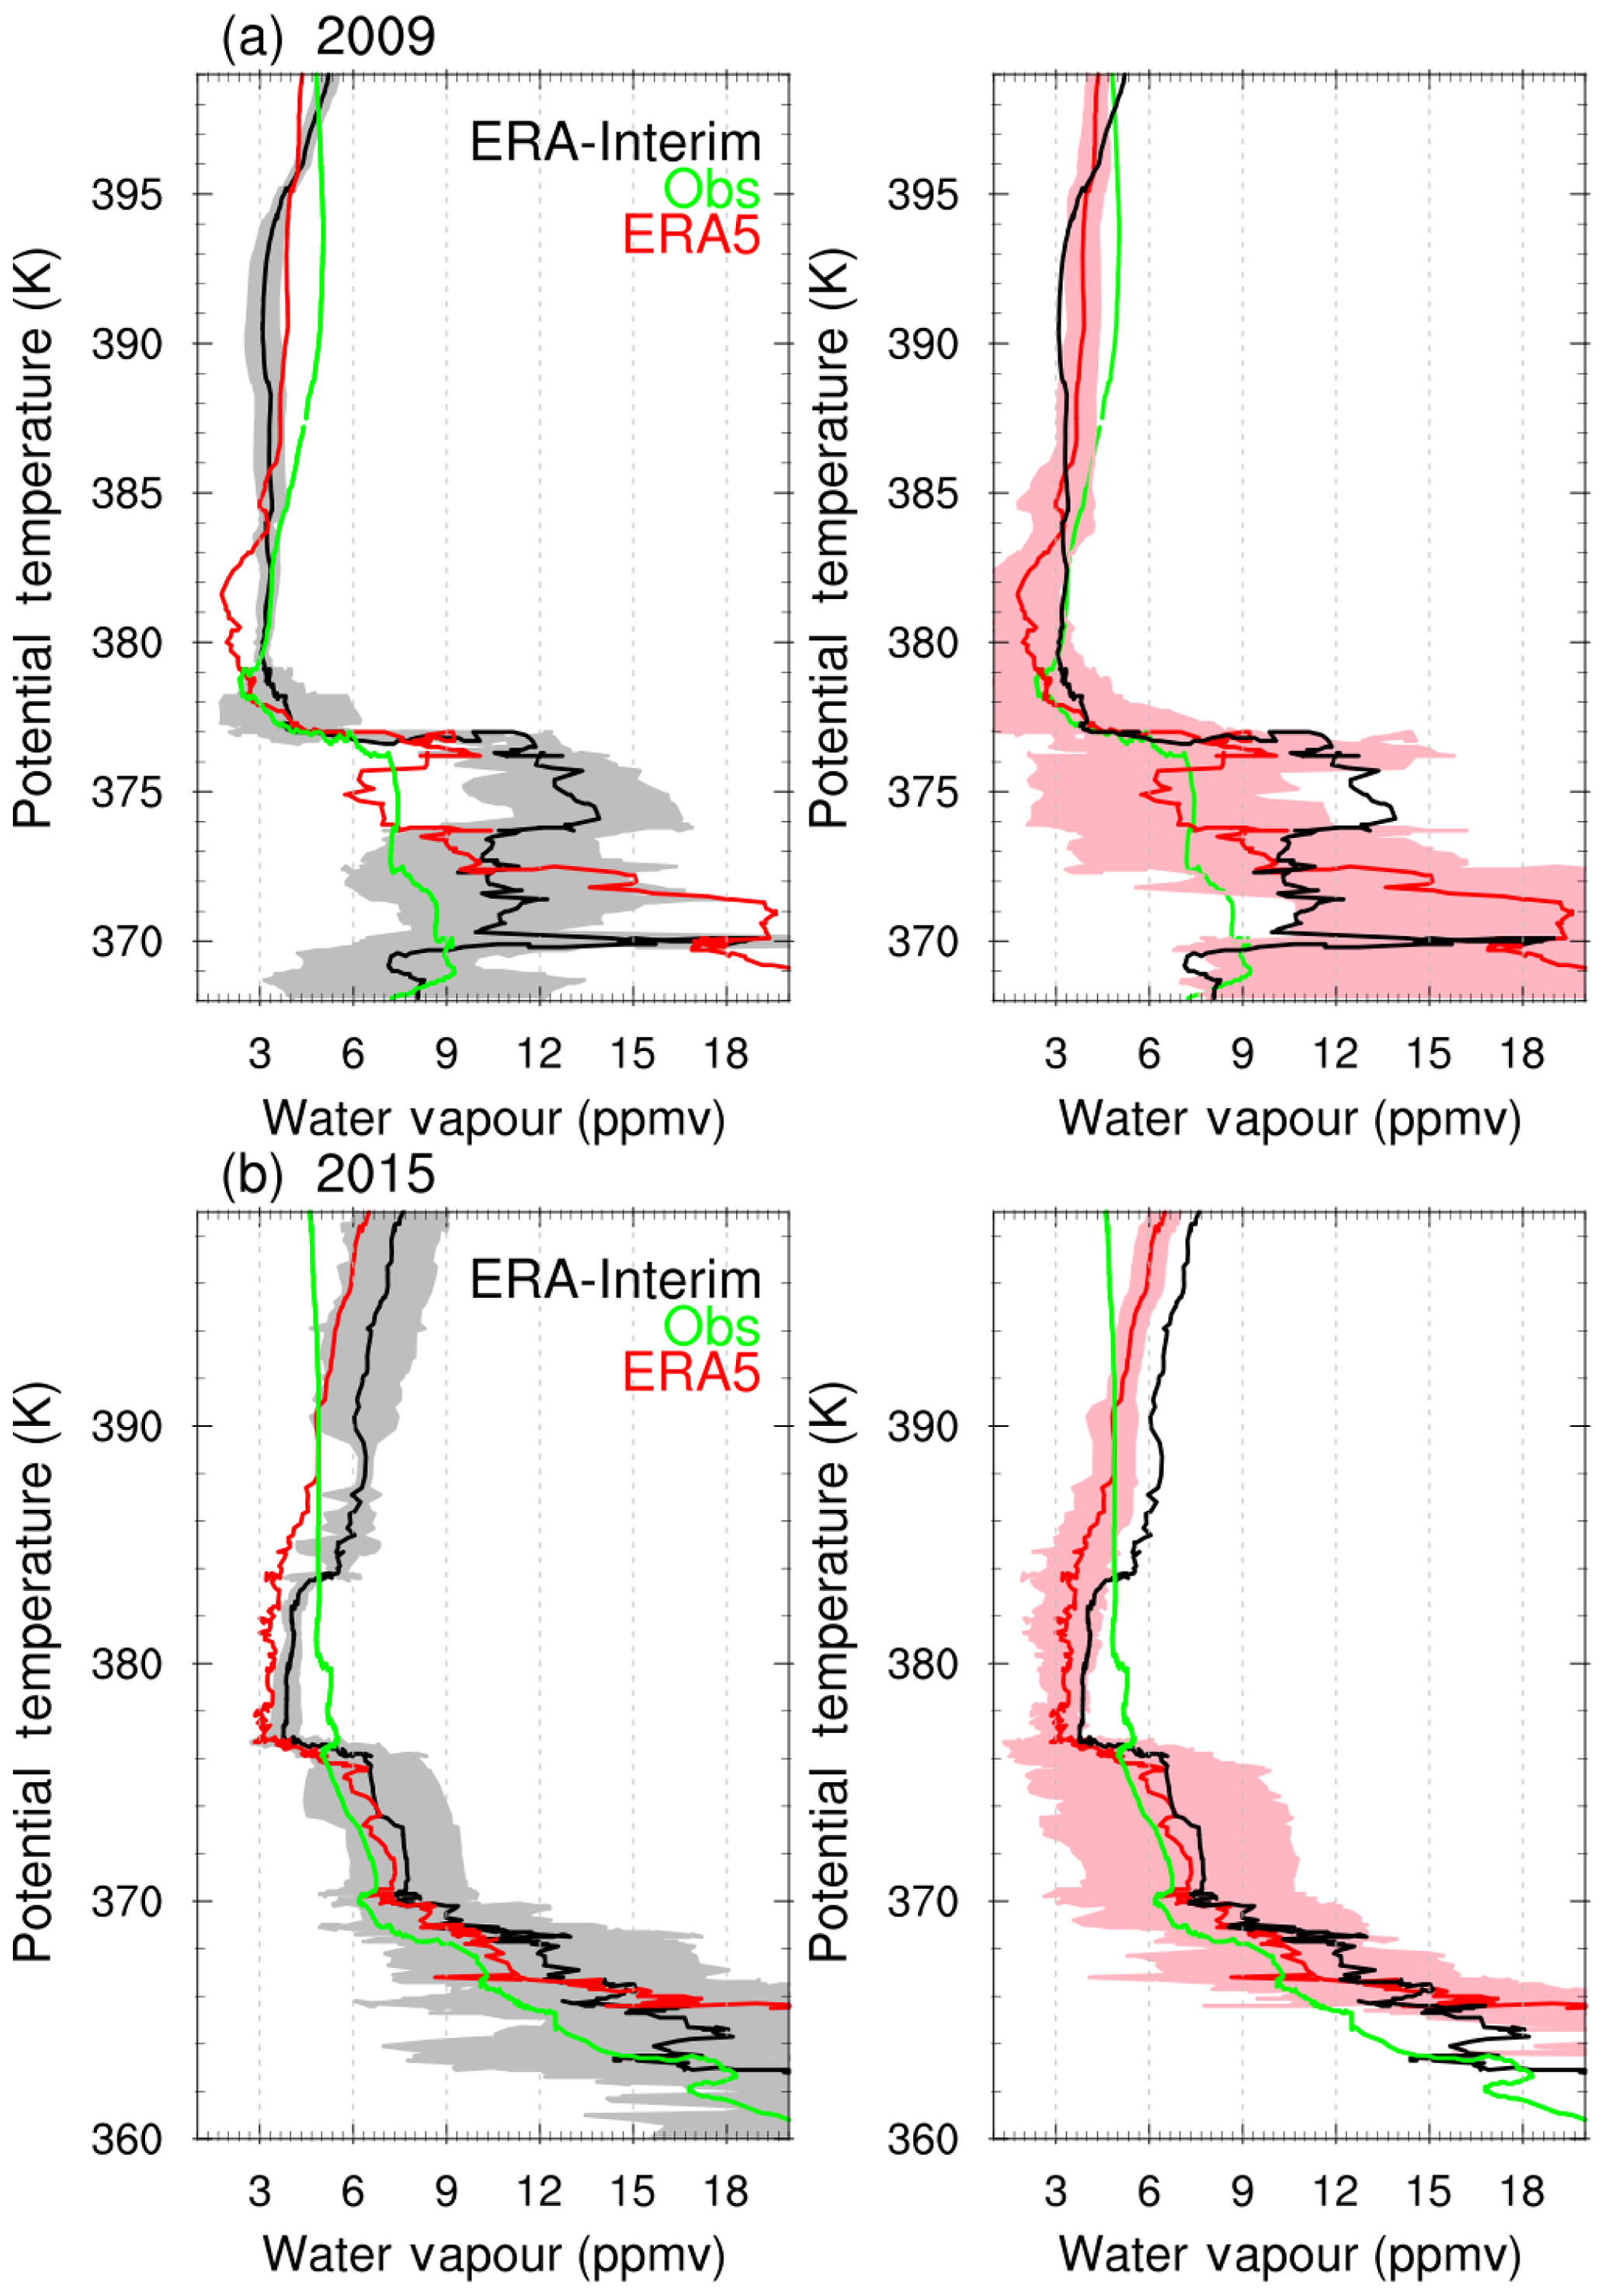
Figure B1Water vapour profiles (green line) measured by CFH on (a) 8 August 2009 and (b) 10 August 2015 and mean reconstructed water vapour based on diabatic trajectories using ERA-Interim (black line) and ERA5 (red line) for 2009 and 2015. The grey/pink regions show the 1σ standard deviation range of the ensemble of backward trajectories.
ERA-Interim and ERA5 meteorological reanalysis data are freely available from the web page http://apps.ecmwf.int/datasets/ (ECMWF, 2018) (last access: 3 August 2018). The MLS ozone and water vapour data were downloaded from https://acdisc.gesdisc.eosdis.nasa.gov/data/ (NASA, 2017). The FY-2D and FY-2G data used in this study can be obtained at http://satellite.nsmc.org.cn/PortalSite/Data/Satellite.aspx (NSMC, 2018). The ozone profiles for Naha are provided by the World Ozone and Ultraviolet Radiation Data Centre (WOUDC) at https://woudc.org/data/explore.php?lang=en (WOUDC, 2018). The upper air soundings data were downloaded from the University of Wyoming at http://weather.uwyo.edu/upperair/sounding.html (University of Wyoming, 2018). The SWOP data of this paper are available upon request to Jianchun Bian (bjc@mail.iap.ac.cn). The CLaMS backward trajectory calculations may be requested from Dan Li (lidan@mail.iap.ac.cn). The CLaMS model code can be requested from Rolf Müller (ro.mueller@fz-juelich.de)
DL prepared for the first draft. BV, RM, GG, FP, and MR provided effective and constructive comments and helped improve the paper. JB and HV gave useful comments. JB, ZB, QL, JZ, and DL made the balloon-borne measurements in Kunming. HV supported the measurements. All coauthors contributed to writing the paper
The authors declare that they have no conflict of interest.
This article is part of the special issue ”StratoClim stratospheric and upper tropospheric processes for better climate predictions (ACP/AMT inter-journal SI)”. It is not associated with a conference.
This research was supported by the National Key Research and Development Program of China (2018YFC1505703) and the National Natural Science Foundation of China (grant no. 91837311, 41975050, 41605025, 41675040, 91637104, and 41705127). We wish to thank three anonymous reviewers for very constructive suggestions.
Our activities contribute to the European Community’s Seventh Framework Programme (FP7/2007-2013) as part of the StratoClim project (grant agreement no. 603557). The authors thank the Strategic Priority Research Program of the Chinese Academy of Sciences (grant no. XDA17010102), the International Postdoctoral
Exchange Fellowship Program 2017 under grant no. 20171015, and the China
Postdoctoral Science Foundation (grant no. 2015M581153).
The article processing charges for this open-access publication were covered by a Research Centre of the Helmholtz Association.
This paper was edited by Timothy J. Dunkerton and reviewed by three anonymous referees.
Bergman, J. W., Fierli, F., Jensen, E. J., Honomichl, S., and Pan, L. L.: Boundary layer sources for the Asian anticyclone: Regional contributions to a vertical conduit, J. Geophys. Res.-Atmos., 118, 2560–2575, https://doi.org/10.1002/jgrd.50142, 2013. a, b, c
Bian, J., Pan, L. L., Paulik, L., Vömel, H., and Chen, H.: In situ water vapor and ozone measurements in Lhasa and Kunming during the Asian summer monsoon, Geophys. Res. Lett., 39, L19808, https://doi.org/10.1029/2012GL052996, 2012. a, b, c, d
Cairo, F., Buontempo, C., MacKenzie, A. R., Schiller, C., Volk, C. M., Adriani, A., Mitev, V., Matthey, R., Di Donfrancesco, G., Oulanovsky, A., Ravegnani, F., Yushkov, V., Snels, M., Cagnazzo, C., and Stefanutti, L.: Morphology of the tropopause layer and lower stratosphere above a tropical cyclone: a case study on cyclone Davina (1999), Atmos. Chem. Phys., 8, 3411–3426, https://doi.org/10.5194/acp-8-3411-2008, 2008. a
Chen, B., Xu, X. D., Yang, S., and Zhao, T. L.: Climatological perspectives of air transport from atmospheric boundary layer to tropopause layer over Asian monsoon regions during boreal summer inferred from Lagrangian approach, Atmos. Chem. Phys., 12, 5827–5839, https://doi.org/10.5194/acp-12-5827-2012, 2012. a, b, c
Dee, D. P., Uppala, S. M., Simmons, A. J., Berrisford, P., Poli, P., Kobayashi, S., Andrae, U., Balmaseda, M. A., Balsamo, G., Bauer, P., Bechtold, P., Beljaars, A. C. M., van de Berg, L., Bidlot, J., Bormann, N., Delsol, C., Dragani, R., Fuentes, M., Geer, A. J., Haimberger, L., Healy, S. B., Hersbach, H., Hólm, E. V., Isaksen, L., Kållberg, P., Köhler, M., Matricardi, M., McNally, A. P., Monge-Sanz, B. M., Morcrette, J.-J., Park, B.-K., Peubey, C., de Rosnay, P., Tavolato, C., Thépaut, J.-N., and Vitart, F.: The ERA-Interim reanalysis: configuration and performance of the data assimilation system, Q. J. Roy. Meteor. Soc., 137, 553–597, https://doi.org/10.1002/qj.828, 2011. a
ECMWF: ERA-Interim and ERA5 meteorological reanalysis data, available at: http://apps.ecmwf.int/datasets/, last access: 3 August 2018. a
Fu, Y. F., Xian, T., Lü, D. R., Liu, G. S., Heng, Z. W., Sun, L., Liu, Q., Wang, Y., and Yang, Y. J.: Ozone vertical variations during a typhoon derived from the OMI observations and reanalysis data, China Sci. Bull., 58, 3890–3894, https://doi.org/10.1007/s11434-013-6024-7, 2013. a, b
Fueglistaler, S., Legras, B., Beljaars, A., Morcrette, J.-J., Simmons, A., Tompkins, A. M., and Uppapla, S.: The diabatic heat budget of the upper troposphere and lower/mid stratosphere in ECMWF reanalyses, Q. J. Roy. Meteor. Soc., 135, 21–37, https://doi.org/10.1002/qj.361, 2009. a
Fujiwara, M., Suzuki, J., Gettelman, A., Hegglin, M. I., Akiyoshi, H., and Shibata, K.: Wave activity in the tropical tropopause layer in seven reanalysis and four chemistry climate model data sets, J. Geophys. Res.-Atmos., 117, D12105, https://doi.org/10.1029/2011JD016808, 2012. a
Garny, H. and Randel, W. J.: Transport pathways from the Asian monsoon anticyclone to the stratosphere, Atmos. Chem. Phys., 16, 2703–2718, https://doi.org/10.5194/acp-16-2703-2016, 2016. a
Goff, J. A. and Gratch, S.: Low-pressure properties of water from −160 to 212 F, Trans. Am. Soc. Heating Air-Cond. Eng., 52, 95–122, 1946. a, b
Hasebe, F., Fujiwara, M., Nishi, N., Shiotani, M., Vömel, H., Oltmans, S., Takashima, H., Saraspriya, S., Komala, N., and Inai, Y.: In situ observations of dehydrated air parcels advected horizontally in the Tropical Tropopause Layer of the western Pacific, Atmos. Chem. Phys., 7, 803–813, https://doi.org/10.5194/acp-7-803-2007, 2007. a
Hasebe, F., Inai, Y., Shiotani, M., Fujiwara, M., Vömel, H., Nishi, N., Ogino, S.-Y., Shibata, T., Iwasaki, S., Komala, N., Peter, T., and Oltmans, S. J.: Cold trap dehydration in the Tropical Tropopause Layer characterised by SOWER chilled-mirror hygrometer network data in the Tropical Pacific, Atmos. Chem. Phys., 13, 4393–4411, https://doi.org/10.5194/acp-13-4393-2013, 2013. a, b, c, d
Hersbach, H. and Dee, D.: ERA5 reanalysis is in production, ECMWF Newsletter, 147, p. 7, available at: https://www.ecmwf.int/en/newsletter/147/news/era5-reanalysis-production (last access: 22 November 2018), 2016. a
Hoffmann, L., Günther, G., Li, D., Stein, O., Wu, X., Griessbach, S., Heng, Y., Konopka, P., Müller, R., Vogel, B., and Wright, J. S.: From ERA-Interim to ERA5: the considerable impact of ECMWF's next-generation reanalysis on Lagrangian transport simulations, Atmos. Chem. Phys., 19, 3097–3124, https://doi.org/10.5194/acp-19-3097-2019, 2019. a, b
Holton, J. R. and Gettelman, A.: Horizontal transport and the dehydration of the stratosphere, Geophys. Res. Lett., 28, 2799–2802, 2001. a, b, c
Höpfner, M., Ungermann, J., Borrmann, S., Wagner, R., Spang, R., Riese, M., Stiller, G., Appel, O., Batenburg, A. M., Bucci, S., Cairo, F., Dragoneas, A., Friedl-Vallon, F., Hünig, A., Johansson, S., Krasauskas, L., Legras, B., Leisner, T., Mahnke, C., Möhler, O., Molleker, S., Müller, R., Neubert, T., Orphal, J., Preusse, P., Rex, M., Saathoff, H., Stroh, F., Weigel, R., and Wohltmann, I.: Ammonium nitrate particles formed in upper troposphere from ground ammonia sources during Asian monsoons, Nat. Geosci., 12, 608–612, https://doi.org/10.1038/s41561-019-0385-8, 2019. a
Hyland, R. W. and Wexler, A.: Formulations for the thermodynamic properties of the saturated phases of H2O from 173.15 K to 473.15 K, ASHRAE Tran., 89, 500–519, 1983. a
Inai, Y., Hasebe, F., Fujiwara, M., Shiotani, M., Nishi, N., Ogino, S.-Y., Vömel, H., Iwasaki, S., and Shibata, T.: Dehydration in the tropical tropopause layer estimated from the water vapor match, Atmos. Chem. Phys., 13, 8623–8642, https://doi.org/10.5194/acp-13-8623-2013, 2013. a, b, c, d
Komhyr, W. D., Barnes, R. A., Brothers, G. B., Lathrop, J. A., and Opperman, D. P.: Electrochemical concentration cell ozonesonde performance evaluation during STOIC 1989, J. Geophys. Res., 100, 9231–9244, https://doi.org/10.1029/94JD02175, 1995. a
Konopka, P., Steinhorst, H.-M., Grooß, J.-U., Günther, G., Müller, R., Elkins, J. W., Jost, H.-J., Richard, E., Schmidt, U., Toon, G., and McKenna, D. S.: Mixing and Ozone Loss in the 1999-2000 Arctic Vortex: Simulations with the 3-dimensional Chemical Lagrangian Model of the Stratosphere (CLaMS), J. Geophys. Res., 109, D02315, https://doi.org/10.1029/2003JD003792, 2004. a
Li, D., Vogel, B., Bian, J., Müller, R., Pan, L. L., Günther, G., Bai, Z., Li, Q., Zhang, J., Fan, Q., and Vömel, H.: Impact of typhoons on the composition of the upper troposphere within the Asian summer monsoon anticyclone: the SWOP campaign in Lhasa 2013, Atmos. Chem. Phys., 17, 4657–4672, https://doi.org/10.5194/acp-17-4657-2017, 2017. a, b, c, d, e, f
Li, D., Vogel, B., Müller, R., Bian, J., Günther, G., Li, Q., Zhang, J., Bai, Z., Vömel, H., and Riese, M.: High tropospheric ozone in Lhasa within the Asian summer monsoon anticyclone in 2013: influence of convective transport and stratospheric intrusions, Atmos. Chem. Phys., 18, 17979–17994, https://doi.org/10.5194/acp-18-17979-2018, 2018. a
Livesey, N. J., Read, W. G., Wagner, P. A., Froidevaux, L., Lambert, A., Manney, G. L., Millán Valle, L. F., Pumphrey, H. C., Santee, M. L., Schwartz, M. J., Wang, S., Fuller, R. A., Jarnot, R. F., Knosp, B. W., Martinez, E., and Lay, R. R.: Version 4.2x Level 2 data quality and description document, JPL D-33509 Rev. D, https://mls.jpl.nasa.gov/data/v4-2_data_quality_document.pdf (last access: 31 July 2019), 2018. a
McKenna, D. S., Konopka, P., Grooß, J.-U., Günther, G., Müller, R., Spang, R., Offermann, D., and Orsolini, Y.: A new Chemical Lagrangian Model of the Stratosphere (CLaMS): 1. Formulation of advection and mixing, J. Geophys. Res., 107, 4309, https://doi.org/10.1029/2000JD000114, 2002. a
Minschwaner, K., Manney, G. L., Petropavlovskikh, I., Torres, L. A., Lawrence, Z. D., Sutherland, B., Thompson, A. M., Johnson, B. J., Butterfield, Z., Dubey, M. K., Froidevaux, L., Lambert, A., Read, W. G., and Schwartz, M. J.: Signature of a tropical Pacific cyclone in the composition of the upper troposphere over Socorro, NM, Geophys. Res. Lett., 42, 9530–9537, https://doi.org/10.1002/2015GL065824, 2015. a, b
Murphy, D. M. and Koop, T.: Review of the vapour pressures of ice and supercooled water for atmospheric applications, Q. J. Roy. Meteor. Soc., 131, 1539–1565, 2005. a, b
Naja, M. and Akimoto, H.: Contribution of regional pollution and long-range transport to the Asia-Pacific region: Analysis of long-term ozonesonde data over Japan, J. Geophys. Res., 109, D21306, https://doi.org/10.1029/2004JD004687, 2004. a
NASA: MLS ozone and water vapour data, available at: https://acdisc.gesdisc.eosdis.nasa.gov/data/, last access: 3 November 2017. a
Newton, R., Vaughan, G., Hintsa, E., Filus, M. T., Pan, L. L., Honomichl, S., Atlas, E., Andrews, S. J., and Carpenter, L. J.: Observations of ozone-poor air in the tropical tropopause layer, Atmos. Chem. Phys., 18, 5157–5171, https://doi.org/10.5194/acp-18-5157-2018, 2018. a
NSMC: FY-2D and FY-2G data, available at: http://satellite.nsmc.org.cn/PortalSite/Data/Satellite.aspx, last access: 14 June 2018. a
Pan, L. L., Honomichl, S. B., Kinnison, D. E., Abalos, M., Randel, W. J., Bergman, J. W., and Bian, J. C.: Transport of chemical tracers from the boundary layer to stratosphere associated with the dynamics of the Asian summer monsoon, J. Geophys. Res.-Atmos., 121, 14159–14174, https://doi.org/10.1002/2016JD025616, 2016. a
Park, M., Randel, W. J., Gettleman, A., Massie, S. T., and Jiang, J. H.: Transport above the Asian summer monsoon anticyclone inferred from Aura Microwave Limb Sounder tracers, J. Geophys. Res., 112, D16309, https://doi.org/10.1029/2006JD008294, 2007. a
Park, M., Randel, W. J., Emmons, L. K., Bernath, P. F., Walker, K. A., and Boone, C. D.: Chemical isolation in the Asian monsoon anticyclone observed in Atmospheric Chemistry Experiment (ACE-FTS) data, Atmos. Chem. Phys., 8, 757–764, https://doi.org/10.5194/acp-8-757-2008, 2008. a, b
Ploeger, F., Konopka, P., Günther, G., Grooß, J.-U., and Müller, R.: Impact of the vertical velocity scheme on modeling transport across the tropical tropopause layer, J. Geophys. Res., 115, D03301, https://doi.org/10.1029/2009JD012023, 2010. a
Ploeger, F., Fueglistaler, S., Grooß, J.-U., Günther, G., Konopka, P., Liu, Y. S., Müller, R., Ravegnani, F., Schiller, C., Ulanovski, A., and Riese, M.: Insight from ozone and water vapour on transport in the tropical tropopause layer (TTL), Atmos. Chem. Phys., 11, 407–419, https://doi.org/10.5194/acp-11-407-2011, 2011. a, b
Pommrich, R., Müller, R., Grooß, J.-U., Konopka, P., Ploeger, F., Vogel, B., Tao, M., Hoppe, C. M., Günther, G., Spelten, N., Hoffmann, L., Pumphrey, H.-C., Viciani, S., D'Amato, F., Volk, C. M., Hoor, P., Schlager, H., and Riese, M.: Tropical troposphere to stratosphere transport of carbon monoxide and long-lived trace species in the Chemical Lagrangian Model of the Stratosphere (CLaMS), Geosci. Model Dev., 7, 2895–2916, https://doi.org/10.5194/gmd-7-2895-2014, 2014. a, b
Randel, W. J., Park, M., Emmons, L., Kinnison, D., Bernath, P., Walker, K. A., Boone, C., and Pumphrey, H.: Asian Monsoon Transport of Pollution to the Stratosphere, Science, 328, 611–613, https://doi.org/10.1126/science.1182274, 2010. a
Randel, W. J., Zhang, K., and Fu, R.: What controls stratospheric water vapor in the NH summer monsoon regions?, J. Geophys. Res.-Atmos., 120, 7988–8001, https://doi.org/10.1002/2015JD023622, 2015. a
Read, K. A., Mahajan, A. S., Carpenter, L. J., Evans, M. J., Faria, B. V. E., Heard, D. E., Hopkins, J. R., Lee, J. D., Moller, S. J., Lewis, A. C., Mendes, L., McQuaid, J. B., Oetjen, H., Saiz-Lopez, A., Pilling, M. J., and Plane, J. M. C.: Extensive halogen-mediated ozone destruction over the tropical Atlantic Ocean, Nature, 453, 1232–1235, https://doi.org/10.1038/nature07035, 2008a. a
Read, W. G., Schwartz, M. J., Lambert, A., Su, H., Livesey, N. J., Daffer, W. H., and Boone, C. D.: The roles of convection, extratropical mixing, and in-situ freeze-drying in the Tropical Tropopause Layer, Atmos. Chem. Phys., 8, 6051–6067, https://doi.org/10.5194/acp-8-6051-2008, 2008b. a
Rex, M., Wohltmann, I., Ridder, T., Lehmann, R., Rosenlof, K., Wennberg, P., Weisenstein, D., Notholt, J., Krüger, K., Mohr, V., and Tegtmeier, S.: A tropical West Pacific OH minimum and implications for stratospheric composition, Atmos. Chem. Phys., 14, 4827–4841, https://doi.org/10.5194/acp-14-4827-2014, 2014. a
Schiller, C., Grooß, J.-U., Konopka, P., Plöger, F., Silva dos Santos, F. H., and Spelten, N.: Hydration and dehydration at the tropical tropopause, Atmos. Chem. Phys., 9, 9647–9660, https://doi.org/10.5194/acp-9-9647-2009, 2009. a
Schoeberl, M. R. and Dessler, A. E.: Dehydration of the stratosphere, Atmos. Chem. Phys., 11, 8433–8446, https://doi.org/10.5194/acp-11-8433-2011, 2011. a
Schoeberl, M. R., Douglass, A. R., Zhu, Z. X., and Pawson, S.: A comparison of the lower stratospheric age spectra derived from a general circulation model and two data assimilation systems, J. Geophys. Res., 108, 4113, https://doi.org/10.1029/2002JD002652, 2003. a
Shi, C. H., Zhang, C. X., and Guo, D.: Comparison of electrochemical concentration cell ozonesonde and microwave limb sounder satellite remote sensing ozone profiles for the center of the South Asian High, Remote Sens., 9, 1012, https://doi.org/10.3390/rs9101012, 2017. a
Tissier, A.-S. and Legras, B.: Convective sources of trajectories traversing the tropical tropopause layer, Atmos. Chem. Phys., 16, 3383–3398, https://doi.org/10.5194/acp-16-3383-2016, 2016. a
University of Wyoming: Upper air soundings data, available at: http://weather.uwyo.edu/upperair/sounding.html, last access: 12 September 2018. a
Vogel, B., Günther, G., Müller, R., Grooß, J.-U., Hoor, P., Krämer, M., Müller, S., Zahn, A., and Riese, M.: Fast transport from Southeast Asia boundary layer sources to northern Europe: rapid uplift in typhoons and eastward eddy shedding of the Asian monsoon anticyclone, Atmos. Chem. Phys., 14, 12745–12762, https://doi.org/10.5194/acp-14-12745-2014, 2014. a
Vogel, B., Günther, G., Müller, R., Grooß, J.-U., and Riese, M.: Impact of different Asian source regions on the composition of the Asian monsoon anticyclone and of the extratropical lowermost stratosphere, Atmos. Chem. Phys., 15, 13699–13716, https://doi.org/10.5194/acp-15-13699-2015, 2015 a
Vogel, B., Müller, R., Günther, G., Spang, R., Hanumanthu, S., Li, D., Riese, M., and Stiller, G. P.: Lagrangian simulations of the transport of young air masses to the top of the Asian monsoon anticyclone and into the tropical pipe, Atmos. Chem. Phys., 19, 6007–6034, https://doi.org/10.5194/acp-19-6007-2019, 2019. a
Vömel, H., Naebert, T., Dirksen, R., and Sommer, M.: An update on the uncertainties of water vapor measurements using cryogenic frost point hygrometers, Atmos. Meas. Tech., 9, 3755–3768, https://doi.org/10.5194/amt-9-3755-2016, 2016. a
Vömel, H., David, D. E., and Smith, K.: Accuracy of tropospheric and stratospheric water vapor measurements by the cryogenic frost point hygrometer: Instrumental details and observations, J. Geophys. Res., 112, D08305, https://doi.org/10.1029/2006JD007224, 2007. a
von Glasow, R., Sander, R., Bott, A., and Crutzen, P. J.: Modeling halogen chemistry in the marine boundary layer 1. Cloud-free MBL, J. Geophys. Res., 107, 4341, https://doi.org/10.1029/2001JD000942, 2002. a
WMO: Definition of the tropopause, WMO Bull, IV, 134–138, 1957. a
WOUDC (the World Ozone and Ultraviolet Radiation Data Centre): Ozone profiles, available at: https://woudc.org/data/explore.php?lang=en, last access: 15 June 2018. a
Wright, J. S., Fu, R., Fueglistaler, S., Liu, Y. S., and Zhang, Y.: The influence of summertime convection over Southeast Asia on water vapor in the tropical stratosphere, J. Geophys. Res., 116, D12302, https://doi.org/10.1029/2010JD015416, 2011. a, b
Yan, R. C. and Bian, J. C.: Tracing the boundary layer sources of carbon monoxide in the Asian summer monsoon anticyclone using WRF–Chem, Adv. Atmos. Sci., 32, 943–951, https://doi.org/10.1007/s00376-014-4130-3, 2015. a
- Abstract
- Introduction
- Measurements and trajectory calculations
- Results
- Discussion and conclusions
- Appendix A: Comparisons of ERA-Interim and ERA5 wind fields
- Appendix B: Comparisons of the ERA-Interim and ERA5 reconstructed SMRmin with the water vapour mixing ratio observed by CFH
- Code and data availability
- Author contributions
- Competing interests
- Special issue statement
- Acknowledgements
- Financial support
- Review statement
- References