the Creative Commons Attribution 4.0 License.
the Creative Commons Attribution 4.0 License.
 | 01 Apr 2020
Vertical characteristics of aerosol hygroscopicity and impacts on optical properties over the North China Plain during winter
Qian Gao
Ping Tian
Fei Wang
Delong Zhao
Kai Bi
Yangzhou Wu
Shuo Ding
Kang Hu
Jiale Zhang
Deping Ding
Chunsheng Zhao
The water uptake of aerosol influences its optical depth and capacity for cloud formation, depending on the vertical profile of aerosol hygroscopicity because of different solar radiation received and supersaturation (SS) conditions at different atmospheric levels. Such information is lacking over the polluted East Asian region. This study presents aircraft-based in situ measured aerosol size distributions and chemical compositions by a series of flights over the Beijing area in wintertime. Under high relative humidity (hRH) conditions (surface RH > 60 %), a significant enhancement of aerosol hygroscopicity parameter (κ) in the planetary boundary layer (PBL) was observed to increase by 50 % from 0.20 up to 0.34 from the surface to the top of the PBL (vertical gradient of ∼0.13 km−1), along with the dry particle effective diameter (Deff) being increased by 71 % and activation ratio up to 0.23 (0.64) at SS =0.05 % (0.1 %). However, a lower vertical gradient of κ (0.05 km−1) and smaller Deff was exhibited under low RH (lRH, surface RH < 60 %). This suggests that the aqueous processes played an important role in promoting the enhancement of particle hygroscopicity in the PBL. The κ in the lower free troposphere (LFT) was relatively stable at 0.24±0.03 with a slight increase during regional transport. The enhancement of aerosol optical depth (AOD) due to water uptake ranged 1.0–1.22 for the PBL under lRH and LFT, but it reached as high as 6.4 in the PBL under hRH. About 80 % and 18 % of the AOD were contributed to by aerosol hygroscopic growth under hRH and lRH, respectively. These results emphasize the important evolution of aerosol water-uptake capacity in the PBL, especially under the high RH condition.
- Article
(5341 KB) - Full-text XML
-
Supplement
(634 KB) - BibTeX
- EndNote


Water growth on particles can increase particle size and modify its refractive index, thereby affecting its radiative effects. The aerosol can be subject to hygroscopic growth under subsaturation (Köhler, 1936) and serve as cloud condensation nuclei (CCN) under a supersaturated environment (Dusek et al., 2006). Due to the fact that most instruments characterize the properties of aerosol in dry condition, it is necessary to recover the properties to the ambient environment when using the observational data to estimate the direct and indirect radiative impacts of aerosol. In addition, the hygroscopic growth of aerosols can influence the consistency of observations of aerosol mass and chemical compositions, leading to less robustness in the analyses of spatial and temporal variances and chemical mechanism studies (Chen et al., 2018). Therefore, the observation of the hygroscopicity profile is crucial from scientific and measurement perspectives.
The hygroscopic properties of aerosol are mainly determined by composition, with inorganics having higher hygroscopicity (Cruz and Pandis, 2000; Gysel et al., 2007) than less water-soluble substances, such as black carbon (Aklilu et al., 2006; Pringle et al., 2010) or primary organics (Wang et al., 2008). However, ambient aerosols are complex mixtures and their compositions vary at different stages of the atmospheric aging process (Zhang et al., 2007). A single hygroscopicity parameter (κ) (Petters and Kreidenweis, 2007) is used to describe the composition effect on hygroscopicity, under both sub- and supersaturation conditions (Petters and Kreidenweis, 2008). The aerosol composition measurements were intensively conducted on the ground in the East Asian region in recent decades (Meng et al., 2014; Wu et al., 2016; Zou et al., 2019; Irwin et al., 2011). These studies computed the measured compositions by volume-weighted fractions to estimate the κ, and found κ to be ranging from 0.1 to 0.4 under different environments or pollution sources; in particular, the secondary inorganics are in consensus found to be the main component driving the liquid water content in aerosol (Pringle et al., 2010; Prenni, 2003; Khlystov, 2005). The water absorbed on aerosol could importantly influence the consequent gas uptake (Kolb et al., 2002) and aqueous reactions (Ge et al., 2012), and it may further promote secondary formation in the particle phase (Hennigan et al., 2008).
The boundary layer meteorology and associated physicochemical processing on pollutants has raised great attention recently, which could cause important feedback impacts on enhancing the pollution level via inhibiting the development of the boundary layer (Zhou et al., 2019; Bharali et al., 2019; Liu et al., 2018b). This impact is importantly determined by the vertical distribution of aerosol concentration, size distribution, and optical properties. The location of the aerosol layer or hygroscopic growth at different locations in the atmospheric column is important in altering the thermodynamic stability, e.g., influencing the radiative inversion through dimming effect towards lower level (Morgan et al., 2010; Massoli et al., 2009). A precious study shows that the presence of absorbing aerosols over the boundary layer could suppress its development, thereby enhancing the pollution in megacities (Ding et al., 2016; Zhao et al., 2020). Under high pollution, this impact could be exacerbated, especially under the high moisture condition, as evidenced by a number of studies that showed that over 25 % of the polluted days with significantly reduced visibility in megacities were associated with high RH (Deng et al., 2013; Zhong et al., 2018; Qiang et al., 2015; Quan et al., 2014; Liu et al., 2013). These results emphasize the importance of studying the vertical characteristics of particle hygroscopicity, but such information is still lacking due to limited airborne measurements over the East Asian region.
This study reports the results of a series of aircraft-based in situ measurements conducted over the Beijing region in the winter of 2016. The detailed chemical compositions are used to estimate the vertical distributions of aerosol hygroscopicity. The in situ measured size distribution and hygroscopic growth factor are combined to evaluate the influence of water uptake on the ambient aerosol optical depth (AOD) and CCN activation ratio under different moisture conditions.
2.1 Flight information
Measurements were performed over the Beijing area by King Air 350 aircraft in the winter of 2016 (Liu et al., 2018a; Tian et al., 2019; Zhao et al., 2019). The sampling inlet system used on the aircraft is the model 1200 passive isokinetic aerosol sampling inlet (BMI, Brechtel Manufacturing Inc.), which could deliver 150 L min−1 of sample flow at 100 m s−1 air speed, with particle diameters between 0.01 and 6 µm with > 95 % collection efficiency (Tian et al., 2019; Hermann et al., 2001). The maintained room temperature in the cabin serves as an automatic drier when ambient temperature was lower than inside at higher altitude; in addition to that, a silicate diffusion drier was installed before the instrument sampling, further warranting the dry condition for the samples. An aircraft-integrated meteorological measurement system (AIMMS-20, Aventech Inc., Canada) is mounted under the wing to measure temperature (T), relative humidity (RH), wind speed and direction, and pressure with a time resolution of 1 s.
The operation of flights was carried out to avoid clouds where possible, and the results here have been screened to remove the in-cloud data, as determined by measurements of relative humidity and cloud liquid water content. The flights were mostly operated at altitudes up to 2.5 km, focusing on the pollutants in the planetary boundary layer (PBL) and lower free troposphere (LFT) around the Beijing area. The flight tracks and time schedules are presented in Fig. 1 and Table 1. The aircraft took off from Shahe in the morning (a rural area ∼20 km to the northwest of central Beijing), conducting a full profile, and then flew over Beijing city or the surrounding area with a few constant-level runs at different altitudes, followed by another full profile over Shahe. As the aircraft was unable to fly lower than 500m altitude over Beijing city due to flight-path restrictions, full profiles throughout the lower troposphere were only conducted over Shahe.
Table 1Flight time schedules (LT, local time) and corresponding planetary boundary layer height and surface RH.
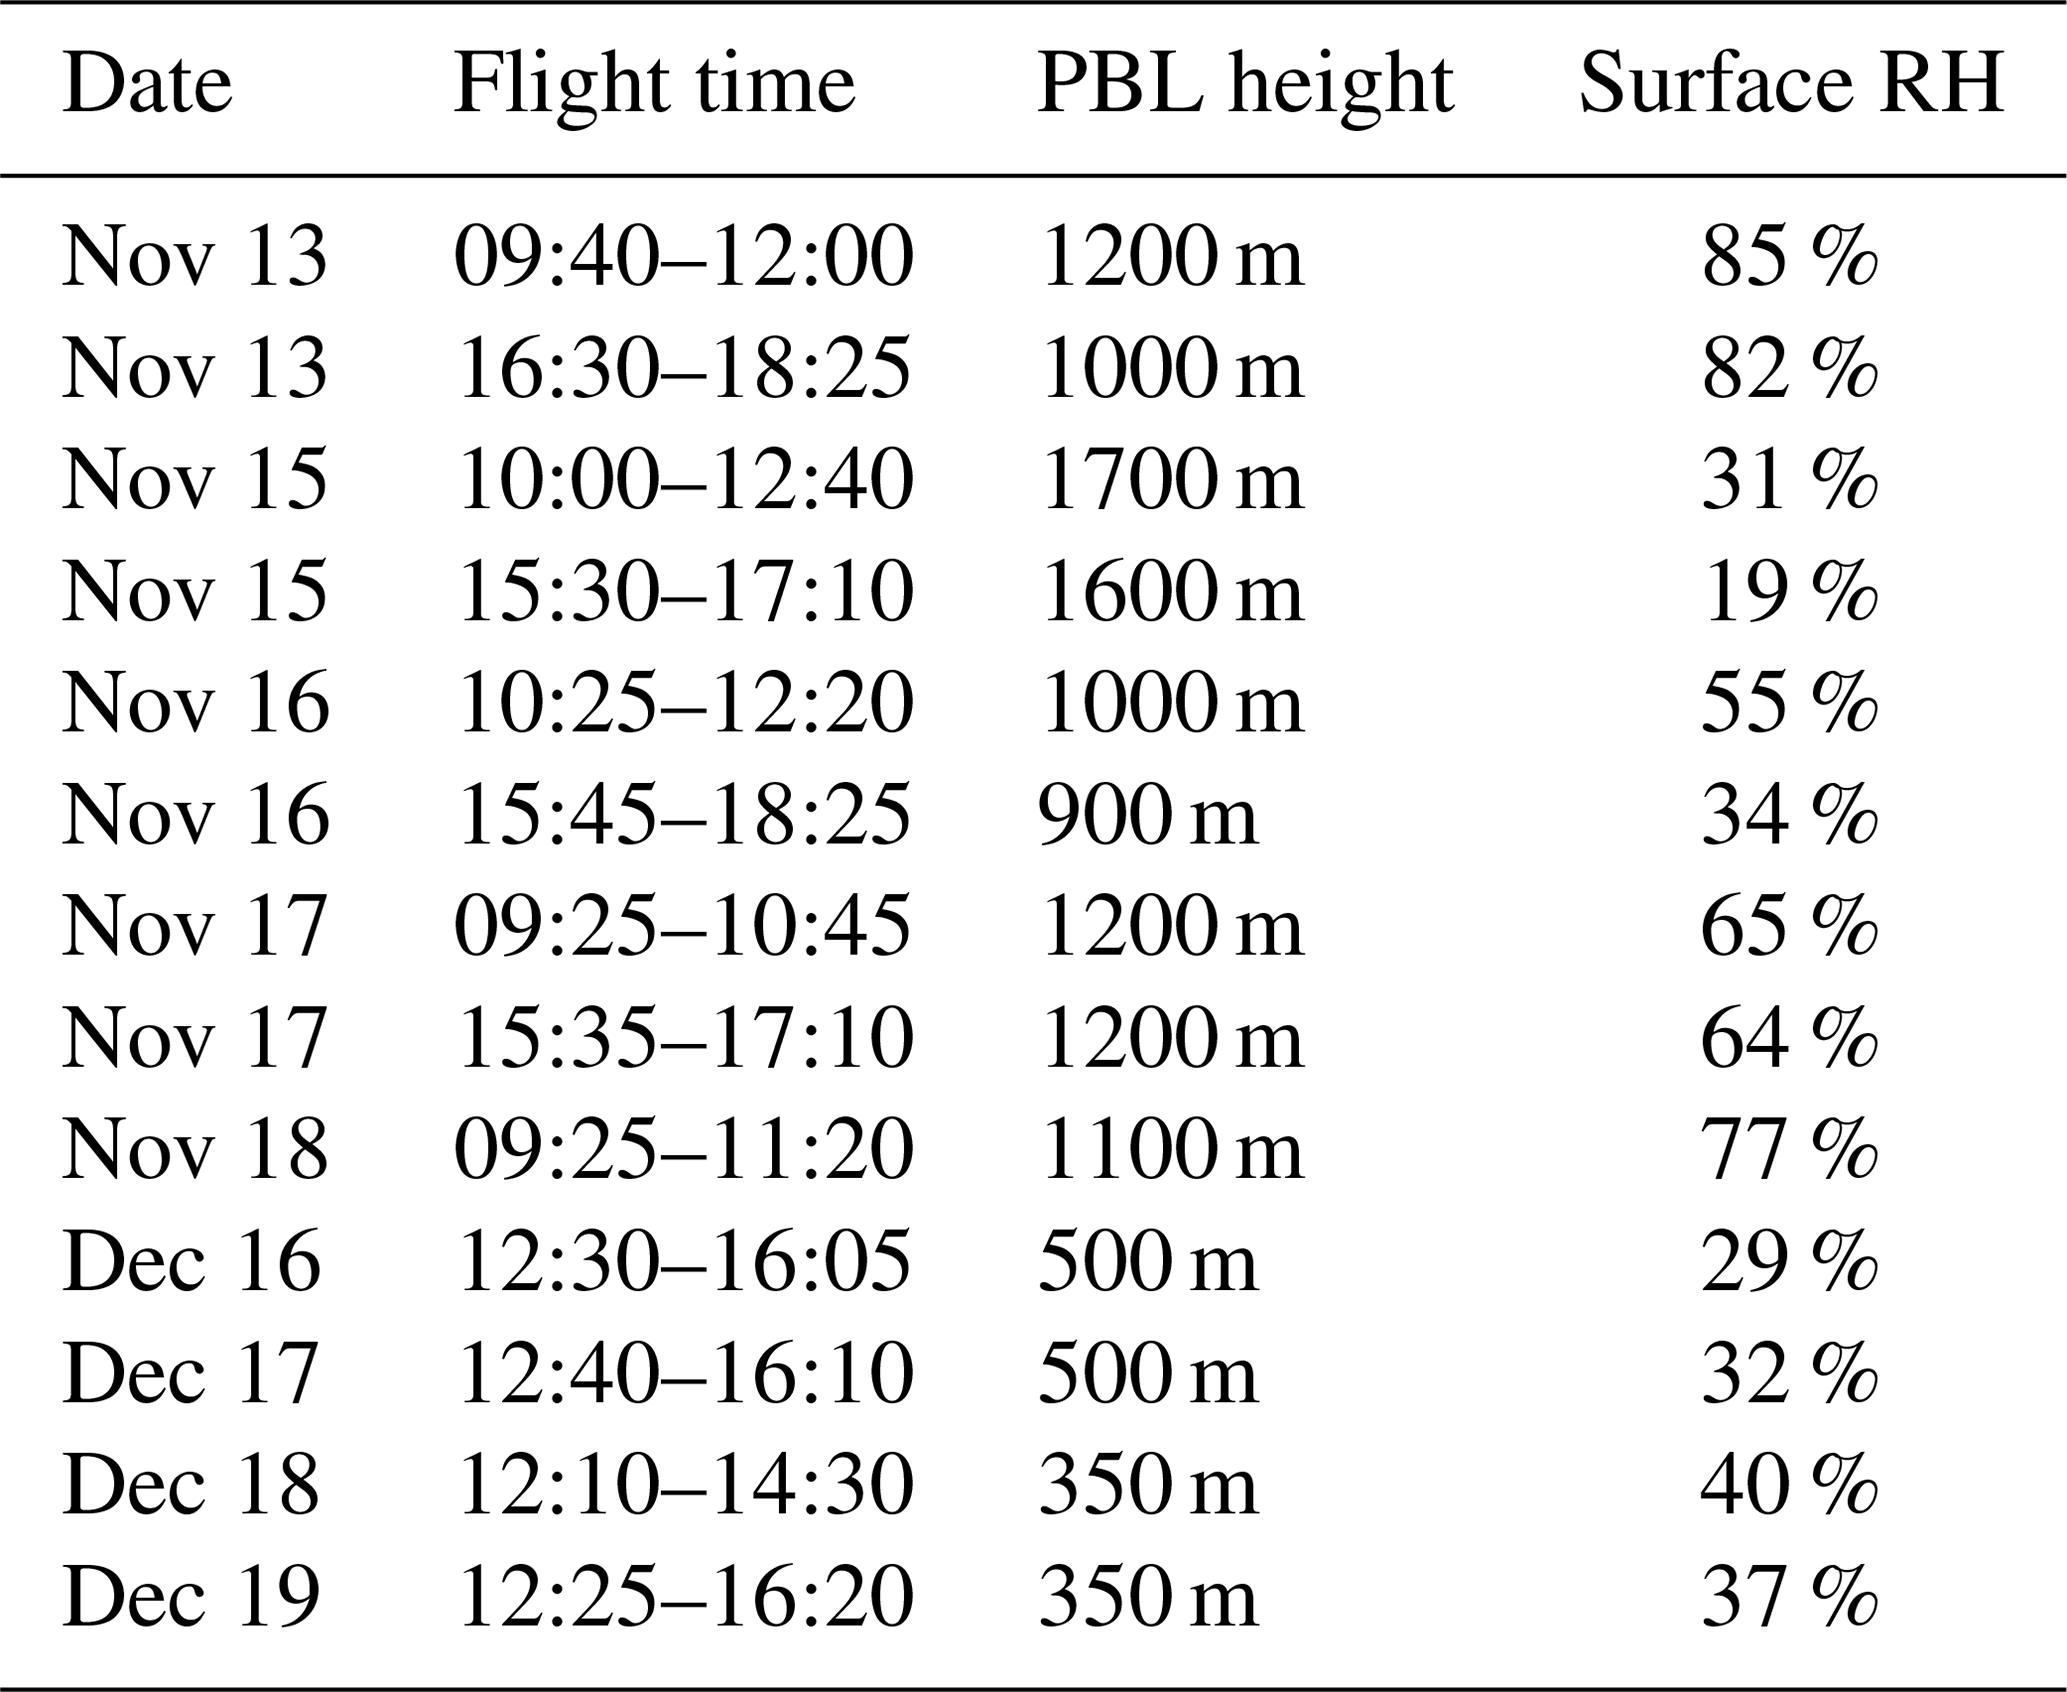
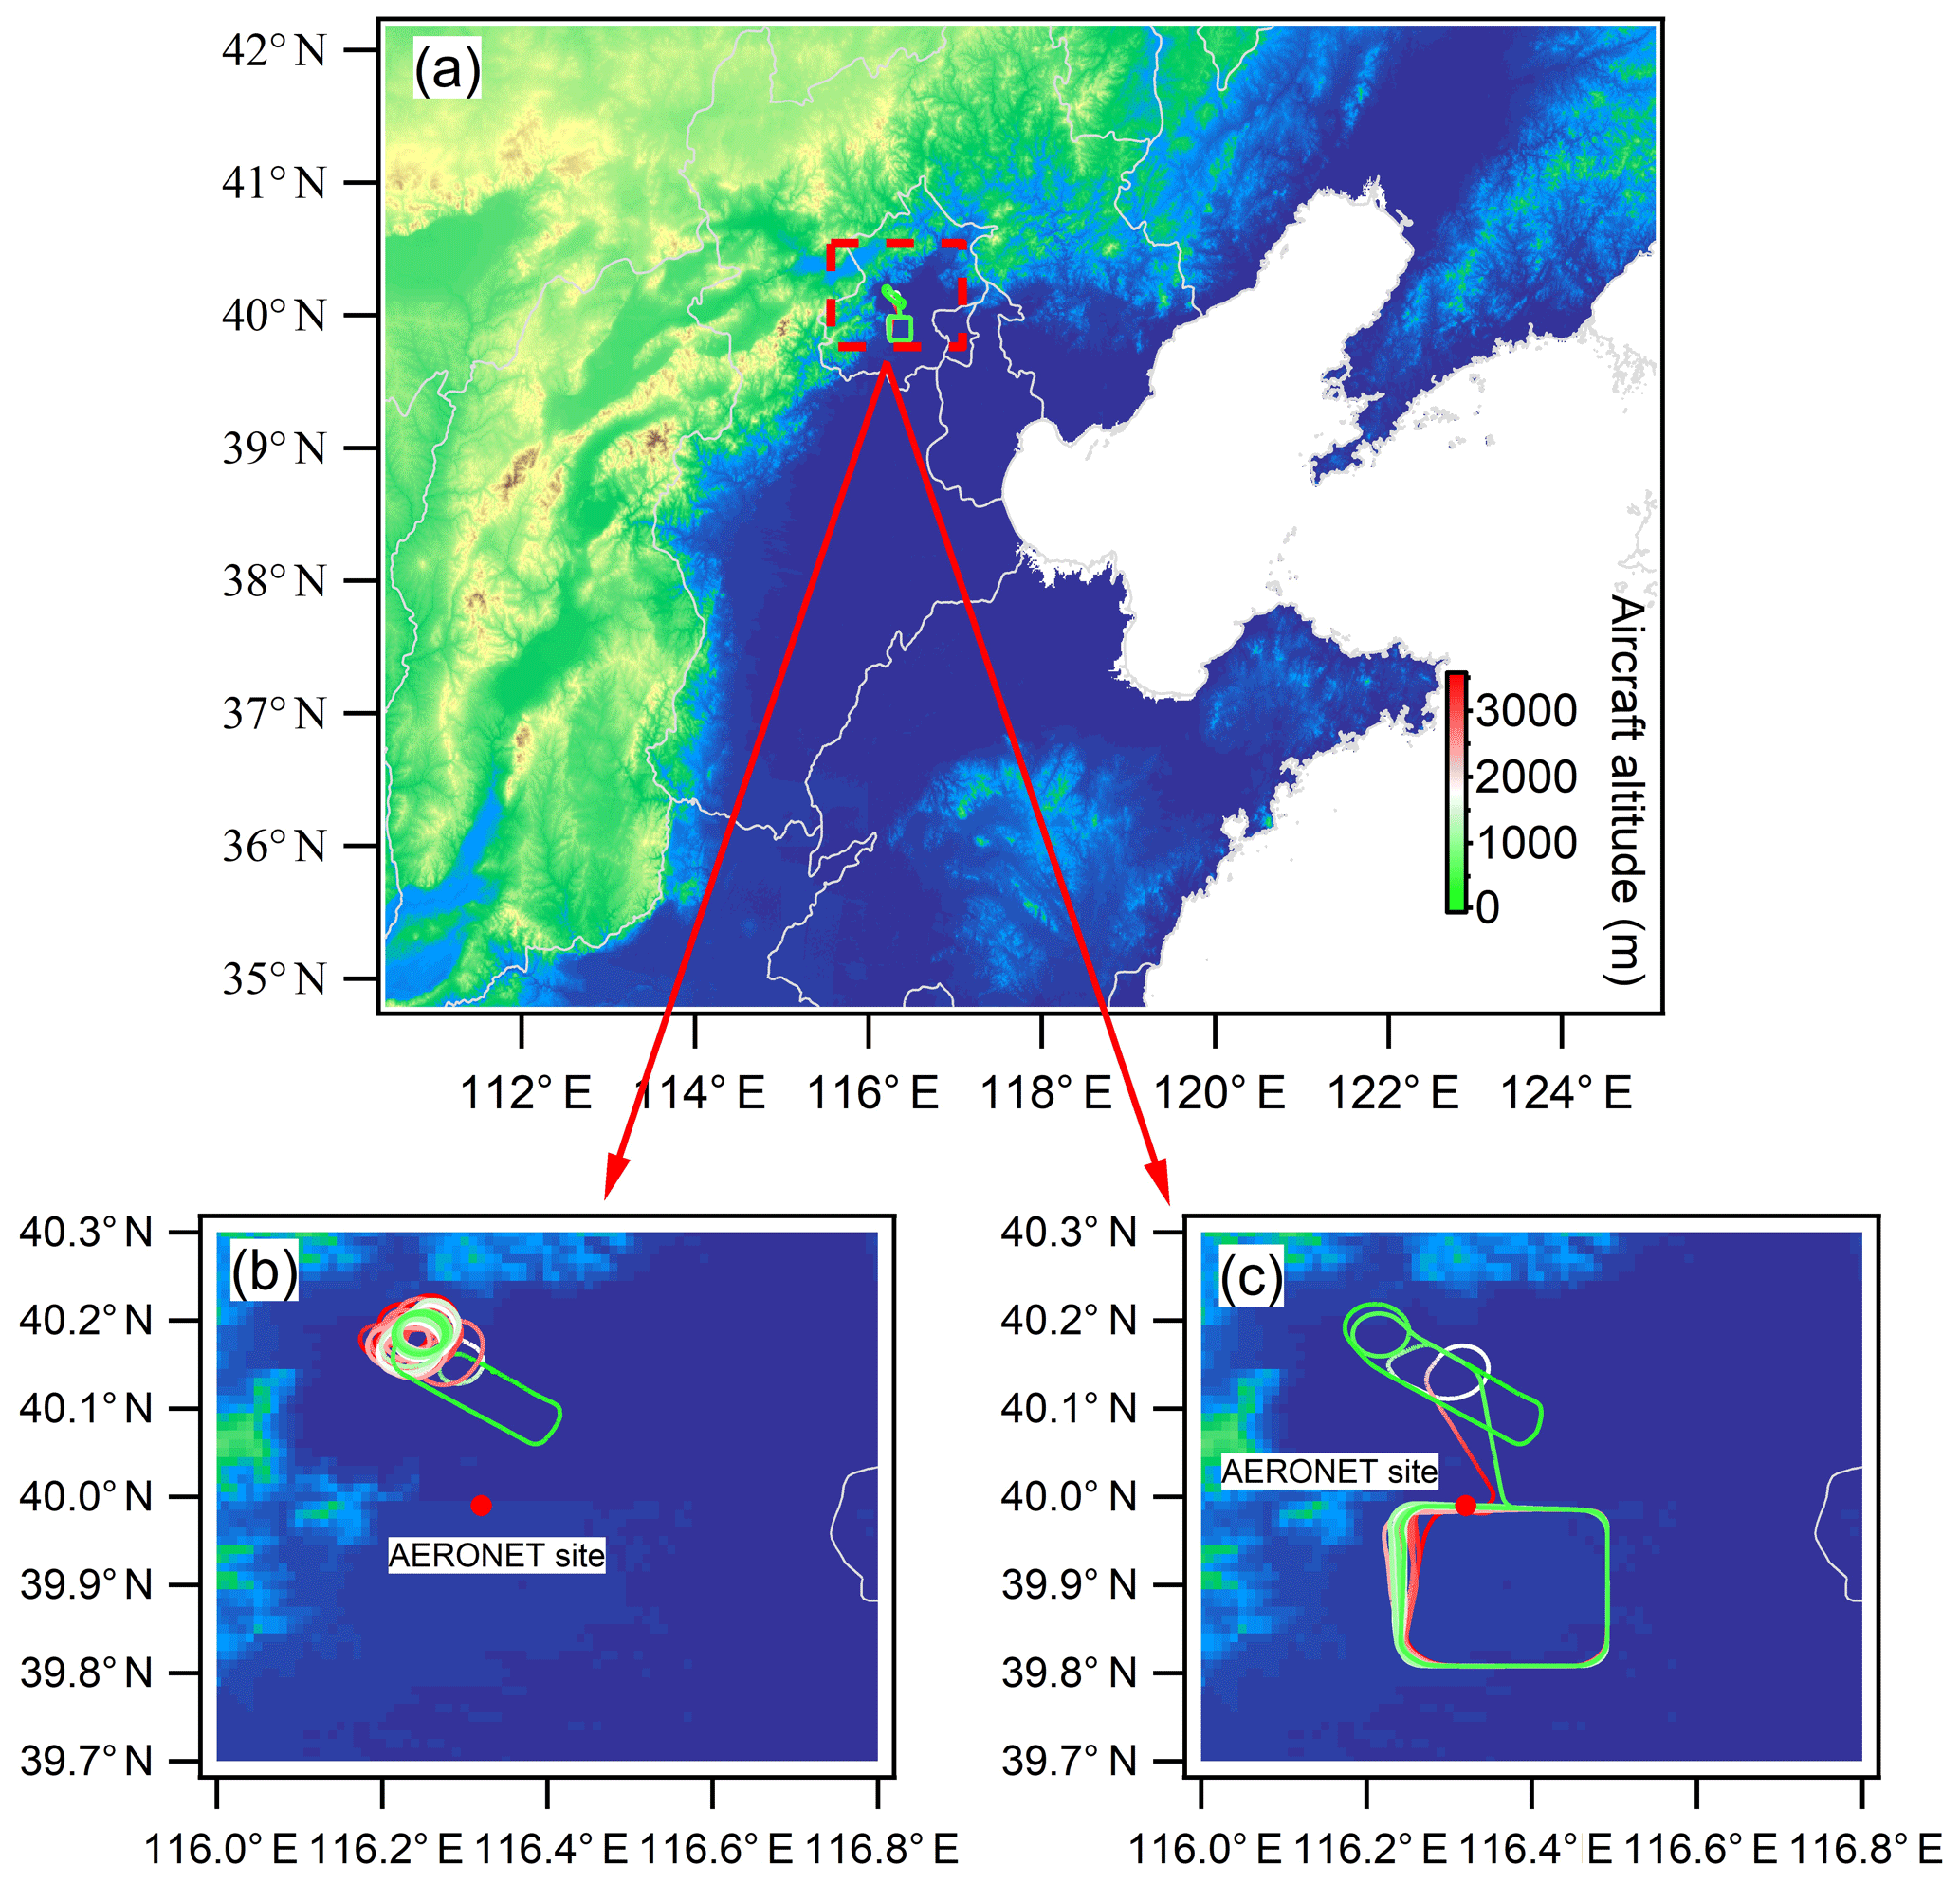
Figure 1Flight tracks on the terrain map. (a) The surrounding terrain and (b) flight tracks in November 2016 and (c) in December 2016. Red solid symbols in (b) and (c) represent the location of the Peking University AERONET site.
2.2 Instrumentation for aerosol measurements
The particle size distribution was measured by the PCASP (passive cavity aerosol spectrometer probe) instrument with a time resolution of 1 s, at diameters from 0.1 to 3 µm. With a wired heater on top of the inlet, the aerosol size distribution measured by the PCASP was considered to be dry at RH < 40 % (Strapp et al., 1992). Due to the detection limit of the instrument, the first two bins (0.1–0.11, 0.11–0.12 µm) are eliminated from the analysis (Liu et al., 2009). The aerosol number concentration Na (cm−3) refers to the total number concentration with diameters ranging 0.12–3 µm. The effective diameter Deff is calculated by
where Ni is the number concentration of ith size bin; Di is the particle diameter at each size bin.
A compact time-of-flight aerosol mass spectrometer (C-ToF-AMS) measured submicron nonrefractory aerosol (NR-PM1) chemical compositions with a time resolution of 1 min, including nitrate (NO3), sulfate (SO4), ammonium (NH4), chloride (Chl), and organics (Org) (Drewnick et al., 2005; Canagaratna et al., 2007). The term nonrefractory refers to all species that can be vaporized at 600∘ and Torr. A constant pressure controller was used to regulate and maintain the downstream pressure at 650 hPa in order to ensure constant sampling conditions for the AMS during altitude change (Bahreini et al., 2008). All calibrations (flow rate, particle velocity, ionization efficiency) were performed under this pressure before and after each flight. Mass concentrations derived from the AMS are reported as micrograms per standard cubic meter (T=273.15 K, p=1013.25 hPa). The AMS collection efficiency (CE), which accounts for the incomplete detection due to particle bounce at the vaporizer and/or the partial transmission of particles by the lens (Canagaratna et al., 2007), is significantly modulated by particle phase (Matthew et al., 2008). In this study, a CE correction was used following Middlebrook et al. (2012). A positive matrix factorization (PMF) analysis was performed on the organic mass spectra following the procedures by Ulbrich et al. (2009). Two factors were resolved for the results here, which are the hydrocarbon-like organic aerosol (HOA) and oxygenated organic aerosol (OOA), corresponding to the primary OA (POA) and secondary OA (SOA), respectively.
Equivalent black carbon mass was measured with an Aethalometer (AE33, Magee Scientific) at 1 Hz. The Aethalometer collected aerosol particles through the same isokinetic inlet and sampling line as for the AMS. The instruments used a dual-dots configuration to auto-correct for the loading affect. The measured absorption was converted to BC mass using an apparent mass absorption cross section (MAC) of 7.7 m2 g−1 at a wavelength of 880 nm (Drinovec et al., 2015). The λ=880 nm setting is chosen to avoid the potential interference of brown carbon at shorter wavelengths. The multi-scattering enhancement factor C value of 2.88 at 880 nm wavelength was used to exclude the multiple light scattering effects, which was obtained through a laboratory study by running the AE33 in parallel with a photoacoustic photometer (PASS-3, DMT, USA) for 1 week ambient measurement (Tian et al., 2019).
The measurements of the AMS and Aethalometer, which are the nonrefractory and refractory composition, respectively, represent the main compositions of aerosol in PM1. The sum of measured AMS and AE33 masses is compared with PCASP-derived PM1 (Fig. S1 in the Supplement), and it showed a high correlation (R2=0.91, slope =1.05), implying a high level of agreement between measurements inside and outside the cabin.
2.3 Aerosol hygroscopic properties
The hygroscopic parameter κ (Petters and Kreidenweis, 2007) is solely determined by composition and reflects the Raoult term in Köhler theory. The κ for an internal mixture with multiple compositions is contributed to by the κ of each volume-weighted composition, following the Zdanovskii–Stokes–Robinson (ZSR) mixing rule (Stokes and Robinson, 1966), which is expressed as
where i represents the ith composition, εi is the volume fraction of each composition in the bulk, and ki is the hygroscopic parameter for each composition. In this study, the compositions are determined by AMS the AE33 measurements. In particular, the inorganic compositions are derived by empirically pairing the AMS-measured ions (Gysel et al., 2007), which is expressed as
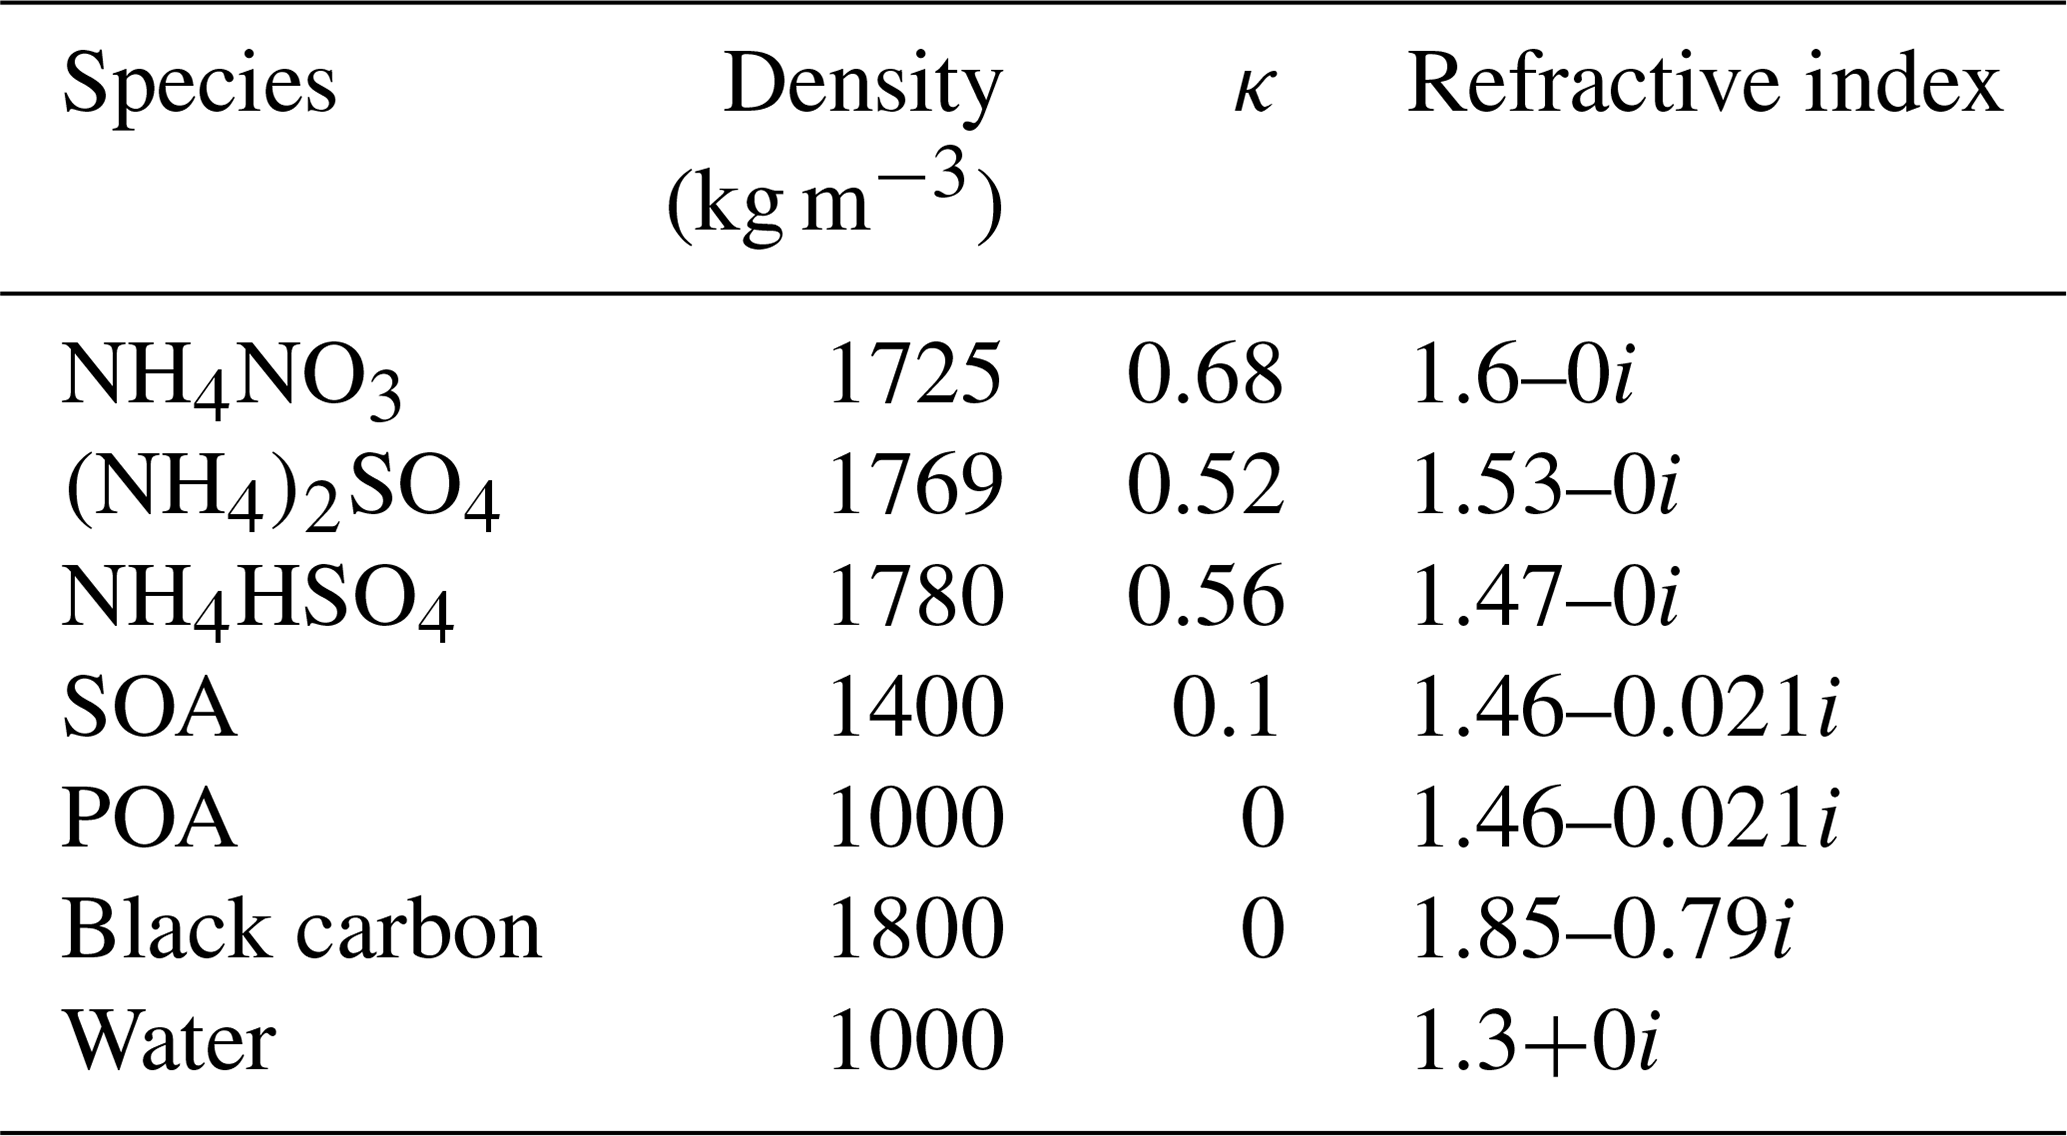
All species are then converted to volume by assuming a density. Table 2 summaries the density and κ used for all species mentioned in this study. By including the ammonium chloride, a mass fraction of 3.6 %±2.0 % was found throughout the experiment, and the chloride concentration was mostly lower than the lower AMS detection limit; thus, its contribution to bulk aerosol hygroscopicity could be ignored during the observation. The κ of organics (κorg) has more diverse compared to inorganics (Saxena et al., 1995; Aklilu et al., 2006). Previous studies suggest that the hygroscopicity of organics varied with their oxidation state (Chang, 2011; Tritscher et al., 2011). The organic matter was classified as primary organic aerosol (POA) and secondary organic aerosol (SOA) by the PMF analysis. According to a closure study between aerosol chemical composition and hygroscopic growth in Beijing (Wu et al., 2016), the hygroscopicity of organic matter was assigned with a κSOA and κPOA of 0.1 and 0, respectively, and κBC is set to 0.
Table 2Density, hygroscopicity parameter (κ), and refractive indices of pure composition used in this study.
2.4 Aerosol optical properties
The refractive index (RI) in bulk, as contributed to by different compositions, is calculated according to the volume mixing rule (Wen, 2003). The RI of each volume-weighted composition is summarized in Table 2. In addition to dry compositions, the volume of water contained in particles is calculated based on the hygroscopic growth of particles under certain RH. If the hygroscopicity parameter (κ) is known, aerosol hygroscopic growth factor (HGF) and ambient size distribution can be calculated from the dry particle diameter (Dd) and ambient relative humidity (RH), which is expressed as
where σs∕a is the water surface tension at the solution–air interface, Mw is the molar mass of water, R is the universal gas constant, T is the absolute temperature, and ρw is the density of water.
The volume of absorbed water (Vwater) is then calculated from HGF by
The water is then taken into account as a composition to work out the RI for wet aerosol, which is expressed as
where Vi is the respective volume of each component, Vchem and Vwater are total volume of all chemical species (other than water) and absorbed water, respectively; mi and ni are real and imaginary parts of refractive indices for each pure component. Then the real part (mamb) and imaginary part (namb) of ambient aerosol particle refractive indices can be derived from chemical components and absorbed water by Eqs. (7) and (8).
The extinction cross section (Cext, in µm2) is calculated at each particle diameter (Di), multiplied by number concentration (in cm−3) at each Di to obtain the extinction coefficient (σext(Di), in Mm−1). The σext(Di) is then integrated over all Di to obtain the total σext for bulk aerosol at a specified wavelength (λ, 870 nm in this study). This calculation is performed for both dry and ambient conditions using dry and wet particle sizes, particle RI (as calculated above), to obtain the dry or ambient total extinction. The σext is multiplied by height interval (Δh, 100 m) to obtain the dry and ambient aerosol optical depth (AOD) at each altitude:
where Di,dry is the dry particle diameter, and Di,amb is calculated by Di,dry multiplied by HGF, which represents the ambient particle diameter under the ambient RH condition.
f(AOD), which is the ratio of AODamb,100 m to AODdry,100 m, is introduced to characterize the AOD enhancement due to particle hygroscopic growth under ambient condition.
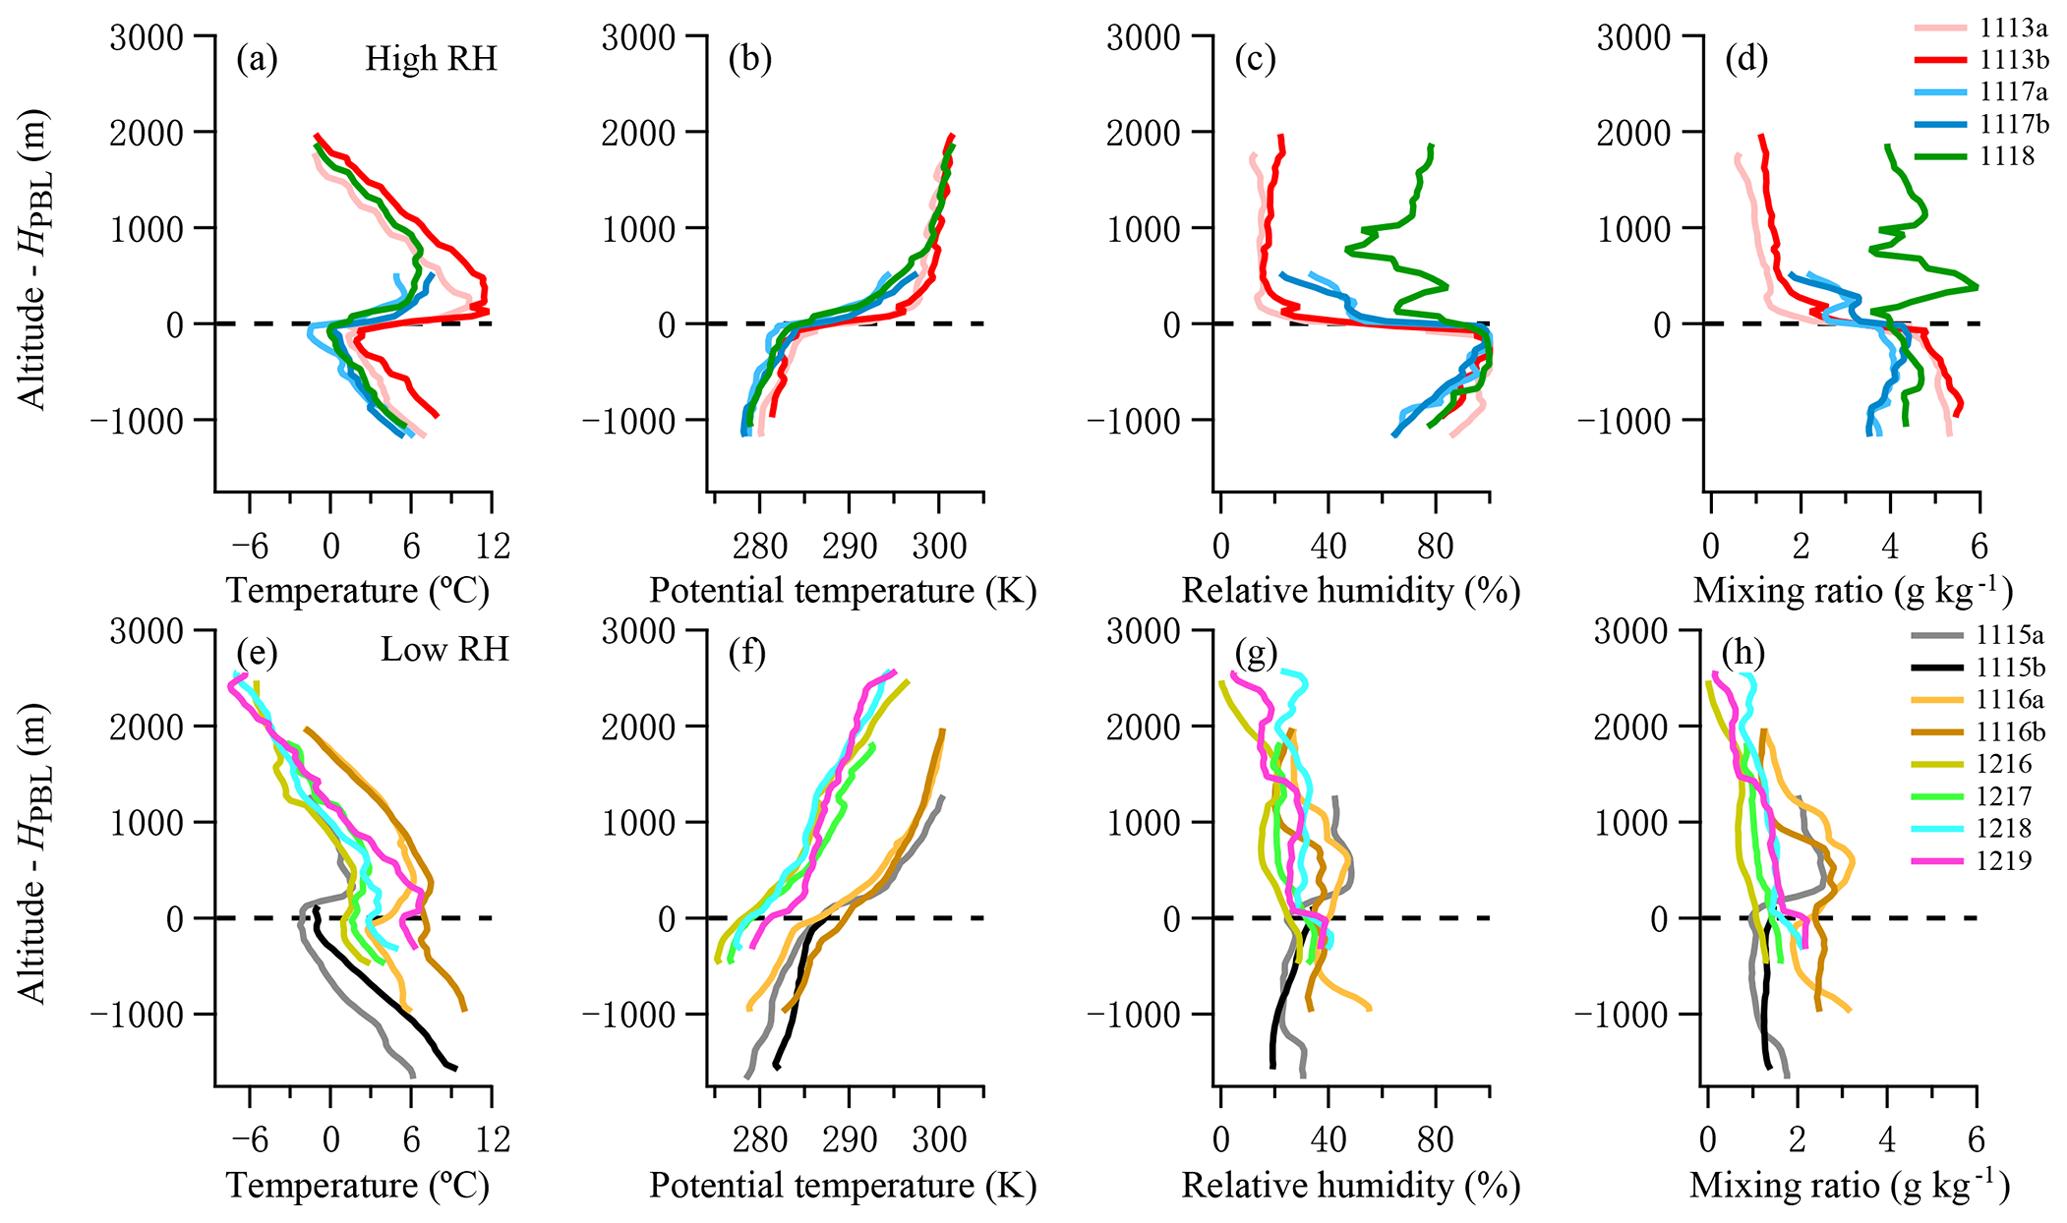
Figure 2Vertical profiles of in situ measured meteorological parameters under high RH and low RH conditions during the experiment; y axis denotes the above-sea-level height relative to the planetary boundary layer height.
3.1 Meteorology
Vertical profiles of aircraft-based in situ measured meteorological parameters (temperature T, potential temperature θ, relative humidity RH, water mixing ratio q) under high and low relative humidity conditions are presented in Fig. 2. The high and low RH conditions are defined by ground-level RH higher and smaller than 60 %, respectively. The height of the planetary boundary layer (PBL) is defined as the altitude (z) at which the vertical gradient, dθ∕dz, reached 10 K km−1, and in the PBL dθ∕dz less than 10 K km−1 denoted a thermal-dynamically well-mixed layer (Su et al., 2017). As shown in Fig. 2a, temperature inversion layers appeared on top of the PBL for most flights, and the degree of inversion under high RH condition was much larger than that under low RH condition, with mean values of 7.8∘. Along with temperature decrease in the vertical direction, RH in the PBL showed positive vertical gradient in the PBL, especially under high RH condition (Fig. 2c). The water mixing ratio (q) showed weak vertical variation in the PBL (Fig. 2d and h), meaning a well-mixed moisture.
A recent study in Beijing found that most aerosols deliquesced at RH ∼60 % (Zou et al., 2019); a criteria with surface RH above or below 60 % is thus set to investigate the potential moisture influence on the observed composition, defined as high RH (hRH) and low RH (lRH), respectively. For lRH cases, the profiles were further classified as more polluted condition when surface PM1 > 100 µg m−3.
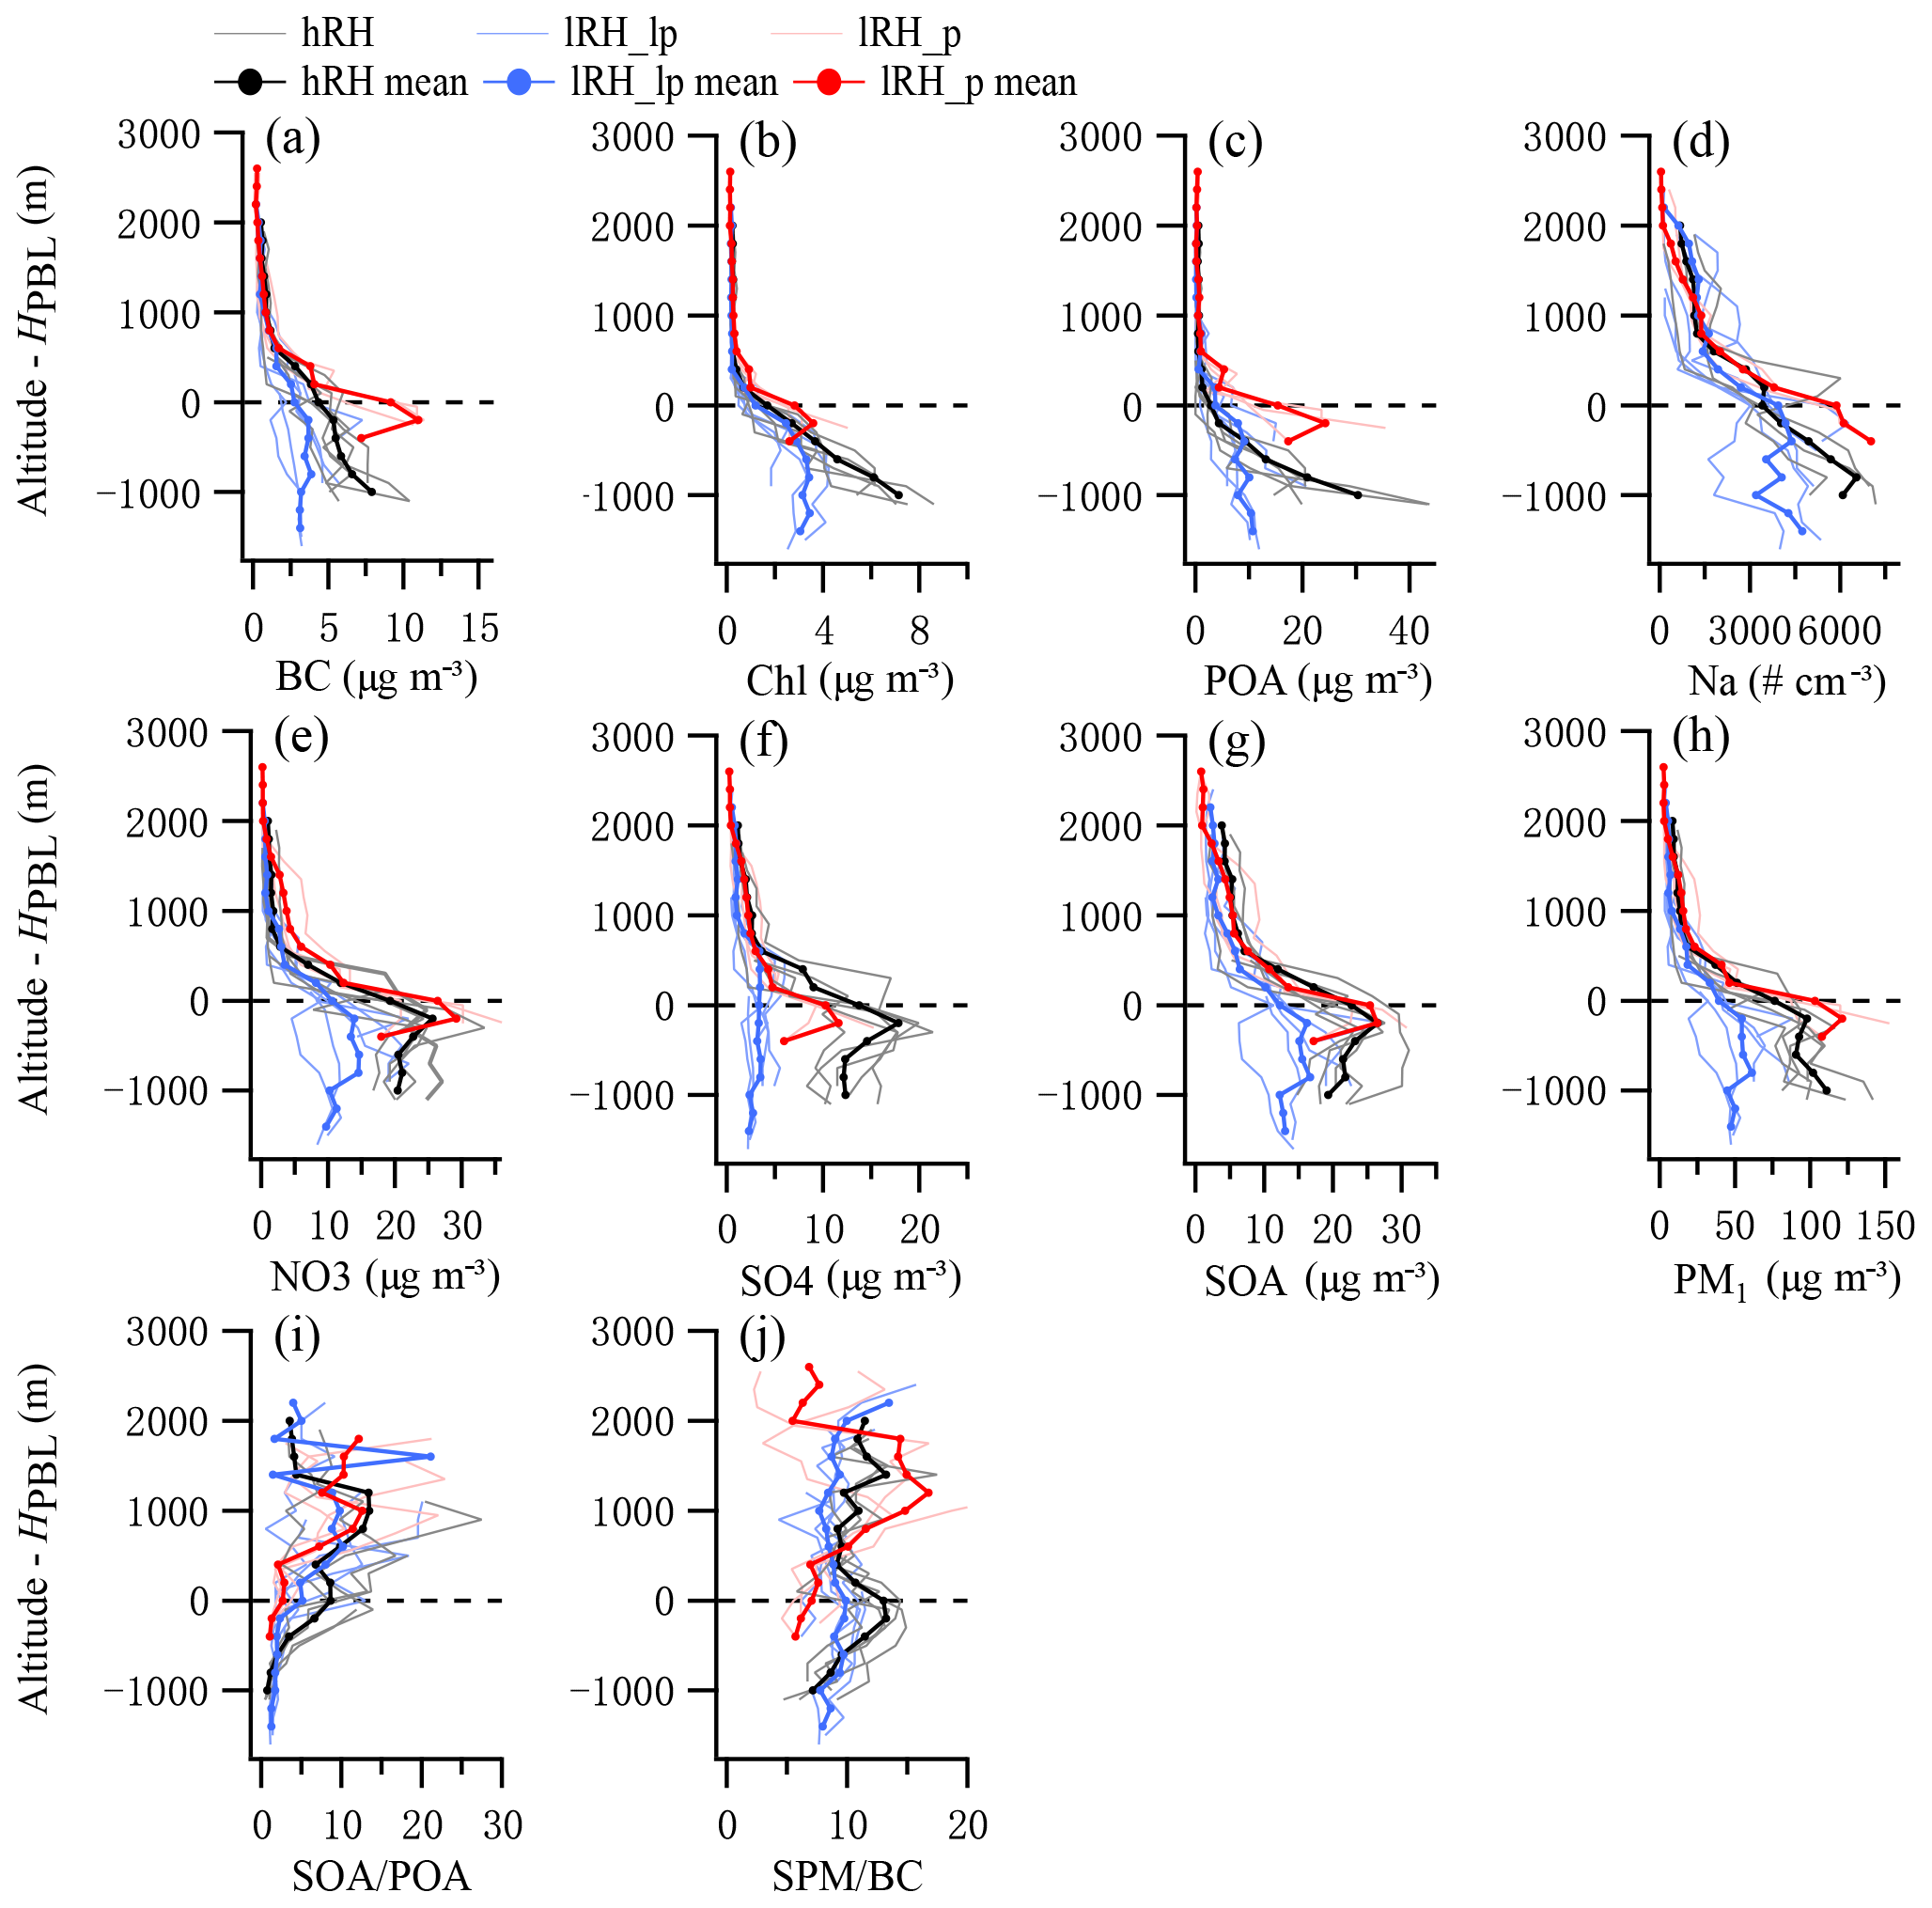
Figure 3Vertical profiles of aerosol properties under low RH and less polluted condition (lRH_lp), low RH and polluted condition (lRH_p), and high RH condition (hRH). (a–d) Primary aerosol components and number concentrations, “Na” denotes the number concentration at 0.12–3 µm measured by the PCASP, (e–h) secondary aerosol components and mass concentrations, (i) ratio of SOA over POA, (j) ratio of SPM (secondary particulate matter) over BC. The solid lines show mean values in 100 m altitude bins.
3.2 Vertical characterization of aerosol chemical composition
The vertical profiles of aerosol chemical components under lRH and hRH conditions are shown in Fig. 3, including the primary emissions (BC, chloride, POA), secondary compositions (nitrate, sulfate, SOA), and the ratio between both, i.e., SOA/POA and SPM/BC (where SPM, secondary particulate matter, is the sum of secondary species). Because the primary sources mainly result from surface emission, all primary species (BC, Chl, POA) featured with an accumulated concentration towards lower level but a reduced concentration at higher level. This consistent exponential decrease profile pattern in wintertime was also observed in previous studies over Beijing (Zhang et al., 2009; Liu et al., 2009; Zhao et al., 2019). However, the mass concentrations for all secondary components including nitrate, sulfate, and SOA had less vertical gradient within the PBL (Fig. 3e–h). This is further reflected by Fig. 3i–j, with the secondary to primary ratio (SOA/POA, SPM/BC) showing pronounced positive vertical gradient, and this increase was capped on top of the PBL. It is noted that the increased contribution of secondary species was closely correlated with RH increase in the PBL. The increased RH could promote the condensation of semivolatile species to the aerosol phase (Khlystov et al., 2005; Pankow et al., 1993) and may also enhance the heterogeneous reactions on the existing particle surface from gaseous precursors (Guo et al., 2014; Huang et al., 2014). Due to the higher hygroscopicity of secondary species, the observations here provide direct evidence that the increase in moisture had modified the aerosol composition in the PBL to contain more secondary species and more hygroscopic particles.
For the lRH condition (surface RH < 60 %), contrasting vertical structures of aerosol compositions were observed compared to hRH. The aerosol loadings had large variabilities, and the high concentration in the PBL coincided with the reduced PBL height. These conditions are thus further classified as more and less polluted corresponding to PBL height < 500 and > 500 m, respectively. The secondary species almost covaried with the primary, leading to an almost consistent secondary to primary ratio in the PBL, with SOA/POA of ∼2.1 and SPM/BC of ∼9.5 (Fig. 3i–j). Under the polluted condition, both ratios were lower than that under less polluted condition. The contribution of secondary aerosols, as reflected by SOA/POA and SPM/BC ratios, fell within the same range with that at the surface level of hRH. By comparing with the hRH condition, the almost maintained secondary contribution in the PBL under lRH (Fig. 3i–j) suggests the less important secondary formation or at least that the moisture in the PBL had not sufficiently promoted the modification of primary species, but the pollutants were mainly modulated by the emissions and regional transport.
Figure 3h PM1 mass concentrations show exponential decreases with altitude in the LFT with most concentrations distributed in the range of 2–38 µg m−3, and the contribution of SOA becomes more significant (Fig. S2).
3.3 Vertical profile of particle hygroscopicity
Figure 4 shows the vertical profiles of dry aerosol hygroscopicity parameter (κ) and effective diameter under all conditions. The bulk κ is largely modulated by secondary inorganic compositions given their larger κ. The κ on the ground showed consistent values (0.22±0.02, range of 0.20–0.25) under all conditions, which was in the middle range of previous ground measurements in Beijing (Wang and Chen, 2019; Wu et al., 2016; Zou et al., 2019; Liu et al., 2014), and the observations here extend the hygroscopicity information to the upper level. As shown in Fig. 4a, the vertical profiles of κ under hRH show a pronounced increase from surface level to the top of the PBL with a variation from 0.18 to 0.34 by a factor of 1.9. This is consistent with the increasing fraction of most secondary inorganic hygroscopic species due to that fact that pure inorganic substances are more hygroscopic (Table 2). The increase in κ generally followed a linear correlation with a slope of 0.13 km−1, and, in contrast, with a much lower vertical gradient of κ (slope of 0.05 km−1) under lRH. Under hRH, the source of moisture from the surface was accumulated in the PBL and promoted the enhancement of particle hygroscopicity, thus showing a positive correlation between κ and RH (Figs. 2c and 4a). This means under hRH condition the aerosol in the PBL significantly enhanced the capacity for water uptake and the deliquesce process in the vertical direction, and thus it provides a more reactive surface for aerosol to enhance the condensation and aqueous reaction.
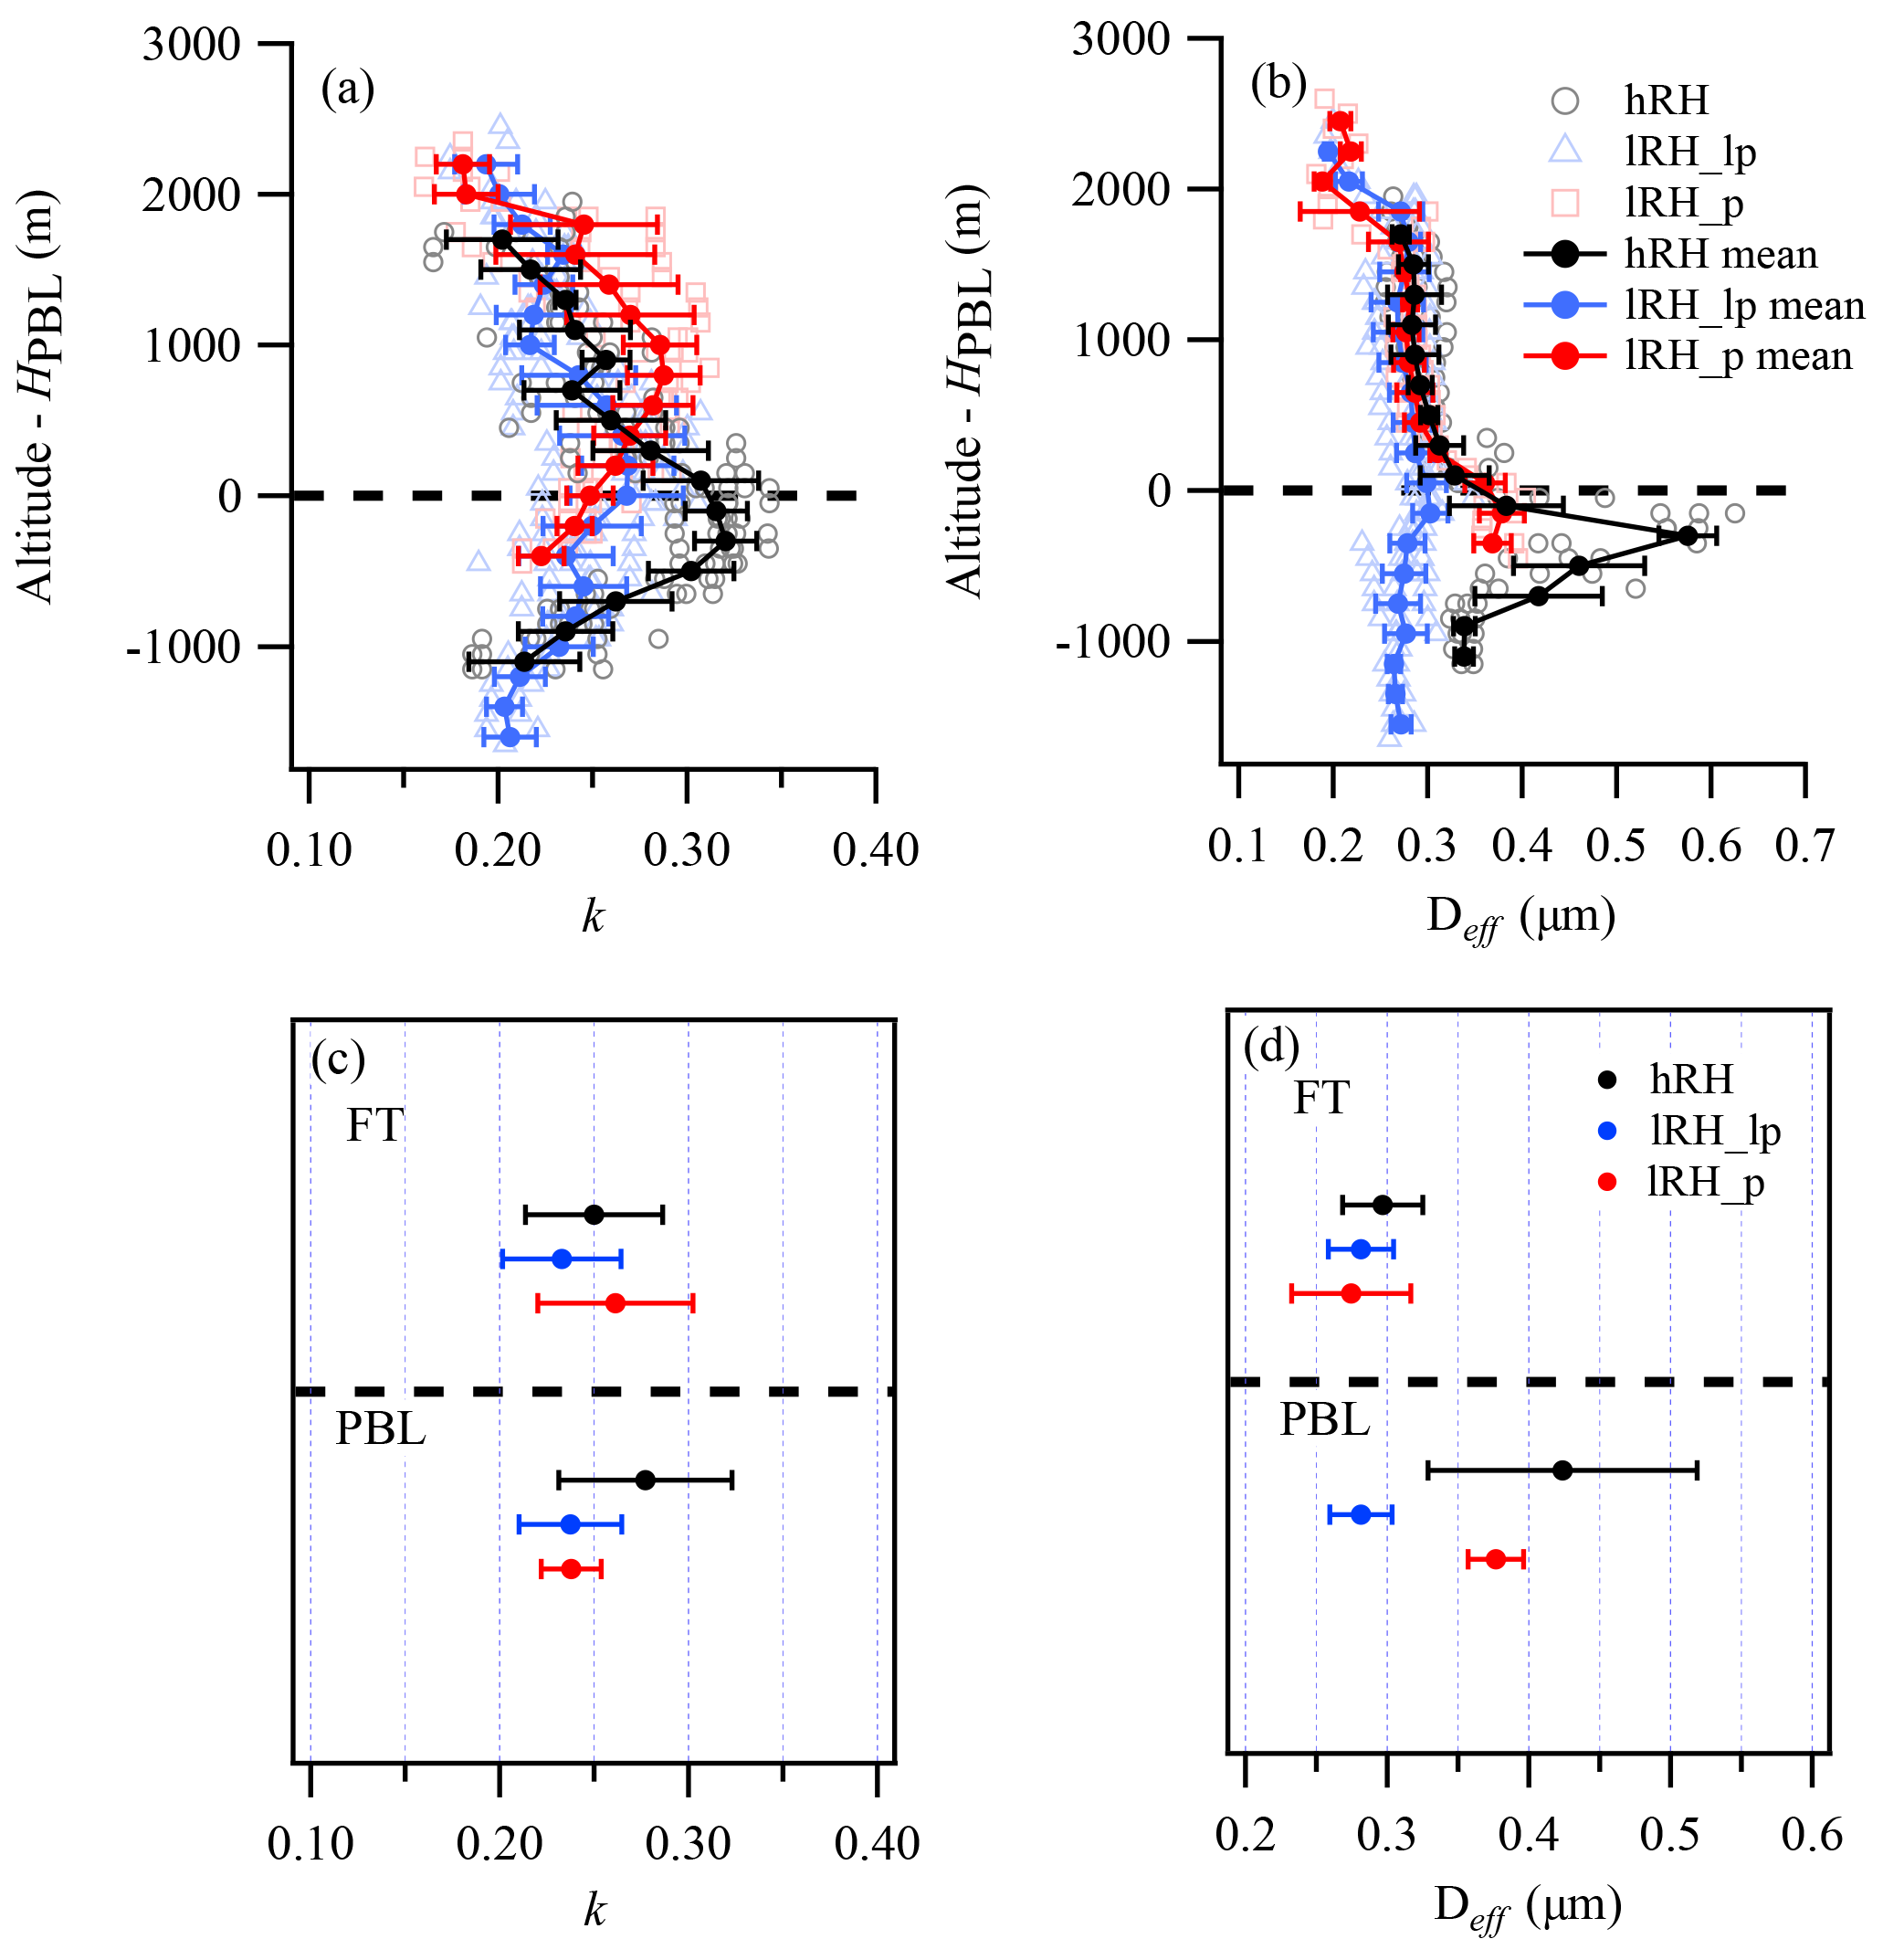
Figure 4Vertical profiles of (a) hygroscopic parameter κ, (b) effective diameter Deff of dry particle, and (c–d) mean ±σ in the LFT and PBL corresponding to the upper panels. Blue, red, and black represent low RH and the less polluted condition (lRH_lp), low RH and the polluted condition (lRH_p), and the high RH condition (hRH), respectively.
The κ increased with altitude in the PBL and showed a maximum at the top of the PBL, decreasing then with altitude in the LFT. κ showed a higher value above the PBL under lRH polluted condition compared to the others at the same height. Back-trajectory analysis (Fig. S5) showed that these aerosols advected by regional transport from the polluted southern region (Liu et al., 2018a; Tian et al., 2019) may have already been aged and hygroscopic. The Deff showed large variations in the PBL and depended on the pollution level and RH. In line with the κ, the high RH condition also showed a remarkable enhancement of Deff from the surface to the top of the PBL by 71 %, while under lRH the Deff had almost no vertical variation and larger Deff was shown under higher pollution. The Deff was consistently at 0.25–0.32 µm in the LFT for all conditions (Fig. 4b).
Figure 4c and d summarize the κ and Deff in the PBL and LFT, respectively, under the three types of environments. In the PBL, κ consistency showed a value of 0.24±0.02 under different pollution levels of lRH, but Deff varied between 0.28 and 0.38 µm, respectively. However, the notable increase in both κ and Deff under hRH suggests the importance of aqueous processes for modifying both the particle size and chemical compositions (Qiang et al., 2015; Sun et al., 2016), particularly at the top of the PBL (Liu et al., 2018b). The particles in the LFT showed κ between 0.23 and 0.26 but a consistently smaller particle size at Deff=0.27–0.30 µm, which may result from a lack of gas-precursors at upper level not allowing particle growth.
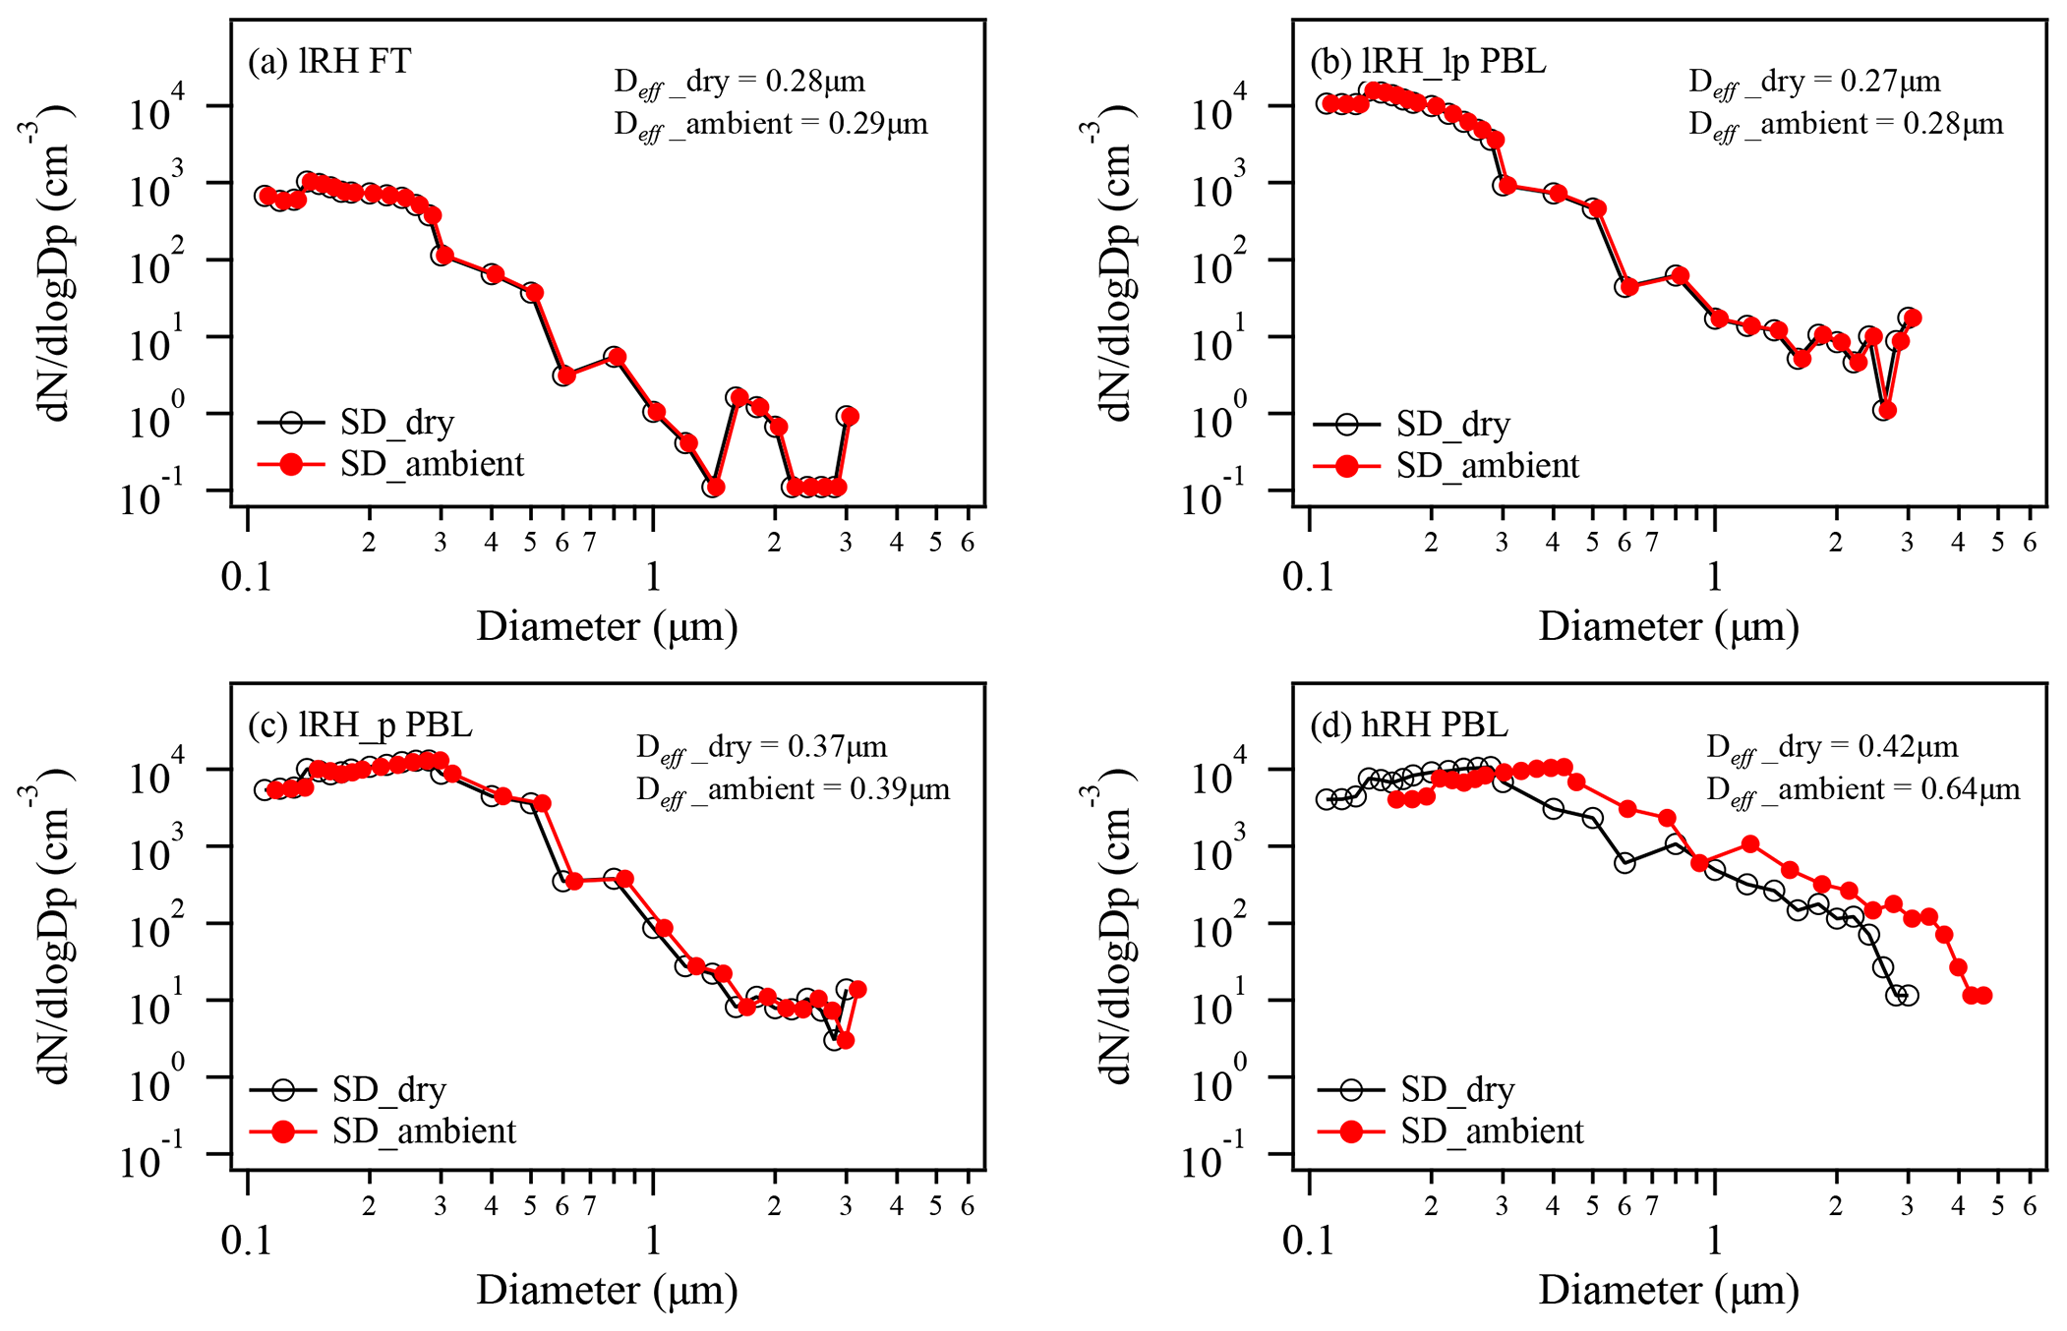
Figure 5Measured dry size distribution and estimated ambient size distribution by considering the hygroscopic growth of aerosol for (a) lower free troposphere under low RH (lRH FT), (b) PBL under low RH and less polluted condition (lRH_lp PBL), (c) PBL in the polluted but low RH condition (lRH_p PBL), and (d) PBL under high RH condition (hRH PBL).
3.4 Dry and ambient size distribution
Combing the measured size distribution and hygroscopicity information, the aerosol size distribution under both dry and ambient conditions can be obtained. Figure 5 shows the typical examples of aerosol dry and ambient size distribution under different conditions. The hygroscopic growth factor (HGF) of particles in the ambient condition is determined by RH and hygroscopic parameter κ. As Fig. S3 shows, the HGF at a diameter of 200 nm exponentially increased with ambient RH, and at higher κ this increase had a higher offset. When RH < 60 %, the HGF only slightly increased with RH; however, HGF exponentially increased with RH at higher RH, e.g., from RH 80 % to 95 %, HGF increased from 1.2 to 2.1 by a factor of 1.8. Hygroscopicity also exerts more significant impacts on HGF under hRH conditions. As discussed in Sect. 3.3, hRH condition has increased both particle dry size and particle hygroscopicity, whereby the hygroscopic growth could further enlarge particle size under high RH. This is demonstrated in Fig. 5d, where a remarkable growth of aerosol size occurred in the hRH PBL with a mean HGF of ∼1.6 (Fig. 5d). The mean HGF for lRH was at 1.04±0.02, thus showing little difference between dry and ambient size distribution under lRH condition due to lack of moisture for hygroscopic growth (Fig. 5a–c).
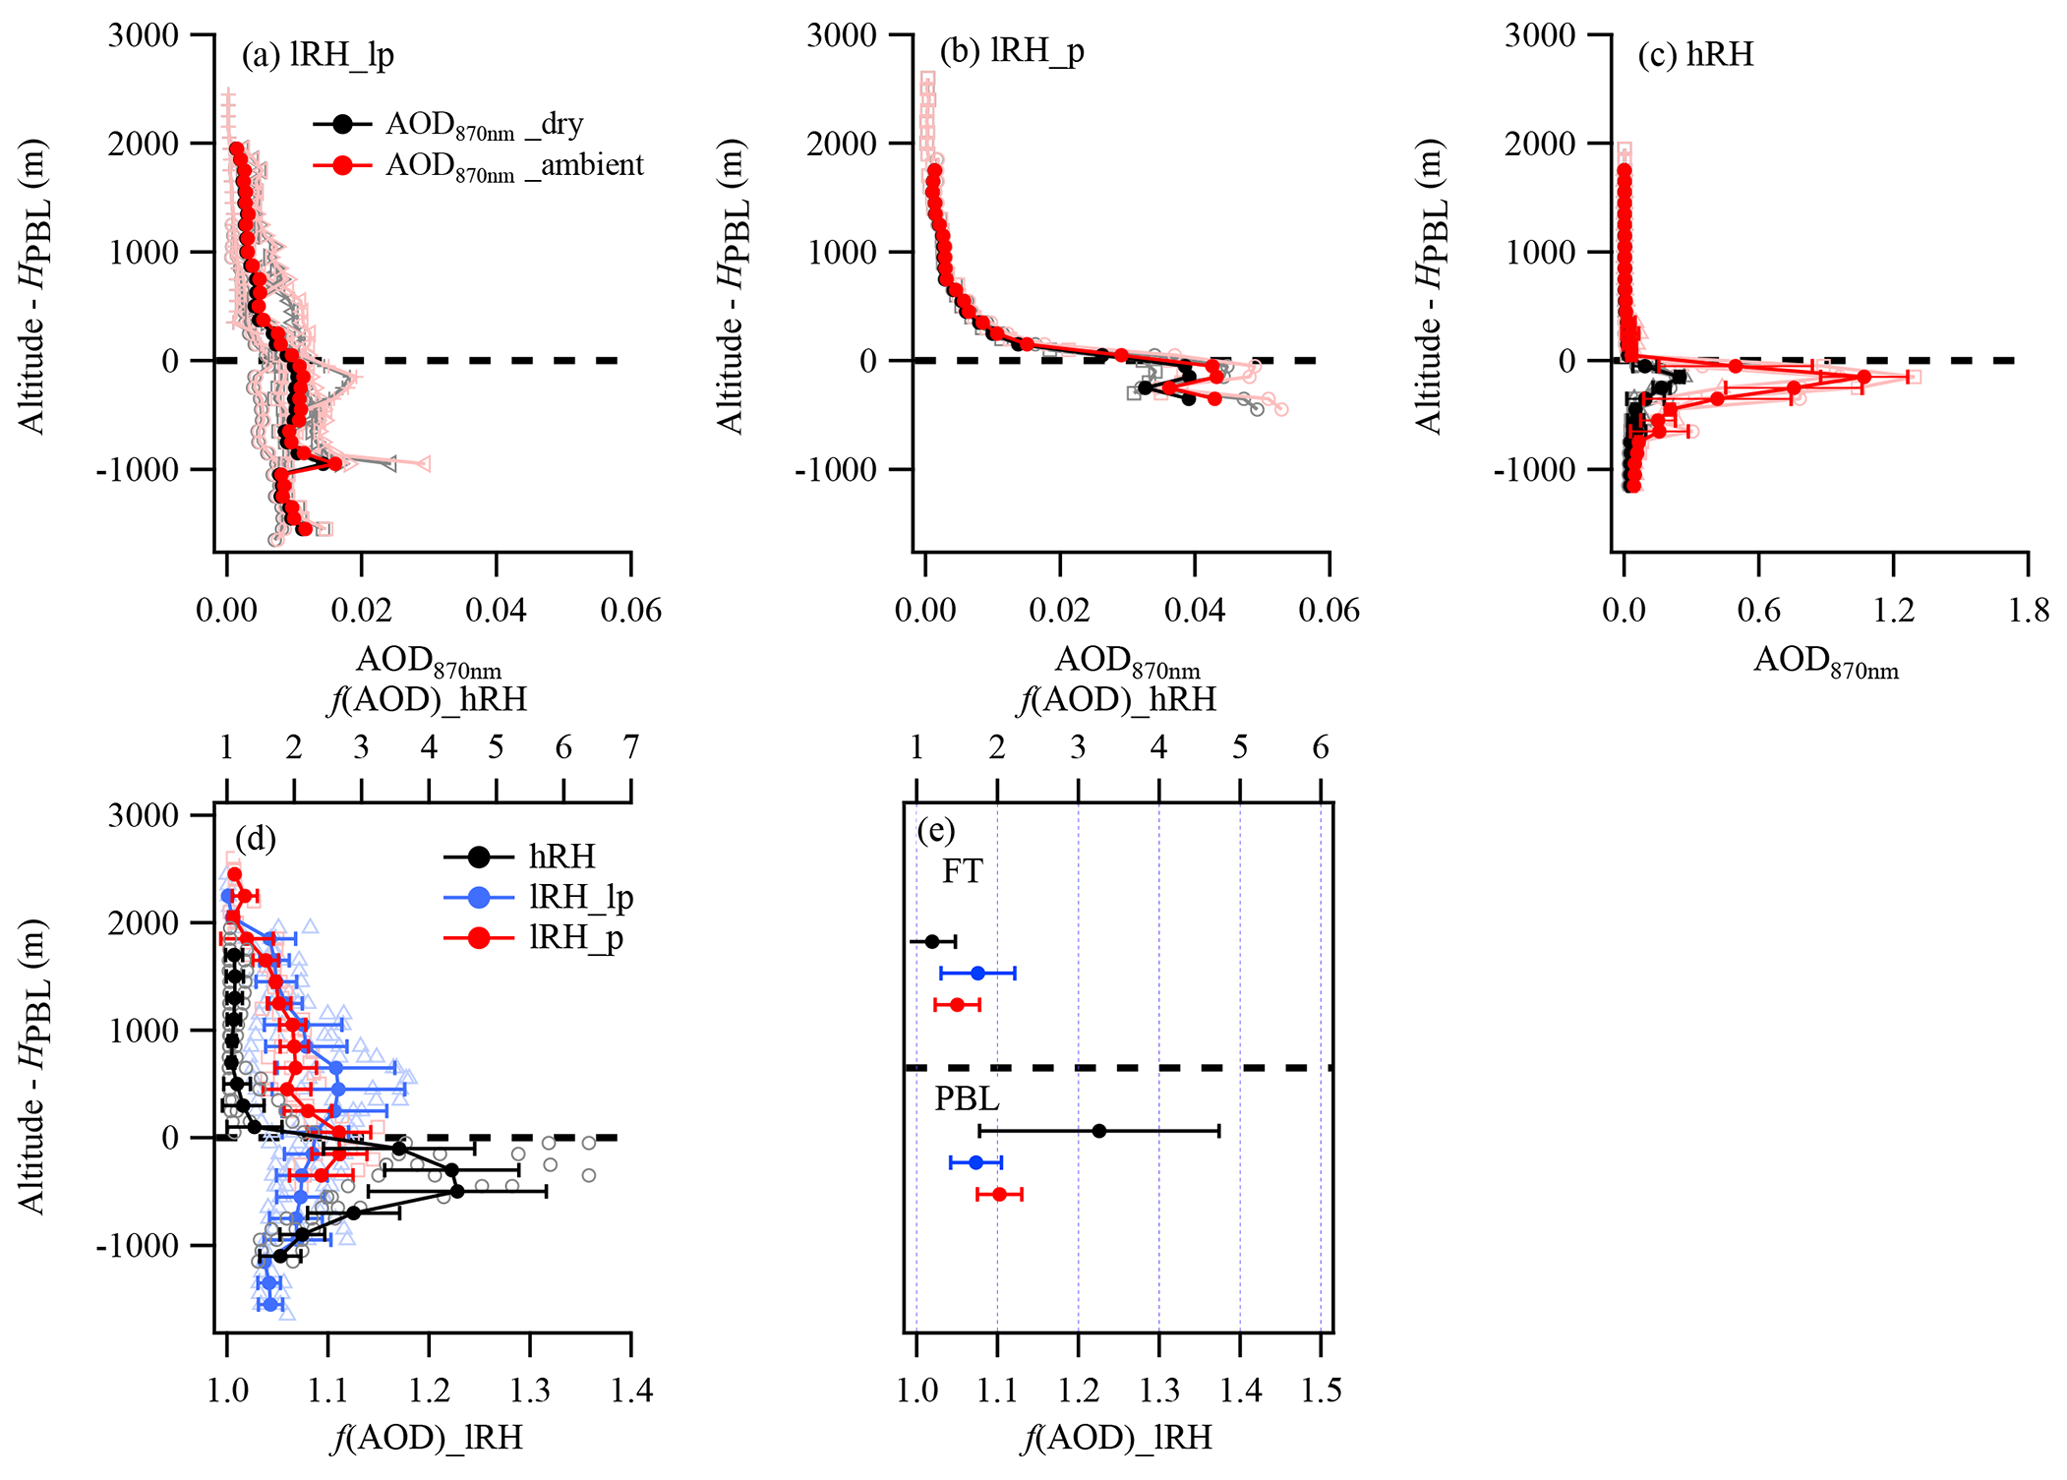
Figure 6Vertical profiles of AOD under lRH and hRH conditions; (a) low RH and less polluted condition (lRH_lp), (b) low RH and polluted condition (lRH_p), and (c) high RH condition (hRH). The gray and light red lines indicate the AOD for dry and ambient RH conditions, respectively; (c–d) vertical profiles of f(AOD) (the ratio of calculated ambient AOD and dry AOD) and corresponding mean ±σ in the FT and PBL. Note that the f(AOD) for hRH uses the top x axis.
3.5 Vertical profiles of particle dry and ambient AOD
The aerosol optical depth is derived from the dry and ambient size distributions. Figure 6 shows vertical profiles of dry and ambient AOD with a height interval of 100 m (AOD100 m) under lRH and hRH conditions. For lRH less polluted (lRH_lp) periods (Fig. 6a), the AOD was less than 0.02 throughout the column and showed insignificant vertical gradient, with AOD in the PBL slightly higher than that in the LFT. The AOD of the PBL for the lRH polluted period (lRH_p) could reach up to 0.040 and 0.043 for dry and ambient conditions, respectively. Over 70 % of the integrated AOD was concentrated within the shallow PBL, and AOD above the PBL exponentially decreased with altitude (Fig. 6b), where the difference between dry and ambient conditions was larger than lRH_lp. Consistent with the variation of κ and particle size, AOD under high RH condition showed remarkable enhancement close to the top of the PBL (Fig. 6c), with dry and ambient AOD reaching up to 0.25 and 1.07, respectively.
The f(AOD) is hereby defined as the ratio of AOD100 m between ambient and dry conditions to reflect the influence of hygroscopic growth on particle extinction. The vertical profiles are shown in Fig. 6d, with the mean ±σ in the PBL and LFT shown in Fig. 6e. During the observations, f(AOD) in the PBL increased with altitude at 0.03, 0.09, 2.43 per km elevation under lRH_lp, lRH_p, and hRH conditions, respectively. The f(AOD) is found to range from 1.0 to 1.2 for the PBL under lRH and LFT at all conditions, but it could reach as high as 4.4±1.3 in the PBL under hRH. f(AOD) is determined by combined factors of aerosol size, hygroscopicity, and RH. The RH increased with altitude in the PBL under hRH conditions and deceased above the PBL (Fig. 2c). The moisture trapped in the PBL enhanced the secondary aerosol formation through heterogeneous aqueous reactions, as reflected by the enhanced fraction of secondary inorganic and secondary organic components (Fig. 3j) and increased hygroscopicity from surface to the top of the PBL (Fig. 4a). This is also consistent with the dry particle size (Fig. 4b), and the correlation between Deff (in the dry condition) and RH is shown in Fig. S4. When RH < 60 %, the Deff has no obvious correlation with RH, but it significantly increased with RH when RH > 60 %. This is in line with the increased contribution of secondary species under hRH condition. Consistent with the RH profile, both the peak Deff and peak κ appeared at the top of the PBL (Fig. 4a and b), but all decreased above the PBL (apart from for the polluted lRH profiles, there was an elevated κ at higher altitude). This vertical structure was caused by a combination of the convective mixing in the PBL and a capping effect by the temperature inversion on top of the PBL. The gas, particles, and moisture were trapped in the PBL where an intense deliquesce process and heterogenous aqueous reactions occurred, enlarging particle size and increasing particle hygroscopicity. These processes further led to peak f(AOD) appearing at the top of the PBL (Fig. 6d). Further back-trajectory analysis showed that for the polluted lRH profiles (e.g., flight on 18 December), the enhanced κ at ∼1 km above the PBL was introduced by regional transport from the polluted southwest region. For these cases, the aged particles as well as the moisture were advected from outside of the Beijing area, and the aging processes as described above tended to occur in the pathway of transport rather than occurring at the local scale.
A comparison between in situ measurement-constrained AOD and AERONET AOD at λ=870 nm is presented in the Fig. 7. Under low RH condition, the in situ dry AOD has a high correlation with AERONET AOD (R2=0.94) but 35 % lower. Including the particle hygroscopic growth improves the agreement between both methods by 21 %. This suggests a 7 %–25 % of column-integrated AOD may be contributed to by water growth on particles under ambient surface RH < 60 %. Note that when ambient surface RH > 60 %, due to dramatically enhanced AOD in addition to the low-level cloud formation, the passive AERONET measurement was not available; we therefore only estimate the impacts of hygroscopic growth on AOD from our in situ measurements. As the inset of Fig. 7 shows, under hRH the AOD was enhanced by a factor of 3.7–6.6 due to water uptake.
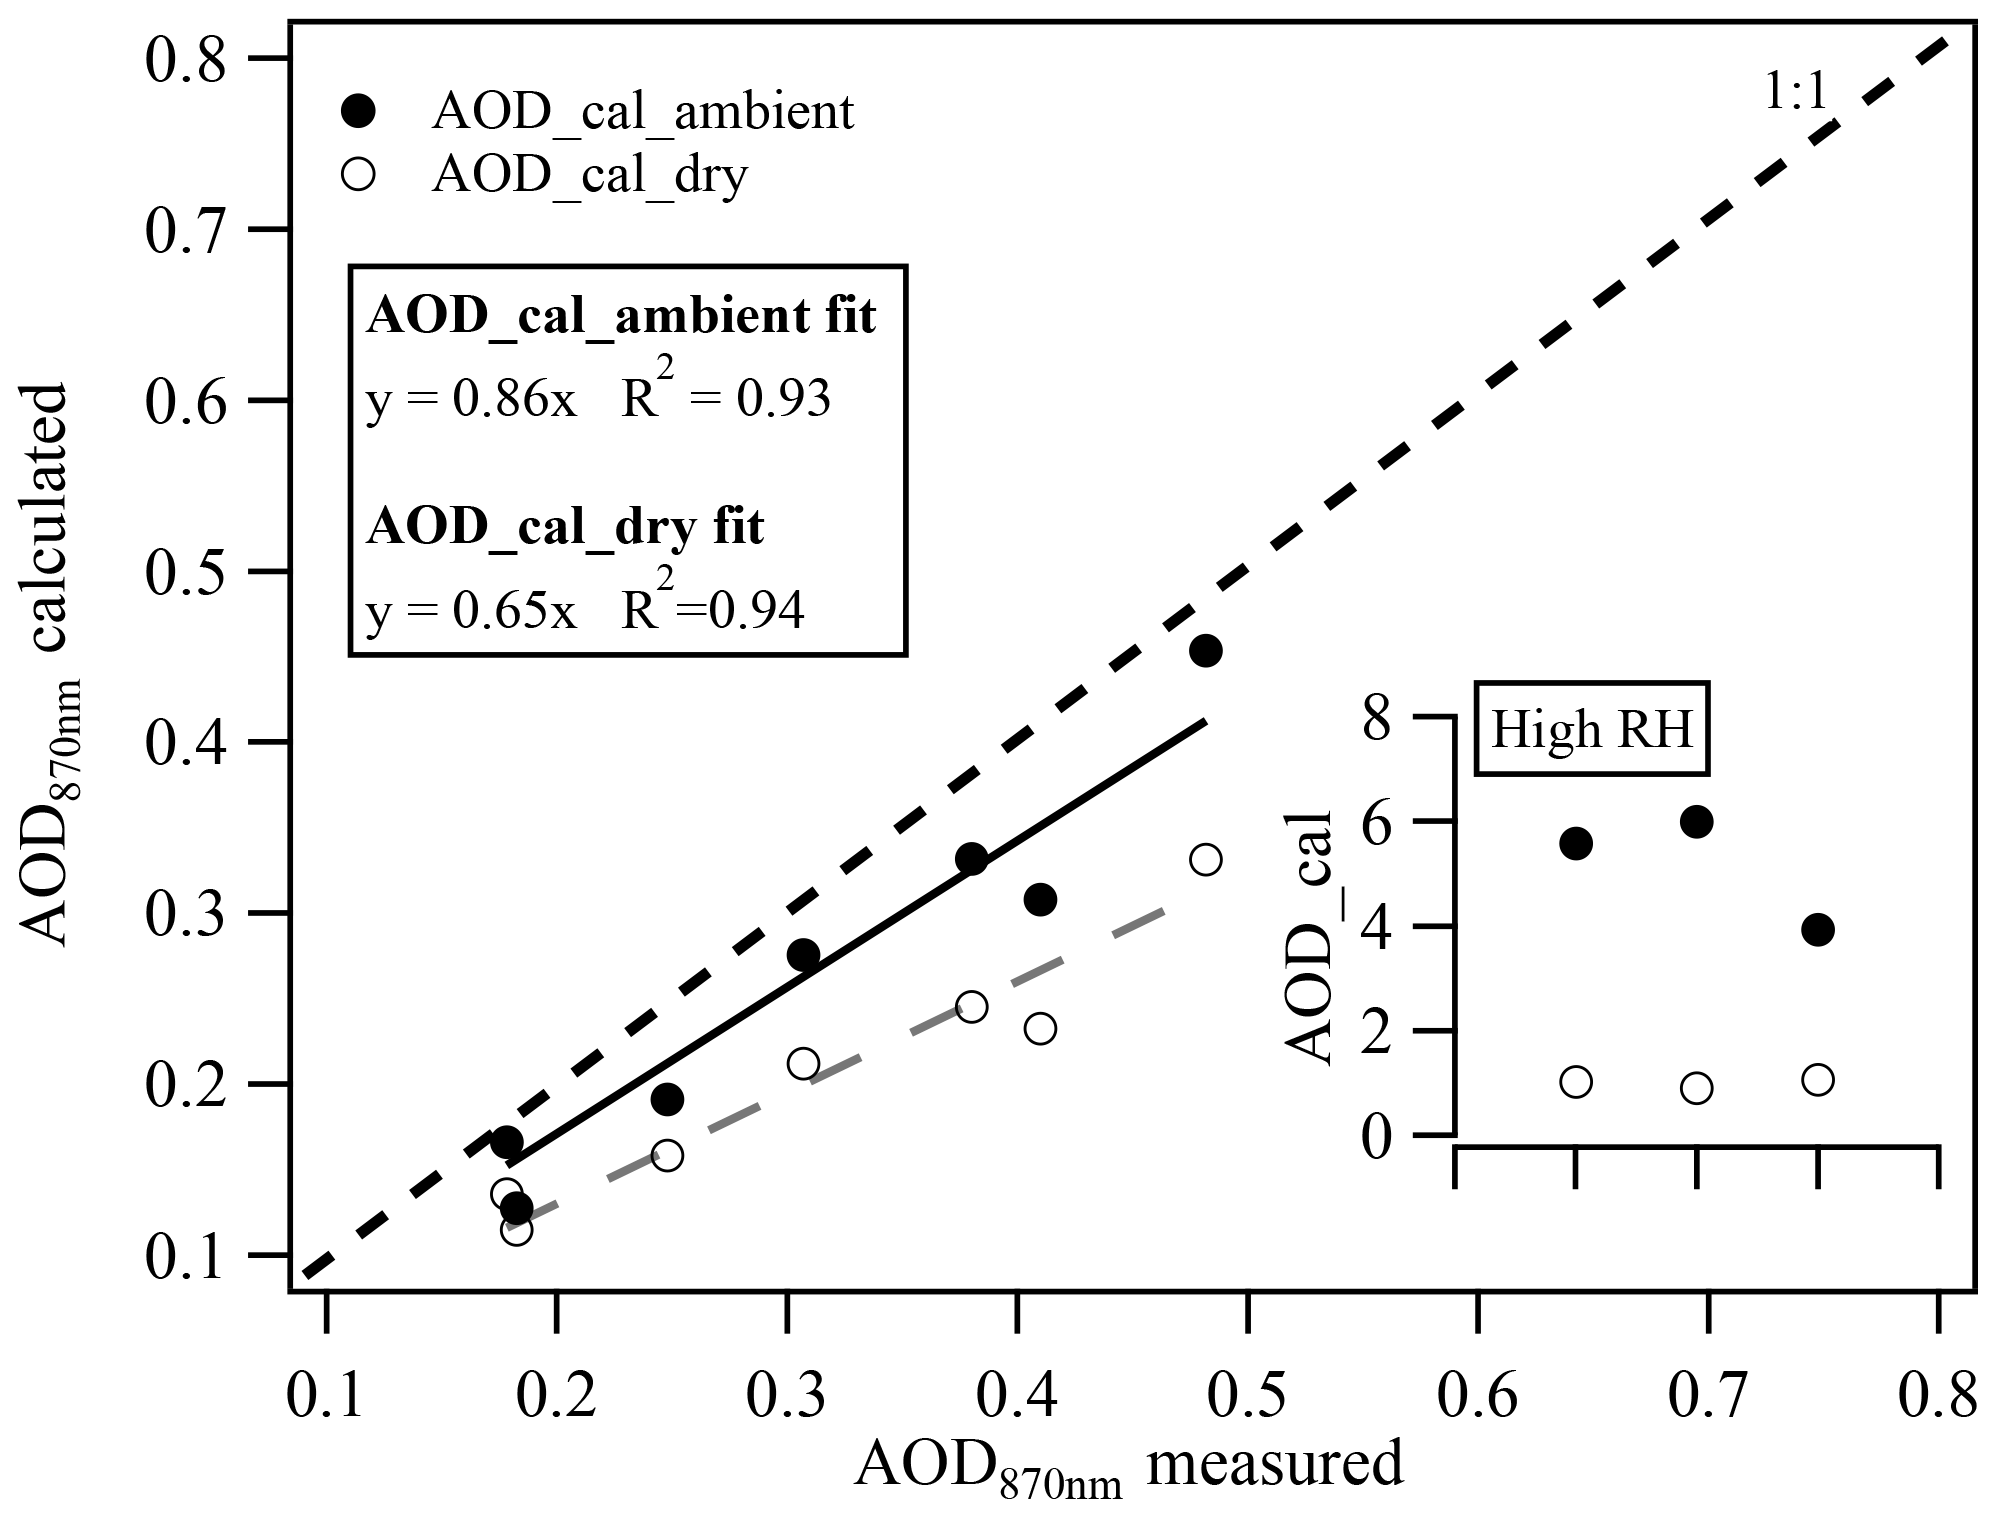
Figure 7Comparison of in situ measured dry AOD and ambient AOD at λ=870 nm with the AERONET measurement.
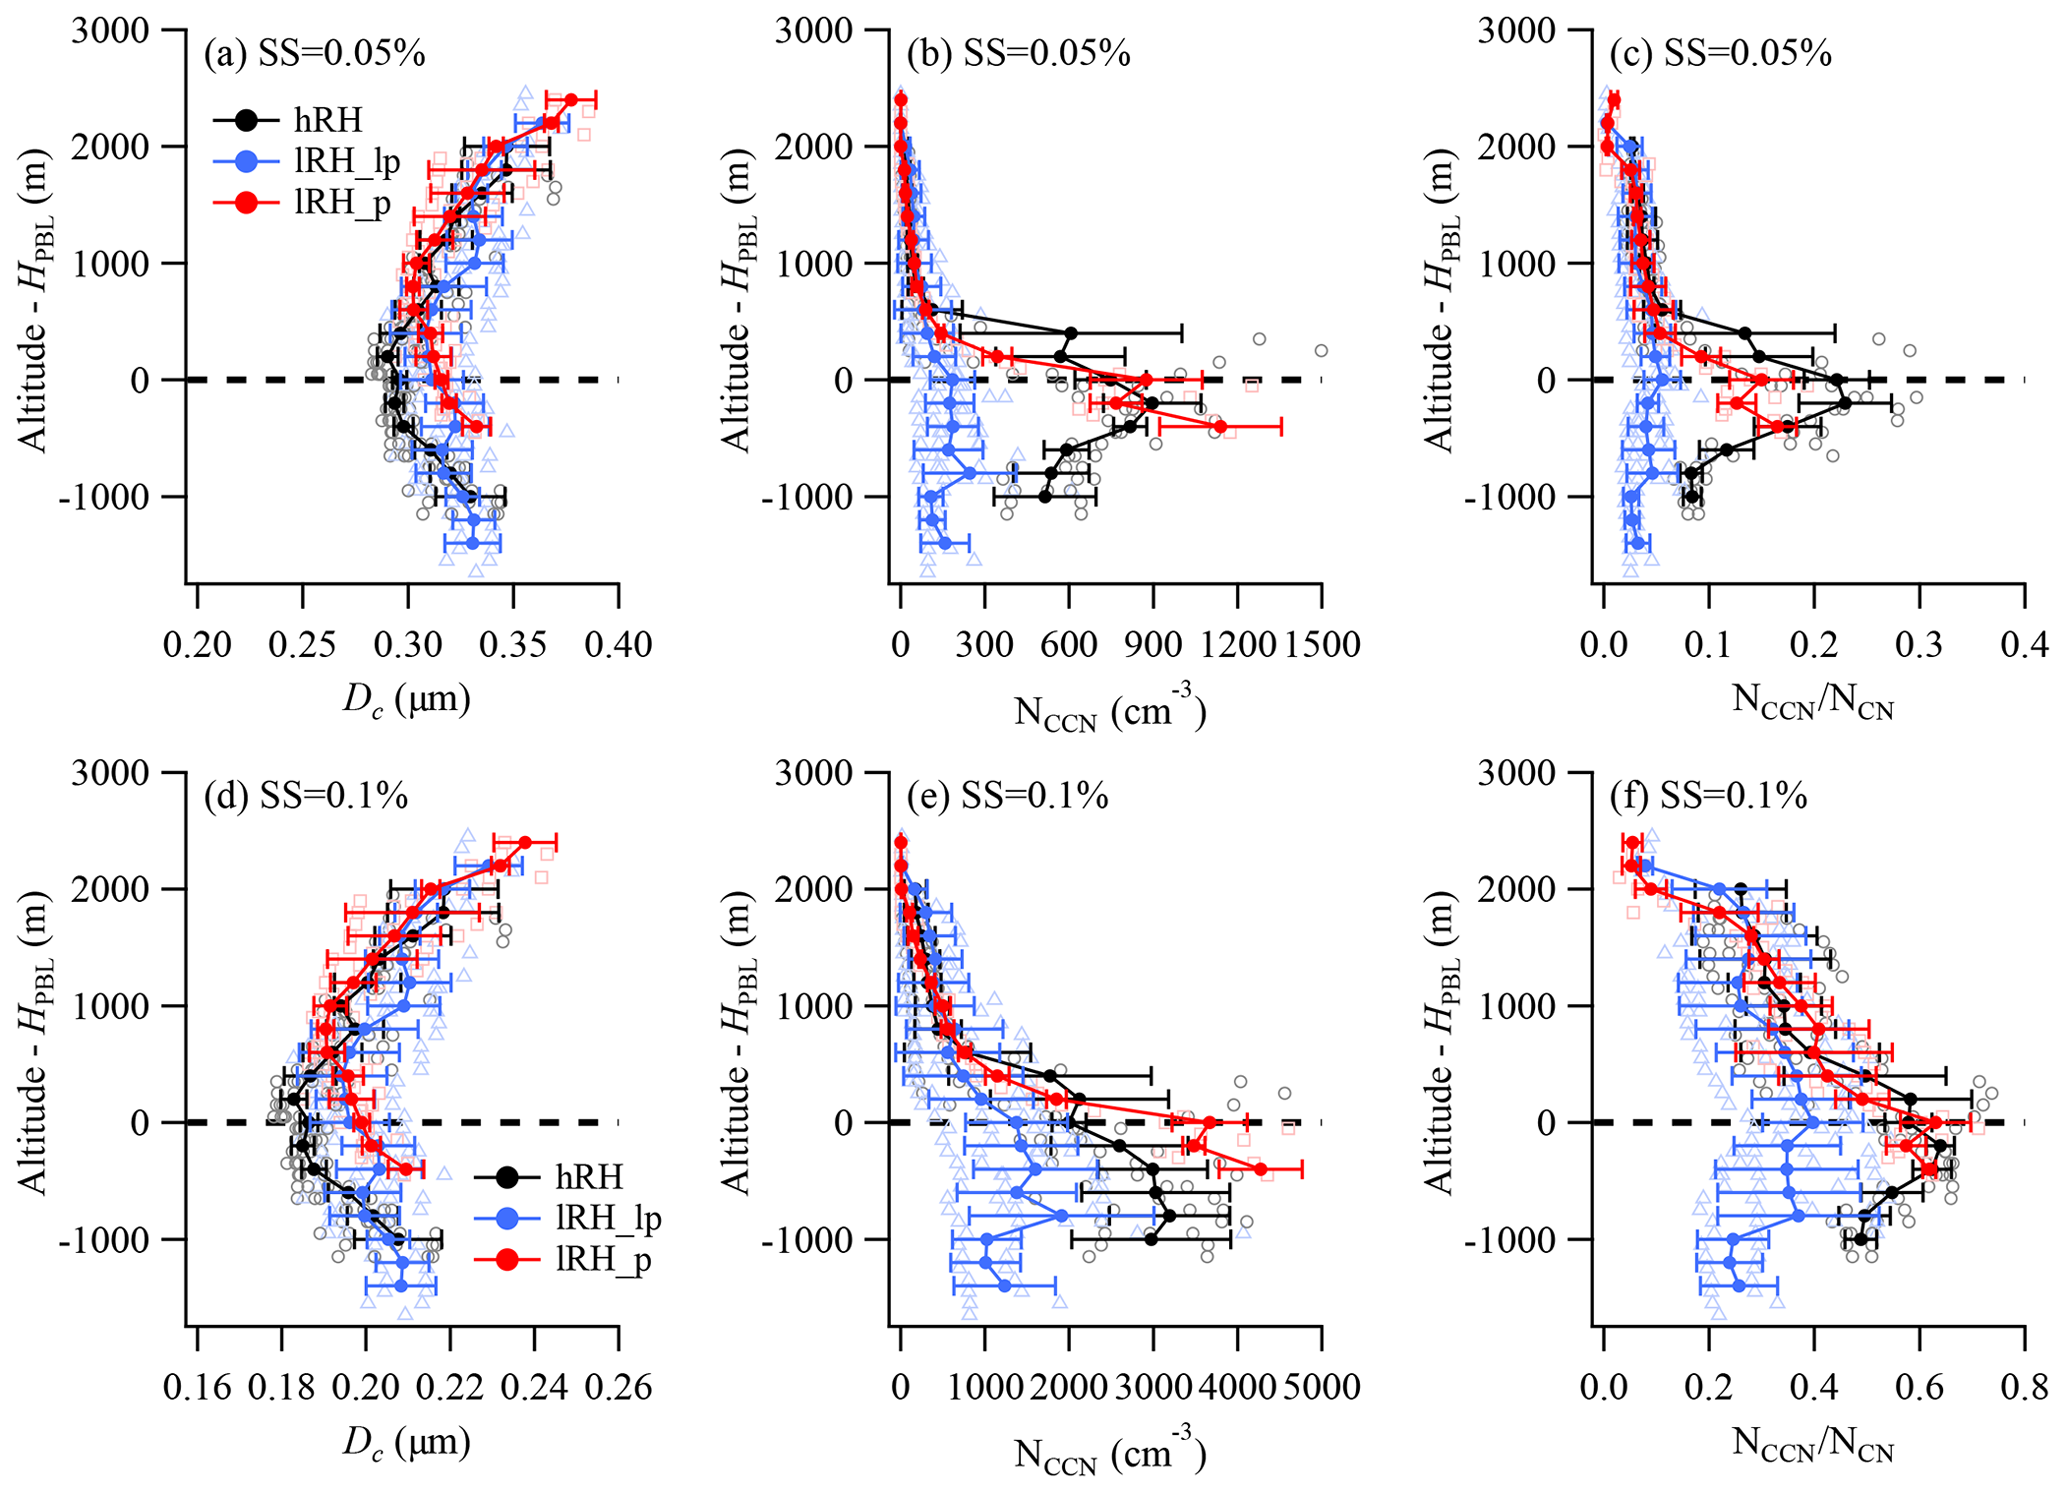
Figure 8Vertical profiles of aerosol activation properties under lRH and hRH conditions; (a–c) critical diameter (Dc), number concentration of CCN (NCCN), and the ratio of NCCN and NCN (NCCN∕NCN) at supersaturation (SS) of 0.05 %, using PCASP measured size distribution; (d–f) Dc, NCCN, and NCCN∕NCN at SS =0.1 %. The black, blue, and red lines denote the profiles under hRH, lRH_lp, and lRH_p conditions, respectively.
3.6 Vertical profile of CCN activity
The critical diameter Dc is the diameter above which the particles are considered to be activated at a specific supersaturation (SS). The mean Dc is determined from the bulk κ (Petters and Kreidenweis, 2007), which is expressed as
where A is defined by Eq. (5) and Sc is the critical supersaturation.
The total aerosol number concentration (Dp=0.12–3 µm) measured by the PCASP is denoted as NCN. The CCN number concentration (NCCN) is determined by the sum of the number concentration for the particle size larger than Dc. Hereby, the CCN activation fraction (NCCN∕NCN) in the diameter range of 0.12–3 µm can be obtained at a given SS.
Previous studies estimated the SS for stratus clouds to be slightly less than 0.1 % over polluted continental regions (Hudson and Noble, 2014; Hudson et al., 2010). The North China Plain is one of the most polluted areas in China (Huang et al., 2014; Zhang et al., 2015); we thus test the CCN activity here at SS =0.05 % and 0.1 %.
Figure 8 shows that the Dc in the hRH PBL was smaller than that in the lRH PBL due to increased κ, and the vertical gradient of Dc under hRH condition was larger than that under lRH condition. Dc showed a higher variability at SS =0.05 % than at SS =0.1 % (Fig. 8a, d), ranging from 0.27–0.35 µm (SS =0.05 %) and 0.18–0.21 µm (SS =0.1 %), respectively. Corresponding to κ profiles shown in Fig. 4a, both hRH and lRH_lp profiles showed minimum Dc (at SS =0.05 %) on top of the PBL at 0.27 and 0.32 µm, respectively (Fig. 8a). The lRH_p showed elevated Dc minima at ∼1 km above the PBL. At upper level in the LFT, Dc increased with altitude for all conditions.
The NCCN showed enhanced concentration in the PBL than that of the LFT but with different vertical structures at different SS (Fig. 8b, e). The total CCN number concentration showed a notable difference between clean and polluted environment. In the PBL, the averaged CCN number concentration at SS =0.05 % was 167±44 cm−3 under the lRH_lp period, and it increased to 765±199 cm−3 under a highly polluted environment. For SS =0.1 %, the averaged CCN number concentration increased to 1370±297, 3807±415, and 2797±438 cm−3 under lRH_lp, lRH_p, and hRH conditions, respectively. This is in line with the CCN activation fraction that a positive vertical gradient of NCCN∕NCN for hRH condition peaking at the top of the PBL and shown at SS =0.05 %. But for the lRH_lp condition, the NCCN∕NCN or NCCN was more uniformly distributed in the PBL. The increase in SS enhanced the vertical gradient of NCCN∕NCN for lRH_lp. It is noted that at SS =0.05 % the potential CCN activation fraction of dry aerosol at the top of the PBL was highest for hRH (0.23±0.04) and higher than lRH_p by 53 %. The increase in SS up to 0.1 % led to a lessened difference among conditions, with lRH_p and hRH being more comparable. This suggests that the particle composition or size-dependent CCN activation ability will be more homogenously distributed at higher supersaturation conditions.
At which level the particle will be activated depends on the actual SS at different cloud levels, but the results here show that the enhanced RH will increase both dry particle size and hygroscopicity through a variety of aqueous reactions and processes (Zheng et al., 2015; Sun et al., 2016; Wang et al., 2014). The particles are thus expected to be significantly activated at a level closer to cloud base (or higher temperature) and at a much lower altitude (lowered condensation level due to increased surface RH), which will further depress the boundary layer development, thereby trapping the aerosol, gases, and moisture within a more limited atmospheric column. The aerosols at higher level, which showed a smaller size and lower hygroscopicity, would need higher SS to be activated, though these particles tend to be activated or incorporated into clouds likely by entrainment from cloud top or larger-scale cloud systems. The results here show that the surface characteristics of dry aerosols may not present the particles which initialize the cloud formation at the top of the PBL. Therefore, the process when pollutants are uplifting from the surface to the top of the PBL until the particle activation point should be considered, e.g., the enhancement of particle size and hygroscopicity with altitude in the PBL.
The vertical profiles of aerosol hygroscopic properties over the North China Plain were investigated based on the aircraft in situ measured aerosol chemical compositions. These profiles covered ambient conditions of higher surface RH (hRH, > 60 %) and lower RH (lRH, < 60 %) with less and more polluted conditions. For hRH, a significant enhancement of hygroscopicity parameter (κ) in the PBL was observed to increase by a factor of 1.9 from the surface to the top of the PBL (generally following a linear correlation with a slope of 0.13 km−1) along with the dry particle effective diameter (Deff) increase by a factor of 1.7, in contrast with a much lower vertical gradient of κ (slope =0.05 km−1) and Deff under lRH. This suggests that the aqueous reaction played an important role in promoting the enhancement of particle hygroscopicity in the hRH PBL. The κ in the LFT was relatively stable at 0.24±0.02 with a slight increase during regional transport. The contrast between hRH and lRH emphasizes the importance of moisture on modifying the aerosol compositions and hygroscopicity in the PBL.
The increase in κ was in line with the increase in particle size, and both factors contributed to the increase in particle extinction due to particle hygroscopic growth. The enhancement of aerosol optical depth (AOD) due to water uptake ranged 1.0–1.20 for the PBL under lRH and LFT, but it could reach as high as 4.4±1.3 in the PBL under hRH. The comparison of in situ constrained AOD and AERONET AOD revealed that about 80 % and 18 % of the AOD were contributed to by aerosol hygroscopic growth under hRH and lRH conditions, respectively. Importantly, the majority of enhancement in κ and extinction occurred at the top of the PBL under wet condition, leading to an enhanced positive vertical gradient of the AOD distribution. This evolution process from the surface to the top of the PBL should be considered given that the particle information on the surface may not represent that on top of the PBL where particle activation will mostly occur.
The results here show that the globally used κ=0.3 (Pringle et al., 2010) may be applied only when the anthropogenic emissions are after significant secondary processing, such as in this study κ reached 0.34 at the top of the PBL during high moisture condition or above the PBL where regional transport advected aged pollutants. The fresher emissions, or the emissions after being scavenged, showed lower κ at 0.20–0.25 as shown here. This study provides a framework for particle hygroscopicity under different pollution and moisture levels over this region that is influenced by intense anthropogenic activities. The increased κ and particle size towards the top of the PBL under high moisture condition tends to result in feedback effects, allowing enhanced water content in particles due to hygroscopic growth, and this will facilitate the aqueous reactions (Liu et al., 2018b) and lead to further radiative impacts.
Processed data are available from the file sharing link (https://pan.baidu.com/s/1P4B7Of_mbyJhBgvpD6zAMA&shfl=sharepset, last access: 23 March 2020.) using extracting code dhsq.
The supplement related to this article is available online at: https://doi.org/10.5194/acp-20-3931-2020-supplement.
QL, DL, QG, PT, FW, DZ, KB, YW, SD, KH, and JZ were involved in collecting, processing, and analysis of aircraft and ground data. QL and DL carried out the data analysis, with significant inputs from DD and CZ. QL and DL wrote the paper. QL and all authors contributed to the discussions.
The authors declare that they have no conflict of interest.
Part of this work is supported by the National Center of Meteorology, Abu Dhabi, UAE, under the UAE Research Program for Rain Enhancement Science.
This research has been supported by the National Key Research and Development Program of China (grant no. 2016YFC0203302), the National Natural Science Foundation of China (grant nos. 41975177, 41875167, 41675138, and 41875044), and the Beijing Natural Science Foundation (no. 8192021).
This paper was edited by Aijun Ding and reviewed by two anonymous referees.
Aklilu, Y., Mozurkewich, M., Prenni, A. J., Kreidenweis, S. M., Alfarra, M. R., Allan, J. D., Anlauf, K., Brook, J., Leaitch, W. R., and Sharma, S.: Hygroscopicity of particles at two rural, urban influenced sites during Pacific 2001: Comparison with estimates of water uptake from particle composition, Atmos. Environ., 40, 2650–2661, 2006.
Bahreini, R., Dunlea, E. J., Matthew, B. M., Simons, C., Docherty, K. S., DeCarlo, P. F., Jimenez, J. L., Brock, C. A., and Middlebrook, A. M.: Design and Operation of a Pressure-Controlled Inlet for Airborne Sampling with an Aerodynamic Aerosol Lens, Aerosol Sci. Tech., 42, 465–471, https://doi.org/10.1080/02786820802178514, 2008.
Bharali, C., Nair, V. S., Chutia, L., and Babu, S. S.: Modeling of the Effects of Wintertime Aerosols on Boundary Layer Properties Over the Indo Gangetic Plain, J. Geophys. Res.-Atmos., 124, 4141–4157, https://doi.org/10.1029/2018jd029758, 2019.
Canagaratna, M. R., Jayne, J. T., Jimenez, J. L., Allan, J. D., Alfarra, M. R., Zhang, Q., Onasch, T. B., Drewnick, F., Coe, H., Middlebrook, A., Delia, A., Williams, L. R., Trimborn, A. M., Northway, M. J., DeCarlo, P. F., Kolb, C. E., Davidovits, P., and Worsnop, D. R.: Chemical and microphysical characterization of ambient aerosols with the aerodyne aerosol mass spectrometer, Mass Spectrom. Rev., 26, 185–222, https://doi.org/10.1002/mas.20115, 2007.
Chang, Y. W.: Arctic Aerosol Sources and Continental Organic Aerosol Hygroscopicity, Doctoral, 2011.
Cruz, C. and Pandis, S.: Deliquescence and Hygroscopic Growth of Mixed Inorganic−Organic Atmospheric Aerosol, Environ. Sci. Technol., 34, 4313–4319, https://doi.org/10.1021/es9907109, 2000.
Chen, Y., Wild, O., Wang, Y., Ran, L., Teich, M., Größ, J., Wang, L., Spindler, G., Herrmann, H., van Pinxteren, D., McFiggans, G., and Wiedensohler, A.: The influence of impactor size cut-off shift caused by hygroscopic growth on particulate matter loading and composition measurements, Atmos. Environ., 195, 141–148, https://doi.org/10.1016/j.atmosenv.2018.09.049, 2018.
Deng, X., Wu, D., Yu, J., Lau, A. K. H., Li, F., Tan, H., Yuan, Z., Ng, W. M., Deng, T., Wu, C., and Zhou, X.: Characterization of secondary aerosol and its extinction effects on visibility over the Pearl River Delta Region, China, J. Air Waste Manage., 63, 1012–1021, https://doi.org/10.1080/10962247.2013.782927, 2013.
Ding, A. J., Huang, X., Nie, W., Sun, J. N., Kerminen, V.-M., Petäjä, T., Su, H., Cheng, Y. F., Yang, X.-Q., Wang, M. H., Chi, X. G., Wang, J. P., Virkkula, A., Guo, W. D., Yuan, J., Wang, S. Y., Zhang, R. J., Wu, Y. F., Song, Y., Zhu, T., Zilitinkevich, S., Kulmala, M., and Fu, C. B.: Enhanced haze pollution by black carbon in megacities in China, Geophys. Res. Lett., 43, 2873–2879, https://doi.org/10.1002/2016GL067745, 2016.
Drewnick, F., Hings, S. S., Decarlo, P., Jayne, J. T., Gonin, M., Fuhrer, K., Weimer, S., Jimenez, J. L., Demerjian, K. L., and Borrmann, S.: A New Time-of-Flight Aerosol Mass Spectrometer (TOF-AMS)–Instrument Description and First Field Deployment, Aerosol Sci. Tech., 39, 637–658, 2005.
Drinovec, L., Močnik, G., Zotter, P., Prévôt, A. S. H., Ruckstuhl, C., Coz, E., Rupakheti, M., Sciare, J., Müller, T., Wiedensohler, A., and Hansen, A. D. A.: The ”dual-spot” Aethalometer: an improved measurement of aerosol black carbon with real-time loading compensation, Atmos. Meas. Tech., 8, 1965–1979, https://doi.org/10.5194/amt-8-1965-2015, 2015.
Dusek, U., Frank, G., Hildebrandt, L., Curtius, J., Schneider, J., Walter, S., Chand, D., Drewnick, F., Hings, S., and Jung, D.: Size matters more than chemistry for cloud-nucleating ability of aerosol particles, Science, 312, 1375–1378, 2006.
Ge, X., Ruehl, C. R., Setyan, A., Zhang, Q., and Sun, Y.: Effect of aqueous-phase processing on aerosol chemistry and size distributions in Fresno, California, during wintertime, Environ. Chem., 9, 221–235, 2012.
Guo, S., Hu, M., Zamora, M. L., Peng, J., Shang, D., Zheng, J., Du, Z., Wu, Z., Shao, M., Zeng, L., Molina, M. J., and Zhang, R.: Elucidating severe urban haze formation in China, P. Natl. Acad. Sci. USA, 111, 17373–17378, https://doi.org/10.1073/pnas.1419604111, 2014.
Gysel, M., Crosier, J., Topping, D. O., Whitehead, J. D., Bower, K. N., Cubison, M. J., Williams, P. I., Flynn, M. J., McFiggans, G. B., and Coe, H.: Closure study between chemical composition and hygroscopic growth of aerosol particles during TORCH2, Atmos. Chem. Phys., 7, 6131–6144, https://doi.org/10.5194/acp-7-6131-2007, 2007.
Hennigan, C. J., Bergin, M. H., Dibb, J. E., and Weber, R. J.: Enhanced secondary organic aerosol formation due to water uptake by fine particles, Geophys. Res. Lett., 35, L18801, https://doi.org/10.1029/2008GL035046, 2008.
Hermann, M., Stratmann, F., Wilck, M., and Wiedensohler, A.: Sampling Characteristics of an Aircraft-Borne Aerosol Inlet System, J. Atmos. Ocean. Tech., 18, 7–19, https://doi.org/10.1175/1520-0426(2001)018<0007:scoaab>2.0.co;2, 2001.
Huang, R.-J., Zhang, Y., Bozzetti, C., Ho, K.-F., Cao, J.-J., Han, Y., Daellenbach, K. R., Slowik, J. G., Platt, S. M., Canonaco, F., Zotter, P., Wolf, R., Pieber, S. M., Bruns, E. A., Crippa, M., Ciarelli, G., Piazzalunga, A., Schwikowski, M., Abbaszade, G., Schnelle-Kreis, J., Zimmermann, R., An, Z., Szidat, S., Baltensperger, U., Haddad, I. E., and Prevot, A. S. H.: High secondary aerosol contribution to particulate pollution during haze events in China, Nature, 514, 218–222, https://doi.org/10.1038/nature13774, 2014.
Hudson, J., Noble, S., and Jha, V.: Stratus cloud supersaturations, Geophys. Res. Lett., 37, L21813, https://doi.org/10.1029/2010GL045197, 2010.
Hudson, J. G. and Noble, S.: CCN and Vertical Velocity Influences on Droplet Concentrations and Supersaturations in Clean and Polluted Stratus Clouds, J. Atmos. Sci., 71, 312–331, https://doi.org/10.1175/jas-d-13-086.1, 2014.
Irwin, M., Robinson, N., Allan, J. D., Coe, H., and McFiggans, G.: Size-resolved aerosol water uptake and cloud condensation nuclei measurements as measured above a Southeast Asian rainforest during OP3, Atmos. Chem. Phys., 11, 11157–11174, https://doi.org/10.5194/acp-11-11157-2011, 2011.
Khlystov, A.: Water content of ambient aerosol during the Pittsburgh Air Quality Study, J. Geophys. Res., 110, D07S10, https://doi.org/10.1029/2004jd004651, 2005.
Khlystov, A., Zhang, Q., Jimenez, J. L., Stanier, C., Pandis, S. N., Canagaratna, M. R., Fine, P., Misra, C., and Sioutas, C.: In situ concentration of semi-volatile aerosol using water-condensation technology, J. Aerosol Sci., 36, 866–880, https://doi.org/10.1016/j.jaerosci.2004.11.005, 2005.
Köhler, H.: The nucleus in and the growth of hygroscopic droplets, T. Faraday Soc., 32, 1152–1161, https://doi.org/10.1039/TF9363201152, 1936.
Kolb, C. E., Davidovits, P., Jayne, J. T., Shi, Q., and Worsnop, D. R.: Kinetics of trace gas uptake by liquid surfaces, Progress in Reaction Kinetics & Mechanism, 27, 2002.
Liu, H. J., Zhao, C. S., Nekat, B., Ma, N., Wiedensohler, A., van Pinxteren, D., Spindler, G., Müller, K., and Herrmann, H.: Aerosol hygroscopicity derived from size-segregated chemical composition and its parameterization in the North China Plain, Atmos. Chem. Phys., 14, 2525–2539, https://doi.org/10.5194/acp-14-2525-2014, 2014.
Liu, P., Zhao, C., Zhang, Q., Deng, Z., Huang, M., Xincheng, M. A., and Tie, X.: Aircraft study of aerosol vertical distributions over Beijing and their optical properties, Tellus B, 61, 756–767, 2009.
Liu, Q., Ding, D., Huang, M., Tian, P., Zhao, D., Wang, F., Li, X., Bi, K., Sheng, J., Zhou, W., Liu, D., Huang, R., and Zhao, C.: A study of elevated pollution layer over the North China Plain using aircraft measurements, Atmos. Environ., 190, 188–194, https://doi.org/10.1016/j.atmosenv.2018.07.024, 2018a.
Liu, Q., Jia, X., Quan, J., Li, J., Li, X., Wu, Y., Chen, D., Wang, Z., and Liu, Y.: New positive feedback mechanism between boundary layer meteorology and secondary aerosol formation during severe haze events, Sci. Rep.-UK, 8, 6095, https://doi.org/10.1038/s41598-018-24366-3, 2018b.
Liu, X., Gu, J., Li, Y., Cheng, Y., Yu, Q., Han, T., Wang, J., Tian, H., Jing, C., and Zhang, Y.: Increase of aerosol scattering by hygroscopic growth: Observation, modeling, and implications on visibility, Atmos. Res., 132–133, 91–101, 2013.
Massoli, P., Bates, T. S., Quinn, P. K., Lack, D. A., and Williams, E. J.: Aerosol optical and hygroscopic properties during TexAQS-GoMACCS 2006 and their impact on aerosol direct radiative forcing, J. Geophys. Res.-Atmos., 114, D00F07, https://doi.org/10.1029/2008JD011604, 2009.
Matthew, B. M., Middlebrook, A. M., and Onasch, T. B.: Collection Efficiencies in an Aerodyne Aerosol Mass Spectrometer as a Function of Particle Phase for Laboratory Generated Aerosols, Aerosol Sci. Tech., 42, 884–898, 2008.
Meng, J. W., Yeung, M. C., Li, Y. J., Lee, B. Y. L., and Chan, C. K.: Size-resolved cloud condensation nuclei (CCN) activity and closure analysis at the HKUST Supersite in Hong Kong, Atmos. Chem. Phys., 14, 10267–10282, https://doi.org/10.5194/acp-14-10267-2014, 2014.
Middlebrook, A. M., Bahreini, R., Jimenez, J. L., and Canagaratna, M. R.: Evaluation of Composition-Dependent Collection Efficiencies for the Aerodyne Aerosol Mass Spectrometer using Field Data, Aerosol Sci. Tech., 46, 258–271, https://doi.org/10.1080/02786826.2011.620041, 2012.
Morgan, W. T., Allan, J. D., Bower, K. N., Esselborn, M., Harris, B., Henzing, J. S., Highwood, E. J., Kiendler-Scharr, A., McMeeking, G. R., Mensah, A. A., Northway, M. J., Osborne, S., Williams, P. I., Krejci, R., and Coe, H.: Enhancement of the aerosol direct radiative effect by semi-volatile aerosol components: airborne measurements in North-Western Europe, Atmos. Chem. Phys., 10, 8151–8171, https://doi.org/10.5194/acp-10-8151-2010, 2010.
Pankow, J. F., Storey, J. M. E., and Yamasaki, H.: Effects of relative humidity on gas/particle partitioning of semivolatile organic compounds to urban particulate matter, Environ. Sci. Technol., 27, 2220–2226, 1993.
Petters, M. D. and Kreidenweis, S. M.: A single parameter representation of hygroscopic growth and cloud condensation nucleus activity, Atmos. Chem. Phys., 7, 1961–1971, https://doi.org/10.5194/acp-7-1961-2007, 2007.
Petters, M. D. and Kreidenweis, S. M.: A single parameter representation of hygroscopic growth and cloud condensation nucleus activity – Part 2: Including solubility, Atmos. Chem. Phys., 8, 6273–6279, https://doi.org/10.5194/acp-8-6273-2008, 2008.
Prenni, A.: Water uptake of internally mixed particles containing ammonium sulfate and dicarboxylic acids, Atmos. Environ., 37, 4243–4251, https://doi.org/10.1016/s1352-2310(03)00559-4, 2003.
Pringle, K. J., Tost, H., Pozzer, A., Pöschl, U., and Lelieveld, J.: Global distribution of the effective aerosol hygroscopicity parameter for CCN activation, Atmos. Chem. Phys., 10, 5241–5255, https://doi.org/10.5194/acp-10-5241-2010, 2010.
Qiang, Z., Jiannong, Q., Xuexi, T., Xia, L., Quan, L., Yang, G., and Delong, Z.: Effects of meteorology and secondary particle formation on visibility during heavy haze events in Beijing, China, Sci. Total Environ., 502, 578–584, 2015.
Quan, J., Tie, X., Qiang, Z., Quan, L., Xia, L., Yang, G., and Zhao, D.: Characteristics of heavy aerosol pollution during the 2012–2013 winter in Beijing, China, Atmos. Environ., 88, 83–89, 2014.
Saxena, P., Hildemann, L. M., Mcmurry, P. H., and Seinfeld, J. H.: Organics Alter Hygroscopic Behavior of Atmospheric Particles, J. Geophys. Res.-Atmos., 100, 18755–18770, 1995.
Stokes, R. H. and Robinson, R. A.: Interactions in Aqueous Nonelectrolyte Solutions. I. Solute-Solvent Equilibria, J. Phys. Chem., 70, 2126–2131, https://doi.org/10.1021/j100879a010, 1966.
Su, T., Li, J., Li, C., Xiang, P., Lau, A. K.-H., Guo, J., Yang, D., and Miao, Y.: An intercomparison of long-term planetary boundary layer heights retrieved from CALIPSO, ground-based lidar, and radiosonde measurements over Hong Kong, J. Geophys. Res.-Atmos., 122, 3929–3943, https://doi.org/10.1002/2016jd025937, 2017.
Sun, Y., Chen, C., Zhang, Y., Xu, W., Zhou, L., Cheng, X., Zheng, H., Ji, D., Li, J., Tang, X., Fu, P., and Wang, Z.: Rapid formation and evolution of an extreme haze episode in Northern China during winter 2015, Sci. Rep., 6, 27151, https://doi.org/10.1038/srep27151, 2016.
Tian, P., Liu, D., Huang, M., Liu, Q., Zhao, D., Ran, L., Deng, Z., Wu, Y., Fu, S., Bi, K., Gao, Q., He, H., Xue, H., and Ding, D.: The evolution of an aerosol event observed from aircraft in Beijing: An insight into regional pollution transport, Atmos. Environ., 206, 11–20, https://doi.org/10.1016/j.atmosenv.2019.02.005, 2019.
Tritscher, T., Dommen, J., DeCarlo, P. F., Gysel, M., Barmet, P. B., Praplan, A. P., Weingartner, E., Prévôt, A. S. H., Riipinen, I., Donahue, N. M., and Baltensperger, U.: Volatility and hygroscopicity of aging secondary organic aerosol in a smog chamber, Atmos. Chem. Phys., 11, 11477–11496, https://doi.org/10.5194/acp-11-11477-2011, 2011.
Ulbrich, I. M., Canagaratna, M. R., Zhang, Q., Worsnop, D. R., and Jimenez, J. L.: Interpretation of organic components from Positive Matrix Factorization of aerosol mass spectrometric data, Atmos. Chem. Phys., 9, 2891–2918, https://doi.org/10.5194/acp-9-2891-2009, 2009.
Strapp, J. W., R. Leaitch, W., and Liu, P.: Hydrated and Dried Aerosol-Size-Distribution Measurements from the Particle Measuring Systems FSSP-300 Probe and the Deiced PCASP-100X Probe, 548–555, 1992.
Wang, J., Lee, Y.-N., Daum, P. H., Jayne, J., and Alexander, M. L.: Effects of aerosol organics on cloud condensation nucleus (CCN) concentration and first indirect aerosol effect, Atmos. Chem. Phys., 8, 6325–6339, https://doi.org/10.5194/acp-8-6325-2008, 2008.
Wang, Y. and Chen, Y.: Significant Climate Impact of Highly Hygroscopic Atmospheric Aerosols in Delhi, India, Geophys. Res. Lett., 46, 5535–5545, https://doi.org/10.1029/2019gl082339, 2019.
Wang, Y. S., Yao, L., Wang, L. L., Liu, Z. R., Ji, D. S., Tang, G. Q., Zhang, J. K., Sun, Y., Hu, B., and Xin, J. Y.: Mechanism for the formation of the January 2013 heavy haze pollution episode over central and eastern China, Sci. China Earth Sci., 57, 14–25, 2014.
Wen, Y.: Improved recursive algorithm for light scattering by a multilayered sphere, Appl. Optics, 42, 1710–1720, 2003.
Wu, Z. J., Zheng, J., Shang, D. J., Du, Z. F., Wu, Y. S., Zeng, L. M., Wiedensohler, A., and Hu, M.: Particle hygroscopicity and its link to chemical composition in the urban atmosphere of Beijing, China, during summertime, Atmos. Chem. Phys., 16, 1123–1138, https://doi.org/10.5194/acp-16-1123-2016, 2016.
Zhang, Q., Jimenez, J. L., Canagaratna, M. R., Allan, J. D., Coe, H., Ulbrich, I., Alfarra, M. R., Takami, A., Middlebrook, A. M., Sun, Y. L., Dzepina, K., Dunlea, E., Docherty, K., DeCarlo, P. F., Salcedo, D., Onasch, T., Jayne, J. T., Miyoshi, T., Shimono, A., Hatakeyama, S., Takegawa, N., Kondo, Y., Schneider, J., Drewnick, F., Borrmann, S., Weimer, S., Demerjian, K., Williams, P., Bower, K., Bahreini, R., Cottrell, L., Griffin, R. J., Rautiainen, J., Sun, J. Y., Zhang, Y. M., and Worsnop, D. R.: Ubiquity and dominance of oxygenated species in organic aerosols in anthropogenically-influenced Northern Hemisphere midlatitudes, Geophys. Res. Lett., 34, L13801, https://doi.org/10.1029/2007gl029979, 2007.
Zhang, Q., Ma, X., Tie, X., Huang, M., and Zhao, C.: Vertical distributions of aerosols under different weather conditions: Analysis of in-situ aircraft measurements in Beijing, China, Atmos. Environ., 43, 5526–5535, https://doi.org/10.1016/j.atmosenv.2009.05.037, 2009.
Zhang, X. Y., Wang, J. Z., Wang, Y. Q., Liu, H. L., Sun, J. Y., and Zhang, Y. M.: Changes in chemical components of aerosol particles in different haze regions in China from 2006 to 2013 and contribution of meteorological factors, Atmos. Chem. Phys., 15, 12935–12952, https://doi.org/10.5194/acp-15-12935-2015, 2015.
Zhao, D., Huang, M., Tian, P., He, H., Lowe, D., Zhou, W., Sheng, J., Wang, F., Bi, K., Kong, S., Yang, Y., Liu, Q., Liu, D., and Ding, D.: Vertical characteristics of black carbon physical properties over Beijing region in warm and cold seasons, Atmos. Environ., 213, 296–310, https://doi.org/10.1016/j.atmosenv.2019.06.007, 2019.
Zhao, D., Liu, D., Yu, C., Tian, P., Hu, D., Zhou, W., Ding, S., Hu, K., Sun, Z., Huang, M., Huang, Y., Yang, Y., Wang, F., Sheng, J., Liu, Q., Kong, S., Li, X., He, H., and Ding, D.: Vertical evolution of black carbon characteristics and heating rate during a haze event in Beijing winter, Sci. Total Environ., 709, 136251, https://doi.org/10.1016/j.scitotenv.2019.136251, 2020.
Zheng, G. J., Duan, F. K., Su, H., Ma, Y. L., Cheng, Y., Zheng, B., Zhang, Q., Huang, T., Kimoto, T., Chang, D., Pöschl, U., Cheng, Y. F., and He, K. B.: Exploring the severe winter haze in Beijing: the impact of synoptic weather, regional transport and heterogeneous reactions, Atmos. Chem. Phys., 15, 2969–2983, https://doi.org/10.5194/acp-15-2969-2015, 2015.
Zhong, J., Zhang, X., Dong, Y., Wang, Y., Liu, C., Wang, J., Zhang, Y., and Che, H.: Feedback effects of boundary-layer meteorological factors on cumulative explosive growth of PM2.5 during winter heavy pollution episodes in Beijing from 2013 to 2016, Atmos. Chem. Phys., 18, 247–258, https://doi.org/10.5194/acp-18-247-2018, 2018.
Zhou, M., Zhang, L., Chen, D., Gu, Y., Fu, T. M., Gao, M., Zhao, Y. H., Lu, X., and Zhao, B.: The impact of aerosol-radiation interactions on the effectiveness of emission control measures, Environ. Res. Lett., 14, 024002, https://doi.org/10.1088/1748-9326/aaf27d, 2019.
Zou, J., Yang, S., Hu, B., Liu, Z., Gao, W., Xu, H., Du, C., Wei, J., Ma, Y., Ji, D., and Wang, Y.: A closure study of aerosol optical properties as a function of RH using a κ-AMS-BC-Mie model in Beijing, China, Atmos. Environ., 197, 1–13, https://doi.org/10.1016/j.atmosenv.2018.10.015, 2019.