the Creative Commons Attribution 4.0 License.
the Creative Commons Attribution 4.0 License.
 | 30 Mar 2020
Aerosol hygroscopicity and its link to chemical composition in the coastal atmosphere of Mace Head: marine and continental air masses
Jurgita Ovadnevaite
Kirsten N. Fossum
Chunshui Lin
Ru-Jin Huang
Colin O'Dowd
Darius Ceburnis
Chemical composition and hygroscopicity closure of marine aerosol in high time resolution has not been achieved yet due to the difficulty involved in measuring the refractory sea-salt concentration in near-real time. In this study, attempts were made to achieve closure for marine aerosol based on a humidified tandem differential mobility analyser (HTDMA) and a high-resolution time-of-flight aerosol mass spectrometer (AMS) for wintertime aerosol at Mace Head, Ireland. The aerosol hygroscopicity was examined as a growth factor (GF) at 90 % relative humidity (RH). The corresponding GFs of 35, 50, 75, 110 and 165 nm particles were 1.54±0.26, 1.60±0.29, 1.66±0.31, 1.72±0.29 and 1.78±0.30 (mean ± standard deviation), respectively. Two contrasting air masses (continental and marine) were selected to study the temporal variation in hygroscopicity; the results demonstrated a clear diurnal pattern in continental air masses, whereas no diurnal pattern was found in marine air masses. In addition, wintertime aerosol was observed to be largely externally mixed in both of the contrasting air masses. Concurrent high time resolution PM1 (particulate matter <1 µm) chemical composition data from combined AMS and MAAP measurements, comprising organic matter, non-sea-salt sulfate, nitrate, ammonium, sea salt and black carbon (BC), were used to predict aerosol hygroscopicity with the Zdanovskii–Stokes–Robinson (ZSR) mixing rule. Overall, good agreement (an R2 value of 0.824 and a slope of 1.02) was found between the growth factor of 165 nm particles measured by the HTDMA (GF_HTDMA) and the growth factor derived from the AMS + MAAP bulk chemical composition (GF_AMS). Over 95 % of the estimated GF values exhibited less than a 10 % deviation for the whole dataset, and this deviation was mostly attributed to the neglected mixing state as a result of the bulk PM1 composition.
- Article
(4602 KB) -
Supplement
(1049 KB) - BibTeX
- EndNote


Marine aerosol is probably the most important component of natural aerosol in terms of climate effect (O'Dowd and de Leeuw, 2007), because over 70 % of the Earth's surface is covered by global ocean. There are two ways that marine aerosol can exert its impact on global climate: (1) by scattering the incoming solar radiation and (2) by acting as cloud condensation nuclei (CCN). Hygroscopicity – the ability of aerosol to take up water vapour – plays a significant role in both. Hygroscopicity affects the mass of aerosols by increasing the aerosol liquid water content and enhancing particle light scattering, thereby cooling the atmosphere directly. Furthermore, hygroscopicity has a large impact on CCN activation and cloud droplet formation, modifying cloud radiative forcing and the hydrological cycle (Twomey, 1974, 1977).
Aerosol hygroscopicity is determined by its chemical composition. Closure studies that have attempted to predict hygroscopicity based on chemical composition measurements have improved the understanding of the relationship between aerosol hygroscopicity and chemical composition in various environments. Thanks to the wide use of aerosol mass spectrometry (AMS), the chemical composition of aerosols is now available to attempt closure with hygroscopicity data at a high time resolution. For example, a closure study conducted in Paris revealed an overestimation of predicted hygroscopicity when the nitrate mass concentration exceeded 10 µg m−3 (Kamilli et al., 2014). Moreover, a closure study in Beijing suggested that the hygroscopicity of organics was related to their oxidised state (Wu et al., 2016), whereas another study in Hong Kong did not find any improvement in closure (Yeung et al., 2014). Despite the advantage of co-located aerosol chemical composition and hygroscopicity measurements that help to reconcile subsaturated particle hygroscopicity with its chemical composition, thereby identifying knowledge gaps, it is widely accepted that sea salt (the main component of marine aerosol) measurements using AMS are challenging due to its semi-refractory nature, which results in incomplete chemical composition information and unrealistic hygroscopicity.
The hygroscopicity of marine aerosol has been intensively studied, including studies in the Arctic (Zhou et al., 2001), Atlantic (Swietlicki et al., 2000) and Pacific (Berg et al., 1998) oceans, but chemical composition and hygroscopicity closure studies are still very limited. A hygroscopicity and chemical composition study conducted in the northeastern Pacific (Kaku et al., 2006) found that the growth factor (GF) was overestimated by 30 % using the Zdanovskii–Stokes–Robinson (ZSR) mixing rule. The study speculated that the overestimation was caused by the nonideal behaviour of organics. An investigation into the hygroscopicity of aerosol in Antarctica, using an impactor for the size-segregated composition of marine aerosol particles, found that the hygroscopicity was mainly driven by inorganic salts (Asmi et al., 2010). However, due to the limitations of the sampling technique (filters and impactors) and the short sampling period, they were unable to capture the temporal evolution of the chemical composition, which hindered the detailed analysis of a real-time linkage to hygroscopicity.
This study aimed to characterise marine and continental aerosol during the winter period of low marine biological productivity at the coastal Mace Head Atmospheric Research Station, which is situated at the boundary of the northeastern Atlantic and the rural west of Ireland. The aerosol hygroscopicity was measured in situ in subsaturated conditions (RH 90 %) using a humidified tandem differential mobility analyser (HTDMA). The aerosol hygroscopicity parameter was also estimated using chemical composition data from near real-time chemical composition measurements, including sea salt from a high-resolution time-of-flight aerosol mass spectrometer (HR-ToF-AMS) and a multi-angle absorption photometer (MAAP). Two contrasting cases were analysed in detail to represent continental and marine air masses, and hygroscopic aerosol properties were expected to differ greatly between the two. To the best of our knowledge, this is the first closure study on aerosol hygroscopicity and chemical composition that has included sea salt for marine aerosols in high time resolution.
2.1 Site description
The Mace Head Atmospheric Research Station is located on the North Atlantic coast of Ireland, County Galway, at 53∘19′36′′ N, 9∘54′14′′ W (O'Connor et al., 2008). Air is sampled from the main community sampling duct that draws air from 10 m above ground level and is positioned 80–120 m from the ocean depending on the tide. Meteorological data are recorded at the station, including rainfall, solar radiation, wind speed, wind direction, temperature, RH and pressure (available at http://www.macehead.org/, last access: 26 March 2020). Measurements were conducted from 1 January to 23 March 2009 comprised 1300 h valid HTDMA and AMS data. Air masses were tracked using HYSPLIT (Rolph et al., 2017) 72 h backward trajectories with an end point of 500 m above mean sea level at Mace Head according to the Global Data Assimilation System (https://www.ncdc.noaa.gov/data-access/model-data/model-datasets/global-data-assimilation-system-gdas, last access: 26 March 2020).
2.2 Instrumentation
2.2.1 HTDMA
The hygroscopic growth factor of aerosol particles was measured with a HTDMA (Liu et al., 1978; Rader and McMurry, 1986; Swietlicki et al., 2008; Tang et al., 2019). The HTDMA at Mace Head, which has been described in great detail in previous studies (Bialek et al., 2012; 2014), consisted of a dry Hauke-type differential mobility analyser (DMA; RH <10 %, dried by a Nafion™ dryer), a Gore-Tex™ humidifier, a second Hauke-type DMA and a condensation particle counter (CPC; TSI model 3772). To stabilise the RH, the second DMA was placed in a temperature-controlled box. Four ROTRONIC RH/temperature sensors and an Edgetech DewMaster dew point chilled mirror sensor were used to monitor the RH fluctuation within the system, and the humidifier was controlled by an analogue to digital and digital to analogue feedback system. The first DMA was used to select monodisperse particles with a certain electrical mobility. The monodisperse particles were then humidified, and a hygroscopic growth probability distribution function was produced by the second DMA and the CPC. As the dry diameter of aerosol is well established, the hygroscopic growth factor can be calculated by measuring the aerosol size distribution at a selected RH. To retrieve the growth factor from raw data and to correct the broadening of the DMA distribution, a piecewise linear inversion algorithm was used (Gysel et al., 2009). In this study, the first DMA was held at a RH of 10 %, while the second DMA was set at a RH of 90 %. The dry particle diameters selected by the first (dry) DMA were 35, 50, 75, 110 and 165 nm with a scan duration of 180 s; thus, the full cycle through all of the diameters took 15 min. The sample and sheath flow rates were 1 and 9 L min−1, respectively. The operation and quality assurance procedure followed the standard configuration and deployment recommended by the European Supersites for Atmospheric Aerosol Research (EUSAAR) network project (Duplissy et al., 2009).
2.2.2 Chemical composition (HR-ToF-AMS and MAAP)
The chemical composition was measured using a HR-ToF-AMS (Aerodyne Research Inc., Billerica, MA) (DeCarlo et al., 2006) which has a vacuum aerodynamic cut-off diameter of 1 µm. Regular calibrations were performed with ammonium nitrate, and the composition-dependent collection efficiency was applied. AMS provided the mass concentration of organic matter, ammonium, non-sea-salt sulfate, nitrate and methanesulfonic acid (MSA). AMS typically runs at an evaporation temperature of 600 ∘C, which is optimised for the detection of non-refractory aerosol species such as organic matter, nitrate, sulfate and ammonium. Sea salt was expected to be refractory at the above-mentioned temperature, thereby compromising the detection of non-refractory species (Allan et al., 2004). However, Ovadnevaite et al. (2012) convincingly demonstrated that sea salt can be successfully quantified at the standard evaporation temperature as long as the RH is maintained within reasonable limits (<80 %) and the AMS vaporiser is not overloaded by sea salt. In this study, sea salt was retrieved using a 23Na35Cl+ ion signal at m∕z 58 and a scaling factor of 51 (Ovadnevaite et al., 2012). The quantification of MSA was realised and calibrated using the ion signal of and CH3SO3H+, which are exclusively related to MSA. The composition-dependent collection efficiency (CDCE) was used to correct the AMS species concentrations (Middlebrook et al., 2012). The CDCE does not take the sea salt or organic matter contribution into account; however, these species would only be corrected proportionally to the total mass (if at all) and would not affect the fractional contribution of the species used in this study. We attempted a comparison between the scanning mobility particle sizer (SMPS) volume and AMS plus BC combined volume to attest to the proficiency of the CDCE correction (DeCarlo et al., 2004). The comparison is presented in Fig. S1 in the Supplement (the slope was 1.03±0.01). The excellent agreement with respect to the volume comparison suggests that the CDCE correction was realistic with a few outliers pointing at a slight size range discrepancy between the SMPS and the AMS. The relationship between sea salt and wind speed is presented in Fig. S2 for the entire year of 2009 and is similar to that previously published by Ovadnevaite et al. (2012), although it is not as clear-cut as that in the previous publication. It must be noted that although the wind speed was the dominant factor for sea-salt aerosol production, there were few a more parameters in the sea spray source function that were related to the sea state, salinity and temperature, which all affect the quantitative relationship. Thus, excellent agreement can only be expected in very well-defined low-pressure systems that produce sea salt and in events where sea salt is well mixed and filled in the entire boundary layer, as exclusively occurs during significant storms. While the sea spray source function is at work during every occurrence of wind-induced bubble bursting (Ovadnevaite et al., 2014b), the quantitative representation of particle mass and number is not instantly achieved. Nevertheless, both relationships provided extra confidence in the quantitative detection of sea salt by AMS. The operational details of the HR-ToF-AMS are described by Ovadnevaite et al. (2014a). The degree of neutralisation of the bulk aerosol was calculated as follows: DON . The concentration of optically absorbing black carbon (BC) was measured by a multi-angle absorption photometer (MAAP, Thermo Fisher Scientific model 5012). The MAAP operated at a flow rate of 10 L min−1 and a 5 min time resolution. The MAAP measured the transmittance and reflectance of BC-containing particles at two angles to calculate the optical absorbance, as described in Petzold and Schönlinner (2004).
2.3 Hygroscopicity data analysis
The growth factor (GF) of aerosol particles undergoing humidification was obtained using , where D and D0 are the electrical mobility diameters of humidified and dry aerosols, respectively.
One of the HTDMA features is the ability to reveal the aerosol mixing state by detecting the presence of more than one particle growth mode. Each growth mode represents different water uptake properties, indicating the different chemical composition of each mode. The growth factor probability distribution function (GF-PDF) was separated into four growth modes according to the GF range: a near-hydrophobic mode (NH; 1<GF<1.11), a less hygroscopic mode (LH; 1.11<GF<1.33), a more hygroscopic mode (MH; 1.33<GF<1.85) and a sea salt mode (SS; 1.85<GF). For particles in a specific GF range, for example LH, the number fraction of the mode (nf_LH) was derived from the retrieved probability density function c(GF, D) as follows:
It should be noted that this categorisation was not always representative. For example, in highly acidic marine aerosol, the MH mode peaked at 1.8<GF<2.0 due to a high level of highly hygroscopic H2SO4, which had a GF of up to 1.9, rather than sea salt, which has a GF of 2.1. Due to the spread of the GF-PDF, some sections of the PDF that represented non-neutralised particles could be categorised into the SS mode, which would then result in an underestimation of the averaged GF for both the MH and SS modes as well as an overestimation of the number fraction of the SS mode. The GFmean of each mode was calculated as follows: .
2.4 Hygroscopicity–chemistry closure
The mass concentrations were converted to volume fractions of the individual components (organics, NH4HSO4, H2SO4, NH4NO3, (NH4)2SO4, MSA, sea salt and BC) using a simplified ion-pairing scheme (Gysel et al., 2007). The GF values of individual components are summarised in Table 1. Although the hygroscopicity of inorganic compounds is well understood and established, it is still challenging to quantify the hygroscopicity of organic matter ranging from 1 to 1.5 or from hydrocarbon to oxalic acids (Kreidenweis and Asa-Awuku, 2014); however, most of the anthropogenic organics have a GF of less than 1.2. In this study, we first used a fixed GF value of 1.18 for organics, which was the average value from several closure studies (Wang et al., 2018; Yeung et al., 2014), and a constant density of 1400 kg m−3, as used by Gysel et al. ( 2007).
Table 1Density and GF (at 90 % RH) of chemical species used in the closure study.
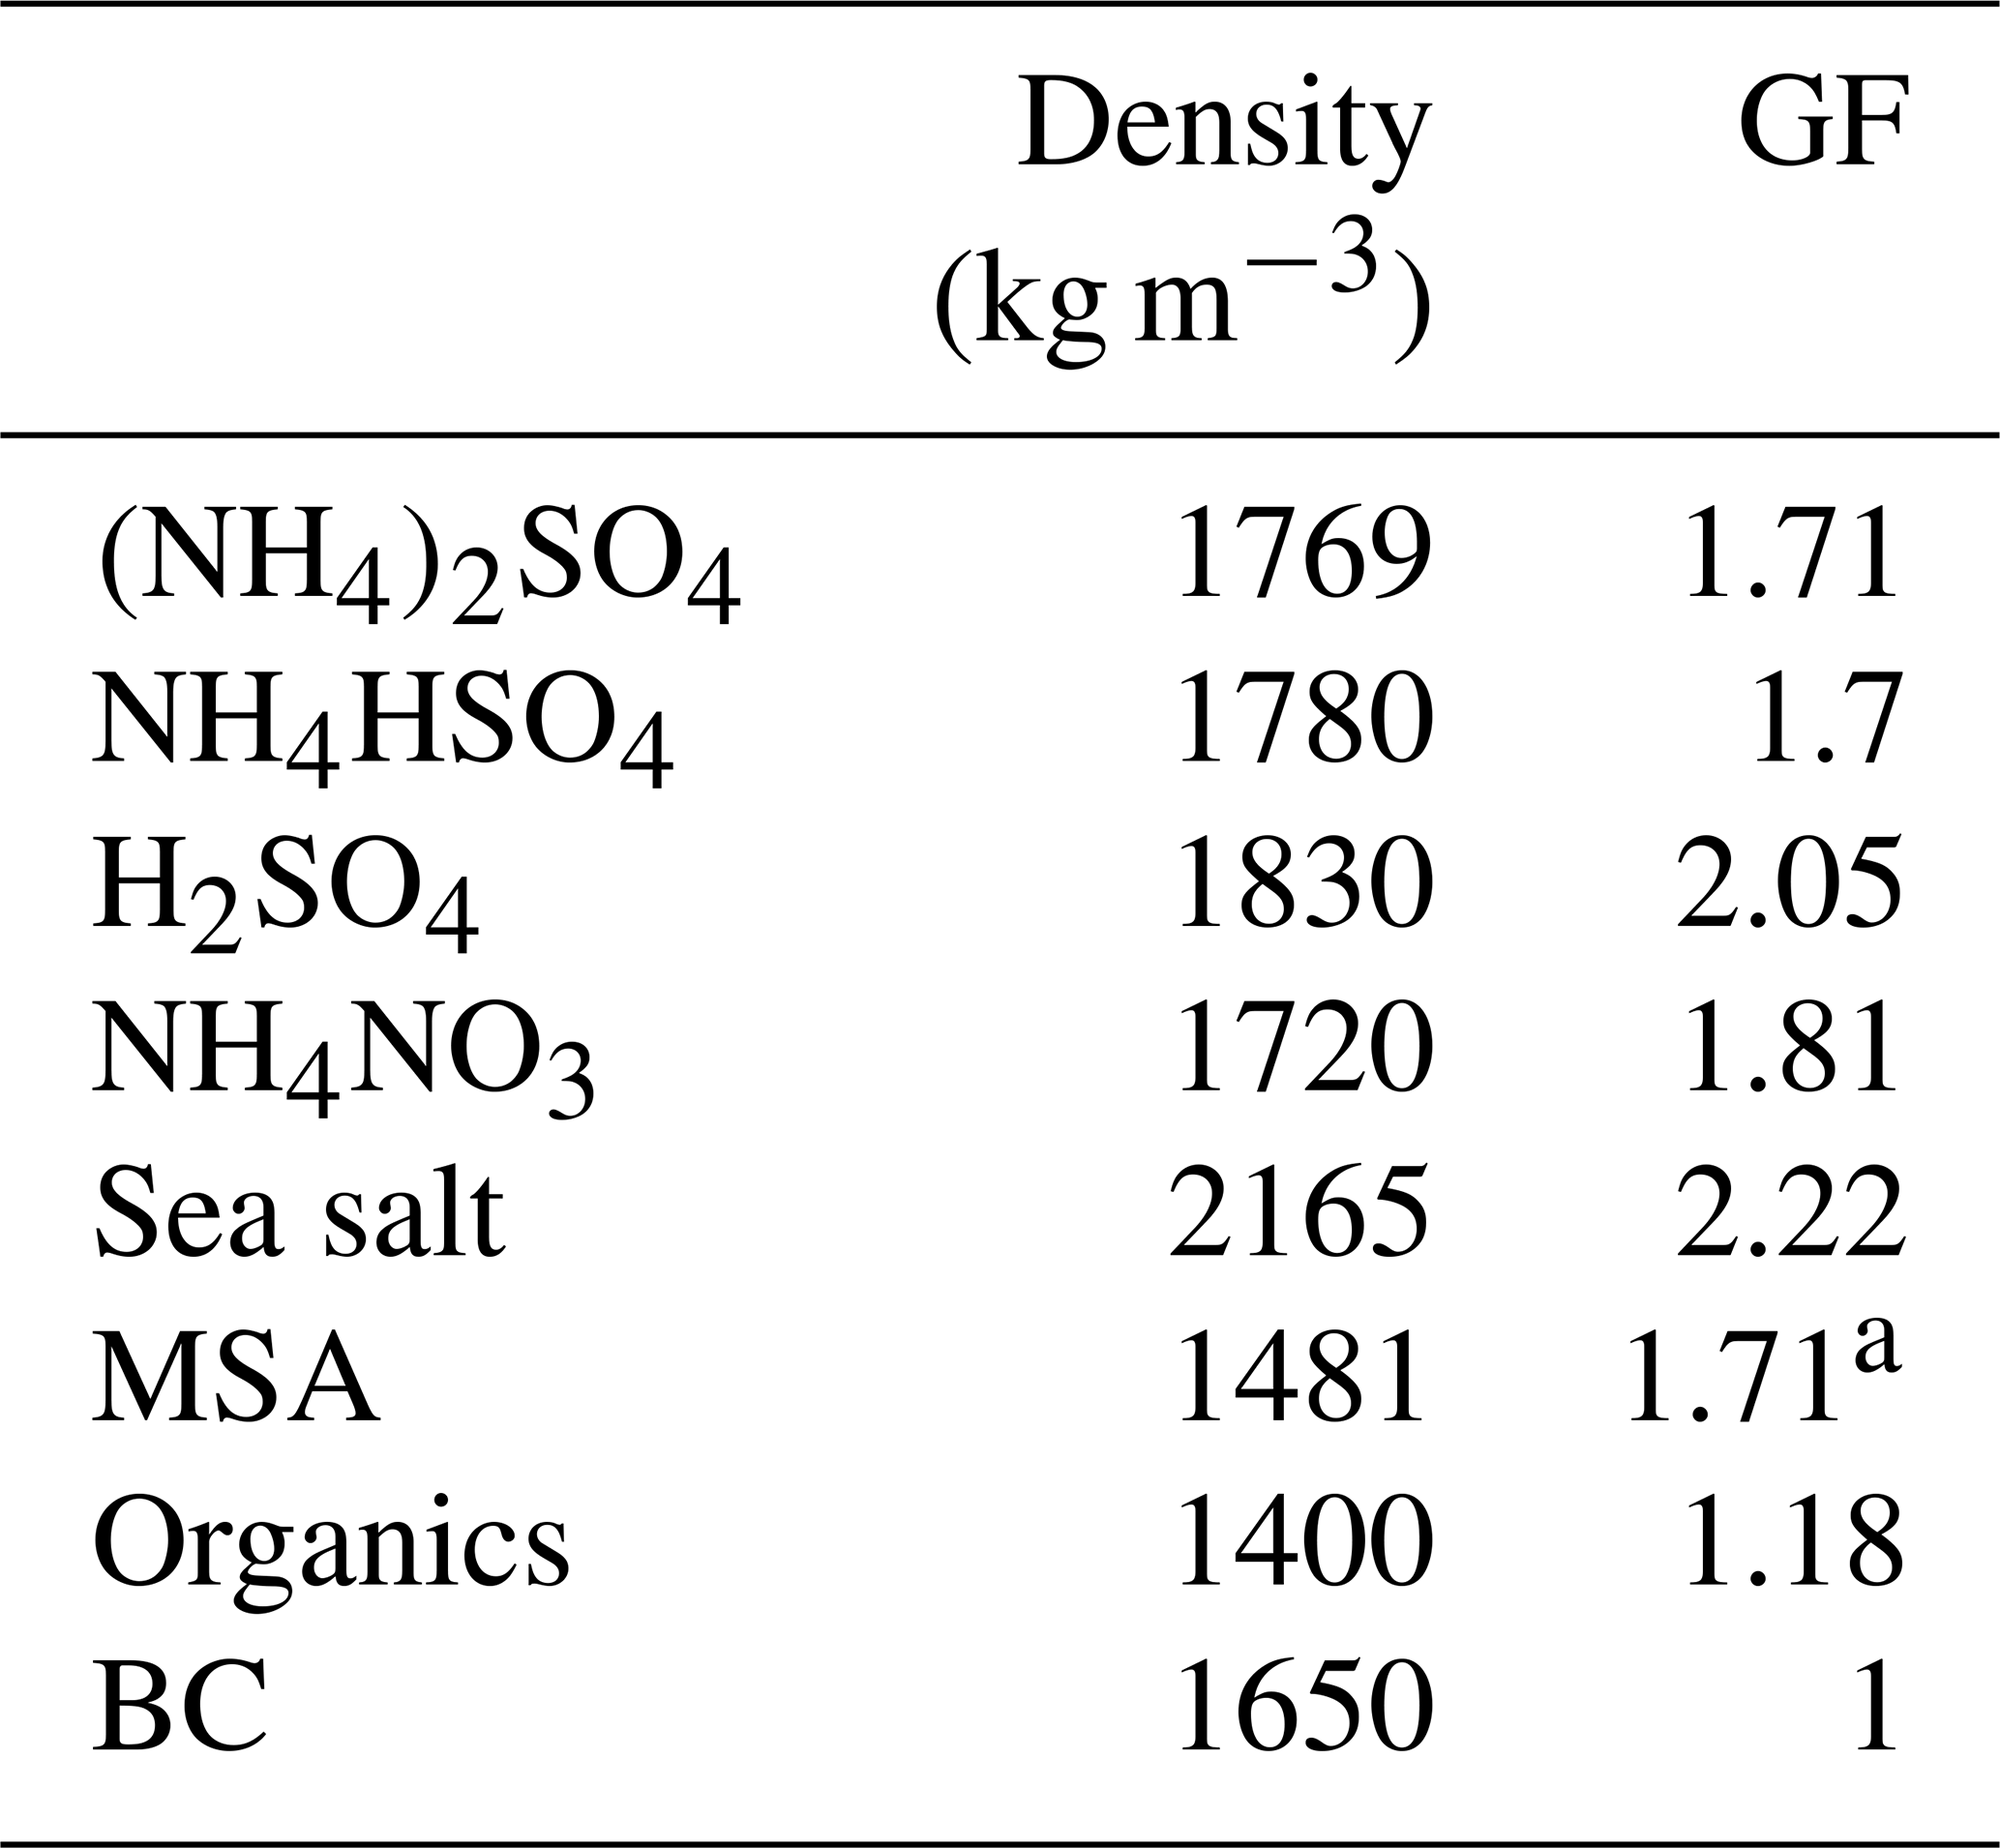
a The value was adapted from Fossum et al. (2018) and Tang et al. (2018).
Assuming constant GF and density values for organics may induce a bias in closure studies, because the hygroscopicity of organics differs according to their molecular structure, air mass history or oxidation level. The GFMSA of 1.71 was calculated using the κ value, which, in turn, was obtained using the AIOMFAC model (Fossum et al., 2018; Zuend et al., 2011) and is supported by a recent lab experiment (Tang et al., 2018). The hygroscopicity of inorganic sea salt was found to be 8 %–15 % lower than that of pure NaCl; therefore, a GF value 2.22 for inorganic sea salt (at RH 90 %) was used (Zieger et al., 2017). The closure between the measured and predicted values was characterised by a linear regression using the corresponding R2 (the variance, which is a square of the correlation coefficient) and regression slope values.
The GF estimation was based on the Zdanovskii–Stokes–Robinson (ZSR) mixing rule (Stokes and Robinson, 1966) using the measured aerosol chemical composition, which assumes that the water uptake of the mixture is equivalent to the sum of the water uptake of the individual substances. The GF calculated from the bulk chemistry of the HR-ToF-AMS (GF_AMS) can be written as follows: GF_AMS , where vi is the volume fraction of the compound in the dry particle, and GFi is the growth factor of the individual chemical components. In the above equation, any interaction between the solutes is neglected, and the volume of the dry mixture is the sum of the volumes of its dry components.
3.1 Meteorology and air mass origin
The measurement period spanned from 1 January 2009 to 23 March 2009. The data, including meteorological parameters and aerosol chemical composition, are shown in Fig 1. The average ambient temperature and RH values for the entire period were 6.5±2.5 ∘C and 85.8±8.8 %, respectively.

Figure 1Temporal variation of (a) the mass concentration of chemical species measured by the HR-ToF-AMS and MAAP; (b) wind speed (m s−1) with wind direction represented using a colour scale; (c) and temperature (∘C; blue line) and RH (hPa; red line). The boxed areas correspond to the continental events (C1 and C2; black) and the marine events (M1 and M2; blue).
The measurement period was examined in terms of contrasting air mass origins, and two continental events (C1 and C2) and two marine events (M1 and M2) were selected. These contrasting events are highlighted in the time series shown in Fig. 1, and they were expected to reveal greatly different aerosol particle hygroscopic properties. The air mass backward trajectories for these four events are shown in Fig. 2. Events C1 and C2 represented air masses that originated over continental Europe 72 h prior to being transported across the UK and Ireland towards Mace Head. Events M1 and M2, in comparison, were considered to represent clean marine air that originated over the northeastern Atlantic Ocean and was transported to the west coast of Ireland. The start and end time of each event is summarised in Table S1. The mass concentrations of the chemical composition, including non-sea-salt sulfate, nitrate, ammonium, organic matter, MSA, sea salt and BC, of each event are summarised in Table S2. It is important to emphasise that marine air masses are not always pristinely clean despite their advection over oceanic waters. Therefore, only data with a BC concentration of less than 15 ng m−3 and a wind direction within the 190 to 300∘ sector were included in the data analysis of marine events; these data are summarised in Table S2. The mean BC concentrations during the M1 and M2 events were 10.1 and 9.9 ng m−3, respectively, demonstrating the value of the conservative approach to qualifying pristine marine air masses; the corresponding data capture is presented in Fig. S3 for the M1 event. A strict and conservative BC criterion has been used to filter the cleanest maritime air masses. An analysis of the representativeness of clean maritime air masses has been extensively discussed by O'Dowd et al. (2014), where no correlation was found between organic matter (OM) and BC for the different BC concentration ranges of 0–15 and 15–50 ng m−3 (R2 values of 0.006 and 0.046, respectively). Figure S8 shows the non-refractory organics and non-sea-salt sulfate concentration from AMS versus the BC concentration in this study, which once again demonstrate no relationship with clean marine air masses derived using the conservative BC criterion. However, a relationship was found between the above-mentioned species in continental air masses, as one would expect in air masses where pollutants are typically internally mixed and advected by long-range transport to the site.
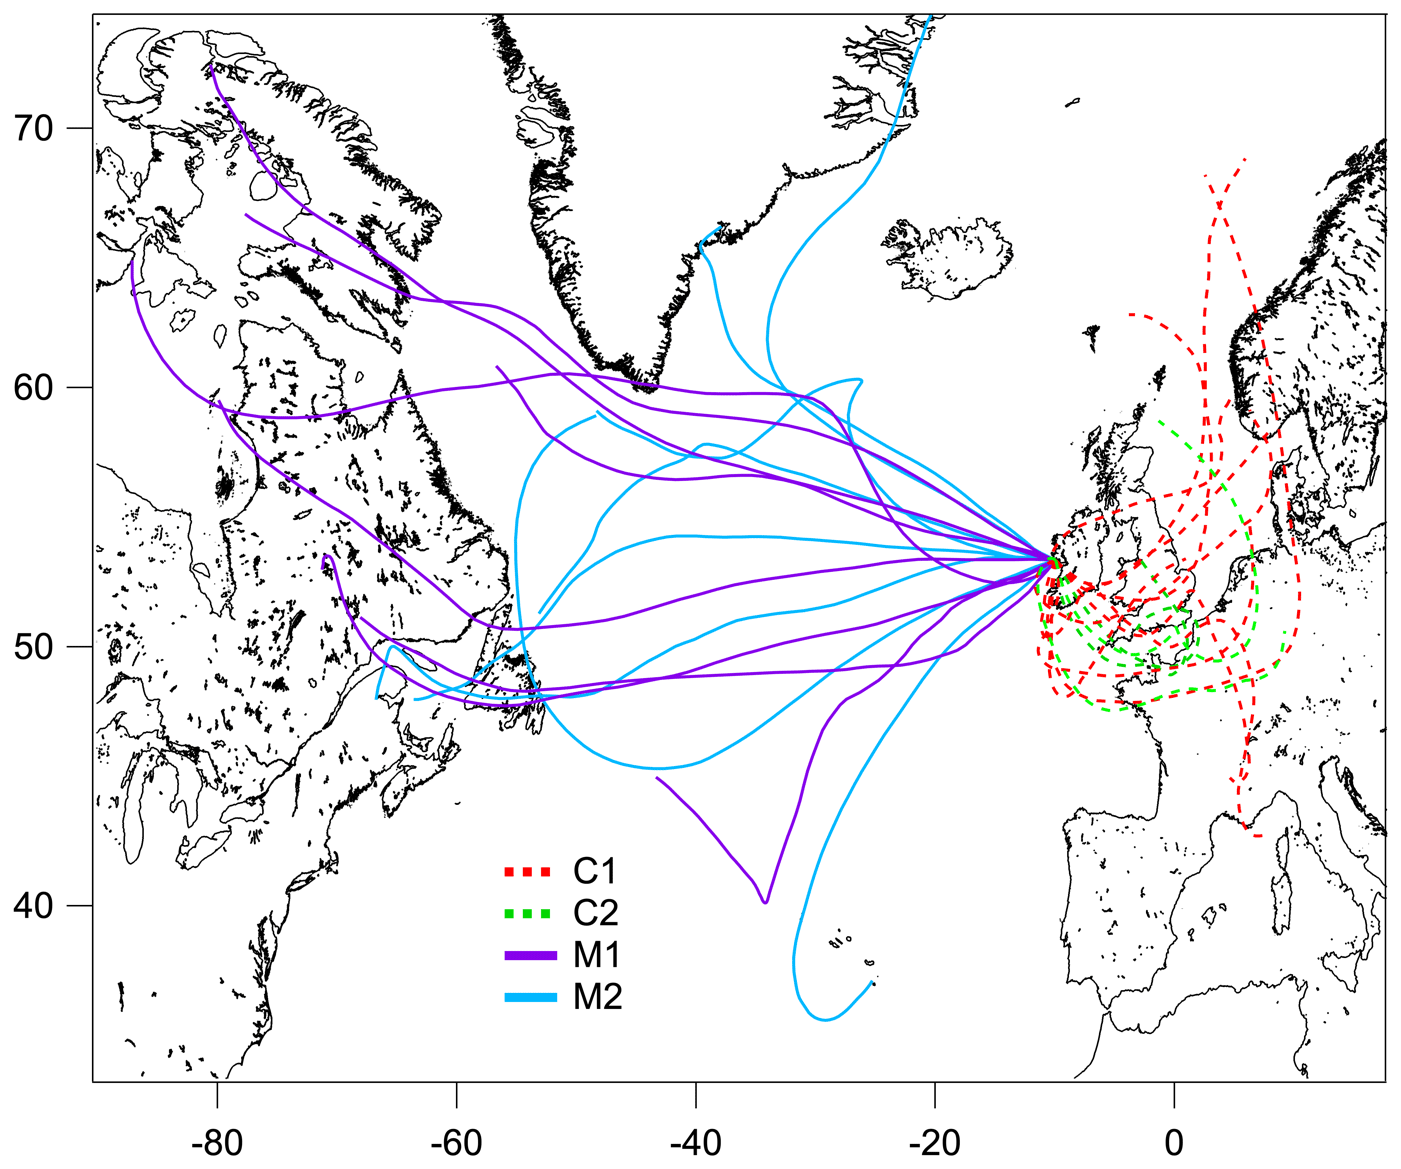
Figure 2The 72 h backward trajectories arriving at 500 m above mean sea level at Mace Head, retrieved with the Global Data Assimilation System, for the continental (C1 – red dashed line; C2 – green dashed line) and marine (M1 – purple solid line; M2 – blue solid line) events. The trajectory was calculated every 24 h over the event duration.
3.2 Aerosol hygroscopicity
3.2.1 Overview of hygroscopicity measurements
During the full winter measurement period, aerosols displayed a temporal variation in the GF-PDF across all sizes, and larger particles clearly exhibited larger GF values overall (Fig. 3). The mean GFs of 35, 50, 75, 110 and 165 nm dry mobility diameter particles were 1.54±0.26, 1.60±0.29, 1.66±0.31, 1.72±0.29 and 1.78±0.30, respectively.
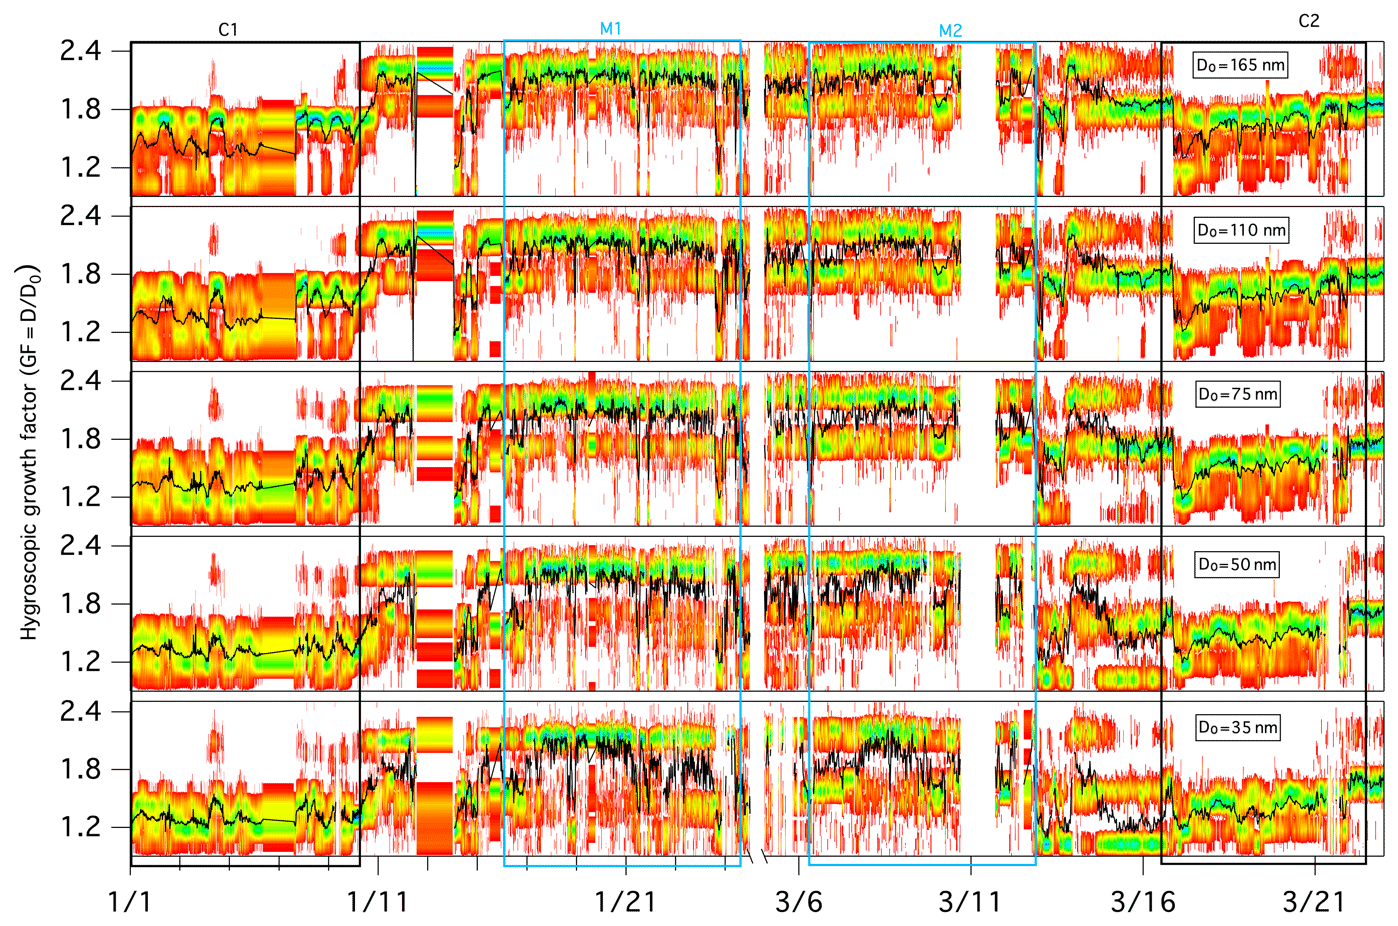
Figure 3Growth factor probability distribution functions (GF-PDFs) for different dry particle sizes as measured by the HTDMA. The colour bar indicates the probability density, and the black line represents the averaged GF.
The GF-PDFs were observed to be highly size dependent throughout the sampling period (Fig. 3), and different modal patterns (single mode, bimodal and/or trimodal) were also found for all of the measured particle sizes, although with a different frequency of occurrence. The occurrence of single-mode profiles increased with decreasing D0: the frequency of occurrence was 10.4 % for a 35 nm dry particle diameter, 8.8 % for a 50 nm dry particle diameter, 7.6 % for a 75 nm dry particle diameter, 4.7 % for a 110 nm dry particle diameter and 3.0 % for a 165 nm dry particle diameter. A few trimodal patterns were observed, particularly in marine air masses, and the occurrence of trimodal profiles also increased with decreasing size: the frequency of occurrence was 9.8 % for a 35 nm dry particle diameter, 7.9 % for a 50 nm dry particle diameter, 6.5 % for a 75 nm dry particle diameter, 3.8 % for a 110 nm dry particle diameter and 1.9 % for a 165 nm dry particle diameter. Overall, bimodal GF-PDF profiles dominated the whole winter period regardless of size (Fig. 3), suggesting that the sampled aerosol was largely externally mixed at Mace Head throughout the winter season. To determine the influence of air mass, we examine the hygroscopicity and chemical composition of marine and continental aerosol in the following sections.
3.2.2 Continental air masses
No precipitation was observed during continental air mass events, and measured temperatures were typical of Mace Head winter seasons, ranging from 1 to 6 ∘C, while the RH ranged from 70 % to 100 %. Wind speed peaked at a maximum of 17 m s−1 and a minimum of below 5 m s−1.
Figure 3 provides an overview of the GF-PDFs and the average GFs of preselected aerosol particles. Throughout the C1 and C2 events, particles with a D0 greater than 75 nm exhibited bimodal or trimodal GF-PDFs with a MH, LH or NH mode. Particles with a D0 of less than 50 nm were rather different and were dominated by the LH and NH modes. Completely nonhygroscopic particles (GF ∼1) were not observed, but some of the GF-PDF data spread reached the NH mode, indicating some extent of internal mixing; however, a dominant multimodal pattern clearly demonstrated mostly external mixing. External mixing has also been observed in other studies in winter, especially in locations with a large anthropogenic influence (Swietlicki et al., 2008).
Figure 4 depicts the number fraction of each growth mode type by the measured particle size over the winter measurement period. The MH mode was dominated by 165 nm particles, whereas the LH and NH modes became more prominent as the size decreased. A similar size-dependent mode distribution has also been observed in Beijing (Wu et al., 2016) and southern Sweden (Fors et al., 2011). The number fraction values of NH (nf_NH) were similar for all sizes, nf_LH decreased with increasing particle size and the nf_MH mode increased with increasing size. It is generally argued that larger particles have typically undergone atmospheric ageing and cloud processing (such as coagulation, droplet coalescence, condensation of semi-volatile gases, chemical reactions and photooxidisation) for a longer period of time, thereby acquiring additional mass, growing in size and exhibiting more hygroscopic features. The SS mode was very small in continental air masses as expected (frequency of occurrence of 1 % during C1 and 5 % during C2), but externally mixed sea salt was clearly discerned nevertheless. As shown in Fig. S4, the average GF of 110 and 165 nm particles showed a clear diurnal pattern, which peaked at about 11:00 LT (local time) every day and reached a minimum at 20:00 LT. This trend was similar to GF observations in the Po Valley (Bialek et al., 2014) or Oklahoma (Mahish and Collins, 2017) and is often attributed to a shallower and more stagnant boundary layer during the night with temperature inversions arising from radiative cooling of the surface. When the sun rises in the morning, the boundary layer increases in height and older particles are mixed down. In general, older particles are more hygroscopic, which results from cloud processing and photo-ageing (Rissler et al., 2006).
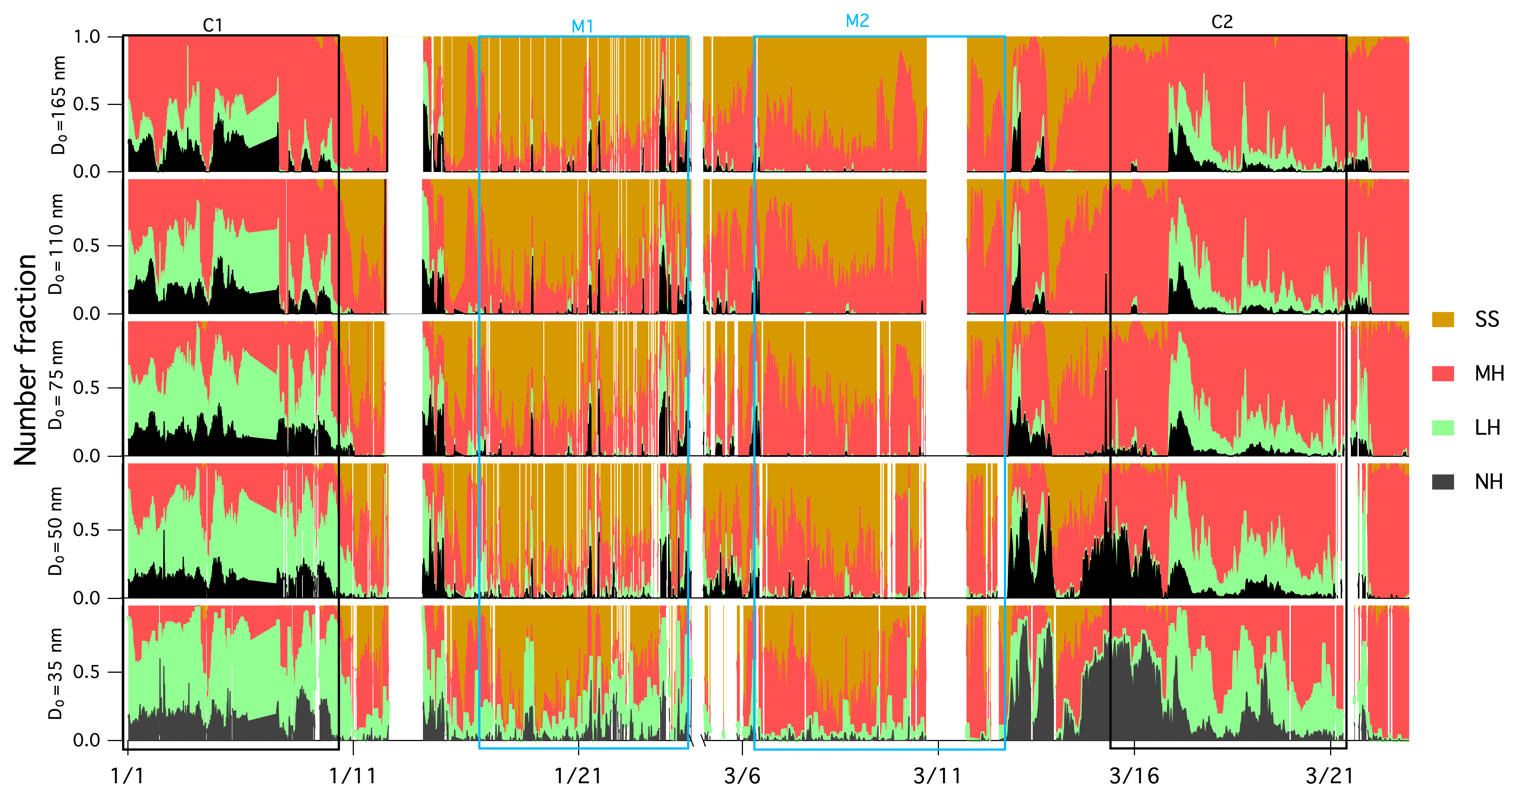
Figure 4Time series of the number fraction of the NH mode (in black; GF <1.11), the LH mode (in green; 1.11<GF<1.33), the MH mode (in red; 1.33<GF<1.85) and the SS mode in (in brown; GF >1.85) of aerosols with preselected dry diameter.
AMS and MAAP measurements are shown in Fig. 1a, and the mean ± standard deviation of the total mass concentration, BC, organic matter, nitrate, ammonium and non-sea-salt sulfate are shown in Table S2. The respective mass concentrations of BC during C1 and C2 were 500 and 518 ng m−3, and the respective nitrate mass loadings were 0.92 and 4.06 µg m−3, suggesting a heavy anthropogenic impact during continental events. The mass concentrations of sea salt during C1 and C2 were 0.17 and 0.13 µg m−3, respectively, suggesting little impact from marine sources during the selected wintertime continental events.
3.2.3 Marine air masses
Aerosol hygroscopicity in the marine air masses was dramatically different from the continental air masses. The meteorological conditions and the chemical composition of each event are shown in Fig. 1. During the M1 and M2 marine air mass events, the wind speed varied from 4 to 20 m s−1, and the wind direction varied from 180 to 320∘ and corresponded to clean maritime conditions at Mace Head (O'Dowd et al., 2014). The RH and temperature ranged from 70 % to 100 % and from 0 to 10∘C, respectively. The marine GF-PDFs of M1 and M2 were mostly bimodal, indicating that the aerosol was mostly externally mixed, but generally much more hygroscopic than during continental events. The mean GFs of M1 and M2, which ranged from 1.8 to 2.1, are shown in Table S3 and suggest the highly hygroscopic nature of marine aerosol. The diurnal pattern of M1 and M2 is shown in Fig. S1 and, contrary to the C1 and C2 air masses, the marine air masses did not revealed a clear diurnal pattern, which was likely due to the well-mixed marine boundary layer and stable temperature over the ocean. Long-term data are required to form a solid conclusion; however, this is outside the scope of the current paper and will be addressed in future research.
In wintertime, the MH mode was ubiquitous in sampled marine aerosol (observed in all scans) as was the SS mode. However, for Aitken-mode particles, the LH or NH modes were also observed. Interestingly, a significant number fraction of sea salt was detected down to particle diameters of 35 nm, which in accordance with the nanoparticle modes in the sea spray source function developed by Ovadnevaite et al. (2014). In this study, the greatest number fraction of the SS mode was observed around a particle diameter of 75 nm, which is also in line with the aforementioned sea spray source function. Although the SS mode observed at 35 nm could have been attributed to sulfuric acid, this was unlikely to have been the case in this study for the following reasons: (1) ammonium tends to react with smaller sulfate particles because their larger surface to volume ratio produces less hygroscopic ammonium (bi)sulfate; (2) highly hygroscopic (GF >1.85) non-sea-salt (or low sea salt) aerosol has never been observed; and (3) the number of SS-mode particles (the number fraction of the SS mode times the number of Aitken-mode particles measured by the SMPS) was highly dependent on wind speed. The NH and LH modes were more pronounced in the smaller particle sizes. After applying the pristine marine criterion (a BC concentration less than 15 ng m−3 and a wind direction within 190 to 300∘ sector), the NH and LH modes were dramatically reduced across the Aitken-mode particles and were effectively absent in the accumulation-mode particles (Fig. S3), but the NH and LH modes of 35 nm still remained. Given the conservative BC threshold and the absence of low hygroscopicity modes in larger particles, local anthropogenic contamination can be excluded. The conclusive origin of the less hygroscopic particles observed in the North Atlantic will be the subject of a further long-term study. The GFs of the MH mode (GF_MH) for the continental and marine events are summarised in Table S4. The averaged GF_MH also increased with the D0 (e.g. the GF_MH increased from 1.57 for 35 nm to 1.70 for 165 nm particles for the marine event). The highest GF_MH in the 165 nm GF-PDF was around 1.78, which is similar to the GF of ammonium bisulfate (a GF of 1.79); this indicates that the aerosol in the MH mode was largely comprised of non-neutralised sulfate that originated from marine DMS oxidation and from a lack of ammonia, which results in largely acidic particles. Moreover, the marine GF_MH was higher than that of the continental event, which could be attributed to the difference in the degree of neutralisation. The degree of neutralisation for C1, C2, M1 and M2 was 0.88, 0.93, 0.24 and 0.03, respectively, which clearly suggests a higher contribution of sulfuric acid and ammonium bisulfate in marine air masses. In contrast to previous studies that reported very low frequency of occurrence of the SS mode at coastal sites in Hong Kong during winter (Yeung et al., 2014), our observations indicated a large presence of the SS mode during wintertime as the result of long air mass advection over the stormy North Atlantic.
The comparison of the GFs between the continental and marine events is shown in Fig. 5, where GFs increase with aerosol size in both continental and marine events, but the size dependence is rather different. The difference between the GFs of 35 and 50 nm particle sizes was smaller for the continental events than for the marine events. On the contrary, the difference among the 75, 110 and 165 nm sizes was smaller for the marine events. The size dependence of the GFs could have resulted from the Kelvin effect and/or chemical composition. To remove the impact from the Kelvin effect, the hygroscopicity parameter was calculated. Similar to the GFs, the κ values show size dependence for both the continental and marine events (Fig. S5). The difference in the size-dependent behaviour was the result of different air mass histories and the corresponding aerosol production mechanisms affecting the aerosol chemical composition. Marine aerosols are mainly produced by wind-stress-induced bubble bursting or gas transfer that results in secondary particles, whereas continental anthropogenic aerosol undergoes a significant ageing process as it is produced by distant anthropogenic sources.
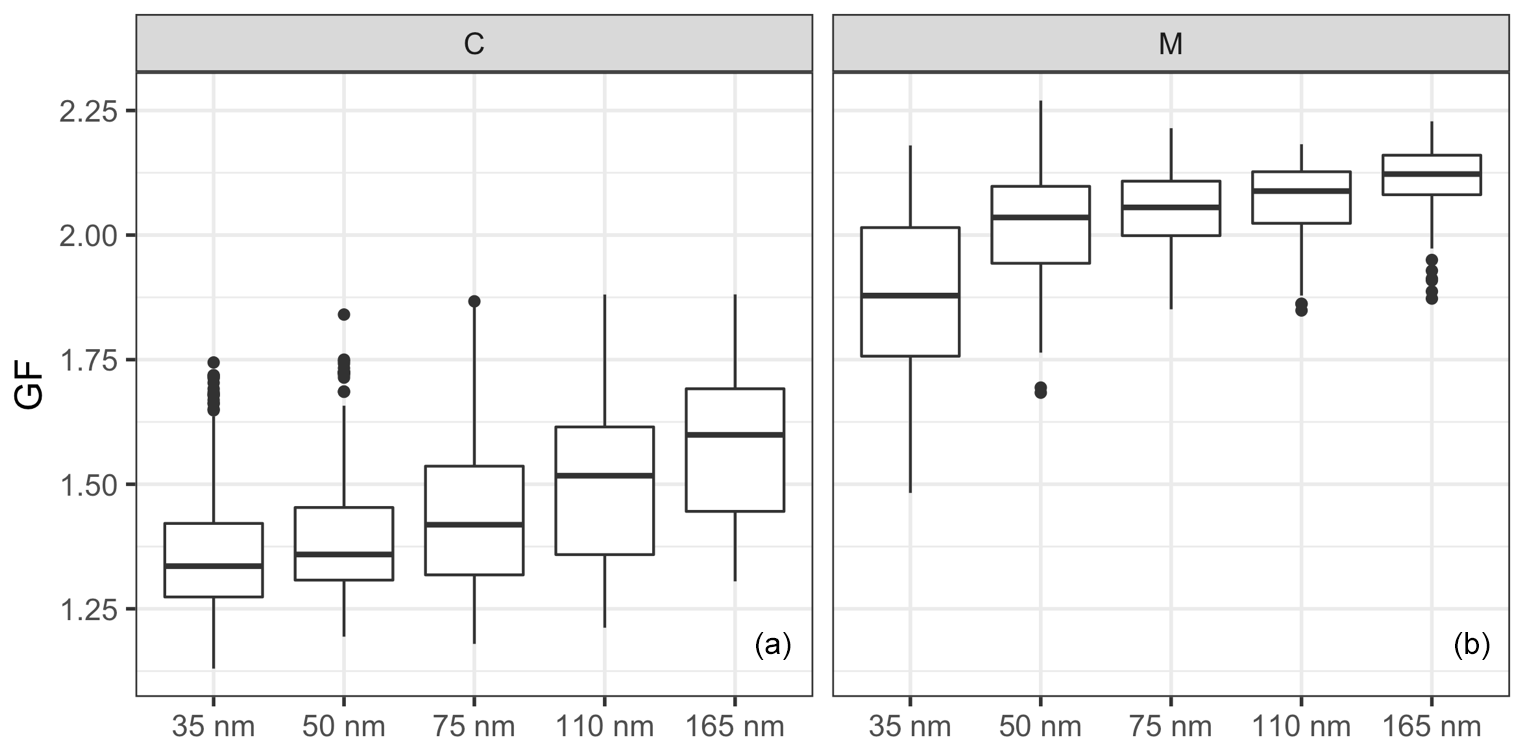
Figure 5The size-resolved GFs for the (a) continental (C) and (b) marine (M) events. The horizontal lines represent the median GF, the boxes represent the 25 %–75 % percentile and the whiskers represent 1.5× IQR from the boxes (where the IQR is the interquartile range). Data beyond the end of the whiskers are plotted individually as outliers.
3.3 Chemical composition closure study
The size-resolved GFs measured by the HTDMA (denoted as GF_HTDMA) were plotted against GFs estimated with the ZSR mixing rule using AMS chemical composition data (denoted as GF_AMS). A linear regression was used to fit the GF_AMS and GF_HTDMA, with the slope of a nonzero intercept linear regression fit reflecting how well the estimation agrees with the measurements. As shown in Fig. 6, the regression slopes were 0.91 and 1 for 35 and 165 nm, respectively, and the variance increased from 0.61 to 0.84 with the increase in D0, suggesting that the closure agreement improves for larger particle sizes. For example, the GF_AMS of 35 nm D0 aerosols showed an overestimation with over 93 % of the data points located outside of the 10 % deviation from the 1:1 line. The comparison of 165 nm aerosols with bulk chemistry was very good with over 95 % of data points lying within 10 % deviation of the 1:1 line. The slope of the linear regression was 1.02, suggesting that there was no systematic error in the GF estimation. The results of the comparison suggests that (1) the chemical composition that was used to derive the GF was bulk PM1 data, which may differ significantly from Aitken-mode particles but approximate accumulation-mode particles quite well – thereby affecting a poorer comparison of Aitken-mode particles; and (2) that the Kelvin effect, which would become significant at small sizes, was neglected in the calculation. Contrary to the study of Hong et al. (2018), the correlations between GF_AMS and GF_HTDMA in this study, even those of small particles, showed much better correlations than the total lack of a correlation found by the former work. As described in Sect. 2, the chemical compositions measured by AMS in this study were bulk PM1 chemical composition, where the contribution of sub-50 nm particles was negligible. Consequently, it is expected that the calculated GF values deviate considerably from the measured GF for particles smaller than 50 nm. Given the that the best agreement was obtained for the larger sizes and considering the relevance of this for cloud condensation nuclei, we now focus on the closure results of 75, 110 and 165 nm particles to assess event results. As shown in Fig. 6, although the general closure agreement was good, a large number of data points were still scattered around the regression line. The comparison between GF_AMS and GF_HTDMA was plotted for continental and marine events, as shown in Fig. 7.
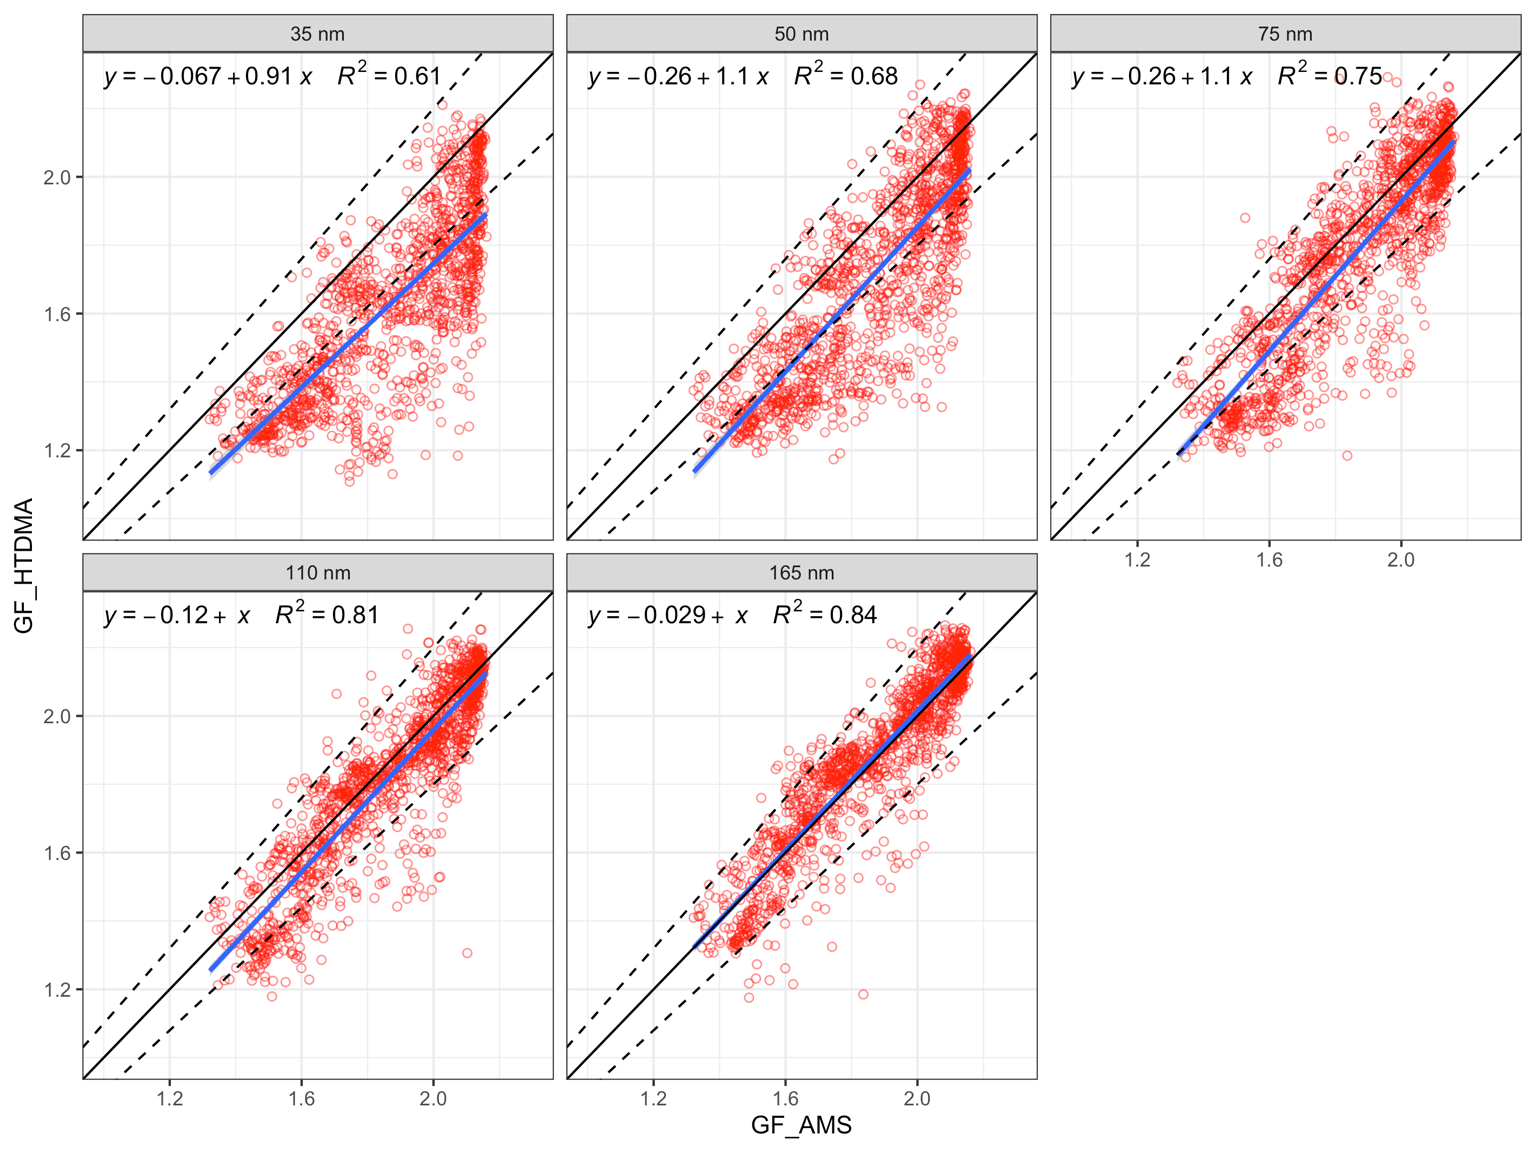
Figure 6The comparison of bulk GF_AMS with size-dependent GF_HTDMA. The 1:1 line is shown in black; the 10 % deviation is indicated by the dashed lines; the blue line is the regression line ; and R2 is the regression coefficient (variance).
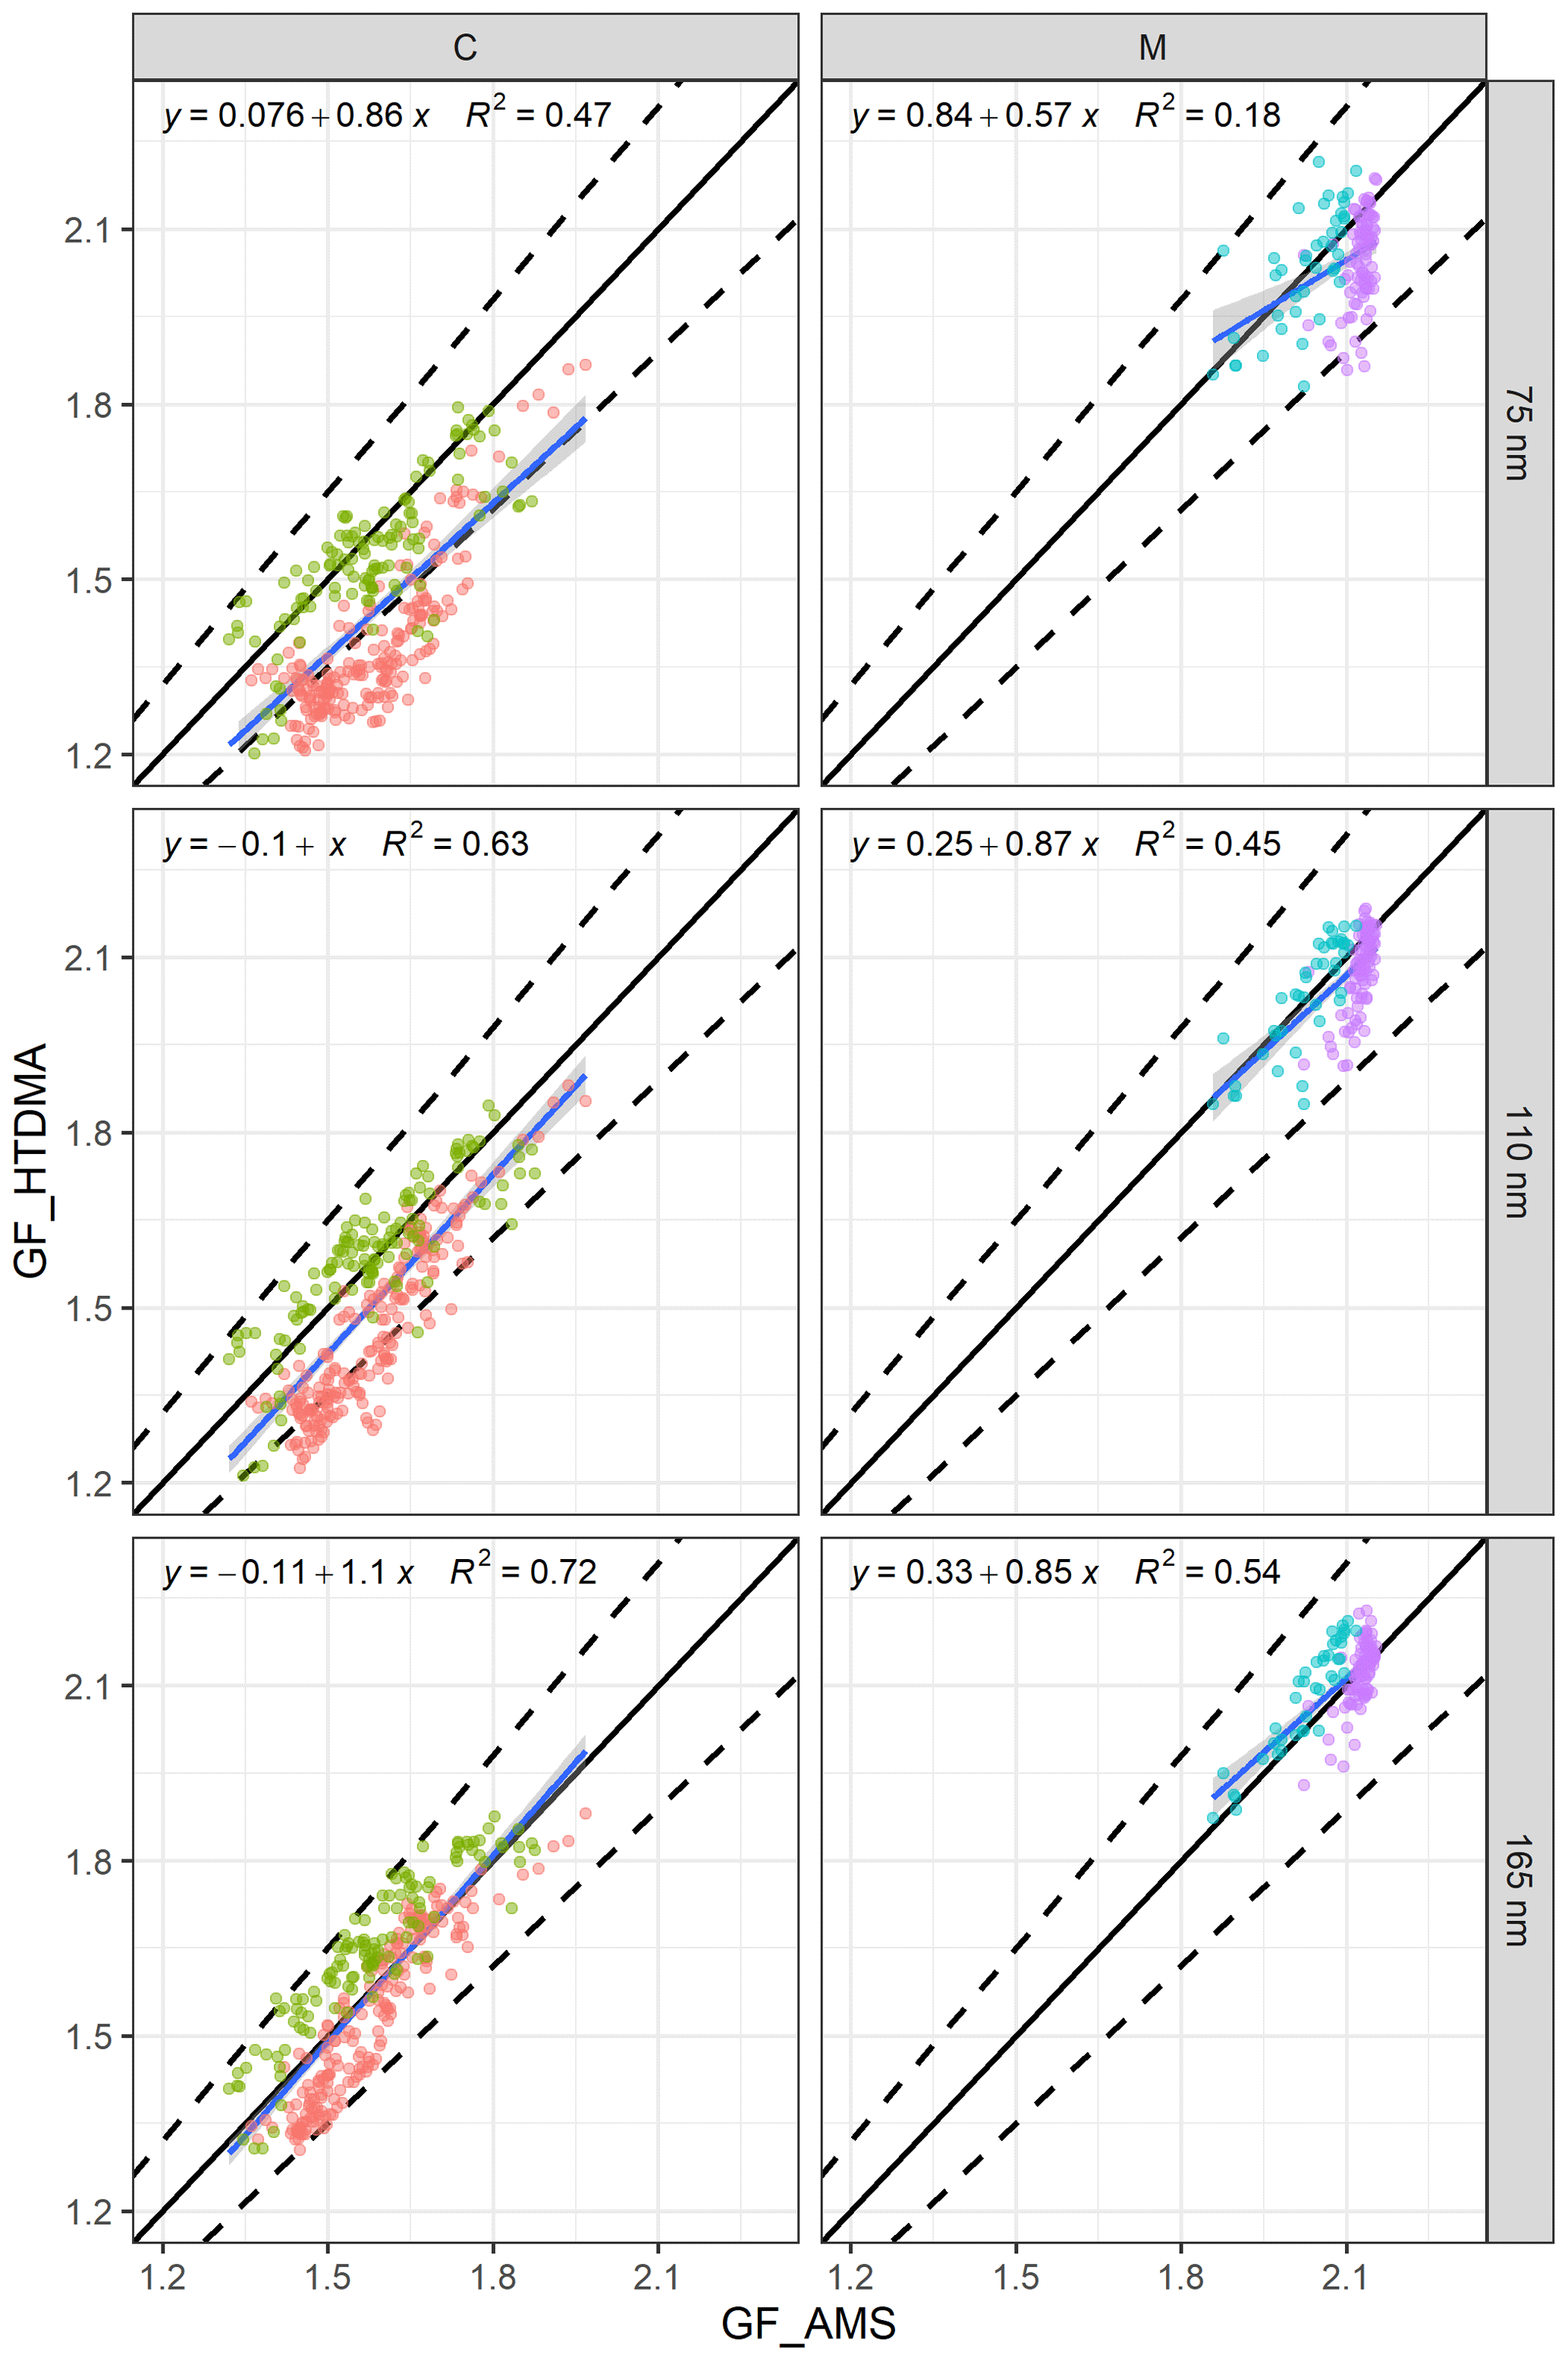
Figure 7The relationship between GF_AMS and GF_HTDMA (D0 of 75, 100 and 165 nm) of (a) continental events (C1 in red and C2 in green) and (b) marine events (M1 in blue and M2 in purple). The black line is the 1:1 line for continental (C) or marine (M) events, the dashed lines are the 10 % deviation and the blue line is the regression equation.
The regression lines approached the 1:1 line with increasing size. For example, the R2 values were 0.47 and 0.18 for 75 nm particles during continental and marine events, respectively. For aerosol with a D0 of 165 nm, the regression coefficients were 0.72 and 0.54, and the slopes were 1.1 and 0.85 for continental and marine events, respectively.
The regression results were reasonable, even for 75 nm particles, but they certainly improved with increasing size for the continental events; however, the improvement was not as significant for marine events (Fig. 7). Although a few data points were outside of the 10 % deviation range for 75 nm, the R2 for 75 nm was as low as 0.18 due to the lack of dynamic range in GF_AMS; nevertheless, over 95 % of the data points were well within the 10 % deviation, and all of the marine event data points were well within 10 % of the 1:1 line for 110 and 165 nm. Despite the fact that the above regressions suggested that a reasonable closure was achieved for continental and marine events, the closure results for each individual event were different. For 75 nm particles in C1, over 60 % of the estimated GFs were outside of the 10 % deviation range, whereas in C2 very few GFs fell outside of the 10 % deviation range. In contrast, for 165 nm particles, C1 GFs were typically overestimated, whereas C2 GFs were underestimated. The above results clearly demonstrated an increasing impact of the hydrophobic mode in smaller particles (Fig. 4) which was poorly captured by the bulk PM1 mass. Marine event GF_HTDMA and GF_AMS values were in good agreement, with 95 % of the data points lying within the ±10%. During individual marine events, over 80 % of the M1 GF values were underestimated, whereas M2 GFs were mostly overestimated. The regression slope of all of the data was 1, indicating that the GF_HTDMA of marine aerosol could be estimated fairly well based on AMS bulk PM1 measurements using the ZSR rule with the sea-salt concentration measured by AMS.
The overall very good agreement was a result of utilising sea-salt mass concentrations derived by AMS (Ovadnevaite et al., 2012). The result verifies AMS as an good technique for near-real-time sea-salt measurements. During the selected marine events, the PM1 aerosol volume fraction of sea salt ranged from 2 % to 95 %. In our study, the use of high time and mass resolution AMS data and the subsequent inclusion of sea-salt mass improved the closure greatly. As far as we are aware, this current chemical composition and hygroscopicity closure study is the first of its kind conducted on sea-salt-containing aerosol.
3.4 Closure uncertainty and error analysis
Although general agreement between the measured and estimated GF values was found in both continental and marine aerosol, the closure results for each event were slightly different. This motivated us to explore the cause of the closure errors by focusing on three metrics: (1) the O : C ratio, (2) the volume fraction of ammonium nitrate (vi(NH4NO3)) and (3) the aerosol mixing state.
The introduction of a constant GForg was considered to be the cause of a systematic error. The relationship between GForg and the organic oxidisation level is under intensive debate. In some studies, the GForg has been found to increase with an increasing O : C ratio in both chamber and ambient studies (Jimenez et al., 2009; Lambe et al., 2011; Massoli et al., 2010; Wong et al., 2011; Wu et al., 2016), and theoretical calculations have also demonstrated that GForg exhibits a linear dependence on the O : C ratio (Nakao, 2017). However, the correlation between GForg and the O : C ratio varies among aerosol sources, and some studies have reported no significant relationship (Chang et al., 2010; Suda et al., 2014).
Figure 8a shows the relationship between the O : C ratio and the GF deviation by plotting a normalised error |(GF_HTDMA − GF_AMS) / GF_HTDMA)|. When the O : C ratio was below 0.5, a slight overestimation was observed, but the deviation was less than 10 %; however, when the O : C ratio was between 0.5 and 1.25, no obvious pattern could be discerned. Freshly emitted hydrocarbon compounds have a relatively low O : C ratio and lower hygroscopicity; therefore, a GForg value of 1.1 is likely to cause an overestimation. When the O : C ratio increases to 0.6, the reported GForg value ranges from 1.15 to 1.4, depending on the air mass (Hong et al., 2018).
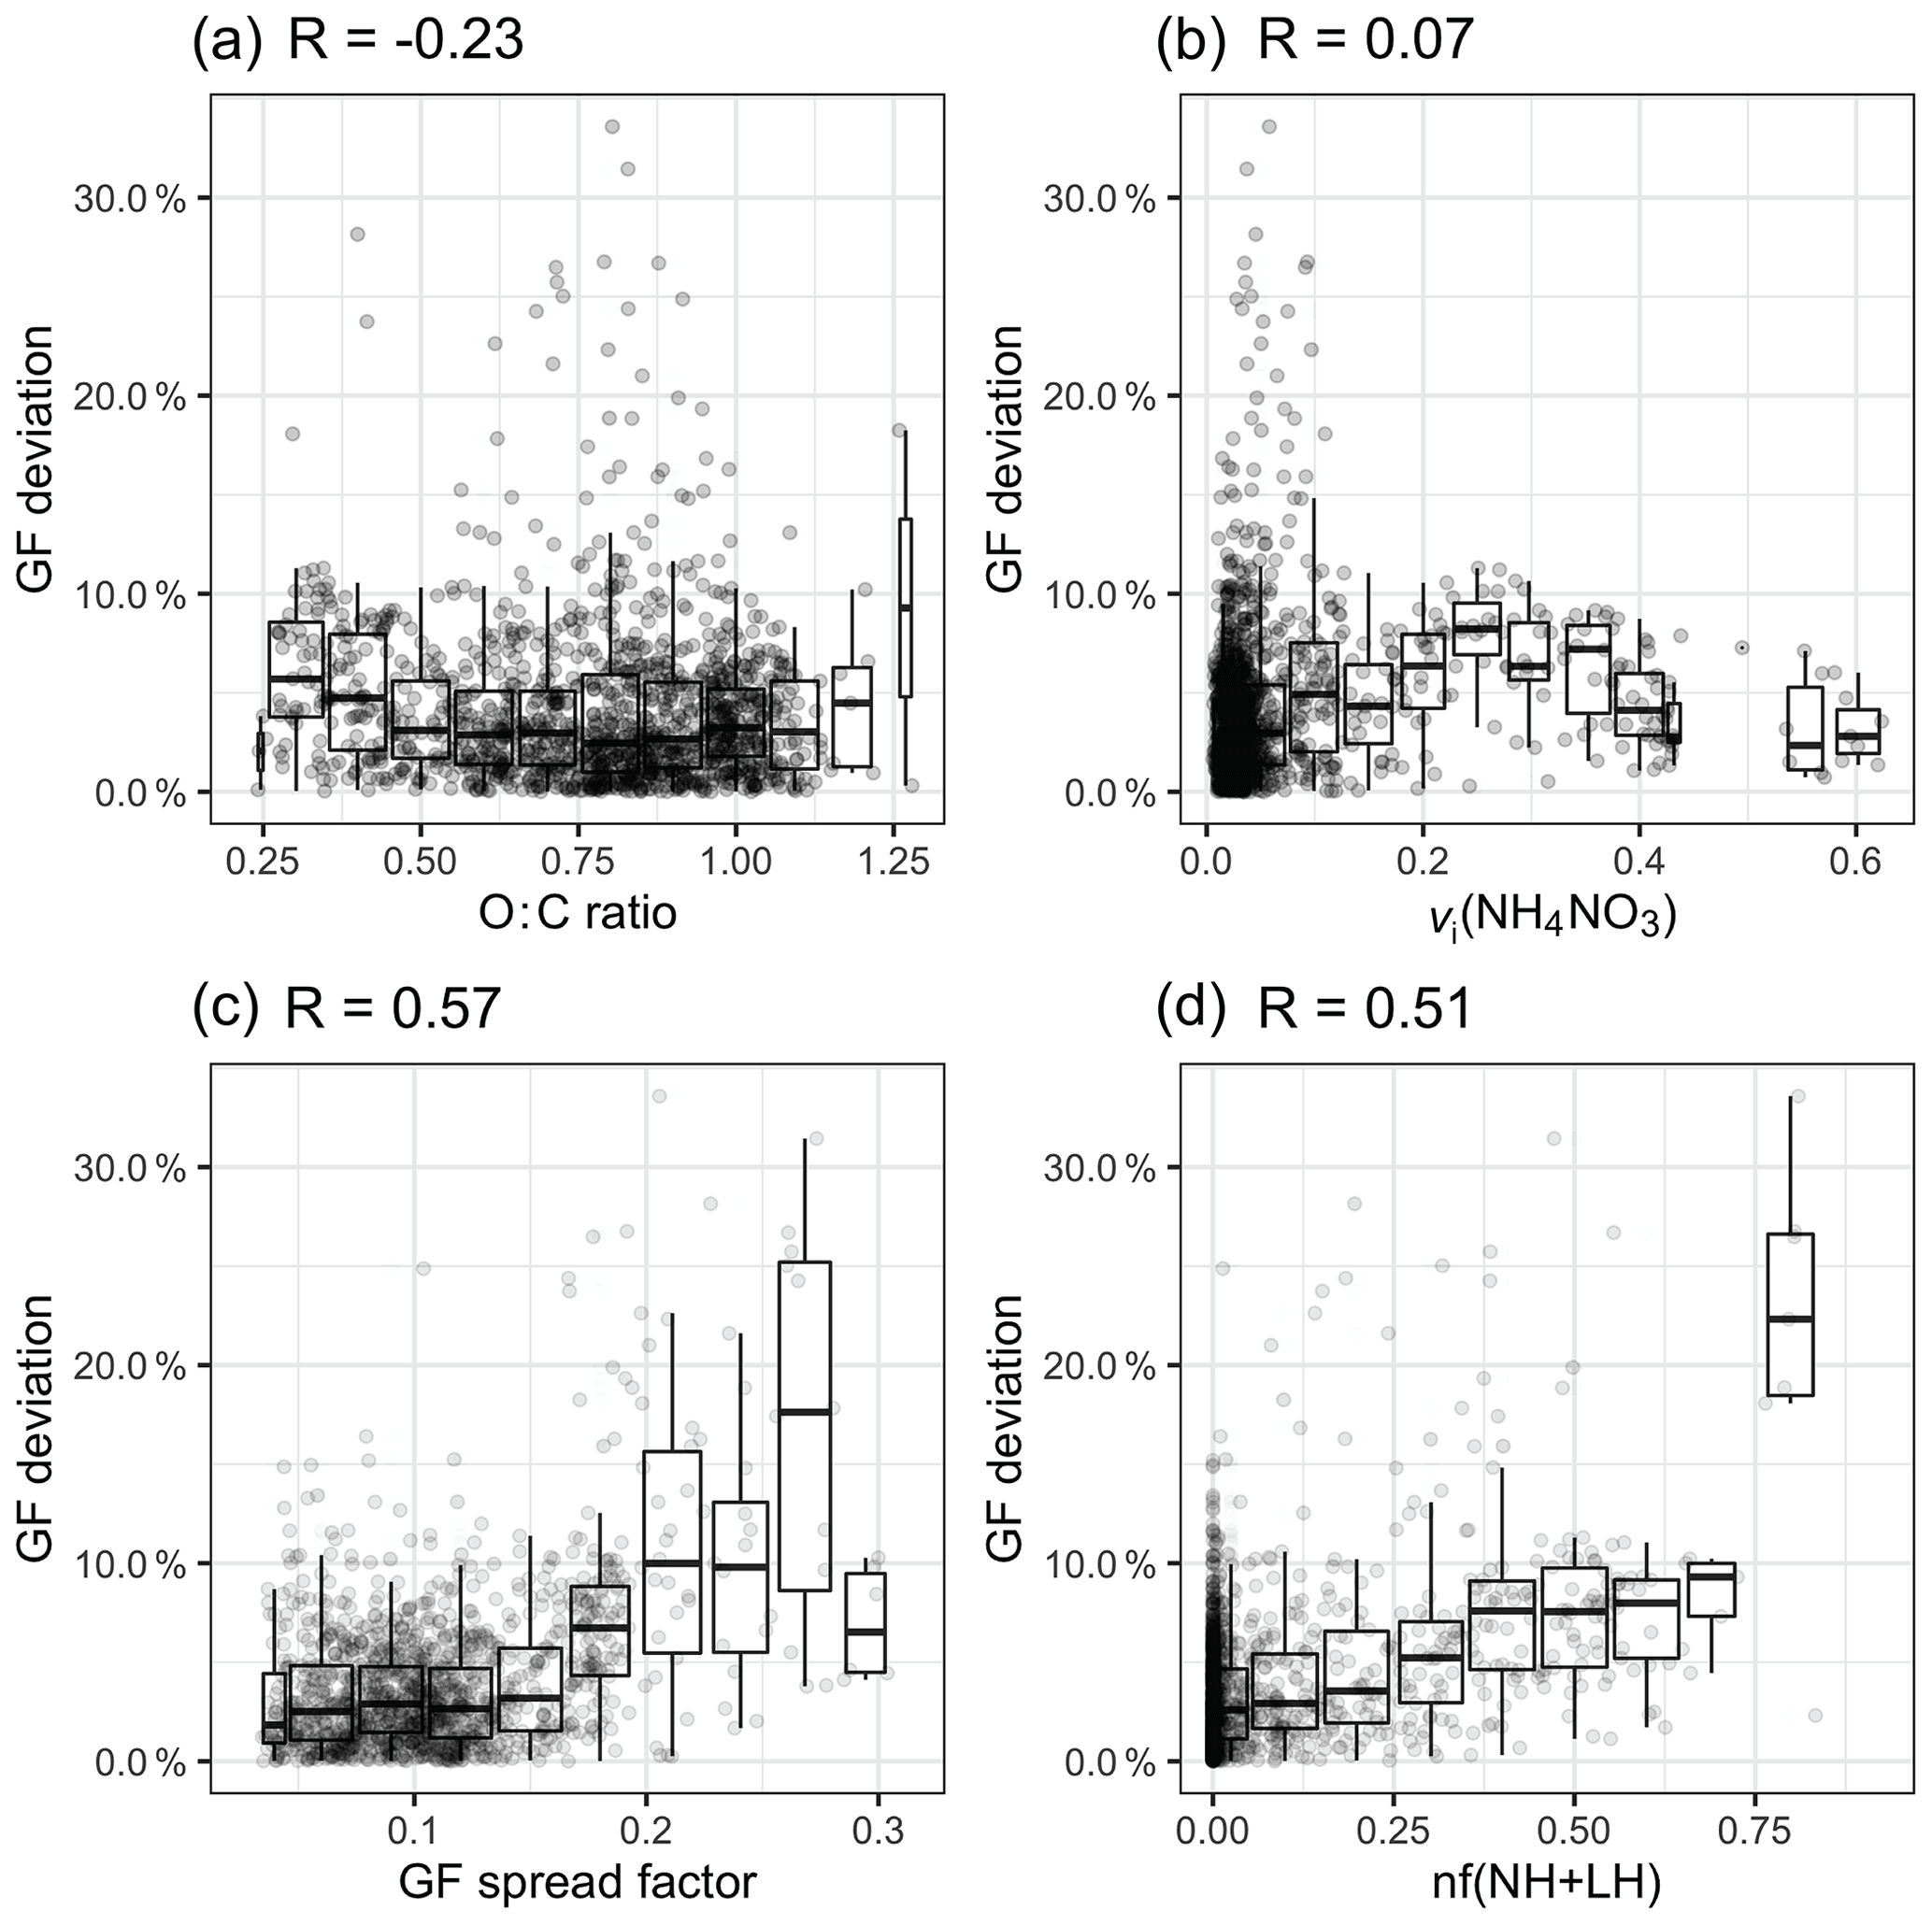
Figure 8The relationship between the GF deviation and (a) the O : C ratio, (b) the volume fraction of NH4NO3, (c) the GF spread factor and (d) the nf(NH + LH) over the whole study period.
The introduction of a constant density and constant GForg may not be valid for every event, and is likely to cause slight overestimation, but this cannot explain deviations above 10 %, at least for the aerosol observed at Mace Head.
Another reason for the apparent overestimation of GF_AMS was considered to be the evaporation of NH4NO3 in the HTDMA instrument, which has been implicated in causing closure failure during nitrate-enriched periods in previous closure studies (Gysel et al., 2007; 2001; Swietlicki et al., 1999). Gysel et al. (2007) reported that 50 %–60 % of the volume of NH4NO3 evaporated within the HTDMA for particle diameters ranging from 50 to 60 nm. Despite this possible cause of the underestimation of GF in the HTDMA, the presence of nitrate is unlikely to be the main cause of the discrepancy in our study for several reasons. First, the residence time of aerosols in our HTDMA system is about 10 s, which is significantly shorter than other systems such as the HTDMA in Gysel et al. (2007), which has a residence time of approximately 60 s and resulted in significant NH4NO3 evaporation. Second, no obvious correlation was found between the GF deviation and the volume fraction (vi) of NH4NO3 (R=0.07; Fig. 8b). Therefore, as far as our study is concerned, there is no evidence that ammonium nitrate evaporation is responsible for the closure discrepancy.
The mixing state of aerosol can influence the hygroscopicity closure in two ways. First, the accuracy of AMS measurements is determined by the collection efficiency: for internally mixed aerosols the efficiency is constant for all particles, whereas in external mixtures the application of a constant collection efficiency may produce differences between the real and measured chemical species concentration. Second, externally mixed aerosol has a size-dependent chemical composition where the bulk chemistry tends to be more representative of larger particles (165 nm) that carry the bulk of mass over smaller particles (35 nm) that contribute negligibly to mass. For external mixture, the bulk chemical measurement of PM1 mass may induce errors at smaller sizes, whereas for internal mixture, the error tends to be smaller.
Two metrics were adapted to represent the mixing state: (1) the GF spread factor and (2) the number fraction of the NH and LH modes, nf(NH + LH), both of which were derived from the GF-PDF of 165 nm aerosols. The GF spread factor was defined as the standard deviation of the GF-PDF divided by an arithmetic mean GF (Stolzenburg and McMurry, 1988). As the MH mode was present during every event at every particle size, the number fraction of the NH and LH (nf(NH + LH)) modes could be used as a metric of the external mixing (Ching et al., 2017; Su et al., 2010). As shown in Fig. 8c and d, the GF spread factor and the nf(NH + LH) factor have the largest regression coefficient with GF deviation (R of 0.51 and 0.57, respectively).
As shown in Fig. 8c, when the GF spread factor is less than 0.2, most of the GF deviations remain within 10 %. When the GF spread factor increases over 0.2, the range of GF deviation increases to 30 %. A similar relationship is found between nf(NH + LH) and the GF deviation, but the tendency is constrained within 10 %, and many outliers cannot be captured by increasing nf(NH + LH). This is because the relationship between nf(NH + LH) and the GF spread factor is not linear. Certain aerosol populations, such as an external mixture of inorganics and sea salt, that do not contain the NH and LH modes could exhibit a larger GF spread factor. It is also possible that aerosol with a small spread factor value could contain a significant number of particles in the NH and LH modes. Above all, we conclude that, although the scatter is larger, aerosol with a larger GF spread factor tends to be associated with high GF deviation. Two examples of GF-PDFs with a GF spread factor larger than 0.2 are shown in Fig. S6. These examples suggest the existence of a multi-modal distribution. Comparing their chemical composition during C and M events, the presence of sea salt and elevated BC-containing particles was found, as shown in Fig. S7, suggesting that the externally mixed and anthropogenically impacted aerosol and/or sea-salt-containing polluted aerosol are responsible for the discrepancy. Therefore, we suggest that great care must be exercised in estimating hygroscopicity using the bulk PM1 chemical composition when the BC concentration exceeds 0.1 µg m−3 and the sea salt concentration is below 0.5 µg m−3. It has to be noted that the frequency of occurrence of a GF spread factor greater than 0.2 is as low as 1 % at Mace Head, suggesting that the sea-salt-containing bulk PM1 chemical composition can generally be used to achieve closure with aerosol hygroscopic properties.
In this study, data from a HTDMA and an AMS instrument deployed at Mace Head Atmospheric Research Station were used to characterise aerosol hygroscopicity and to elucidate the link with aerosol chemical composition by taking the advantage of the high temporal resolution of the two instruments. In winter, which is a period of low biological activity at Mace Head, the sampled aerosols were mostly externally mixed, as revealed by the GF-PDFs. The continental and marine air masses were examined in detail in terms of the influence of the chemical components on aerosol GFs, and marine aerosol had significantly higher hygroscopicity than continental aerosol. General agreement was achieved between the estimated and measured GFs for 165 nm aerosols. For aerosol from continental events, general agreement was achieved between the estimated and measured hygroscopicity GFs for aerosol with a D0 of 165 nm, whereas for marine aerosol, the GF of particles larger than 75 nm could be estimated reasonably. A closure between hygroscopicity and chemical composition was achieved for the first time for marine aerosol with a large sea-salt mass loading without significant systematic errors. The ZSR rule for the hygroscopicity estimation of marine aerosol was also validated for the first time with sea salt measured by HR-ToF-AMS.
The analysis of statistical deviations from perfect closure indicated that a highly external mixing state (a GF spread factor greater than 0.2) can have the largest impact when comparing hygroscopicity derived from bulk chemical composition data and size-dependent hygroscopicity measurements. This study opens up new opportunities for predicting the physico-chemical properties of marine aerosols with HR-ToF-AMS. It should be noted that good closure for marine aerosol has only been validated for wintertime and is yet to be explored for summertime, when both primary and secondary biogenic organic matter concentrations are expected to be at their highest due to enhanced ocean biological productivity.
Data used in the study are available from the first author upon request (w.xu2@nuigalway.ie).
The supplement related to this article is available online at: https://doi.org/10.5194/acp-20-3777-2020-supplement.
COD and DC conceived the study, WX analysed the data, JO provided the AMS data, and WX and KNF prepared the paper with contributions from all co-authors.
The authors declare that they have no conflict of interest.
The authors wish to acknowledge Jakub Bialek for acquiring the HTDMA data.
This research has been supported by the EPA-Ireland (AEROSOURCE, grant no. 2016-CCRP-MS-31), COLOSSAL COST Action CA16109, the China Scholarship Council (grant no. 201706310154) and MaREI (Marine and Renewable Energy Ireland).
This paper was edited by Kostas Tsigaridis and reviewed by two anonymous referees.
Allan, J. D., Delia, A. E., Coe, H., Bower, K. N., Alfarra, M. R., Jimenez, J. L., Middlebrook, A. M., Drewnick, F., Onasch, T. B., Canagaratna, M. R., Jayne, J. T., and Worsnop, D. R.: A generalised method for the extraction of chemically resolved mass spectra from aerodyne aerosol mass spectrometer data, J. Aerosol Sci., 35, 909–922, https://doi.org/10.1016/j.jaerosci.2004.02.007, 2004.”
Asmi, E., Frey, A., Virkkula, A., Ehn, M., Manninen, H. E., Timonen, H., Tolonen-Kivimäki, O., Aurela, M., Hillamo, R., and Kulmala, M.: Hygroscopicity and chemical composition of Antarctic sub-micrometre aerosol particles and observations of new particle formation, Atmos. Chem. Phys., 10, 4253–4271, https://doi.org/10.5194/acp-10-4253-2010, 2010.
Berg, O. H., Swietlicki, E., and Krejci, R.: Hygroscopic growth of aerosol particles in the marine boundary layer over the Pacific and Southern Oceans during the First Aerosol Characterization Experiment (ACE 1), J. Geophys. Res.-Atmos., 103, 16535–16545, https://doi.org/10.1029/97JD02851, 1998.
Bialek, J., Dall'Osto, M., Monahan, C., Beddows, D., and O'Dowd, C. D.: On the contribution of organics to the North East Atlantic aerosol number concentration, Environ. Res. Lett., 7, 044013, https://doi.org/10.1088/1748-9326/7/4/044013, 2012.
Bialek, J., Dall Osto, M., Vaattovaara, P., Decesari, S., Ovadnevaite, J., Laaksonen, A., and O'Dowd, C.: Hygroscopic and chemical characterisation of Po Valley aerosol, Atmos. Chem. Phys., 14, 1557–1570, https://doi.org/10.5194/acp-14-1557-2014, 2014.
Chang, R. Y.-W., Slowik, J. G., Shantz, N. C., Vlasenko, A., Liggio, J., Sjostedt, S. J., Leaitch, W. R., and Abbatt, J. P. D.: The hygroscopicity parameter (κ) of ambient organic aerosol at a field site subject to biogenic and anthropogenic influences: relationship to degree of aerosol oxidation, Atmos. Chem. Phys., 10, 5047–5064, https://doi.org/10.5194/acp-10-5047-2010, 2010.
Ching, J., Fast, J., West, M., and Riemer, N.: Metrics to quantify the importance of mixing state for CCN activity, Atmos. Chem. Phys., 17, 7445–7458, https://doi.org/10.5194/acp-17-7445-2017, 2017.
DeCarlo, P. F., Slowik, J. G., Worsnop, D. R., Davidovits, P., and Jimenez, J. L.: Particle Morphology and Density Characterization by Combined Mobility and Aerodynamic Diameter Measurements. Part 1: Theory, Aerosol Sci. Tech., 38, 1185–1205, https://doi.org/10.1080/027868290903907, 2004.
DeCarlo, P. F., Kimmel, J. R., Trimborn, A., Northway, M. J., Jayne, J. T., Aiken, A. C., Gonin, M., Fuhrer, K., Horvath, T., Docherty, K. S., Worsnop, D. R., and Jimenez, J. L.: Field-Deployable, High-Resolution, Time-of-Flight Aerosol Mass Spectrometer, Anal. Chem., 78, 8281–8289, https://doi.org/10.1021/ac061249n, 2006.
Duplissy, J., Gysel, M., Sjogren, S., Meyer, N., Good, N., Kammermann, L., Michaud, V., Weigel, R., Martins dos Santos, S., Gruening, C., Villani, P., Laj, P., Sellegri, K., Metzger, A., McFiggans, G. B., Wehrle, G., Richter, R., Dommen, J., Ristovski, Z., Baltensperger, U., and Weingartner, E.: Intercomparison study of six HTDMAs: results and recommendations, Atmos. Meas. Tech., 2, 363–378, https://doi.org/10.5194/amt-2-363-2009, 2009.
Fors, E. O., Swietlicki, E., Svenningsson, B., Kristensson, A., Frank, G. P., and Sporre, M.: Hygroscopic properties of the ambient aerosol in southern Sweden – a two year study, Atmos. Chem. Phys., 11, 8343–8361, https://doi.org/10.5194/acp-11-8343-2011, 2011.
Fossum, K. N., Ovadnevaite, J., Ceburnis, D., Dall'Osto, M., Marullo, S., Bellacicco, M., Simó, R., Liu, D., Flynn, M., Zuend, A., and O'Dowd, C. D.: Summertime Primary and Secondary Contributions to Southern Ocean Cloud Condensation Nuclei, Sci. Rep., 8, 1295, https://doi.org/10.1038/s41598-018-32047-4, 2018.
Gysel, M., Weingartner, E., and Baltensperger, U.: Hygroscopicity of Aerosol Particles at Low Temperatures. 2. Theoretical and Experimental Hygroscopic Properties of Laboratory Generated Aerosols, Environ. Sci. Technol., 36, 63–68, https://doi.org/10.1021/es010055g, 2001.
Gysel, M., Crosier, J., Topping, D. O., Whitehead, J. D., Bower, K. N., Cubison, M. J., Williams, P. I., Flynn, M. J., McFiggans, G. B., and Coe, H.: Closure study between chemical composition and hygroscopic growth of aerosol particles during TORCH2, Atmos. Chem. Phys., 7, 6131–6144, https://doi.org/10.5194/acp-7-6131-2007, 2007.
Gysel, M., McFiggans, G., and Coe, H.: Inversion of tandem differential mobility analyser (TDMA) measurements, J. Aerosol Sci., 40, 134–151, https://doi.org/10.1016/j.jaerosci.2008.07.013, 2009.
Hong, J., Xu, H., Tan, H., Yin, C., Hao, L., Li, F., Cai, M., Deng, X., Wang, N., Su, H., Cheng, Y., Wang, L., Petäjä, T., and Kerminen, V.-M.: Mixing state and particle hygroscopicity of organic-dominated aerosols over the Pearl River Delta region in China, Atmos. Chem. Phys., 18, 14079–14094, https://doi.org/10.5194/acp-18-14079-2018, 2018.
Jimenez, J. L., Canagaratna, M. R., Donahue, N. M., Prevot, A. S. H., Zhang, Q., Kroll, J. H., DeCarlo, P. F., Allan, J. D., Coe, H., Ng, N. L., Aiken, A. C., Docherty, K. S., Ulbrich, I. M., Grieshop, A. P., Robinson, A. L., Duplissy, J., Smith, J. D., Wilson, K. R., Lanz, V. A., Hueglin, C., Sun, Y., Tian, J., Laaksonen, A., Raatikainen, T., Rautiainen, J., Vaattovaara, P., Ehn, M., Kulmala, M., Tomlinson, J. M., Collins, D. R., Cubison, M. J., E, Dunlea, J., Huffman, J. A., Onasch, T. B., Alfarra, M. R., Williams, P. I., Bower, K., Kondo, Y., Schneider, J., Drewnick, F., Borrmann, S., Weimer, S., Demerjian, K., Salcedo, D., Cottrell, L., Griffin, R., Takami, A., Miyoshi, T., Hatakeyama, S., Shimono, A., Sun, J. Y., Zhang, Y. M., Dzepina, K., Kimmel, J. R., Sueper, D., Jayne, J. T., Herndon, S. C., Trimborn, A. M., Williams, L. R., Wood, E. C., Middlebrook, A. M., Kolb, C. E., Baltensperger, U., and Worsnop, D. R.: Evolution of organic aerosols in the atmosphere, Science, 326, 1525–1529, https://doi.org/10.1126/science.1180353, 2009.
Kaku, K. C., Hegg, D. A., Covert, D. S., Santarpia, J. L., Jonsson, H., Buzorius, G., and Collins, D. R.: Organics in the Northeastern Pacific and their impacts on aerosol hygroscopicity in the subsaturated and supersaturated regimes, Atmos. Chem. Phys., 6, 4101–4115, https://doi.org/10.5194/acp-6-4101-2006, 2006.
Kamilli, K. A., Poulain, L., Held, A., Nowak, A., Birmili, W., and Wiedensohler, A.: Hygroscopic properties of the Paris urban aerosol in relation to its chemical composition, Atmos. Chem. Phys., 14, 737–749, https://doi.org/10.5194/acp-14-737-2014, 2014.
Kreidenweis, S. M. and Asa-Awuku, A.: Aerosol hygroscopicity: Particle water content and its role in atmospheric processes, in: Treatise on Geochemistry, Elsevier, Oxford, 331–361, 2014.
Lambe, A. T., Onasch, T. B., Massoli, P., Croasdale, D. R., Wright, J. P., Ahern, A. T., Williams, L. R., Worsnop, D. R., Brune, W. H., and Davidovits, P.: Laboratory studies of the chemical composition and cloud condensation nuclei (CCN) activity of secondary organic aerosol (SOA) and oxidized primary organic aerosol (OPOA), Atmos. Chem. Phys., 11, 8913–8928, https://doi.org/10.5194/acp-11-8913-2011, 2011.
Liu, B. Y. H., Pui, D. Y. H., Whitby, K. T., Kittelson, D. B., Kousaka, Y., and McKenzie, R. L.: the aerosol mobility chromatograph: a new detectoer for sulfuric acid aerosols, Atmos. Environ., 12, 99–104, https://doi.org/10.1016/0004-6981(78)90192-0, 1978.
Mahish, M. and Collins, D. R.: Analysis of a multi-year record of size-resolved hygroscopicity measurements from a rural site in the U.S, Aerosol Air Qual. Res., 17, 1489–1500, https://doi.org/10.4209/aaqr.2016.10.0443, 2017.
Massoli, P., Lambe, A. T., Ahern, A. T., Williams, L. R., Ehn, M., Mikkila, J., Canagaratna, M. R., Brune, W. H., Onasch, T. B., Jayne, J. T., Petaja, T., Kulmala, M., Laaksonen, A., Kolb, C. E., Davidovits, P., and Worsnop, D. R.: Relationship between aerosol oxidation level and hygroscopic properties of laboratory generated secondary organic aerosol (SOA) particles, Geophys. Res. Lett., 37, L24801, https://doi.org/10.1029/2010GL045258, 2010.
Middlebrook, A. N., Bahreini, R., Jimenez, J. L., and Cangaratna M. R.: Evaluation of composition-dependent collection efficiencies for the Aerodyne Aerosol Mass Spectrometer using field data, Aerosol Sci. Tech., 46, 258–271, https://doi.org/10.1080/02786826.2011.620041, 2012.
Nakao, S.: Why would apparent κ linearly change with O ∕ C? Assessing the role of volatility, solubility, and surface activity of organic aerosols, Aerosol Sci. Tech., 51, 1377–1388, https://doi.org/10.1080/02786826.2017.1352082, 2017.
O'Connor, T. C., Jennings, S. G., and O'Dowd, C. D.: Highlights of fifty years of atmospheric aerosol research at Mace Head, Atmos. Res., 90, 338–355, https://doi.org/10.1016/j.atmosres.2008.08.014, 2008.
O'Dowd, C. D. and de Leeuw, G.: Marine aerosol production: a review of the current knowledge, Philos. T. Roy. Soc. A, 365, 1753–1774, https://doi.org/10.1098/rsta.2007.2043, 2007.
O'Dowd, C., Ceburnis, D., Ovadnevaite, J., Vaishya, A., Rinaldi, M., and Facchini, M. C.: Do anthropogenic, continental or coastal aerosol sources impact on a marine aerosol signature at Mace Head?, Atmos. Chem. Phys., 14, 10687–10704, https://doi.org/10.5194/acp-14-10687-2014, 2014.
Ovadnevaite, J., Ceburnis, D., Canagaratna, M., Berresheim, H., Bialek, J., Martucci, G., Worsnop, D. R., and O'Dowd, C. D.: On the effect of wind speed on submicron sea salt mass concentrations and source fluxes, J. Geophys. Res. Atmos., 117, D16201, https://doi.org/10.1029/2011jd017379, 2012.
Ovadnevaite, J., Ceburnis, D., Leinert, S., Dall'Osto, M., Canagaratna, M., O'Doherty, S., Berresheim, H., and O'Dowd, C. D.: Submicron NE Atlantic marine aerosol chemical composition and abundance: Seasonal trends and air mass categorization, J. Geophys. Res.-Atmos., 119, 11850–11863, https://doi.org/10.1002/2013JD021330, 2014a.
Ovadnevaite, J., Manders, A., de Leeuw, G., Ceburnis, D., Monahan, C., Partanen, A.-I., Korhonen, H., and O'Dowd, C. D.: A sea spray aerosol flux parameterization encapsulating wave state, Atmos. Chem. Phys., 14, 1837–1852, https://doi.org/10.5194/acp-14-1837-2014, 2014b.
Petzold, A. and Schönlinner, M.: Multi-angle absorption photometry – a new method for the measurement of aerosol light absorption and atmospheric black carbon, J. Aerosol Sci., 35, 421–441, https://doi.org/10.1016/j.jaerosci.2003.09.005, 2004.
Rader, D. J. and McMurry, P. H.: Application of the tandem differential mobility analyzer to studies of droplet growth or evaporation, J. Aerosol Sci., 17, 771–787, https://doi.org/10.1016/0021-8502(86)90031-5, 1986.
Rissler, J., Vestin, A., Swietlicki, E., Fisch, G., Zhou, J., Artaxo, P., and Andreae, M. O.: Size distribution and hygroscopic properties of aerosol particles from dry-season biomass burning in Amazonia, Atmos. Chem. Phys., 6, 471–491, https://doi.org/10.5194/acp-6-471-2006, 2006.
Rolph, G., Stein, A., and Stunder, B.: Real-time Environmental Applications and Display sYstem: READY, Environ. Modell. Softw., 95, 210–228, https://doi.org/10.1016/j.envsoft.2017.06.025, 2017.
Stokes, R. H. and Robinson, R. A.: Interactions in Aqueous Nonelectrolyte Solutions. I. Solute-Solvent Equilibria, J. Phys. Chem., 70, 2126–2131, https://doi.org/10.1021/j100879a010, 1966.
Stolzenburg, M. R. and McMurry, P. H.: TDMAFIT User's Manual, Department of Mechanical Engineering, Particle Technology Laboratory, University of Minnesota, Minnesota, 1988.
Su, H., Rose, D., Cheng, Y. F., Gunthe, S. S., Massling, A., Stock, M., Wiedensohler, A., Andreae, M. O., and Pöschl, U.: Hygroscopicity distribution concept for measurement data analysis and modeling of aerosol particle mixing state with regard to hygroscopic growth and CCN activation, Atmos. Chem. Phys., 10, 7489–7503, https://doi.org/10.5194/acp-10-7489-2010, 2010.
Suda, S. R., Petters, M. D., Yeh, G. K., Strollo, C., Matsunaga, A., Faulhaber, A., Ziemann, P. J., Prenni, A. J., Carrico, C. M., Sullivan, R. C., and Kreidenweis, S. M.: Influence of functional groups on organic aerosol cloud condensation nucleus activity, Environ. Sci. Technol., 48, 10182–10190, https://doi.org/10.1021/es502147y, 2014.
Swietlicki, E., Zhou, J., Berg, O. H., Martinsson, B. G., Frank, G., Cederfelt, S.-I., Dusek, U., Berner, A., Birmili, W., Wiedensohler, A., Yuskiewicz, B., and Bower, K. N.: A closure study of sub-micrometer aerosol particle hygroscopic behaviour, Atmos. Res., 50, 205–240, https://doi.org/10.1016/s0169-8095(98)00105-7, 1999.
Swietlicki, E., Zhou, J., Covert, D. S., Hameri, K., Busch, B., Vakeva, M., Dusek, U., Berg, O. H., Wiedensohler, A., Aalto, P. P., Makela, J., Martinsson, B. G., Papaspiropoulos, G., Mentes, B., Frank, G., and Stratmann, F.: Hygroscopic properties of aerosol particles in the north- eastern Atlantic during ACE-2, Tellus B, 52, 201–227, https://doi.org/10.1034/j.1600-0889.2000.00036.x, 2000.
Swietlicki, E., Hansson, H. C., Hämeri, K., Svenningsson, B., Atmospheric, A. M., McFiggans, G., McMurry, P. H., Petaja, T., Tunved, P., Gysel, M., Topping, D. O., Weingartner, E., Baltensperger, U., Rissler, J., Wiedensohler, A., and Kulmala, M.: Hygroscopic properties of submicrometer atmospheric aerosol particles measured with H-TDMA instruments in various environments – a review, Tellus B, 60, 432–469, https://doi.org/10.1111/j.1600-0889.2008.00350.x, 2008.
Tang, M., Guo, L., Bai, Y., Huang, R.-J., Wu, Z., Wang, Z., Zhang, G., Ding, X., Hu, M., and Wang, X.: Impacts of methanesulfonate on the cloud condensation nucleation activity of sea salt aerosol, Atmos. Environ., 201, 13–17, https://doi.org/10.1016/j.atmosenv.2018.12.034, 2018.
Tang, M., Chan, C. K., Li, Y. J., Su, H., Ma, Q., Wu, Z., Zhang, G., Wang, Z., Ge, M., Hu, M., He, H., and Wang, X.: A review of experimental techniques for aerosol hygroscopicity studies, Atmos. Chem. Phys., 19, 12631–12686, https://doi.org/10.5194/acp-19-12631-2019, 2019.
Twomey, S.: Pollution and the planetary albedo, Atmos. Environ., 8, 1251–1256, https://doi.org/10.1016/0004-6981(74)90004-3, 1974.
Twomey, S.: The influence of pollution on the shortwave abedo of clouds, J. Atmos. Sci., 34, 1149–1152, https://doi.org/10.1175/1520-0469(1977)034<1149:tiopot>2.0.co;2, 1977.
Wang, Y., Li, Z., Zhang, Y., Du, W., Zhang, F., Tan, H., Xu, H., Fan, T., Jin, X., Fan, X., Dong, Z., Wang, Q., and Sun, Y.: Characterization of aerosol hygroscopicity, mixing state, and CCN activity at a suburban site in the central North China Plain, Atmos. Chem. Phys., 18, 11739–11752, https://doi.org/10.5194/acp-18-11739-2018, 2018.
Wong, J. P. S., Lee, A. K. Y., Slowik, J. G., Cziczo, D. J., Leaitch, W. R., Macdonald, A., and Abbatt, J. P. D.: Oxidation of ambient biogenic secondary organic aerosol by hydroxyl radicals: Effects on cloud condensation nuclei activity, Geophys. Res. Lett., 38, L22805, https://doi.org/10.1029/2011GL049351, 2011.
Wu, Z. J., Zheng, J., Shang, D. J., Du, Z. F., Wu, Y. S., Zeng, L. M., Wiedensohler, A., and Hu, M.: Particle hygroscopicity and its link to chemical composition in the urban atmosphere of Beijing, China, during summertime, Atmos. Chem. Phys., 16, 1123–1138, https://doi.org/10.5194/acp-16-1123-2016, 2016.
Yeung, M. C., Lee, B. P., Li, Y. J., and Chan, C. K.: Simultaneous HTDMA and HR-ToF-AMS measurements at the HKUST Supersite in Hong Kong in 2011, J. Geophys. Res.-Atmos., 119, 9864–9883, https://doi.org/10.1002/2013JD021146, 2014.
Zhou, J., Swietlicki, E., Berg, O. H., Aalto, P. P., Hameri, K., Nilsson, E. D., and Leck, C.: Hygroscopic properties of aerosol particles over the central Arctic Ocean during summer, J. Geophys. Res.-Atmos., 106, 32111–32123, https://doi.org/10.1029/2000JD900426, 2001.
Zieger, P., Väisänen, O., Corbin, J. C., and Partridge, D. G.: Revising the hygroscopicity of inorganic sea salt particles, Nat. Comm., 8, 15883, https://doi.org/10.1038/ncomms15883, 2017.
Zuend, A., Marcolli, C., Booth, A. M., Lienhard, D. M., Soonsin, V., Krieger, U. K., Topping, D. O., McFiggans, G., Peter, T., and Seinfeld, J. H.: New and extended parameterization of the thermodynamic model AIOMFAC: calculation of activity coefficients for organic-inorganic mixtures containing carboxyl, hydroxyl, carbonyl, ether, ester, alkenyl, alkyl, and aromatic functional groups, Atmos. Chem. Phys., 11, 9155–9206, https://doi.org/10.5194/acp-11-9155-2011, 2011.