the Creative Commons Attribution 4.0 License.
the Creative Commons Attribution 4.0 License.
 | 26 Mar 2020
Molecular markers of biomass burning and primary biological aerosols in urban Beijing: size distribution and seasonal variation
Shaofeng Xu
Lujie Ren
Yunchao Lang
Shengjie Hou
Hong Ren
Lianfang Wei
Libin Wu
Junjun Deng
Xiaole Pan
Zifa Wang
Yafang Cheng
Biomass burning and primary biological aerosol particles account for an important part of urban aerosols. Floods of studies have been conducted on the chemical compositions of fine aerosols (PM2.5) in megacities where the haze pollution is one of the severe environmental issues in China. However, little is known about their size distributions in atmospheric aerosols in the urban boundary layer. Here, size-segregated aerosol samples were collected in Beijing during haze and clear days from April 2017 to January 2018. Three anhydrosugars, six primary saccharides and four sugar alcohols in these samples were identified and quantified by gas chromatography/mass spectrometry (GC/MS). Higher concentrations of a biomass burning tracer, levoglucosan, were detected in autumn and winter than in other seasons. Sucrose, glucose, fructose, mannitol and arabitol were more abundant in the bloom and glowing seasons. A particularly high level of trehalose was found in spring, which was largely associated with the Asian dust outflows. Anhydrosugars, xylose, maltose, inositol and erythritol are mainly present in the fine mode (<2.1 µm), while the others showed the coarse-mode preference. The concentrations of measured tracers of biomass burning particles and primary biological particles in the haze events were higher than those in the non-hazy days, with enrichment factors of 2–10. Geometric mean diameters (GMDs) of molecular markers of biomass burning and primary biological aerosols showed that there was no significant difference in the coarse mode (>2.1 µm) between the haze and non-haze samples, while a size shift towards large particles and large GMDs in the fine fraction (<2.1 µm) was detected during the hazy days, which highlights that the stable meteorological conditions with high relative humidity in urban Beijing may favor the condensation of organics onto coarse particles.The contributions of reconstructed primary organic carbon (POC) by tracer-based methods from plant debris, fungal spores and biomass burning to aerosol OC in the total-mode particles were in the ranges of 0.09 %–0.30 % (on average 0.21 %), 0.13 %–1.0 % (0.38 %) and 1.2 %–7.5 % (4.5 %), respectively. This study demonstrates that the contribution of biomass burning was significant in Beijing throughout the whole year with the predominance in the fine mode, while the contributions of plant debris and fungal spores dominated in spring and summer in the coarse mode, especially in sizes >5.8 µm. Our observations demonstrate that the sources, abundance and chemical composition of urban aerosol particles are strongly size dependent in Beijing, which is important to better understand the environmental and health effects of urban aerosols and should be considered in air quality and climate models.
- Article
(4157 KB) -
Supplement
(744 KB) - BibTeX
- EndNote


Organic aerosols (OAs), one of the primary contributors of atmospheric aerosols, account for 20 %–90 % of submicron aerosols. Numerous studies found that OAs have a significant impact on the hydrological cycle and global climate (Jimenez et al., 2009; Kanakidou et al., 2005; Ng et al., 2010; Pöschl, 2005), as well as human health (Nel, 2005). Concentration, composition and size of OAs are vital factors for such an adverse impact (Tremblay et al., 2007). Fine particles are more detrimental to human health due to the ability to deposit into deep parts of lungs (Nemmar et al., 2002). In addition, due to distinct sources of fine and coarse particles, particle sizes of organic species could act as a tool to identify OA sources and to assess their health effects.
Primary biological aerosol particles (PBAPs) and biomass burning (BB) are two major sources of atmospheric primary organic aerosols (POAs). PBAPs are those directly emitted into the atmosphere including bacteria, plant debris, fungal spores, and fragments of plants and animals (Després et al., 2012; Fang et al., 2018; Fu et al., 2012; O'dowd et al., 2004; Samaké et al., 2019). These PBAPs not only affect the hydrological cycle and climate change by means of acting as cloud and ice nuclei but also jeopardize human health (Fröhlich-Nowoisky et al., 2012, 2016; Humbal et al., 2018; Rajput et al., 2018). Although recent studies have revealed the abundance and size distributions of PBAPs, studies regarding their emission sources and relative contributions remained poorly known (China et al., 2018; Di Filippo et al., 2013; Huffman et al., 2010; Jia et al., 2010; Tobo et al., 2013). Primary saccharides have been used as tracers for PBAP (Fu et al., 2013; Medeiros et al., 2006; Wan et al., 2007). Sucrose, glucose and fructose are predominantly derived from plant materials, such as pollen, fruit and leaves (Pacini, 2000; Puxbaum and Tenze-Kunit, 2003). Amongst sugar alcohols, mannitol and arabitol are the primary ones. Mannitol, arabitol and trehalose have been recognized as tracers of airborne fungi (Bauer et al., 2008; Fu et al., 2016; Samaké et al., 2019; Verma et al., 2018). Sparse data about erythritol and inositol can be found in the literature. Recently, these two species were reported as having similar sources to other sugar alcohols, such as arabitol and mannitol (Chen et al., 2013).
Biomass burning, as a substantial source of particles in the atmosphere, generates plenty of POAs (Andreae and Merlet, 2001; Wan et al., 2019; Yan et al., 2015). On the basis of the difference of burning materials (e.g., deciduous leaves and grass), BB is classified as open-field burning in forests, savannas, croplands, and residential heating and cooking (Akagi et al., 2011). Levoglucosan, generated by the thermal decomposition of cellulose (Simoneit, 2002; Simoneit et al., 1999), is regarded as the most typical tracer for BB because levoglucosan is chemically stable in the air (Simoneit et al., 2004, 1999). Isomeric ratios of individual anhydrosugars have been applied to distinguish biofuel sources (Engling et al., 2006; Fine et al., 2004; Sheesley et al., 2003). The levoglucosan to mannosan (L∕M) ratio varies with aerosols generated by burning of hardwood, softwood and agricultural waste with a ratio range of 13–27, 2.5–5.8 and 25–55.7, respectively (Engling et al., 2006; Fu et al., 2012; Sang et al., 2013; Sheesley et al., 2003).
As a highly developed economic zone, Beijing has been facing serious air pollution. Though the government has made great efforts to improve the air quality in Beijing, haze events still occur frequently, especially in winter (Cheng et al., 2016; Zheng et al., 2015). Moreover, air pollution, accompanied with high abundances of fine particles, has become a serious environmental problem in China's cities and adjacent areas. There have been many studies on the composition and sources of aerosols in Beijing (Yang et al., 2016). However, few studies have been conducted regarding the size distribution, contribution and processes of POAs in different seasons in Beijing. Thus, research on chemical compositions and size distributions of PBAP and BB in Beijing is vital in terms of regional air quality.
In this study, size-segregated aerosols were sampled in Beijing from April 2017 to January 2018. Molecular characteristics, size distributions, and seasonal trends of anhydrosugars and other saccharides were investigated during haze and clean days. Concentrations and contributions of plant debris, fungal spores and biomass-burning-derived OC were estimated according to the tracer methods. The variations in size distributions of organic species in aerosols in different seasons were also assessed.
2.1 Sample collection
All samples were collected using a nine-stage cascade impactor sampler (Andersen, U.S.A.) at a flow rate of 25.8 L min−1 from April 2017 to January 2018. The sampler was put on a second-story building rooftop in the Institute of Atmospheric Physics (IAP), Chinese Academy of Sciences in Beijing, China (39∘58′28′′ N, 116∘22′16′′ E). The IAP is located on the north side of Beijing, which is considered to be a representative urban urea for a mixed district of traffic, residential and commercial areas. Urban aerosol samples collected here are influenced by both anthropogenic (e.g., traffic and cooking emissions) and natural sources (e.g., soil dust, plant debris and microorganisms). Before sampling, the quartz fiber filters were combusted at 450 ∘C for 6 h. The cutoff sizes are in the following sequence: >9.0, 9.0–5.8, 5.8–4.7, 4.7–3.3, 3.3–2.1, 2.1–1.1, 1.1–0.7, 0.7–0.4 and <0.4 µm. Four sets of size-segregated aerosol samples per season and thus 16 sets (i.e., 144 samples) were obtained throughout the year. Blank filters were obtained for each season for quality control. Specific information including weather conditions, sampling periods and sample numbers was summarized in Table S1 in the Supplement. All samples were stored at a −20∘ in freezer prior to analysis.
Table 1Abundances (ng m−3) and seasonal variations in anhydrosugars and other saccharides in size-segregated aerosols in urban Beijing from April 2017 to January 2018. In total 16 sets of size-segregated samples were analyzed; each set contains nine samples.

Note that the samples are divided into spring (April–May), summer (June–July), autumn (October–November) and winter (December–January).
2.2 Sample extraction and derivatization
Using a disinfected scissor, each filter aliquot (∼6.4 cm2) was cut and extracted three times with a dichloromethane / methanol mixture (2:1, v∕v) under ultrasonic agitation for 10 min. After filtering, the solvent extracts were concentrated with a rotary evaporator and a stream of filtered dry nitrogen gas. The extracts were converted to their trimethylsilyl derivatives using mixture of 25 µL of N,O-bis-(trimethylsilyl)trifluoroacetamide (BSTFA) with 1 % trimethylsilyl chloride and 5 µL of pyridine for 3 h at 70∘ (Fu et al., 2008). The derivatives were diluted by adding 30 µL of internal standard (C13 n-alkane, 1.43 ng µL−1) and then were stored in a freezer before GC/MS analysis.
2.3 Gas chromatography/mass spectrometry measurement
An Agilent model 7890 GC coupled to an Agilent model 5975C mass-selective detector (MSD) was used to analyze organic compounds of these samples. A total of 2 µL of pretreatment sample was injected and separated in a fused silica capillary column. The column temperature program was optimized with a series of procedures: start and hold for 2 min at 50 ∘C, increase to 120 ∘C with a pace at 15 ∘C min−1, then raise to 300 ∘C at 5 ∘C min−1, and keep isothermal at 300 ∘C for 16 min. The mass spectrometer was operated on electron ionization (EI) mode at 70 eV and scanned from 50 to 650. Mass spectral data were acquired and processed with the Chemstation software. Individual compounds were identified by comparing mass spectra with those of authentic standards. The data reported here were corrected for the field blanks.
2.4 Measurements of OC and EC
Organic carbon (OC) and elemental carbon (EC) were measured using a thermal/optical carbon analyzer (model RT-4, Sunset Laboratory Inc., USA). A punch (17 mm diameter) of each aliquot or blank filter was used for the determination. The concentrations of OC and EC here were all corrected for field blanks.
2.5 Backward trajectories and fire spot counts
To better characterize the features and origins of air masses in Beijing, 3 d backward trajectory analyses were conducted using the HYSPLIT4 model (Draxler and Rolph, 2013) for all the dust storm and haze periods in our study. Backward trajectories were calculated at an altitude of 500 m above ground level. Influence of BB in urban Beijing is demonstrated by fire spots acquired from the MODIS website (https://earthdata.nasa.gov/earth-observation-data/near-real-time/firms, last access: 16 July 2019). The crowding level of the fire spots here represented the scales and intensity of BB. Cluster analyses were applied for typical dust storm and haze events in the present study (Fig. S1 in the Supplement).
3.1 Abundances and seasonal variations in anhydrosugars
3.1.1 Anhydrosugars
Levoglucosan, a typical tracer of biomass burning, is formed from the thermal decomposition of cellulose during vegetation burning activities, which has been detected in many urban as well as rural areas (Cheng et al., 2013; Chowdhury et al., 2007; Fu et al., 2010; Wang et al., 2006; Yttri et al., 2007). As additional important types of anhydrosugars, mannosan and galactosan, the isomers of levoglucosan, are exclusively derived from the pyrolysis of hemicellulose (Fraser and Lakshmanan, 2000; Simoneit et al., 1999; Simoneit, 2002). The concentrations of and temporal variations in anhydrosugars (i.e., levoglucosan, mannosan and galactosan) are shown in Table 1 and Fig. 1. Among the three anhydrosugars, levoglucosan was the predominant compound (80.1–1230 ng m−3, 365 ng m−3), which was 1 order of magnitude higher than mannosan (8.41–168 ng m−3, 46.8 ng m−3) and galactosan (5.09–108 ng m−3, 27.6 ng m−3). The concentration of levoglucosan was the highest in winter, followed by autumn, spring and summer. Similar seasonality has been documented in several studies in Beijing (Chen et al., 2013; Liang et al., 2016). The abundances in summer and winter were comparable with previous studies (Cheng et al., 2013; Zhang et al., 2008). Mannosan and galactosan displayed a similar seasonal trend. Similar to levoglucosan, total anhydrosugars peaked in winter (250–1503 ng m−3, 678 ng m−3) and bottomed in summer (87.8–246 ng m−3, 137 ng m−3). The most abundant anhydrosugars in winter are possibly due to the enhanced sources from open-field biomass and domestic burning, together with frequent development of inversion layers in winter. Interestingly, the concentrations of levoglucosan in autumn (224–759 ng m−3, 501 ng m−3) and winter (131–1230 ng m−3, 559 ng m−3) were much higher than those in summer (80.1–203 ng m−3, 114 ng m−3). Except for the decrease in biomass burning activities, a higher level of OH radicals in summer on account of high temperature and intensive ultraviolet light (Stone et al., 2012) may lead to the photochemical degradation of levoglucosan (Arangio et al., 2015; Hennigan et al., 2010; Lai et al., 2014; Mochida et al., 2010).
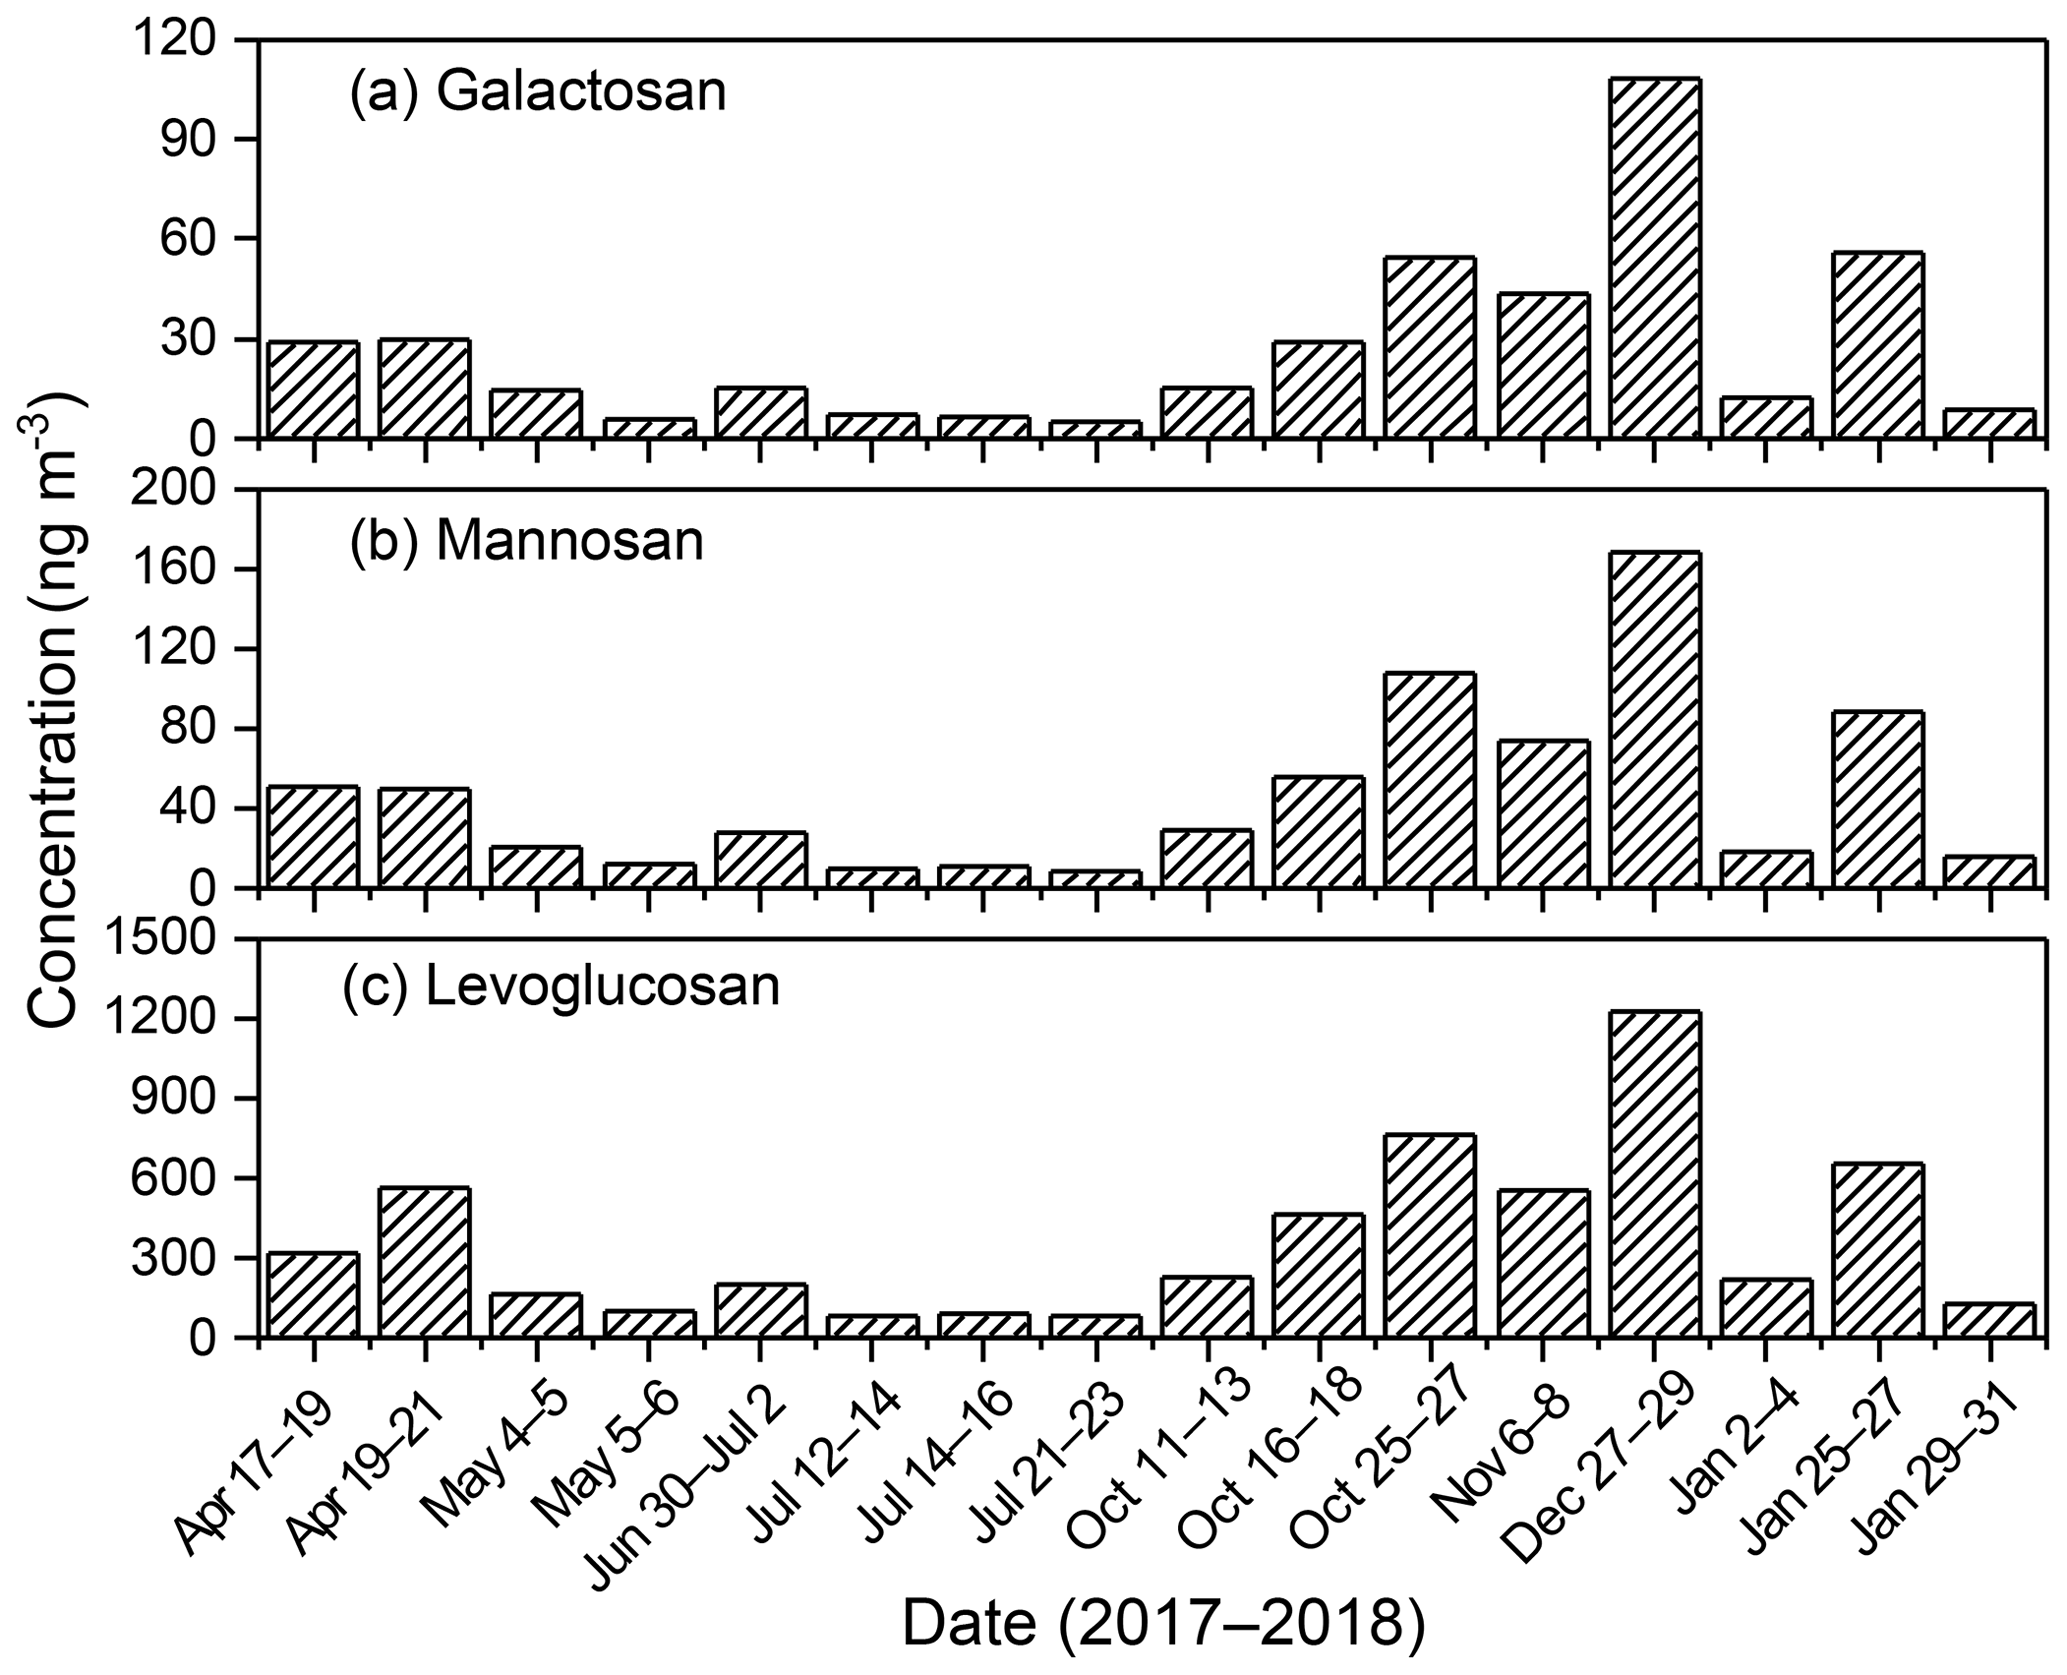
Figure 1Seasonal trends (a, b, c) of anhydrosugars in urban Beijing aerosols from April 2017 to January 2018.
Concentrations of individual anhydrosugars in haze days were much higher than those in non-haze days in each season (Table 2). Moreover, the level of anhydrosugars (2310 ng m−3, average) in winter was 1 order of magnitude higher than the other seasons (302, 171 and 798 ng m−3 for spring, summer and autumn, respectively). Such trends indicated that the haze samples were largely influenced by biomass burning emissions in Beijing, consistent with previous studies in Beijing (Zhang et al., 2017) and other regions such as New Delhi (India), Tasmania (Australia) and Kathmandu (Nepal) (Fu et al., 2010; Reisen et al., 2013; Wan et al., 2019).
Table 2Abundances and seasonal variations in anhydrosugars and other saccharides in haze and non-haze days from April 2017 to January 2018.
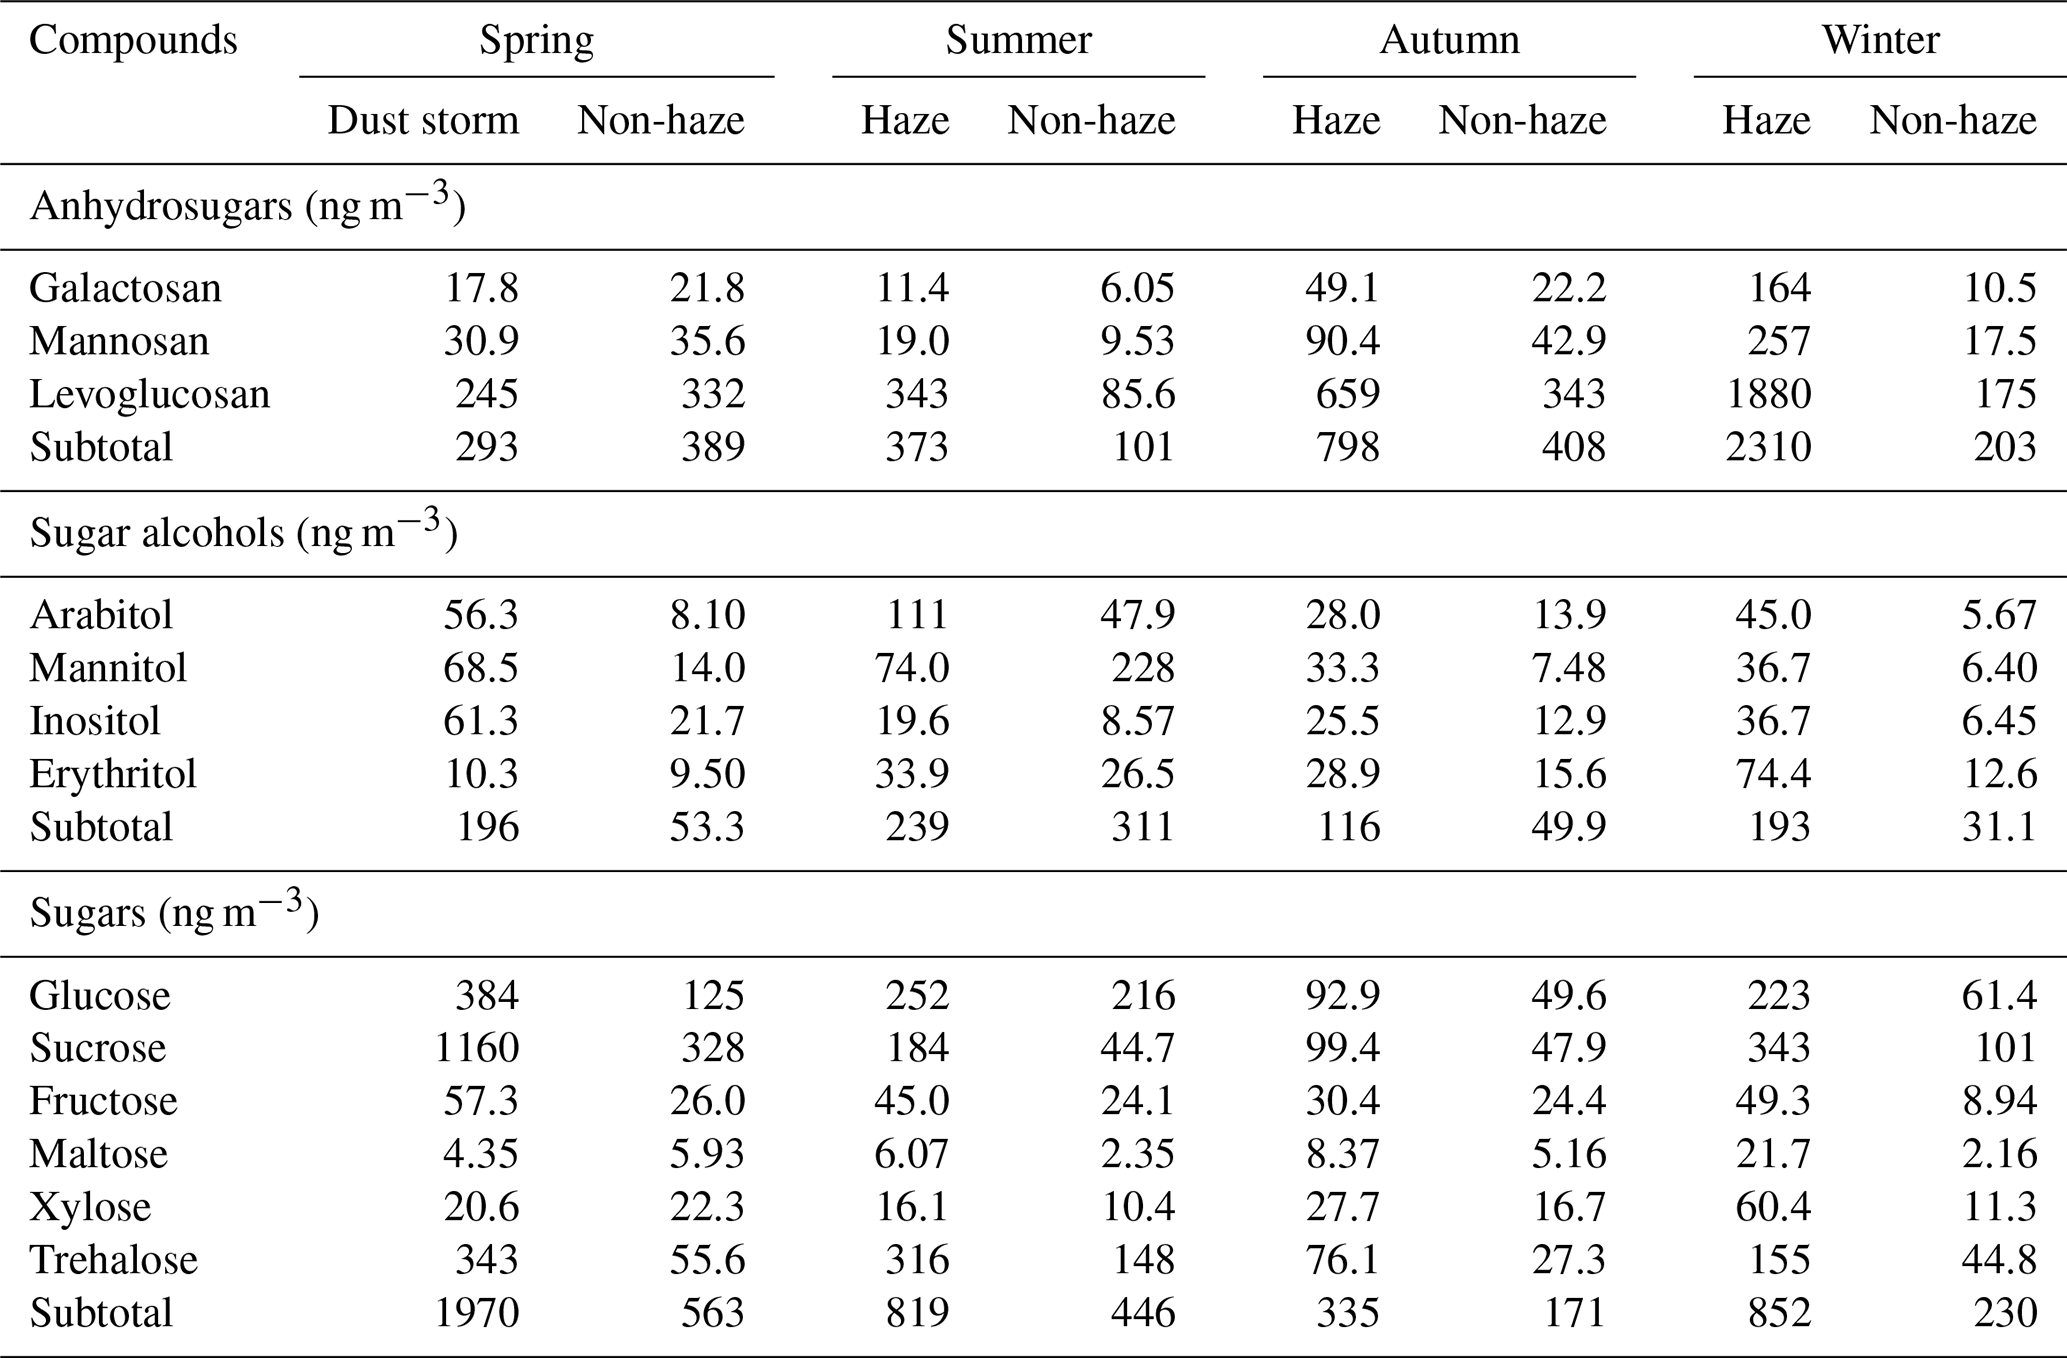
Table 3Abundance of anhydrosugars and other saccharides in the total, fine (<2.1 µm) and coarse (≥2.1 µm) particles in Beijing from April 2017 to January 2018.

During dust storm periods in spring, air masses primarily originated from middle-to-north Asia (MNA) (Fig. S1a–b). Specifically, 71 %–75 % of air masses originated from west-to-central Russia, passed through Mongolia and finally arrived in Beijing. Such a phenomenon is likely attributed to the influence of Asian outflow. Compared to 17 to 19 April, fewer fire spots were found in the movement route of air masses in 4 to 5 May, which can explain the lower levels of anhydrosugars in the aerosols. As time came to summer, the influence of air masses from central China was strengthened. In the meantime, frequent straw burning events were found in these regions due to the harvest season (Fig. S1c–d). However, this emission had an insignificant impact on the anhydrosugars considering the relatively low concentrations. In winter haze periods, 53 %–100 % of the air masses originated from northern China, and the rest originated from Mongolia. Interestingly, much fewer fire spots could be observed (Fig. S1g–h) compared to summer and autumn. In winter, domestic burning and small-scale open-field burning are much more intensive than in other seasons. However, these two burning activities are hardly detectable by satellite, which could account for the much higher abundances of anhydrosugars.
Pearson correlations among anhydrosugars and OC and EC were also studied (Table S2). Levoglucosan displayed a positive correlation with mannosan (r=0.99, p<0.001) and galactosan (r=0.98, p<0.001). Such consistent trends suggested that the anhydrosugars were emitted from similar sources. EC is considered to be closely related with BB (Akagi et al., 2011). Positive correlations between EC and levoglucosan (r=0.45, p<0.001), mannosan (r=0.43, p<0.001) and galactosan (r=0.43, p<0.001) indicate that BB was a major source of the anhydrosugars in urban Beijing aerosols.
3.1.2 Ratios of L∕M, M∕G, L∕OC and L∕EC
Previous surveys found that levoglucosan / mannosan (L∕M) ratios vary with biofuel burning sources; those from hardwood, softwood and crop residues are often in ranges of 13–27, 2.5–5.8 and 25–55.7, respectively (Engling et al., 2006; Fine et al., 2004; Křůmal et al., 2010; Sheesley et al., 2003). The L∕M values are shown in Table 1 and Fig. 2. The annual L∕M ratios varied within a narrow range over the sampling periods (7.62–8.64, 8.27), indicating a mixture contribution of softwood burning and hardwood burning. The L∕M ratios were relatively higher in winter (7.30–11.8, average 8.64) and spring (6.34–11.8, 8.49), consistent with those obtained in previous studies (Zhu et al., 2015). This is probably associated with open-field biomass burning, e.g., agricultural residues and deciduous leaves. The L∕M ratios were smaller in summer and autumn, along with a higher level of M∕G ratios than those in winter and spring. These results were likely attributed to the higher proportion of softwood burnings and the degradation of levoglucosan (Arangio et al., 2015; Lai et al., 2014; Mochida et al., 2010).
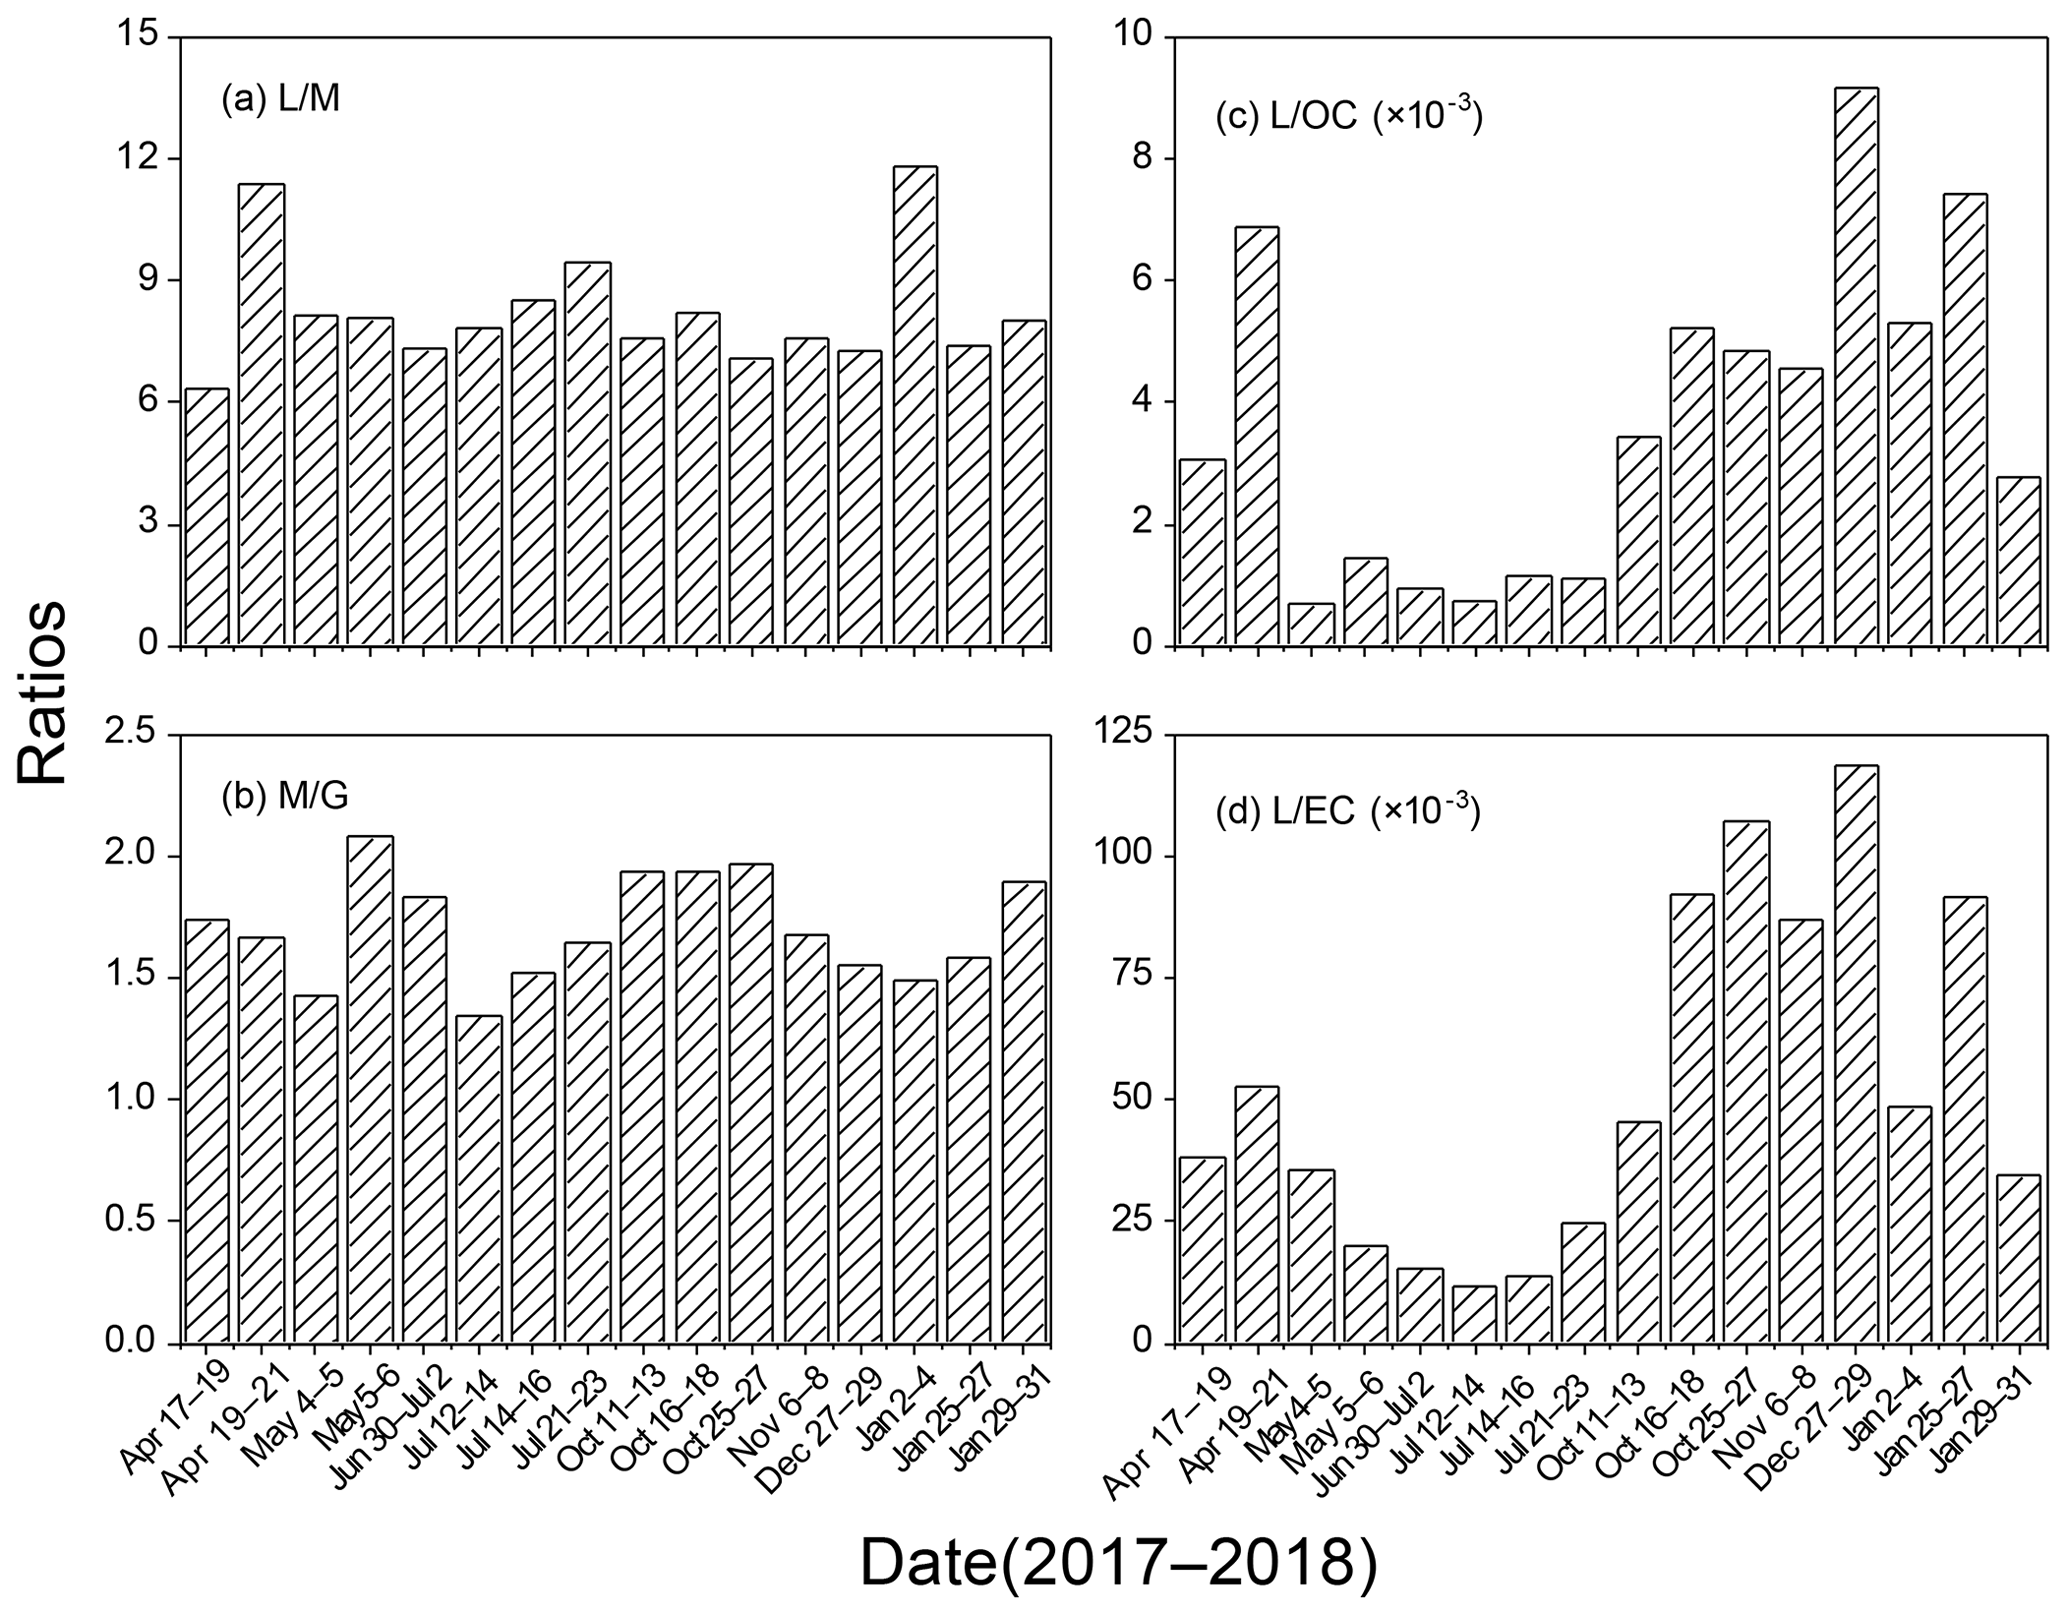
Figure 2Temporal variations in the concentration ratios of L∕M (levoglucosan to mannosan), M∕G (mannosan to galactosan), L∕OC (levoglucosan to organic carbon) and L∕EC (levoglucosan to elemental carbon) for urban aerosols in Beijing.
The ratio of mannosan to galactosan (M∕G) is used as an auxiliary means to distinguish the burning substrates because galactosan is more abundant than mannosan in combustion smokes of crop straws, grasses and briquettes (Fabbri et al., 2009; Oros et al., 2006; Vicente et al., 2018). The M∕G ratios during all the periods were in a range of 1.35–2.08 with an average of 1.70 (Fig. 2b). The M∕G ratios reached a maximum in autumn (1.68–1.97, 1.88) and a minimum in summer (1.35–1.83, 1.59). The lower ratios in summer haze days (30 June to 2 July) were in agreement with the former studies during summer BB periods (Engling et al., 2006). The higher ratios in typical summer time in July (14 to 16 July and 21 to 23 July) were consistent with previous results in the North China Plain and western United States (Fine et al., 2004; Fu et al., 2008). The M∕G ratios ranged from 1.49 to 1.89 (average 1.62) in winter, consistent with the higher abundance of galactosan over mannosan associated with the BB products from crop wastes in the North China Plain (Fu et al., 2008).
The ratio of levoglucosan to OC (L∕OC) and EC (L∕EC) is applied to evaluate the impact of BB on airborne particles and the possible photochemical aging of levoglucosan (Feng et al., 2007; Mkoma et al., 2013; Zhang et al., 2008). The ratios of L∕OC showed a clear temporal trend (annual mean , Fig. 2c) with the highest values in winter (2.79–, followed by autumn (3.46–), spring (0.69–) and summer (0.73–). Similar seasonal trends have been reported in previous studies (Feng et al., 2007; Ho et al., 2014). EC is highly related to the activities of coal combustion, vehicle exhaust and biomass burning (Akagi et al., 2011; Lu et al., 2011; Waked et al., 2014). The L∕EC ratios showed a similar temporal pattern to the L∕OC ratios. The L∕EC ratios exhibited maxima in autumn (45–, , followed by winter (34–, , spring (20–, and summer (12–, , indicating more contribution of BB to aerosols in cold seasons.
The L∕M, L∕OC and L∕EC ratios in this study were compared with those reported for other Asian cities in recent studies. The L∕M ratios showed different seasonal and spatial distributions among different cities. Those reported in Nepal (16.3±5.96) were much higher than our study (Wan et al., 2019). A previous study in Okinawa found a L∕M ratio of 10.7±6.1 and exhibited a similar seasonal trend to our study (Zhu et al., 2015). Lower ratios of L∕M suggested that more burning substrates were softwood in Beijing, while in previous studies in Beijing lower L∕M ratios in winter were observed (Cheng et al., 2013). Higher ratios of L∕M in our study may be ascribed to the reduced use of coal in recent years in northern China. Coal combustion is also a potential source of levoglucosan, leading to a lower ratio of L∕M (Yan et al., 2017). In comparison to annual mean L∕OC ratios in Guangzhou and Zhaoqing in the Pearl River Delta (PRD) region ( and , respectively) (Ho et al., 2014), the lower values of L∕OC in Beijing were potentially associated with the less extensive burning activities under the prohibition of open agricultural residue burning. Although the seasonal trend is similar to that of Okinawa, the L∕EC ratios in Beijing were much higher than those in Okinawa. Besides the high abundance of levoglucosan in Beijing, these results may also imply that EC was associated with other sources, such as local transport emission and coal combustion, while EC in Okinawa might represent a regional background level (Zhu et al., 2015).
The L∕M, M∕G, L∕OC and L∕EC ratios according to the particle size are presented in Fig. 3. Higher L∕M values were observed in fine particles during non-haze days, which were 1.02–1.71 times higher than those in coarse modes. In contrast, the L∕M ratios did not vary significantly according to particle size in the haze days. The L∕M values in fine modes during haze periods were slightly higher than those in coarse modes. The ratios between fine and coarse modes were close to unity. The elevated L∕M ratios in fine modes suggested that hardwood was potentially the source of the burning substrates, while the relatively lower L∕M ratios in coarse modes indicated the mixture impact of hardwood and softwood burning. The M∕G ratios were also higher in fine modes than coarse modes with a factor of 1.0–2.5, suggesting a large impact of biomass burning from crop straws and grasses in fine modes. Moreover, such activities were more pronounced in haze days than non-haze days, implying the increasing contributions from crop straws burning in haze days.
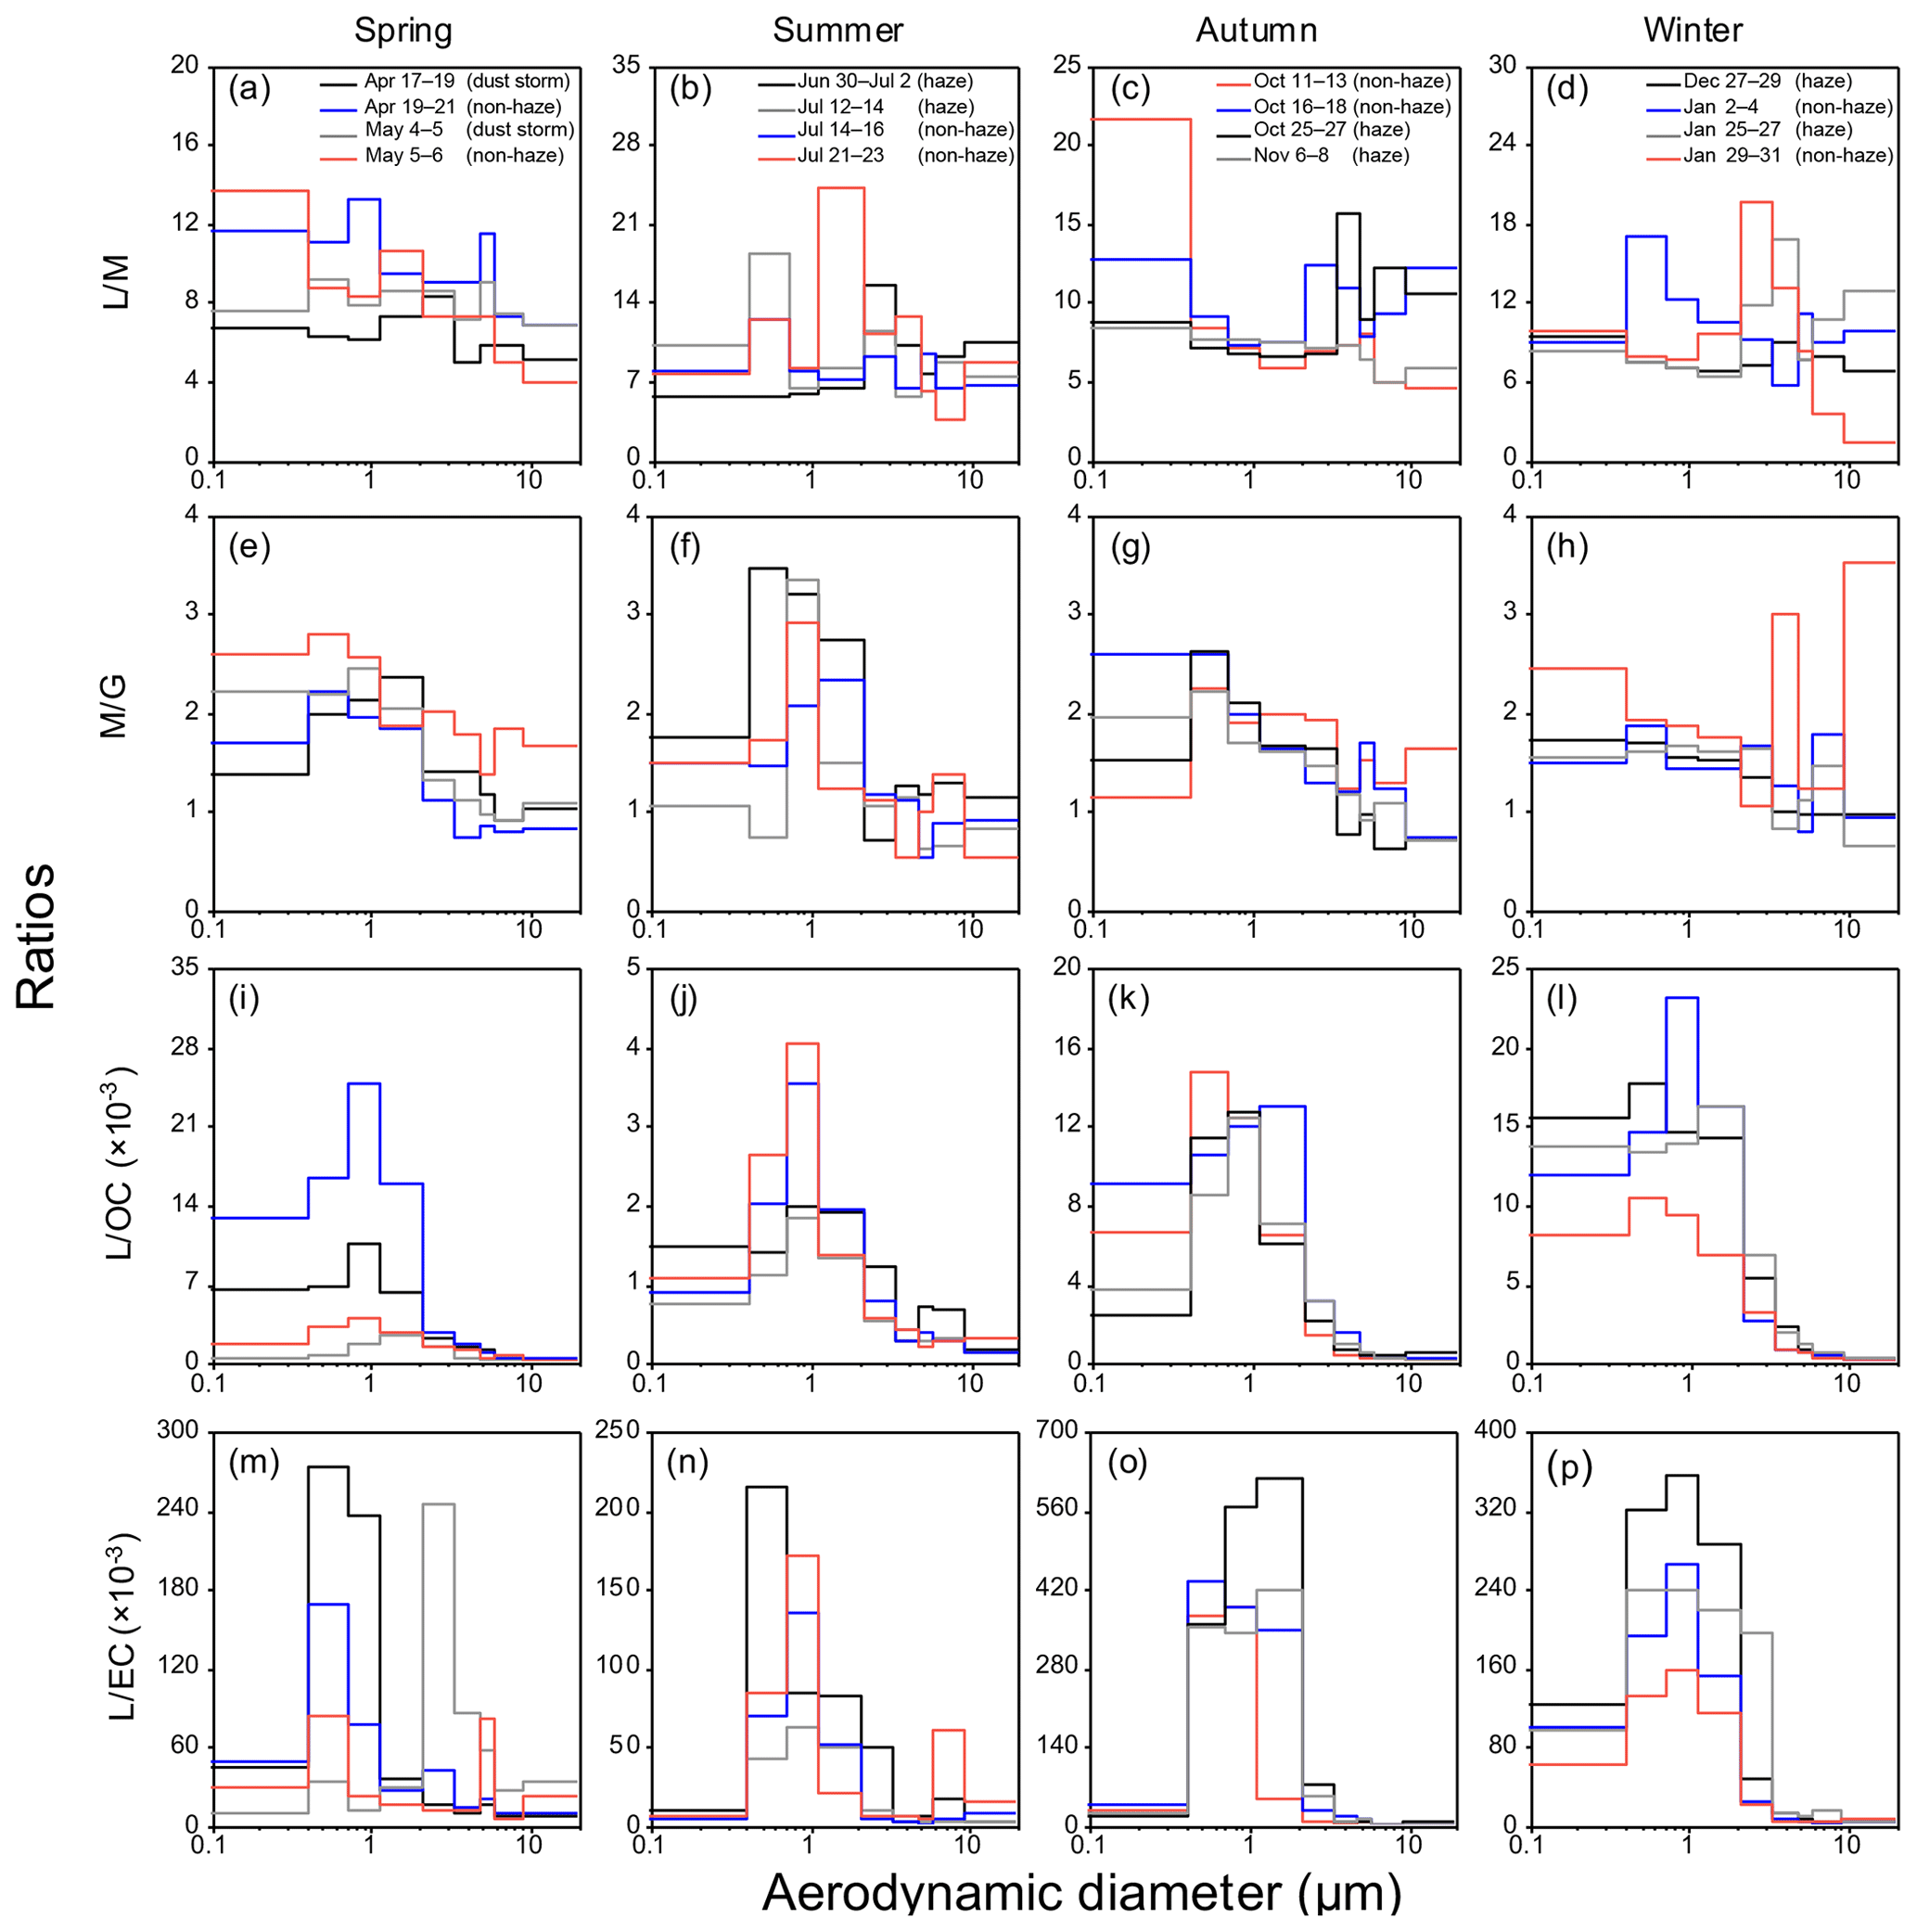
Figure 3The concentration ratios of L∕M, M∕G, L∕OC and L∕EC according to particle size for urban aerosols in Beijing during April 2017 to January 2018.
The L∕OC ratios showed a uniform dependence on particle sizes much higher in fine modes during all sampling periods. The average ratios of L∕OC (fine modes) to L∕OC (coarse modes) for four seasons were 6.31, 4.49, 11.3 and 9.47, respectively. Such a pattern was consistent with the finding that levoglucosan is mostly present in fine modes (Simoneit and Elias, 2001). The L∕OC ratios in summer were a magnitude lower than in other seasons, which is likely attributed to the fewer biomass burning emissions in the urban areas of Beijing.
The L∕EC ratios also exhibited a clear pattern with high values in fine modes and low values in coarse modes, similar to the L∕OC ratios. Cao et al. (2005) found that the EC in PM10 was more abundant than in PM2.5, while most levoglucosan was in fine modes, resulting in low L∕EC ratios in coarse modes. Nevertheless, a high L∕EC ratio was observed in the coarse modes during 4–5 May when Beijing encountered the most severe dust storm in that spring. Unlike the other samples, levoglucosan accounted for an unexpectedly high proportion in the coarse modes (discussed in Sect. 3.3.1). Meanwhile, the concentrations (23– µg m−3) of EC in coarse modes were much lower in the dust period than in non-haze periods (30– µg m−3) during spring. As a consequence, a low level of EC and high level of levoglucosan lead to the high L∕EC ratio in the coarse mode.
3.2 Abundances and seasonal variations in primary saccharides and sugar alcohols
3.2.1 Primary saccharides
The concentrations of primary saccharides and sugar alcohols in four seasons are shown in Table 1 and Fig. 4. The concentrations of primary saccharides and sugar alcohols averaged 620 and 139 ng m−3, respectively. Except maltose and xylose, other primary saccharides exhibited higher abundance in spring and summer compared to autumn and winter. Among these compounds, sucrose (30.8–1590 ng m−3, 267 ng m−3) was the most abundant one, followed by glucose (38.9–502 ng m−3, 162 ng m−3) and fructose (7.97–72.5 ng m−3, 30.1 ng m−3).
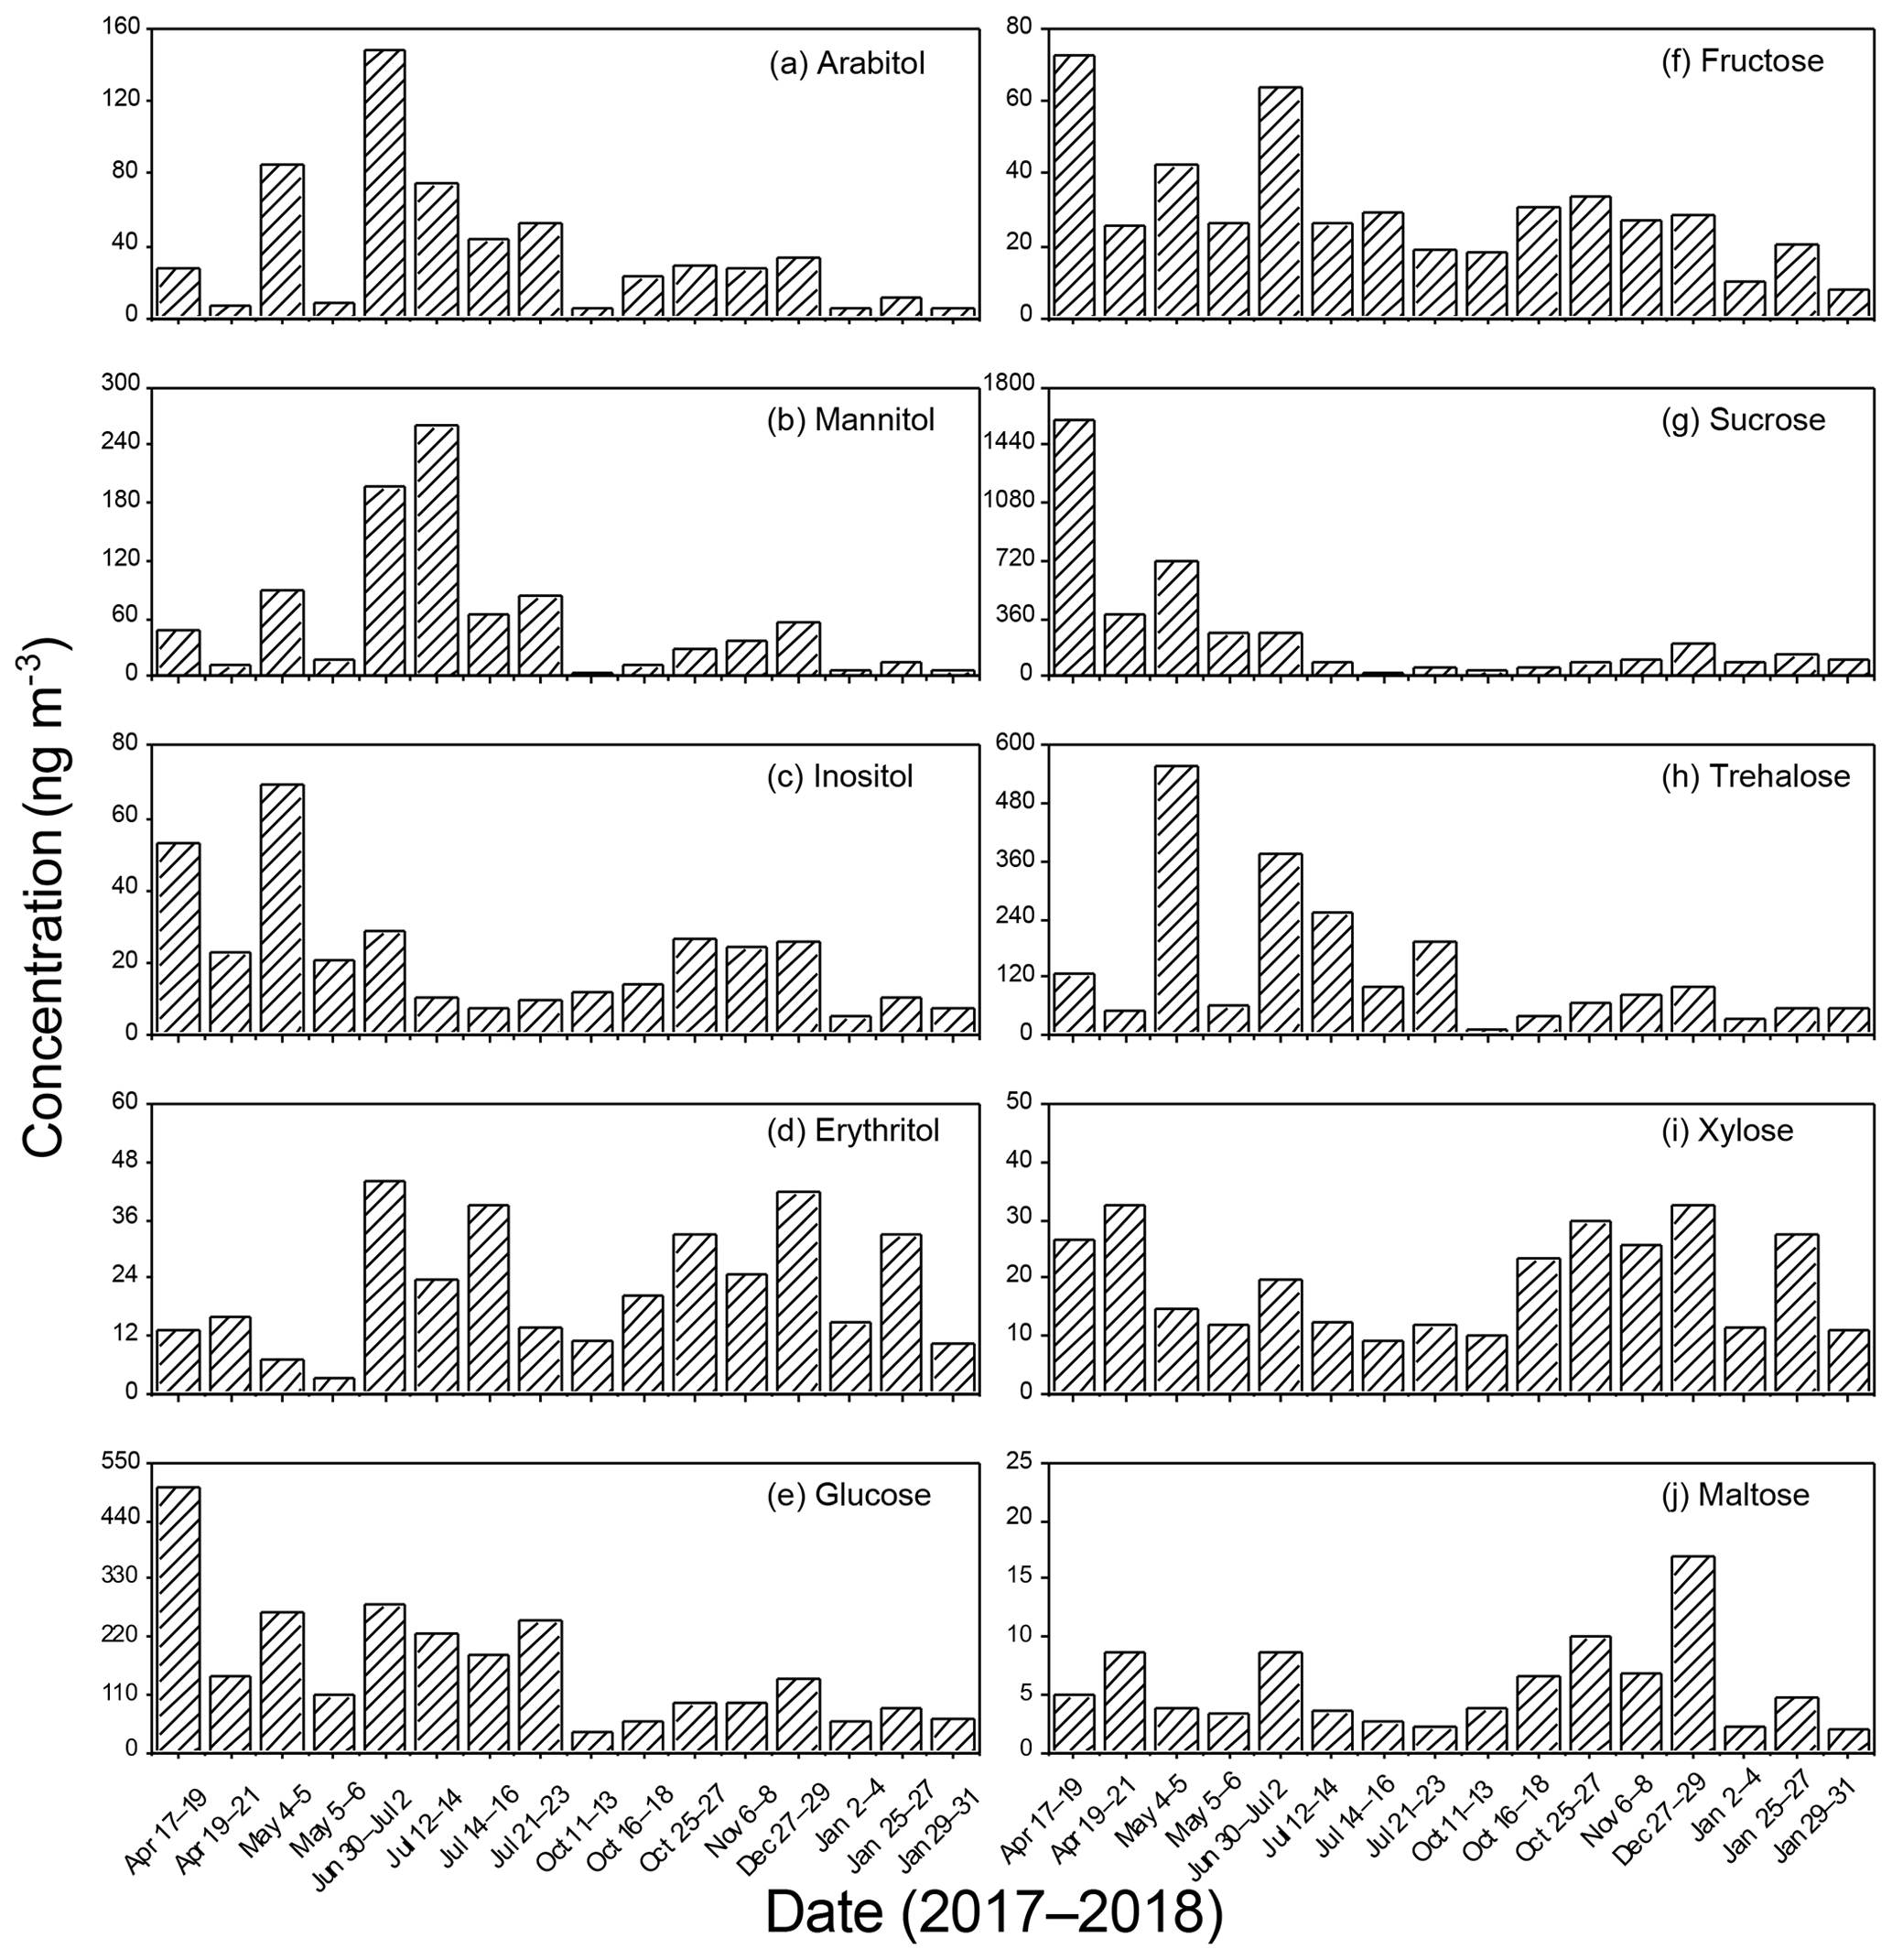
Figure 4Temporal variations in primary saccharides and sugar alcohols in urban Beijing aerosols from April 2017 to January 2018.
Fructose and glucose are mainly derived from plant fragments (e.g., bark, leaves), pollen, lichen and soil dust (Dahlman et al., 2003; Fu et al., 2012; Pacini, 2000; Vesprini et al., 2002; Zhu et al., 2015). Glucose reached a maximum in spring (107–502 ng m−3, 255 ng m−3), followed by summer (184–279 ng m−3, 234 ng m−3), winter (60.0–139 ng m−3, 86.4 ng m−3) and autumn (38.9–93.3 ng m−3, 71.2 ng m−3). Fructose varied with a similar trend. High concentrations in spring likely coincided with agricultural tilling activities (Simoneit et al., 2004) and comparably active vegetation in the warmer season. The significant correlation between glucose and fructose (r=0.81, p<0.001) further indicated that these two compounds originated from common sources (Table S3), consistent with the results of previous studies in East Asian areas (Chen et al., 2013; Fu et al., 2012; Zhu et al., 2015). Previous studies found good correlations between fructose and glucose with OC in biomass burning aerosols over an Amazonia pasture site (Graham, 2002), in contrast to this study (Table S3), which suggested that biomass burning made minor contributions to glucose and fructose in Beijing.
Sucrose, a major constituent of pollen, peaked in spring during the blossom booming season, in agreement with previous studies (Fu et al., 2012; Pacini, 2000; Yttri et al., 2007; Jia et al., 2010). A previous study reported that sucrose, like glucose and fructose, could abundantly emit into the air along with the increased biological activities (Rogge et al., 2007). Accordingly, sucrose was much more predominant in spring (266–1594 ng m−3, 743 ng m−3) and then sharply declined in winter (87.7–209 m−3, 137 ng m−3) and summer (30.8–275 ng m−3, 114 ng m−3). Interestingly, sucrose reached a minimum in autumn (32.6–115 m−3, 73.3 ng m−3) rather than in summer. This is likely attributed to the agricultural activities in summer. In June and July, tilling activities frequently exposed crop (e.g., wheat) roots to the air, leading to the release of sucrose from the roots into the atmosphere.
Trehalose is present in various microorganisms (e.g., fungi and bacteria), some higher plants and invertebrates (Medeiros et al., 2006). In this study, trehalose exhibited a high abundance in spring (51.8–559 ng m−3, 199 ng m−3), peaked in summer (101–378 ng m−3, 232 ng m−3), and sharply reduced by nearly 75 % in autumn and winter. Trehalose is a useful tracer for soil input to the atmosphere in regions related to agricultural activities and dust storms (He et al., 2001; Simoneit et al., 2004). Thus, the concentration of trehalose was considerably high in a dust period during 4–5 May (559 ng m−3) and haze days during 30 June to 2 July and 12–14 July (Fig. 4h).
Xylose and maltose exhibited a totally different seasonal trend from other primary saccharides. Xylose showed high levels in autumn (10.2–29.7 ng m−3, 22.2 ng m−3) and winter (11.0–32.7 ng m−3, 20.7 ng m−3). Xylose is present in most woods and straw as a major constituent of hemicellulose (Chen et al., 2013; Sullivan et al., 2011). The biomass burning activities in Beijing likely caused the elevated abundance of xylose, given the positive correlation between xylose and levoglucosan (r=0.86, p<0.001). Maltose, a microbial degradation product of starch, showed a similar seasonal pattern with xylose (Medeiros et al., 2006) and positively correlated with levoglucosan (r=0.89, p<0.001). These results suggest that biomass burning was a major source of xylose and maltose.
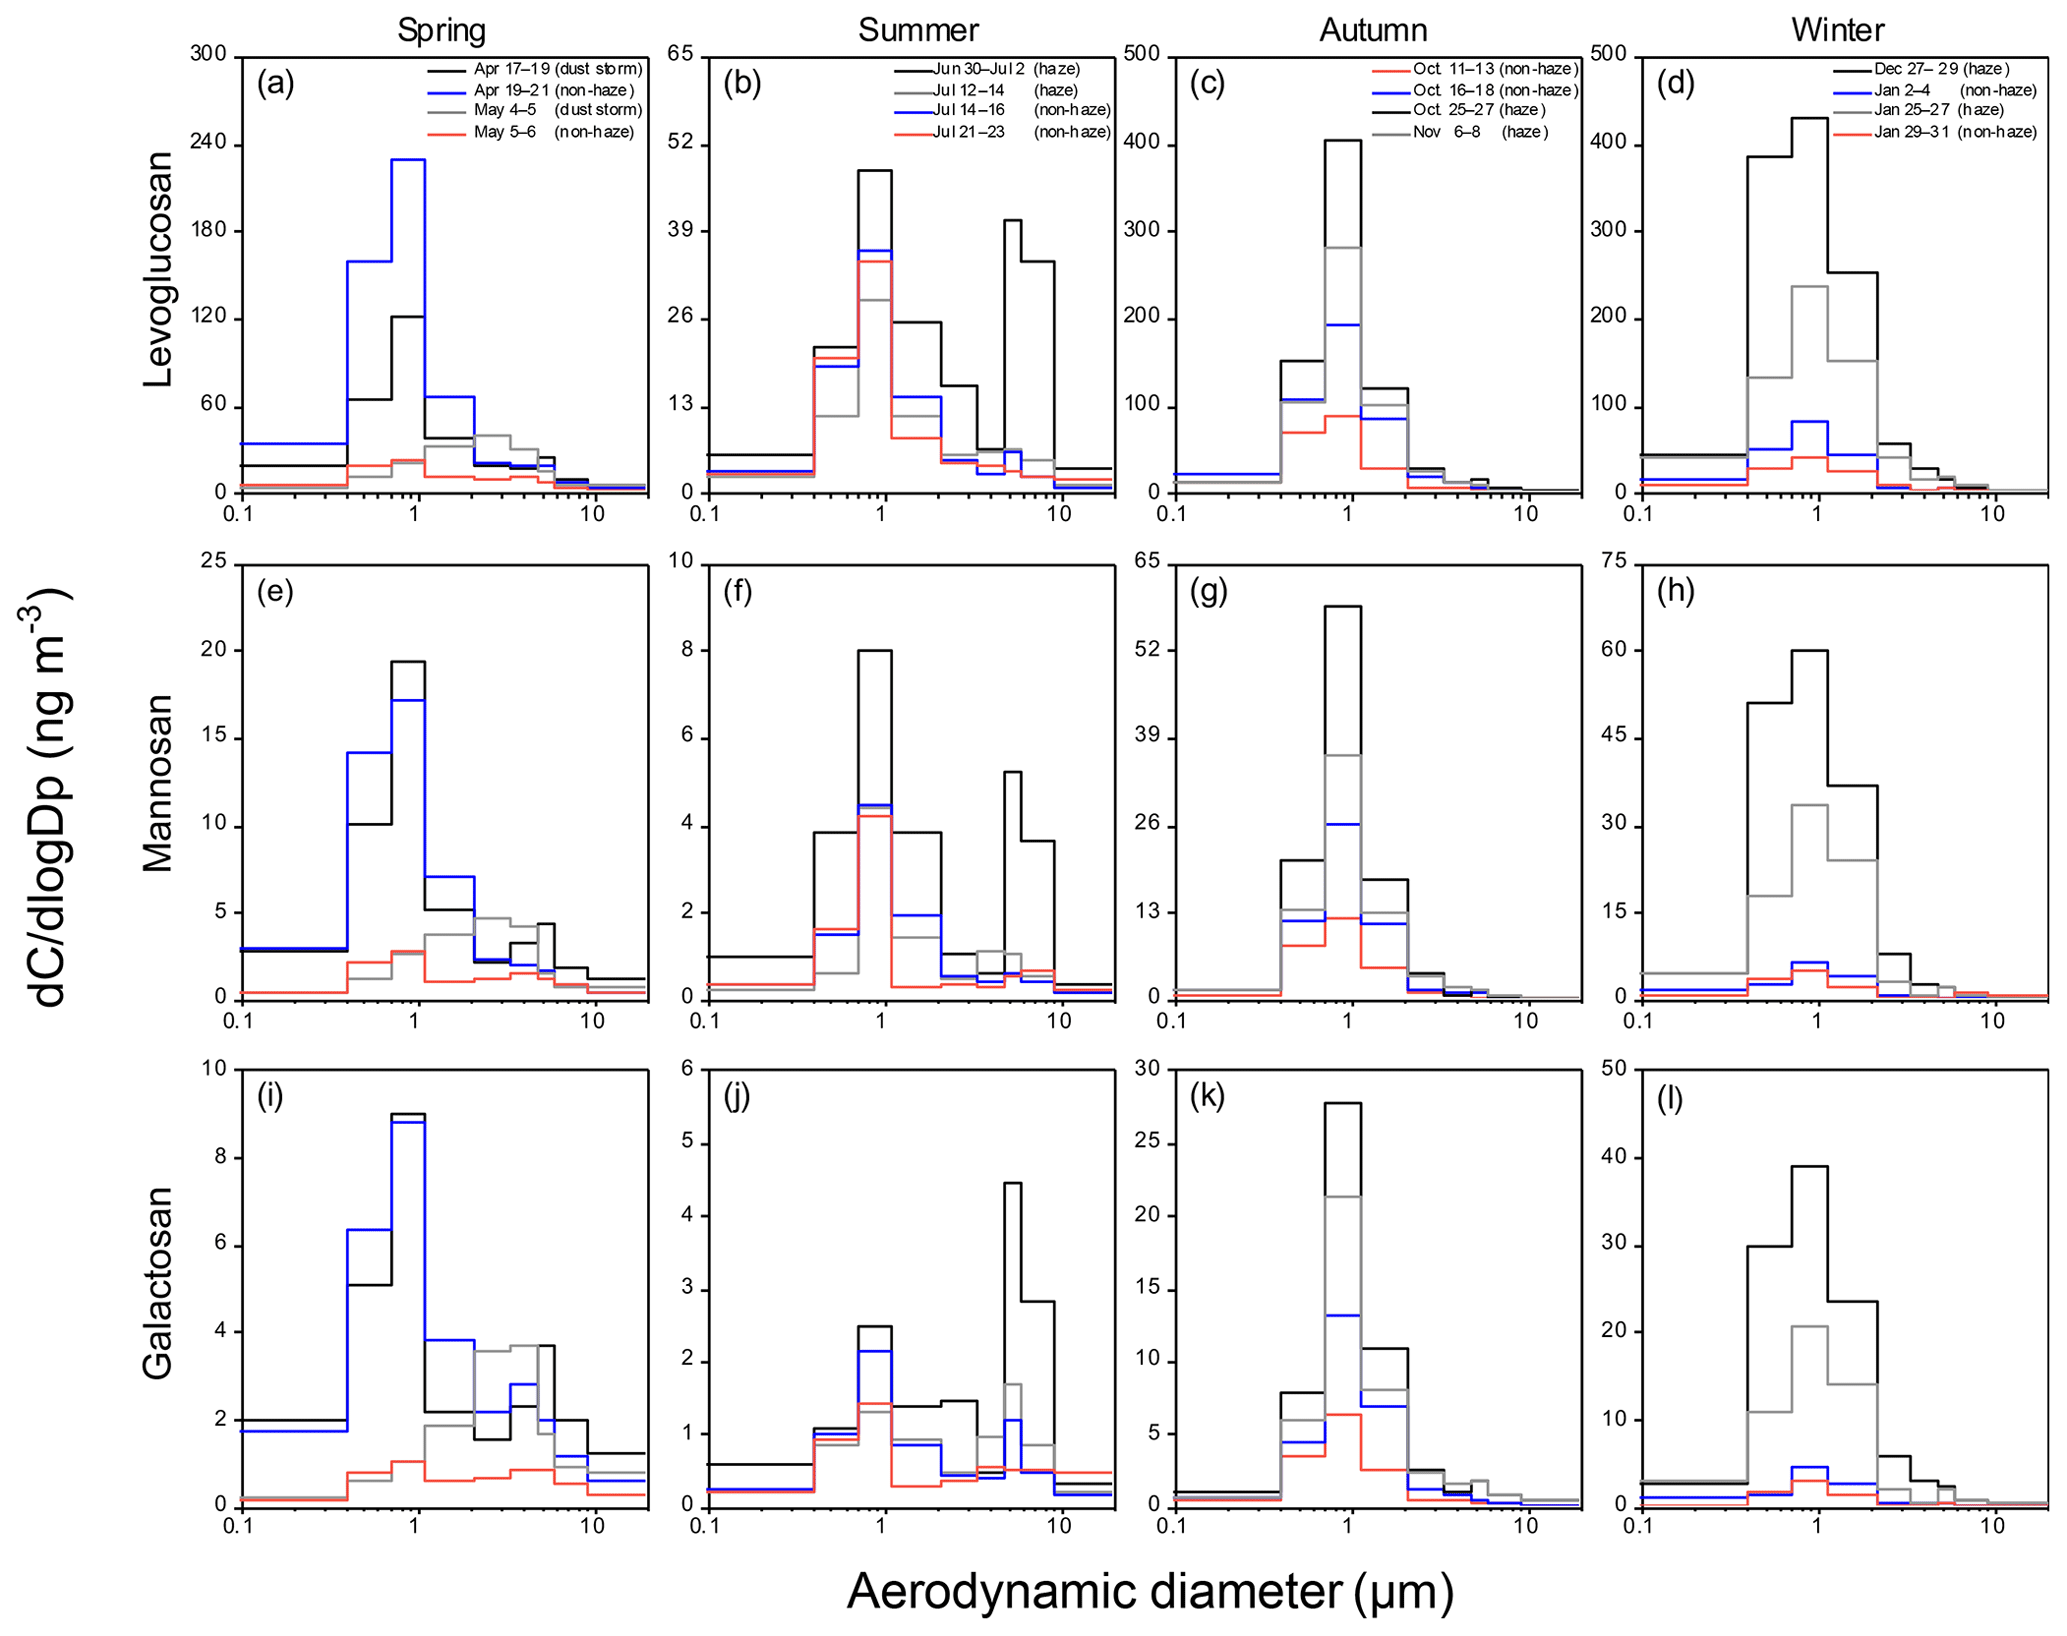
Figure 5Size distributions of levoglucosan and its isomers, mannosan and galactosan, in urban aerosols in Beijing.
3.2.2 Sugar alcohols
The sum of sugar alcohols (29.8–418 ng m−3, 139 ng m−3) was much lower than primary saccharides and anhydrosugars (Table 1). In the detected compounds, mannitol showed the highest level (3.64–259 ng m−3, 58.4 ng m−3), followed by arabitol (5.35–149 ng m−3, 36.7 ng m−3), inositol (5.05–69.2 ng m−3, 21.8 ng m−3) and erythritol (3.16–44.1 ng m−3, 21.8 ng m−3). Both mannitol and arabitol exhibited maxima in summer (65.1–259 ng m−3, 151 ng m−3 and 43.4–149 ng m−3, 79.6 ng m−3, respectively). Mannitol reached a minimum (3.64–37.7 ng m−3, 20.4 ng m−3) in autumn and arabitol reached a minimum in winter (5.52–33.8 ng m−3, 14.1 ng m−3). Mannitol significantly correlated with arabitol during the whole sample period (r=0.83, p<0.001), indicating they are generally related to common sources. Mannitol and arabitol primarily derive from airborne fungal spores (Fu et al., 2010; Medeiros et al., 2006; Zhang et al., 2010) and detritus of mature leaves (Pashynska et al., 2002). In summertime, fungal spores can be derived from multiple sources (e.g., plants, vegetation decomposition and agricultural activities), while in autumn and winter fungal spores are mainly suspended from exposed surfaces (Liang et al., 2013). Moreover, a previous study indicated that a higher leaf area index and atmospheric water vapor would facilitate the emission of mannitol (Heald and Spracklen, 2009). In agreement with that study, mannitol and arabitol in our study may be closely related to the activities of the terrestrial biosphere.
Erythritol and inositol were the less abundant of the calculated sugar alcohols. The abundance of erythritol was lowest in spring (3.16–15.8 ng m−3, 9.92 ng m−3) and highest in summer (13.8–44.1 ng m−3, 30.2 ng m−3), and it remained at a relative high level in autumn and winter (11.1–33.0 ng m−3, 22.3 ng m−3 and 10.7–41.6 ng m−3, 24.9 ng m−3, respectively). Temporally, erythritol correlated well with levoglucosan (r=0.50, p<0.001), indicating a potential contribution from BB (Table S3). Results on inositol in aerosols were seldom reported (Chen et al., 2013). In this study, inositol showed maxima (20.7–69.2 ng m−3, 41.5 ng m−3) in spring and minima (5.05–26.0 ng m−3, 12.4 ng m−3) in winter. Inositol was positively correlated with trehalose (r=0.65, p<0.001) and exhibited a similar temporal variation with other sugar alcohols, suggesting developing leaves and plant debris may be a potential source.
Table 4Geometric mean diameters (GMDs, µm) of anhydrosugars and other saccharides in the total-mode particles in Beijing from April 2017 to January 2018. GMD: logGMD = (∑Cilog, where Ci is the concentration of a compound in size stage i and Dpi is the geometric mean diameter of particles collected on stage i.

3.3 Size distribution
3.3.1 Anhydrosugars
The size distributions of anhydrosugars for each sampling period are shown in Fig. 5. The concentrations of anhydrosugars in fine (<2.1 µm) and coarse (≥2.1 µm) mode as well as whole size ranges are listed in Table 3. Among the class of anhydrosugars, levoglucosan was approximately an order of magnitude higher than other compounds in the fine and coarse particles. Levoglucosan is initially emitted from the flame and subsequently condenses onto preexisting particles as temperature decreases, and it is thus present mostly in fine particles (Simoneit and Elias, 2001). In this study, levoglucosan showed a unimodal size distribution with a peak at the ranges of 0.4–2.1 µm during most sampling periods (Fig. 5a–d). The concentrations of levoglucosan in the fine mode were 1.8–9.3 times those in the coarse mode. Mannosan and galactosan also showed a size distribution pattern similar to levoglucosan during all sampling periods.
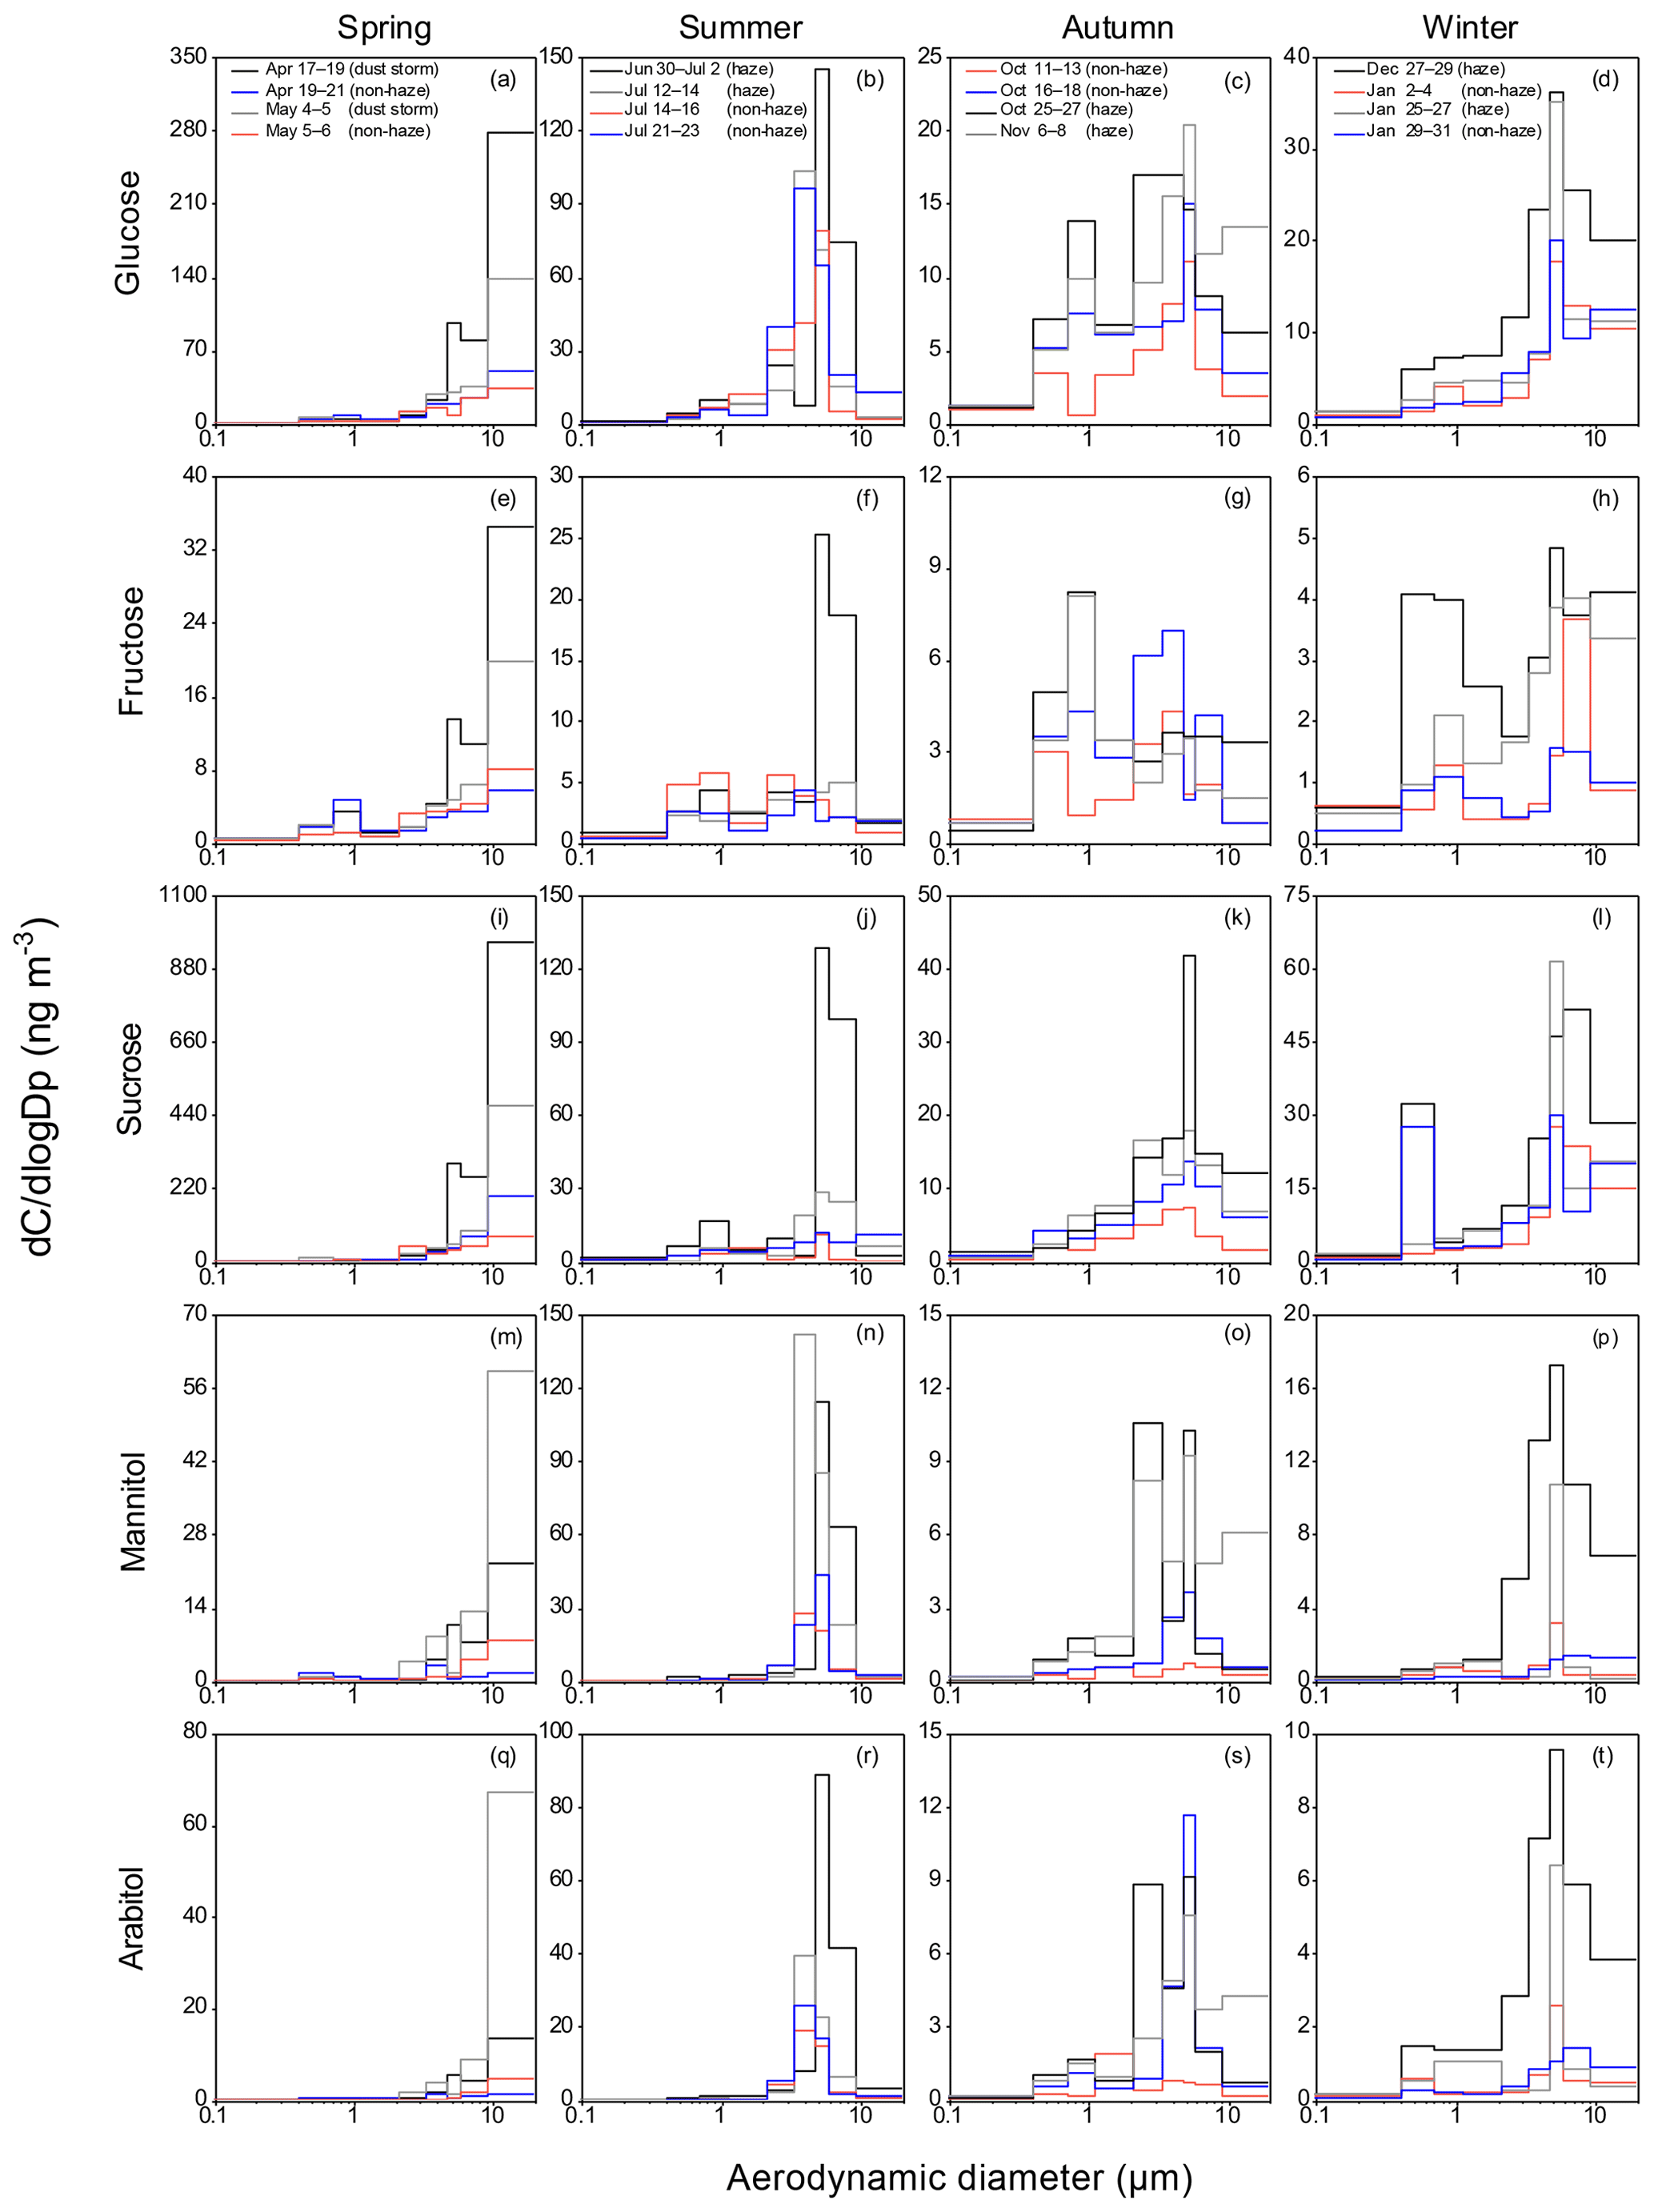
Figure 6Size distributions of glucose, fructose, sucrose, mannitol and arabitol in urban aerosols in Beijing.

Figure 7Size distributions of trehalose, xylose, maltose, inositol and erythritol in urban aerosols in Beijing.
Interestingly, all three anhydrosugars exhibited a unimodal size distribution in the coarse mode during the most serious dust storm period (4 to 5 May). Such distribution behaviors highlighted the significant contribution of dust storms to the loading of organic aerosols (OA) in Beijing. In a dust storm, strongly windblown coarse particles from a large-scale resuspension from crustal, soil, roads or other unpaved areas, along with long-range transport of particles from north and northwest desert regions, could induce a remarkable size shift of OA from the fine to the coarse mode. A similar result has reported such a phenomenon (Herner et al., 2006). The total-mode GMDs (geometric mean diameters) of these species, corresponding to the dust storm periods in spring, showed larger values (1.12–1.47 µm) than those in the non-haze periods (0.62–1.04 µm). The typical summer haze period (30 June to 2 July) with a minor peak at 3.3–5.8 µm in the coarse mode was likely due to the meteorological conditions with higher humidity and lower wind speed. Previous studies found that the size of the ambient particle can be modified by chemical reactions; condensation/evaporation; coagulation with other particles; and activation during high humidity, wet and dry deposition (Herner et al., 2006). Anhydrosugars are highly water soluble compared with fossil-fuel-derived particles, whose sizes increase with increasing relative humidity (Reid et al., 2005). During the haze period, the concentrations of all species were comparatively higher, especially in autumn and winter. As mentioned above, a larger scale of BB in cold seasons could lead to massive emission of these species. Moreover, autumn and winter were characterized by a low mixing layer and stagnant conditions in haze days, which benefit the accumulation of the pollutants (Balducci and Cecinato, 2010; Bigi and Ghermandi, 2011; Carbone et al., 2010; Perrone et al., 2012; Pietrogrande et al., 2014). The total- and coarse-mode GMDs of anhydrosugars in spring and summer were larger than in autumn and winter, while the fine-mode GMDs showed smaller values (Tables 4, S4 and S5). Such altering of particle size has been observed in other places (Herner et al., 2006; Wang et al., 2011).
Table 5Abundance of estimated primary OC (plant debris, fungal spores, biomass burning) and its contributions to OC in urban Beijing aerosols from April 2017 to January 2018.

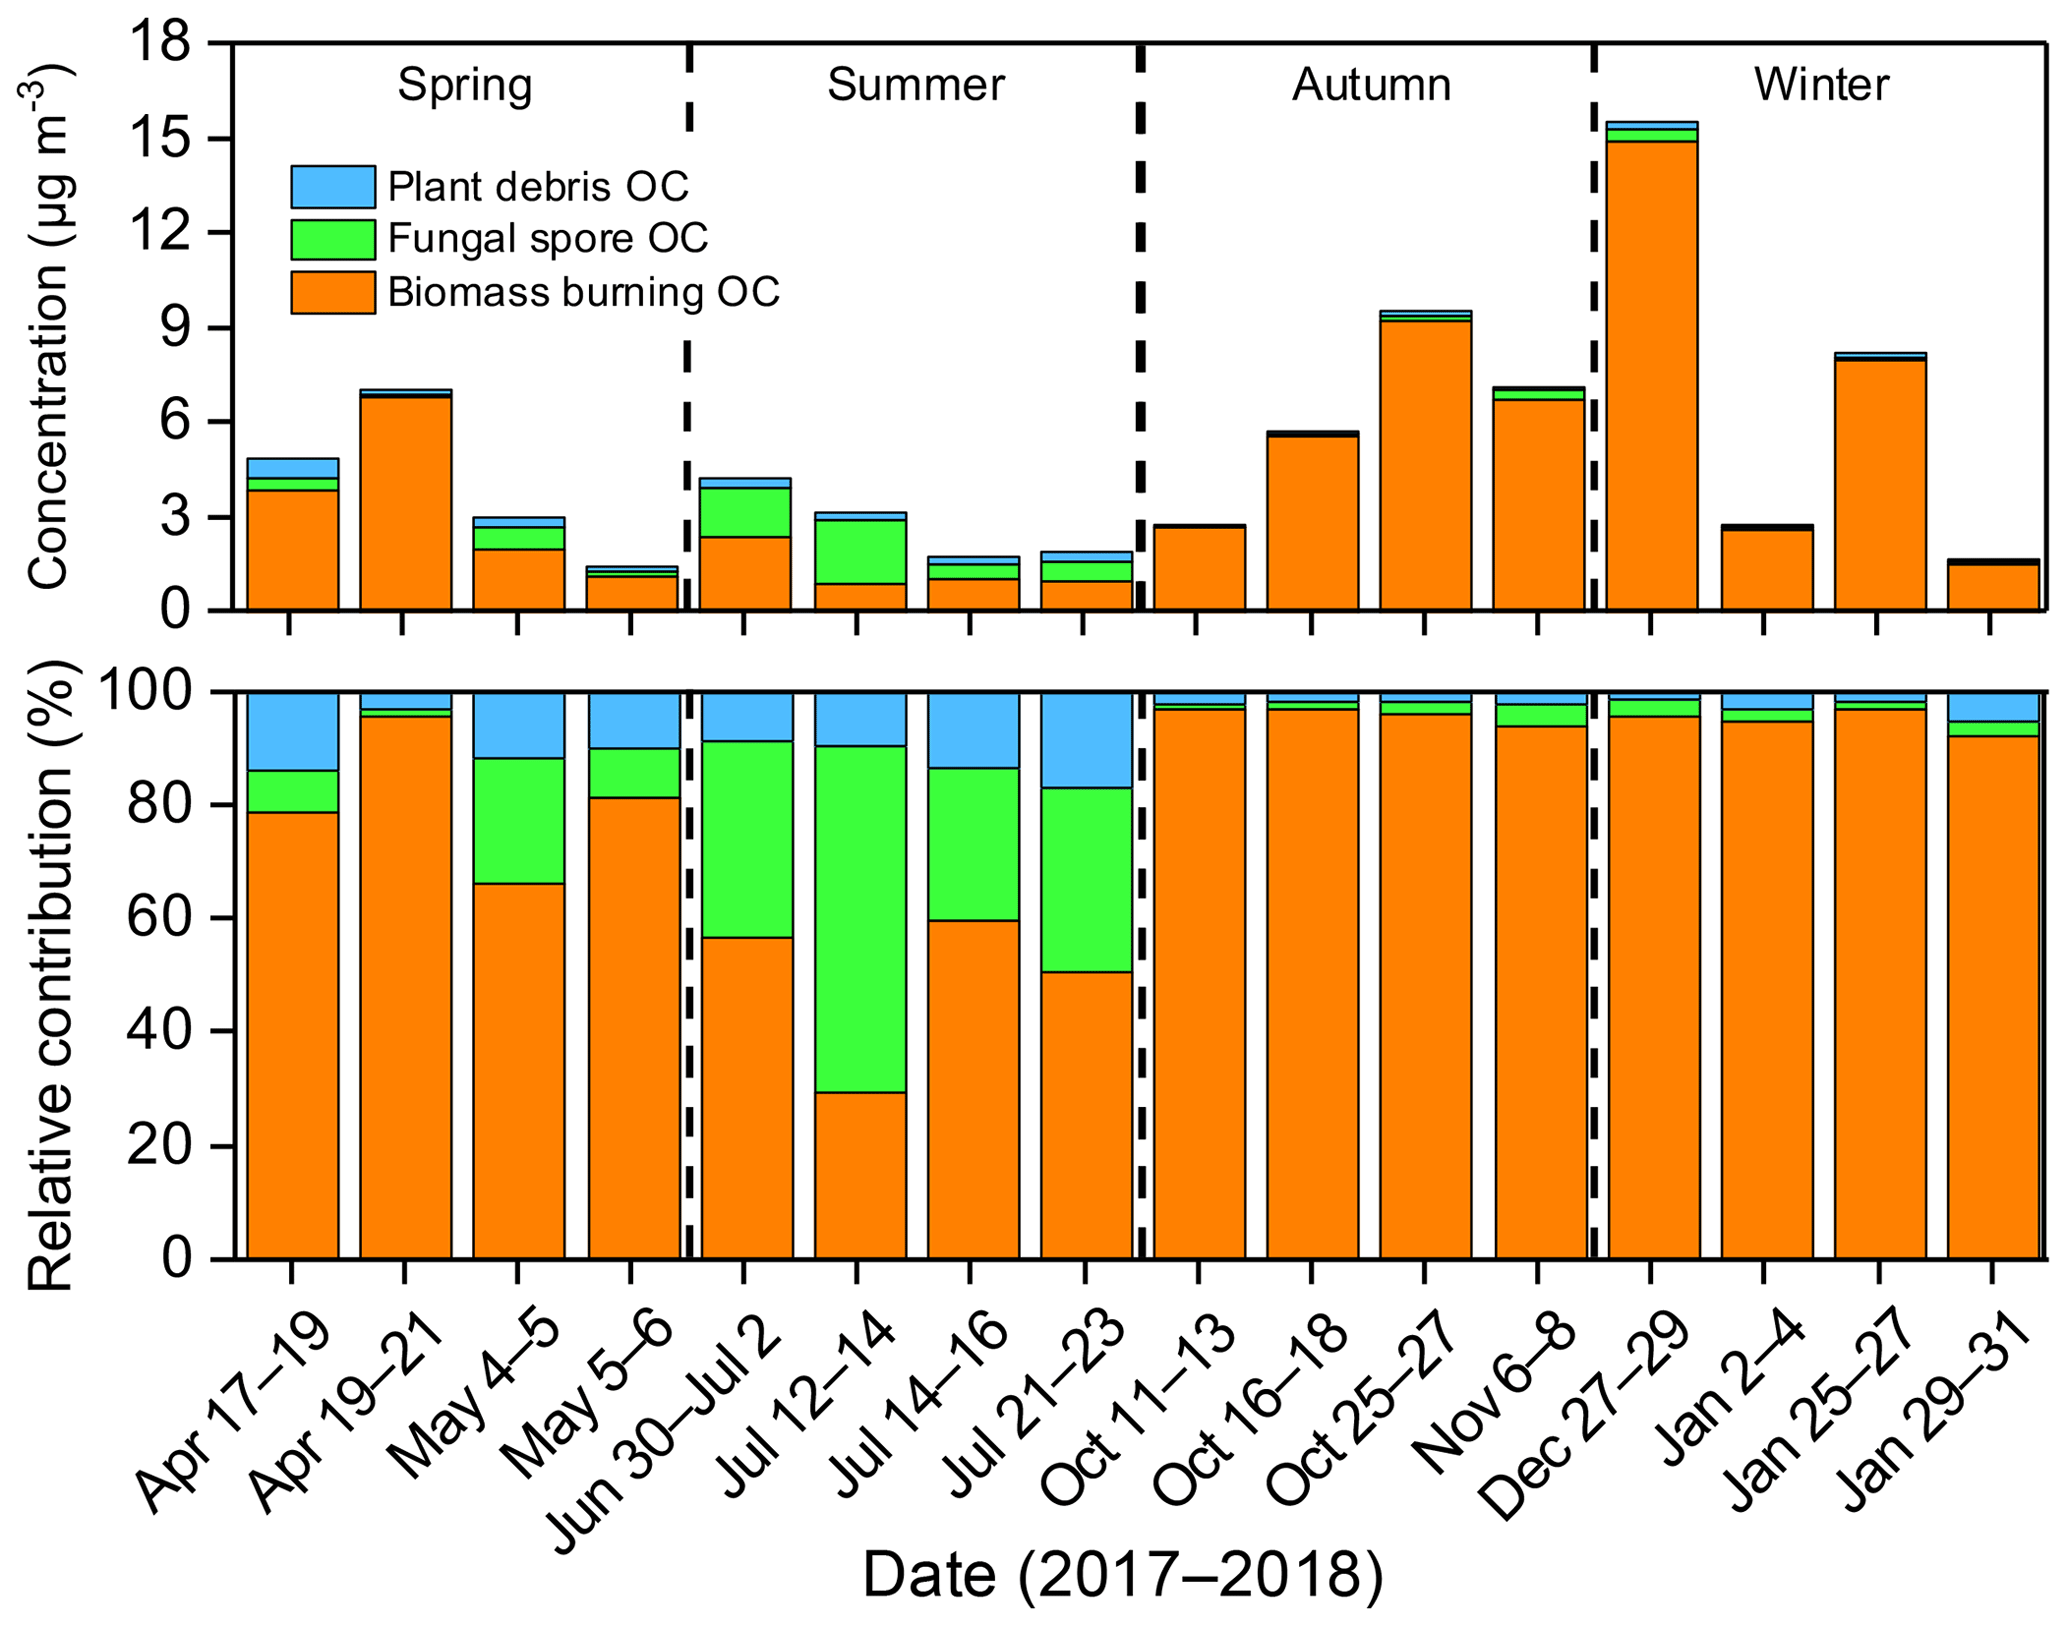
Figure 8Monthly variations in plant-debris-derived OC, fungal-spore-derived OC, and BB-derived OC in urban aerosols in Beijing and relative contributions of these primary OC.

Figure 9Concentrations of OC derived from plant debris, fungal spores and biomass burning in different size ranges of urban aerosols in Beijing.
3.3.2 Primary saccharides
The size distributions of all primary sugars are shown in Figs. 6–7. Both glucose and fructose are present mostly in coarse modes (Fig. 6). Though the concentrations of glucose were much higher than fructose, these two compounds showed similar trends with a bimodal size distribution, peaking at 0.7–1.1 and >5.8 µm for spring, 0.4–1.1 and 3.3–5.8 µm for summer and autumn, and 0.4–1.1 and 4.7–9 µm for winter. Compared to the smaller contribution in the fine mode in spring and summer (5.9 %–8.5 % and 14.5 %–26.7 % for glucose and fructose, respectively), the fractions of these two compounds were more abundant in fine aerosols during autumn and winter (15.0 %–24.4 % and 32.6 %–45.8 % for glucose and fructose, respectively). However, the origins of glucose and related sugars in fine particles remained unclear. Former studies suggested that fragmented pollen grains, either in cytoplasmic vesicles or dissolved in the cytosol, could be sources of sugars in the fine aerosol (Pacini, 2000; Yttri et al., 2007).
The size distribution of sucrose is shown in Fig. 6i–l. Sucrose showed a bimodal size distribution with high concentrations in the coarse mode during the sampling periods. A minor peak was found in the size ranges of 0.4–1.1 µm and a major peak was found at sizes >5.8 µm. Compared to the other three seasons (approximately 14.9 %, 18.8 % and 19.1 % for summer, autumn and winter, respectively), sucrose was not as prevalent in the fine mode (3.3 %) in spring. Such a phenomenon could be ascribed to the prevailing of pollen grain emission during the spring bloom season (Xu et al., 2012). Previous studies reported that most pollen of grasses actually remains in the anthers, and the cycle of wetting–drying causes the pollen to rupture from the anthers, with the pollen in the size range of 120 nm to 4.67 µm (Taylor et al., 2002). Meanwhile, furious windblown coarse aerosols from resuspension of dust in spring could further lead to higher abundance. Glucose, fructose and sucrose exhibited the largest total- and coarse-mode GMDs in dust storm aerosols, suggesting the effect of dust storms on particles which could contribute a large number of sugars (Tables 4, S5).
Trehalose resembles arabitol and mannitol more closely, which is mostly present in the coarse mode with a proportion of over 90 % and showed a nearly unimodal size distribution during the whole sampling periods (Fig. 7a–d). This result indicates that trehalose originated from fungal spores, consistent with former studies (Lewis and Smith, 1967; Medeiros et al., 2006). The same as sucrose, trehalose was greatly influenced by the dust storm in spring. The concentrations of trehalose in dust storm were 4–10 times higher than in non-haze periods (Fig. 7a), indicating the essential impact of dust storms. Also, trehalose showed the largest total, fine- and coarse-mode GMDs in dust storm periods (Tables 4, S4–S5). This phenomenon was in good agreement with the observation in Seoul (Jeon et al., 2013). Noticeably, the total- and coarse-mode GMDs of trehalose in winter non-haze days were much larger than those in haze days. We assumed that soil resuspension by wind input a substantial amount of large particles into the air, but the mechanism needs to be further discussed.
Different from other sugars and sugar alcohols, xylose and maltose showed a bimodal size distribution (Fig. 7). Except for summer, xylose and maltose were observed with a major peak at 0.4–1.1 µm and a minor peak at 3.3–5.8 µm in the other three seasons. In summer, xylose and maltose were mostly present in coarse aerosols and even peaked at 3.3–9 µm during 30 June to 2 July. The distribution patterns of xylose and maltose were similar to those of anhydrosugars, suggesting biomass burning may be a dominant sugar source in the fine mode. Xylose and glucose were positively correlated well with each other (r=0.83, p<0.001) in coarse modes, whereas the origin of maltose in coarse modes remained unclear in this study. The correlations between maltose and glucose and between maltose and sucrose were poor ( and r=0.01, respectively), in contrast to former studies that showed that maltose is particularly important in developing flower buds (Bieleski, 1995), indicating that maltose may be derived from other sources.
3.3.3 Sugar alcohols
The size distributions of sugar alcohols are illustrated in Figs. 6–7. Mannitol and arabitol showed similar trends while erythritol and inositol exhibited a different distribution pattern. Both mannitol and arabitol showed a unimodal size distribution in spring and summer, while they showed bimodal size distributions in autumn and winter. Mannitol and arabitol peaked at >9.0 µm and 3.3–9.0 µm in spring and summer, respectively, while they exhibited more fine aerosols in winter than in warm seasons. Such a phenomenon was attributed to various sources of mannitol and arabitol. In summer and autumn, fungal spores in the atmosphere can be derived from complex sources (e.g., plant leaves, agricultural activities), which may contribute more to coarse particles than those in winter (Yttri et al., 2007), while in winter there are fewer plant cover and agricultural activities, resulting in a higher fraction in the fine mode. Former studies suggested that mannitol was present in aerosol samples influenced by wildfire smoke, and mannitol and arabitol might be emitted by thermal stripping during wildfires (Medeiros and Simoneit, 2007; Simoneit et al., 2004). These sources can also effectively elevate the abundance of mannitol and arabitol in the fine mode in winter. Compared to other sampling periods, mannitol and arabitol in the dust storm exhibited the largest GMD values, which was ascribed to large emissions from the resuspension of fungal spores from the surface soil. Previous studies also found that elevated concentrations of trehalose, mannitol and arabitol were generally related to resuspended soil and the outflow of dust storms (Liang et al., 2013; Rogge et al., 2007). In summer, autumn and winter haze days, the total- and coarse-mode GMDs of mannitol and arabitol were generally larger than those in non-haze (Tables 4 and S4).
Inositol showed a bimodal size distribution in four seasons, while the pattern varied with season. In spring, the concentrations of inositol were high in the coarse mode with a peak at >9.0 µm, while in other seasons the concentrations of inositol peaked at 0.4–1.1 µm. The total-mode GMDs of inositol in the dust storm samples were much larger than those in other non-haze and haze samples, indicating the substantial influence of dust. The size pattern of inositol was similar to those of arabitol and mannitol, potentially responding to fungal spores in the local terrestrial biosphere. In this study, inositol was positively related to levoglucosan in the fine mode (r=0.77, p<0.001), which could explain the fine-mode preference in cold seasons. Such a correlation was further ascertained by the total- and fine-mode GMDs of inositol, for its similarity with that of anhydrosugars.
Erythritol presented a bimodal size distribution for all sampling periods. In summer, erythritol is mostly seen in the coarse mode with a major peak at 3.3–5.8 µm and a minor peak at 0.4–1.1 µm, while in other seasons the distribution patterns reversed with the prevailing of the fine mode and peaked at 0.4–1.1 µm. The source of erythritol in the fine mode was different from that in the coarse mode. The positive relationship between erythritol and levoglucosan (r=0.90, p<0.001) in the fine mode suggests the dominant contribution from biomass burning to erythritol. However, erythritol covaried with arabitol (r=0.59, p<0.001) in the coarse mode, suggesting that erythritol is partly of local origin.
Larger GMDs of primary carbonaceous particles in the fine mode in haze days than in non-haze days have been observed in both previous studies and the present study. One reason is the enhanced hygroscopic growth of airborne particles under relatively high humidity. As shown in Table S1, haze days were characterized by high relative humidity. Previous studies found that all the fine modes of WSOC (water-soluble organic carbon) showed a larger GMD in hazy days, and the fine-mode GMDs of aliphatic hydrocarbons were generally larger in haze samples due to higher relative humidity (Kang et al., 2016; Wang et al., 2011). In addition, the increased concentrations of airborne aerosols could increase the overall coagulation rate, resulting in a faster rate of collisions between particles and the formation of larger particles (Herner et al., 2006). Table 2 shows that the concentrations of anhydrosugars, primary saccharides and sugar alcohols were much higher in haze days, which were responsible for the larger GMDs in the fine mode and a size shift towards large particles.
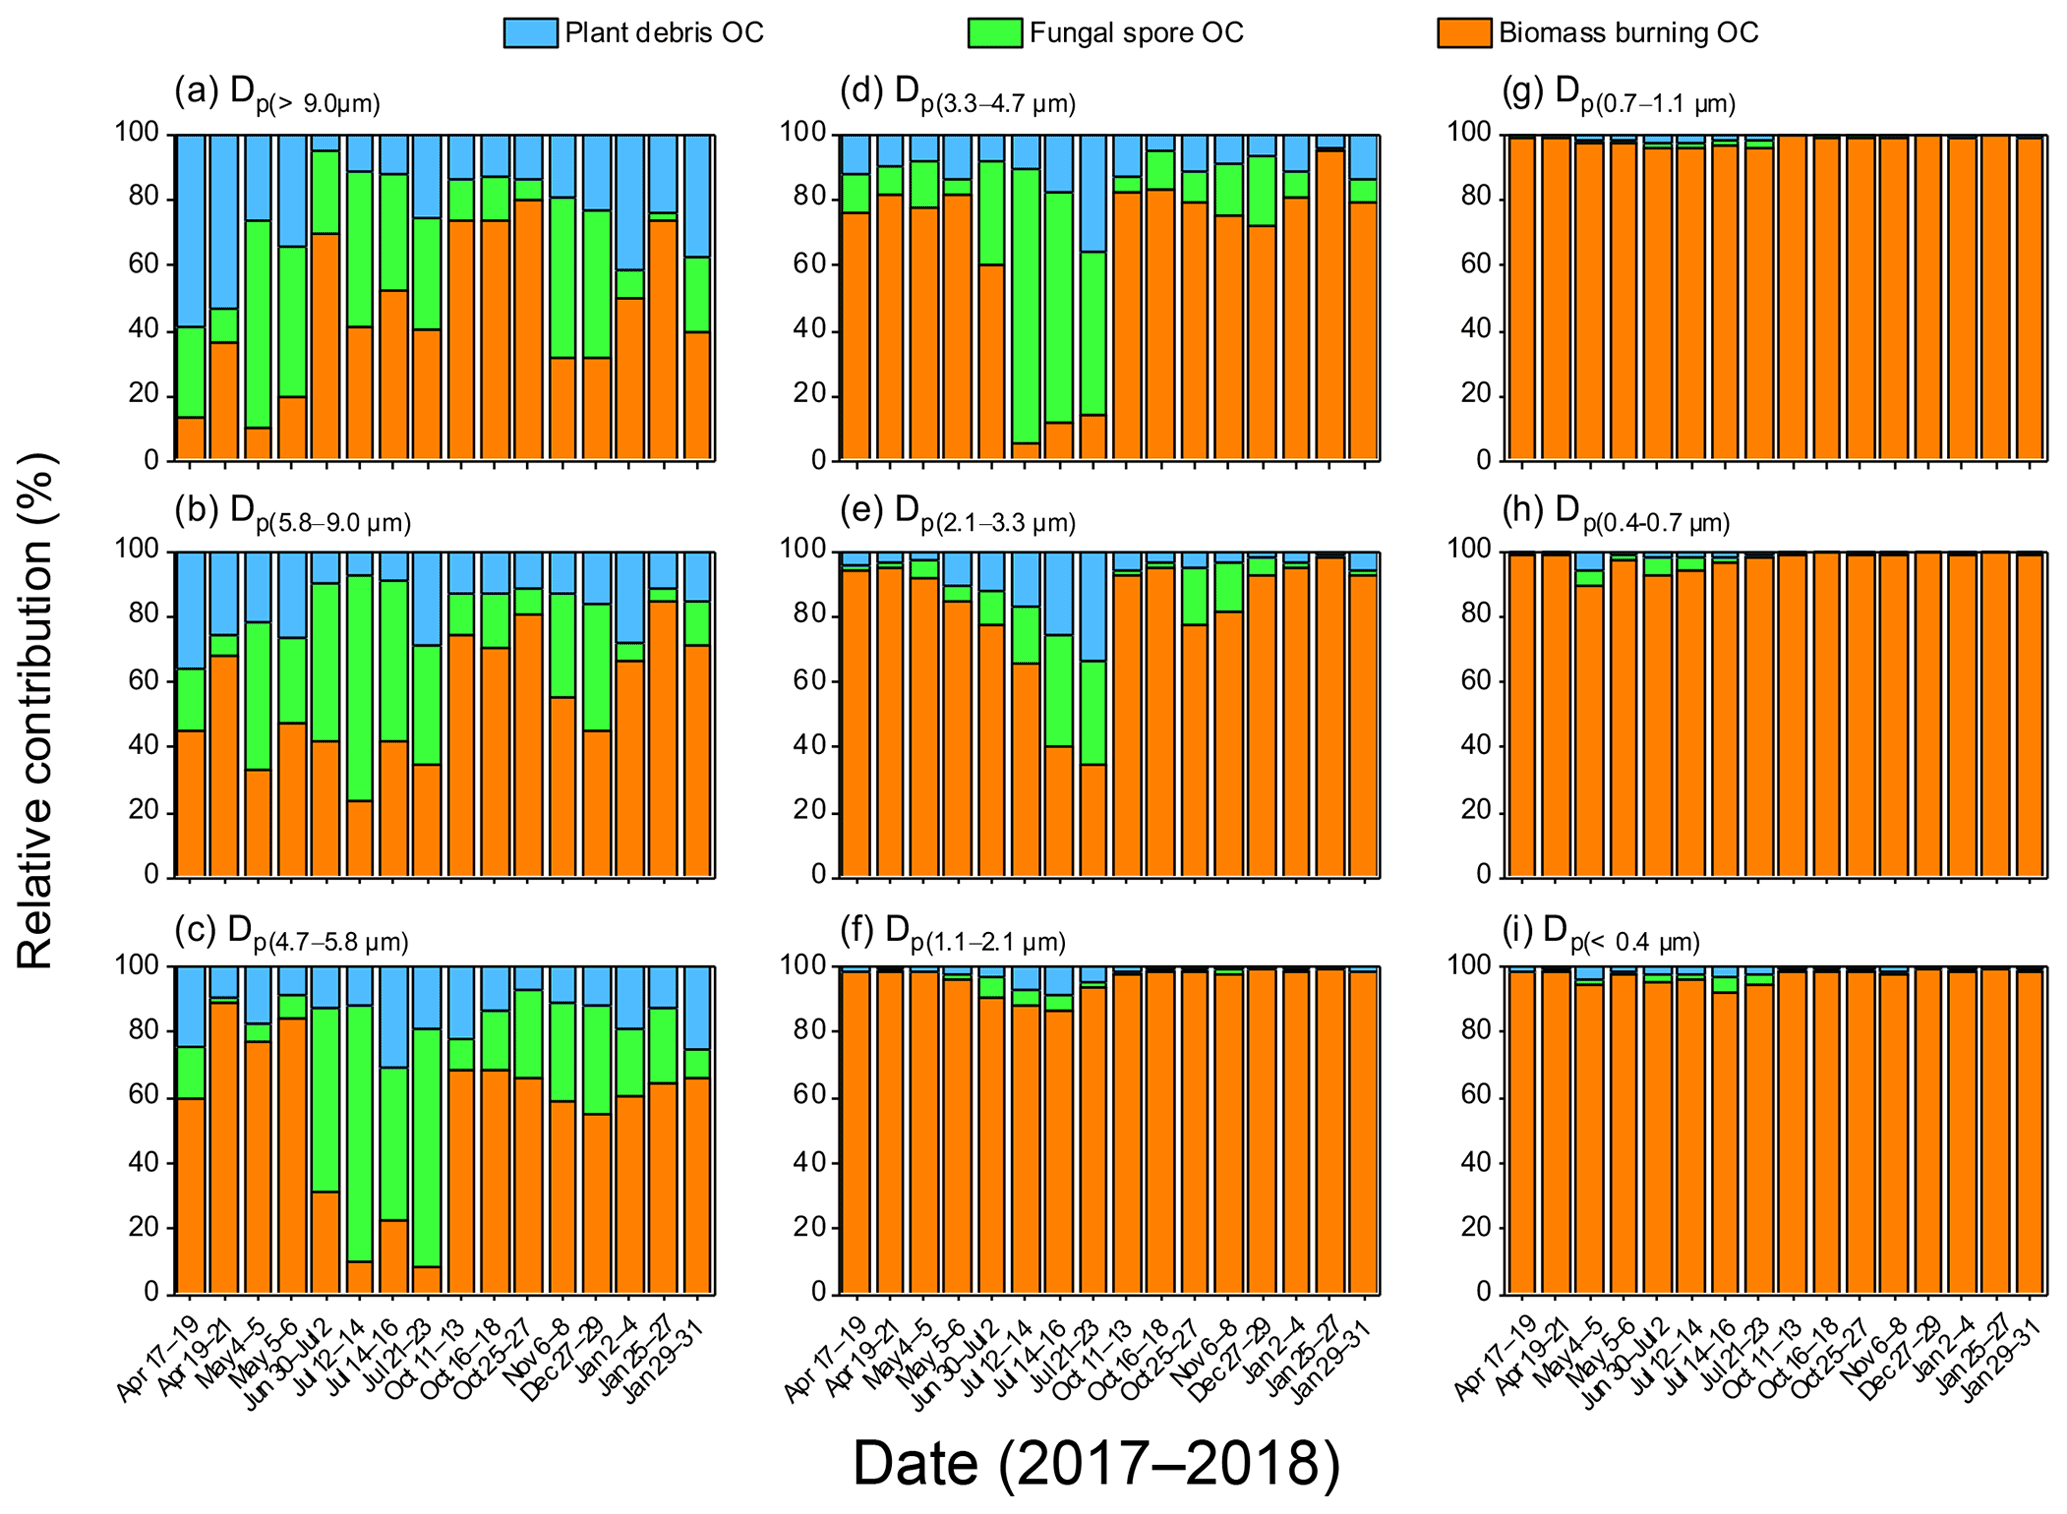
Figure 10Relative contributions of plant-debris-derived OC, fungal-spore-derived OC and BB-derived OC in different size ranges of urban aerosols in Beijing.
3.4 Abundance and contributions of OC from biomass burning, plant debris and fungal spores
Based on the tracer methods, the quantitative estimates of OC from biomass burning (BB), plant debris and fungal spores are shown in Table 5 and Figs. 8–9. In a combustion test in fireplaces conducted by Fine et al. (2004), the emission ratio of OC∕levoglucosan mass was 7.35 on average, and high ratios of 8.0 %–8.2 % are probably typical for open fires of burning grasses, woods and agricultural residues (Andreae and Merlet, 2001; Zhang et al., 2007). Considering the burning of agricultural wastes, an L∕OC ratio of 8.2 % was applied in this study. Except for summer, BB-OC was the most dominant and showed an order of magnitude higher than the other two OC contributors. The level of BB-OC reached a maximum in cold seasons (6.81 µg m−3 for winter, 6.11 µg m−3 for autumn) and a minimum in summer (1.39 µg m−3). The contributions of BB-OC reached the highest level (7.52 %) in winter, followed by autumn (5.51 %), and the lowest (1.21 %) in summer (Table 5 and Fig. 8b). Apart from the elevated abundance of levoglucosan, stable meteorological conditions would also lead to the accumulation of BB-OC in cold seasons (He et al., 2001).
Compared to BB-OC, the contributions of plant debris and fungal spores exhibited totally different patterns. Based on the relationship between glucose and plant debris (Puxbaum and Tenze-Kunit, 2003), the plant-debris-derived OC was estimated. The plant-debris-derived OC showed a seasonal trend with higher concentrations in spring (0.34 µg m−3) and summer (0.31 µg m−3) but lower in autumn (0.09 µg m−3) and winter (0.11 µg m−3). Likewise, the contributions of plant debris to OC were relatively larger in spring and summer (both 0.30 %), but they only accounted for 0.01 % in autumn and 0.16 % in winter. Mannitol, a tracer for fungal spores, was applied to estimate the contribution of fungal spores to OC using an experimentally derived factor of 1.7 pg mannitol and 13 pg OC per fungal spore (Bauer et al., 2008; Carvalho et al., 2003; Graham et al., 2003). In general, the abundance of fungal-spore-derived OC exhibited a similar trend with plant-debris-derived OC, which reached a maximum in summer (1.15 µg m−3) and reduced in autumn and winter (0.16 µg m−3). The contributions of fungal spores to OC reached a maximum in summer (1.00 %) and a minimum in autumn (0.13 %).
The contributions of OC from BB, plant debris and fungal spores according to particle size are shown in Fig. 10. BB-OC accounted for more than 85 % of the three species in the fine modes. It was more pronounced in autumn and winter at approximately 100 %. The contributions of BB-OC in coarse modes were of two patterns. In the size range of 2.1–9.0 µm, the relative contributions of OC were higher in spring, autumn and winter, with a proportion over 60 %, and exhibited the smallest fraction in summer, while in the size range larger than 9.0 µm, the smallest fraction of BB-OC appeared in spring, and the relative contributions were below 60 % in most periods. Plant-debris-derived OC was mostly present in the coarse modes. In the size range larger than 9.0 µm, the plant-debris-derived OC was the dominant one and peaked in spring (Fig. 9). Similar to plant-debris-derived OC, fungal-spore-derived OC also showed a high contribution in the coarse mode. The annual contributions of fungal spores to OC ranged from 0.04 % to 2.73 % (0.56 %) in the coarse mode, while those in the fine mode were just 0.03 %–0.14 % (0.06 %). Burge (2002) found that fungal spores in the atmosphere were present predominantly in the size range of 2–10 µm. Previous studies also found similar results showing that mannitol mainly occurs in the coarse size fraction (Carvalho et al., 2003; Graham et al., 2003; Samaké et al., 2019). The relative contribution decreased in the smaller size ranges and was much higher in summer compared to other seasons. The contributions of fungal spores to OC were particularly high (1.48 %) in the coarse fraction in summer, indicating the multiple sources of fungal spores in summertime. Both plant debris OC and fungal spore OC were present in fine modes, especially in spring and summer, which has been observed in several sites (Carvalho et al., 2003; Graham et al., 2003; Yang et al., 2012). It was worth mentioning that, though the contributions of plant debris and fungal spores in the whole range were insignificant in cold seasons, their contribution in the coarse mode could not be ignored.
Compared to the contributions of BB, plant debris and fungal spores in non-haze day, the total contribution to OC showed a larger fraction in haze days for each season with enriched factors of 1.2–9.1. However, the reasons for elevated contribution in hazy days varied with season. In summer, the enhanced concentration of fungal-spore-derived OC was the primary causation (Fig. 9), especially in the size range of 3.3–9.0 µm. The levels of plant-debris-derived OC in haze days were about 2.4–4.0 times higher than that in non-haze days, while BB-OC and fungal-spore-derived OC showed no significant differences (Figs. 8–9). Hence, the contribution to POC in haze days was seen more in the coarse mode than in non-haze days, whereas in autumn and winter the elevated total contribution is attributed to the increased concentration of BB-OC. Figure 9f–i shows that BB-OC in the size range of 0.4–2.1 µm of haze samples was much higher than that in non-haze samples. As a result, the prevalence of BB-OC lead to more total contribution in the fine mode and more in haze days.
Atmospheric concentrations; seasonal variations; and size distributions of anhydrosugars, primary saccharides, and sugar alcohols were investigated in urban aerosols from Beijing, China. High concentrations of anhydrosugars in the cold seasons were associated with the enhancement of biomass burning activities and adverse meteorological conditions. High levels of primary bioaerosol tracers such as sucrose, fructose, glucose, mannitol and arabitol were found in bloom and glowing seasons. The predominance of trehalose, a known tracer for Asian dust, was found during the most severe dust storm event (4–5 May). Anhydrosugars, xylose, maltose, inositol and erythritol were mostly present in the fine mode, while other primary sugars and sugar alcohols dominated in coarse particles. Dust storm greatly enhance organic aerosol concentrations and induce a remarkable size shift towards coarse sizes. Fine-mode GMDs of biomass burning aerosols and primary biological aerosol particles were larger in the haze days than in the non-haze days, probably due to the stable meteorological conditions with higher humidity, which favor the condensation of organic matter onto aerosol particles, especially in the coarse mode.
Based on the tracer-based methods, the contributions of biomass burning, plant debris and fungal spores to OC were calculated with a percentage of 1.21 %–7.52 %, 0.09 %–0.30 % and 0.13 %–1.00 %, respectively. The contribution of biomass-burning-derived OC predominated in the fine mode throughout the year, although the contribution was not negligible in the size range of 2.1–9.0 µm. The contribution of plant-debris-derived OC dominated in the coarse mode and decreased with the decreasing size. The contribution of fungal-spore-derived OC dominated in the size range of 3.3–5.8 µm in summertime samples. Though the sources of plant debris and fungal spores prevailed in spring and summer, small contributions in the coarse mode were also found during cold seasons due to long-range atmospheric transport from the southern regions. To better characterize sources and formation processes of haze particles and atmospheric chemistry in the North China Plain, further investigations on the size distributions of biogenic and anthropogenic secondary organic aerosol (SOA) tracers are strongly needed in the future.
The dataset for this paper is available upon request from the corresponding author (fupingqing@tju.edu.cn).
Information on sampling parameters from April 2017 to January 2018 (Table S1). Linear correlation coefficients among anhydrosugars and OC, and with EC in Beijing aerosols from April 2017 to January 2018 (Table S2). Linear correlation coefficients among primary saccharides and sugar alcohols, and with levoglucosan in Beijing aerosols from April 2017 to January 2018 (Table S3). Geometric mean diameters (GMDs, mm) of anhydrosugars and other saccharides in the fine-mode (<2.1 µm) and coarse-mode (≥2.1 µm) particles in Beijing (Tables S4 and S5). Clusters of 3 d backward trajectories of air masses arriving at Beijing during dust storm events and haze periods from April 2017 to January 2018 (Fig. S1). The supplement related to this article is available online at: https://doi.org/10.5194/acp-20-3623-2020-supplement.
The authors declare that they have no conflict of interest.
PQF designed this research. Field campaigns were organized by PQF, SJH and YCL. Aerosol samples were collected by SJH. Laboratory analyses were performed by SFX, LJR, HR and SJH. The paper was written by SFX and PQF in consultation with and with editing from all other authors.
This research has been supported by the National Natural Science Foundation of China (grant nos. 41625014, 41581130024 and 41807303) and the State Key Joint Laboratory of Environment Simulation and Pollution Control (grant no. 18K02ESPCT).
This paper was edited by Qiang Zhang and reviewed by two anonymous referees.
Akagi, S. K., Yokelson, R. J., Wiedinmyer, C., Alvarado, M. J., Reid, J. S., Karl, T., Crounse, J. D., and Wennberg, P. O.: Emission factors for open and domestic biomass burning for use in atmospheric models, Atmos. Chem. Phys., 11, 4039–4072, https://doi.org/10.5194/acp-11-4039-2011, 2011.
Andreae, M. O. and Merlet, P.: Emission of trace gases and aerosols from biomass burning, Global Biogeochem. Cy., 15, 955–966, https://doi.org/10.1029/2000gb001382, 2001.
Arangio, A. M., Slade, J. H., Berkemeier, T., Pöschl, U., Knopf, D. A., and Shiraiwa, M.: Multiphase chemical kinetics of OH radical uptake by molecular organic markers of biomass burning aerosols: humidity and temperature dependence, surface reaction, and bulk diffusion, J. Phys. Chem. A., 119, 4533–4544, https://doi.org/10.1021/jp510489z, 2015.
Balducci, C. and Cecinato, A.: Particulate organic acids in the atmosphere of Italian cities: Are they environmentally relevant?, Atmos. Environ., 44, 652–659, https://doi.org/10.1016/j.atmosenv.2009.11.015, 2010.
Bauer, H., Claeys, M., Vermeylen, R., Schueller, E., Weinke, G., Berger, A., and Puxbaum, H.: Arabitol and mannitol as tracers for the quantification of airborne fungal spores, Atmos. Environ., 42, 588–593, https://doi.org/10.1016/j.atmosenv.2007.10.013, 2008.
Bieleski, R. L.: Onset of phloem export from senescent petals of daylily, Plant Phys., 109, 557–565, https://doi.org/10.1104/pp.109.2.557,1995.
Bigi, A. and Ghermandi, G.: Particle Number Size Distribution and Weight Concentration of Background Urban Aerosol in a Po Valley Site, Water, Air, Soil Pollut., 220, 265–278, https://doi.org/10.1007/s11270-011-0752-6, 2011.
Burge, H. A.: An update on pollen and fungal spore aerobiology, J. Aller. Clin. Immunol., 110, 544–552, https://doi.org/10.1067/mai.2002.128674, 2002.
Cao, J. J., Wu, F., Chow, J. C., Lee, S. C., Li, Y., Chen, S. W., An, Z. S., Fung, K. K., Watson, J. G., Zhu, C. S., and Liu, S. X.: Characterization and source apportionment of atmospheric organic and elemental carbon during fall and winter of 2003 in Xi'an, China, Atmos. Chem. Phys., 5, 3127–3137, https://doi.org/10.5194/acp-5-3127-2005, 2005.
Carbone, C., Decesari, S., Mircea, M., Giulianelli, L., Finessi, E., Rinaldi, M., Fuzzi, S., Marinoni, A., Duchi, R., Perrino, C., Sargolini, T., Vardè, M., Sprovieri, F., Gobbi, G. P., Angelini, F., and Facchini, M. C.: Size-resolved aerosol chemical composition over the Italian Peninsula during typical summer and winter conditions, Atmos. Environ., 44, 5269–5278, https://doi.org/10.1016/j.atmosenv.2010.08.008, 2010.
Carvalho, A., Pio, C., and Santos, C.: Water-soluble hydroxylated organic compounds in German and Finnish aerosols, Atmos. Environ., 37, 1775–1783, https://doi.org/10.1016/S1352-2310(03)00066-9, 2003.
Chen, J., Kawamura, K., Liu, C. Q., and Fu, P.: Long-term observations of saccharides in remote marine aerosols from the western North Pacific: A comparison between 1990–1993 and 2006–2009 periods, Atmos. Environ., 67, 448–458, https://doi.org/10.1016/j.atmosenv.2012.11.014, 2013.
Cheng, Y., Engling, G., He, K.-B., Duan, F.-K., Ma, Y.-L., Du, Z.-Y., Liu, J.-M., Zheng, M., and Weber, R. J.: Biomass burning contribution to Beijing aerosol, Atmos. Chem. Phys., 13, 7765–7781, https://doi.org/10.5194/acp-13-7765-2013, 2013.
Cheng, Y., Zheng, G., Wei, C., Mu, Q., Zheng, B., Wang, Z., Gao, M., Zhang, Q., He, K., and Carmichael, G.: Reactive nitrogen chemistry in aerosol water as a source of sulfate during haze events in China, Sci. Adv., 2, e1601530, https://doi.org/10.1126/sciadv.1601530, 2016.
China, S., Burrows, S. M., Wang, B., Harder, T. H., Weis, J., Tanarhte, M., Rizzo, L. V., Brito, J., Cirino, G. G., Ma, P.-L., Cliff, J., Artaxo, P., Gilles, M. K., and Laskin, A.: Fungal spores as a source of sodium salt particles in the Amazon basin, Nat. Commun., 9, 4793, https://doi.org/10.1038/s41467-018-07066-4, 2018.
Chowdhury, Z., Zheng, M., Schauer, J. J., Sheesley, R. J., Salmon, L. G., Cass, G. R., and Russell, A. G.: Speciation of ambient fine organic carbon particles and source apportionment of PM2.5 in Indian cities, J. Geophys. Res., 112, D15303, https://doi.org/10.1029/2007JD008386, 2007.
Dahlman, L., Persson, J., Nasholm, T., and Palmqvist, K.: Carbon and nitrogen distribution in the green algal lichens Hypogymnia physodes and Platismatia glauca in relation to nutrient supply, Planta, 217, 41–48, https://doi.org/10.1007/s00425-003-0977-8, 2003.
Després, V., Huffman, J. A., Burrows, S. M., Hoose, C., Safatov, A., Buryak, G., Fröhlich-Nowoisky, J., Elbert, W., Andreae, M., Pöschl, U., and Meteorology, P.: Primary biological aerosol particles in the atmosphere: a review, Tellus B, 64, 598, https://doi.org/10.3402/tellusb.v64i0.15598, 2012.
Di Filippo, P., Pomata, D., Riccardi, C., Buiarelli, F., and Perrino, C.: Fungal contribution to size-segregated aerosol measured through biomarkers, Atmos. Environ., 64, 132–140, https://doi.org/10.1016/j.atmosenv.2012.10.010, 2013.
Draxler, R. R. and Rolph, G. D.: HYSPLIT (HYbrid Single-Particle Lagrangian Integrated Trajectory) Model, access via NOAA ARL READY Website, available at: http://www.arl.noaa.gov/HYSPLIT.php (last access: 8 July 2014), NOAA Air Resources Laboratory, College Park, MD, 2013.
Engling, G., Carrico, C. M., Kreidenweis, S. M., Collett Jr., J. L., Day, D. E., Malm, W. C., Lincoln, E., Min Hao, W., Iinuma, Y., and Herrmann, H.: Determination of levoglucosan in biomass combustion aerosol by high-performance anion-exchange chromatography with pulsed amperometric detection, Atmos. Environ., 40, 299–311, https://doi.org/10.1016/j.atmosenv.2005.12.069, 2006.
Fabbri, D., Torri, C., Simoneit, B. R., Marynowski, L., Rushdi, A. I., and Fabiańska, M.J: Levoglucosan and other cellulose and lignin markers in emissions from burning of Miocene lignites, Atmos. Environ., 43, 2286–2295, https://doi.org/10.1016/j.atmosenv.2009.01.030, 2009.
Fang, Z., Guo, W., Zhang, J., and Lou, X.: Influence of Heat Events on the Composition of Airborne Bacterial Communities in Urban Ecosystems, Int. J. Environ. Res. Public. Health, 15, 2295, https://doi.org/10.3390/ijerph15102295, 2018.
Feng, J., Guo, Z., Chan, C. K., and Fang, M.: Properties of organic matter in PM2.5 at Changdao Island, China – A rural site in the transport path of the Asian continental outflow, Atmos. Environ., 41, 1924–1935, https://doi.org/10.1016/j.atmosenv.2006.10.064, 2007.
Fine, P. M., Cass, G. R., and Simoneit, B. R.: Chemical characterization of fine particle emissions from the fireplace combustion of wood types grown in the Midwestern and Western United States, Environ. Eng. Sci., 21, 387–409, https://doi.org/10.1089/109287504323067021, 2004.
Fraser, M. P. and Lakshmanan, K.: Using levoglucosan as a molecular marker for the long-range transport of biomass combustion aerosols, Environ. Sci. Technol., 34, 4560–4564, https://doi.org/10.1021/es991229l, 2000.
Fröhlich-Nowoisky, J., Burrows, S. M., Xie, Z., Engling, G., Solomon, P. A., Fraser, M. P., Mayol-Bracero, O. L., Artaxo, P., Begerow, D., Conrad, R., Andreae, M. O., Després, V. R., and Pöschl, U.: Biogeography in the air: fungal diversity over land and oceans, Biogeosciences, 9, 1125–1136, https://doi.org/10.5194/bg-9-1125-2012, 2012.
Fröhlich-Nowoisky, J., Kampf, C. J., Weber, B., Huffman, J. A., Pöhlker, C., Andreae, M. O., Lang-Yona, N., Burrows, S. M., Gunthe, S. S., and Elbert, W., Su, H., Hoor, P., Thines, E., Hoffmann, T., Després, V. R., and Pöschl, U.: Bioaerosols in the Earth system: Climate, health, and ecosystem interactions, Atmos. Res., 182, 346–376, https://doi.org/10.1016/j.atmosres.2016.07.018, 2016.
Fu, P. Q., Kawamura, K., Chen, J., Charrière, B., and Sempéré, R.: Organic molecular composition of marine aerosols over the Arctic Ocean in summer: contributions of primary emission and secondary aerosol formation, Biogeosciences, 10, 653–667, https://doi.org/10.5194/bg-10-653-2013, 2013.
Fu, P., Kawamura, K., Okuzawa, K., Aggarwal, S. G., Wang, G., Kanaya, Y., and Wang, Z.: Organic molecular compositions and temporal variations of summertime mountain aerosols over Mt. Tai, North China Plain, J. Geophys. Res., 113, D19107, https://doi.org/10.1029/2008jd009900, 2008.
Fu, P., Kawamura, K., Kanaya, Y., and Wang, Z.: Contributions of biogenic volatile organic compounds to the formation of secondary organic aerosols over Mt. Tai, Central East China, Atmos. Environ., 44, 4817–4826, https://doi.org/10.1016/j.atmosenv.2010.08.040, 2010.
Fu, P., Kawamura, K., Kobayashi, M., and Simoneit, B. R.: Seasonal variations of sugars in atmospheric particulate matter from Gosan, Jeju Island: Significant contributions of airborne pollen and Asian dust in spring, Atmos. Environ., 55, 234–239, https://doi.org/10.1016/j.atmosenv.2012.02.061, 2012.
Fu, P., Zhuang, G., Sun, Y., Wang, Q., Chen, J., Ren, L., Yang, F., Wang, Z., Pan, X., Li, X., and Kawamura, K.: Molecular markers of biomass burning, fungal spores and biogenic SOA in the Taklimakan desert aerosols, Atmos. Environ., 130, 64–73, https://doi.org/10.1016/j.atmosenv.2015.10.087, 2016.
Graham, B.: Water-soluble organic compounds in biomass burning aerosols over Amazonia1. Characterization by NMR and GC-MS, J. Geophys. Res., 107, 8047, https://doi.org/10.1029/2001jd000336, 2002.
Graham, B., Guyon, P., Taylor, P. E., Artaxo, P., Maenhaut, W., Glovsky, M. M., Flagan, R. C., and Andreae, M. O.: Organic compounds present in the natural Amazonian aerosol: Characterization by gas chromatography-mass spectrometry, J. Geophys. Res., 108, 4766, https://doi.org/10.1029/2003jd003990, 2003.
He, K., Yang, F., Ma, Y., Zhang, Q., Yao, X., Chan, C. K., Cadle, S., Chan, T., and Mulawa, P.: The characteristics of PM2. 5 in Beijing, China, Atmos. Environ., 35, 4959–4970, https://doi.org/10.1016/s1352-2310(01)00301-6, 2001.
Heald, C. L. and Spracklen, D. V.: Atmospheric budget of primary biological aerosol particles from fungal spores, Geophys. Res. Lett., 36, L09806, https://doi.org/10.1029/2009gl037493, 2009.
Hennigan, C. J., Sullivan, A. P., Collett Jr., J. L., and Robinson, A. L.: Levoglucosan stability in biomass burning particles exposed to hydroxyl radicals, Geophys. Res. Lett., 37, L09806, https://doi.org/10.1029/2010gl043088, 2010.
Herner, J. D., Ying, Q., Aw, J., Gao, O., Chang, D. P., and Kleeman, M. J.: Dominant mechanisms that shape the airborne particle size and composition distribution in central California, Aerosol Sci. Technol., 40, 827–844, https://doi.org/10.1080/02786820600728668, 2006.
Ho, K. F., Engling, G., Sai Hang Ho, S., Huang, R., Lai, S., Cao, J., and Lee, S. C.: Seasonal variations of anhydrosugars in PM2.5 in the Pearl River Delta Region, China, Tellus B Chem. Phys. Meteorol., 66, 103–107, https://doi.org/10.3402/tellusb.v66.22577, 2014.
Huffman, J. A., Treutlein, B., and Pöschl, U.: Fluorescent biological aerosol particle concentrations and size distributions measured with an Ultraviolet Aerodynamic Particle Sizer (UV-APS) in Central Europe, Atmos. Chem. Phys., 10, 3215–3233, https://doi.org/10.5194/acp-10-3215-2010, 2010.
Humbal, C., Gautam, S., and Trivedi, U.: A review on recent progress in observations, and health effects of bioaerosols, Environ. Int., 118, 189–193, https://doi.org/10.1016/j.envint.2018.05.053, 2018.
Jeon, E. M., Kim, Y. P., Jeong, K., Kim, I. S., Eom, S. W., Choi, Y. Z., and Ka, J. O.: Impacts of Asian dust events on atmospheric fungal communities, Atmos. Environ., 81, 39–50, https://doi.org/10.1016/j.atmosenv.2013.08.039, 2013.
Jia, Y., Bhat, S., and Fraser, M. P.: Characterization of saccharides and other organic compounds in fine particles and the use of saccharides to track primary biologically derived carbon sources, Atmos. Environ., 44, 724–732, https://doi.org/10.1016/j.atmosenv.2009.10.034, 2010.
Jimenez, J. L., Canagaratna, M. R., Donahue, N. M., Prevot, A. S., Zhang, Q., Kroll, J. H., DeCarlo, P. F., Allan, J. D., Coe, H., Ng, N. L., Aiken, A. C., Docherty, K. S., Ulbrich, I. M., Grieshop, A. P., Robinson, A. L., Duplissy, J., Smith, J. D., Wilson, K. R., Lanz, V. A., Hueglin, C., Sun, Y. L., Tian, J., Laaksonen, A., Raatikainen, T., Rautiainen, J., Vaattovaara, P., Ehn, M., Kulmala, M., Tomlinson, J. M., Collins, D. R., Cubison, M. J., Dunlea, E. J., Huffman, J. A., Onasch, T. B., Alfarra, M. R., Williams, P. I., Bower, K., Kondo, Y., Schneider, J., Drewnick, F., Borrmann, S., Weimer, S., Demerjian, K., Salcedo, D., Cottrell, L., Griffin, R., Takami, A., Miyoshi, T., Hatakeyama, S., Shimono, A., Sun, J. Y., Zhang, Y. M., Dzepina, K., Kimmel, J. R., Sueper, D., Jayne, J. T., Herndon, S. C., Trimborn, A. M., Williams, L. R., Wood, E. C., Middlebrook, A. M., Kolb, C. E., Baltensperger, U., and Worsnop, D. R.: Evolution of organic aerosols in the atmosphere, Science, 326, 1525–1529, https://doi.org/10.1126/science.1180353, 2009.
Kanakidou, M., Seinfeld, J. H., Pandis, S. N., Barnes, I., Dentener, F. J., Facchini, M. C., Van Dingenen, R., Ervens, B., Nenes, A., Nielsen, C. J., Swietlicki, E., Putaud, J. P., Balkanski, Y., Fuzzi, S., Horth, J., Moortgat, G. K., Winterhalter, R., Myhre, C. E. L., Tsigaridis, K., Vignati, E., Stephanou, E. G., and Wilson, J.: Organic aerosol and global climate modelling: a review, Atmos. Chem. Phys., 5, 1053–1123, https://doi.org/10.5194/acp-5-1053-2005, 2005.
Kang, M., Fu, P., and Aggarwal, S.: Size distributions of n-alkanes, fatty acids and fatty alcohols in springtime aerosols from New Delhi, India, Environ. Pollut., 219, 957–966, https://doi.org/10.1016/j.envpol.2016.09.077, 2016.
Křůmal, K., Mikuška, P., Vojtěšek, M., and Večeřa, Z.: Seasonal variations of monosaccharide anhydrides in PM1 and PM2:5 aerosol in urban areas, Atmos. Environ., 44, 5148–5155, https://doi.org/10.1016/j.atmosenv.2010.08.057, 2010.
Lai, C., Liu, Y., Ma, J., Ma, Q., and He, H.: Degradation kinetics of levoglucosan initiated by hydroxyl radical under different environmental conditions, Atmos. Environ., 91, 32–39, https://doi.org/10.1016/j.atmosenv.2014.03.054, 2014.
Lewis, D. and Smith, D.: Sugar alcohols (polyols) in fungi and green plants, 1. Distribution, physiology and metabolism, New Phytol., 66, 143–184, https://doi.org/10.2307/2430328, 1967.
Liang, L., Engling, G., He, K., Du, Z., Cheng, Y., and Duan, F.: Evaluation of fungal spore characteristics in Beijing, China, based on molecular tracer measurements, Environ. Res. Lett., 8, 014005, https://doi.org/10.1088/1748-9326/8/1/014005, 2013.
Liang, L., Engling, G., Du, Z., Cheng, Y., Duan, F., Liu, X., and He, K.: Seasonal variations and source estimation of saccharides in atmospheric particulate matter in Beijing, China, Chemosphere, 150, 365–377, https://doi.org/10.1016/j.chemosphere.2016.02.002, 2016.
Lu, Z., Zhang, Q., and Streets, D. G.: Sulfur dioxide and primary carbonaceous aerosol emissions in China and India, 1996–2010, Atmos. Chem. Phys., 11, 9839–9864, https://doi.org/10.5194/acp-11-9839-2011, 2011.
Medeiros, P. M. and Simoneit, B. R.: Analysis of sugars in environmental samples by gas chromatography–mass spectrometry, J. Chromatogr., 1141, 271–278, https://doi.org/10.1016/j.chroma.2006.12.017, 2007.
Medeiros, P. M., Fernandes, M. F., Dick, R. P., and Simoneit, B. R.: Seasonal variations in sugar contents and microbial community in a ryegrass soil, Chemosphere, 65, 832–839, https://doi.org/10.1016/j.chemosphere.2006.03.025, 2006.
Mkoma, S. L., Kawamura, K., and Fu, P. Q.: Contributions of biomass/biofuel burning to organic aerosols and particulate matter in Tanzania, East Africa, based on analyses of ionic species, organic and elemental carbon, levoglucosan and mannosan, Atmos. Chem. Phys., 13, 10325–10338, https://doi.org/10.5194/acp-13-10325-2013, 2013.
Mochida, M., Kawamura, K., Fu, P., and Takemura, T.: Seasonal variation of levoglucosan in aerosols over the western North Pacific and its assessment as a biomass-burning tracer, Atmos. Environ., 44, 3511–3518, https://doi.org/10.1016/j.atmosenv.2010.06.017, 2010.
Nel, A.: Air pollution-related illness: effects of particles, Science, 308, 804–806, https://doi.org/10.1126/science.1108752, 2005.
Nemmar, A., Hoet, P. M., Vanquickenborne, B., Dinsdale, D., Thomeer, M., Hoylaerts, M., Vanbilloen, H., Mortelmans, L., and Nemery, B.: Passage of inhaled particles into the blood circulation in humans, Circ., 105, 411–414, https://doi.org/10.1161/hc0402.104118, 2002.
Ng, N. L., Canagaratna, M. R., Zhang, Q., Jimenez, J. L., Tian, J., Ulbrich, I. M., Kroll, J. H., Docherty, K. S., Chhabra, P. S., Bahreini, R., Murphy, S. M., Seinfeld, J. H., Hildebrandt, L., Donahue, N. M., DeCarlo, P. F., Lanz, V. A., Prévôt, A. S. H., Dinar, E., Rudich, Y., and Worsnop, D. R.: Organic aerosol components observed in Northern Hemispheric datasets from Aerosol Mass Spectrometry, Atmos. Chem. Phys., 10, 4625–4641, https://doi.org/10.5194/acp-10-4625-2010, 2010.
O'dowd, C. D., Facchini, M. C., Cavalli, F., Ceburnis, D., Mircea, M., Decesari, S., Fuzzi, S., Yoon, Y. J., and Putaud, J. P.: Biogenically driven organic contribution to marine aerosol, Nature, 431, 676–680, https://doi.org/10.1038/nature02959, 2004.
Oros, D. R., bin Abas, M. R., Omar, N. Y. M., Rahman, N. A., and Simoneit, B. R.: Identification and emission factors of molecular tracers in organic aerosols from biomass burning: Part 3. Grasses, Appl. Geochem., 21, 919–940, https://doi.org/10.1016/j.apgeochem.2006.01.00821, 2006.
Pacini, E.: From anther and pollen ripening to pollen presentation, in: Pollen and pollination, Springer, 19–43, https://doi.org/10.1007/978-3-7091-6306-1_2, 2000.
Pashynska, V., Vermeylen, R., Vas, G., Maenhaut, W., and Claeys, M.: Development of a gas chromatographic/ion trap mass spectrometric method for the determination of levoglucosan and saccharidic compounds in atmospheric aerosols. Application to urban aerosols, J. Mass Spectrom., 37, 1249–1257, https://doi.org/10.1002/jms.391, 2002.
Perrone, M., Larsen, B., Ferrero, L., Sangiorgi, G., De Gennaro, G., Udisti, R., Zangrando, R., Gambaro, A., and Bolzacchini, E.: Sources of high PM2.5 concentrations in Milan, Northern Italy: molecular marker data and CMB modelling, Sci. Total Environ., 414, 343–355, https://doi.org/10.1016/j.scitotenv.2011.11.026, 2012.
Pietrogrande, M. C., Bacco, D., Visentin, M., Ferrari, S., and Casali, P.: Polar organic marker compounds in atmospheric aerosol in the Po Valley during the Supersito campaigns – Part 2: Seasonal variations of sugars, Atmos. Environ., 97, 215–225, https://doi.org/10.1016/j.atmosenv.2014.07.056, 2014.
Pöschl, U.: Atmospheric aerosols: composition, transformation, climate and health effects, Angew. Chem. Int. Edit., 44, 7520–7540, https://doi.org/10.1002/anie.200501122, 2005.
Puxbaum, H. and Tenze-Kunit, M.: Size distribution and seasonal variation of atmospheric cellulose, Atmos. Environ., 37, 3693–3699, https://doi.org/10.1016/S1352-2310(03)00451-5, 2003.
Rajput, P., Chauhan, A. S., and Gupta, T.: Bioaerosols over the indo-gangetic plain: influence of biomass burning emission and ambient meteorology, in: Environmental Contaminants: measurement, modelling and control, edited by: Gupta, T., Agarwal, A. K., Agarwal, R. A., and Labhsetwar, N. K., 93–121, Springer Singapore, Singapore, https://doi.org/10.1007/978-981-10-7332-8, 2018.
Reid, J. S., Koppmann, R., Eck, T. F., and Eleuterio, D. P.: A review of biomass burning emissions part II: intensive physical properties of biomass burning particles, Atmos. Chem. Phys., 5, 799–825, https://doi.org/10.5194/acp-5-799-2005, 2005.
Reisen, F., Meyer, C. M., and Keywood, M. D.: Impact of biomass burning sources on seasonal aerosol air quality, Atmos. Environ., 67, 437–447, https://doi.org/10.1016/j.atmosenv.2012.11.004, 2013.
Rogge, W. F., Medeiros, P. M., and Simoneit, B. R.: Organic marker compounds in surface soils of crop fields from the San Joaquin Valley fugitive dust characterization study, Atmos. Environ., 41, 8183–8204, https://doi.org/10.1016/j.atmosenv.2007.06.030, 2007.
Samaké, A., Jaffrezo, J.-L., Favez, O., Weber, S., Jacob, V., Canete, T., Albinet, A., Charron, A., Riffault, V., Perdrix, E., Waked, A., Golly, B., Salameh, D., Chevrier, F., Oliveira, D. M., Besombes, J.-L., Martins, J. M. F., Bonnaire, N., Conil, S., Guillaud, G., Mesbah, B., Rocq, B., Robic, P.-Y., Hulin, A., Le Meur, S., Descheemaecker, M., Chretien, E., Marchand, N., and Uzu, G.: Arabitol, mannitol, and glucose as tracers of primary biogenic organic aerosol: the influence of environmental factors on ambient air concentrations and spatial distribution over France, Atmos. Chem. Phys., 19, 11013–11030, https://doi.org/10.5194/acp-19-11013-2019, 2019.
Sang, X., Zhang, Z., Chan, C., and Engling, G.: Source categories and contribution of biomass smoke to organic aerosol over the southeastern Tibetan Plateau, Atmos. Environ., 78, 113–123, https://doi.org/10.1016/j.atmosenv.2012.12.012, 2013.
Sheesley, R. J., Schauer, J. J., Chowdhury, Z., Cass, G. R., and Simoneit, B. R.: Characterization of organic aerosols emitted from the combustion of biomass indigenous to South Asia, J. Geophys. Res., 108, 4285, https://doi.org/10.1029/2002jd002981, 2003.
Simoneit, B. R.: Biomass burning – a review of organic tracers for smoke from incomplete combustion, Appl. Geochem., 17, 129–162, https://doi.org/10.1016/S0883-2927(01)00061-0, 2002.
Simoneit, B. R. and Elias, V. O.: Detecting organic tracers from biomass burning in the atmosphere, Marine Pollut. Bull., 42, 805–810, https://doi.org/10.1016/S0025-326X(01)00094-7, 2001.
Simoneit, B. R., Schauer, J. J., Nolte, C., Oros, D. R., Elias, V. O., Fraser, M., Rogge, W., and Cass, G. R.: Levoglucosan, a tracer for cellulose in biomass burning and atmospheric particles, Atmos. Environ., 33, 173–182, https://doi.org/10.1016/S1352-2310(98)00145-9, 1999.
Simoneit, B. R., Elias, V. O., Kobayashi, M., Kawamura, K., Rushdi, A. I., Medeiros, P. M., Rogge, W. F., and Didyk, B. M.: Sugars dominant water-soluble organic compounds in soils and characterization as tracers in atmospheric particulate matter, Environ. Sci. Technol., 38, 5939–5949, https://doi.org/10.1021/es0403099, 2004.
Stone, D., Whalley, L. K., and Heard, D. E.: Tropospheric OH and HO2 radicals: field measurements and model comparisons, Chem. Soc. Rev., 41, 6348–6404, https://doi.org/10.1039/c2cs35140d, 2012.
Sullivan, A., Frank, N., Kenski, D., and Collett, J. L.: Application of high-performance anion-exchange chromatography–pulsed amperometric detection for measuring carbohydrates in routine daily filter samples collected by a national network: 2. Examination of sugar alcohols/polyols, sugars, and anhydrosugars in the upper Midwest, J. Geophys. Res., 116, D08302, https://doi.org/10.1029/2010JD014166, 2011.
Taylor, P. E., Flagan, R. C., Valenta, R., and Glovsky, M. M.: Release of allergens as respirable aerosols: A link between grass pollen and asthma, J. Allergy Clin. Immunol., 109, 51–56, https://doi.org/10.1067/mai.2002.120759, 2002.
Tobo, Y., Prenni, A. J., DeMott, P. J., Huffman, J. A., McCluskey, C. S., Tian, G., Pöhlker, C., Pöschl, U., and Kreidenweis, S. M.: Biological aerosol particles as a key determinant of ice nuclei populations in a forest ecosystem, J. Geophys. Res.-Atmos., 118, 10082–10099, https://doi.org/10.1002/jgrd.50790, 2013.
Tremblay, R. T., Riemer, D. D., and Zika, R. G.: Organic composition of PM2.5 and size-segregated aerosols and their sources during the 2002 Bay Regional Atmospheric Chemistry Experiment (BRACE), Florida, USA, Atmos. Environ., 41, 4323–4335, https://doi.org/10.1016/j.atmosenv.2006.11.061, 2007.
Verma, S. K., Kawamura, K., Chen, J., and Fu, P.: Thirteen years of observations on primary sugars and sugar alcohols over remote Chichijima Island in the western North Pacific, Atmos. Chem. Phys., 18, 81–101, https://doi.org/10.5194/acp-18-81-2018, 2018.
Vesprini, J. L., Nepi, M., Cresti, L., Guarnieri, M., and Pacini, E.: Changes in cytoplasmic carbohydrate content during Helleborus pollen presentation, Grana, 41, 16–20, https://doi.org/10.1080/00173130260045459, 2002.
Vicente, E. D., Vicente, A., Evtyugina, M., Carvalho, R., Tarelho, L. A., Oduber, F. I., and Alves, C.: Particulate and gaseous emissions from charcoal combustion in barbecue grills, Fuel Process. Technol., 176, 296–306, https://doi.org/10.1016/j.fuproc.2018.03.004, 2018.
Waked, A., Favez, O., Alleman, L. Y., Piot, C., Petit, J.-E., Delaunay, T., Verlinden, E., Golly, B., Besombes, J.-L., Jaffrezo, J.-L., and Leoz-Garziandia, E.: Source apportionment of PM10 in a north-western Europe regional urban background site (Lens, France) using positive matrix factorization and including primary biogenic emissions, Atmos. Chem. Phys., 14, 3325–3346, https://doi.org/10.5194/acp-14-3325-2014, 2014.
Wan, E. C. H. and Yu, J. Z.: Analysis of sugars and sugar polyols in atmospheric aerosols by chloride attachment in liquid chromatography/negative ion electrospray mass spectrometry, Environ. Sci. Technol., 41, 2459–2466, https://doi.org/10.1021/es062390g, 2007.
Wan, X., Kang, S., Rupakheti, M., Zhang, Q., Tripathee, L., Guo, J., Chen, P., Rupakheti, D., Panday, A. K., Lawrence, M. G., Kawamura, K., and Cong, Z.: Molecular characterization of organic aerosols in the Kathmandu Valley, Nepal: insights into primary and secondary sources, Atmos. Chem. Phys., 19, 2725–2747, https://doi.org/10.5194/acp-19-2725-2019, 2019.
Wang, G., Kawamura, K., Lee, S., Ho, K., and Cao, J. J.: Molecular, seasonal, and spatial distributions of organic aerosols from fourteen Chinese cities, Environ. Sci. Technol., 40, 4619–4625, https://doi.org/10.1021/es060291x, 2006.
Wang, G., Chen, C., Li, J., Zhou, B., Xie, M., Hu, S., Kawamura, K., and Chen, Y.: Molecular composition and size distribution of sugars, sugar-alcohols and carboxylic acids in airborne particles during a severe urban haze event caused by wheat straw burning, Atmos. Environ., 45, 2473–2479, https://doi.org/10.1016/j.atmosenv.2011.02.045, 2011.
Xu, J. X., Zhang, D. S., and Li, L. H.: Seasonal variations of airborne pollen in Beijing, China and their relationships with meteorological factors, Acta. Ecol. Sin., 32, 202–208, https://doi.org/10.1016/j.chnaes.2012.05.002, 2012.
Yan, C., Zheng, M., Sullivan, A. P., Bosch, C., Desyaterik, Y., Andersson, A., Li, X., Guo, X., and Zhou, T.: Chemical characteristics and light-absorbing property of water-soluble organic carbon in Beijing: Biomass burning contributions, Atmos. Environ., 121, 4–12, https://doi.org/10.1016/j.atmosenv.2015.05.005, 2015.
Yan, C., Zheng, M., Sullivan, A. P., Shen, G., Chen, Y., Wang, S., Zhao, B., Cai, S., Desyaterik, Y., Li, X., Zhou, T., Gustafsson, O., and Collett Jr., J. L.: Residential Coal Combustion as a Source of Levoglucosan in China, Environ. Sci. Technol., 52, 1665–1674, https://doi.org/10.1021/acs.est.7b05858, 2017.
Yang, F., Kawamura, K., Chen, J., Ho, K., Lee, S., Gao, Y., Cui, L., Wang, T., and Fu, P.: Anthropogenic and biogenic organic compounds in summertime fine aerosols (PM2.5) in Beijing, China, Atmos. Environ., 124, 166–175, https://doi.org/10.1016/j.atmosenv.2015.08.095, 2016.
Yang, Y., Chan, C. Y., Tao, J., Lin, M., Engling, G., Zhang, Z., Zhang, T., and Su, L.: Observation of elevated fungal tracers due to biomass burning in the Sichuan Basin at Chengdu City, China, Sci. Total Environ., 431, 68–77, https://doi.org/10.1016/j.scitotenv.2012.05.033, 2012.
Yttri, K. E., Dye, C., and Kiss, G.: Ambient aerosol concentrations of sugars and sugar-alcohols at four different sites in Norway, Atmos. Chem. Phys., 7, 4267–4279, https://doi.org/10.5194/acp-7-4267-2007, 2007.
Zhang, T., Claeys, M., Cachier, H., Dong, S., Wang, W., Maenhaut, W., and Liu, X.: Identification and estimation of the biomass burning contribution to Beijing aerosol using levoglucosan as a molecular marker, Atmos. Environ., 42, 7013–7021, https://doi.org/10.1016/j.atmosenv.2008.04.050, 2008.
Zhang, T., Engling, G., Chan, C. Y., Zhang, Y. N., Zhang, Z. S., Lin, M., Sang, X. F., Li, Y., and Li, Y. S.: Contribution of fungal spores to particulate matter in a tropical rainforest, Environ. Res. Lett., 5, 024010, https://doi.org/10.1088/1748-9326/5/2/024010,2010.
Zhang, Y. X., Min, S., Zhang, Y. H., Zeng, L. M., He, L. Y., Bin, Z., Wei, Y. J., and Zhu, X. L. : Source profiles of particulate organic matters emitted from cereal straw burnings, J. Environ. Sci., 19, 167–175, https://doi.org/10.1016/S1001-0742(07)60027-8, 2007.
Zhang, Y., Ren, H., Sun, Y., Cao, F., Chang, Y., Liu, S., Lee, X., Agrios, K., Kawamur, K., Liu, D., Ren, L., D, W., Wan, Z., Prévôt, A. S. H., Szida, S., and Fu, P. Q.: High Contribution of Nonfossil Sources to Submicrometer Organic Aerosols in Beijin, China, Environ. Sci. Technol., 5, 7842–7852, https://doi.org/10.1021/acs.est.7b01517, 2017.
Zheng, G. J., Duan, F. K., Su, H., Ma, Y. L., Cheng, Y., Zheng, B., Zhang, Q., Huang, T., Kimoto, T., Chang, D., Pöschl, U., Cheng, Y. F., and He, K. B.: Exploring the severe winter haze in Beijing: the impact of synoptic weather, regional transport and heterogeneous reactions, Atmos. Chem. Phys., 15, 2969–2983, https://doi.org/10.5194/acp-15-2969-2015, 2015.
Zhu, C., Kawamura, K., and Kunwar, B.: Effect of biomass burning over the western North Pacific Rim: wintertime maxima of anhydrosugars in ambient aerosols from Okinawa, Atmos. Chem. Phys., 15, 1959–1973, https://doi.org/10.5194/acp-15-1959-2015, 2015.