the Creative Commons Attribution 4.0 License.
the Creative Commons Attribution 4.0 License.
 | 18 Mar 2020
An optimized tracer-based approach for estimating organic carbon emissions from biomass burning in Ulaanbaatar, Mongolia
Jayant Nirmalkar
Tsatsral Batmunkh
Jinsang Jung
The impact of biomass burning (BB) on atmospheric particulate matter of <2.5 µm diameter (PM2.5) at Ulaanbaatar, Mongolia, was investigated using an optimized tracer-based approach during winter and spring 2017. Integrated 24 h PM2.5 samples were collected on quartz-fiber filters using a 30 L min−1 air sampler at an urban site in Ulaanbaatar. The aerosol samples were analyzed for organic carbon (OC) and elemental carbon (EC), anhydrosugars (levoglucosan, mannosan, and galactosan), and water-soluble ions. OC was found to be the predominant species, contributing 64 % and 56 % to the quantified aerosol components in PM2.5 in winter and spring, respectively. BB was identified as a major source of PM2.5, followed by dust and secondary aerosols. Levoglucosan ∕ mannosan and levoglucosan ∕ K+ ratios indicate that BB in Ulaanbaatar mainly originated from the burning of softwood. Because of the large uncertainty associated with the quantitative estimation of OC emitted from BB (OCBB), a novel approach was developed to optimize the OC ∕ levoglucosan ratio for estimating OCBB. The optimum OC ∕ levoglucosan ratio in Ulaanbaatar was obtained by regression analysis between OCnon-BB (OCtotal–OCBB) and levoglucosan concentrations that gives the lowest coefficient of determination (R2) and slope. The optimum OC ∕ levoglucosan ratio was found to be 27.6 and 18.0 for winter and spring, respectively, and these values were applied in quantifying OCBB. It was found that 68 % and 63 % of the OC were emitted from BB during winter and spring, respectively. This novel approach can also be applied by other researchers to quantify OCBB using their own chemical measurements. In addition to OCBB, sources of OCnon-BB were also investigated through multivariate correlation analysis. It was found that OCnon-BB originated mainly from coal burning, vehicles, and vegetative emissions.


Organic aerosol (OA) contributes a significant fraction (10 %–90 %) of atmospheric particulate matter (PM), which can affect human health and air quality (Jimenez et al., 2009; Maenhaut et al., 2011; Fu et al., 2012; Allan et al., 2014; Chen et al., 2018). An understanding of the sources of PM is highly relevant for air-quality remediation. Biomass burning (BB) is a major source of organic carbon (OC) in PM2.5 (PM with aerodynamic diameter ≤ 2.5 µm), and it may become more significant in the future as air-quality regulations restrict other anthropogenic emissions (Davy et al., 2011; Allan et al., 2014; Sullivan et al., 2019). Coal combustion, thermal power plants, and traffic emissions also make potential contributions to the OC content of PM (Watson et al., 2001a, b; Pei et al., 2016; Deshmukh et al., 2019; Haque et al., 2019), modifying PM characteristics such as hygroscopicity, light-attenuating properties, and health impacts (Jung et al., 2009; Sullivan et al., 2019). Previous studies have observed that the toxicity of PM2.5 increases with the oxidation potential of BB species because of the water-soluble fraction of OC (Verma et al., 2014).
Previous studies have identified and quantified OC emitted from BB (OCBB) using BB tracers (levoglucosan, mannosan, galactosan, and K+). Levoglucosan is produced from the pyrolysis of cellulose at temperatures of >300 ∘C (Simoneit et al., 1999; Claeys et al., 2010; Maenhaut et al., 2011; Nirmalkar et al., 2015; Achad et al., 2018), and two isomers of levoglucosan, mannosan and galactosan, are produced by the burning of hemicellulose (Reche et al., 2012). The atmospheric concentration of levoglucosan is higher than that of the two isomers because of the lower content of hemicellulose (20 %–30 %, dry weight) than cellulose (40 %–50 %) in softwood and hardwood (Reche et al., 2012; Sharma et al., 2015). Water-soluble K+ can also be used as a BB tracer (Pio et al., 2008; Cheng et al., 2013; Nirmalkar et al., 2015; Chen et al., 2018; Chantara et al., 2019). The proportion of these BB tracers in PM depends on various factors such as the type of biomass (softwood, hardwood, crop, grass, etc.), where it is burned (traditional stoves, fireplaces, field burning, burning in closed chambers, etc.), the type of burning (smoldering, flaming, etc.), and the burning season (Fu et al., 2012; Cheng et al., 2013; Jung et al., 2014). Levoglucosan ∕ mannosan, levoglucosan ∕ K+, and OC ∕ levoglucosan ratios were used to identify major biomass types and quantify OCBB (Reche et al., 2012; Cheng et al., 2013; Jung et al., 2014; Chen et al., 2018). However, OC ∕ levoglucosan ratios are quite variable even with the same type of BB because of variations in burning type, location, and season (Cheng et al., 2013; Thepnuan et al., 2019, and references therein). It is therefore essential to optimize the OC ∕ levoglucosan ratio to better estimate OCBB.
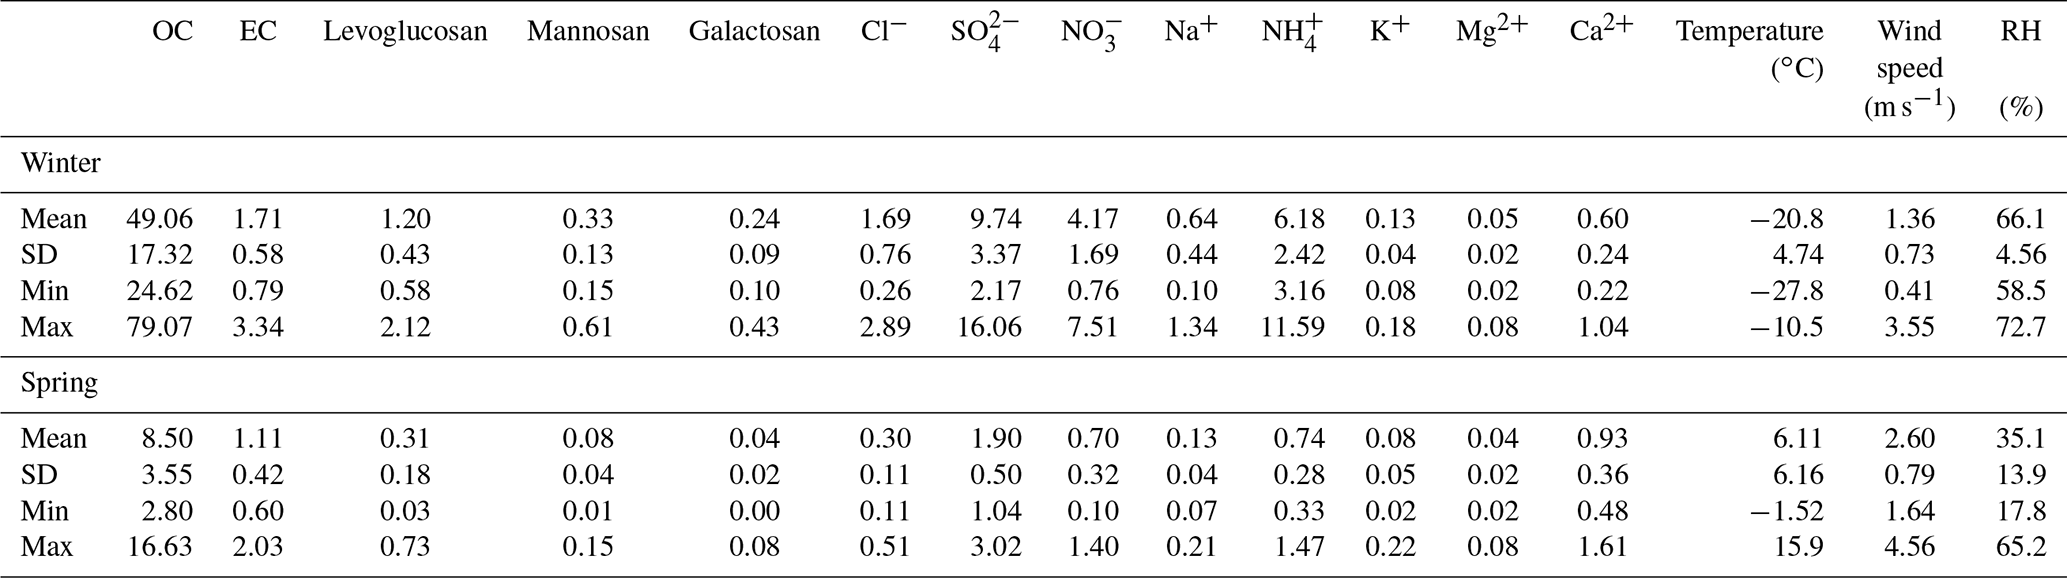
Ulaanbaatar, with a population of about 1 million, is an atmospheric pollution “hotspot” because of its topography, being situated in the Tuul River valley and surrounded by the Khentii Mountains, with a high elevation (1300–1949 m a.s.l. – above sea level) and large variations in temperature (−28 to +16 ∘C) and relative humidity (17.7 %–72.7 %; Table 1; Batmunkh et al., 2013; Jung et al., 2014). As the world's coldest capital city during winter, it requires additional fuel for space heating. The topography and low-temperature conditions cause an increase in PM concentrations, which are exacerbated by low wind speeds and atmospheric temperature inversions (Jung et al., 2010).
Table 1Concentrations (µg m−3) of organic carbon, elemental carbon, levoglucosan, mannosan, galactosan, and water-soluble ions in PM2.5 samples collected from Ulaanbaatar, Mongolia, during the winter (n=17) and spring (n=17) of 2017.
Half of the residents in Ulaanbaatar live in 160 000 gers (traditional Mongolian dwellings) (Guttikunda and Jawahar, 2014). Biomass is used as fuel for cooking and heating in many low-income gers in Ulaanbaatar. The common tree species in Mongolia are larch, pine, cedar, spruce, and birch; these are mostly softwood (http://www.fao.org/3/w8302e/w8302e05.htm; http://www.fao.org/3/a-am616e.pdf, last access: 17 December 2019). Each ger burns an average of 3 m3 of wood per year (Guttikunda, 2008; Zhamsueva et al., 2018). Organic carbon (OC) has severe effects on human health and global climate change (Sun et al., 2019). But there are very few estimates of OC emitted from biomass burning (OCBB) in Ulaanbaatar. Few studies have investigated the chemical characteristics of aerosol in Ulaanbaatar (Jung et al., 2010; Davy et al., 2011; Batmunkh et al., 2013), with none examining the contribution of OCBB and the type of biomass. Therefore, this study estimated the appropriate concentration of OCBB and identified the type of biomass at Ulaanbaatar, Mongolia.
In this study, we quantified the BB tracers levoglucosan, mannosan, galactosan, K+, and other chemical species. Potential sources of PM2.5 were identified by principal component analysis (PCA), with levoglucosan ∕ K+ and levoglucosan ∕ mannosan ratios being used to identify major biomass types. OCBB can be quantified from OC ∕ levoglucosan ratios and levoglucosan concentrations in PM. However, uncertainties of OCBB are high because OC ∕ levoglucosan ratios can vary depending on fuel type, burning conditions, and burning location (Duan et al., 2004; Cheng et al., 2013; Jung et al., 2014). Therefore, it is required to determine the most suitable OC ∕ levoglucosan ratio of BB emissions for estimating the appropriate concentration of OCBB. Here, for the first time, optimized OC ∕ levoglucosan ratios were investigated for estimating concentrations of OCBB during winter and spring. OCnon-BB sources were also investigated using multivariate correlation analysis with ions and elemental carbon (EC).
2.1 Sampling site and aerosol sampling
Aerosol sampling was carried out in Ulaanbaatar during the winter (17 January to 3 February) and spring (17 April to 4 May) of 2017, with 24 h periods commencing daily at 11:00 LT (local time). An aerosol sampler was installed on the rooftop of the National Agency for Meteorology and Environmental Monitoring station in Ulaanbaatar (47∘92′ N, 106∘90′ E, Fig. 1), 10 m a.g.l. (above ground level). The sampling site was located at 8–10 km from two coal-based thermal power plants to the west (Chung and Chon, 2014). PM2.5 samples were collected on 47 mm diameter quartz-fiber filters (Pall Life Sciences, USA) using an aerosol sampler (Murata Keisokuki Service, Japan) at a flow rate of 30 L min−1. A field blank filter was collected during winter (n=1) and spring (n=1). The quartz-fiber filter was loaded in the sampler for 5 min without operating a pump. The concentration of all chemical analytes has been corrected using the blank filter concentration. Sampled filters were wrapped in aluminum foil and heated at 550 ∘C for 12 h to remove adsorbed impurities before use and stored at −20 ∘C before and after sampling.
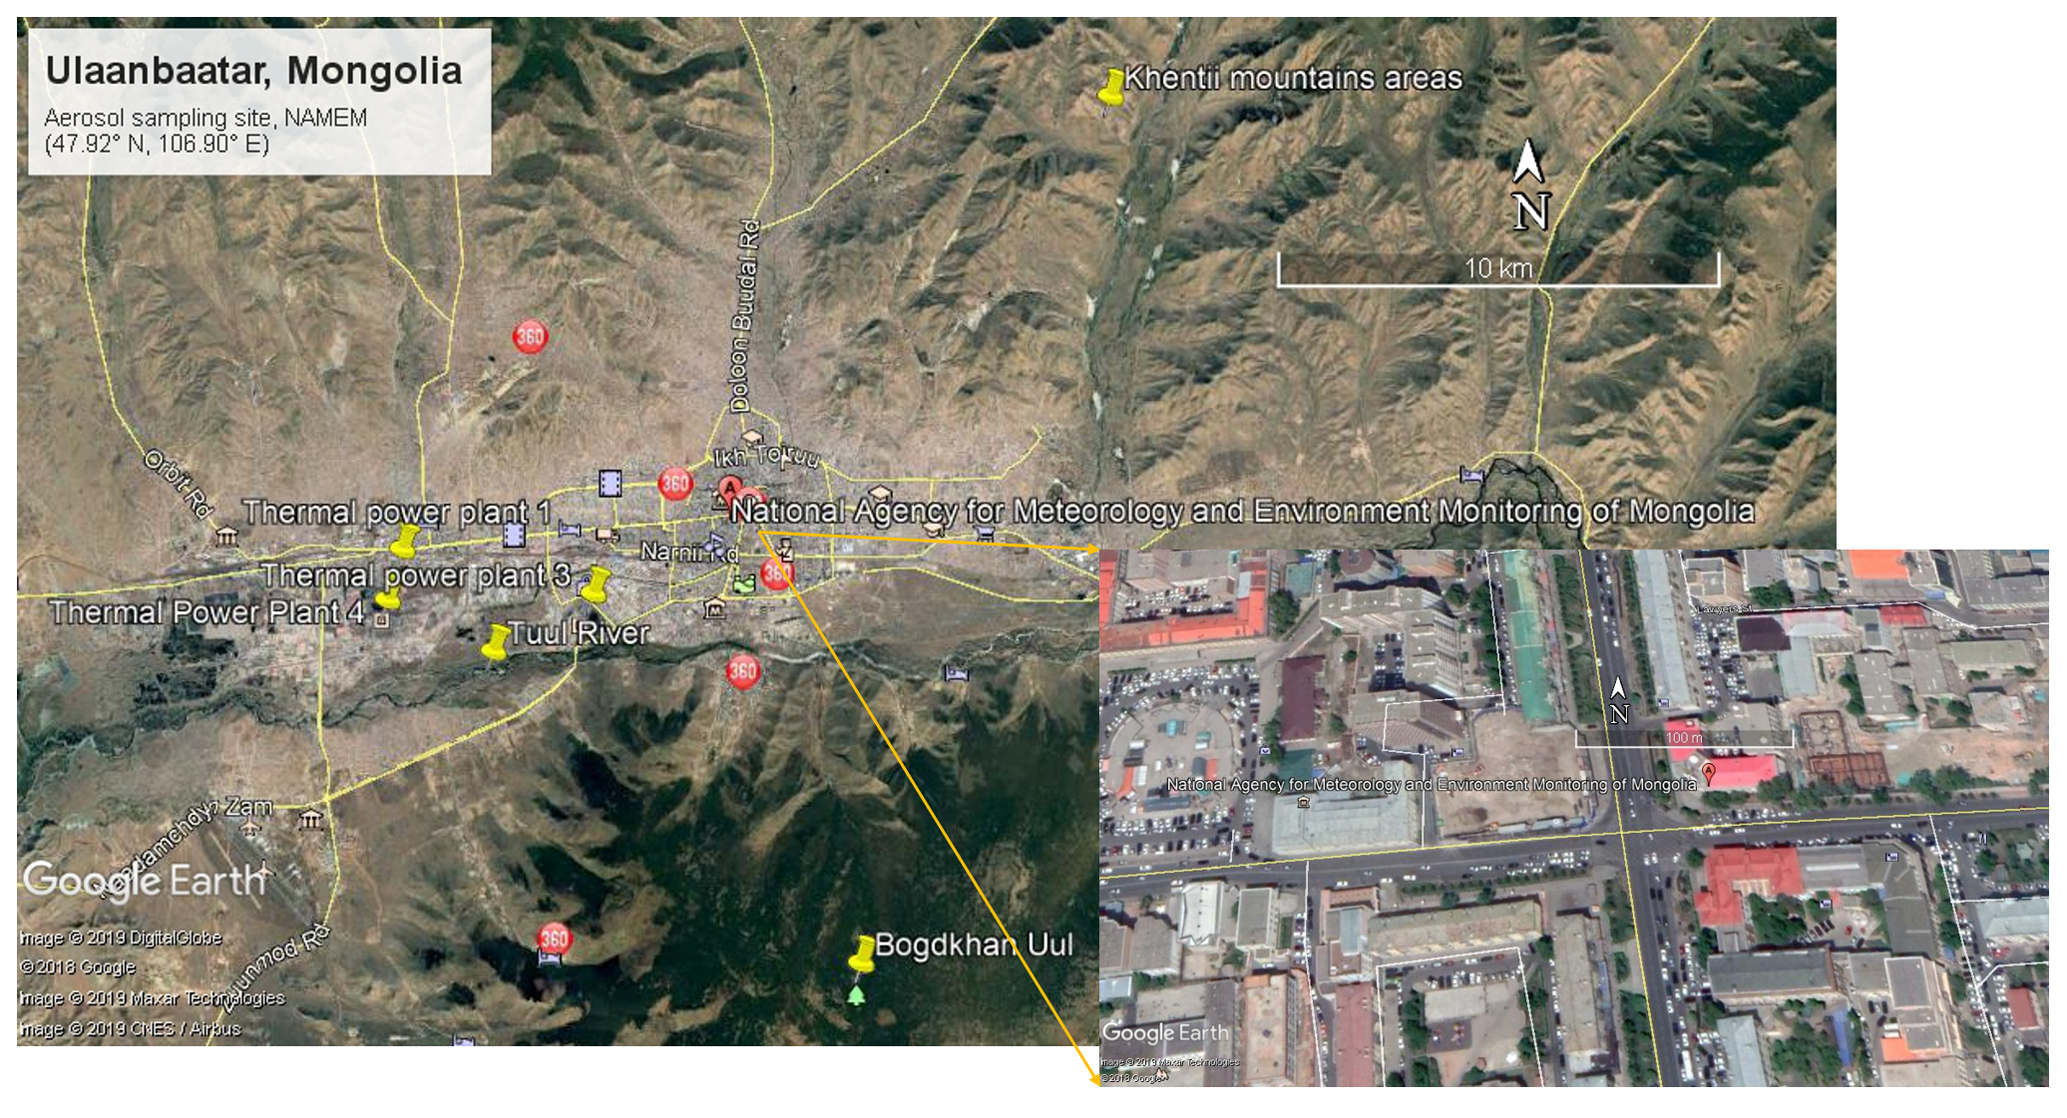
Figure 1Sampling site in Ulaanbaatar, Mongolia (https://awww.google.com/earth/versions/#earth-pro, last access: 11 July 2019, © Google Earth).
2.2 Filter analysis
One-fourth of each quartz-fiber filter sample was extracted in 10 mL of ultrapure water (resistivity 18.2 M, total OC content < 1 ppb) under ultrasonication for 30 min. The water extract was then filtered using a syringe filter (Millipore, Millex-GV, 0.45 µm) and stored at 4 ∘C pending analysis. Water-soluble cations (K+, Na+, Ca2+, Mg2+, and ) were quantified by an ion chromatograph (Dionex ICS 5000, Thermo Fisher Scientific, USA). Water-soluble cations were separated using an IonPac CS-12A column (Thermo Fisher Scientific, USA) with 20 mM of methanesulfonic acid as an eluent at a flow rate of 1.0 mL min−1. Water-soluble anions (Cl−, , and ) were separated using an IonPac AS-15 column (Thermo Fisher Scientific, USA) with 40 mM of KOH as an eluent at a flow rate of 1.2 mL min−1. The detection limits for major inorganic ions based on 3σ of blanks were 0.01, 0.01, and 0.03 µg m−3 for , , and , respectively.
Levoglucosan, mannosan, and galactosan were measured by a high-performance anion-exchange chromatograph (Dionex, ICS-5000, Thermo Fisher Scientific, USA) with pulsed amperometric detection involving an electrochemical detector with a gold working electrode. Details of the method are given elsewhere (Jung et al., 2014). In brief, separation involved a CarboPak MA1 (4×250 mm, Thermo Fisher Scientific, USA) analytical column and NaOH eluent (360 mM, 0.4 mL min−1). Limits of detection were 3.0, 0.7, and 1.0 ng m−3 for levoglucosan, mannosan, and galactosan, respectively.
Aerosol samples were analyzed for OC and EC using a thermal optical OC–EC analyzer (Sunset Laboratory Inc. Forest Grove, OR, USA) with laser-transmittance-based correction of pyrolysis. Details of the analyzer and quality-control parameters are reported elsewhere (Jung et al., 2014). In brief, 1.5 cm2 punch samples of the quartz-fiber filter were placed in a quartz dish inside the thermal desorption oven of the analyzer. OC and EC were quantified using a temperature program developed by the US National Institute for Occupational Safety and Health (NIOSH) in an inert atmosphere (100% He) and in an oxidizing atmosphere (98 % He + 2 % O2), respectively. Detection limits of OC and EC were 0.04 and 0.01 µg C m−3, and their analytical uncertainties were 1.3 % and 3.7 %, respectively.
2.3 Conditional probability function
The conditional probability function (CPF) calculates the probability that a source is located within a particular wind direction sector, ΔΘ:
where nΔΘ is the number of times that the wind passed through direction sector ΔΘ, and mΔΘ is the number of times that the source contribution peaked while the wind passed through sector ΔΘ (Ashbaugh et al., 1985). To use CPF with the Ulaanbaatar data, the 24 h averaged source contribution data have been applied to all 1 h wind direction averages recorded at the site for each date. The angular interval ΔΘ was set at 10∘. To calculate mΔΘ, the 75th percentiles of source contribution concentrations were counted. CPF is useful in determining the direction of a source from a receptor site; however, it cannot determine the actual location of the source.
2.4 Principal component analysis
In order to identify the source groupings of chemical species in PM2.5, principal component analysis (PCA) was applied. PCA is done using a commercially available software package (SPSS, version 10.0). PCA applies projection dimension reduction methods, converting several concentration sets into significant sets of columns (principal components, PCs) without damaging the original data. PCA is a widely used statistical technique to quantitatively identify a small number of independent factors among the species concentrations, which can explain the variance of the data, by using the eigenvector decomposition of a matrix of pair-wise correlations. PCA with varimax rotation and the retention of principal components having eigenvalues > 1.0 was used to identify major species associated with different sources. It was widely used for the identification of pollution sources in the atmosphere (Fang et al., 2003; Nirmalkar et al., 2015).
3.1 Chemical characteristics of PM2.5 and source identification
Mass concentrations of carbonaceous aerosol, BB tracers, and water-soluble ions in PM2.5 samples collected at Ulaanbaatar during winter and spring of 2017 are summarized in Table 1. OC contributed 64±5.1 % and 56±6.0 % of the quantified aerosol components in PM2.5 in winter and spring, respectively (Table 1). Average concentrations of OC during winter were 5 times those obtained in spring (Fig. 2). Previously, OC has been observed as a major component in PM2.5 in Ulaanbaatar during the winter period (Jung et al., 2010; Batmunkh et al., 2013). This may be attributed to additional BB emissions for home heating and temperature inversions with low wind speeds (average wind speed of 1.43±0.73 m s−1; Table 1 and Fig. 3a). OC concentrations decreased with increasing wind speed during winter (Fig. 3a) and spring (Fig. 3b) over all air temperature ranges. The inverse relationship between OC and wind speed during winter (Fig. 3a) and spring (Fig. 3b) suggests a predominance of local sources, with higher wind speeds flushing air pollutants out of the area, whereas low wind speeds allow them to accumulate (Khan et al., 2010; Wang et al., 2018).

Figure 2Daily variations in atmospheric concentrations (µg m−3) of chemical species in Ulaanbaatar during winter (a) and spring (b) of 2017.

Figure 3Daily atmospheric concentrations of OC (µg C m−3) as a function of wind speed (m s−1) and temperature (∘C) during winter (a) and spring (b) of 2017.
The average concentration of EC during winter (1.71±0.58 µg m−3) was higher than that in spring (1.11±0.42 µg m−3) (Table 1), consistent with general urban observations in cities in China (Ji et al., 2016) and India (Panda et al., 2016). During both winter and spring, EC concentrations at the study site were lower and had different trends compared to those observed in a suburban site (2.3±1.0 and 3.1±1.5 µg m−3, respectively) and an urban site (2.3±1.0 and 3.3±1.2 µg m−3, respectively) in Shanghai, China (Feng et al., 2009).
The potential source direction of EC during winter and spring was west as shown in Fig. 5; this can be explained by the influence of emissions from thermal power plants. The correlation of EC was strong with Ca2+ during spring as shown in Fig. 4. CPF analysis suggested that the potential source direction of EC and Ca2+ was similar (Fig. 5). High abundances of Ca2+ and EC are observed from stack emissions of coal-fired thermal power plants (Pei et al., 2016; Zhang et al., 2015). Thus, EC and Ca2+ in Ulaanbaatar might be strongly related to emissions from thermal power plants.
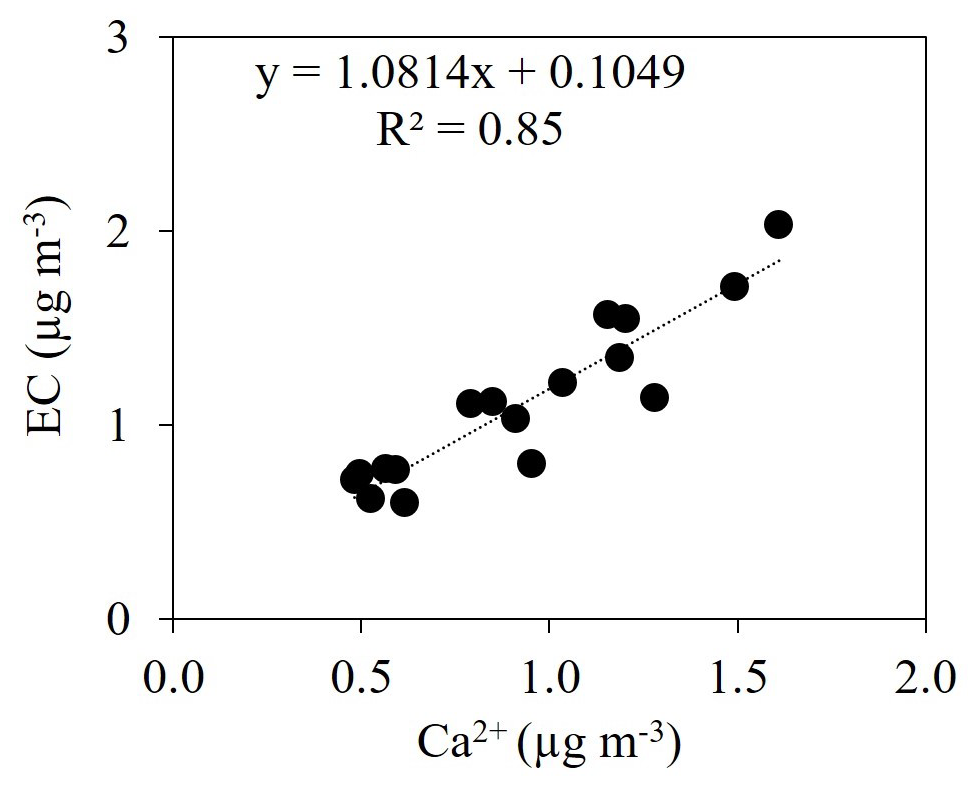
Figure 4Relationship between PM2.5 concentrations of Ca2+ and EC (µg m−3) during spring of 2017.
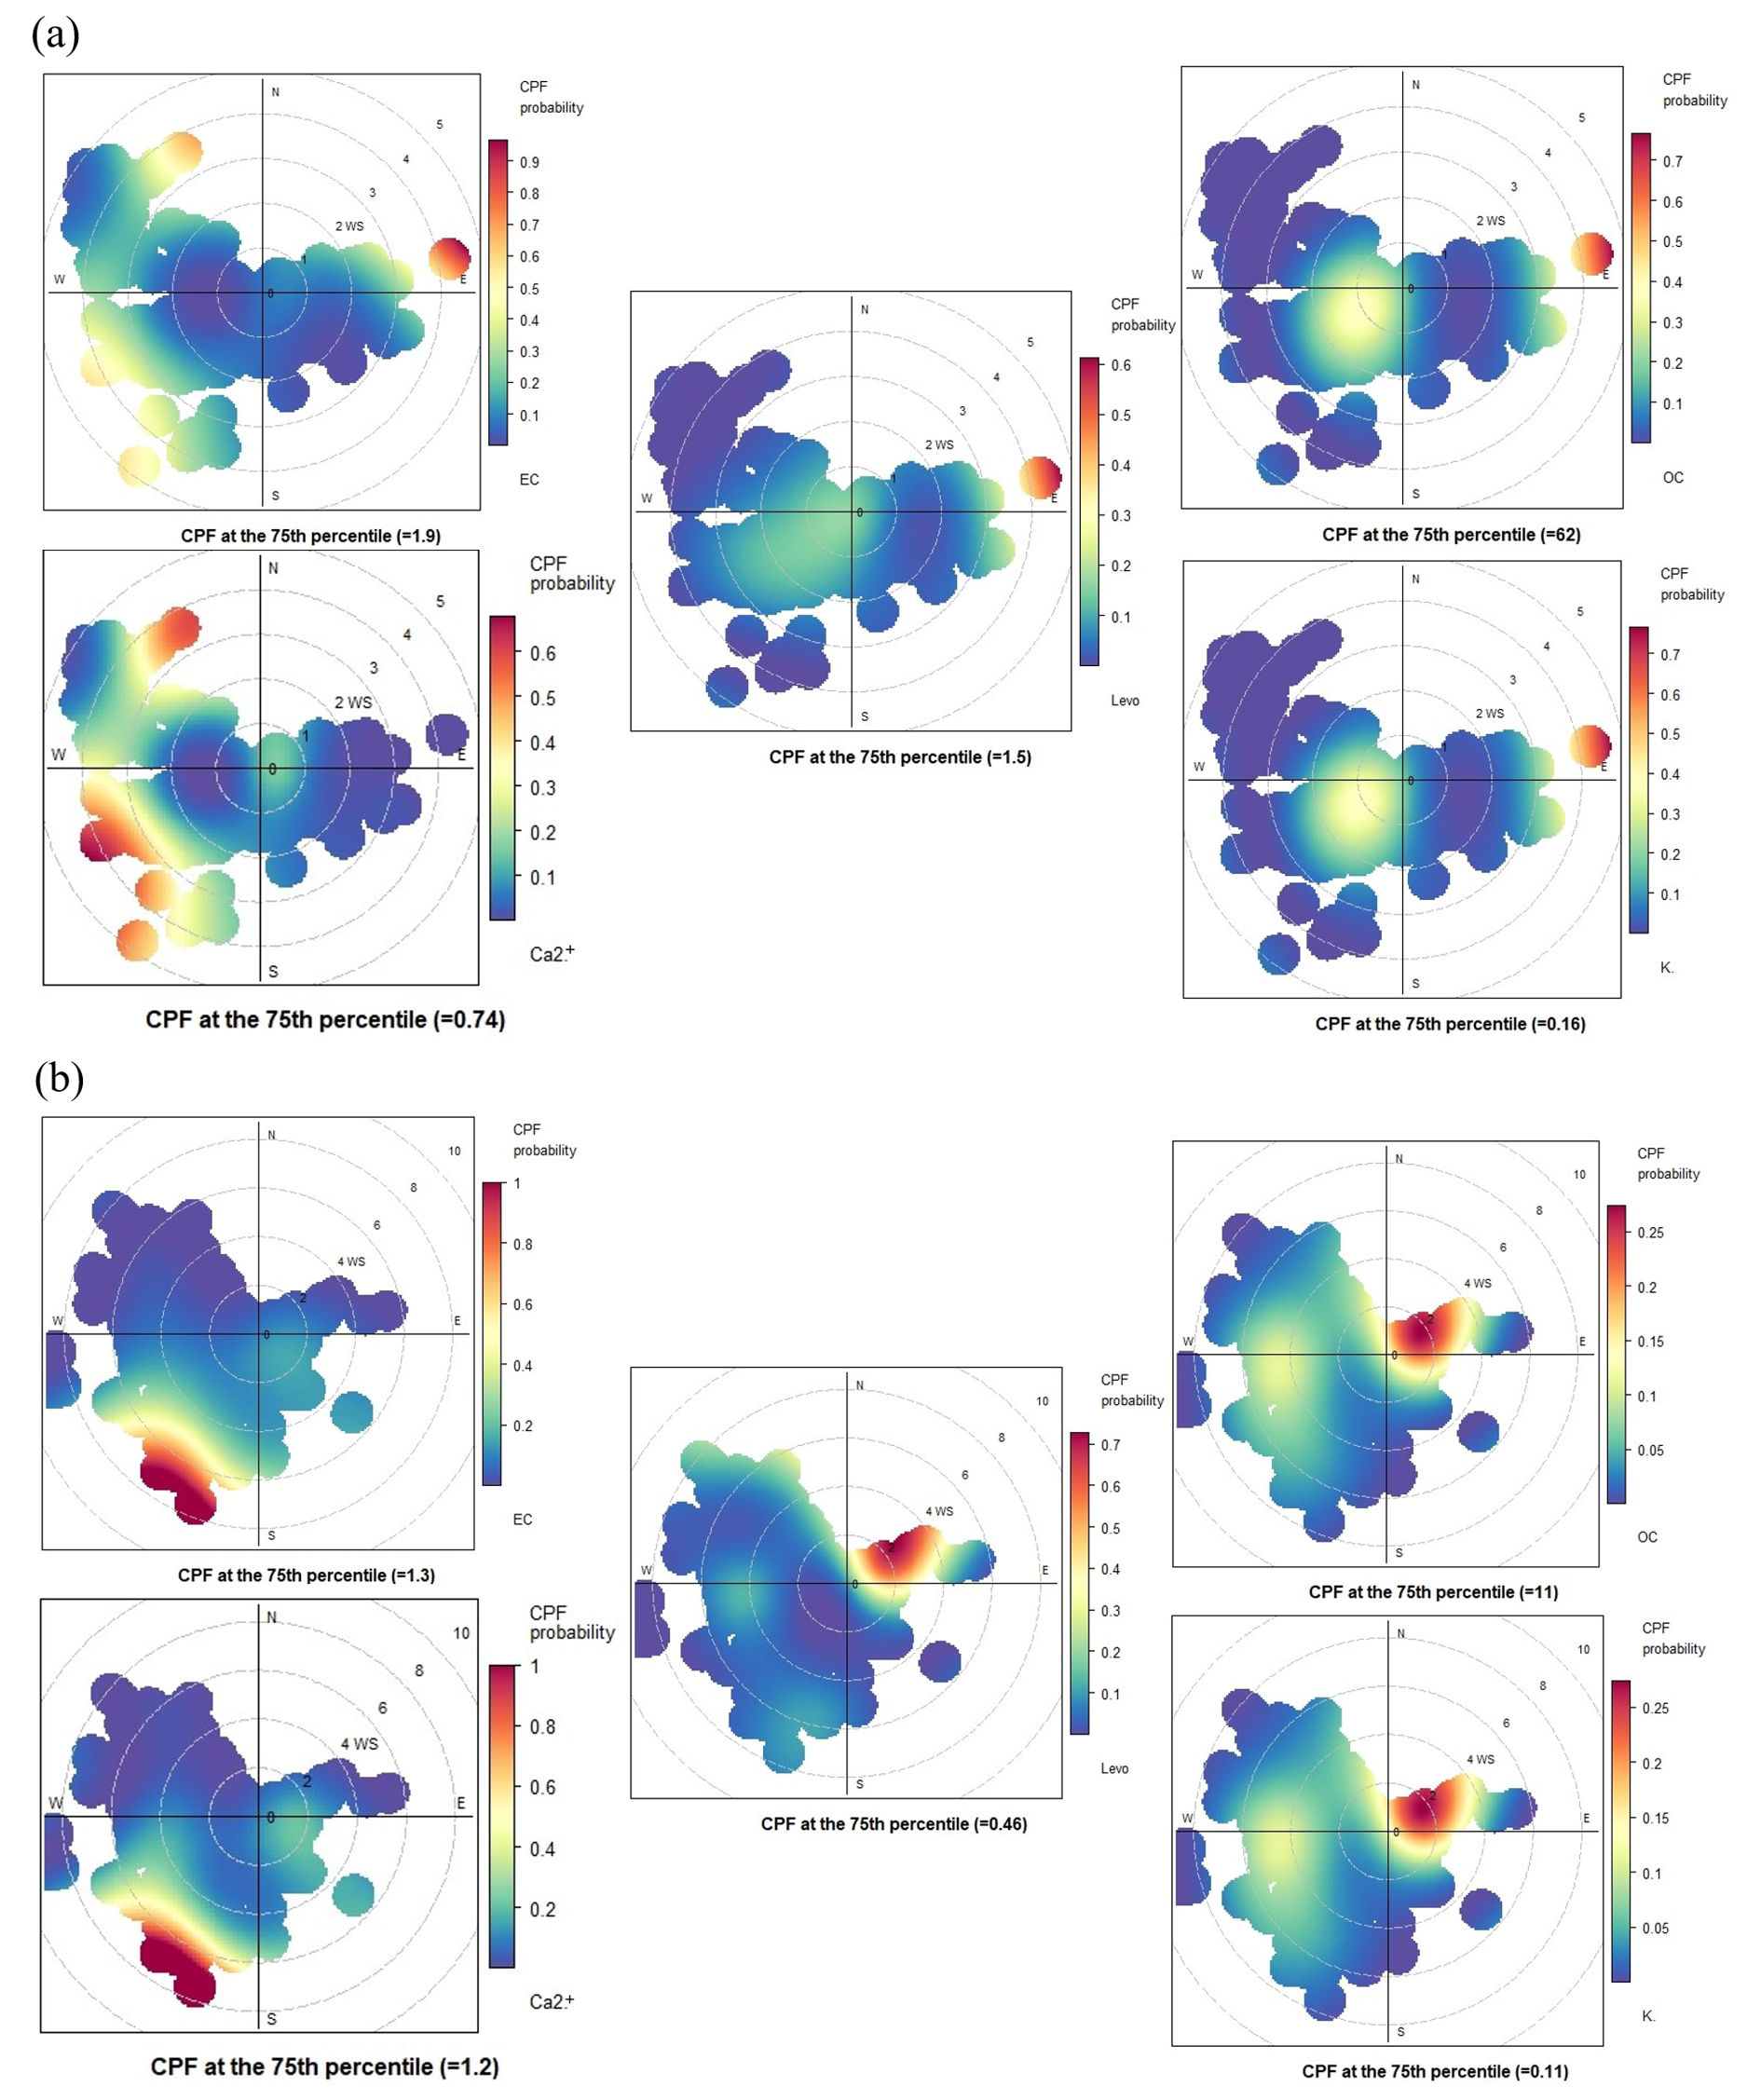
Figure 5Conditional probability function (CPF) of levoglucosan (levo), OC, K+, EC, and Ca2+ during winter (a) and spring (b) of 2017.
Daily concentrations of levoglucosan, mannosan, and galactosan have similar trends during winter and spring (Fig. 2), possibly because of the combustion of similar biomass fuels in both seasons. Changes in the concentrations of these BB tracers might be attributed to changes in the relative proportions of cellulose and hemicellulose in different biomass fuels (Zhu et al., 2015; Nirmalkar et al., 2015). Concentrations of anhydrosugars were 4 times higher in winter than in spring (Table 1) due to increased heating requirements in winter. The higher relative humidity (58.5 %–72.7 %) and lower temperature (−10.5 to −27.8 ∘C; Table 1) in winter can also contribute to longer atmospheric residence times due to increased levoglucosan stability (Lai et al., 2014). Higher concentrations of BB tracers in winter than spring have previously been observed in Beijing, China (Liang et al., 2016), and were attributed to meteorological conditions similar to those in Ulaanbaatar. Further, it was observed that during winter the ambient temperature was consistently low (less than −10 ∘C; Fig. 3a) in Ulaanbaatar; therefore, residential biomass burning occurred continuously for space heating. Thus, there would be no dependence of emission rates of levoglucosan and mannosan on ambient temperature during the sampling period. The concentration of levoglucosan and mannosan may be influenced by local wind speed, as shown in Fig. 3a, rather than ambient temperature. The average K+ concentration (0.08±0.05 µg m−3) in this study is significantly lower than the K (0.32 µg m−3) observed in Ulaanbaatar during 2004–2008 (Davy et al., 2011).
Among water-soluble ions, (9.7±3.4 µg m−3) was the most dominant PM2.5 species during winter, followed by (6.2±2.4 µg m−3) and (4.2±1.7 µg m−3), whereas (1.9±0.5 µg m−3) was the dominant species during spring, followed by Ca2+ (0.9±0.4 µg m−3) and (0.7±0.3 µg m−3). The total + + content accounted for 27 % and 23 % of the total measured chemical species during winter and spring, respectively (Fig. 2 and Table 1). is the most prevalent water-soluble ion in PM2.5 in Wuhan, Guangzhou, and Tianjin (China) due to industrial emissions and coal burning (Gu et al., 2011; Tao et al., 2014; Huang et al., 2016; Pei et al., 2016). This suggests that the higher concentration in Ulaanbaatar may be attributable to emissions from the three major coal-fired thermal power plants near the study site.
The atmospheric concentrations of OC (11–17 µg m−3) and levoglucosan (0.46–0.73 µg m−3) were higher for samples collected during 27–30 April 2017 than on almost all remaining days in spring (Fig. 2b). Backward atmospheric trajectories based on the Hybrid Single-Particle Lagrangian Integrated Trajectory (HYSPLIT) model provided by the US National Oceanic and Atmospheric Administration (NOAA) Air Resources Laboratory (ARL) indicate that during those days, air masses originated from a region where a significant number of fires were detected (US Fire Information for Resource Management System – FIRMS; National Aeronautics and Space Administration – NASA; Fig. 6a and b). Thus, the elevated OC and levoglucosan concentrations during 27–30 April might be influenced by the long-range transport of BB from north of Mongolia.
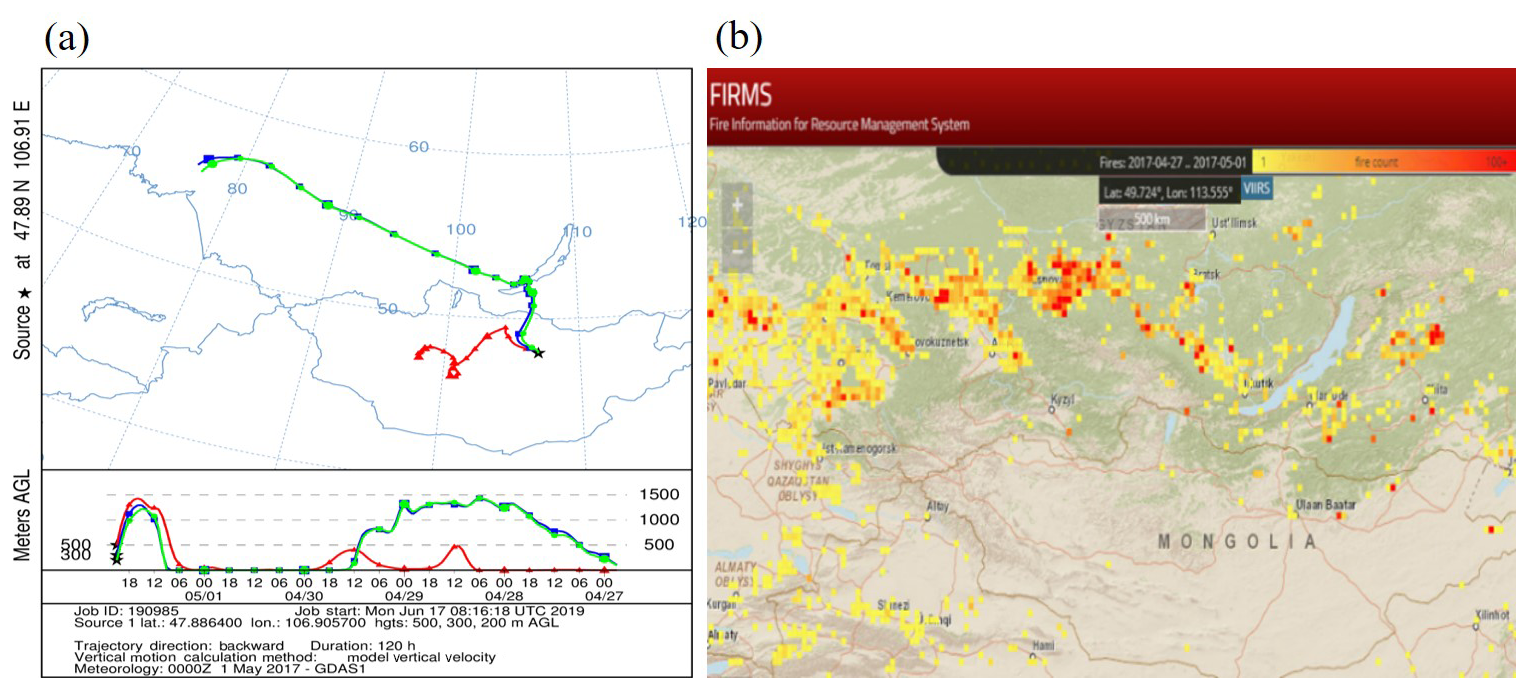
Figure 6(a) The 5-day backward air-mass trajectories (https://ready.arl.noaa.gov/HYSPLIT.php, last access: 17 August 2019) and (b) FIRMS fire counts (https://firms.modaps.eosdis.nasa.gov/alerts/, last access: 17 August 2019) around Ulaanbaatar during spring of 2017.
3.2 Principal component analysis
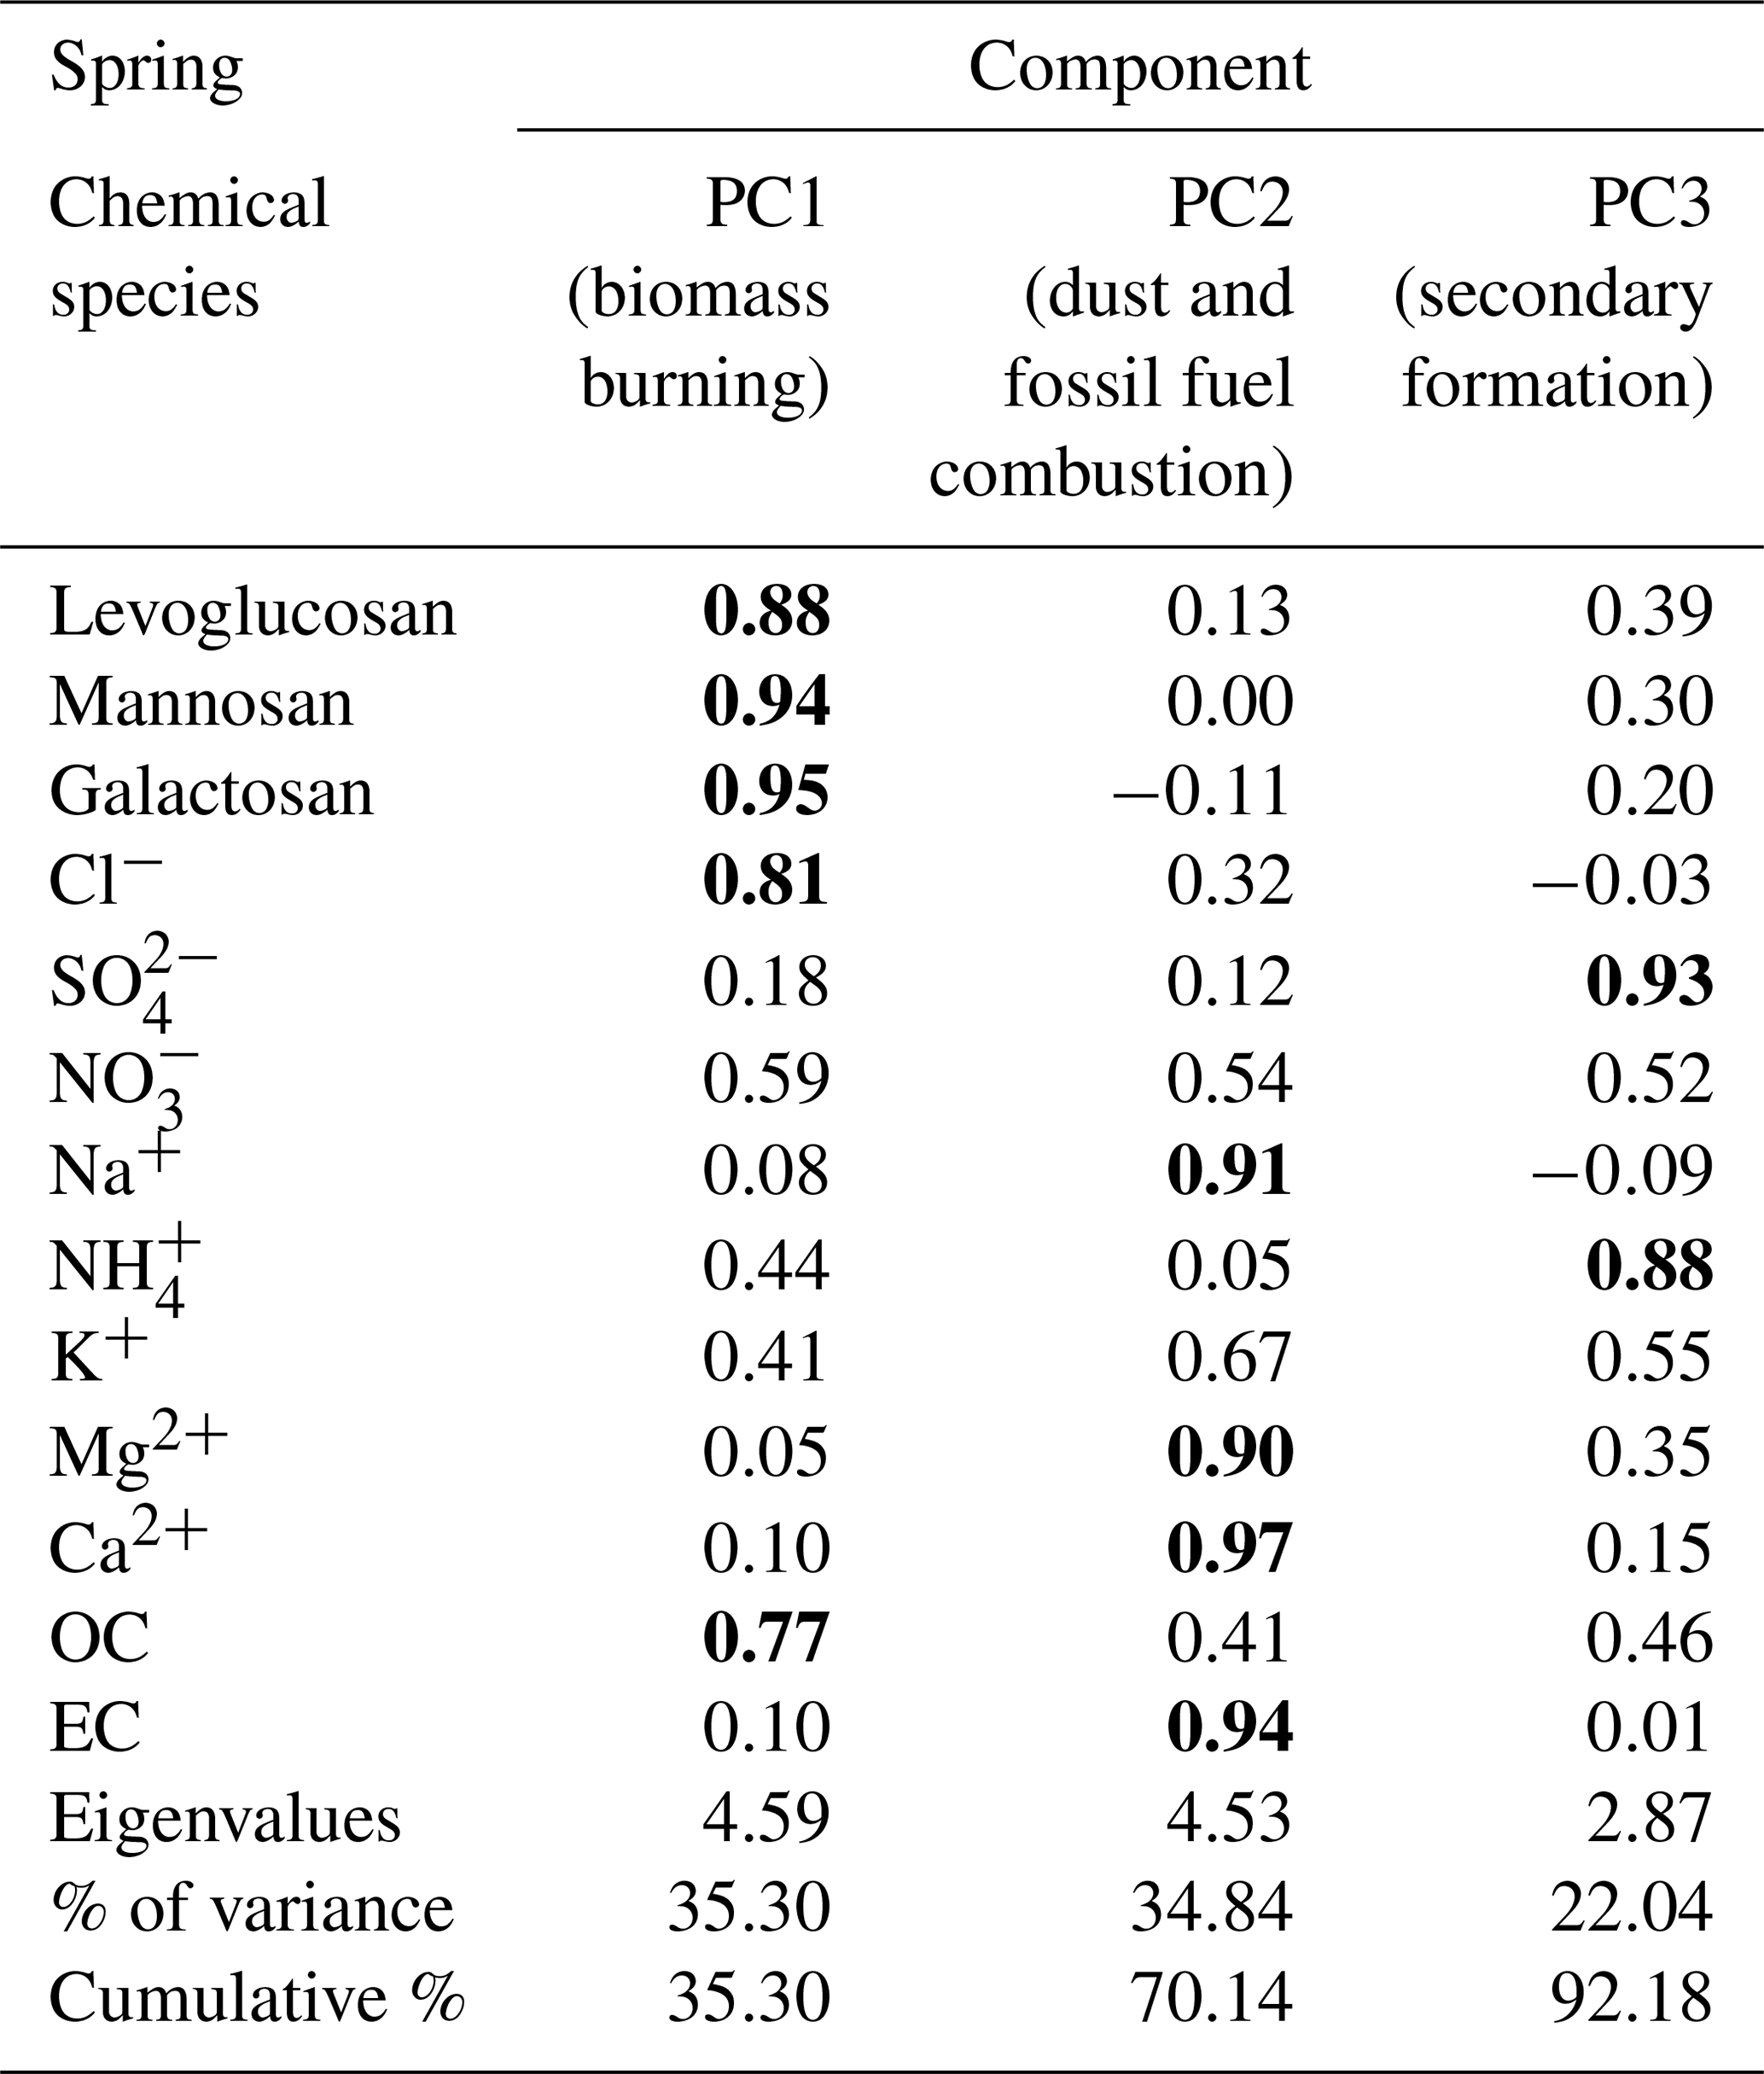
Principal component analysis (PCA) is a useful tool for reducing the dimensionality of large aerosol datasets to principal components using varimax rotation for source identification (Cao et al., 2005; Lin et al., 2018; Nirmalkar et al., 2019). Four principal components (PCs) in winter and three in spring were identified with eigenvalues > 1 after varimax rotation, explaining 96 % and 92 %, respectively, of the total variance (Tables 2 and 3). The PCs were categorized on the basis of the loadings of chemical components as follows. In winter, PC1 includes BB characterized by high loadings of levoglucosan, mannosan, and galactosan; PC2 includes dust characterized by Ca2+ and Mg2+ content; PC3 includes secondary formation characterized by , , and content; and PC4 includes fossil fuel combustion characterized by EC. In spring, PC1 includes BB (levoglucosan, mannosan, and galactosan); PC2 includes dust (Ca2+ and Mg2+) and fossil fuel combustion (EC); and PC3 includes secondary formation (, , and ). The PCA results show that the chemical components of PM2.5 in Ulaanbaatar were mainly affected by BB during winter and spring. Further, OC was primarily influenced by BB because it correlated well with the total variance of PC1 during winter (0.82; Table 2) and spring (0.77; Table 3).
Table 2Source identification of chemical species using principal component (PC) analysis and varimax rotation at Ulaanbaatar, Mongolia, during the winter of 2017. Bold values show high loadings of chemical species.
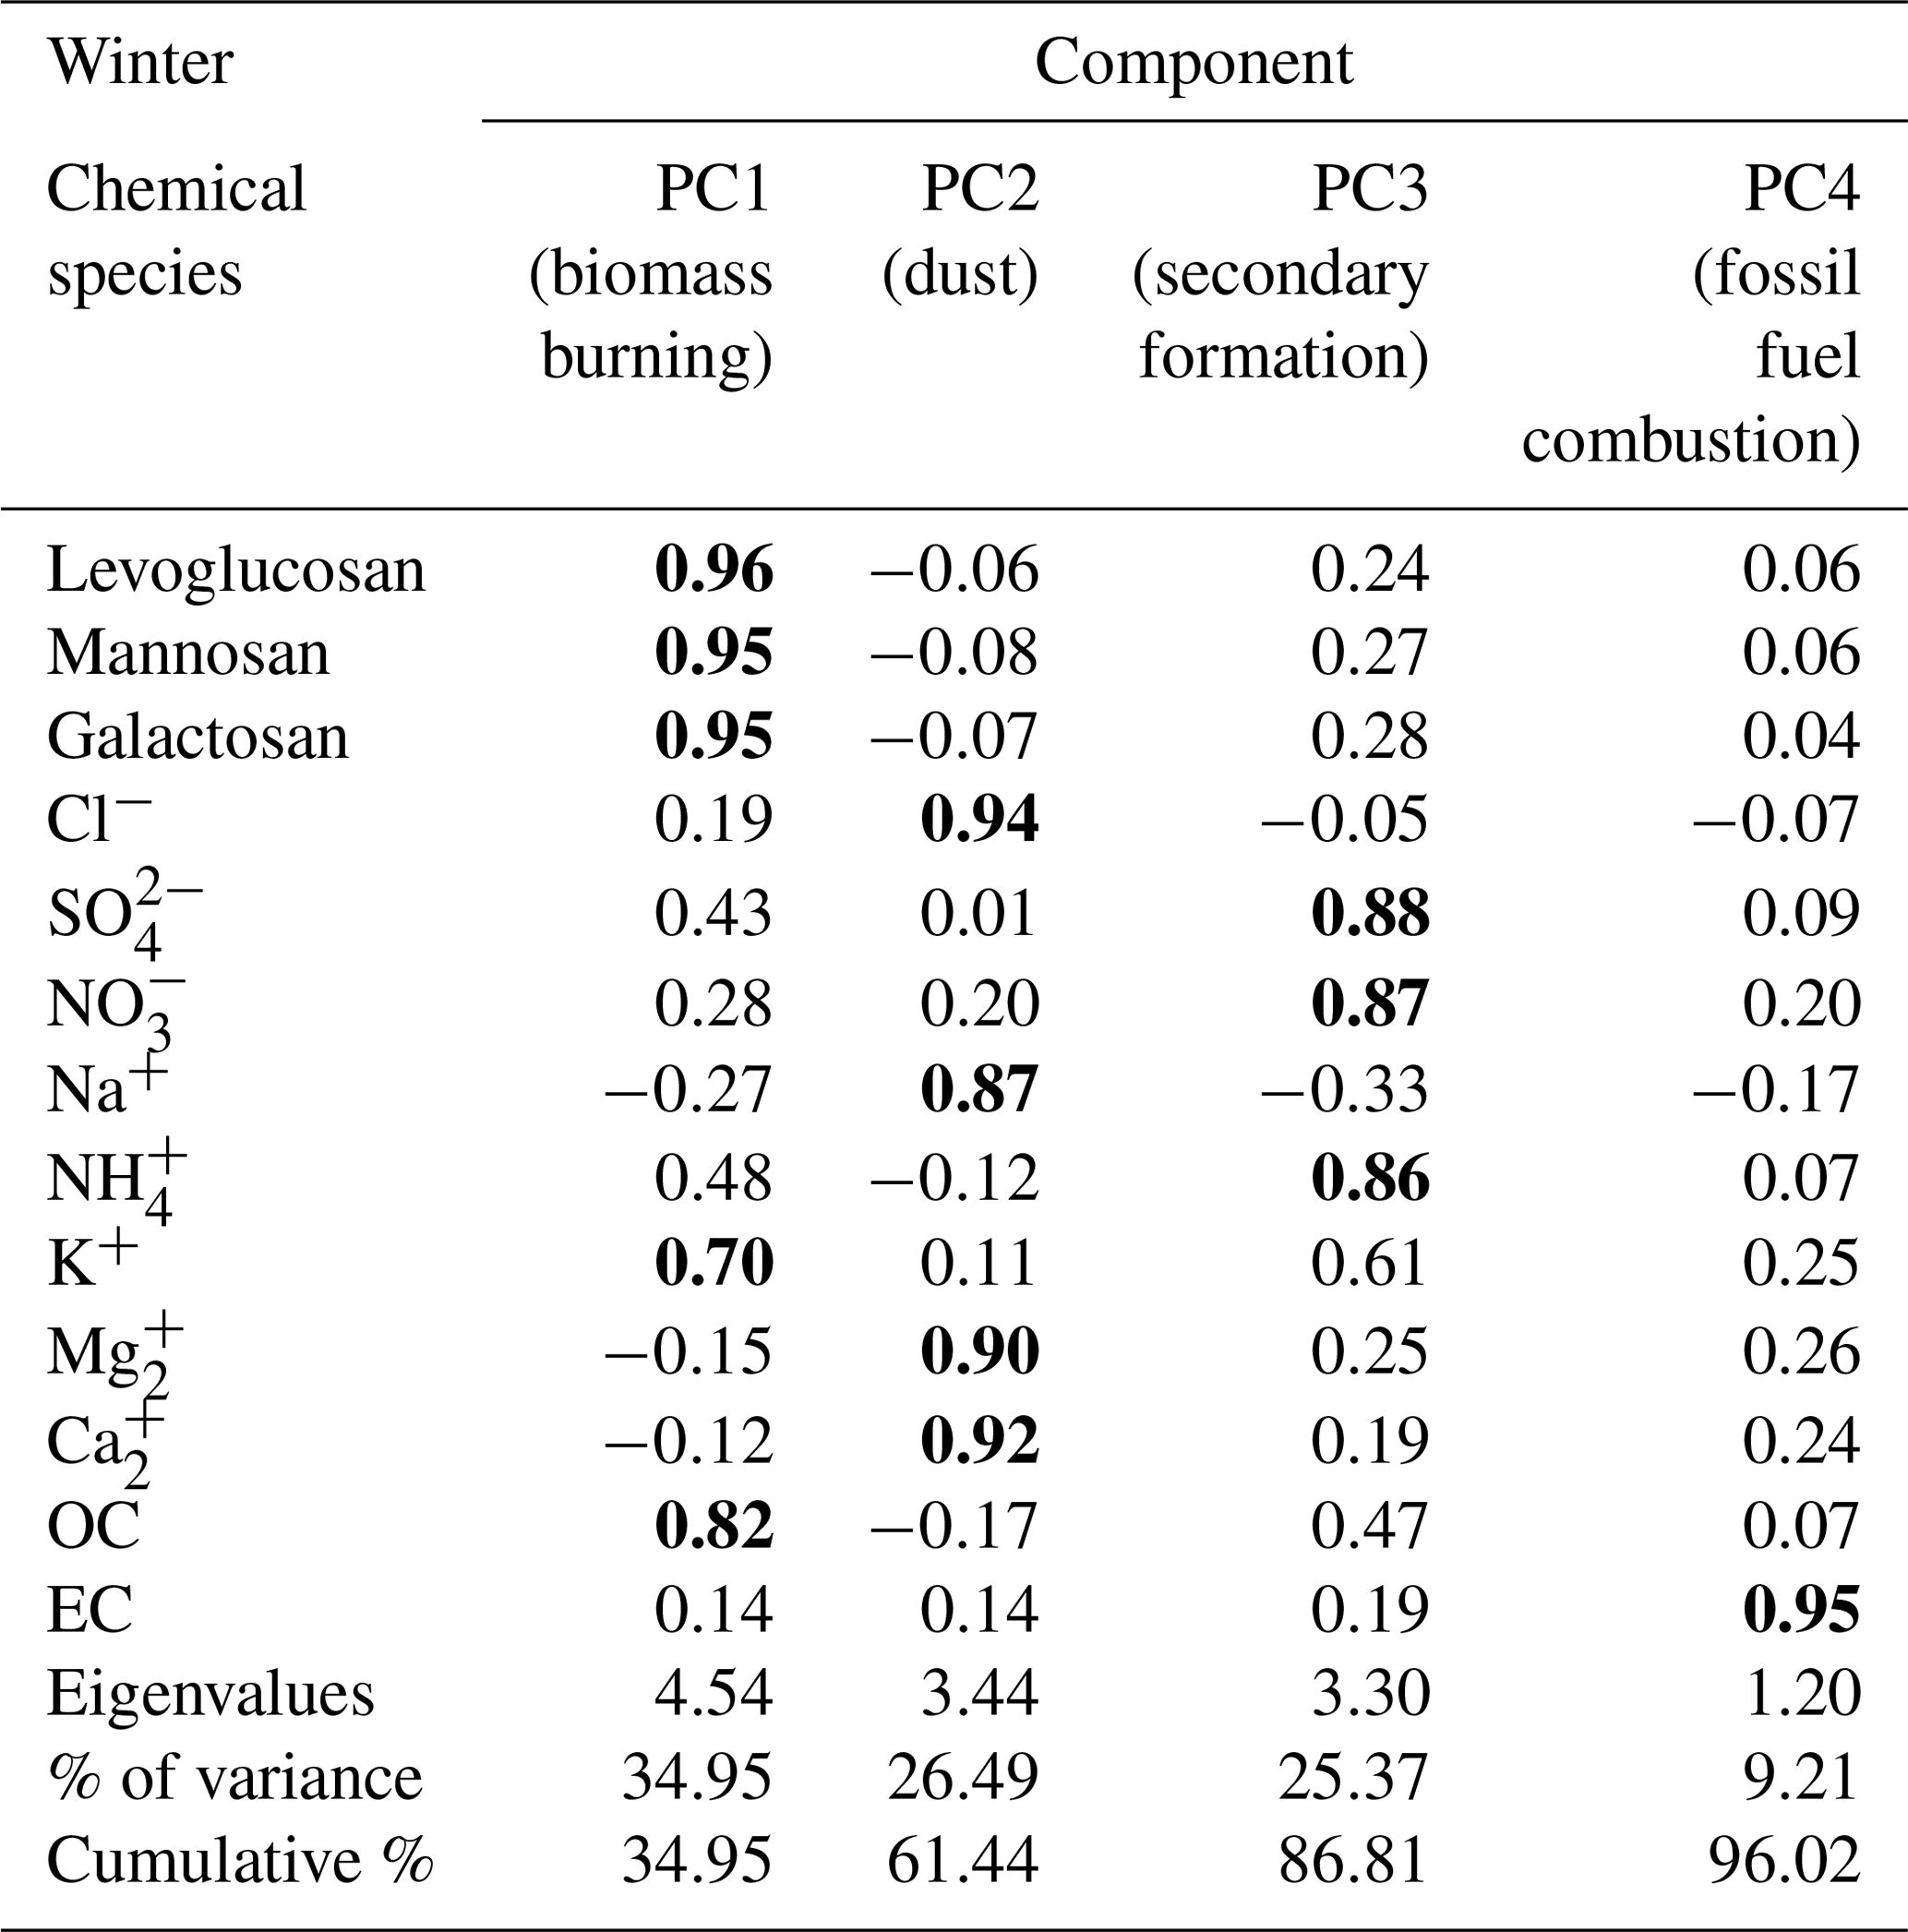
Table 3Source identification of chemical species using PCA and varimax rotation at Ulaanbaatar, Mongolia, during the spring of 2017. Bold values show high loadings of chemical species.
3.3 Relationship among BB tracers
The correlations among the three BB tracers levoglucosan, mannosan, and galactosan are shown in Fig. 7a (winter) and Fig. 7b (spring). The correlations between levoglucosan and mannosan and between levoglucosan and galactosan are strong during winter (R2=0.99 for both pairs) and spring (R2=0.95 and 0.83, respectively; Fig. 7a and b). Concentrations of levoglucosan and OC are strongly correlated during both winter (R2=0.78) and spring (R2=0.86; Fig. 8a), suggesting that a major fraction of OC might originate from BB in Ulaanbaatar. The similar strong correlation and steep slope observed in OC–levoglucosan plots for PM collected in Chiang Mai Province (Thailand) and Daejeon (Korea) were attributed mainly to BB (Jung et al., 2014; Thepnuan et al., 2019).
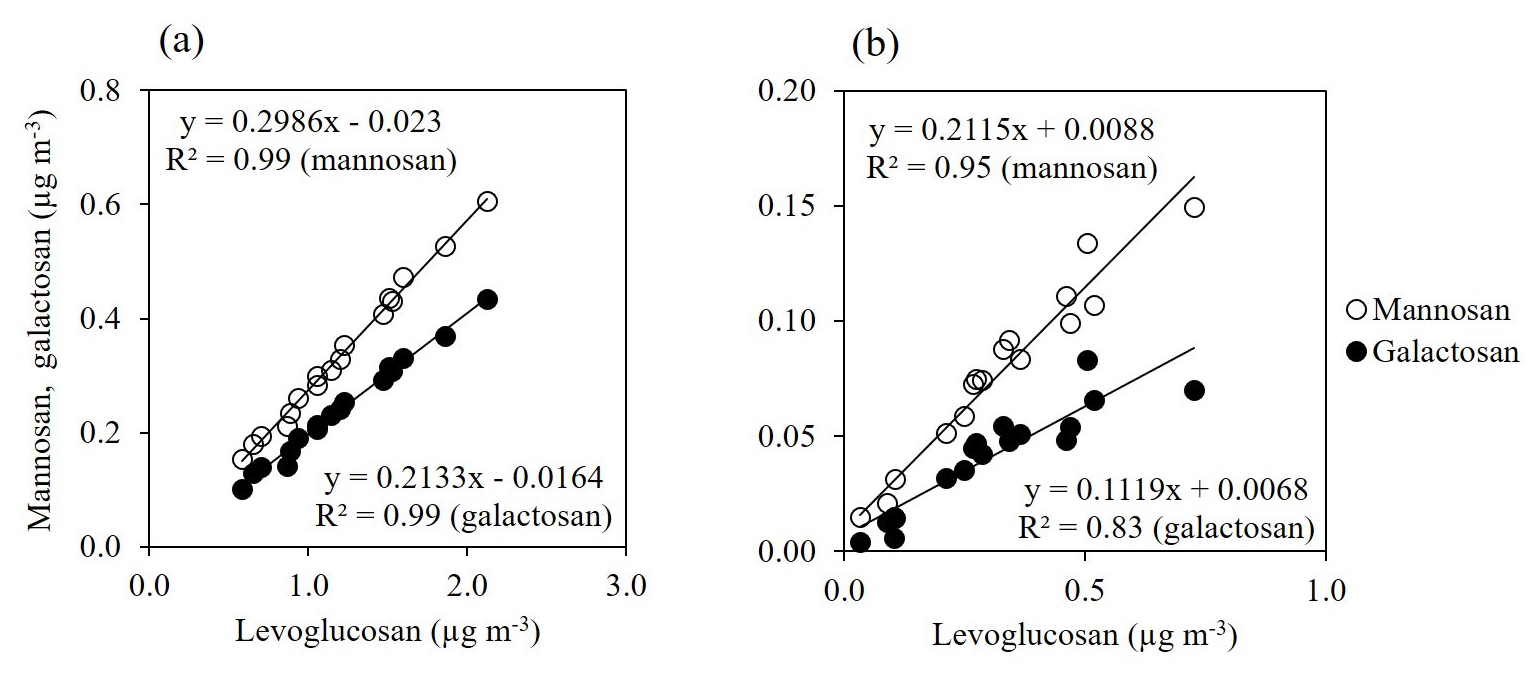
Figure 7Correlations of PM2.5 concentrations (µg m−3) of mannosan and galactosan with levoglucosan during winter (a) and spring (b) of 2017.
Fine-mode K+ is considered to be a biomass burning tracer in previous studies (Louie et al., 2005; Deshmukh et al., 2011; Cheng et al., 2013). The moderate correlation between levoglucosan and K+ concentrations (R2=0.68) in winter indicates that they are produced from similar sources (Fig. 8b), with BB contributing most of the K+. However, the correlation between levoglucosan and K+ was weak in spring (R2=0.49; Fig. 8b). Because K+ is typically emitted at a higher mass fraction in flaming-phase combustion compared to smoldering (Lee et al., 2010), smoldering combustion tends to have a higher levoglucosan ∕ K+ emission ratio compared to flaming combustion (Schkolnik et al., 2005; Gao et al., 2003). A high levoglucosan ∕ K+ ratio was observed during winter (8.92) compared to spring (4.21) at this site. Thus, a weak correlation between levoglucosan and K+ concentrations at Ulaanbaatar in spring can be explained by mixed burning conditions such as smoldering and flaming.
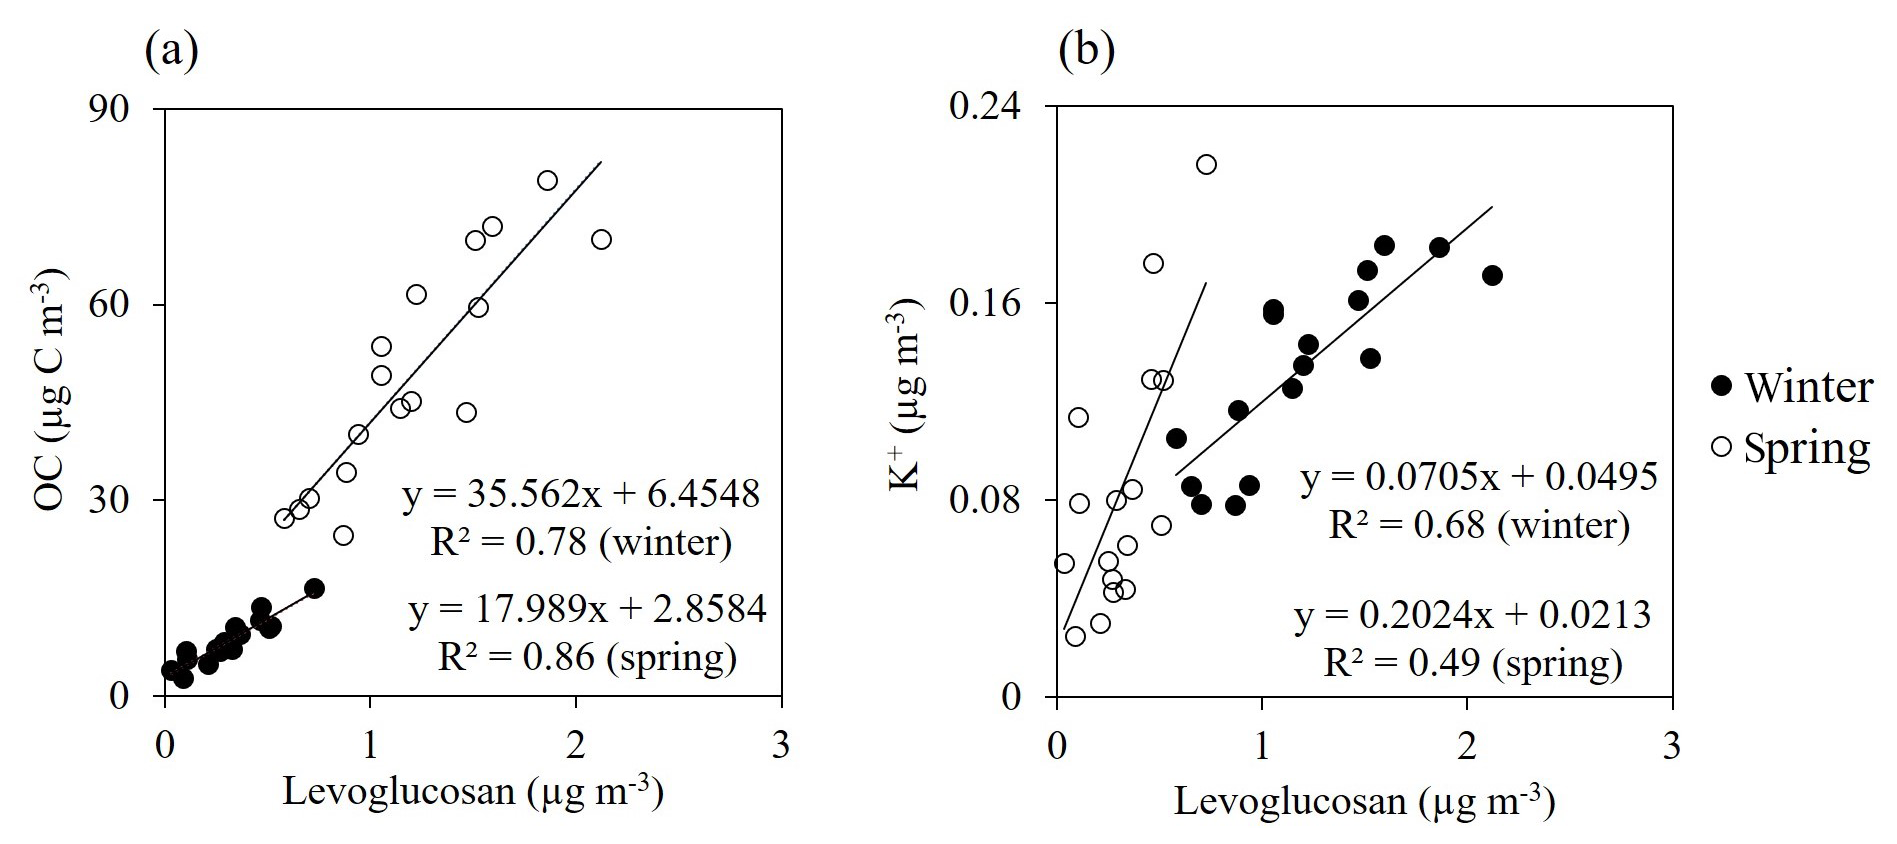
Figure 8Correlation between PM2.5 concentrations of (a) OC (µg C m−3) and levoglucosan (µg m−3) and between (b) K+ and levoglucosan (µg m−3) during winter and spring of 2017.
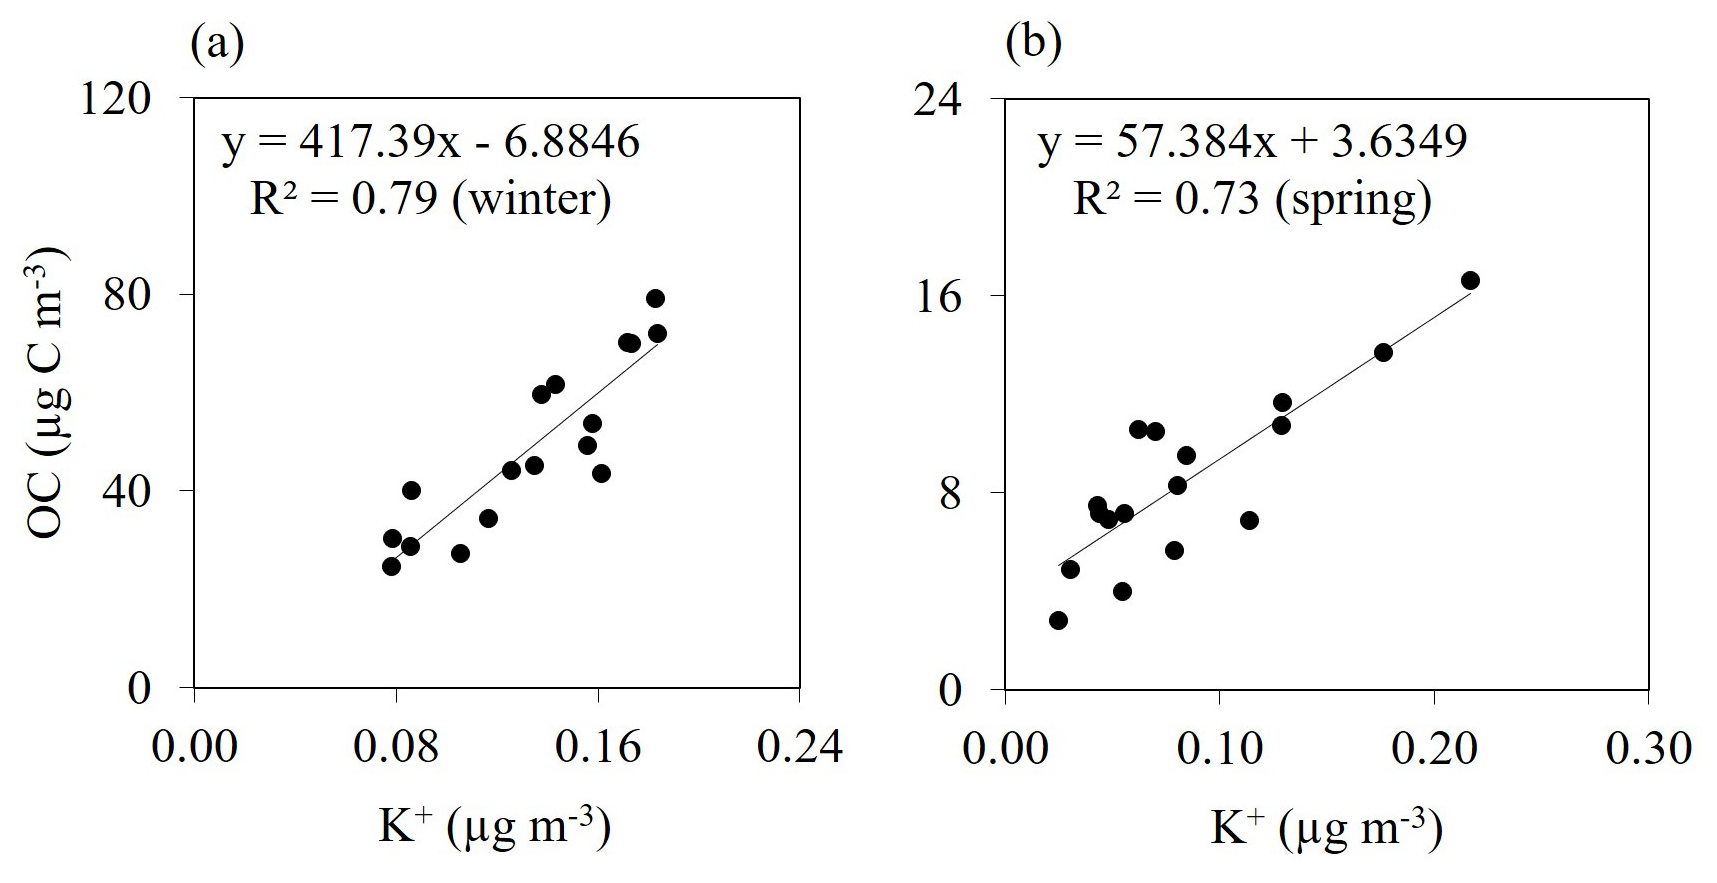
Figure 9Correlation between PM2.5 concentrations of OC (µg C m−3) and K+ (µg m−3) during winter (a) and spring (b) of 2017.
OC and K+ concentrations correlated well during winter ( Fig. 9a) and spring (R2=0.73; Fig. 9b), suggesting that they might originate from similar sources. Because most of the aerosol particles emitted from BB belong to PM2.5, the correlation between OC and K+ as well as levoglucosan suggests that BB is one of the potential sources of OC in winter and spring. Because biomass fuel is burned in traditional stoves with no pollution control devices in Ulaanbaatar (Batmunkh et al., 2013), soil and ash particles are entrained in convective processes and uplifted in the atmosphere together with smoke particles (Deshmukh et al., 2011; Nirmalkar et al., 2019).
3.4 Tracing the source of BB aerosol
OC is a major contributor of the quantified aerosol components in PM2.5 in Ulaanbaatar during spring and winter (Table 1). To quantify the OCBB, it is necessary to identify the BB fuel type. Several investigators used levoglucosan ∕ mannosan and levoglucosan ∕ K+ ratios to identify BB fuel types (Puxbaum et al., 2007; Cheng et al., 2013; Jung et al., 2014; Chen et al., 2018; Thepnuan et al., 2019).
The levoglucosan ∕ mannosan ratio is source-specific and can be used to identify BB fuel types due to the unique cellulose and hemicellulose compositions of different biomass fuels (Zhang et al., 2007; Cheng et al., 2013). A previous study suggested that the levoglucosan ∕ mannosan ratio is strongly dependent on wood type, rather than on the site where the wood is grown (Cheng et al., 2013). Therefore, the levoglucosan ∕ mannosan ratio was used to trace the type of wood burned during winter and spring for indoor heating and cooking purposes. Previous studies have used levoglucosan ∕ mannosan ratios to investigate the BB fuel types (Cheng et al., 2013; Jung et al., 2014).
However, the levoglucosan ∕ mannosan ratio cannot distinguish crop residuals (29±15) (Sheesley et al., 2003; Sullivan et al., 2008; Engling et al., 2009; Oanh et al., 2011) and hardwood (28±28) (Fine et al., 2001, 2002, 2004a, b; Engling et al., 2006; Schmidl et al., 2008; Bari et al., 2009; Gonçalves et al., 2010) due to the overlap of ratios between these fuel types (Cheng et al., 2013; Fine et al., 2001, 2002, 2004a, b; Engling et al., 2006). However, the levoglucosan ∕ K+ ratio can distinguish between the two groups (Jung et al., 2014, Chen et al., 2018). Both the levoglucosan ∕ mannosan and levoglucosan ∕ K+ ratios are therefore useful in distinguishing various types of fuel (Cheng et al., 2013; Puxbaum et al., 2007).
A levoglucosan ∕ mannosan–levoglucosan ∕ K+ scatter plot based on the results of the present and previous studies is shown in Fig. 10, using data from Schauer et al. (2001), Fine et al. (2001, 2002, 2004a, b), and Engling et al. (2006) for hardwood grown in the USA; Schauer et al. (2001), Hays et al. (2002), Fine et al. (2001, 2002, 2004a, b), and Engling et al. (2006) for US softwood; Schmidl et al. (2008), Bari et al. (2009), and Gonçalves et al. (2010) for hardwood grown in Europe; Iinuma et al. (2007), Schmidl et al. (2008), and Gonçalves et al. (2010) for European softwood; Engling et al. (2006) and Sullivan et al. (2008) for needles and duff found in the USA; Sullivan et al. (2008) for US grass; and from Sheesley et al. (2003), Sullivan et al. (2008), Engling et al. (2009), and Oanh et al. (2011) for Asian rice straw.
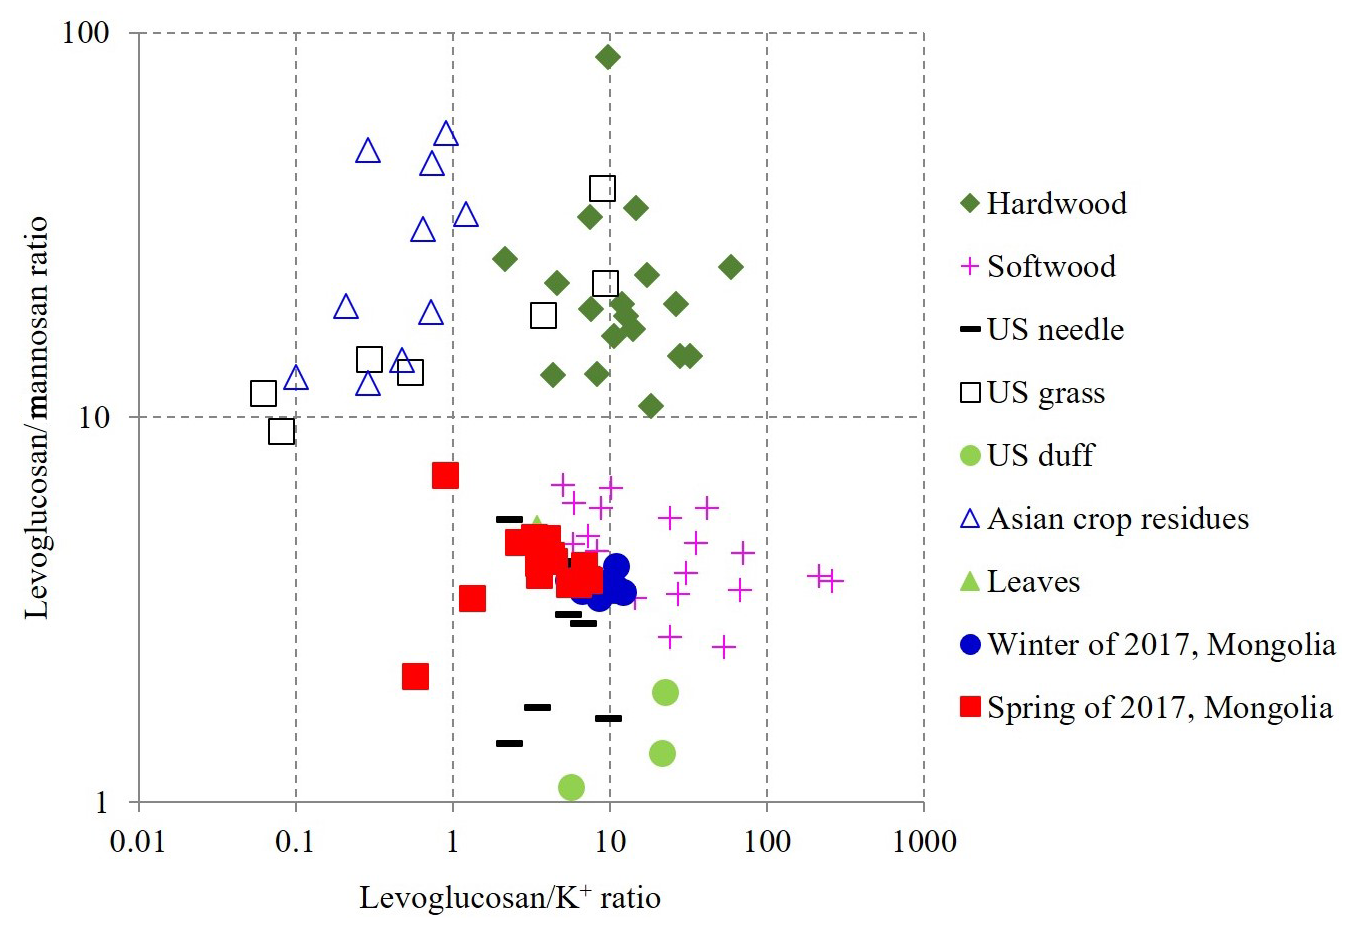
Figure 10Scatter plot of levoglucosan ∕ K+ versus levoglucosan ∕ mannosan from different types of BB emissions, including those measured in Ulaanbaatar (blue circles and red squares).
The average levoglucosan ∕ mannosan ratio was 3.6±0.2 (range: 3.4–4.1) in winter and 4.1±1.0 (2.12–7.05) in spring, whereas the levoglucosan ∕ K+ ratio was 8.9±1.8 (5.5–12.4) in winter and 4.2±2.1 (0.58–7.49) in spring at the study site (Fig. 10), within the ranges reported for softwood-burning sources (2.5–6.7 and 4.6–261, respectively) (Fine et al., 2001, 2002, 2004a, b; Schauer et al., 2001; Hays et al., 2002; Engling et al., 2006; Iinuma et al., 2007; Schmidl et al., 2008; Gonçalves et al., 2010; Cheng et al., 2013). During winter and spring, the levoglucosan ∕ K+ and levoglucosan ∕ mannosan ratios in Ulaanbaatar appeared in the softwood region (Fig. 10).
Therefore, softwood burning seems to be the major source of BB aerosol in Ulaanbaatar during both winter and spring, consistent with previously reported softwood-burning emissions from fireplaces in northern and southern regions of the USA (Fine et al., 2001, 2002), from household combustion in Zhengzhou, China (Chen et al., 2018), and from stovewood combustion in the mid-European region (Austria; Schmidl et al., 2008).
3.5 Optimization of OC ∕ levoglucosan ratio for estimating OCBB emissions
OCBB was estimated by multiplying the OC ∕ levoglucosan ratio and levoglucosan concentration. Previous studies have used the OC ∕ levoglucosan ratio obtained from sources of BB aerosol to estimate OCBB. A ratio of 7.35 reported for the burning of four types of US hardwood (Fine et al., 2002) was used for estimating OCBB at four background sites in Europe (Puxbaum et al., 2007). Later, a mean value of 11.2 for the OC ∕ levoglucosan ratio derived from ratios ranging 4.5–24.6 was used for estimating OCBB in the UK (Harrison et al., 2012). However, such estimates may not be accurate as the OC ∕ levoglucosan ratio is highly variable in BB emissions. For example, the average OC ∕ levoglucosan ratio from softwood burning (23.8) is much higher than that of hardwood burning (7.35) (Fine et al., 2002; Schmidl et al., 2008); differences are more than tenfold among studies of softwood-burning OC ∕ levoglucosan ratios (Fine et al., 2002; Hays et al., 2002; Engling et al., 2006; Iinuma et al., 2007; Gonçalves et al., 2010). Combustion conditions may also significantly influence OC ∕ levoglucosan ratios. For example, the OC ∕ levoglucosan ratio varied by a factor of about 7 between burning the same wood (Loblolly pine) in a fireplace (27.6; Fine et al., 2002) and in a stove (3.4; Fine et al., 2004b). Therefore, it is necessary to optimize the OC ∕ levoglucosan ratio for use in estimating OCBB.
This study has used an optimized OC ∕ levoglucosan ratio to estimate the precise concentration of OCBB for the Ulaanbaatar study site. We have used a range of different OC ∕ levoglucosan ratios obtained from previous literature (Fig. 11) for a regression analysis with measured levoglucosan concentrations to estimate the optimum OC ∕ levoglucosan ratio (Fig. 12a and b). First, candidate OCBB (Fig. 11) in this study was estimated from OC ∕ levoglucosan ratios for softwood burning in previous chamber experiments (Cheng et al., 2013; Schauer et al., 2001; Hays et al., 2002; Fine et al., 2001, 2002, 2004a, b; Engling et al., 2006; Iinuma et al., 2007; Schmidl et al., 2008; Gonçalves et al., 2010, Fig. 11) and the measured levoglucosan concentration at this site. Second, the OCnon-BB concentration was calculated by subtracting OCBB from the corresponding total OC. If calculated OCnon-BB does not contain OCBB, both the regression slope and R2 between OCnon-BB versus levoglucosan will be close to zero. As shown in Fig. 12a and b, the lowest R2 and regression slope were observed with OC ∕ levoglucosan ratios of 27.6 and 18.0 in winter and spring, respectively. Thus, the optimized OC ∕ levoglucosan ratios for our site were determined to be 27.6 and 18.0 in winter and spring, respectively.
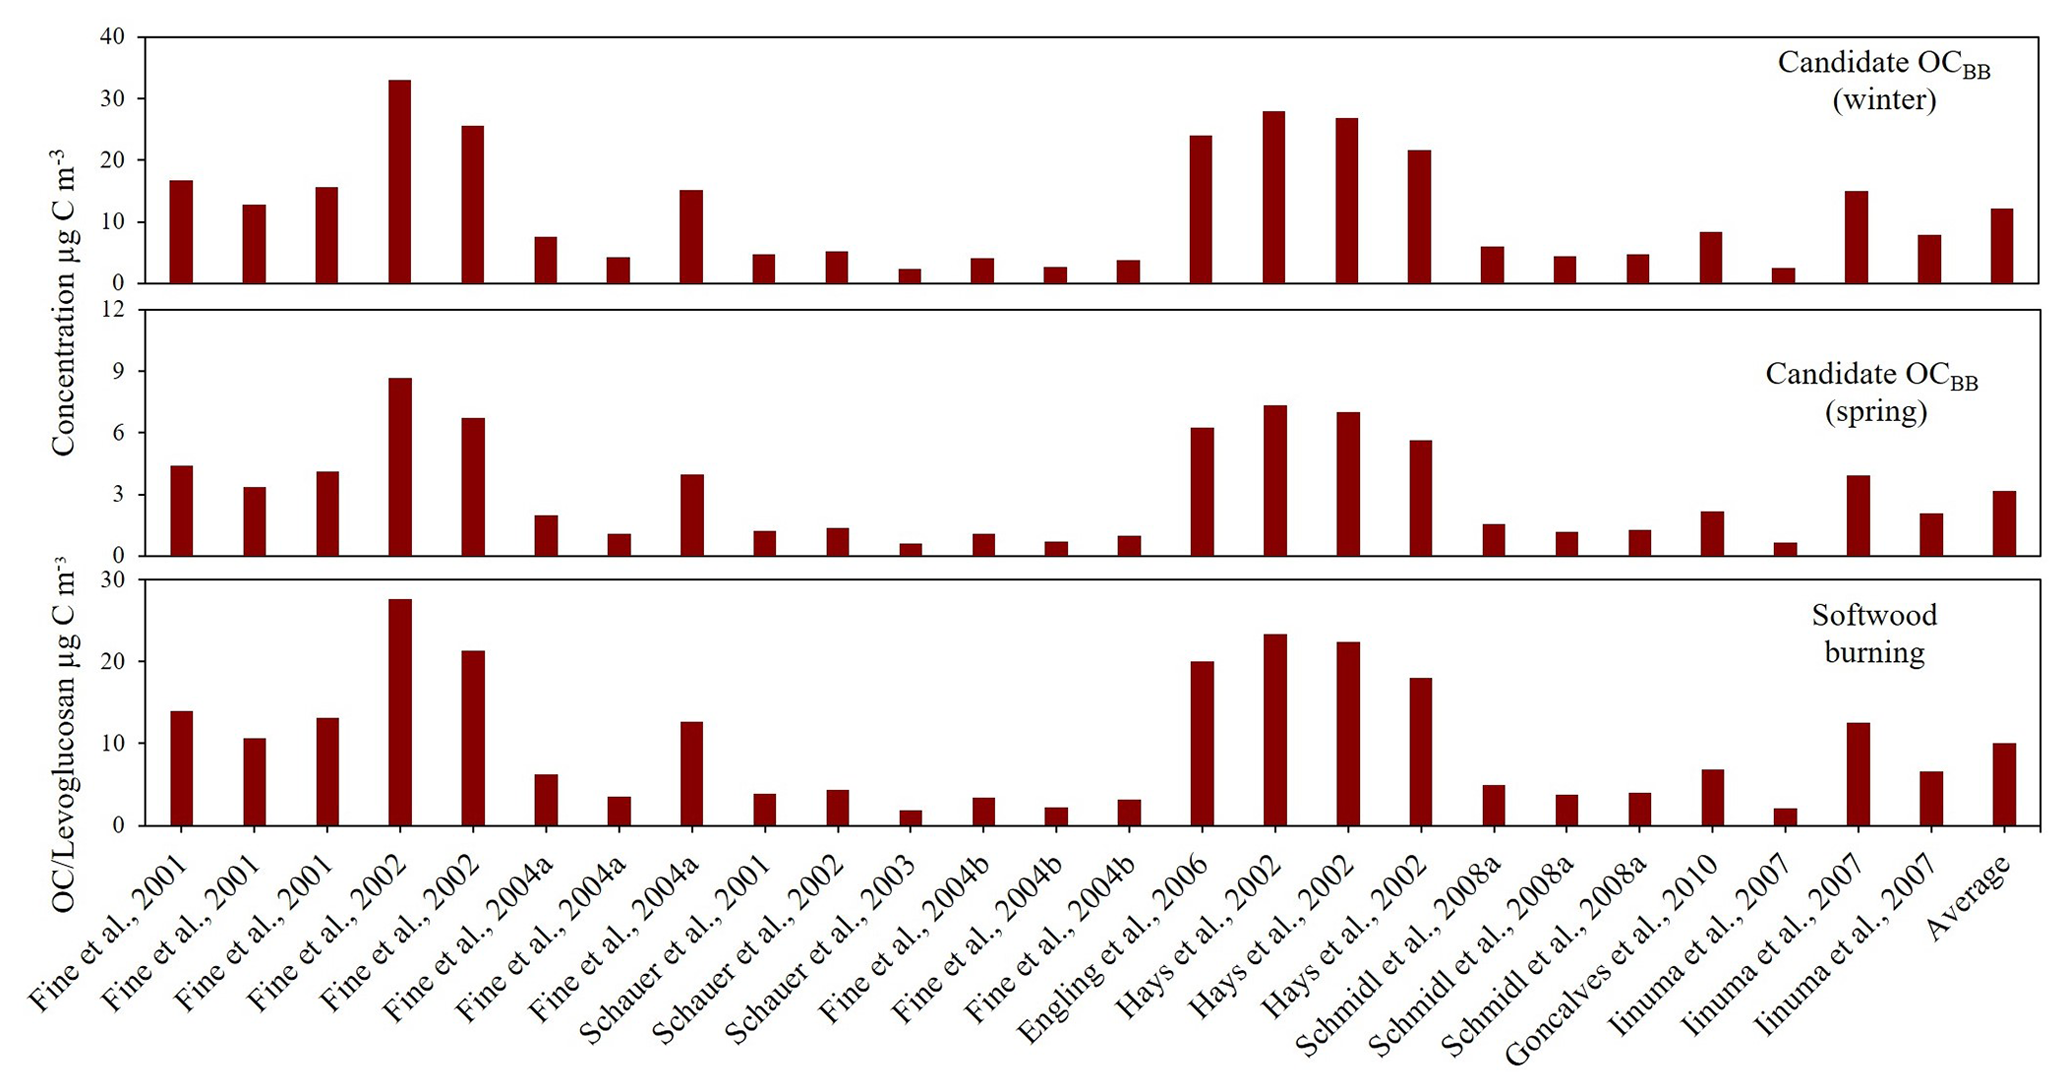

Figure 12Graphical determination of optimized OC ∕ levoglucosan ratios used to estimate PM2.5 concentrations of OCBB in Ulaanbaatar in winter (a) and spring (b) of 2017.
During winter the higher optimum ratio of OC ∕ levoglucosan might be due to incomplete combustion during smoldering phenomena. As smoldering fires are characterized by lower temperatures and thus have lower combustion efficiency, they release more un-combusted condensable products, resulting in the production of more unbroken organic compounds (Engling et al., 2006). Smoldering combustion generally leads to increased emissions of volatile organic compounds (VOCs) and particulate organic matter (OM) (Obrist et al., 2007). In contrast, the relatively lower optimum ratio of OC ∕ levoglucosan during spring might be due to the higher combustion efficiency during flaming phenomena.
The OCBB concentrations at the Ulaanbaatar study site were calculated from the optimized OC ∕ levoglucosan ratios (winter: 27.6 and spring: 18.0) and measured levoglucosan concentrations. The OCBB concentration was estimated to be 33.1±11.9 µg C m−3 (range 16.0–58.5 µg C m−3) and 5.64±3.29 µg C m−3 (range 0.57–13.1 µg C m−3), accounting for 68 % and 63 % of the total OC in winter and spring, respectively (Fig. 13). The average of previously published OC ∕ levoglucosan ratios, 10.1±7.9 (range 1.90–27.6), gives an estimated OCBB concentration of 12.1±4.4 µg C m−3 (range 5.9–21.4 µg C m−3) and 3.2±1.8 µg C m−3 (0.32–7.34 µg C m−3) in winter and spring, respectively. Their values are 2.7 (winter) and 1.8 (spring) times lower than values estimated using our optimized OC ∕ levoglucosan ratio.

Figure 13Relative contributions (µg C m−3) of OCBB and OCnon-BB to PM2.5 in Ulaanbaatar during winter and spring of 2017.
Our estimated contribution of OCBB was higher than that in Daejeon, South Korea (24 %–68 % of total OC, mean 45 % ± 12 %; Jung et al., 2014), and Beijing, China (50 % of total OC; Cheng et al., 2013), where BB aerosols are produced mainly by the burning of crop residues. The contribution of OCBB to total OC is 57 % and 31 % during the heating (average temperature 0.6 ∘C) and non-heating (average temperature 14 ∘C) seasons in Krynica-Zdrój, Poland (Klejnowski et al., 2017), significantly lower than that of Ulaanbaatar during both winter (average temperature −21 ∘C) and spring (average temperature 6 ∘C). Such high concentrations of OCBB in Ulaanbaatar and Krynica-Zdrój are likely due to intense wood burning for heating during winter.
Table 4Correlation coefficients (r) from a Spearman correlation analysis for OCnon-BB and water-soluble ions during winter and spring of 2017 at Ulaanbaatar, Mongolia.
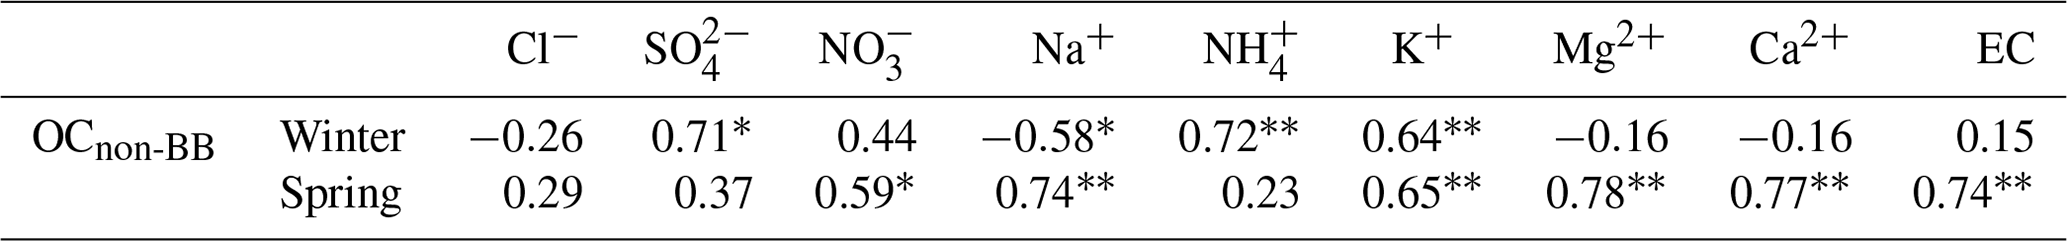
* Correlation is significant at the 0.05 level (two-tailed); * correlation is significant at the 0.01 level (two-tailed).
3.6 Tracing sources of OCnon-BB
A high concentration of OCnon-BB was found during winter compared to spring (Fig. 13). Elevated OCnon-BB could be attributed to enhanced emissions from combustion and favorable meteorological conditions (cold temperatures and inversion conditions, etc.) during the winter. There is a strong correlation between OCnon-BB and , , and K+ in winter and OCnon-BB and , Na+, K+, Mg2+, Ca2+, and EC in spring (Table 4). The residential combustion of coal emits significant amounts of OC, EC, and inorganic species ( and metals) due to incomplete combustion and lack of pollution control devices (Garcia et al., 1992; Li et al., 2016; Watson et al., 2001a, b). Garcia et al. (1992) studied emissions of volatile organic compounds from coal burning and vehicle engines.
In Ulaanbaatar, the use of wood and coal for cooking and heating, as well as emissions from old vehicles are reported as potential sources of OC (Batmunkh et al., 2013; Zhamsueva et al., 2018). The three thermal power plants in Ulaanbaatar are point sources for emissions of carbonaceous aerosol (Batmunkh et al., 2013), burning ∼5 million tons of coal per year (Batmunkh et al., 2013). High concentrations of anions ( and ) and cations ( and Na+) are reported in China (Zhou et al., 2003), the USA (Caiazzo et al., 2013), Brazil (Flues et al., 2002), India (Guttikunda and Jawahar, 2014), Korea (Park and Kim, 2004; Park et al., 2015), and Spain (Alastuey et al., 1999) near coal-fired thermal power plants. Emissions of volatile organic compounds from vegetation have also been observed in previous studies (Fehsenfeld et al., 1992; Shao et al., 2001; Acton et al., 2016). The correlations of OCnon-BB with ions and EC are thus likely due to volatile organic compounds emitted from coal burning, vehicles, and vegetative emissions.
BB was identified as a major source of the quantified aerosol components in PM2.5 in Ulaanbaatar, Mongolia, during the winter and spring of 2017 based on PCA. OC was the major component of the quantified aerosol components during the entire sampling period for the winter and spring. For the determination of OCBB, the fuel type must be identified, and levoglucosan ∕ mannosan and levoglucosan ∕ K+ ratios obtained from previous studies and our on-site measurements were used for this purpose.
Softwood burning was identified as a major source of OCBB. However, OC ∕ levoglucosan ratios from softwood burning are highly variable, and an optimum ratio was derived by regression analysis between daily concentrations of OCnon-BB and levoglucosan, yielding values of 27.6 and 18.0 for winter and spring, respectively. The application of these ratios indicates that 68 % and 63 % of the OC originated from BB during winter and spring, respectively, which is about double that estimated using average values of previous studies. The atmospheric concentration of OCBB was higher in winter than in spring, mainly due to additional BB for heating and cooking. BB aerosols in Ulaanbaatar originate mainly from local softwood burning. The approach developed here may be applied elsewhere to screen region-specific OC ∕ levoglucosan ratios for estimating appropriate atmospheric concentrations of OCBB, aiding the establishment of BB control measures.
The data used in this study are available from the corresponding author upon request (jsjung@kriss.re.kr).
JJ and TB designed the study and carried out the fieldwork. JJ performed chemical analyses and quality-control measures. JN wrote the paper under the guidance of JJ. All authors commented on and discussed the paper.
The authors declare that they have no conflict of interests.
This work was funded by a grant (19011057) from the Korea Research Institute of Standards and Science (KRISS) under the Basic R & D Project for the quantification of local and long-range-transported pollutants during a severe haze episode over the Korean Peninsula. The authors gratefully acknowledge the NOAA Air Resources Laboratory for the provision of the HYSPLIT transport and dispersion model and access to the READY website (http://www.arl.noaa.gov/ready.html, last access: 17 August 2019) as well as the Fire Information for Resource Management System (FIRMS) of the National Aeronautics and Space Administration (NASA), US (https://firms.modaps.eosdis.nasa.gov/alerts/, last access: 17 August 2019).
This research has been supported by the Korea Research Institute of Standards and Science (grant no. 19011057).
This paper was edited by James Allan and reviewed by two anonymous referees.
Achad, M., Caumo, S., de Castro Vasconcellos, P., Bajano, H., Gómez, D., and Smichowski, P.: Chemical markers of biomass burning: Determination of levoglucosan, and potassium in size-classified atmospheric aerosols collected in Buenos Aires, Argentina by different analytical techniques, Microchem. J., 139, 181–187, https://doi.org/10.1016/j.microc.2018.02.016, 2018.
Acton, W. J. F., Schallhart, S., Langford, B., Valach, A., Rantala, P., Fares, S., and Carriero, G.: Canopy-scale flux measurements and bottom-up emission estimates of volatile organic compounds from a mixed oak and hornbeam forest in northern Italy, Atmos. Chem. Phys., 16, 7149–7170, https://doi.org/10.5194/acp-16-7149-2016, 2016.
Alastuey, A., Querol, X., Chaves, A., Ruiz, C. R., Carratala, A., and Lopez-Soler, A.: Bulk deposition in a rural area located around a large coal-fired power station, northeast Spain, Environ. Pollut., 106, 359–367, https://doi.org/10.1016/S0269-7491(99)00103-7, 1999.
Allan, J. D., Morgan, W. T., Darbyshire, E., Flynn, M. J., Williams, P. I., Oram, D. E., Artaxo, P., Brito, J., Lee, J. D., and Coe, H.: Airborne observations of IEPOX-derived isoprene SOA in the Amazon during SAMBBA, Atmos. Chem. Phys., 14, 11393–11407, https://doi.org/10.5194/acp-14-11393-2014, 2014.
Ashbaugh, L. L., Malm, W. C., and Sadeh, W. Z.: A residence time probability analysis of sulfur concentrations at Grand Canyon National Park, Atmos. Environ., 19, 1263–1270, https://doi.org/10.1016/0004-6981(85)90256-2, 1985.
Bari, M. A., Baumbach, G., Kuch, B., and Scheffknecht, G.: Wood smoke as a source of particle-phase organic compounds in residential areas, Atmos. Environ., 43, 4722–4732, https://doi.org/10.1016/j.atmosenv.2008.09.006, 2009.
Batmunkh, T., Kim, Y. J., Jung, J. S., Park, K., and Tumendemberel, B.: Chemical characteristics of fine particulate matters measured during severe winter haze events in Ulaanbaatar, Mongolia, J. Air Waste Manage. Assoc., 63, 659–670, https://doi.org/10.1080/10962247.2013.776997, 2013.
Caiazzo, F., Ashok, A., Waitz, I. A., Yim, S. H., and Barrett, S. R.: Air pollution and early deaths in the United States. Part I: Quantifying the impact of major sectors in 2005, Atmos. Environ., 79, 198–208, https://doi.org/10.1016/j.atmosenv.2013.05.081, 2013.
Cao, J. J., Wu, F., Chow, J. C., Lee, S. C., Li, Y., Chen, S. W., An, Z. S., Fung, K. K., Watson, J. G., Zhu, C. S., and Liu, S. X.: Characterization and source apportionment of atmospheric organic and elemental carbon during fall and winter of 2003 in Xi'an, China, Atmos. Chem. Phys., 5, 3127–3137, https://doi.org/10.5194/acp-5-3127-2005, 2005.
Chantara, S., Thepnuan, D., Wiriya, W., Prawan, S., and Tsai, Y. I.: Emissions of pollutant gases, fine particulate matters and their significant tracers from biomass burning in an open-system combustion chamber, Chemosphere, 224, 407–416, 2019.
Chen, H., Yin, S., Li, X., Wang, J., and Zhang, R.: Analyses of biomass burning contribution to aerosol in Zhengzhou during wheat harvest season in 2015, Atmos. Res., 207, 62–73, https://doi.org/10.1016/j.atmosres.2018.02.025, 2018.
Cheng, Y., Engling, G., He, K.-B., Duan, F.-K., Ma, Y.-L., Du, Z.-Y., Liu, J.-M., Zheng, M., and Weber, R. J.: Biomass burning contribution to Beijing aerosol, Atmos. Chem. Phys., 13, 7765–7781, https://doi.org/10.5194/acp-13-7765-2013, 2013.
Chung, S. and Chon, H. T.: Assessment of the level of mercury contamination from some anthropogenic sources in Ulaanbaatar, Mongolia, J. Geochem. Explor., 147, 237–244, https://doi.org/10.1016/j.gexplo.2014.07.016, 2014.
Claeys, M., Kourtchev, I., Pashynska, V., Vas, G., Vermeylen, R., Wang, W., Cafmeyer, J., Chi, X., Artaxo, P., Andreae, M. O., and Maenhaut, W.: Polar organic marker compounds in atmospheric aerosols during the LBA-SMOCC 2002 biomass burning experiment in Rondônia, Brazil: sources and source processes, time series, diel variations and size distributions, Atmos. Chem. Phys., 10, 9319–9331, https://doi.org/10.5194/acp-10-9319-2010, 2010.
Deshmukh, D. K., Deb, M. K., Tsai, Y. I., and Mkoma, S. L.: Water soluble ions in PM2.5 and PM1 aerosols in Durg city, Chhattisgarh, India, Aerosol Air Qual. Res., 11, 696–708, https://doi.org/10.4209/aaqr.2011.03.0023, 2011.
Deshmukh, D. K., Haque, M. M., Kim, Y., and Kawamura, K.: Organic tracers of fine aerosol particles in central Alaska: summertime composition and sources, Atmos. Chem. Phys., 19, 14009–14029, https://doi.org/10.5194/acp-19-14009-2019, 2019.
Davy, P. K., Gunchin, G., Markwitz, A., Trompetter, W. J., Barry, B. J., Shagjjamba, D., and Lodoysamba, S.: Air particulate matter pollution in Ulaanbaatar, Mongolia: determination of composition, source contributions and source locations, Atmos. Poll. Res., 2, 126–137, https://doi.org/10.5094/APR.2011.017, 2011.
Duan, F., Liu, X., Yu, T., and Cachier, H.: Identification and estimate of biomass burning contribution to the urban aerosol organic carbon concentrations in Beijing, Atmos. Environ. 38, 1275–1282, https://doi.org/10.1016/j.atmosenv.2003.11.037, 2004.
Engling, G., Carrico, C. M., Kreidenweis, S. M., Collett Jr., J. L., Day, D. E., Malm, W. C., Lincoln, L., Hao, W. M., Iinuma, Y., and Herrmann, H.: Determination of levoglucosan in biomass combustion aerosol by high-performance anion-exchange chromatography with pulsed amperometric detection, Atmos. Environ., 40, 299–311, https://doi.org/10.1016/j.atmosenv.2005.12.069, 2006.
Engling, G., Lee, J. J., Tsai, Y. W., Lung, S. C. C., Chou, C. C. K., and Chan, C. Y.: Size resolved anhydrosugar composition in smoke aerosol from controlled field burning of rice straw, Aerosol Sci. Tech., 43, 662–672, https://doi.org/10.1080/02786820902825113, 2009.
Fang, G. C., Chang, C. N., Chu, C. C., Wu, Y. S., Fu, P. P. C., Yang, I. L., and Chen, M. H.: Characterization of particulate, metallic elements of TSP, PM2.5 and PM2.5−10 aerosols at a farm sampling site in Taiwan, Taichung, Sci. Total Environ., 308, 157–166, https://doi.org/10.1016/S0048-9697(02)00648-4, 2003.
Fehsenfeld, F., Calvert, J., Fall, R., Goldan, P., Guenther, A. B., Hewitt, C. N., Lamb, B., Liu, S., Trainer, M., Westberg, H., and Zimmerman, P.: Emissions of volatile organic compounds from vegetation and the implications for atmospheric chemistry, Global Biogeochem. Cy., 6, 389–430, https://doi.org/10.1029/92GB02125, 1992.
Feng, Y., Chen, Y., Guo, H., Zhi, G., Xiong, S., Li, J., Sheng, G., and Fu, J.: Characteristics of organic and elemental carbon in PM2.5 samples in Shanghai, China, Atmos. Res., 92, 434–442, https://doi.org/10.1016/j.atmosres.2009.01.003, 2009.
Fine, P. M., Cass, G. R., and Simoneit, B. R. T.: Chemical characterization of fine particle emissions from fireplace combustion of woods grown in the northeastern United States, Environ. Sci. Technol., 35, 2665–2675, https://doi.org/10.1021/es001466k, 2001.
Fine, P. M., Cass, G. R., and Simoneit, B. R. T.: Chemical characterization of fine particle emissions from the fireplace combustion of woods grown in the southern United States, Environ. Sci. Technol., 36, 1442–1451, https://doi.org/10.1021/es0108988, 2002.
Fine, P. M., Cass, G. R., and Simoneit, B. R. T.: Chemical characterization of fine particle emissions from the fireplace combustion of wood types grown in the midwestern and western United States, Environ. Eng. Sci., 21, 387–409, https://doi.org/10.1089/109287504323067021, 2004a.
Fine, P. M., Cass, G. R., and Simoneit, B. R. T.: Chemical characterization of fine particle emissions from the wood stove combustion of prevalent United States tree species, Environ. Eng. Sci., 21, 705–721, https://doi.org/10.1089/ees.2004.21.705, 2004b.
Flues, M., Hama, P., Lemes, M. J. L., Dantas, E. S. K., and Fornaro, A.: Evaluation of the rainwater acidity of a rural region due to a coal-fired power plant in Brazil, Atmos. Environ., 36, 2397–2404, https://doi.org/10.1016/S1352-2310(01)00563-5, 2002.
Fu, P. Q., Kawamura, K., Chen, J., Li, J., Sun, Y. L., Liu, Y., Tachibana, E., Aggarwal, S. G., Okuzawa, K., Tanimoto, H., and Kanaya, Y.: Diurnal variations of organic molecular tracers and stable carbon isotopic composition in atmospheric aerosols over Mt. Tai in the North China Plain: an influence of biomass burning, Atmos. Chem. Phys., 12, 8359–8375, https://doi.org/10.5194/acp-12-8359-2012, 2012.
Gao, S., Hegg D. A., Hobbs P. V., Kirchstetter T. W., Magi B. I., and Sadilek, M.: Water-soluble organic components in aerosols associated with savanna fires in southern Africa: Identification, evolution, and distribution, J. Geophys. Res., 108, 8491, https://doi.org/10.1029/2002JD002324, 2003.
Garcia, J., Beyne-Masclet, S., Mouvier, G., and Masclet, P.: Emissions of volatile organic compounds by coal-fired power stations, Atmos. Environ. A, 26, 1589–1597, https://doi.org/10.1016/0960-1686(92)90059-T, 1992.
Gonçalves, C., Alves, C., Evtyugina, M., Mirante, F., Pio, C., Caseiro, A., Schmidl, C., Bauer, H., and Carvalho, F.: Characterisation of PM10 emissions from wood stove combustion of common woods grown in Portugal, Atmos. Environ., 44, 4474–4480, https://doi.org/10.1016/j.atmosenv.2010.07.026, 2010.
Gu, J., Bai, Z., Li, W., Wu, L., Liu, A., Dong, H., and Xie, Y.: Chemical composition of PM2.5 during winter in Tianjin, China, Particuology, 9, 215–221, https://doi.org/10.1016/j.partic.2011.03.001, 2011.
Guttikunda, S.: Urban air pollution analysis for Ulaanbaatar, Mongolia, SIM Working Paper No. 2008-005, SSRN, Rochester, NY, https://doi.org/10.2139/ssrn.1288328, 2008.
Guttikunda, S. K. and Jawahar, P.: Atmospheric emissions and pollution from the coal-fired thermal power plants in India, Atmos. Environ., 92, 449–460, https://doi.org/10.1016/j.atmosenv.2014.04.057, 2014.
Harrison, R. M., Beddows, D. C. S., Hu, L., and Yin, J.: Comparison of methods for evaluation of wood smoke and estimation of UK ambient concentrations, Atmos. Chem. Phys., 12, 8271–8283, https://doi.org/10.5194/acp-12-8271-2012, 2012.
Haque, M., Kawamura, K., Deshmukh, D. K., Fang, C., Song, W., Mengying, B., and Zhang, Y. L.: Characterization of organic aerosols from a Chinese megacity during winter: predominance of fossil fuel combustion, Atmos. Chem. Phys., 19, 5147–5164, https://doi.org/10.5194/acp-19-5147-2019, 2019.
Hays, M. D., Geron, C. D., Linna, K. J., Smith, N. D., and Schauer, J. J.: Speciation of gasphase and fine particle emissions from burning of foliar fuels, Environ. Sci. Technol., 36, 2281–2295, https://doi.org/10.1021/es0111683, 2002.
Huang, X., Liu, Z., Zhang, J., Wen, T., Ji, D., and Wang, Y.: Seasonal variation and secondary formation of size-segregated aerosol water-soluble inorganic ions during pollution episodes in Beijing, Atmos. Res., 168, 70–79, https://doi.org/10.1016/j.atmosres.2015.08.021, 2016.
Iinuma, Y., Brüggemann, E., Gnauk, T., Müller, K., Andreae, M. O., Helas, G., Parmar, R., and Herrmann, H.: Source characterization of biomass burning particles: the combustion of selected European conifers, African hardwood, savanna grass, and German and Indonesian peat, J. Geophys. Res., 112, D08209, https://doi.org/10.1029/2006JD007120, 2007.
Ji, D., Zhang, J., He, J., Wang, X., Pang, B., Liu, Z., Wang, L., and Wang, Y.: Characteristics of atmospheric organic and elemental carbon aerosols in urban Beijing, China, Atmos. Environ., 125, 293–306, https://doi.org/10.1016/j.atmosenv.2015.11.020, 2016.
Jimenez, J. L., Canagaratna, M. R., Donahue, N. M., Prevot, A. S. H., Zhang, Q., Kroll, J. H., DeCarlo, P. F., Allan, J. D., Coe, H., Ng, N. L., and Aiken, A. C.: Evolution of organic aerosols in the atmosphere, Science, 326, 1525–1529, https://doi.org/10.1126/science.1180353, 2009.
Jung, J., Lee, H., Kim ,Y. J., Liu, X., Zhang, Y., Hu, M., and Sugimoto, N.: Optical properties of atmospheric aerosols obtained by in situ and remote measurements during 2006 Campaign of Air Quality Research in Beijing (CAREBeijing-2006), J. Geophys. Res., 114, D00G02, https://doi.org/10.1029/2008JD010337, 2009.
Jung, J., Tsatsral, B., Kim, Y. J., and Kawamura, K.: Organic and inorganic aerosol compositions in Ulaanbaatar, Mongolia, during the cold winter of 2007 to 2008: dicarboxylic acids, ketocarboxylic acids, and α-dicarbonyls, J. Geophys. Res.-Atmos., 115, D22203, https://doi.org/10.1029/2010JD014339, 2010.
Jung, J., Lee, S., Kim, H., Kim, D., Lee, H., and Oh, S.: Quantitative determination of the biomass-burning contribution to atmospheric carbonaceous aerosols in Daejeon, Korea, during the rice-harvest period, Atmos. Environ., 89, 642–650, https://doi.org/10.1016/j.atmosenv.2014.03.010, 2014.
Khan, M. F., Shirasuna, Y., Hirano, K., and Masunaga, S.: Characterization of PM2.5, PM2.5−10 and PM>10 in ambient air, Yokohama, Japan, Atmos. Res., 96, 159–172, https://doi.org/10.1016/j.atmosres.2009.12.009, 2010.
Klejnowski, K., Janoszka, K., and Czaplicka, M.: Characterization and seasonal variations of organic and elemental carbon and levoglucosan in PM10 in Krynica Zdroj, Poland, Atmosphere, 8, 190, https://doi.org/10.3390/atmos8100190, 2017.
Lai, C., Liu, Y., Ma, J., Ma, Q., and He, H.: Degradation kinetics of levoglucosan initiated by hydroxyl radical under different environmental conditions, Atmos. Environ., 91, 32–39, https://doi.org/10.1016/j.atmosenv.2014.03.054, 2014.
Lee, T., Sullivan, A. P., Mack, L., Jimenez, J. L., Kreidenweis, S. M., Onasch, T. B., Worsnop, D. R., Malm, W., Wold, C. E., Hao, W. M., and Collett Jr., J. L.: Chemical smoke marker emissions during flaming and smoldering phases of laboratory open burning of wildland fuels, Aerosol Sci. Tech., 44, 1–6, https://doi.org/10.1080/02786826.2010.499884, 2010.
Li, Q., Jiang, J., Zhang, Q., Zhou, W., Cai, S., Duan, L., Ge, S., and Hao, J.: Influences of coal size, volatile matter content, and additive on primary particulate matter emissions from household stove combustion, Fuel, 182, 780–787, https://doi.org/10.1016/j.fuel.2016.06.059, 2016.
Liang, L., Engling, G., Du, Z., Cheng, Y., Duan, F., Liu, X., and He, K.: Seasonal variations and source estimation of saccharides in atmospheric particulate matter in Beijing, China, Chemosphere, 150, 365–377, https://doi.org/10.1016/j.chemosphere.2016.02.002, 2016.
Lin, Y.-C., Hsu, S.-C., Lin, C.-Y., Lin, S.-H., Huang, Y.-T., Chang, Y., and Zhang, Y.-L.: Enhancements of airborne particulate arsenic over the subtropical free troposphere: impact of southern Asian biomass burning, Atmos. Chem. Phys., 18, 13865–13879, https://doi.org/10.5194/acp-18-13865-2018, 2018.
Louie, P. K., Watson, J. G., Chow, J. C., Chen, A., Sin, D. W., and Lau, A. K.: Seasonal characteristics and regional transport of PM2.5 in Hong Kong, Atmos. Environ., 39, 1695–1710, https://doi.org/10.1016/j.atmosenv.2004.11.017, 2005.
Maenhaut, W., Nava, S., Lucarelli, F., Wang, W., Chi, X., and Kulmala, M.: Chemical composition, impact from biomass burning, and mass closure for PM2.5 and PM10 aerosols at Hyytiälä, Finland, in summer 2007, X-Ray Spectrom., 40, 168–171, https://doi.org/10.1002/xrs.1302, 2011.
Nirmalkar, J., Deshmukh, D. K., Deb, M. K., Tsai, Y. I., and Sopajaree, K.: Mass loading and episodic variation of molecular markers in PM2.5 aerosols over a rural area in eastern central India, Atmos. Environ., 117, 41–50, https://doi.org/10.1016/j.atmosenv.2015.07.003, 2015.
Nirmalkar, J., Deshmukh, D. K., Deb, M. K., Tsai, Y. I., and Pervez, S.: Characteristics of aerosol during major biomass burning events over eastern central India in winter: A tracer-based approach, Atmos. Pollut. Res., 10, 817–826, https://doi.org/10.1016/j.apr.2018.12.010, 2019.
Oanh, N. T. K., Ly, B. T., Tipayarom, D., Manandhar, B. R., Prapat, P., Simpson, C. D., and Liu, L. J. S.: Characterization of particulate matter emission from open burning of rice straw, Atmos. Environ., 45, 493–502, https://doi.org/10.1016/j.atmosenv.2010.09.023, 2011.
Obrist, D., Moosmüller, H., Schürmann, R., Chen, L. W. A., and Kreidenweis, S. M.: Particulate-phase and gaseous elemental mercury emissions during biomass combustion: controlling factors and correlation with particulate matter emissions, Environ. Sci. Technol., 42, 721–727, https://doi.org/10.1021/es071279n, 2007.
Panda, S., Sharma, S. K., Mahapatra, P. S., Panda, U., Rath, S., Mahapatra, M., Mandal, T. K., and Das, T.: Organic and elemental carbon variation in PM2.5 over megacity Delhi and Bhubaneswar, a semi-urban coastal site in India, Nat. Hazards, 80, 1709–1728, https://doi.org/10.1007/s11069-015-2049-3, 2016.
Park, S. S. and Kim, Y. J.: PM2.5 particles and size-segregated ionic species measured during fall season in three urban sites in Korea, Atmos. Environ., 38, 1459–1471, https://doi.org/10.1016/j.atmosenv.2003.12.004, 2004.
Park, S. M., Seo, B. K., Lee, G., Kahng, S. H., and Jang, Y.: Chemical composition of water-soluble inorganic species in precipitation at Shihwa Basin, Korea, Atmosphere, 6, 732–750, https://doi.org/10.3390/atmos6060732, 2015.
Pei, B., Wang, X., Zhang, Y., Hu, M., Sun, Y., Deng, J., Dong, L., Fu, Q., and Yan N.: Emissions and source profiles of PM2.5 for coal-fired boilers in the Shanghai megacity, China, Atmos. Pollut. Res., 7, 577–584, https://doi.org/10.1016/j.apr.2016.01.005, 2016.
Pio, C. A., Legrand, M., Alves, C. A., Oliveira, T., Afonso, J., Caseiro, A., Puxbaum, H., Sanchez-Ochoa, A., and Gelencser, A.: Chemical composition of atmospheric aerosols during the 2003 summer intense forest fire period, Atmos. Environ., 42, 7530–7543, https://doi.org/10.1016/j.atmosenv.2008.05.032, 2008.
Puxbaum, H., Caseiro, A., Sánchez-Ochoa, A., Kasper-Giebl, A., Claeys, M., Gelencser, A., Legrand, M., Preunkert, S., and Pio, C.: Levoglucosan levels at background sites in Europe for assessing the impact of biomass combustion on the European aerosol background, J. Geophys. Res.-Atmos., 112, D23S05, https://doi.org/10.1029/2006JD008114, 2007.
Reche, C., Viana, M., Amato, F., Alastuey, A., Moreno, T., Hillamo, R., Teinila, K., Saarnio, K., Seco, R., Penuelas, J., and Mohr, C.: Biomass burning contributions to urban aerosols in a coastal Mediterranean City, Sci. Total Environ., 427, 175–190, https://doi.org/10.1016/j.scitotenv.2012.04.012, 2012.
Schauer, J. J., Kleeman, M. J., Cass, G. R., and Simoneit, B. R. T.: Measurement of emissions from air pollution sources. 3. C1–C29 organic compounds from fireplace combustion of wood, Environ. Sci. Technol., 35, 1716–1728, https://doi.org/10.1021/es001331e, 2001.
Schkolnik, G., Falkovich, A. H., Rudich, Y., Maenhaut, W., and Artaxo, P.: New analytical method for the determination of levoglucosan, polyhydroxy compounds, and 2-methylerythritol and its application to smoke and rainwater samples, Environ. Sci. Technol., 39, 2744–2752, https://doi.org/10.1021/es048363c, 2005.
Schmidl, C., Marr, I. L., Caseiro, A., Kotianová, P., Berner, A., Bauer, H., Kasper-Giebl, A., and Puxbaum, H.: Chemical characterisation of fine particle emissions from wood stove combustion of common woods growing in mid-European Alpine regions, Atmos. Environ., 42, 126–141, https://doi.org/10.1016/j.atmosenv.2007.09.028, 2008.
Shao, M., Czapiewski, K. V., Heiden, A. C., Kobel, K., Komenda, M., Koppmann, R., and Wildt, J.: Volatile organic compound emissions from Scots pine: mechanisms and description by algorithms, J. Geophys. Res.-Atmos., 106, 20483–20491, https://doi.org/10.1029/2000JD000248, 2001.
Sharma, A., Pareek, V., and Zhang, D.: Biomass pyrolysis – A review of modelling, process parameters and catalytic studies, J. Renew. Sustain. Energy, 50, 1081–1096, https://doi.org/10.1016/j.rser.2015.04.193, 2015.
Sheesley, R. J., Schauer, J. J., Chowdhury, Z., Cass, G. R., and Simoneit, B. R. T.: Characterization of organic aerosols emitted from the combustion of biomass indigenous to South Asia, J. Geophys. Res., 108, 4285, https://doi.org/10.1029/2002JD002981, 2003.
Simoneit, B. R., Schauer, J. J., Nolte, C. G., Oros, D. R., Elias, V. O., Fraser, M. P., Rogge, W. F., and Cass, G. R.: Levoglucosan, a tracer for cellulose in biomass burning and atmospheric particles, Atmos. Environ., 33, 173–182, https://doi.org/10.1016/S1352-2310(98)00145-9, 1999.
Sullivan, A. P., Holden, A. S., Patterson, L. A., McMeeking, G. R., Kreidenweis, S. M., Malm, W. C., Hao, W. M., Wold, C. E., and Collett Jr., J. L.: A method for smoke marker measurements and its potential application for determining the contribution of biomass burning from wildfires and prescribed fires to ambient PM2.5 organic carbon, J. Geophys. Res., 113, D22302, https://doi.org/10.1029/2008JD010216, 2008.
Sullivan, A. P., Guo, H., Schroder, J. C., Campuzano-Jost, P., Jimenez, J. L., Campos, T., Shah, V., Jaegle, L., Lee, B. H., Lopez-Hilfiker, F. D., and Thornton, J. A.: Biomass burning markers and residential burning in the winter aircraft campaign. J. Geophys. Res.-Atmos., 124, 1846–1861, https://doi.org/10.1029/2017JD028153, 2019.
Sun, J., Shen, Z., Zhang, Y., Zhang, Q., Wang, F., Wang, T., Chang, X., Lei, Y., Xu, H., Cao, J., and Zhang, N.: Effects of biomass briquetting and carbonization on PM2.5 emission from residential burning in Guanzhong Plain, China, Fuel, 244, 379–387, https://doi.org/10.1016/j.fuel.2019.02.031, 2019.
Tao, J., Zhang, L., Ho, K., Zhang, R., Lin, Z., Zhang, Z., Lin, M., Cao, J., Liu, S., and Wang, G.: Impact of PM2.5 chemical compositions on aerosol light scattering in Guangzhou – the largest megacity in South China, Atmos. Res., 135, 48–58, https://doi.org/10.1016/j.atmosres.2013.08.015, 2014.
Thepnuan, D., Chantara, S., Lee, C. T., Lin, N. H., and Tsai, Y. I.: Molecular markers for biomass burning associated with the characterization of PM2.5 and component sources during dry season haze episodes in Upper South East Asia, Sci. Total Environ., 658, 708–722, https://doi.org/10.1016/j.scitotenv.2018.12.201, 2019.
Verma, V., Fang, T., Guo, H., King, L., Bates, J. T., Peltier, R. E., Edgerton, E., Russell, A. G., and Weber, R. J.: Reactive oxygen species associated with water-soluble PM2.5 in the southeastern United States: spatiotemporal trends and source apportionment, Atmos. Chem. Phys., 14, 12915–12930, https://doi.org/10.5194/acp-14-12915-2014, 2014.
Wang, T., Tian, M., Ding, N., Yan, X., Chen, S. J., Mo, Y. Z., Yang, W. Q., Bi, X. H., Wang, X. M., and Mai, B. X.: Semivolatile organic compounds (SOCs) in fine particulate matter (PM2.5) during clear, fog, and haze episodes in winter in Beijing, China, Environ. Sci. Technol., 52, 5199–5207, https://doi.org/10.1021/acs.est.7b06650, 2018.
Watson, J. G., Chow, J. C., and Fujita, E. M.: Review of volatile organic compound source apportionment by chemical mass balance, Atmos. Environ., 35, 1567–1584, https://doi.org/10.1016/S1352-2310(00)00461-1, 2001a.
Watson, J. G., Chow, J. C., and Houck, J. E.: PM2.5 chemical source profiles for vehicle exhaust, vegetative burning, geological material, and coal burning in Northwestern Colorado during 1995, Chemosphere, 43, 1141–1151, https://doi.org/10.1016/S0045-6535(00)00171-5, 2001b.
Zhamsueva, G. S., Zayakhanov, A. S., Starikov, A. V., Balzhanov, T. S., Tsydypov, V. V., Dementyeva, A. L., and Khodzher, T. V.: Investigation of chemical composition of atmospheric aerosol in Ulaanbaatar during 2005–2014, Geogr. Nat., 39, 270–276, https://doi.org/10.1134/S1875372818030113, 2018.
Zhang, F., Wang, Z. W., Cheng, H. R., Lv, X. P., Gong, W., Wang, X. M., and Zhang, G.: Seasonal variations and chemical characteristics of PM2.5 in Wuhan, central China, Sci. Total Environ., 518, 97–105, https://doi.org/10.1016/j.scitotenv.2015.02.054, 2015.
Zhang, Y. X., Min, S., Zhang, Y. H., Zeng, L. M., He, L. Y., Bin, Z. H. U., Wei, Y. J., and Zhu, X. L.: Source profiles of particulate organic matters emitted from cereal straw burnings, J. Environ. Sci., 19, 167–175, https://doi.org/10.1016/S1001-0742(07)60027-8, 2007.
Zhou, Y., Levy, J. I., Hammitt, J. K., and Evans, J. S.: Estimating population exposure to power plant emissions using CALPUFF: a case study in Beijing, China, Atmos. Environ., 37, 815–826, https://doi.org/10.1016/S1352-2310(02)00937-8, 2003.
Zhu, C., Kawamura, K., and Kunwar, B.: Effect of biomass burning over the western North Pacific Rim: wintertime maxima of anhydrosugars in ambient aerosols from Okinawa, Atmos. Chem. Phys., 15, 1959–1973, https://doi.org/10.5194/acp-15-1959-2015, 2015.