the Creative Commons Attribution 4.0 License.
the Creative Commons Attribution 4.0 License.
 | 13 Mar 2020
Biomass burning aerosol as a modulator of the droplet number in the southeast Atlantic region
Mary Kacarab
K. Lee Thornhill
Amie Dobracki
Steven G. Howell
Joseph R. O'Brien
Steffen Freitag
Michael R. Poellot
Robert Wood
Paquita Zuidema
Jens Redemann
Athanasios Nenes
The southeastern Atlantic (SEA) and its associated cloud deck, off the west coast of central Africa, is an area where aerosol–cloud interactions can have a strong radiative impact. Seasonally, extensive biomass burning (BB) aerosol plumes from southern Africa reach this area. The NASA ObseRvations of Aerosols above CLouds and their intEractionS (ORACLES) study focused on quantitatively understanding these interactions and their importance. Here we present measurements of cloud condensation nuclei (CCN) concentration, aerosol size distribution, and characteristic vertical updraft velocity (w∗) in and around the marine boundary layer (MBL) collected by the NASA P-3B aircraft during the August 2017 ORACLES deployment. BB aerosol levels vary considerably but systematically with time; high aerosol concentrations were observed in the MBL (800–1000 cm−3) early on, decreasing midcampaign to concentrations between 500 and 800 cm−3. By late August and early September, relatively clean MBL conditions were sampled (<500 cm−3). These data then drive a state-of-the-art droplet formation parameterization from which the predicted cloud droplet number and its sensitivity to aerosol and dynamical parameters are derived. Droplet closure was achieved to within 20 %. Droplet formation sensitivity to aerosol concentration, w∗, and the hygroscopicity parameter, κ, vary and contribute to the total droplet response in the MBL clouds. When aerosol concentrations exceed ∼900 cm−3 and maximum supersaturation approaches 0.1 %, droplet formation in the MBL enters a velocity-limited droplet activation regime, where the cloud droplet number responds weakly to CCN concentration increases. Below ∼500 cm−3, in a clean MBL, droplet formation is much more sensitive to changes in aerosol concentration than to changes in vertical updraft. In the competitive regime, where the MBL has intermediate pollution (500–800 cm−3), droplet formation becomes much more sensitive to hygroscopicity (κ) variations than it does in clean and polluted conditions. Higher concentrations increase the sensitivity to vertical velocity by more than 10-fold. We also find that characteristic vertical velocity plays a very important role in driving droplet formation in a more polluted MBL regime, in which even a small shift in w∗ may make a significant difference in droplet concentrations. Identifying regimes where droplet number variability is driven primarily by updraft velocity and not by aerosol concentration is key for interpreting aerosol indirect effects, especially with remote sensing. The droplet number responds proportionally to changes in characteristic velocity, offering the possibility of remote sensing of w∗ under velocity-limited conditions.
- Article
(6516 KB) -
Supplement
(739 KB) - BibTeX
- EndNote


Aerosol particles affect the planetary radiative balance by directly absorbing and scattering radiation. They also provide the nuclei upon which cloud droplets and ice crystals form; variations therein can profoundly impact cloud formation, precipitation, and the hydrological cycle (Boucher et al., 2013; Myhre et al., 2013). These aerosol impacts are thought to be important but uncertain modulators of regional- and global-scale climate. The interactions of aerosols with clouds are especially uncertain and affect estimates of equilibrium climate sensitivity and the transient climate response to greenhouse gas concentrations (Seinfeld et al., 2016; IPCC, 2013).
Only a fraction of aerosols can affect clouds; those aerosols that can activate to form cloud droplets (termed cloud condensation nuclei, CCN) must satisfy a certain physical size range and chemical composition for the levels of water vapor supersaturation that develop in cloud-forming air parcels (Köhler, 1936; Seinfeld and Pandis, 2006). The properties and dynamical development of warm and mixed-phase clouds are sensitive to the number of cloud droplets formed. It is now established that anthropogenic emissions have strongly modulated global CCN and the droplet number since the industrial revolution (e.g., Boucher et al., 2013; Raatikainen et al., 2013). Much work remains, however, to reduce the uncertainty associated with this forcing on climate (e.g., Seinfeld et al., 2016).
Appropriately capturing the variability in the droplet number and its sensitivity to aerosol (which is at the heart of aerosol–cloud interactions) requires a good description of aerosol size distribution and hygroscopicity (e.g., Fanourgakis et al., 2019), especially in boundary layer clouds where liquid clouds and their radiative cooling dominate. Key to achieving this goal is capturing the source characteristics of major aerosol types and their chemical and microphysical evolution throughout their atmospheric residence. Biomass burning (BB) aerosol has emerged as a major source of regional and global aerosol, contributing up to 64 % of global surface CCN concentrations (Spracklen et al., 2011). The influence of BB is expected to increase in importance as the combustion of biomass (natural and anthropogenic) is expected to accelerate in the future, especially in Africa, while anthropogenic emissions decrease (Bond et al., 2013; Andela et al., 2017).
Almost one-third of annual global biomass burning emissions originate from regional fires across the savanna and woodlands of sub-Saharan Africa, and one-fourth originate from southern Africa (van der Werf et al., 2010). From approximately June until October, these intense BB emissions are subsequently transported over the southeast Atlantic (SEA) region (Adebiyi and Zuidema, 2016; Garstang et al., 1996), greatly elevating CCN levels above background concentrations (Ross, et al., 2003) and interacting with low-level marine-boundary-layer clouds that are abundant in the SEA (e.g., Seager et al., 2003; Grosvenor et al., 2018; Zuidema et al., 2018). The SEA experiences a structure transition of clouds from marine stratocumulus to trade wind cumulus, so the coincidence of large BB aerosol plumes implies a potentially large role for aerosol–cloud interactions to affect cloud radiative properties over a globally relevant system, potentially modulating the extent of each regime and the transition itself (Yamaguchi et al., 2015; Zhou et al., 2017). The microphysical influence of BB aerosol on clouds, however, is nonlinear, as increasing aerosol levels enhance the competition of CCN for water vapor, to the point where droplet formation may be insensitive to CCN concentration level (e.g., Rissman et al., 2004; Ruetter et al., 2009; Bougiatioti, et al., 2016). Dynamical adjustments (primarily vertical velocity) may also respond to CCN and cloud droplet number changes; therefore it is important to quantify all these links, as model assessments of BB aerosol–cloud–climate interactions in the SEA critically rely on them. Constraints, however, on such links are virtually nonexistent for this region of the globe.
This study analyzes data collected in August 2017 on the NASA ObseRvations of Aerosols above CLouds and their intEractionS (ORACLES) campaign and provides a systematic mapping of CCN concentration, aerosol size distribution, hygroscopicity, and cloud vertical velocity in the SEA. The in situ measurements are then coupled with a state-of-the-art droplet parameterization to determine the in-cloud maximum supersaturation (Smax) achieved in the cloud updrafts and its response to aerosol changes. The data then are used to quantify the sensitivity of droplet formation to variations in vertical velocity and aerosol. We also explore whether the presence of BB aerosol correlates with shifts in the cloud vertical velocity driving droplet formation. These perturbations in BB aerosol availability, linked with vertical updraft dynamics, and predicted cloud droplet formation allow for the understanding of the drivers of droplet formation in the SEA cloud deck and the degree to which BB influences droplet formation in the boundary layer.
2.1 Observational dataset
A complete description and overview of the project is provided by Redemann et al. (2020). All measurements were taken aboard the National Aeronautics and Space Administration (NASA) P-3B aircraft from 12 August through 31 August as part of the ORACLES 2017 campaign. The aircraft was based at the São Tomé International Airport (0.3778∘ N, 6.7131∘ E) of São Tomé, an island off the west coast of central Africa. A map of MODIS satellite fires for the month of August 2017 can be found in Fig. 1. The burning area is largely savanna grassland, and the subsequent smoke plume travels westward over the SEA region. This work focuses on data collected on eight different research flights in the 2017 campaign during which instrumentation providing all relevant aerosol-microphysical and cloud-scale-dynamics data performed optimally. Flight paths for all data used in this work can be found in Fig. 1. Most flights followed a routine route going out to 5∘ E longitude and then due south. Each flight included legs at varying altitudes to capture the characteristics of the plume, the marine boundary layer (MBL), and the cloud deck. This work primarily focuses on the aerosol measured below cloud in the MBL, as that is the aerosol that will participate in cloud droplet activation.
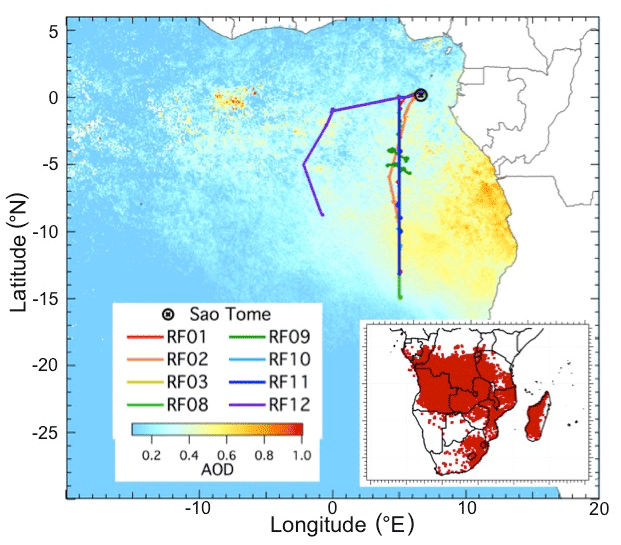
Figure 1Map of ORACLES 2017 research flights used in this work, together with aerosol optical thickness (AOT) of the August 2017 plume (Meyer et al., 2015). The inset provides MODIS imagery of savanna fires throughout August 2017. Most flights are in close proximity to the routine flight path of due south along a 5∘ E longitude.
2.2 Instrumentation
A summary of the relevant measurements obtained at each flight can be found in Table 1. A solid diffuser inlet, characterized previously as having a 4 µm dry-diameter cutoff (McNaughton, et al., 2007), was used to sample aerosol onboard the aircraft. A Droplet Measurement Technologies (DMT) CCN-100 continuous-flow streamwise thermal-gradient chamber (CFSTGC; Roberts and Nenes, 2005) was used to measure CCN concentrations using a DMT constant pressure inlet operated at 600 mbar pressure. Since CCN measurements are highly sensitive to fluctuations in pressure and their effect on generated supersaturation (Raatikainen, et al., 2014), a flow orifice and active control system were used upstream of the instrument to ensure that the pressure remained constant, despite fluctuations in ambient pressure with altitude. The instrument was operated in both standard mode, where supersaturation (SS %) was stepped between 0.1, 0.2, and 0.3 % by changing the temperature gradient in the droplet growth chamber, and in scanning-flow CCN analysis (SFCA) mode (Moore and Nenes, 2009), where supersaturation was varied from 0.1 % to 0.4 % by cycling the flow in a sinusoidal pattern from 300 to 1000 cm3 min−1 while maintaining a constant temperature gradient in the growth chamber. Aerosol particles that activated into droplets sized greater than 0.5 µm were then counted as CCN by the optical particle counter located at the exit of the CFSTGC growth chamber.
Table 1Average marine-boundary-layer (MBL) aerosol concentrations from the UHSAS CCN activity derived from in situ CCN measurements (κCCN), bulk chemical composition (κAMS), and characteristic vertical updraft velocity (w∗). Aerosol conditions are classified for each flights as polluted, intermediate, or clean based on the MBL aerosol concentration.
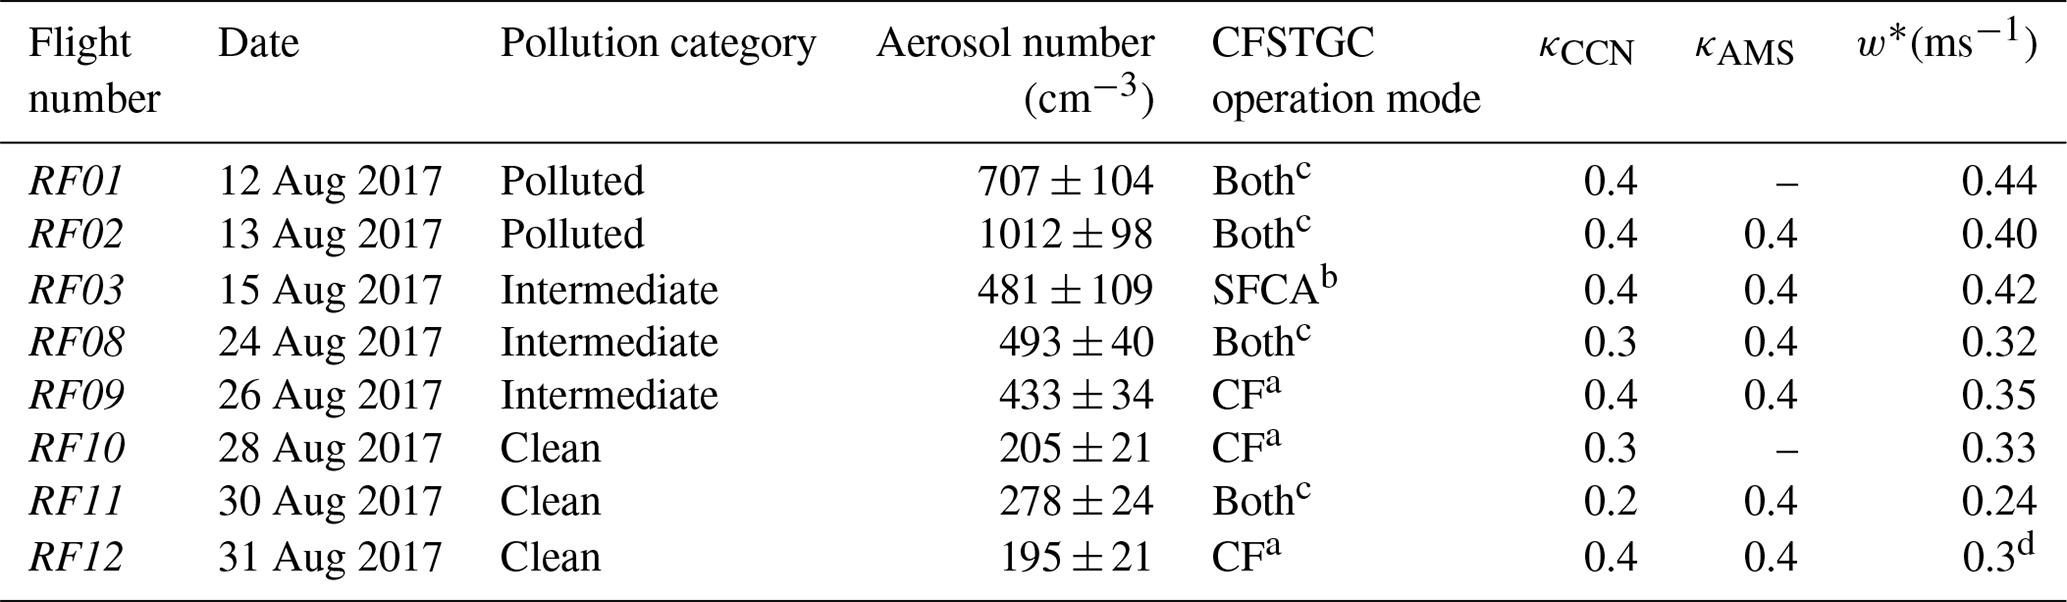
a CF: Constant-flow operation of the CCN instrument. b SFCA: Scanning-flow CCN analysis operation of the CCN instrument. c Both operation modes (CF, SFCA) of the CCN instrument were used. d ms−1 assumed when calculating the droplet number. This value was selected based on the pollution category, date, and the average of corresponding w∗ determined from RF10 and RF11.
A DMT ultra-high-sensitivity aerosol spectrometer (UHSAS) was also operated on the same 600 mbar constant pressure inlet as the CFSTGC to detect the aerosol concentration from 80 to 1000 nm (Table 1). Comparison of UHSAS with DMA distributions revealed that the UHSAS counting efficiency dropped below about 80 nm (Stephen Howell, personal communication, 2020), which should not strongly affect our subsequent analysis – as particles larger than 80 nm in diameter contribute the exclusive majority of CCN that activate into droplets for the conditions considered. The aerosol size distribution was combined with CCN measurements to calculate the hygroscopicity parameter, κ, of the observed aerosol (Petters and Kreidenweis, 2007), following a procedure adopted in numerous studies (e.g., Kalkavouras et al., 2019; Bougiatioti et al., 2016; Moore et al., 2011; Lathem et al., 2013), where integration of the particle size distribution from the largest resolved bin in the UHSAS down to a characteristic size, dcrit (also known as the critical diameter), matches the measured CCN concentration. The hygroscopicity then is obtained from dcrit and the instrument supersaturation, following Kalkavouras et al. (2019).
Vertical winds on the P-3B were measured with the NASA Turbulent Air Motion Measurement System (TAMMS; Thornhill et al., 2003). Fast-response flow-angle, pressure, and temperature sensors combined with a GPS-corrected inertial navigation system (INS) provide 50 Hz inputs to compute 20 Hz averaged vertical winds via the full air motion equations from Lenschow (1986). The updraft velocities are then used as an input to calculate cloud droplet number concentration via a Gaussian distribution of updraft velocities (Sect. 2.3).
An Aerodyne high-resolution time-of-flight aerosol mass spectrometer (HR-ToF-AMS; DeCarlo, et al., 2006) was used to monitor the bulk chemical composition of sampled aerosol throughout all flights. The bulk chemical composition acquired is then used to calculate the bulk κ (Petters and Kreidenweis, 2007), based on the mass fraction of organics and sulfate in the aerosol – assuming that the hygroscopicity of the organic fraction, κorg, equals 0.1, and of sulfate, κsulfate, equals 0.6. We have also ignored the effects of insoluble material – such as black carbon – as it constitutes a small volume fraction of the aerosol and has a negligible influence on hygroscopicity. The bulk-derived κ allows for comparison with the directly calculated κ from the CFSTGC and UHSAS measurements, even if the AMS-derived values correspond to larger sizes than the CCN-derived κ. Nevertheless, strong agreement is found between the two κ values (Table 1; Fig. S1 in the Supplement), thus confirming that the internal-mixture assumption inherent to CCN-derived hygroscopicity applies and that the composition varies little over the size range between dcrit (∼100–200 nm) and the peak of the mass distribution resolved by the AMS. It should also be noted that all of the AMS data analysis was in high-sensitivity mode; the AMS heater was operated at an indicated 600 ∘C, which was tested and proved optimal for the ORACLES BB organic-aerosol plume. The data were processed using the standard AMS software (Squirrel, version 1.41).
A DMT cloud droplet probe (CDP) was used to measure the number of cloud droplets from 2 to 50 µm in diameter. The CDP was modified according to Lance et al. (2010) to reduce coincidence problems. The total cloud droplet number (Nd) from the CDP is compared against the predicted Nd from the cloud droplet parameterization. These comparisons are done in flights with mostly stacked legs in the MBL and clouds; occasionally, flights where aerosol and cloud were immediately before or after each other were used (but not stacked).
2.3 Predicted cloud droplet number
The droplet activation process is the direct microphysical link between clouds and aerosol. Every aerosol particle, to activate and form a cloud droplet, requires exposure to a critical supersaturation level (or above) for enough time to grow past a critical wet size (Nenes et al., 2001) that ensures unconstrained growth. Applying this principle to ambient clouds is confounded by the complex relationship of supersaturation with aerosol size distribution, hygroscopicity, and the characteristic vertical updraft velocity. State-of-the-art cloud droplet parameterizations (e.g., Ghan et al., 2011; Morales Betancourt and Nenes, 2014), however, resolve this relation and determine the cloud droplet number (Nd); maximum available supersaturation (Smax); and sensitivity of Nd to changes in aerosol concentration (Na), vertical updraft velocity (w), and CCN activity (κ).
In this study, we utilize the Nenes and Seinfeld (2003) parameterization with improvements introduced by Fountoukis and Nenes (2005), Barahona et al. (2010), and Morales and Nenes (2014). In applying the droplet parameterization, we integrate over the distribution of vertical velocities within the boundary layer – by utilizing the characteristic-vertical-velocity approach of Morales and Nenes (2010). In this approach, instead of numerically integrating over a probability density distribution (PDF), the parameterization is applied at a characteristic velocity, w∗, that yields the same result as the integrated value over the PDF. To derive w∗, the measured updrafts (positive vertical winds), w, are taken from all segments just below cloud in a given flight then fit to a Gaussian distribution with zero mean; , where σw is the width of the vertical-velocity spectrum (Morales and Nenes, 2010). Stratocumulus clouds, such as those sampled in this study, are well characterized by a Gaussian distribution of vertical velocities with a mean close to zero (Morales and Nenes, 2010). A comparison between the predicted Nd from the parameterization and the measured Nd from the CDP can be found in Fig. S2. The parameterized Nd was, on average, within 20 % of the measured Nd, which is within the difference range of previous droplet closure studies (e.g., Meskhidze et al., 2005; Fountoukis et al., 2007; Morales et al., 2011).
3.1 Marine-boundary-layer air mass characterization
Characteristic vertical profiles of CCN concentrations from 0.1 to 0.4 % supersaturation for flights used in this work are shown in Fig. 2. Earlier flights (RF01–RF03) have lower BB plume heights, relatively little vertical variation in concentration within the plume, and high CCN concentrations in the marine boundary layer (MBL). Later flights (RF08–RF12) show distinct layering in the plume, a higher plume cap altitude, and lower MBL concentrations. Hereafter we focus on aerosol concentrations in the MBL, being the relevant aerosol providing CCN for BL cloud formation. A summary of the MBL aerosol concentrations, CCN-derived κ (averaged over all the supersaturations measured), and characteristic vertical updraft velocity (w∗) is provided for all flights in Table 1. Flights are classified according to the observed MBL aerosol concentrations from the UHSAS into categories defined, for the purposes of this work, as polluted (exceeding 800 cm−3), intermediate (500–800 cm−3), and clean (below 500 cm−3). MBL aerosol concentration is higher earlier on in August and decreases as the mission progresses. The average CCN-derived κ for the MBL aerosol is fairly consistent, ranging from 0.2 to 0.4, and agrees well with the κ estimated from the bulk MBL aerosol elemental composition as measured by the aerosol mass spectrometer, implying that the aerosol is chemically uniform throughout the ultrafine-aerosol size range (Fig. S1).
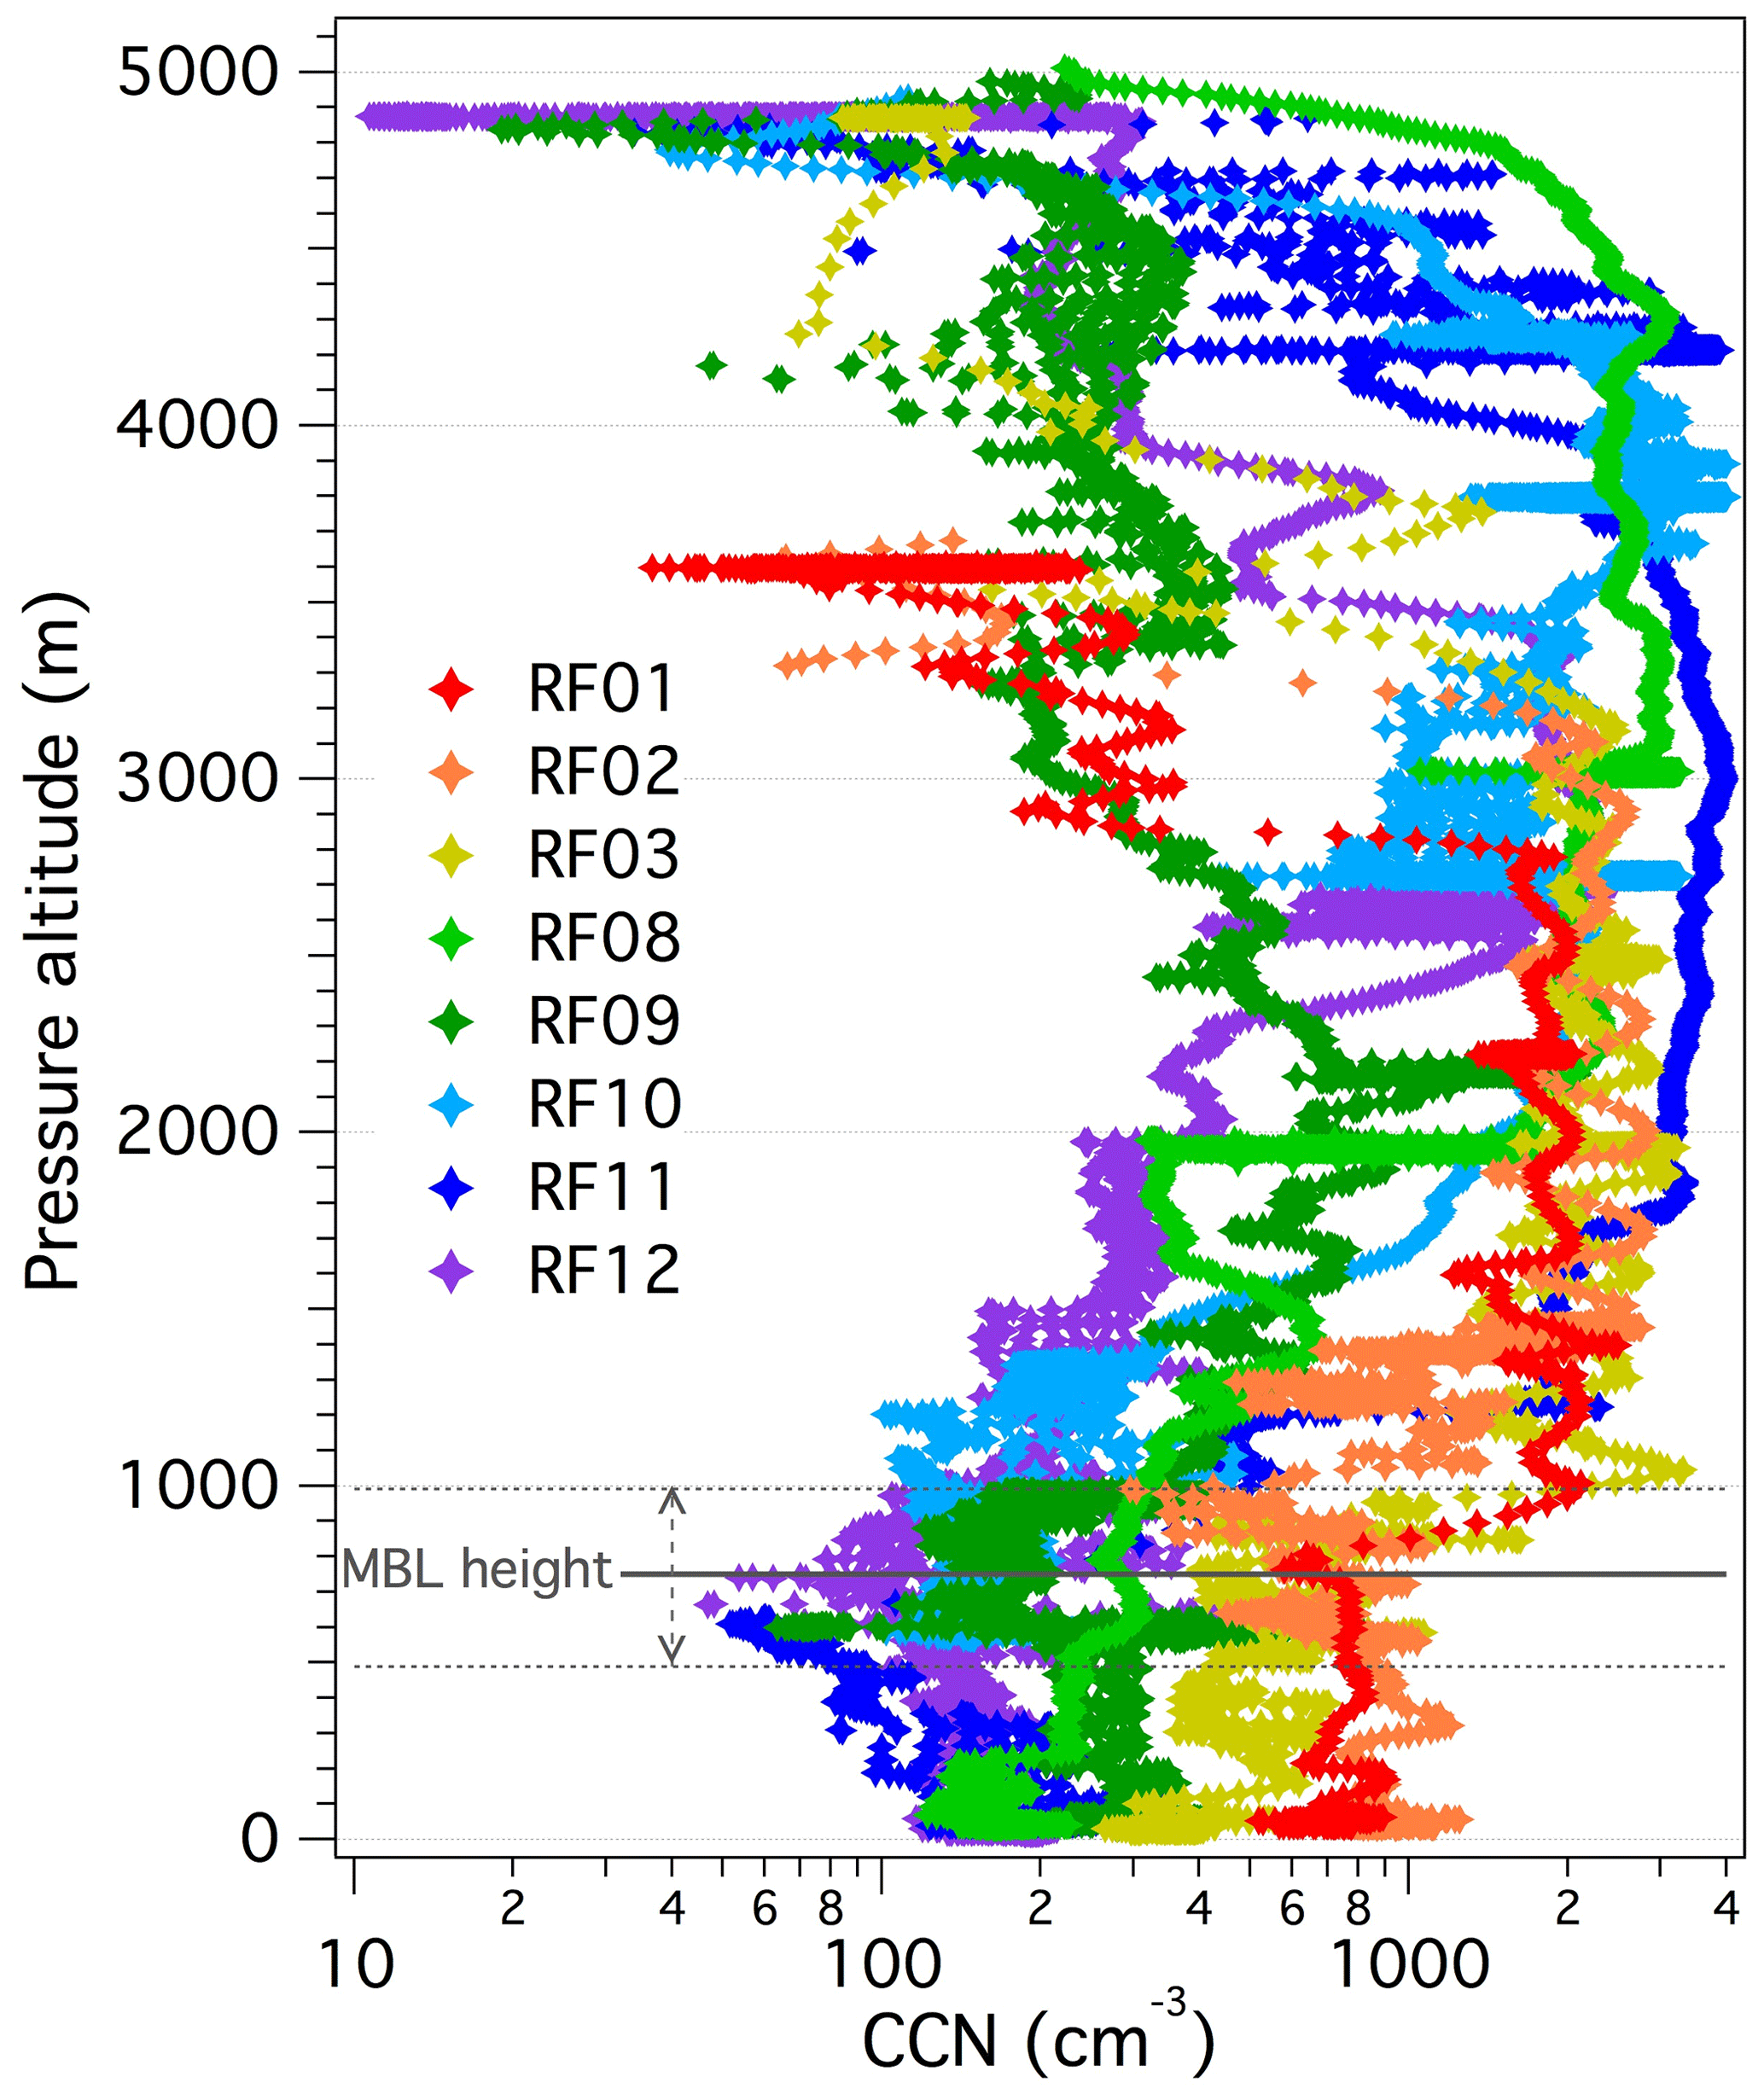
Figure 2Vertical profiles (altitude in meters) of CCN concentration (cm−3) from 0.1 to 0.4 % supersaturation for all flights in this work.
Characteristic vertical updrafts are higher earlier in August, averaging 0.4 ms−1, and decrease to around 0.3 ms−1 later in the campaign. A decrease in MBL aerosol concentration is also seen during this time, with earlier flights seeing aerosol concentrations reaching up to 1000 cm−3 and later decreasing to 200 cm−3. The average BB plume aerosol concentrations aloft range from around 1250 to 3000 cm−3 but show no distinct trends throughout the month. However, an interesting trend can be found in comparing the altitudes of the bottom of the BB plume and the top of the MBL cloud deck with the characteristic vertical updraft velocities: a lower w∗ of 0.3 ms−1 coincides with an observation of a clean, low-aerosol gap between the top of the MBL clouds and the bottom of the BB plume. In higher w∗ flights (0.4 ms−1), the BB plume extends all the way down to the top of the MBL cloud layers. In these flights, the BB plume is observed to have one single well-mixed layer throughout, while the later flights ( ms−1) are characterized by two distinct layers in the plume.
3.2 Predicted droplet number and maximum supersaturation
Figure 3a presents the predicted droplet number (Nd) and CCN (at 0.1 % supersaturation) as a function of total aerosol concentration (Na) for the marine-boundary-layer (MBL) legs of all flights. Above an aerosol concentration of ∼600 cm−3, droplet number concentration becomes progressively less responsive to further increases in CCN number (as the incremental change in Nd is less as CCN increases) and becomes effectively insensitive () for an aerosol concentration exceeding ∼1000 cm−3. The reason behind this increasing insensitivity can be seen in Fig. 3b, which presents Nd against Na for all the MBL leg data; the data are colored by supersaturation. For low values of Na and Nd (∼200 cm−3), Smax tends to be high (just over 0.2 %) and the response of Nd to increases in aerosol is strong. However, when transitioning from clean to intermediate MBL conditions, Nd is less sensitive to increases in aerosol because Smax decreases and mitigates some of the expected droplet number response. Upon reaching polluted conditions (>800 cm−3), the decrease in Smax is even stronger, entering into a regime where any additional aerosol can no longer substantially augment cloud droplets, owing to the extreme competition of the high CCN concentrations for water vapor. This water-vapor-limited regime occurs when the Smax is less than 0.1 % (Fig. 3b); given that water vapor availability is generated through expansion cooling in updrafts, this type of limitation is also known as the updraft-limited regime of droplet formation (Ruetter et al., 2009).

Figure 3(a) The predicted droplet number (Nd; cm−3) and measured CCN (cm−3) at 0.1 % supersaturation as functions of marine-boundary-layer aerosol concentration (Na; cm−3) for all flights. (b) Nd against Na in the MBL for all flights, colored by maximum in-cloud supersaturation (Smax).
3.3 Droplet number sensitivity
The previous section pointed out the variable sensitivity of the droplet number to aerosol perturbations, depending on the conditions of cloud formation. To further explore such issues, we explicitly calculate the sensitivities (partial derivatives) of the droplet number in the MBL to changes in the aerosol number, characteristic vertical updraft velocity, and CCN activity, computed by the parameterization using a finite-difference approximation. This is shown in Fig. 4 for (Fig. 4a), (Fig. 4b), and (Fig. 4c). Results are shown for three flights, corresponding to each pollution class of Table 1: polluted (RF02), intermediate (RF09), and clean (RF10). Sensitivity of the droplet number to total aerosol concentration () is fairly comparable between the two lower-concentration conditions and approaches insensitivity () when the total aerosol concentration exceeds 1000 cm−3. Maximum in-cloud supersaturation decreases steadily as Na increases, and appreciably decreases when Smax drops below 0.12 % (Fig. 4a).
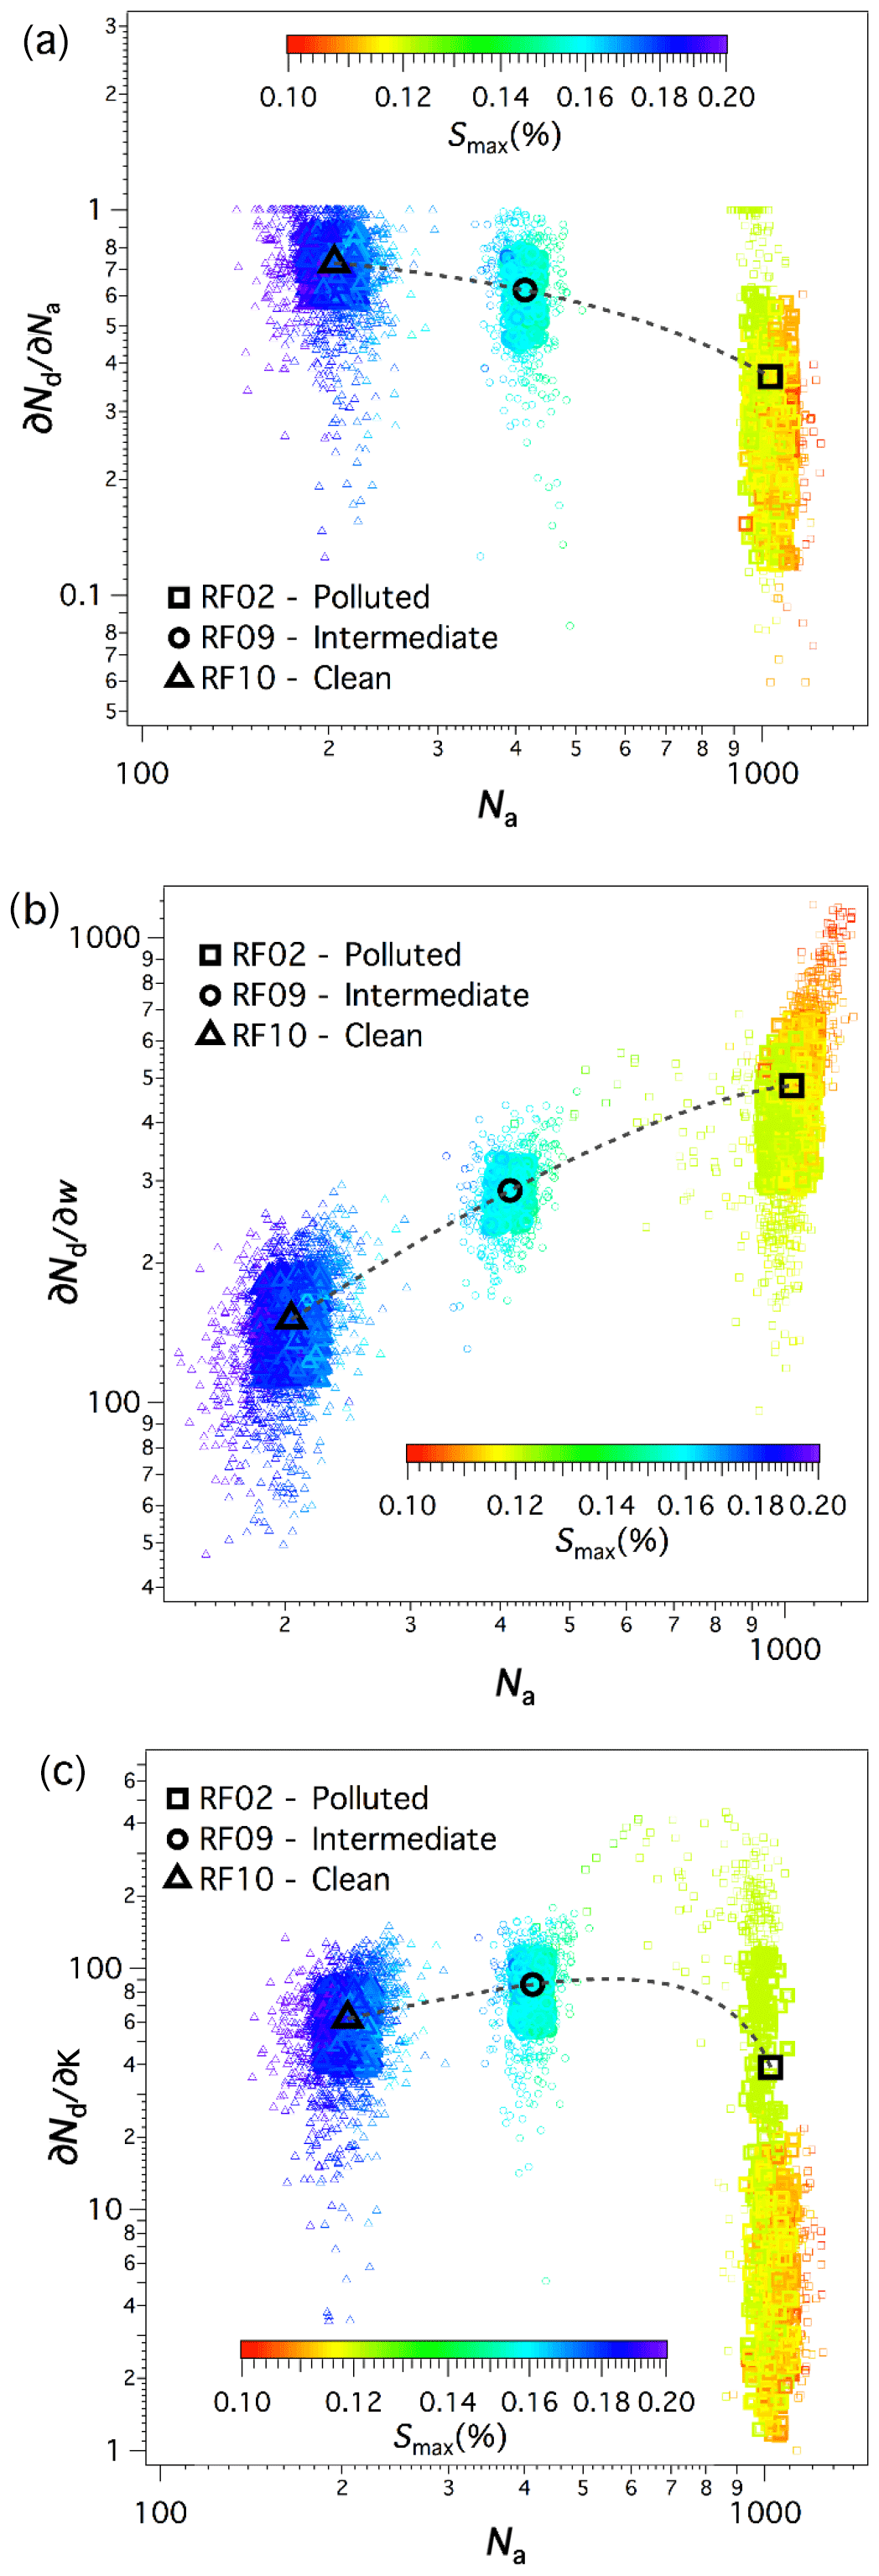
Figure 4The sensitivity of the droplet number to (a) aerosol number (), (b) characteristic velocity (), and (c) hygroscopicity parameter () as functions of Na (cm−3). The data are clustered using the polluted, intermediate, and clean groupings of Table 1.
As decreases with increasing levels of aerosol, droplet sensitivity to vertical updraft velocity, , becomes increasingly important and completely dominates droplet variability for high aerosol numbers. The reason why droplets become so sensitive to vertical-velocity fluctuations under polluted conditions is because vertical velocity drives supersaturation generation; at low supersaturation, when there is very strong competition for water vapor from the many CCN present (velocity-limited regime), any increase in vertical velocity augments supersaturation and the droplet number. For low CCN concentrations, however, supersaturation is high so that fluctuations in aerosol translate to an almost equal response in the droplet number (; Fig. 4a); therefore fluctuations in vertical velocity, hence supersaturation, do not affect the droplet number ( small). The low MBL aerosol concentrations lead to the highest sensitivity of Nd to Na (approaching 100 %), creating an aerosol-limited condition where there is sufficient available supersaturation to activate virtually every aerosol added to the MBL layer. A increase in Na leads to a ∼50 % decrease in the sensitivity of Nd to Na to around 40 %, with the highest aerosol values corresponding to even lower sensitivities to the aerosol number, approaching below 10 % and demonstrating behavior clearly consistent with a velocity-limited regime.
Predicted droplet sensitivity to κ displays a unique trend (Fig. 4c), becoming stronger initially with increasing aerosol, peaking at intermediate concentrations and then rapidly dropping towards insensitivity, when supersaturation approaches 0.1 %. This sudden insensitivity to CCN activity aligns with the clouds being overseeded when supersaturation is starting to be depleted; once supersaturation is not as readily available, any characteristics of the aerosol cease to play a strong role in activation. However, prior to reaching the point of being insensitive to aerosol, increased sensitivity to κ is opposite to the expected trend from Na – indicating that the fluctuation in chemical composition, when droplet formation is in a competitive regime (Fig. 4c), may be an important contributor to droplet formation – consistent with the findings of Bougiatioti et al. (2017) for droplet formation in an urban environment in the eastern Mediterranean region. We emphasize here that the sensitivity to κ (Fig. 4c) is not from its changes in terms of size (which we show above to be small) but rather changes over space and time.
Impact of boundary layer turbulence
Throughout the entirety of flights, the maximum predicted droplet number reaches a plateau, where additional aerosol does not result in any significant increase in Nd. An example of this behavior is presented in Fig. S4 (where data of calculated Nd are presented for the entire research flight, as opposed to only the segments in the MBL shown in previous sections). This plateau, owing to the development of strong water vapor limitations, is termed the limiting droplet number, , and should largely be a function of vertical velocity – precisely because we are in a velocity-limited regime. This realization implies that much of the droplet number variability (measured or retrieved) in clouds strongly influenced by BB plumes reflects the underlying shifts in cloud dynamics associated with each concentration regime. Indeed, the characteristic velocity in the MBL tends to increase as the MBL clouds become progressively polluted (Fig. 5); the most polluted flights (RF01 and RF02) both fall in mid-August and are coincident with a higher characteristic vertical updraft velocity of ∼0.4, while clean MBL flights coincide with lower vertical-updraft-velocity values of ∼0.3 and occur towards the end of August. Intermediate-scenario flights are divided between the two characteristic vertical updraft velocities observed. When the flight-specific characteristic velocity is then used to calculate the droplet response, it follows a trend with aerosol levels that magnifies droplet response from what is expected by increasingly adding pollution alone. In contrast, the aerosol concentration above the MBL is inversely correlated with w∗ (Fig. 5), possibly a result of enhanced mixing between the MBL and the free troposphere (rich in BB aerosol) that is associated with the elevated levels of turbulence (w∗).
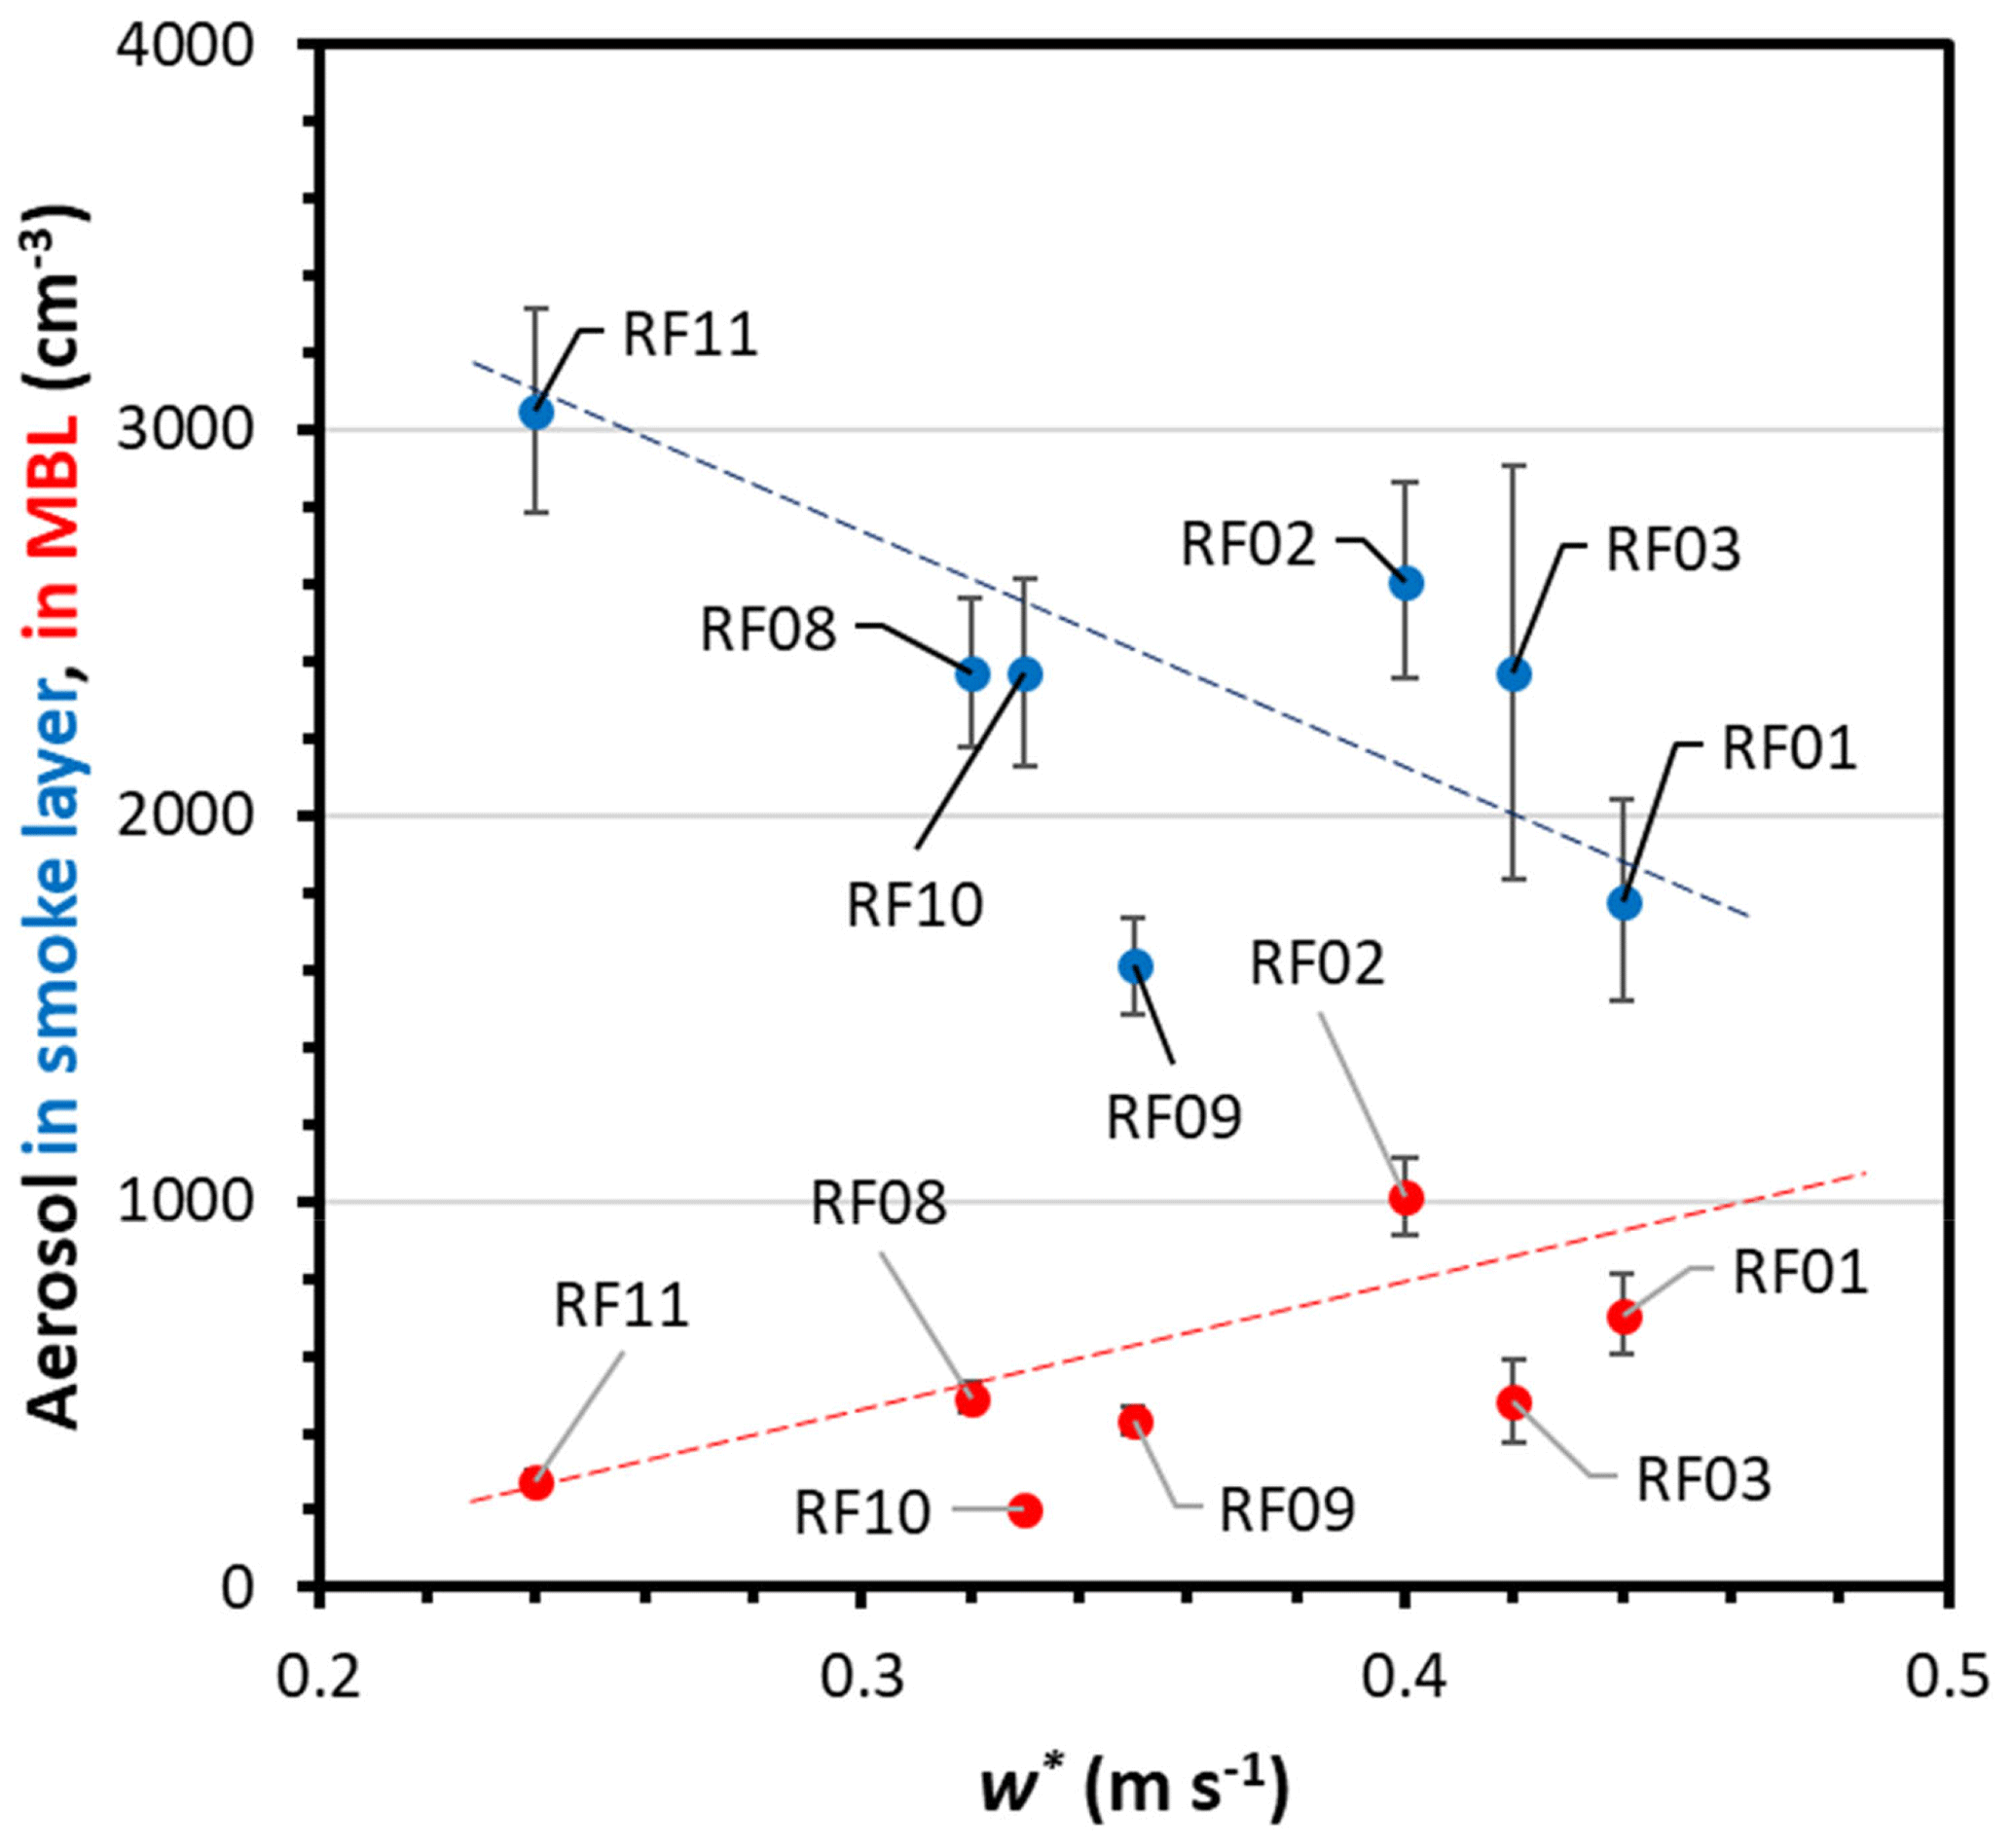
Figure 5Characteristic velocity, w∗, in the MBL as a function of Na (cm−3) in the BBOA plume (blue) and in the MBL (red), for each flight.
The impact of increased w* on the droplet number is shown for polluted, intermediate and clean conditions in the inset plot of Fig. 6 – which shows for each concentration class for w∗ between 0.1 and 0.6 ms−1. For polluted conditions, transitioning from 0.3 to 0.4 ms−1 increases the droplet number from 400 to 500 cm−3, which is a 20–25 % increase. The enhancement is equally important for intermediate and clean conditions (although less in terms of absolute number) and always comparable to droplet enhancements from changes in BB concentration.
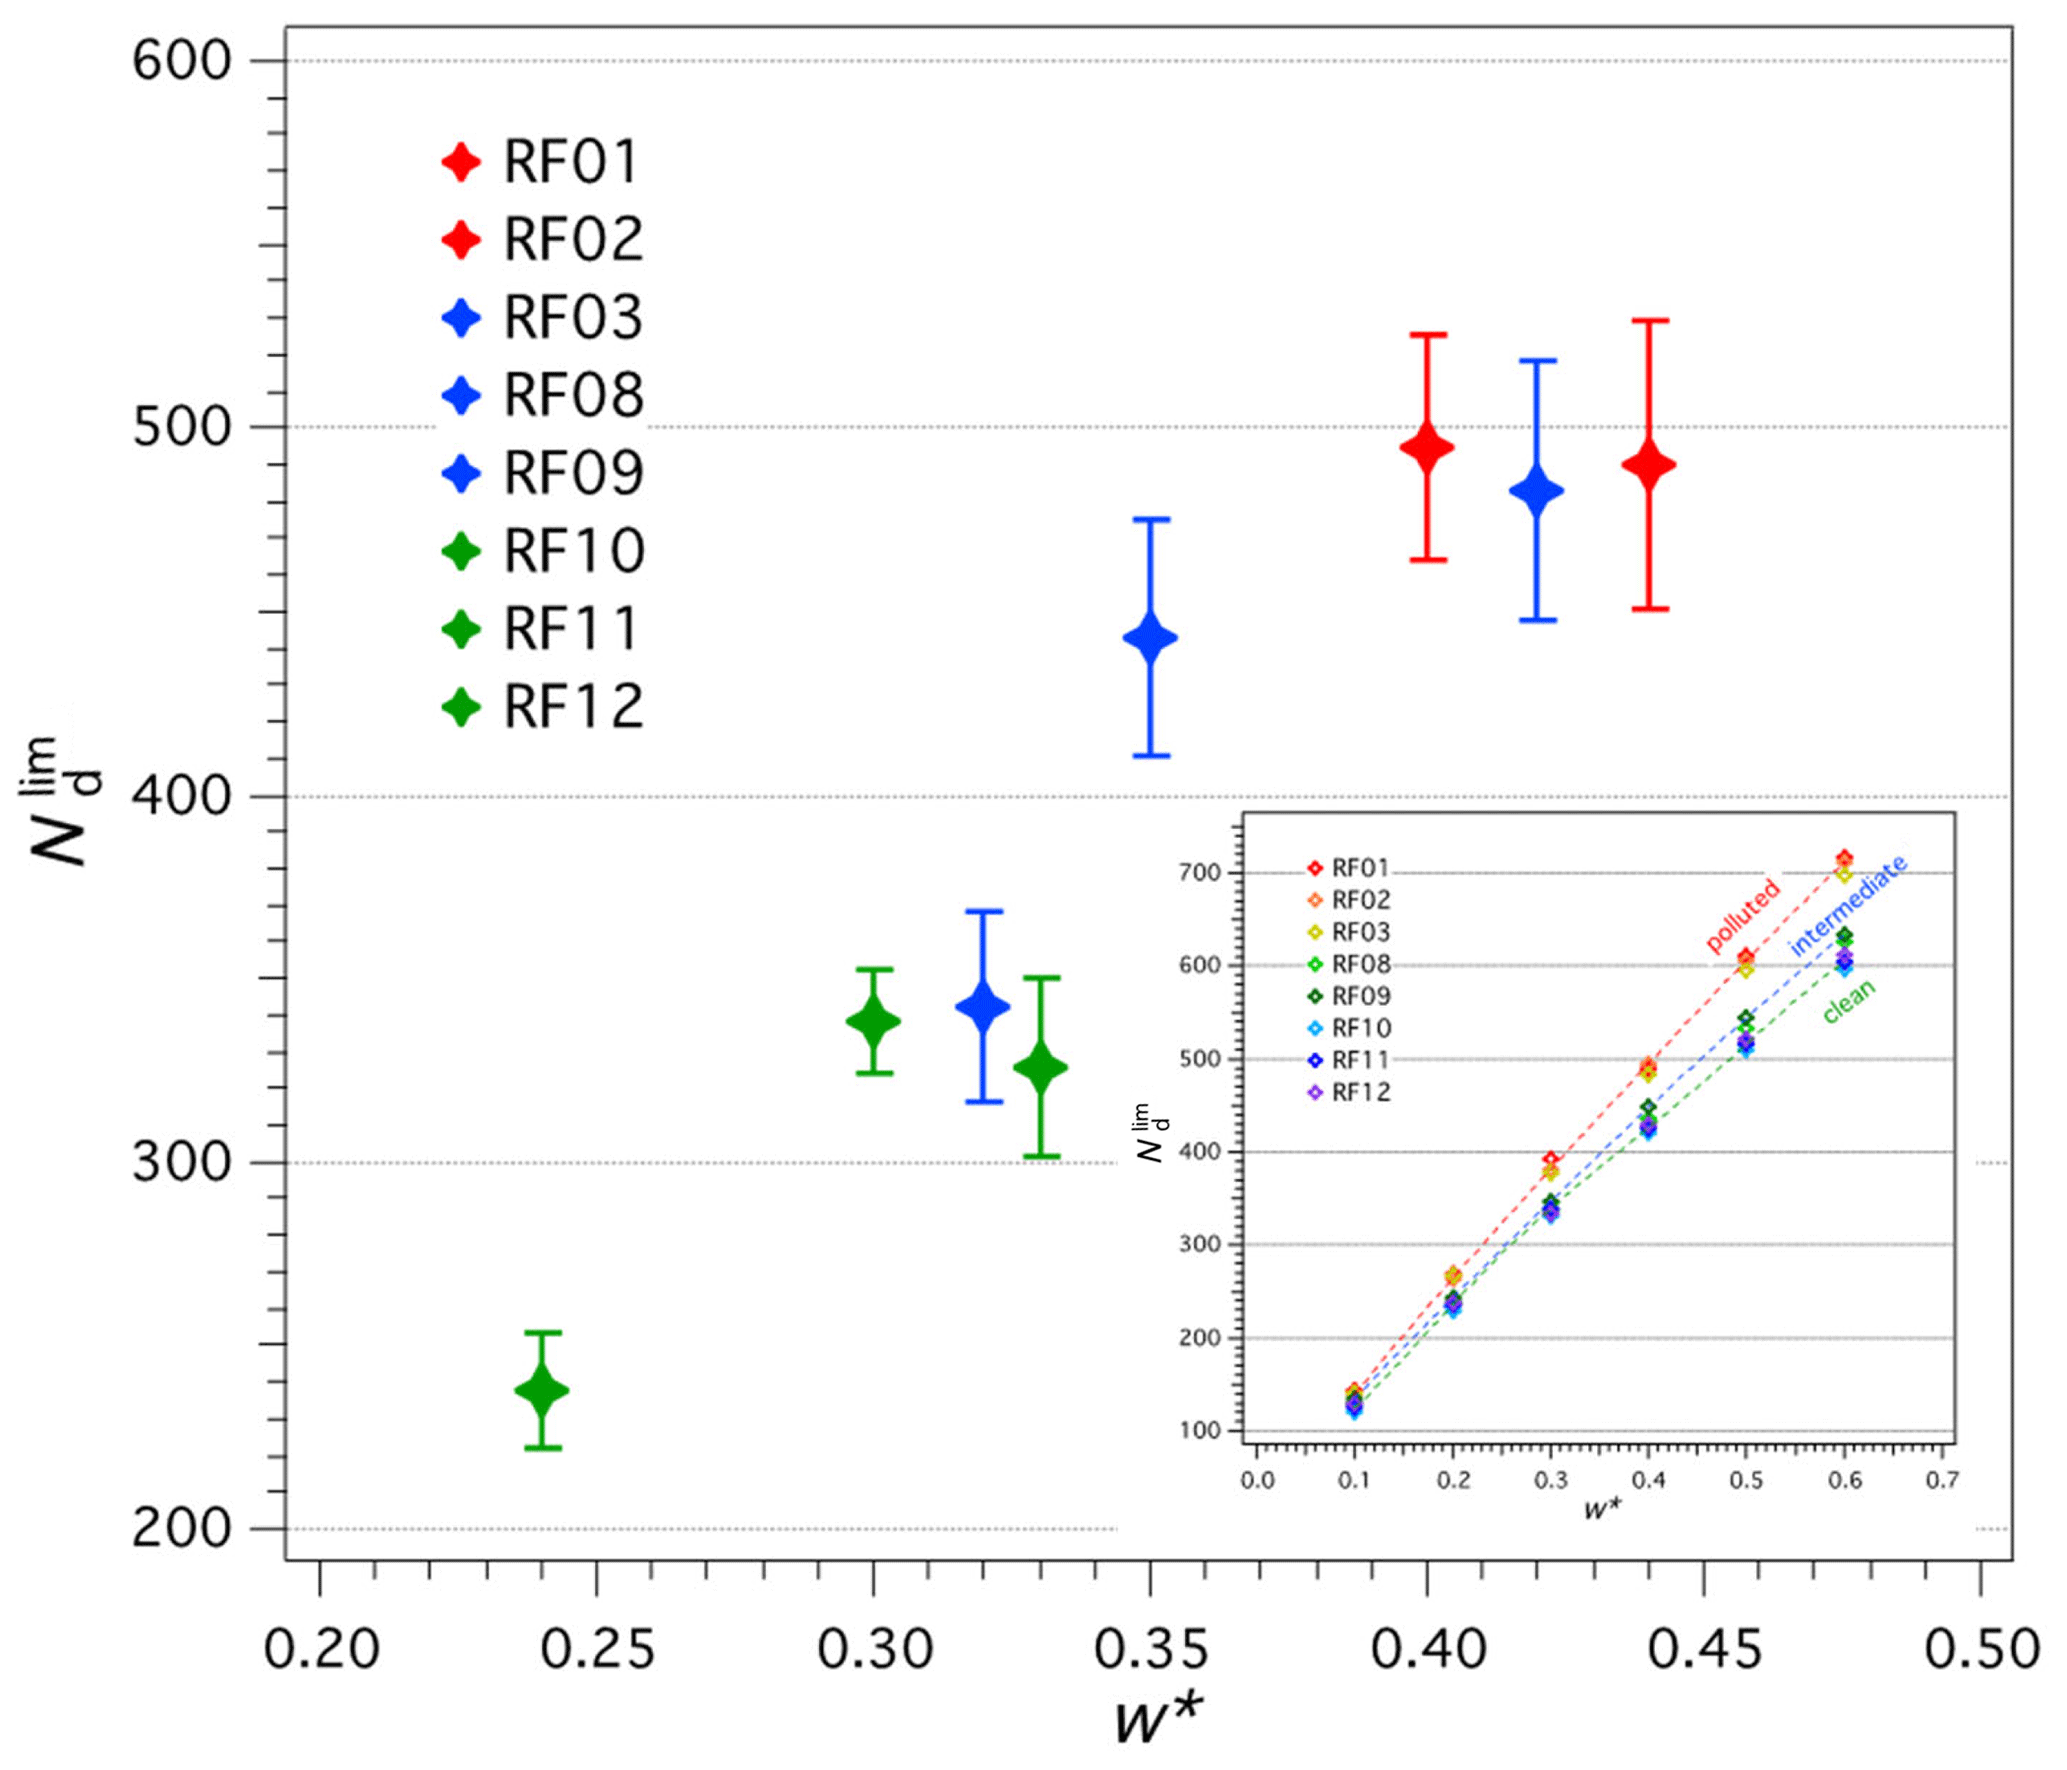
Figure 6 (cm−3) for each flight as a function of characteristic vertical updraft velocity, w∗ (ms−1). Flights are colored by polluted, intermediate, and clean categories, as defined by MBL concentration. The inset also presents the asymptotic activated droplet number (; cm−3) for w∗ ranging from 0.1 to 0.6 ms−1.
3.4 Water vapor limitations and the lifetime of BB aerosol in the MBL
Above an aerosol concentration of ∼800 cm−3 when water vapor availability is severely limited, Nd no longer increases in response to increases in CCN (Fig. 3a). An important consequence is that, under such conditions, much of the BBOA (biomass burning organic aerosol) does not activate into cloud droplets and is therefore not lost through wet deposition. Because of this, the degree of water vapor competition (and supersaturation level) is directly related to BB lifetime in the MBL. may then be inversely linked to CCN lifetime, where velocity-limited conditions, characterized by the smallest droplet activation fraction and , also have the largest lifetime and vice versa for clean MBL conditions.
BB aerosol levels in the SEA varied considerably throughout the 2017 ORACLES deployment. Earlier in the campaign, high aerosol concentrations were observed in the MBL (800–1000 cm−3), which decreased midcampaign to concentrations between 500–800 cm−3, and in late August and early September, relatively clean MBL conditions were seen (<500 cm−3). On 12–13 August, MBL aerosol concentrations exceeded 1000 cm−3. From the observed aerosol size distribution and CCN concentrations, we constrained the aerosol hygroscopicity – which was in agreement with estimates from bulk chemical composition measurements; together with observed MBL vertical-velocity distributions, we then calculated droplet number concentrations using a state-of-the-art droplet activation parameterization. Droplet closure was achieved within 20 %, consistent with the degree of closure achieved in past studies.
From the analysis of the dataset, when aerosol concentrations exceed ∼900 cm−3 and maximum supersaturation approaches 0.1 %, droplet formation in the MBL begins to enter a velocity-limited droplet activation regime, where the cloud droplet number responds weakly to CCN concentration increases. Lower MBL concentrations (500 cm−3 or less) were observed later in the campaign (late August to early September), thus leading to a much higher predicted Smax of 0.2 % and much higher fraction of activated CCN. Under clean conditions, vertical velocity generates ample supersaturation, so droplet formation is limited by the number of aerosol particles in the MBL. Overall this leads to a buffering of the Nd response to aerosol, so that Nd variability is much less (down to 1∕10 or less) than that seen for the underlying CCN.
Droplet formation sensitivity to aerosol concentration; vertical updraft velocity; and the hygroscopicity parameter, κ, vary and contribute to the total droplet response in the MBL clouds. Droplet sensitivity to vertical velocity increases by an order of magnitude as aerosol concentration reaches 1000 cm−3. This highlights the increased (and eventually dominant) role that vertical velocity plays in droplet formation in a polluted MBL environment. Below ∼500 cm−3, in a clean MBL, droplet formation is much more sensitive to changes in aerosol concentration than to the observed changes in vertical updrafts. In the competitive regime, where the MBL has intermediate pollution (500–800 cm−3), hygroscopicity (κ) variations emerge as an important driver of droplet number variability, which is something not seen for either clean or polluted MBL conditions. Throughout the month of August, a shift is observed in w∗, from ∼0.45 m s−1 down to ∼0.26 m s−1, which affects the maximum droplet number that can be generated in the MBL. is significantly affected by changes in w∗, especially in higher MBL pollution conditions, where the effects of increased characteristic vertical updraft velocity significantly magnify droplet number concentrations compared to trends seen in intermediate and clean MBL environments.
Identifying regimes where droplet number variability is primarily driven by updraft velocity changes and not by aerosol concentration is key for interpreting aerosol indirect effects. This is particularly important when using remote sensing data, as can be seen from the data here; diagnosing aerosol indirect effects using above-cloud aerosol would give opposite trends from what actually occurs in the MBL – because BB plume aerosol decreases as the MBL aerosol increases. Nevertheless, the correlations here between above-cloud and MBL aerosol level might be a useful way to diagnose MBL aerosol – from which Nd can eventually be determined. Furthermore, when the droplet number is in the velocity-limited regime, Nd responds proportionally to changes in w∗, offering the possibility of remote sensing of w∗ under these specific conditions (specific criteria need to be developed to help define when velocity-limited conditions occur, e.g., combining collocated in situ and remote sensing data from field intensives).
Very interesting are the trends observed between MBL dynamics, height, and the aerosol levels in the MBL and the BB plume. The w∗ is higher earlier in August and decreases later in the campaign; MBL aerosol concentration correlates with w∗, while an inverse correlation is seen for the aerosol in the BB plume above the MBL. A similarly interesting trend can be found between w∗, the base altitude of the BB plume, and the top of the MBL cloud deck: higher w∗ corresponds to a BB plume that extends down to the top of the MBL cloud layers, while lower w∗ is characterized by two distinct layers in the plume. Although what drives these correlations is not fully understood, it is likely related to the seasonality of the MBL height and its role in regulating mixing between the MBL and aloft (also discussed in Zhang et al., 2019). Indeed, the atmosphere is likely less stable in August, encouraging more buoyant parcels (hence larger w∗) than in September. The w∗ enhancement may also result from enhanced cloud-top radiative cooling driven by liquid water content (LWC) changes between the early and later flights of the campaign; the nearly 3-fold increase in the cloud droplet number and the expected LWC response, however, suggest that clouds may actually be thinner (Painemal and Zuidema, 2010; Wood et al., 2012; de Szoeke et al., 2018). Water vapor in the free troposphere (FT), which is strongly correlated with smoke occurrence in the FT, would also reduce the longwave emission from the top of the stratocumulus and thereby reduce the turbulent driving of the planetary boundary layer (PBL). Water vapor in the outflow layers is driven by the proximity of the continental PBL to the warm continental surface with enhanced evaporation and is not related to aerosol processes. Absorption of solar radiation from black carbon in the MBL may also suppress turbulence and w∗ (Wilcox et al., 2016), although our data suggest these effects may not be strong enough to reverse the trend imposed by any MBL seasonality. A thorough attribution of the link between w∗, aerosol, MBL structure, and the large scale remains to be carried out, though results here suggest simple thresholds on these variables could help models determine how to treat droplet activation in different scenarios.
Although BB aerosol variations can profoundly impact cloud microphysical characteristics, concurrent variations in vertical velocity must also be considered to fully understand the drivers of droplet variability, especially when used to evaluate models and estimates of aerosol–cloud–climate interactions. The small activation fraction of aerosols under polluted MBL conditions may promote the persistence of aerosol for longer in the MBL, extending the reach and influence of BB aerosol in the SEA.
The droplet parameterization used for the calculations in the study is available from athanasios.nenes@epfl.ch upon request. ORACLES mission data can be downloaded from https://espoarchive.nasa.gov/archive/browse/oracles (NASA, 2020).
The supplement related to this article is available online at: https://doi.org/10.5194/acp-20-3029-2020-supplement.
MK and AN conceptualized the study and devised the methodology; software was developed by AN; formal analysis was conducted by MK, AN, and SH; investigation was carried out by MK and AN; the original draft was written by MK and AN; all authors contributed to reviewing and editing the paper.
The authors declare that they have no conflict of interest.
This article is part of the special issue “New observations and related modelling studies of the aerosol–cloud–climate system in the Southeast Atlantic and southern Africa regions (ACP/AMT inter-journal SI)”. It is not associated with a conference.
Mary Kacarab and Athanasios Nenes gratefully acknowledge funding from NASA ORACLES, grant no. NNX15AL68G, and the European Research Council CoG-2016 project PyroTRACH (grant no. 726165) funded by H2020-EU.1.1. – Excellent Science. All other authors acknowledge support from the NASA EVS-2 program for their individual ORACLES grants.
This paper was edited by J.M. Haywood and reviewed by two anonymous referees.
Adebiyi, A. A. and Zuidema, P.: The role of the southern African easterly jet in modifying the southeast Atlantic aerosol and cloud environments, Q. J. Roy. Meteor. Soc., 142, 1574–1589, https://doi.org/10.1002/qj.2765, 2016.
Andela, N., Morton, D. C., Giglio, L., Chen, Y., van der Werf, G. R., Kasibhatla, P. S., DeFries, R. S., Collatz, G. J., Hantson, S., Kloster, S., Bachelet, D., Forrest, M., Lasslop, G., Li, F., Mangeon, S., Melton, J. R., Yue, C., and Randerson, J. T.: A human-driven decline in global burned area, Science, 356, 6345, 1356–1362, https://doi.org/10.1126/science.aal4108, 2017.
Barahona, D., West, R. E. L., Stier, P., Romakkaniemi, S., Kokkola, H., and Nenes, A.: Comprehensively accounting for the effect of giant CCN in cloud activation parameterizations, Atmos. Chem. Phys., 10, 2467–2473, https://doi.org/10.5194/acp-10-2467-2010, 2010.
Bond, T. C., Doherty, S. J., Fahey, D. W., Forster, P. M., Berntsen, T., DeAngelo, B. J., Flanner, M. G., Ghan, S., Kärcher, B., Koch, D., Kinne, S., Kondo, Y., Quinn, P. K., Sarofim, M. C., Schultz, M. G., Schulz, M., Venkataraman, C., Zhang, H., Zhang, S., Bellouin, N., Guttikunda, S. K., Hopke, P. K., Jacobson, M. Z., Kaiser, J. W., Klimont, Z., Lohmann, U., Schwarz, J. P., Shindell, D., Storelvmo, T., Warren, S. G., and Zender, C. S.: Bounding the role of black carbon in the climate system: A scientific assessment, J. Geophys. Res., 118, 5380– 5552, https://doi.org/10.1002/jgrd.50171, 2013.
Boucher, O., Randall, D., Artaxo, P., Bretherton, C., Feingold, G., Forster, P., Kerminen, V.-M., Kondo, Y., Liao, H., Lohmann, U., Rasch, P., Satheesh, S. K., Sherwood, S., Stevens, B., and Zhang, X. Y.: Clouds and aerosols. in: Climate Change 2013: The Physical Science Basis. Contribution of Working Group I to the Fifth Assessment Report of the Intergovernmental Panel on Climate Change edited by: Stocker, T. F., Qin, D., Plattner, G.-K., Tignor, M., Allen, S. K., Doschung, J., Nauels, A., Xia, Y., Bex, V., and Midgley, P. M., Cambridge University Press, UK, New York, NY, USA, pp. 571–657, https://doi.org/10.1017/CBO9781107415324.016, 2013.
Bougiatioti, A., Bezantakos, S., Stavroulas, I., Kalivitis, N., Kokkalis, P., Biskos, G., Mihalopoulos, N., Papayannis, A., and Nenes, A.: Biomass-burning impact on CCN number, hygroscopicity and cloud formation during summertime in the eastern Mediterranean, Atmos. Chem. Phys., 16, 7389–7409, https://doi.org/10.5194/acp-16-7389-2016, 2016.
Bougiatioti, A., Argyrouli, A., Solomos, S., Vratolis, S., Eleftheriadis, K., Papayannis, A., and Nenes, A.: CCN Activity, Variability and Influence on Droplet Formation during the HygrA-Cd Campaign in Athens, Atmosphere, 8, 108, https://doi.org/10.3390/atmos8060108, 2017.
DeCarlo, P. F., Kimmel, J. R., Trimborn, A., Northway, M. J., Jayne, J. T., Aiken, A. C., Gonin, M., Fuhrer, K., Horvath, T., Docherty, K., Worsnop, D. R., and Jimenez, J. L.: Field-Deployable, High-Resolution, Time-of-Flight Aerosol Mass Spectrometer, Anal. Chem., 78, 8281–8289, 2006.
de Szoeke, S. P., Verlinden, K. L., and Covert, D.: Cloud-scale droplet number sensitivity to liquid water path in marine stratocumulus, J. Geophys. Res., 123, 5320–5334, https://doi.org/10.1029/2017JD027508, 2018.
Fanourgakis, G. S., Kanakidou, M., Nenes, A., Bauer, S. E., Bergman, T., Carslaw, K. S., Grini, A., Hamilton, D. S., Johnson, J. S., Karydis, V. A., Kirkevåg, A., Kodros, J. K., Lohmann, U., Luo, G., Makkonen, R., Matsui, H., Neubauer, D., Pierce, J. R., Schmale, J., Stier, P., Tsigaridis, K., van Noije, T., Wang, H., Watson-Parris, D., Westervelt, D. M., Yang, Y., Yoshioka, M., Daskalakis, N., Decesari, S., Gysel-Beer, M., Kalivitis, N., Liu, X., Mahowald, N. M., Myriokefalitakis, S., Schrödner, R., Sfakianaki, M., Tsimpidi, A. P., Wu, M., and Yu, F.: Evaluation of global simulations of aerosol particle and cloud condensation nuclei number, with implications for cloud droplet formation, Atmos. Chem. Phys., 19, 8591–8617, https://doi.org/10.5194/acp-19-8591-2019, 2019.
Fountoukis, C. and Nenes, A.: Continued development of a cloud droplet formation parameterization for global climate models, J. Geophys. Res., 110, D11212, https://doi.org/10.1029/2004JD005591, 2005.
Fountoukis, C., Nenes, A., Meskhidze, N., Bahreini, R., Brechtel, F., Conant, W. C., Jonsson, H., Murphy, S., Sorooshian, A., Varutbangkul, V., Brechtel, F., Flagan, R. C., and Seinfeld, J. H.: Aerosol–cloud drop concentration closure for clouds sampled during ICARTT, J. Geophys. Res., 112, D10S30, https://doi.org/10.1029/2006JD007272, 2007.
Garstang, M., Tyson, P. D., Swap, R., Edwards, M., Kållberg, P., and Lindesay, J. A.: Horizontal and vertical transport of air over southern Africa, J. Geophys. Res., 101, 23721–23736, https://doi.org/10.1029/95JD00844, 1996.
Ghan, S. J., Abdul-Razzak, H., Nenes, A., Ming, Y., Liu, X., Ovchinnikov, M., Shipway, B., Meskhidze, N., Xu, J., and Shi, X.: Droplet nucleation: Physically-based parameterizations and comparative evaluation, J. Adv. Model. Earth Syst., 3, M10001, https://doi.org/10.1029/2011MS000074, 2011.
Grosvenor, D. P., Sourdeval, O.,Zuidema, P., Ackerman, A.,Alexandrov, M. D., Bennartz, R., Boers, R., Cairns, B., Chiu, J. C., Christensen, M., Deneke, H., Diamond, M., Feingold, G., Fridlind, A., Hünerbein, A., Knist, C., Kollias, P., Marshak, A., McCoy, D., Merk, D., Painemal, D., Rausch, J., Rosenfeld, D., Russchenberg, H., Seifert, P., Sinclair, K., Stier, P., van Diedenhoven, B., Wendisch, M., Werner, F., Wood, R., Zhang, Z., and Quaas, J.: Remote sensing of droplet number concentration in warm clouds: A review of the currentstate of knowledge and perspectives, Rev. Geophys., 56, 409–453, https://doi.org/10.1029/2017RG000593, 2018.
IPCC: Climate Change 2013: The Physical Science Basis. Contribution of Working Group I to the Fifth Assessment Report of the Intergovernmental Panel on Climate Change, edited by: Stocker, T. F., Qin, D., Plattner, G.-K., Tignor, M., Allen, S. K., Boschung, J., Nauels, A., Xia, Y., Bex, V., and Midgley, P. M., Cambridge University Press, Cambridge, UK and New York, NY, USA, 1535 pp., https://doi.org/10.1017/CBO9781107415324, 2013.
Kalkavouras, P., Bougiatioti, A., Kalivitis, N., Stavroulas, I., Tombrou, M., Nenes, A., and Mihalopoulos, N.: Regional new particle formation as modulators of cloud condensation nuclei and cloud droplet number in the eastern Mediterranean, Atmos. Chem. Phys., 19, 6185–6203, https://doi.org/10.5194/acp-19-6185-2019, 2019.
Kohler, H.: The nucleus in and the growth of hygroscopic droplets, Trans. Faraday Soc., 32, 1152–1161, 1936.
Lance, S., Brock, C. A., Rogers, D., and Gordon, J. A.: Water droplet calibration of the Cloud Droplet Probe (CDP) and in-flight performance in liquid, ice and mixed-phase clouds during ARCPAC, Atmos. Meas. Tech., 3, 1683–1706, https://doi.org/10.5194/amt-3-1683-2010, 2010.
Lathem, T. L., Beyersdorf, A. J., Thornhill, K. L., Winstead, E. L., Cubison, M. J., Hecobian, A., Jimenez, J. L., Weber, R. J., Anderson, B. E., and Nenes, A.: Analysis of CCN activity of Arctic aerosol and Canadian biomass burning during summer 2008, Atmos. Chem. Phys., 13, 2735–2756, https://doi.org/10.5194/acp-13-2735-2013, 2013.
Lenschow, D. H. (Ed.): Probing the Atmospheric Boundary Layer, Amer. Meteorol. Soc., Boston, MA, USA, 1986.
McNaughton, C. S., Clarke, A. D., Howell, S. G., Pinkerton, M., Anderson, B., Thornhill, L., Hudgins, C., Winstead, E., Dibb, J. E., Scheuer, E., and Maring, H.: Results from the DC-8 Inlet Characterization Experiment (DICE): Airborne Versus Surface Sampling of Mineral Dust and Sea Salt Aerosols, Aerosol. Sci. Tech., 41, 136–159, https://doi.org/10.1080/02786820601118406, 2007.
Meskhidze, N., Nenes, A., Conant, W. C., and Seinfeld, J. H.: Evaluation of a new Cloud Droplet Activation Parameterization with In Situ Data from CRYSTAL-FACE and CSTRIPE, J. Geophys. Res., 110, D16202, https://doi.org/10.1029/2004JD005703, 2005.
Meyer, K., Platnick, S., and Zhang, Z.: Simultaneously inferring above-cloud absorbing aerosol optical thickness and underlying liquid phase cloud optical and microphysical properties using MODIS, J. Geophys. Res. Atmos., 120, 5524–5547, https://doi.org/10.1002/2015JD023128, 2015.
Moore, R. H. and Nenes, A.: Scanning Flow CCN Analysis—A Method for Fast Measurements of CCN Spectra, Aerosol. Sci. Tech., 43, 1192–1207, https://doi.org/10.1080/02786820903289780, 2009.
Moore, R. H., Bahreini, R., Brock, C. A., Froyd, K. D., Cozic, J., Holloway, J. S., Middlebrook, A. M., Murphy, D. M., and Nenes, A.: Hygroscopicity and composition of Alaskan Arctic CCN during April 2008, Atmos. Chem. Phys., 11, 11807–11825, https://doi.org/10.5194/acp-11-11807-2011, 2011.
Morales, R. and Nenes, A.: Characteristic updrafts for computing distribution-averaged cloud droplet number and stratocumulus cloud properties, J. Geophys. Res., 115, D18220, https://doi.org/10.1029/2009JD013233, 2010.
Morales, R., Nenes, A., Jonsson, H., Flagan, R. C., and Seinfeld, J. H.: Evaluation of a diabatic droplet activation parameterization using in-situ cloud data, J. Geophys. Res., 116, D15205, https://doi.org/10.1029/2010JD015324, 2011.
Morales Betancourt, R. and Nenes, A.: Understanding the contributions of aerosol properties and parameterization discrepancies to droplet number variability in a global climate model, Atmos. Chem. Phys., 14, 4809–4826, https://doi.org/10.5194/acp-14-4809-2014, 2014.
Myhre, G., Samset, B. H., Schulz, M., Balkanski, Y., Bauer, S., Berntsen, T. K., Bian, H., Bellouin, N., Chin, M., Diehl, T., Easter, R. C., Feichter, J., Ghan, S. J., Hauglustaine, D., Iversen, T., Kinne, S., Kirkevåg, A., Lamarque, J.-F., Lin, G., Liu, X., Lund, M. T., Luo, G., Ma, X., van Noije, T., Penner, J. E., Rasch, P. J., Ruiz, A., Seland, Ø., Skeie, R. B., Stier, P., Takemura, T., Tsigaridis, K., Wang, P., Wang, Z., Xu, L., Yu, H., Yu, F., Yoon, J.-H., Zhang, K., Zhang, H., and Zhou, C.: Radiative forcing of the direct aerosol effect from AeroCom Phase II simulations, Atmos. Chem. Phys., 13, 1853–1877, https://doi.org/10.5194/acp-13-1853-2013, 2013.
NASA: Observations of Aerosols Above Clouds and Their Interactions (ORACLES), available at: https://espoarchive.nasa.gov/archive/browse/oracles, last access: 12 March 2020.
Nenes, A. and Seinfeld, J. H.: Parameterization of cloud droplet formation in global climate models, J. Geophys. Res., 108, 4415, https://doi.org/10.1029/2002JD002911, D14, 2003.
Nenes, A., Ghan, S., Abdul-Razzak, H., Chuang, P. Y., and Seinfeld, J. H.: Kinetic Limitations on Cloud Droplet Formation and Impact on Cloud Albedo, Tellus, 53B, 133–149, 2001.
Petters, M. D. and Kreidenweis, S. M.: A single parameter representation of hygroscopic growth and cloud condensation nucleus activity, Atmos. Chem. Phys., 7, 1961–1971, https://doi.org/10.5194/acp-7-1961-2007, 2007.
Painemal, D. and Zuidema, P.: Microphysical variability in southeast Pacific Stratocumulus clouds: synoptic conditions and radiative response, Atmos. Chem. Phys., 10, 6255–6269, https://doi.org/10.5194/acp-10-6255-2010, 2010.
Raatikainen,T., Nenes,A., Seinfeld, J. H., Morales, R., Moore, R. H., Lathem, T. L., Lance, S., Padro, L. T., Lin, J. J., Cerully, K., Bougiatioti, A., Cozic, J., Ruehl, C., Chuang, P. Y., Anderson, B., Flagan, R. C., Jonsson, H., Mihalopoulos, N., and Smith, J. N.: Worldwide data sets constrain the water vapor uptake coefficient in cloud formation, P. Natl. Acad. Sci. USA, 110, https://doi.org/10.1073/pnas.1219591110, 2013.
Raatikainen, T., Lin, J. J., Cerully, K. M., Lathem, T. L., Moore, R. H., and Nenes, A.: CCN Data Interpretation Under Dynamic Operation Conditions, Aerosol. Sci. Tech., 48, 552–561, https://doi.org/10.1080/02786826.2014.899429, 2014.
Redemann, J., et al.: An overview of the ORACLES (ObseRvations of Aerosols above CLouds and their intEractionS) project: aerosol-cloud-radiation interactions in the Southeast Atlantic basin, in preparation, 2020.
Rissman, T., Nenes, A., and Seinfeld, J. H.: Chemical amplification (or dampening) of the Twomey effect: Conditions derived from droplet activation theory, J. Atmos. Sci., 61, 919–930, 2004.
Reutter, P., Su, H., Trentmann, J., Simmel, M., Rose, D., Gunthe, S. S., Wernli, H., Andreae, M. O., and Pöschl, U.: Aerosol- and updraft-limited regimes of cloud droplet formation: influence of particle number, size and hygroscopicity on the activation of cloud condensation nuclei (CCN), Atmos. Chem. Phys., 9, 7067–7080, https://doi.org/10.5194/acp-9-7067-2009, 2009.
Roberts, G. C. and Nenes, A.: A Continuous-Flow Streamwise Thermal-Gradient CCN Chamber for Atmospheric Measurements, Aerosol. Sci. Tech., 39, 206–221, https://doi.org/10.1080/027868290913988, 2005.
Ross, K. E., Piketh, S. J., Bruintjes, R. T., Burger, R. P., Swap, R. J., and Annegarn, H. J.: Spatial and seasonal variations in CCN distribution and the aerosol-CCN relationship over southern Africa, J. Geophys. Res., 108, 8481, https://doi.org/10.1029/2002JD002384, 2003.
Seager, R., Murtugudde, R., Naik, N., Clement, A., Gordon, N., and Miller, J.: Air–Sea Interaction and the Seasonal Cycle of the Subtropical Anticyclones, J. Climate, 16, 1948–1966, 2003.
Seinfeld, J. H. and Pandis, S. N.: Atmospheric Chemistry and Physics: From Air Pollution to Climate Change, 2nd edn., John Wiley and Sons, New York, 2006.
Seinfeld, J. H., Bretherton, C., Carslaw, K. S., Coe, H., DeMott, P. J., Dunlea, E. J., Feingold, G., Ghan, S., Guenther, A. B., Kahn, R., Kraucunas, I., Kreidenweis, S. M., Molina, M. J., Nenes, A., Penner, J. E., Prather, K. A., Ramanathan, V., Ramaswamy, V., Rasch, P. J., Ravishankara, A. R., Rosenfeld, D., Stephens, G., and Wood, R.: Improving our fundamental understanding of the role of aerosol–cloud interactions in the climate system, P. Natl. Acad. Sci. USA, 113, 5781–5790, https://doi.org/10.1073/pnas.1514043113, 2016.
Spracklen, D. V., Carslaw, K. S., Pöschl, U., Rap, A., and Forster, P. M.: Global cloud condensation nuclei influenced by carbonaceous combustion aerosol, Atmos. Chem. Phys., 11, 9067–9087, https://doi.org/10.5194/acp-11-9067-2011, 2011.
Thornhill, K. L., Anderson, B. E., Barrick, J. D. W., Bagwell, D. R., Friesen, R., and Lenschow, D.: Air motion intercomparison flights during Transport and Chemical Evolution in the Pacific (TRACE-P)/ACE-ASIA, J. Geophys. Res., 108, https://doi.org/10.1029/2002JD003108, 2003.
van der Werf, G. R., Randerson, J. T., Giglio, L., Collatz, G. J., Mu, M., Kasibhatla, P. S., Morton, D. C., DeFries, R. S., Jin, Y., and van Leeuwen, T. T.: Global fire emissions and the contribution of deforestation, savanna, forest, agricultural, and peat fires (19972009), Atmos. Chem. Phys., 10, 11707–11735, https://doi.org/10.5194/acp-10-11707-2010, 2010.
Wilcox, E. M., Thomas, R. M., Praveen, P. S., Pistone, K., Bender, F. A.-M., and Ramanathan, V.: Black carbon suppresses atmospheric turbulence, P. Natl. Acad. Sci. USA, 113, 42, 11794–11799, https://doi.org/10.1073/pnas.1525746113, 2016.
Wood, R., Leon, D., Lebsock, M., Snider, J., and Clarke, A. D.: Precipitation driving of droplet concentration variability in marine low clouds, J. Geophys. Res., 117, D19210, https://doi.org/10.1029/2012JD018305, 2012.
Yamaguchi, T., Feingold, G., Kazil, J., and McComiskey, A.: Stratocumulus to cumulus transition in the presence of elevated smoke layers, Geophys. Res. Lett., 42, 10478–10485, https://doi.org/10.1002/2015GL066544, 2015.
Zhang, J. and Zuidema, P.: The diurnal cycle of the smoky marine boundary layer observed during August in the remote southeast Atlantic, Atmos. Chem. Phys., 19, 14493–14516, https://doi.org/10.5194/acp-19-14493-2019, 2019.
Zhou, X., Ackerman, A. S., Fridlind, A. M., Wood, R., and Kollias, P.: Impacts of solar-absorbing aerosol layers on the transition of stratocumulus to trade cumulus clouds, Atmos. Chem. Phys., 17, 12725–12742, https://doi.org/10.5194/acp-17-12725-2017, 2017.
Zuidema, P., Sedlacek, A. J. III,Flynn, C., Springston, S.,Delgadillo, R., Zhang, J., Aiken, A. C., Koontz, A., and Muradyan, P.: The Ascension Island boundary layer in the remote southeast Atlantic is often smoky, Geophys. Res. Lett., 45, 4456–4465, https://doi.org/10.1002/2017GL076926, 2018.