the Creative Commons Attribution 4.0 License.
the Creative Commons Attribution 4.0 License.
 | 12 Mar 2020
Convective distribution of dust over the Arabian Peninsula: the impact of model resolution
Jennie Bukowski
Susan C. van den Heever
Along the coasts of the Arabian Peninsula, convective dust storms are a considerable source of mineral dust to the atmosphere. Reliable predictions of convective dust events are necessary to determine their effects on air quality, visibility, and the radiation budget. In this study, the Weather Research and Forecasting Model coupled with Chemistry (WRF-Chem) is used to simulate a 2016 summertime dust event over the Arabian Peninsula and examine the variability in dust fields and associated vertical transport due to the choice of convective parameterization and convection-permitting versus parameterized convection. Simulations are run at 45 and 15 km grid spacing with multiple cumulus parameterizations, and are compared to a 3 km simulation that permits explicit dry and moist convective processes. Five separate cumulus parameterizations at 15 km grid spacing were tested to quantify the spread across different parameterizations. Finally, the impact these variations have on radiation, specifically aerosol heating rates is also investigated.
On average, in these simulations the convection-permitting case produces higher quantities of dust than the parameterized cases in terms of dust uplift potential, vertical dust concentrations, and vertical dust fluxes. Major drivers of this discrepancy between the simulations stem from the convection-permitting case exhibiting higher surface wind speeds during convective activity; lower dust emission wind threshold velocities due to drier soil; and more frequent, stronger vertical velocities which transport dust aloft and increase the atmospheric lifetime of these particles. For aerosol heating rates in the lowest levels, the shortwave effect prevails in the convection-permitting case with a net cooling effect, whereas a longwave net warming effect is present in the parameterized cases. The spread in dust concentrations across cumulus parameterizations at the same grid resolution (15 km) is an order of magnitude lower than the impact of moving from parameterized towards explicit convection. We conclude that tuning dust emissions in coarse-resolution simulations can only improve the results to first-order and cannot fully rectify the discrepancies originating from disparities in the representation of convective dust transport.


Airborne mineral dust is an important atmospheric aerosol (Zender et al., 2004; Ginoux et al., 2012): dust reduces visibility (e.g., Mahowald et al., 2007; Baddock et al., 2014; Camino et al., 2015) and is detrimental to the human respiratory system (Prospero, 1999; van Donkelaar et al., 2010; Stafoggia et al., 2016), but it also plays a vital role in fertilizing iron-deficient maritime ecosystems (Martin, 1991; Bishop et al., 2002; Mahowald et al., 2005; Jickells and Moore, 2015). Dust particles function as cloud condensation nuclei (e.g., Lee et al., 2009; Manktelow et al., 2010; Twohy et al., 2009; Karydis et al., 2011) and ice nuclei (e.g., DeMott et al., 2003; Field et al., 2006; Knopf and Koop, 2006; Boose et al., 2016), thereby altering cloud development and properties. Furthermore, mineral dust is of interest due to its distinctive optical properties: dust both scatters and absorbs shortwave (SW) and longwave (LW) radiation (e.g., Tegen and Lacis, 1996; Kinne et al., 2003; Dubovik et al., 2006), modifying atmospheric thermodynamics and the Earth's energy budget in the process (e.g., Slingo et al., 2006; Sokolik and Toon, 1996; Heald et al., 2014).
The influence of atmospheric mineral dust is widespread in the weather and climate system, yet generating skillful forecasts of dust concentrations and their temporal and spatial evolution has been difficult to achieve. Several studies suggest that including the radiative effects of mineral dust in numerical weather prediction (NWP) could refine the radiation balance of these models and improve forecasts (Kishcha et al., 2011; Haywood et al., 2005; Pérez et al., 2006). Advances in climate models have been made by incorporating time-varying dust sources and climate–dust feedbacks in the radiative forcing calculations (Kok et al., 2014, 2018; Woodage and Woodward, 2014). However, these potential improvements are contingent upon the quality of the dust model and initialization data, which models are known to be especially sensitive to. As such, substantial discrepancies exist across global models of similar resolution (Huneeus et al., 2011) and across regional models (Uno et al., 2006; Todd et al., 2008) in the magnitude of predicted dust flux from the surface to the atmosphere.
A major challenge in modeling dust processes is the scales of motion involved in its emission and subsequent transport. Dust particles mobilize from the surface due to wind erosion of arid soils, a mechanism that occurs on the micrometer scale, but once airborne mineral dust can deposit locally or be transported on the synoptic to global scales. Dust events initiate from both large-scale and synoptic dynamical flow regimes, as well as mesoscale features. Synoptic-scale uplift phenomena include monsoon troughs (e.g., Marsham et al., 2008), Shamal winds (e.g., Yu et al., 2016) and frontal systems (e.g., Beegum et al., 2018), whereas dynamical effects on smaller (meso) scales can raise dust via the production of convective outflow boundaries, or haboobs, (e.g., Miller et al., 2008), daytime turbulence or dry convective processes (e.g., Klose and Shao, 2012), and the morning mixing of the nocturnal low-level jet (NLLJ) momentum to the surface (e.g., Fiedler et al., 2013). When considering only meteorological dust sources, wind drives dust emissions, meaning that the underlying processes that contribute to the wind fields must be resolved in a model to create an accurate dust forecast.
One potential source of disagreement in models stems from the scaling emissions in dust parameterizations, which relate the surface emissions proportionally to the second or third power of surface wind speed. This means that minor miscalculations in modeled wind speeds go on to produce more substantial errors in the dust concentration calculations (e.g., Menut, 2008). Current aerosol forecast and climate models are run at fine enough grid spacing to simulate synoptic events but still typically employ cumulus parameterizations, which are incapable of resolving dry and moist mesoscale updrafts and downdrafts that can potentially loft and/or scavenge dust. Schepanski et al. (2015) found that online dust models are likely to be most sensitive to the initialization data compared with other model options, which adds additional uncertainty to dust forecasts. Pope et al. (2016) and Largeron et al. (2015) both postulated that an inadequate representation of convection in coarse model simulations, specifically the underestimation of high surface wind speeds in mesoscale haboobs, is a major contributor to errors in dust models.
The misrepresentation of dust concentrations in models with cumulus parameterizations has been investigated across several modeling platforms, mostly from the perspective of dust lofting mechanisms at the surface. Heinold et al. (2013) ran the UK Met Office Unified Model (UM) over West Africa with offline dust emissions and found that, of the factors they tested, the model was most sensitive to explicit versus parameterized convection. Furthermore, in the Heinhold et al. (2013) study, dust emissions were reduced by roughly 50 % as the grid resolution was increased to convection-permitting scales. This was found to be due to the parameterized simulations underestimating moist convective activity but drastically overestimating the NLLJ dust uplift mechanism, which is a similar relationship to that originally identified in Marsham et al. (2011).
Conversely, studies using different numerical dust models have identified other relationships between the horizontal resolution and dust emissions. Roberts et al. (2018) also used the UM to investigate this relationship over the Sahara and Sahel and reported little change in the dust emissions when moving from parameterized to explicit convection; however, they also noted that the NLLJ maximum decreased as the convective maximum increased. Reinfried et al. (2009) simulated a haboob case study from Morocco with the Lokal Modell – MultiScale chemistry aerosol transport (LM-MUSCAT, since renamed COSMO-MUSCAT) regional model and found increased dust emissions in a convection-permitting simulation versus those with cumulus parameterizations. They also established that the model was more sensitive to the choice of cumulus parameterization rather than the change in horizontal resolution. Similarly, Bouet et al. (2012) identified an increase in dust emissions with increasing model resolution using the Regional Atmospheric Modeling System coupled to the Dust Prediction Model (RAMS-DPM) while simulating a Bodélé depression case study. Ridley et al. (2013) showed that global aerosol models with parameterized convection were also sensitive to model resolution and that higher horizontal resolution led to higher dust emissions.
With the added computational expense of running aerosol code, the resolution of dust forecast models lags relative to their weather-only prediction counterparts for both global and regional prediction systems (Benedetti et al., 2014, 2018). Global dust forecasts generated by several aerosol models are available through the Sand and Dust Storm Warning Advisory and Assessment System (SDS-WAS; http://www.wmo.int/sdswas, last access: 20 December 2019), but none of the models in the SDS-WAS are currently run at fine enough grid spacing to be considered convection-permitting (SDS-WAS Model inter-comparison and forecast evaluation technical manual; last updated January 2018). While regional numerical weather prediction models have moved into convection-permitting scales, the added computational cost of aerosol parameterizations means that convective parameterizations will be a necessity for longer in models that employ online aerosol predictions. It is also clear that horizontal model resolution remains an understudied factor in regional dust modeling. As such, exploring differences across cumulus parameterizations and those relative to convection-permitting resolutions continues to be relevant and vital to better understand aerosol forecasting and aerosol–cloud–environment interactions.
While previous studies have begun to examine the effect of horizontal model resolution on dust emissions and airborne dust concentrations, there are several factors that warrant more investigation. As it stands, there is little agreement on the sign of the response in dust emissions to a change in horizontal model resolution, which seems to vary based on the regional model being utilized. Most studies have concentrated on the change in dust emissions based on moving from parameterized convection to convection-permitting scales, while ignoring the possible sensitivity due to the choice of the cumulus parameterization itself. Furthermore, much of the previous literature focused on how the increase in resolution affects convective outflow boundaries and surface/near-surface processes as dust sources rather than convective transport and the vertical redistribution of dust and its radiative effects at different levels of the atmosphere. In this paper, we seek to address these limitations in the understanding of the effects of horizontal model resolution on dust concentrations. Therefore, the goal of the research presented here is to quantify the sign and magnitude in the response of modeled dust fields in a regional numerical model to increasing horizontal resolution.
In order to achieve our stated goal, we will use numerical simulations of a case study to examine the variability in dust emissions and vertical dust concentrations and fluxes due to (1) the choice of convective parameterization, (2) convection-permitting versus parameterized convection, and (3) the impact of these variations on radiation, specifically aerosol heating rates. These simulations are performed using the Weather Research and Forecasting Model coupled with Chemistry (WRF-Chem) (Skamarock et al., 2008; Grell et al., 2005; Fast et al., 2006) a platform that has been tested for its sensitivity to vertical resolution for dust extinction coefficient profiles (Teixeira et al., 2016) as well as horizontal model resolution and convective transport for chemical species such as carbon monoxide (e.g., Klich and Fuelberg, 2014) but not for dust. These simulations will represent a case study of a summertime coastal convective dust event over the Arabian Peninsula, a relatively understudied region compared with areas such as the Sahara (Jish Prakash et al., 2015), despite being the world's second largest dust emission region (Tanaka and Chiba, 2004).
This paper is part of a larger body of collaborative work conducted by the Holistic Analysis of Aerosols in Littoral Environments (HAALE) research team under the Office of Naval Research Multidisciplinary University Research Initiative (MURI) program. The primary goal of the HAALE-MURI project is to isolate the fundamental environmental factors that govern the spatial distribution and optical properties of littoral zone aerosols. The study discussed in this paper focuses on advancing our understanding of the role that convection plays in the redistribution of dust aerosol and its radiative effects along the coast of arid regions; this work also seeks to quantify the uncertainty in forecasted dust distributions stemming from the representation of convective processes in a regional model.
The paper is organized as follows: an overview of the WRF-Chem model and physics setup (Sect. 2.1), the dust model setup (Sect. 2.2), information about the cumulus parameterizations and model resolution (Sect. 2.3), the analysis methods (Sect. 2.4), and a description of the case study (Sect. 2.5) are given in Sect. 2. The results are outlined in Sect. 3, including a discussion on the temporal evolution of dust concentrations and dust uplift potential in Sect. 3.1, vertical distributions and fluxes of dust in Sect. 3.2, and the effect on aerosol radiative heating rates in Sect. 3.3. A discussion of the results and implications for the community are located in Sect. 4, and a summary of the findings of this study are reviewed in Sect. 5.
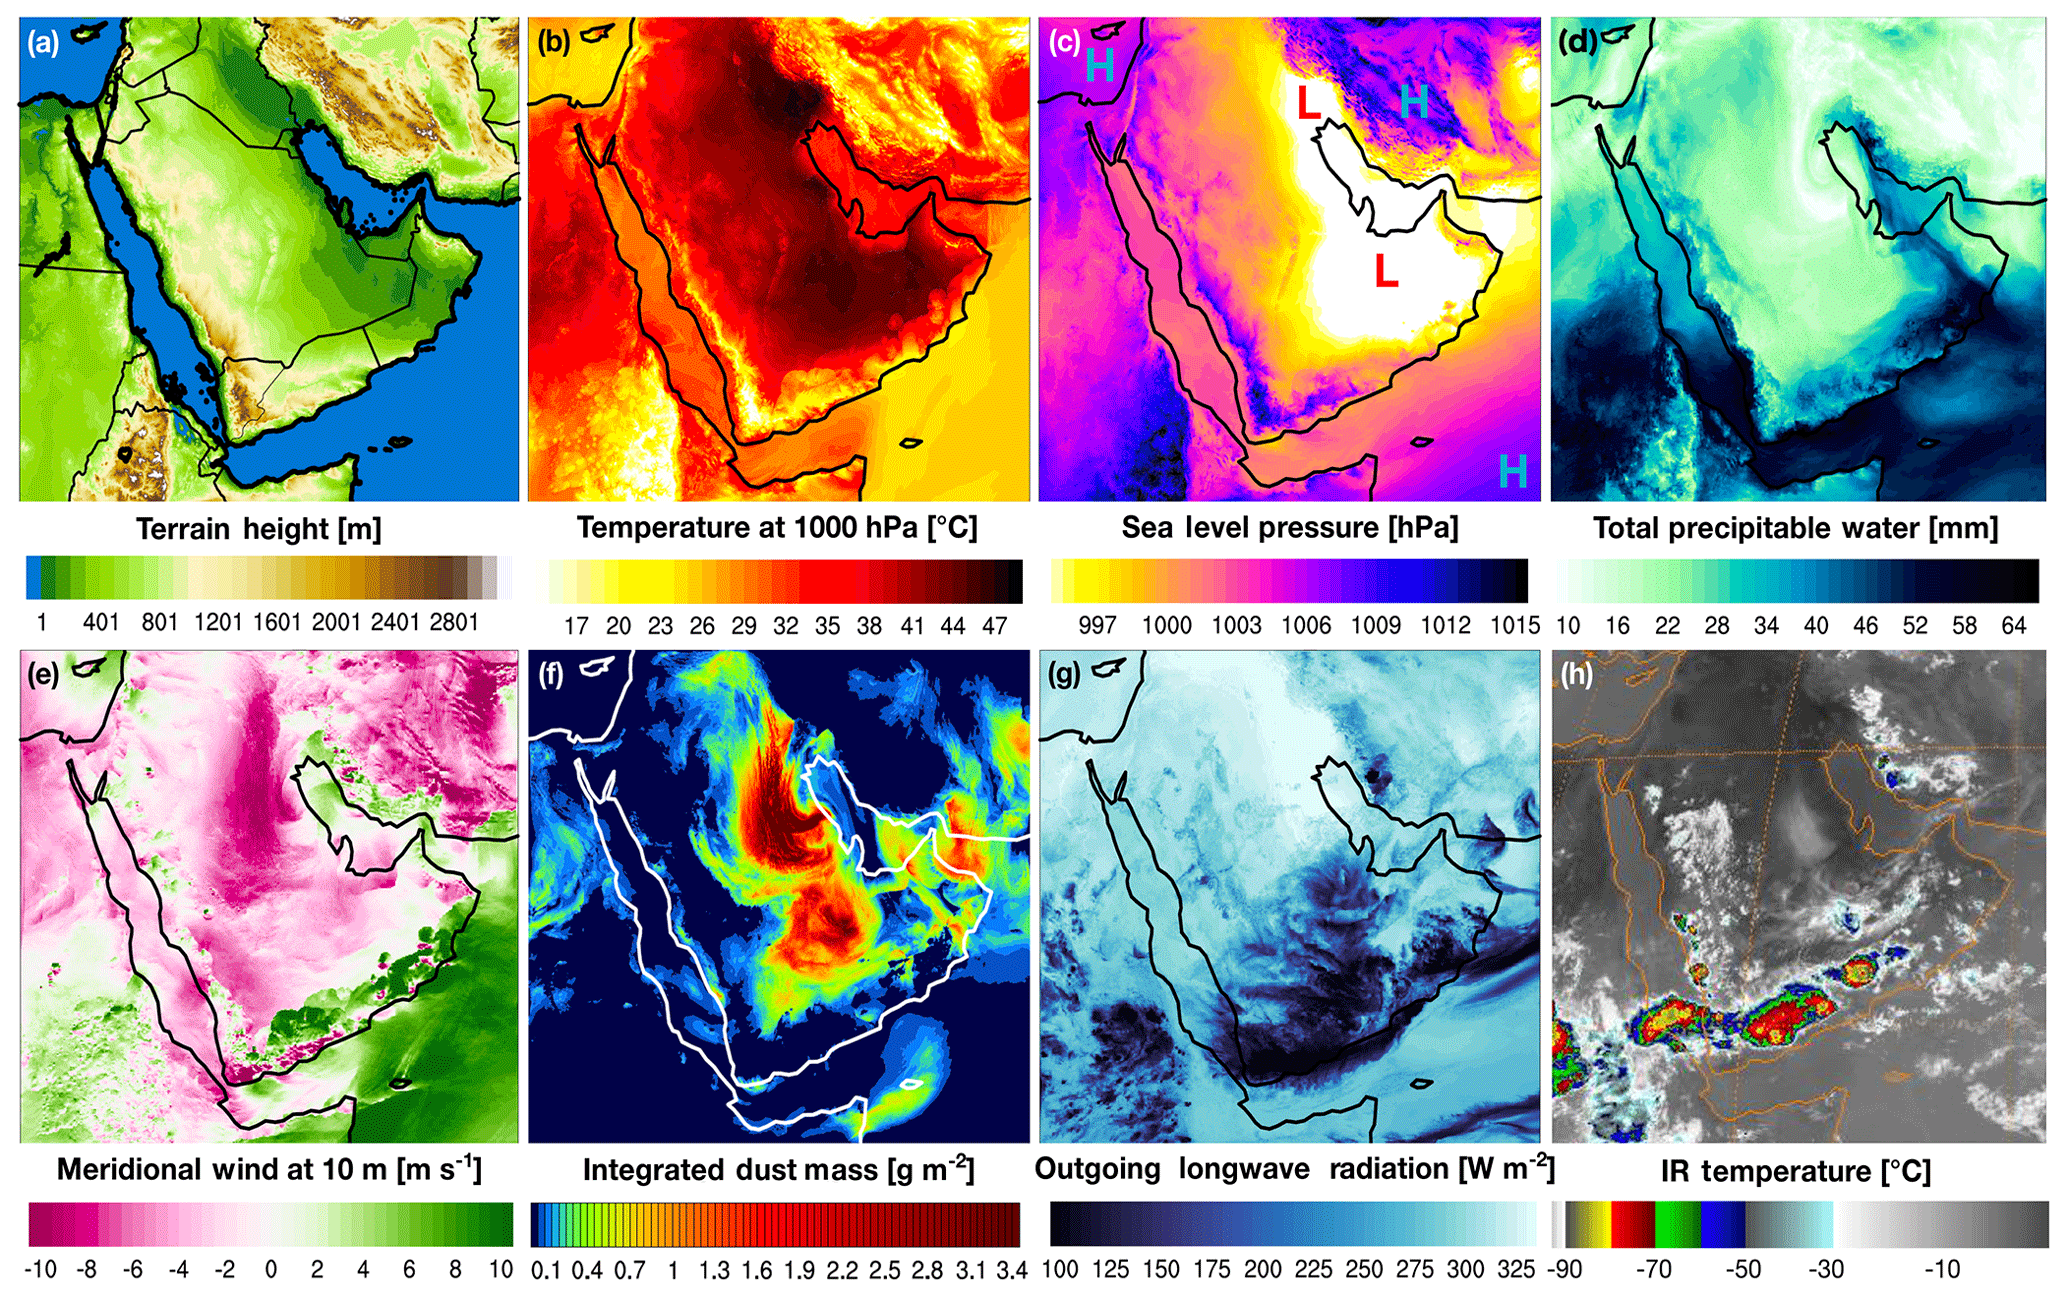
Figure 1Case study topography and meteorology for 3 August 2016 at 15:00 UTC: (a) terrain height and national boundaries, (b) 1000 hPa temperature, (c) sea level pressure, (d) total precipitable water, (e) meridional winds at 10 m a.g.l., (f) vertically integrated dust mass, (g) outgoing longwave radiation, and (h) IR temperature. Panel (h) is observed from Meteosat-7, whereas panels (a)–(g) are snapshots from the 3 km WRF-Chem simulation
2.1 WRF-Chem model description and physics
To investigate the Arabian Peninsula case study, WRF-Chem version 3.9.1.1 was used to simulate the dust outbreak meteorology and aerosol fields. WRF-Chem is an online numerical chemical transport model that allows for interactive aerosol processes, including feedbacks between the meteorology, aerosol, and radiation. The model was coupled to the Goddard Chemistry Aerosol Radiation and Transport (GOCART) module (Ginoux et al., 2001), which allowed for feedbacks between the meteorology and aerosols and is described in more detail in Sect. 2.2. The model was tested with and without dust initial and boundary conditions from the Community Atmosphere Model with Chemistry (CAM-Chem) global model (Emmons et al., 2010). The concentrations of dust advected through the lateral boundary conditions was too small to have an effect on the results, and the initial conditions introduced a spurious decreasing integrated dust trend over time when modeled aerosol optical depth (AOD) was compared to AERONET observations. While the initial conditions led to a higher integrated dust mass, it did not change the conclusions of the study. To remove this factor and focus more on the meteorological processes that actively loft and transport dust in real-time, no chemistry or aerosol initial/lateral boundary conditions were used. Rather, the aerosol fields were initialized with zero concentrations and were allowed to evolve naturally from the model meteorology, aerosol, surface, and radiation processes.
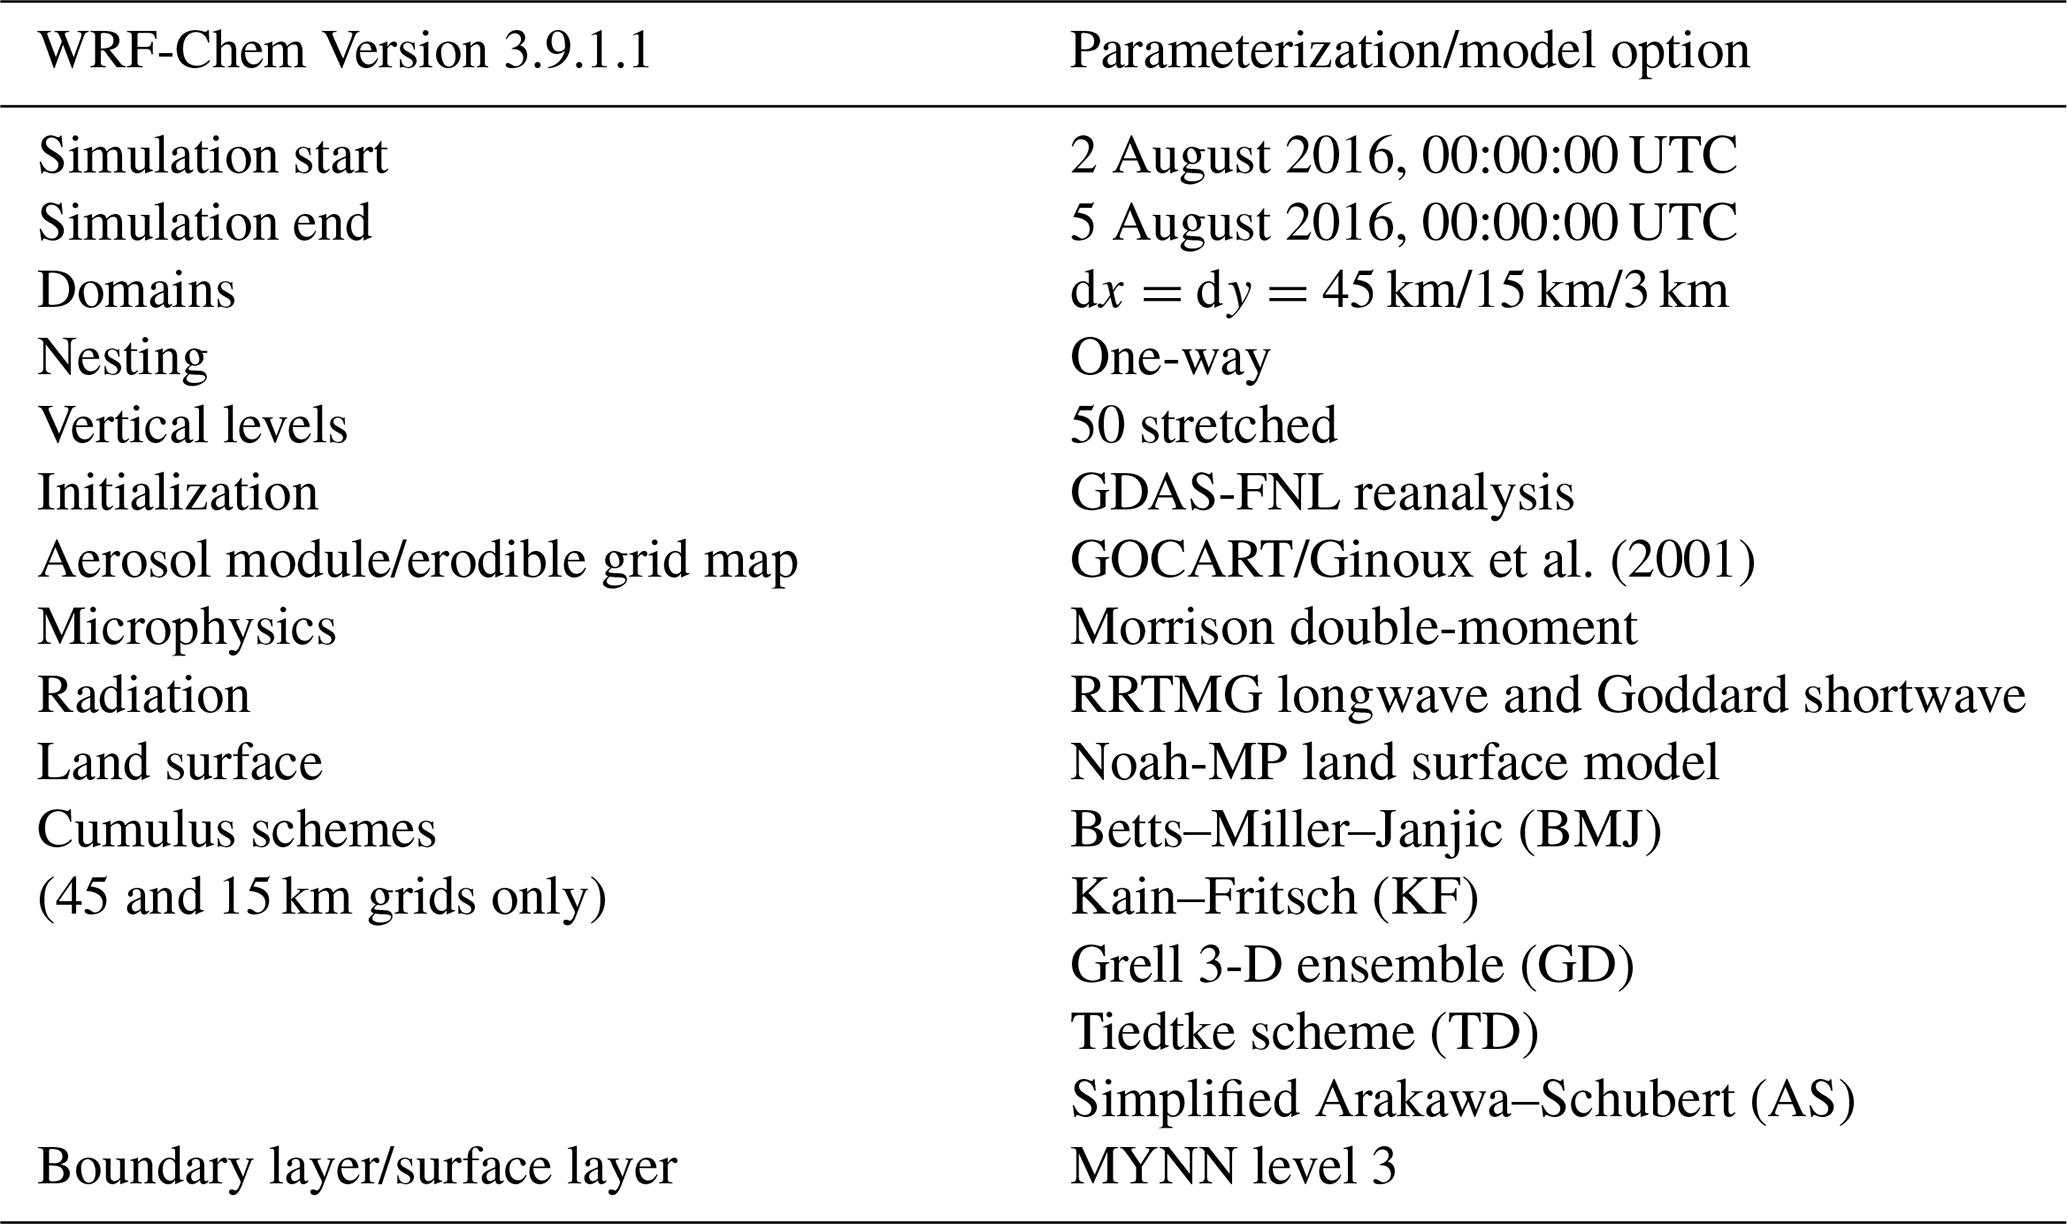
The meteorological and sea surface temperature initial and lateral boundary conditions were sourced from the 0.25 ∘, 6-hourly Global Data Assimilation System Final analysis (GDAS-FNL) (National Centers for Environmental Prediction/National Weather Service/NOAA/U.S. Department of Commerce, 2015). The model was run from 00:00:00 UTC on 2 August 2016 to 00:00:00 UTC on 5 August 2016 and produced output at 30 min intervals. The following model parameterizations were employed and kept constant across the simulations, with similar WRF physics options being utilized elsewhere to study dust effects (e.g., Alizadeh Choobari et al., 2013): the Morrison double-moment microphysics scheme (Morrison et al., 2005, 2009), the RRTMG longwave scheme (Iacono et al., 2008), the Goddard shortwave radiation scheme (Chou and Suarez, 1999), the Noah land surface model with multiparameterization options (Niu et al., 2011; Yang et al., 2011), and the MYNN level 3 boundary layer parameterization (Nakanishi and Niino, 2006; 2009). The convective parameterizations and horizontal resolutions tested will be discussed in Sect. 2.4. A summary of the physics options utilized can be found in Table 1.

Figure 2Skew-T diagrams for two radiosonde release sites in Saudi Arabia on 3 August 2016 at 12:00 UTC for an inland location (a) and a location nearer to the coast (b).
Table 1Summary of the WRF-Chem model options utilized and the simulation setup.
2.2 GOCART dust emissions and dust uplift potential
WRF-Chem is coupled to the GOCART dust module, which parameterizes the emission of dry mineral dust mass from the surface. GOCART is single-moment in mass, meaning there is no number information available to change the number of cloud condensation nuclei or ice nuclei in the microphysics. As such, the indirect effects of dust cannot be simulated with this setup. Using this model, dust is emitted to the atmosphere in five discrete effective radii bins (0.5, 1.4, 2.4, 4.5, and 8.0 µm) based on Eq. (1):
In Eq. (1), Fp is the dust flux from the surface (kg m−2 s−1) for each of the radii bins (p), S represents the wind erosion scaling factor (0 to 1) established by the Ginoux et al. (2001) soil erodibility map, sp is the fraction of each size class within the soil (0 to 1) based on the silt and clay fraction of the soil type, U is the 10 m wind speed (m s−1), and Ut is the threshold velocity of wind erosion (m s−1). C is a tuning constant (set here to a default 1 kg s2 m−5), which can be set by the user to increase or decrease the total dust flux based on regional observations (e.g., Zhao et al., 2010; Kalenderski et al., 2013; Dipu et al., 2013). If the wind speed is less than the threshold velocity, no dust will loft from the surface. Most of the terms in Eq. (1) are time invariant (), except for the wind speed (U) and wind erosion threshold (Ut). Ut is a function of soil wetness, and is calculated using the relationship found in Eq. (2):
For Eq. (2), ρp is the dust particle density (kg m−3), ρa is the density of air (kg m−3), g is gravitational acceleration (m s−2), and wsoil is the soil wetness fraction (0 to 1). Similar to Eq. (1), Eq. (2) includes a threshold, whereby above a soil wetness of 0.5, no dust will be emitted. If the threshold criteria are met and dust lofts from the surface, it is then transported based on the simulated meteorological fields from WRF, including advection, convection, and turbulent mixing, and is removed from the atmosphere via gravitational settling and wet deposition. Here, wet deposition (Yang et al., 2015) is included as a scavenging mechanism to provide a more realistic picture of the moist convection transport process. Aerosol radiation interactions in the SW and LW (Barnard et al., 2010) are included in the simulations to understand the implications that lofted dust has on the energy budget of the case study and are discussed in Sect. 3.3.
Before dust can amass in and influence the atmosphere, it must first be emitted from the surface. Because of the threshold values included in the GOCART dust parameterization equations (Eqs. 1, 2), it is important to understand how often the modeled near-surface wind speeds exceed the wind threshold value. A parameter useful in describing the influence of the wind on dust emissions is dust uplift potential (DUP), proposed by Marsham et al. (2011) and based on Marticorena and Bergametti (1995). The DUP parameter is an offline approximation for the relative amount of dust expected to loft from the surface. DUP is a convenient way to perform first-order sensitivity tests on the meteorology without having to rerun the model and provides a framework for deconvolving the variables in Eqs. (1)–(2). Here, we have adapted the DUP parameter from Marsham et al. (2011) (Eq. 4) into three variations (Eqs. 3, 4, 5); these variations allow researchers to alter the complexity of the analysis by varying the degrees of freedom.
In Eq. (3), Ut is set to a constant wind speed, A, thereby making DUP a function of only the near-surface wind speed; for the purpose of this paper Ut is set to 5 m s−1, but it has been tested elsewhere across the range of 5–10 m s−1 (e.g., Marsham et al., 2011; Cowie et al., 2015; Pantillon et al., 2015). This simplified equation for dust uplift has been used in previous dust studies and is useful to include here to place this manuscript in the context of existing literature. Equation (4) is slightly more intricate in that it considers the model evolution of Ut due to changing soil wetness from precipitation and land surface processes, calculated by Eq. (2). Lastly, Eq. (5) builds on Eq. (4) by including the soil erodibility scaling factor (S), which recognizes that the U and Ut relationship is valid only if it occurs over potential dust source regions. As U, Ut, and S are entangled in the GOCART dust parametrization found in Eqs. (1)–(2), the seemingly minor variations between the DUP parameters in Eqs. (3)–(5) are crucial for isolating which processes, or combination of processes, are sensitive to the horizontal resolution of the model and, hence, to the analysis performed here.
2.3 Domain, nesting, and cumulus parameterizations
Several horizontal model grid spacings (45, 15, and 3 km) of the Arabian Peninsula domain (Fig. 3) were tested to identify the sensitivity of modeled dust concentrations to the model's horizontal resolution. For the two coarsest simulations (45 and 15 km), cumulus parameterizations were employed to represent shallow and deep convection. The 45 km simulation was run with only the Betts–Miller–Janjic (BMJ) cumulus parameterization (Janjic, 1994), while five different cumulus parameterizations were tested for the 15 km simulations to determine the sensitivity of dust lofting to different cumulus parameterizations, including the following: the BMJ; the Kain–Fritsch, KF (Kain, 2004); the Grell 3-D ensemble, GD (Grell, 1993; Grell and Dévényi, 2002); the Tiedtke scheme, TD (Tiedtke, 1989; Zhang and Wang, 2011); and the simplified Arakawa–Schubert scheme, AS (Arakawa and Schubert, 1974; Han and Pan, 2011). A 15 km simulation with no cumulus parameterization was also run, but the results were similar and within the spread of the 15 km simulations that employed cumulus parameterizations and are not included here. The finest-resolution simulation (3 km) was run at convection-permitting scales; hence, no cumulus parameterizations were invoked. The 3 km simulation was initialized as a one-way nest from the 15 km BMJ simulation, which served as its parent lateral boundary conditions. Other combinations of nests were tested, but the results were not sensitive to which 15 km simulation was used as the parent nest, or lateral boundary conditions, for the 3 km simulation. A summary of the model domains is also found in Fig. 3.

Figure 3Model domain setup and analysis region for the 45 km (purple) and 15 km (blue) independent simulations with cumulus parameterizations as well as the 3 km nested convection-permitting simulation (orange). The averaging region for the analysis is denoted in yellow.
The cumulus parameterizations tested in this study for the 15 km simulations vary with respect to their methods for triggering and then characterizing convective processes at the sub-grid-scale level. BMJ is a moisture and temperature adjustment scheme that acts to restore the pre-convective unstable thermodynamic profile to a post-convective stable and well-mixed reference profile, whereas the other cumulus parameterizations (KF, GD, TD, and AS) employ a mass-flux approach to determine updraft and downdraft mass transport. Across the mass-flux parameterizations, GD is unique in that it computes an ensemble of varying convective triggers and closure assumptions and then feeds the ensemble mean back to the model. Furthermore, all five schemes represent shallow convection in addition to deep convection, the mass-flux schemes include detrainment of water and ice at cloud top, and AS and TD are formulated to include momentum transport in their calculations. These differences across parameterizations will result in varying updraft and downdraft speeds and precipitation rates, which will have consequences for the vertical transport of airborne dust as well as the strength of convective outflow boundaries and, therefore, dust emission at the surface. Several cumulus parameterization schemes were tested to introduce spread into the solutions and to represent the 15 km results as a five-member ensemble mean with uncertainty estimates. Because this paper seeks to investigate the effect of horizontal resolution on dust transport, comparing individual cumulus schemes against one another is outside the scope of this study.
2.4 Averaging and analysis methods
Because the representation of convective processes varies across the simulations, the results will focus on composite statistics from the 3 d case study. The authors make no attempt to track and match individual convective elements across simulations, as their triggering, timing, and development (or lack of development) will fluctuate depending on the model resolution and cumulus parameterization, thus making a truly consistent analysis problematic. Instead, this paper takes a step backward and aims to quantify, in an average sense, how the choice of horizontal resolution and parameterized convection affects dust concentrations in the WRF-Chem model across the Arabian Peninsula. The analyses and averages are processed within the yellow box shown in Fig. 3, disregarding all other grid points outside the Arabian Peninsula study area. Analyses that are temporally averaged are only averaged over the last 2 d of the simulation (00:00:00 UTC on 3 August 2016 to 00:00:00 UTC on 5 August 2016) to account for model spin-up in the first 24 h. All results are summed over the five dust bins in the GOCART model rather than being treated separately. Lastly, the results from the five 15 km simulations are averaged together to produce a mean 15 km resolution response; this mean is presented, along with the maximum and minimum spread across these simulations for reference.
2.5 Case study overview
The dust event simulated for this study occurred from 2 to 5 August 2016 across the Arabian Peninsula, originating from a combination of synoptic and mesoscale dust sources. A meteorological analysis of this event, including an attribution of specific dust sources to meteorological features can be found in Miller et al. (2019) and will not be reiterated in detail here. Rather, a snapshot of the meteorology and dust fields from the WRF-Chem simulation on 3 August at 15:00:00 UTC can be found in Figs. 1–2 as a reference to the typical meteorological setup for this case study.
For this event, the high summertime temperatures in the desert of the Arabian Peninsula produce a thermal low couplet at the surface, with one low centered over Iraq and the other over the Rub' al Khali desert in Saudi Arabia (Fig. 1c). The local low-pressure couplet leads to cyclonic surface winds between these two areas (Fig. 1e), comprised of northerly flow from Iraq into Saudi Arabia, with retuning southerly flow from Oman over the Persian Gulf and into Kuwait, and is a major non-convective contributor to the dust budget for this case study (Fig. 1f). In addition to these large-scale flow patterns, a daytime sea breeze brings moist, maritime air from the coast of Yemen and Oman inland into the otherwise arid Saudi Arabian basin (Fig. 1e, d). This moisture gradient is also evident in the skew-T diagrams, which represent an inland radiosonde release site at Riyadh (Fig. 2a), and a site closer to the coast in Abha (Fig. 2b), both located in Saudi Arabia. There is a stark difference in low-level moisture between the two sites, although both display a subsidence inversion aloft between 500 and 600 hPa. Furthermore, nocturnal low-level jets form along the Zagros Mountains (in Iran and Iraq) and the Red Sea, both of which have been studied previously in the literature (Giannakopoulou and Toumi, 2012; Kalenderski and Stenchikov, 2016).
Due to the region's inherent moisture constraints, convection is limited spatially to the coastal regions of the Arabian Peninsula, as is most summertime convective and non-convective precipitation in this region (e.g., Shwehdi, 2005; Almazroui, 2011; Hasanean and Almazroui, 2015; Babu et al., 2016). Moist convective cells develop along a low-level convergence line between the northerly basin flow and sea breeze front (Fig. 1g, h) aided by elevated terrain in Yemen and Oman (Fig. 1a). This convective setup along the southern portion of the Arabian Peninsula is a feature evident in each day of this case study, initializing diurnally in the local late afternoon and early evening, thereby providing 3 d of data for analysis, with the height of convective activity occurring on 3 August. Individual convective cells form along the convergence line, a typical Middle Eastern characteristic (Dayan et al., 2001), but do not organize further, owing to a lack of upper-level synoptic support and insufficient moisture in the interior of the peninsula. Nevertheless, the convective line does produce outflow boundaries, which loft dust from the surface and are the main convective dust source for this case study. More information on model validation of this study, including comparisons of these simulations with AOD observations can be found in Saleeby et al. (2019), which shows that WRF-Chem systematically underestimates the dust AOD for this event.
3.1 Temporal evolution
3.1.1 Dust uplift potential
The first process of interest in determining the sensitivity of modeled dust concentrations to horizontal resolution in WRF-Chem is the amount of dust lofted from the surface to the atmosphere. Figure 4 depicts the average DUP for the simulations at each 30 min output, using Eqs. (3)–(5) to separate out the importance of the different mechanisms regulating dust emissions.
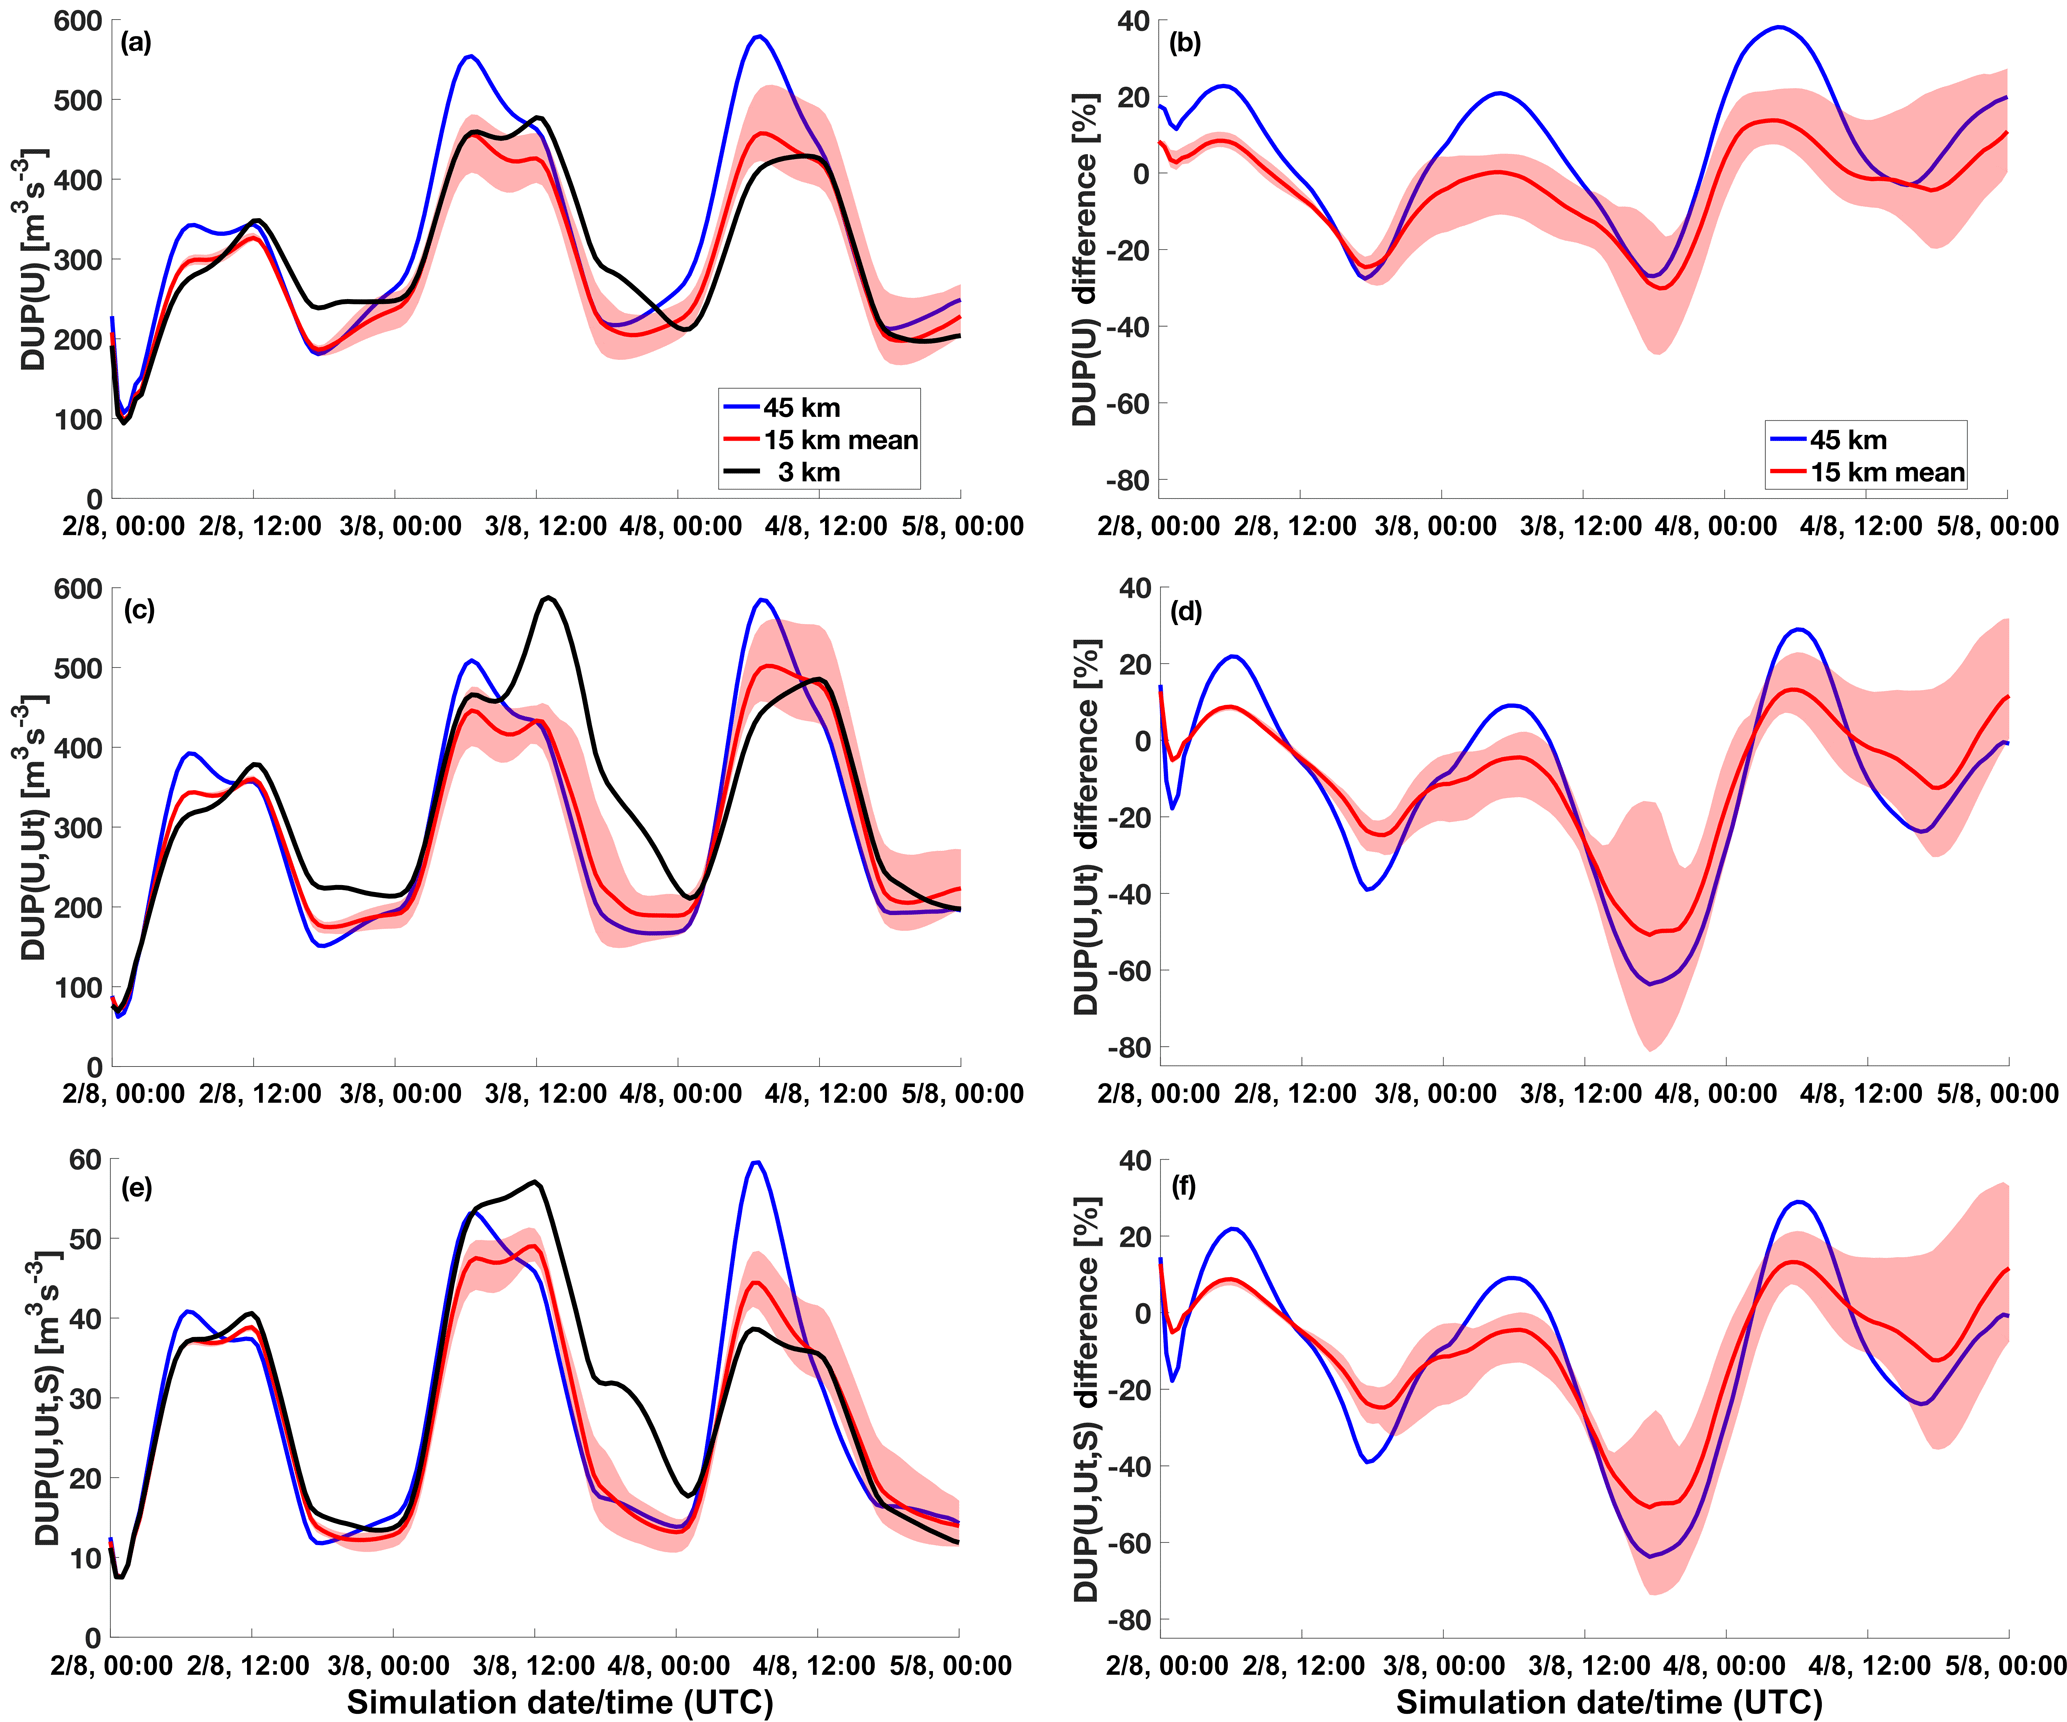
Figure 4The spatially averaged dust uplift potential for (a) DUP(U), (c) DUP(U,Ut), and (e) DUP() for the 45 km (blue), 15 km mean (red), and 3 km (black) simulations with the maximum and minimum spread across the 15 km simulations indicated in light red shading. Note that there is a change in scale in the ordinate in panel (e). (b, d, f) The percent difference between the 3 km convection-permitting simulation and the simulations employing cumulus parameterizations for the different DUP parameters.
Regardless of which DUP parameter is used, almost all of the simulations capture the bimodal daily maximum in dust emissions in the local midmorning (06:00 UTC) and late afternoon (13:00 UTC) due to the mixing of the NLLJ with the surface and convective outflow boundaries, respectively. The only resolution where the bimodality is absent is the 45 km simulation, which captures the NLLJ mechanism but misses the second convective activity maximum. The coarsest simulation overestimates the near-surface wind speeds related to the NLLJ mechanism, which subsequently inhibits convection later in the day. Because of this, the 45 km simulation has the highest DUP(U) (Fig. 4a) based only on wind speed (Eq. 3), which is a result similar to the Heinhold et al. (2013) and Marsham et al. (2011) studies over the Sahara.
However, when taking the calculated threshold wind velocity into account (Eq. 4), the convection-permitting simulation (3 km) displays the strongest DUP(U,Ut) at the local late afternoon convective maximum (Fig. 4c). For this to be the case compared with the DUP(U) parameter, the 3 km simulation must have a lower threshold wind velocity (Fig. 5a) than the simulations with parameterized convection. As the threshold wind velocity is proportional to soil wetness (Eq. 2), this implies that the convection-permitting simulation will on average have drier soil, or more grid points below the soil wetness threshold than the parameterized simulations. Rainfall is generated differently in parameterized versus convection-permitting simulations, and it has been well documented that parameterized simulations produce more widespread light rainfall, whereas more intense rainfall tends to develop over smaller areas in convection-permitting simulations (e.g., Sun et al., 2006; Stephens et al., 2010). From a domain average perspective, rainfall in the 3 km simulation will cover less area, leading to the soil moisture threshold not being exceeded as frequently as in the parameterized cases.
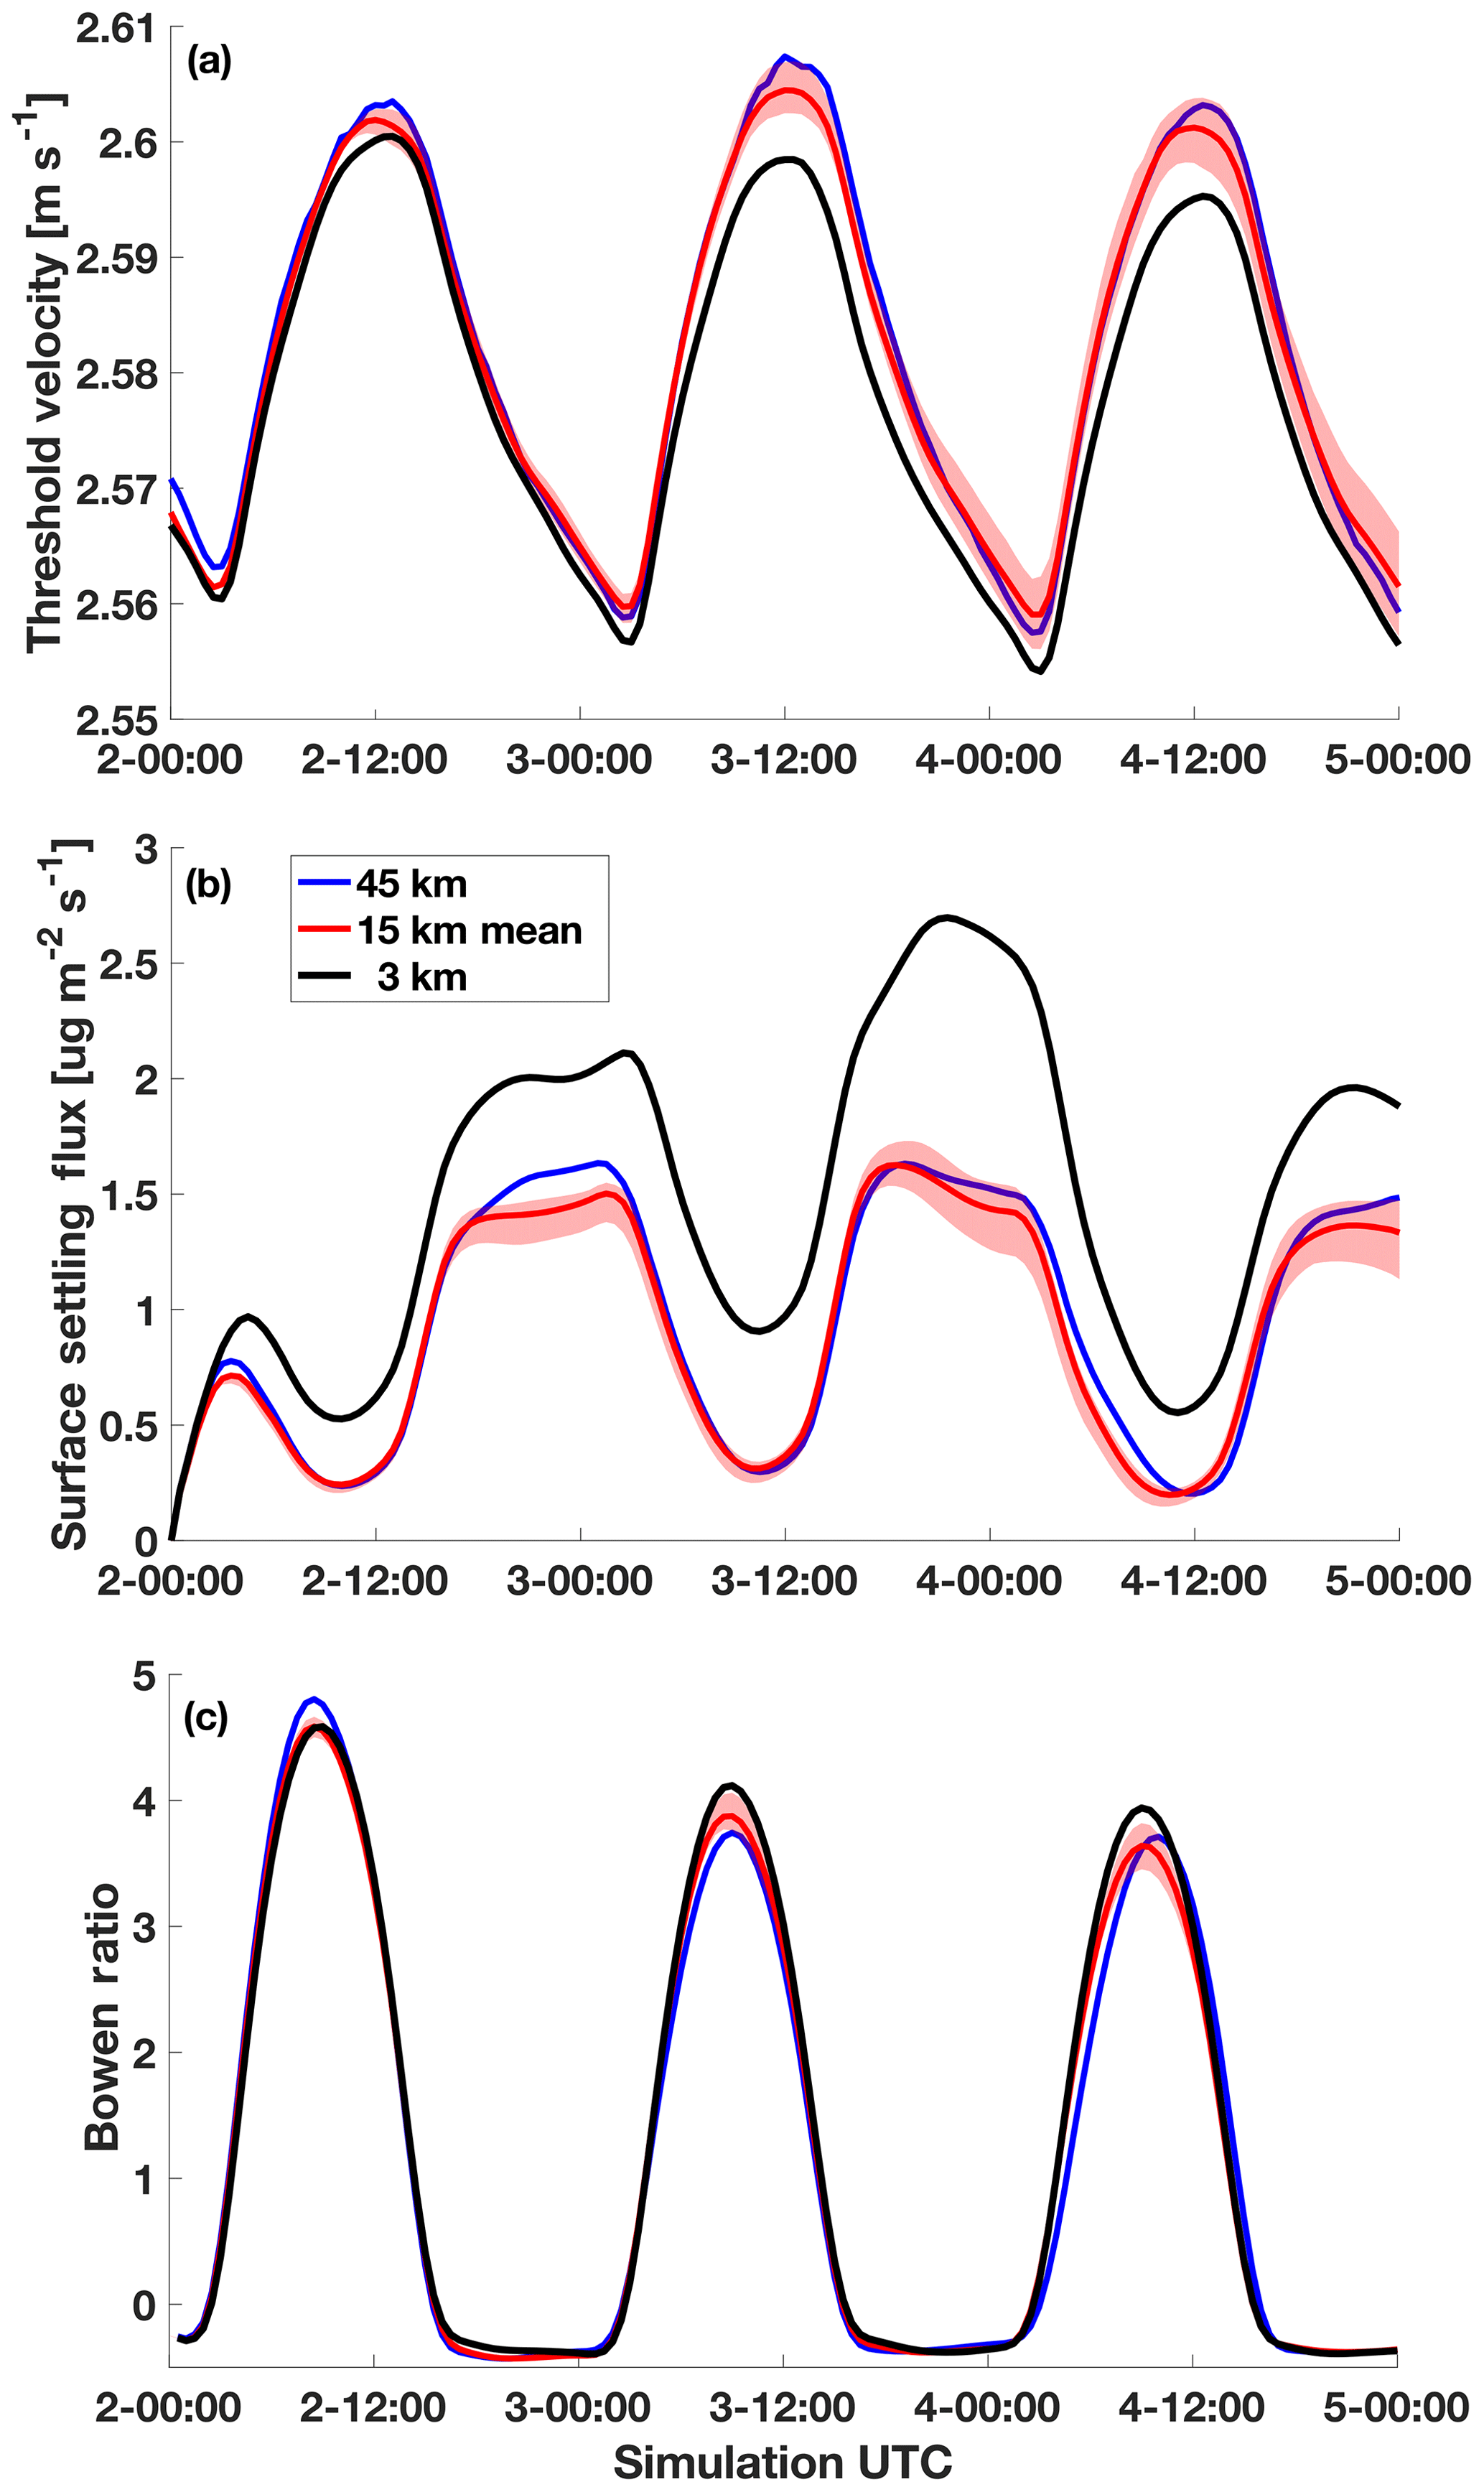
Figure 5Spatially averaged (a) dust uplift threshold velocity, (b) dust surface settling flux, and (c) the Bowen ratio of sensible to latent heat flux. Colors and shading are the same as in Fig. 4.
This spatial difference in rainfall leads to the 3 km case having drier soil on average across the domain, which is evident in the surface fluxes represented by the Bowen ratio of sensible to latent heat fluxes in Fig. 5c. When the Bowen ratio is above one, more of the surface heat exchange with the atmosphere is in the form of sensible heat flux, rather than latent heat flux. Dry soils are characterized by low values of latent heat flux, and therefore exhibit higher Bowen ratios. The 3 km simulation exhibits a higher Bowen ratio on 3 and 4 August, indicating that the soil is drier in the convection-permitting simulation on average. This result implies that disparities in land surface properties across the varying model grid resolutions are important for modulating dust emissions, both from the perspective of convection-permitting versus parameterized convection and associated precipitation as well as latent and sensible heat fluxes.
Adding on to the complexity of the DUP parameter, when the location of dust sources is considered in the DUP() calculations (Eq. 5), some of variability between the local NLLJ and convection maxima is lost in the 3 km simulation (Fig. 4e) on 3 August. Furthermore, including the scaling factor reduces the magnitude of the DUP parameter to roughly 10 % of the initial values for DUP(U) and DUP(U,Ut). Incorporating the dust source function in DUP works not only as a scaling factor for the magnitude of potential dust emissions but also impacts the relative importance of dust production mechanisms (NLLJ versus convection). This shift is a consequence of the location in which these processes occur. For instance, the reduction in the 3 km convective maximum on 3 August between DUP(U,Ut) and DUP() signifies that convection is occurring in locations that are not active dust source regions. Without information on the dust source regions, this process would be assigned an unrealistic dominance over the NLLJ mechanism in terms of DUP.
All simulations are similar for the first 24 h of spin-up until the processes begin to diverge on 3 August, where the convection-permitting simulation produces the maximum DUP() both during the local daytime and nighttime hours. On the final day of the case study (4 August), the convection-permitting simulation has the lowest DUP(), with the NLLJ maximum dominating over the convective maximum in both the 3 and the 15 km mean, due to reduced convective activity in the fine-resolution simulations. Examining the percent difference in DUP between the coarse and fine simulations (Fig. 4b, d, f), the average percent difference between the 3 and 15 km simulations is at a minimum when only wind speed is considered and increases as the degrees of freedom in DUP increases. For the DUP() case, the average percent difference is between 10 % and 65 % lower in the 15 km simulations than in the convection-permitting simulation, with a maximum difference of 85 % and a spread across parameterizations of 20 %. This implies that the convection-permitting WRF-Chem simulation has the potential to loft up to 85 % more dust than those with parameterized convection.
3.1.2 Vertically integrated dust mass
The differences in DUP(), or dust flux from the surface to the atmosphere, specifically the enhanced values for the convection-permitting simulation on 3 August, will lead to more dust lofting than in the coarse simulations. To see how differences in the dust emissions translate into differences in airborne concentrations of dust, Fig. 6 demonstrates the temporal evolution of the spatially averaged, vertically integrated dust mass throughout the vertical column. Here, the convection-permitting simulation records upwards of 150 % more integrated dust mass compared with the coarse-resolution simulations. Across the coarse simulations, the 45 and 15 km runs have similar vertically integrated dust magnitudes, despite the temporal differences in DUP(). This is due to the overestimation of the NLLJ in the 45 km simulations being offset by the enhanced convective dust lofting in the 15 km simulations.
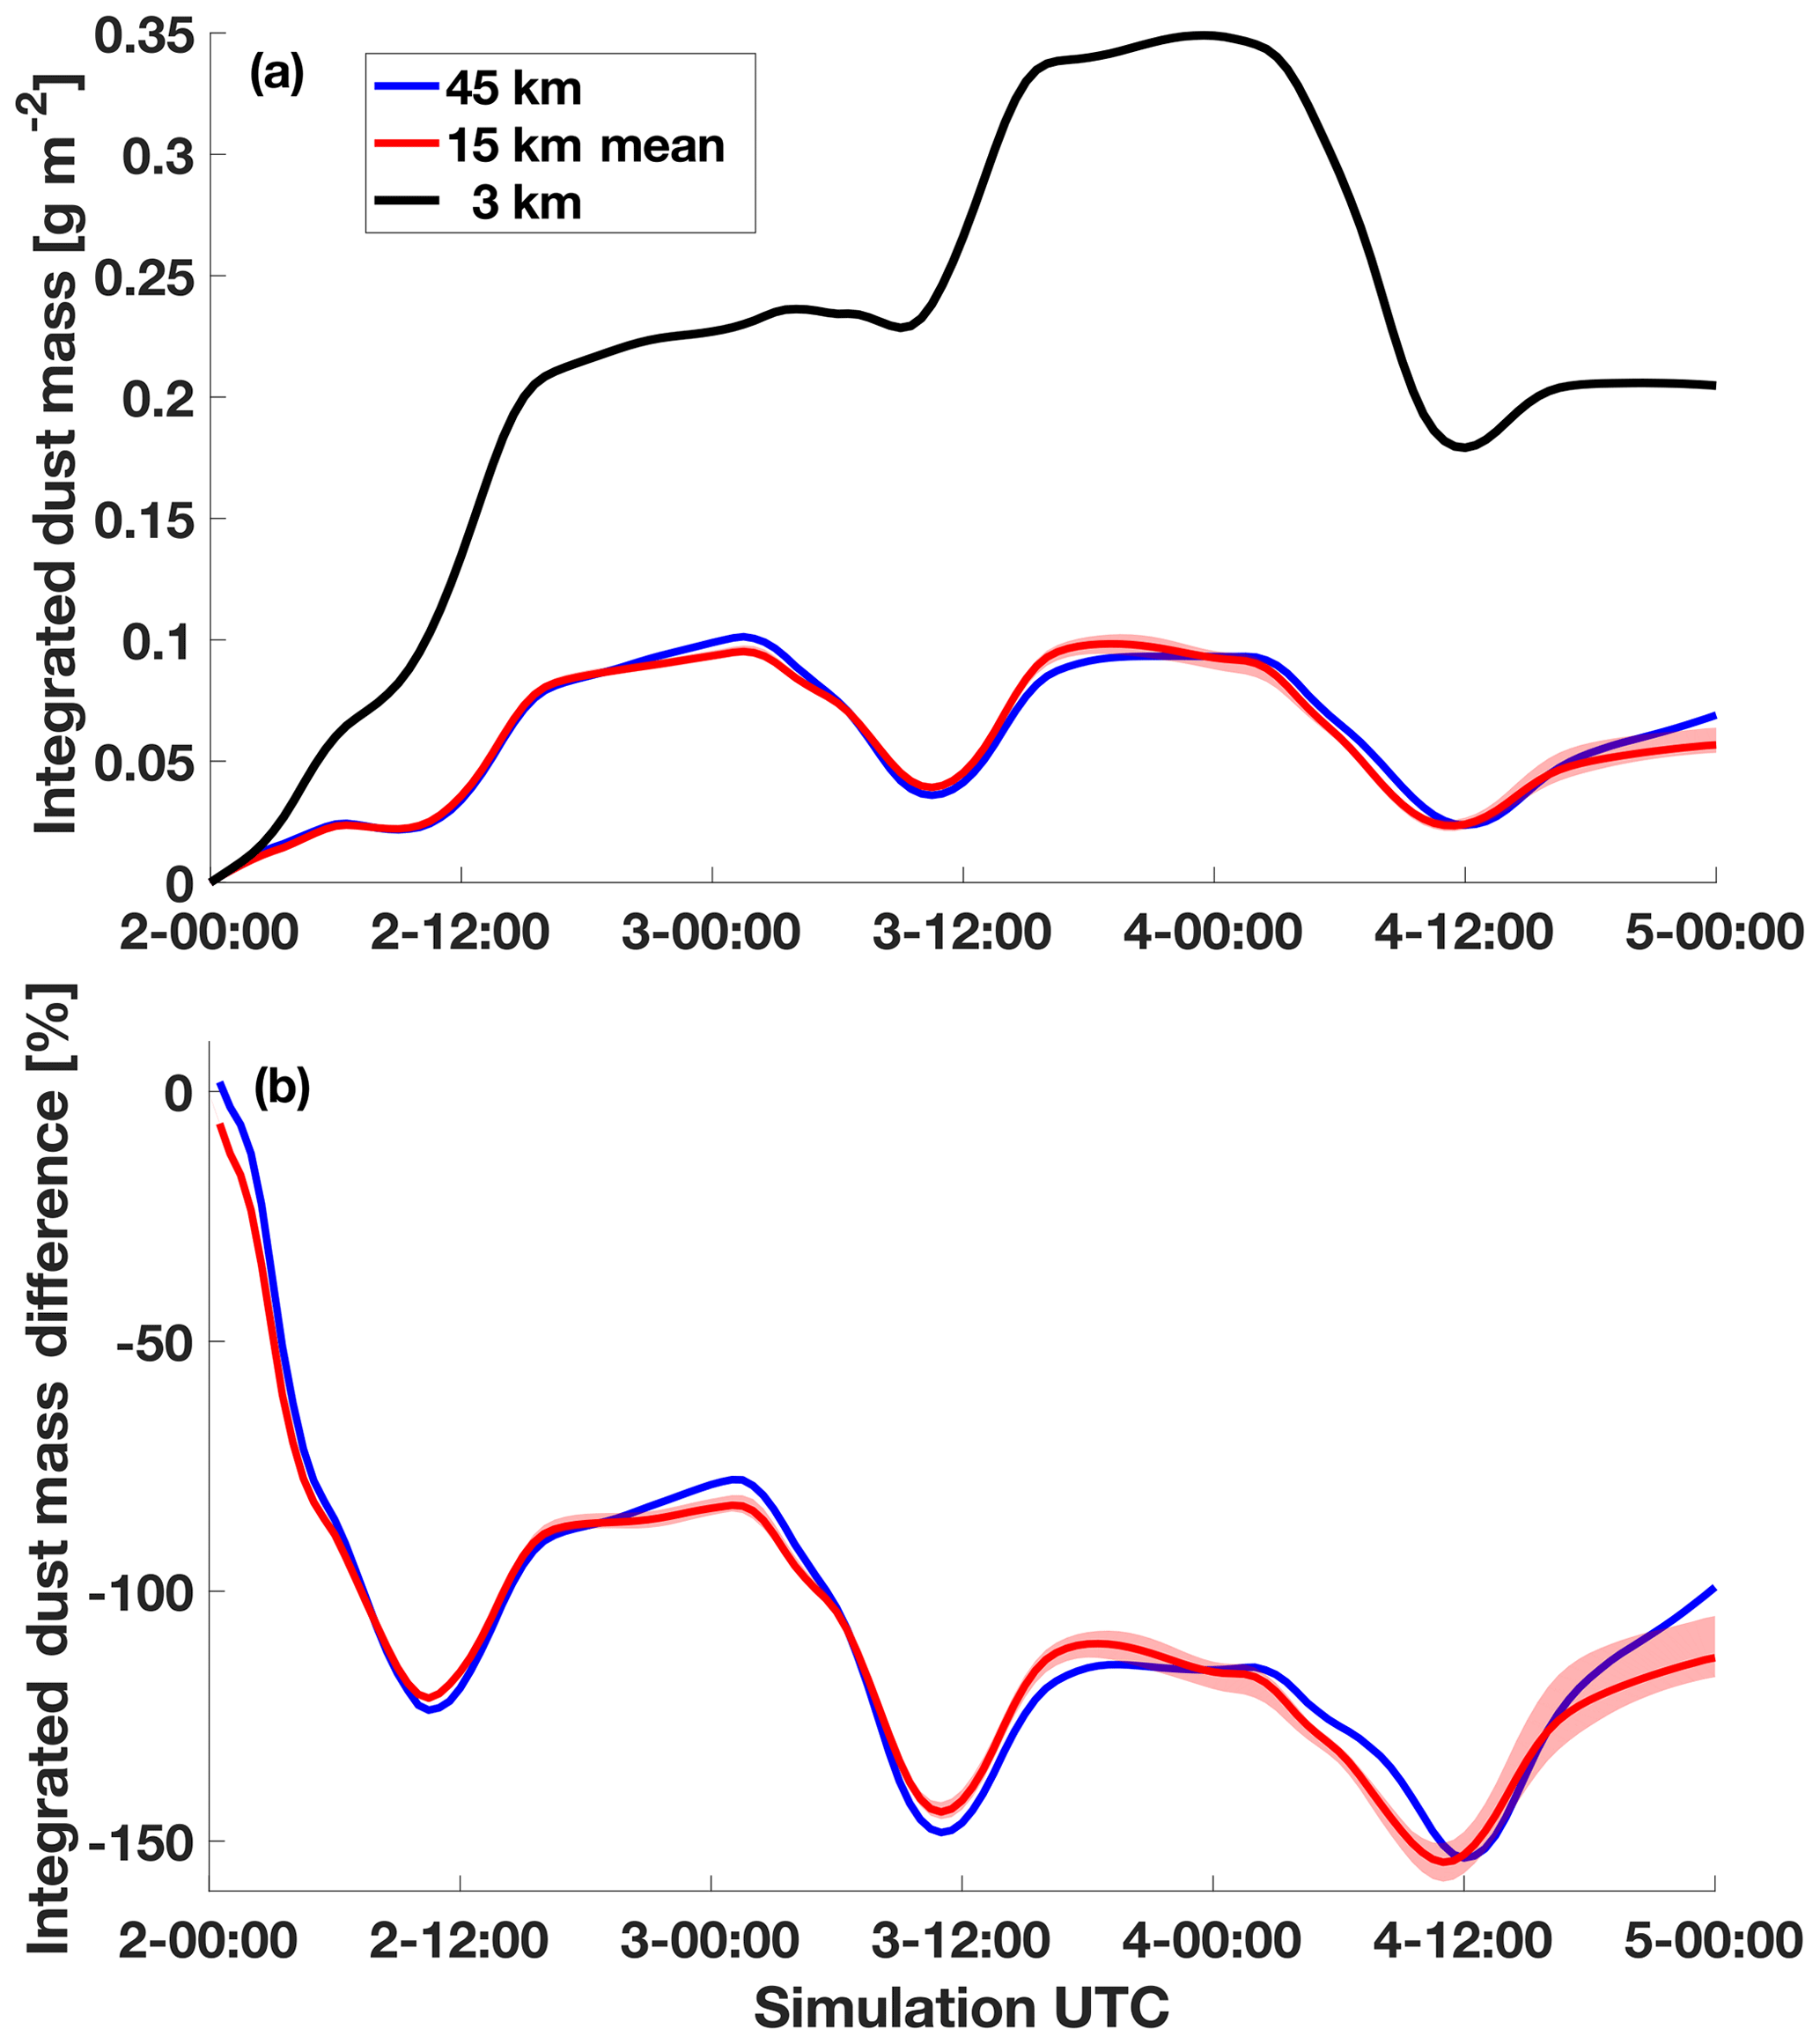
Figure 6Spatially averaged, vertically integrated dust mass. Colors and shading are identical to those used previous figures.
The discrepancy in the diurnal maxima across horizontal resolutions is similar to the results of the UM in Marsham et al. (2011) and Heinhold et al. (2013). However, the results here differ in that both of these previous studies found a stronger NLLJ response in 12 km simulations with convective parameterizations than was found here in the 15 km parameterized ensemble. In contrast to the findings of Marsham et al. (2011) and Heinhold et al. (2013), dust emissions and airborne dust mass increase in the WRF-Chem simulations in the convection-permitting simulation, which is in closer agreement with the studies of Reinfried et al. (2009) and Bouet et al. (2012), who used COSMO-MUSCAT and RAMS-DPM, respectively. Considering each study used a different model and therefore different physics, it is unsurprising that the results vary. However, it is not apparent how much of a role the region or specific case study plays in this difference, and this is an area for future work.
The temporal trends in vertically integrated dust mass lag behind those observed in the DUP plots in Fig. 4. Particularly at time steps where DUP decreases, the change in integrated dust mass follows several hours later. The time series of gravitational settling rates at the surface (Fig. 5b) also lags behind the DUP trends, which implies that the removal mechanisms for dust take time to act on the airborne particles once they are emitted. The rates of gravitational settling are higher in the convection-permitting simulation compared with the coarse simulations because more dust is available aloft to settle out. Nevertheless, Fig. 6a suggests that this increase in gravitational settling rates in the 3 km case is not enough to offset the higher dust emissions, or that the vertically integrated dust quantities would be similar across all the simulations. The fact that the vertically integrated dust values are higher in the 3 km simulation, despite higher rates of gravitational settling, implies that there must be a mechanism that acts to keep dust suspended longer in the convection-permitting simulations than in those with parameterized convection. There are clearly more processes occurring above the surface to influence the vertically integrated dust quantities than just a simple surface emission to surface deposition ratio. This will be further deconstructed by examining vertical profiles in the following section.
3.2 Vertical characteristics
3.2.1 Vertical dust and velocity profiles
Moving away from vertically integrated quantities to a time- and domain-averaged vertical snapshot of dust (Fig. 7a), the vertical dust profile follows a generally exponentially decreasing function and tapers off to low dust concentrations in the range of 5–6 km above ground level (a.g.l.). A widespread subsidence inversion is present near 6 km throughout the case study time period over the inner basin of the Arabian Peninsula (Fig. 2), acting as a cap on vertical motions and dust transport. Because dust concentrations do not vary much above this height, the plots in Fig. 7 have been truncated at 9 km. There is a higher concentration of dust at every level in the convection-permitting simulation compared with that in the coarse simulations. Examining the percent difference plot between the convection-permitting and other simulations in Fig. 7b, there is a difference of approximately 80 % at the surface, which increases upwards to ∼180 % at 6 km. Above this level, the percent difference between the convection-permitting and coarse simulations changes sign, but the overall concentration is extremely low, and, as such, the authors make no attempt to assign meaning to the differences above 6 km.
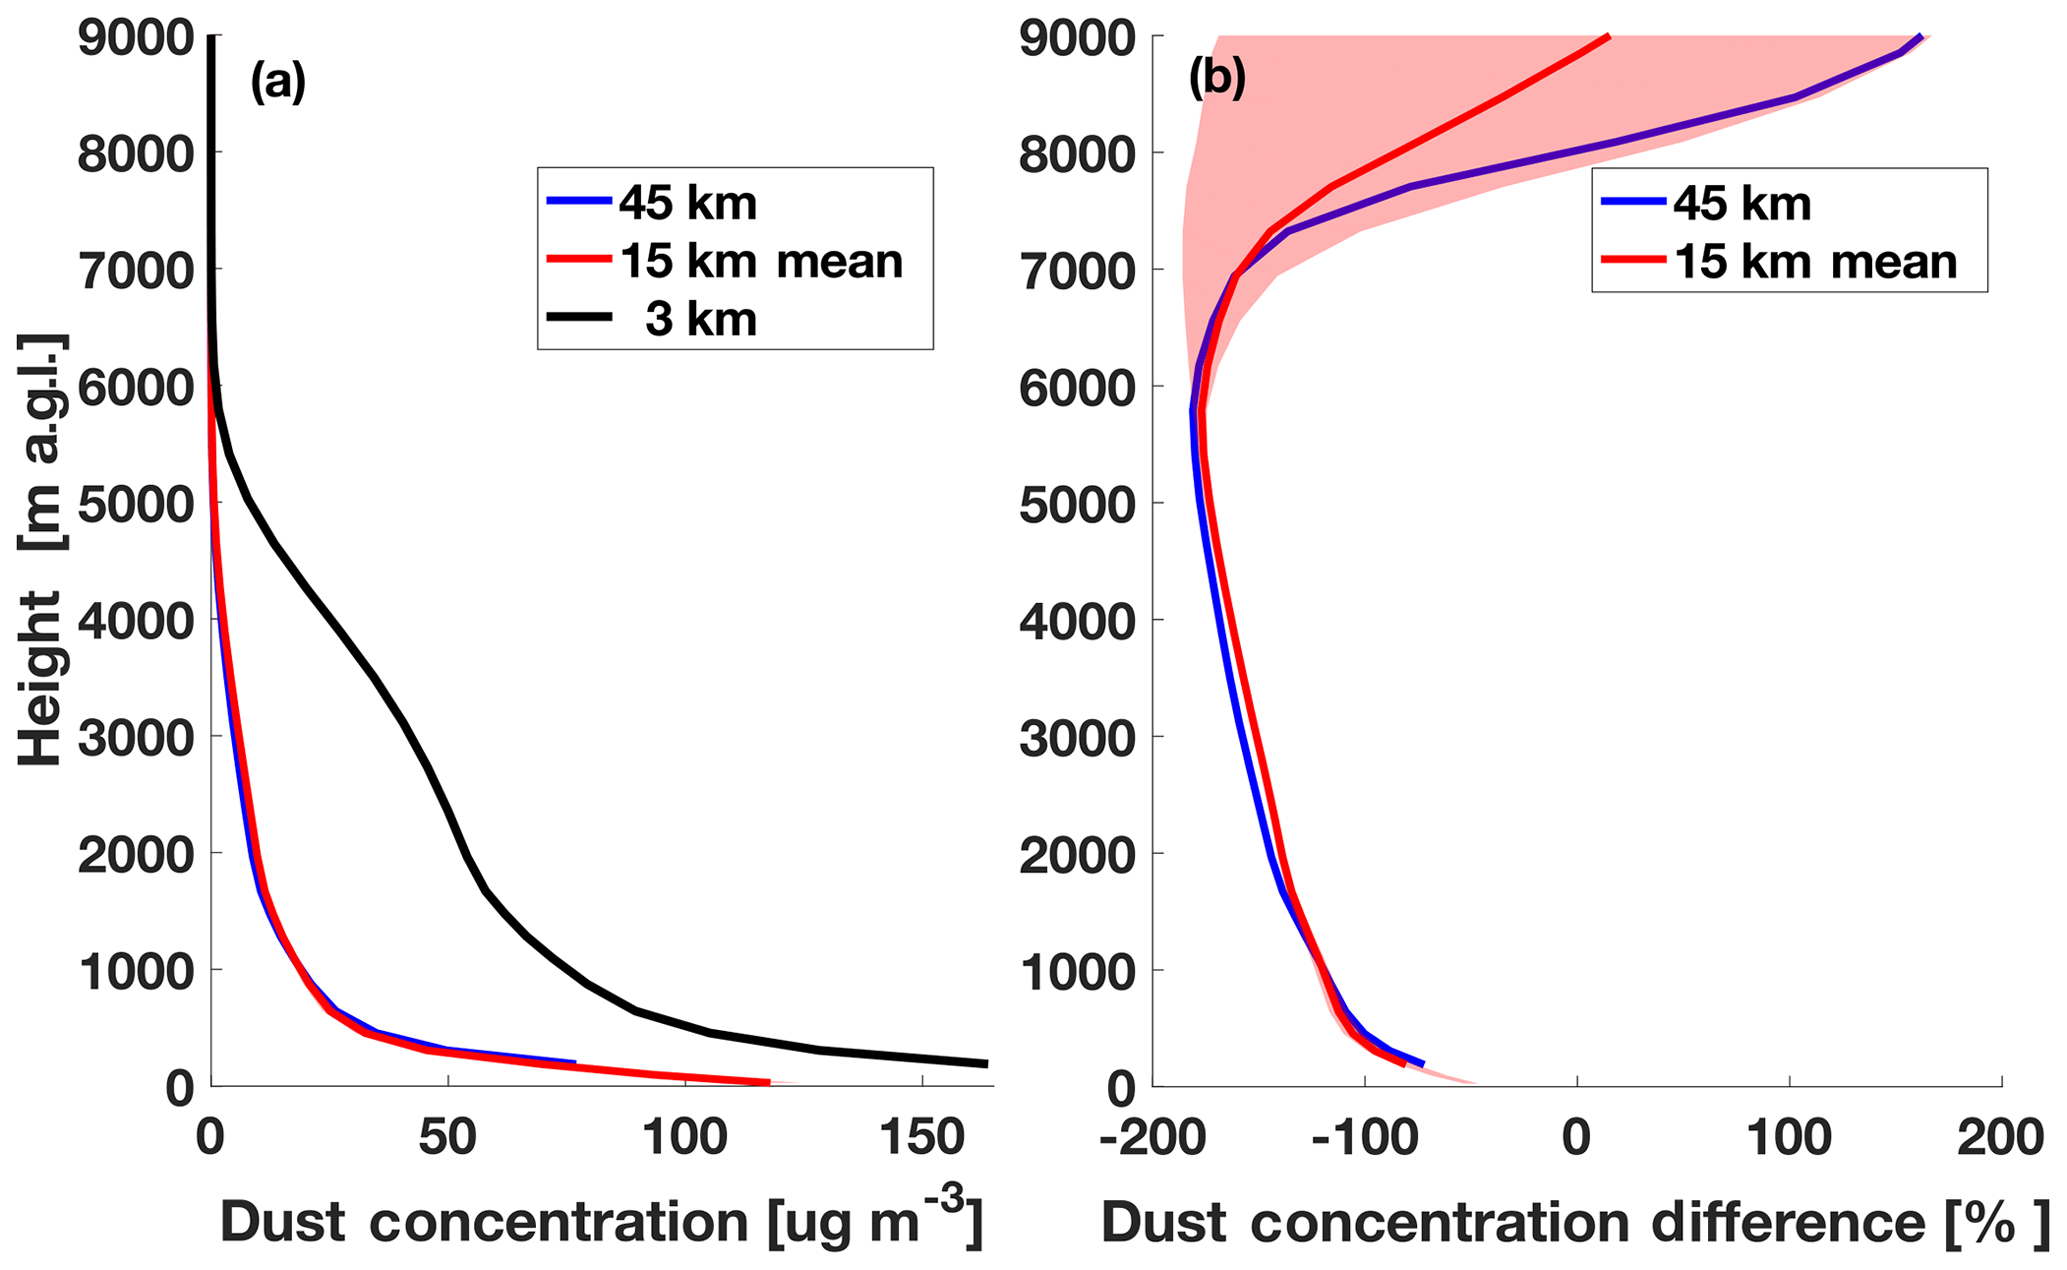
Figure 7 (a) Spatially and temporally averaged vertical dust concentrations as well as (b) the percent difference between the 3 km convection-permitting simulation and the simulations employing cumulus parameterizations. Plots are truncated at 9 km as the values above this height do not significantly vary from what is shown here. Colors and shading are identical to those used in previous figures.
For dust to reach higher levels in the atmosphere, it must undergo vertical transport to move it aloft from its initial source region at the surface. Several mechanisms could be responsible for vertical dust transport in the Arabian Peninsula, including flow over terrain, daytime mixing (dry convection), and, lastly, moist convective updrafts, whose representation (explicit versus parameterized) is a defining difference between the horizontal resolutions tested in this paper. An investigation of the effect that increasing resolution has on updraft and downdraft strength can be found in Fig. 8, which represents the mean of all vertical velocities above or below 0 m s−1, including points that are not vertically continuous. As resolution increases, the average range in vertical velocity also increases. The simulations with parameterized convection have lower mean updraft/downdraft speeds than the convection-permitting simulation, which are of the order of ∼75 % weaker near the surface for the 15 km runs and ∼110 % weaker for the 45 km run. It is known that the updraft radius scales with the grid spacing in numerical models (e.g., Bryan and Morrison, 2012), with a compensating increase in updraft speed as the radius decreases. This relationship skews the frequency of vertical velocities to higher values. Irrespective of resolution, the mean updraft speeds in the WRF-Chem simulations are slightly higher than the downdraft speeds, whereas at the surface mean downdraft speeds are higher than updraft speeds; this is a consideration that will be discussed further in Sect. 3.2.2.
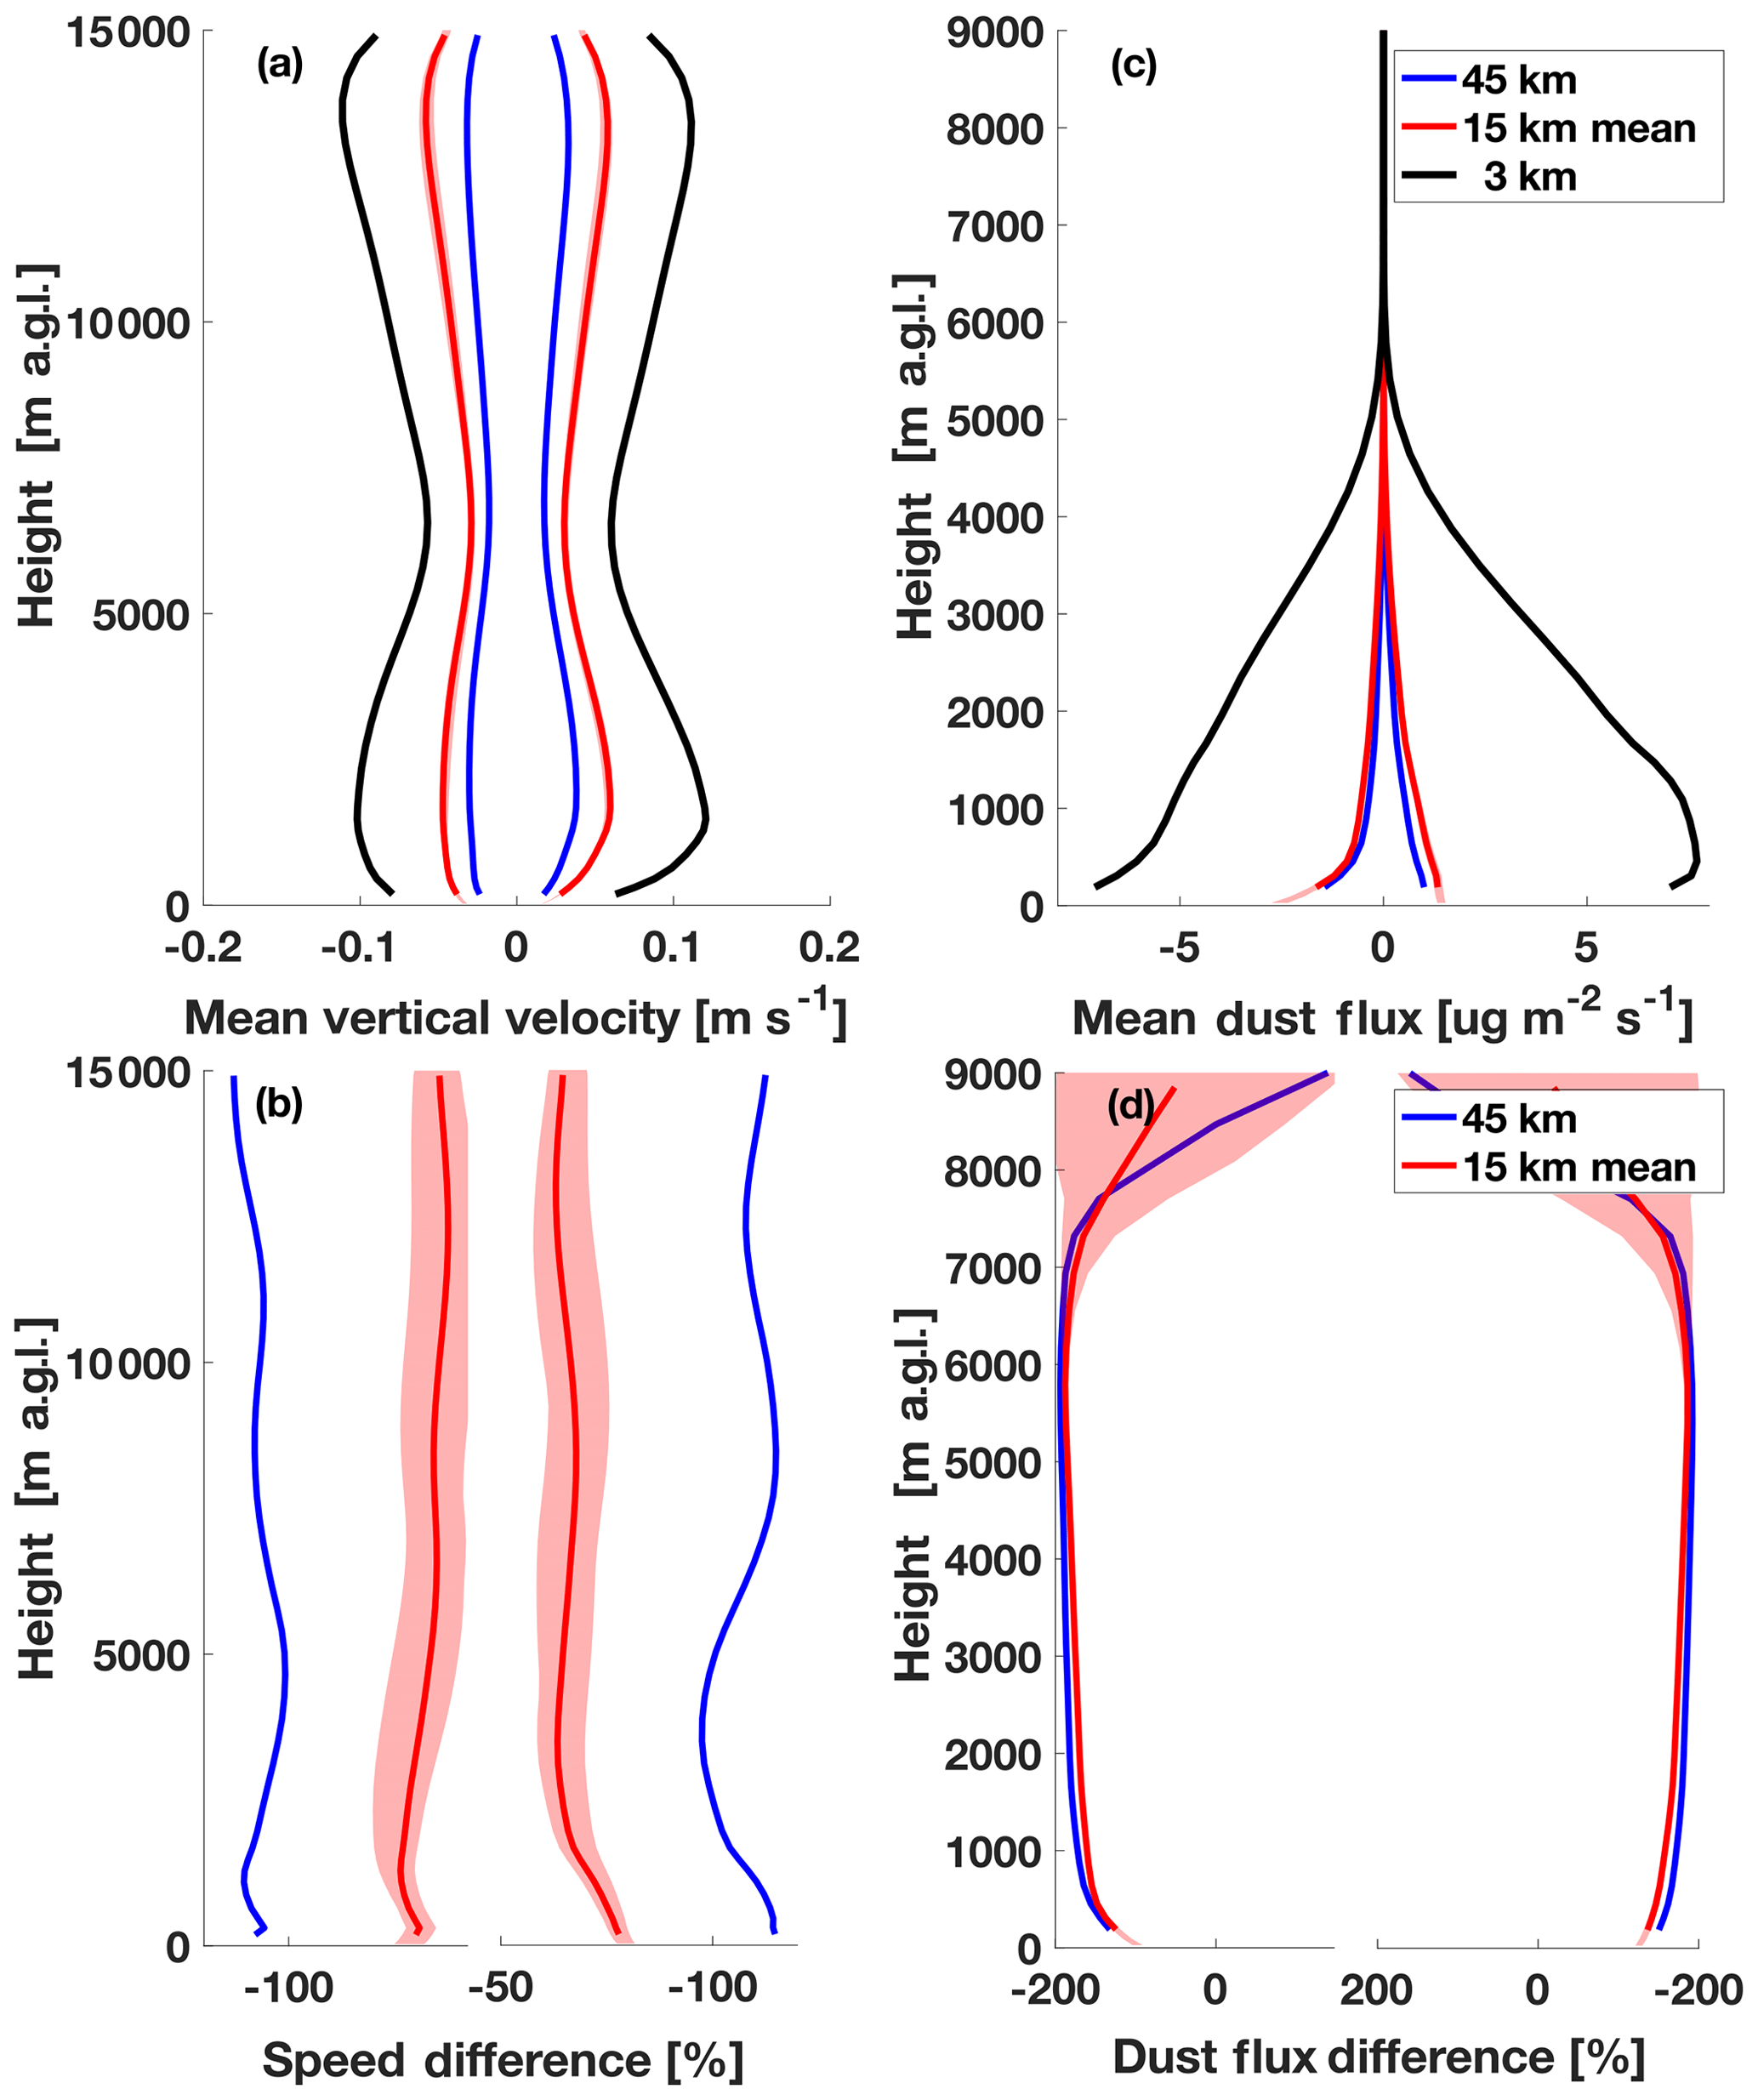
Figure 8 (a) Spatially and temporally averaged vertical velocities as well as (b) the percent difference between the 3 km convection-permitting simulation and the simulations employing cumulus parameterizations. All velocities above or below zero were considered. Colors and shading are identical to those used previous figures. Panels (c) and (d) are the same as panels (a) and (b) but represent the vertical dust mass flux. Note that the vertical axes are truncated at 9 km in panels (c) and (d) as the values above this height do not vary significantly from what is shown here.
3.2.2 Vertical dust flux
The implication for dust transport based on vertical velocities is convoluted, as updrafts and downdrafts work concurrently to redistribute aerosol. As noted in Jung et al. (2005), convective updrafts will lift aerosol particles upward into the free atmosphere, while downdrafts simultaneously limit the maximum vertical extent of these particles. However, the convective transport simulations in Jung et al. (2005) demonstrate that these opposing processes do not act as equal opposites in time, magnitude, and space. This canon holds true for the Arabian Peninsula simulations as well. Figure 9 contains contoured frequency by altitude diagrams (CFADs) of vertical velocity (Yuter and Houze, 1995) normalized by the total number of grid points in each simulation. The normalization is performed to remove an artificial larger frequency in the higher-resolution simulations that arises because there are more grid spaces available to count. Because no vertical velocity threshold is imposed, a majority of points straddle zero. To highlight variability away from the zero line, the CFAD contours are plotted using a log scale.
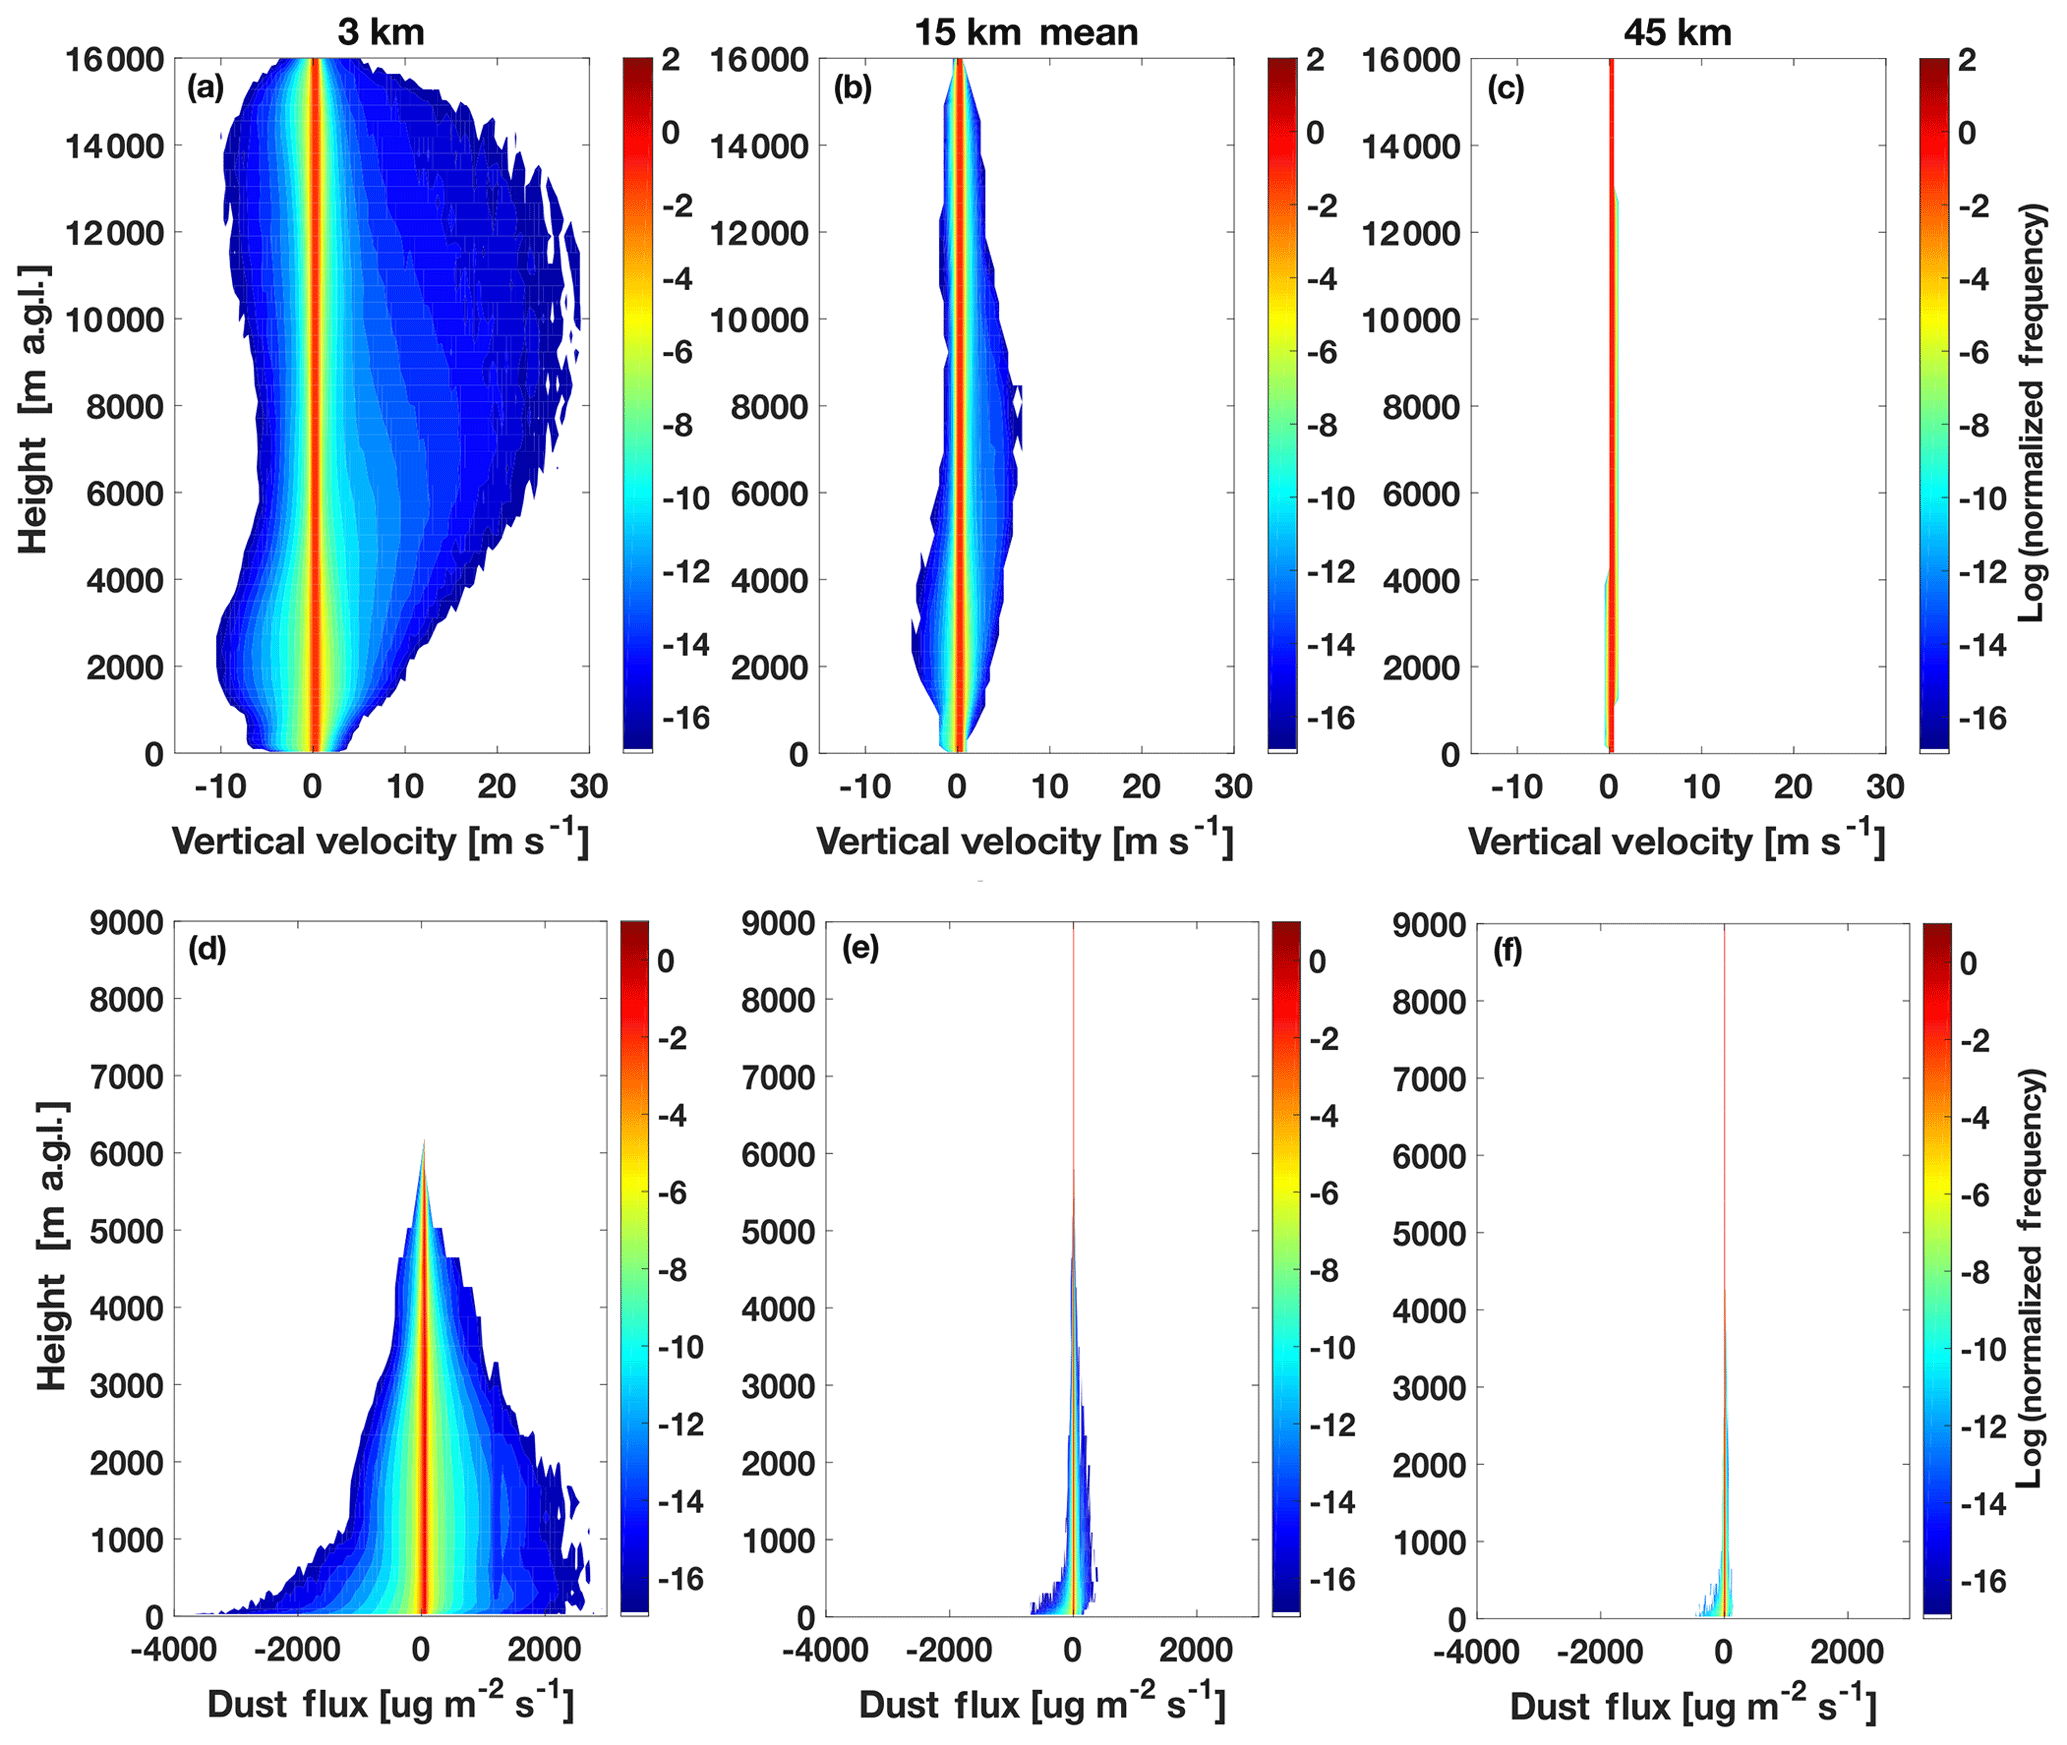
Figure 9(a, b, c) Contoured frequency by altitude diagrams (CFADs) for vertical velocity, normalized by the number of grid points in each respective simulation. The contours are computed on a log scale to highlight the variances away from zero. Panels (d), (e), and (f) show the same but for vertical dust mass flux. Note that panels (d), (e), and (f) are truncated at 9 km as the values above this height do not significantly vary from what is shown here.
Similar to the mean plots in Fig. 8, as resolution increases so does the variability in updraft and downdraft speeds. There is a striking difference between the spread in vertical velocities at all altitudes across the 45 km, 15 km mean, and 3 km simulations in Fig. 9. In the 45 km run, most of the velocities straddle ±1–2 m s−1, whereas the convection-permitting simulation ranges from −10 to 30 m s−1. Not only is the range larger, but the normalized frequency is greater in the fine-resolution simulation as well. The inference here is that stronger updrafts will transport dust higher in the atmosphere, and that stronger updrafts are observed more frequently in the convection-permitting simulation, thereby enhancing the vertical dust transport.
Combining the information on the vertical distribution of dust and updraft/downdraft speeds, it is possible to calculate a domain-averaged dust flux profile (Fig. 8). Again, the magnitude of the dust flux upwards and downwards from the surface through 6 km a.g.l. is higher in the convection-permitting simulation compared to the parameterized simulations. Moreover, the mean near-surface upwards dust flux is stronger than that for the downward dust flux, which coincides with the mean updraft speeds being slightly higher than the mean downdraft speeds at these same vertical levels (Fig. 8). This relationship also holds in the dust flux CFADs (Fig. 9), in which the upward and downward flux of dust has more variability in the 3 km simulation, and stronger vertical dust fluxes are more frequent.
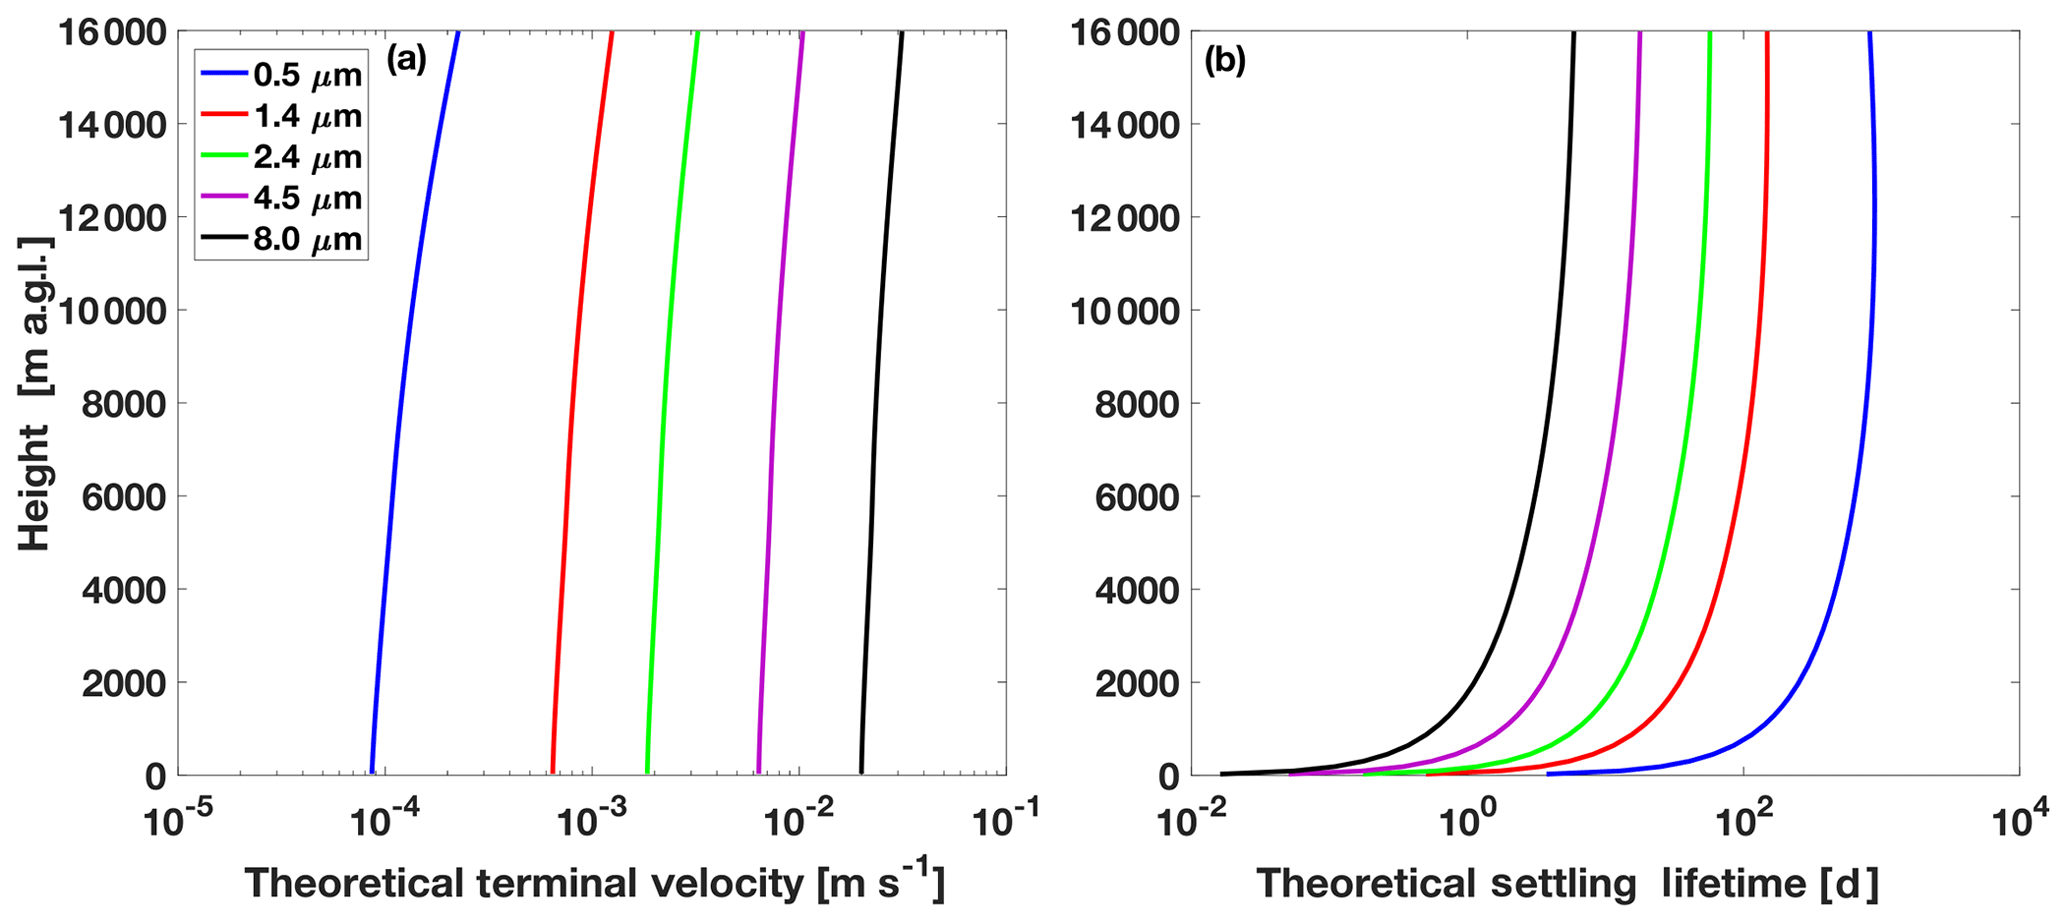
Figure 10(a) Theoretical terminal velocity of dust particles based on Stokes settling velocity with slip correction for pressure dependence for the five effective radii of dust particles in WRF-Chem. The calculations assume no vertical motion, advection, deposition, coagulation, or condensation. (b) The lifetime of these theoretical dust particles based on their height in the atmosphere.
Similarly, there is more dust transport evident at higher vertical levels in the convection-permitting simulation, which has implications for the residence time of the dust particles. As dust is transported higher in the atmosphere, absent any sort of external motion or coagulation outside of gravitational settling, the atmospheric lifetime of the particles will increase. Figure 10 shows the theoretical terminal velocity of dust particles in WRF-Chem using the Stokes settling velocity with slip correction for pressure dependence (Fig. 10a) and their lifetime based on different starting heights in the atmosphere (Fig. 10b), which increases exponentially away from the surface. As such, dust in the convection-permitting simulation will take longer to settle out, leading to the higher observed vertically integrated dust values (Fig. 5) compared with the parameterized simulations. Looking at the distribution of downdrafts in the vertical velocity CFADs (Fig. 9), there is a clear bimodal signal aloft in both the convection-permitting and 15 km simulations; this is representative of two distinct subsidence layers, which act as a cap on vertical transport. The local minimum occurs around 6 km, which could explain why dust fluxes also taper off at this level.
At the surface, higher dust flux values are found in association with the downdrafts, producing a pronounced skewness towards high, yet infrequent values of strong negative dust flux towards the ground (Fig. 9). It is hypothesized that this skewness is a consequence of the dissimilar background dust conditions in the vicinity of near-surface downdrafts and updrafts, similar to the results found by Seigel and van den Heever (2012), who studied the ingestion of dust by a supercell storm. Updrafts originate in relatively clear air, and they consume background dust and transport it upwards. However, downdrafts occur through the cold pool; hence, their source is, at least partially, within the dusty cold pool. As such, downdrafts will have access to more dust and, thus, transport more of it in the downward direction. This skewness warrants further research, preferably from an idealized perspective, to better understand the relationship between storm dynamics, dust emissions, and transport.
In all, the increased vertical dust concentration profile and vertically integrated dust values in the 3 km run are a product of several processes working together. Compared with the simulations with parameterized convection, the 3 km run has enhanced potential for dust uplift due to stronger resolved downdrafts and lower wind velocity thresholds; higher vertical transport due to more frequent, stronger updrafts; and a lengthier theoretical residence time once being lofted to higher levels.
3.3 Impacts on radiation
Beyond the first-order sensitivity of model resolution to dust emissions and concentrations for the Arabian Peninsula case study, there are higher-order effects that disseminate from changing dust concentrations. One example is the modification of atmospheric heating/cooling rates and the radiation budget due to dust absorption and scattering (see Sect. 1). The domain- and time-averaged shortwave (SW), longwave (LW), and net dust heating/cooling rates are found in Fig. 11. The average dust heating and cooling rates were calculated over the last 48 h of the simulation as a difference between the radiation tendency with dust aerosols and without. Ostensibly, as dust concentrations increase in the model as resolution increases so does the magnitude of the radiative effects. There is a stronger SW cooling and LW heating effect in the 3 km simulation, and this trend follows the vertical distribution of dust from Fig. 7, again tapering off near 5–6 km a.g.l.
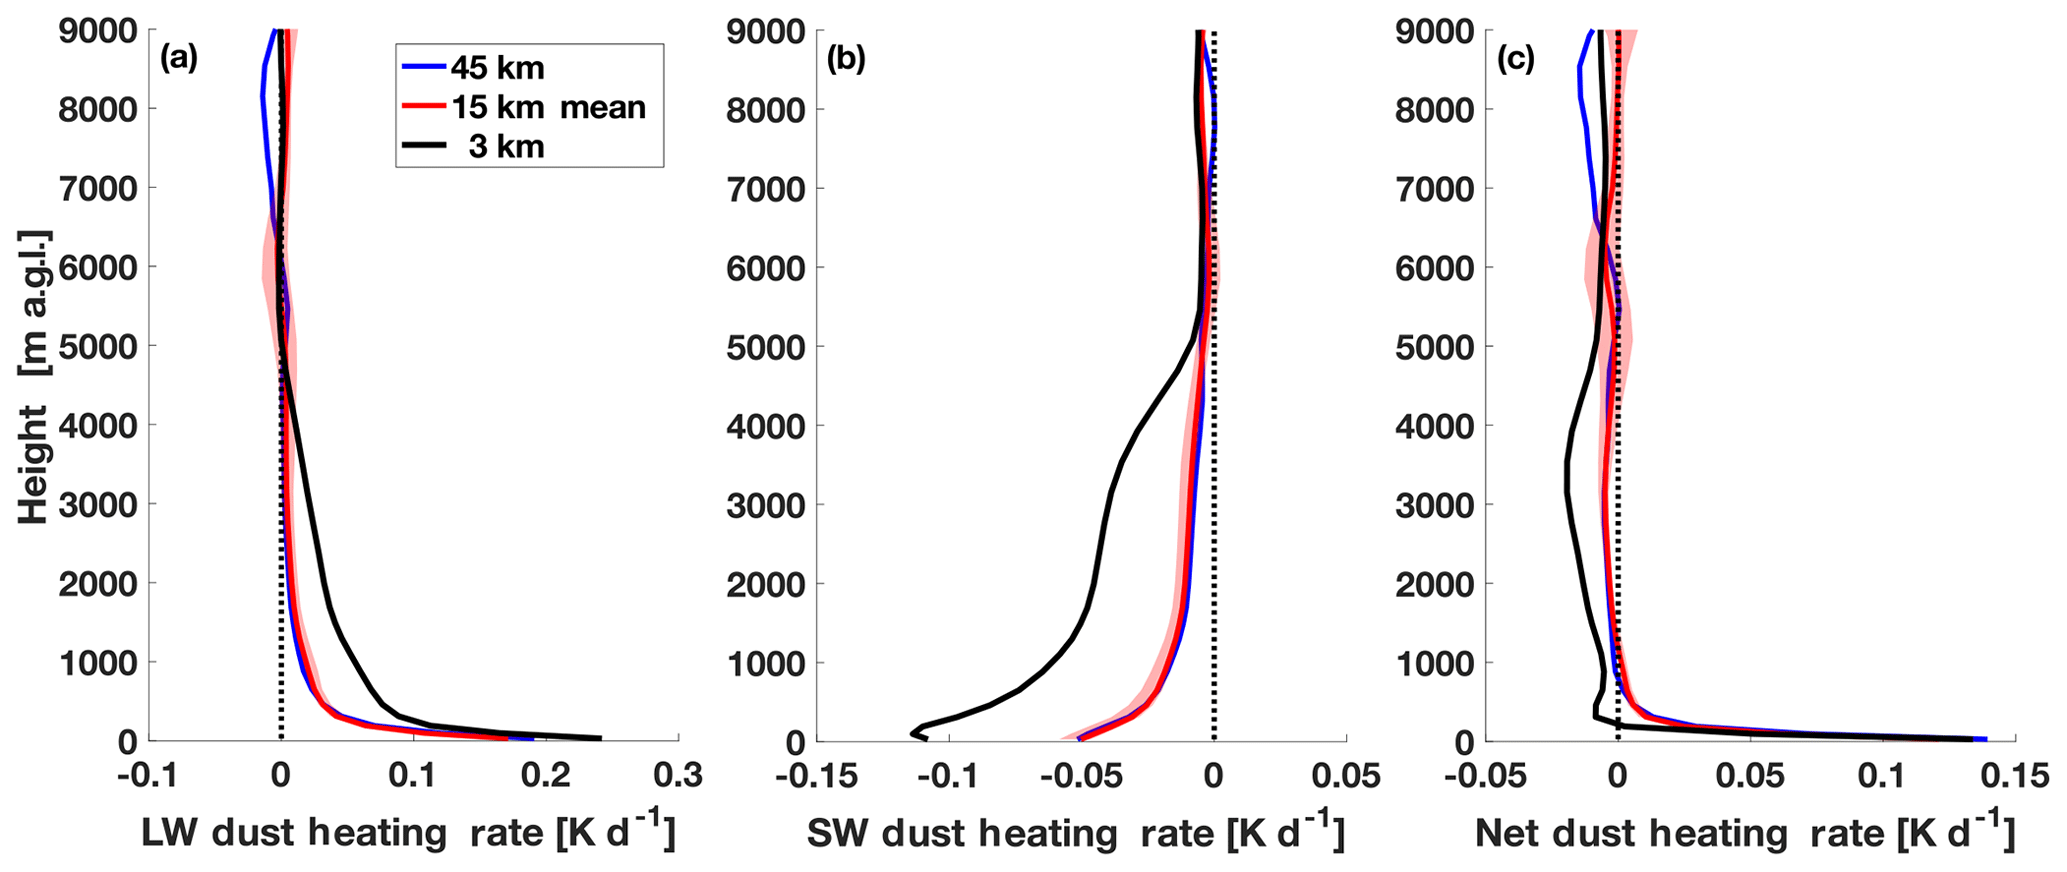
Figure 11Spatially and temporally averaged longwave (a), shortwave (b), and net (c) dust heating rate profile for the 45 km (blue), 15 km mean (red), and 3 km (black) simulations with the maximum and minimum spread across the 15 km simulations indicated in light red shading. Plots are truncated at 9 km as the values above this height do not significantly vary from what is shown here.
Most interestingly, however, is the difference in the net aerosol heating rate. In the lowest layer (<1.5 km), there is a sign change between the fine and coarse simulations. The SW effect in the convection-permitting simulation is strong enough to elicit a net cooling effect in this near-surface layer. Conversely, the LW aerosol heating effect dominates in the coarse simulations, resulting in a net warming effect. The model has a stronger SW effect for dust based on the prescribed index of refraction, but is also related to the timing of dust emissions, considering the SW effect is only active during the daytime. The difference between warming and cooling can have cascading effects on the thermodynamic profile, static stability, and future convective development, which, in turn, impacts the relative importance between convection and the NLLJ discussed earlier. The sensitivity of dust concentrations to horizontal model resolution is important to understand in its own right, but this sensitivity also leads to higher-order changes in model predictions. If NWP models or global climate models (GCMs) are going to incorporate dust radiative effects, concentrations need to be highly constrained, not only to accurately capture the magnitude but also the sign of the response.
For this Arabian Peninsula event, the horizontal resolution in the WRF-Chem model has a considerable effect on the dust budget of the region. Because aerosol prediction models and GCMs still employ cumulus parameterizations, it is important to discuss the uncertainties unearthed in this paper as well as recommendations for past and future forecasts and research that will be generated prior to our ability to consistently run these models at convection-permitting resolutions.
In an average sense, there will be higher dust concentrations produced in convection-permitting simulations compared with those with parameterized convection. The major point here is that the uncertainty in dust concentrations for simulations using different cumulus parameterizations (15 km ensemble) or those using different horizontal resolutions with the same cumulus parameterizations (45 km versus 15 km) is small relative to the differences between the use of parameterized versus convection-permitting scales. Most of the uncertainty in the model's predicted dust concentrations comes from the choice to either parameterize convection or run at convection-permitting scales.
The results of this research do not stand alone in the literature focused on the impact of horizontal model resolution on dust emissions, and there are several similarities and differences to note when comparing this paper to previous studies. Firstly, concerning the diurnal variation in dust emissions, we find a similar response in the NLLJ mechanism to that of Heinhold et al. (2013) and Marsham et al. (2011), whereby the coarsest simulations overestimate the early morning wind speeds caused by the mixing of the jet to the surface and fail to capture the late afternoon/early evening convective dust lofting mechanism. In these previous studies, the convection-permitting simulation reduces the importance of the NLLJ and enhances the convective maximum, but it still retains the NLLJ as the dominant process for dust uplift. Overall, Heinhold et al. (2013) and Marsham et al. (2011) found a net reduction in dust uplift while running at convection-permitting scales. While the NLLJ mechanism is found to be similar here, the analysis reveals an opposite response in WRF-Chem for the Arabian Peninsula, in which the convective maximum dominates, but the NLLJ is still an important mechanism, which thereby leads to more rather than less dust in the convection-permitting simulations. The net increase in dust concentrations in WRF-Chem is similar to the findings of Reinfried et al. (2009), although Reinfried et al. (2009) focused mainly on haboobs, which may point to convection being the source of agreement rather than the balance between the NLLJ and convection. At this point, we cannot determine whether the discrepancies between our results and previous literature comes from regional or case study differences in the importance of these mechanisms to the dust budget, differences in the models' representation of these processes, or a combination of the two. In all, more work needs to be carried out to investigate the relationship between the NLLJ and subsequent late afternoon convection in dust-producing regions as well as the representation of this in numerical models.
For the Arabian Peninsula region, from a vertically integrated viewpoint, it is possible to rudimentarily tune the dust concentrations of the coarse simulations to that of the convection-permitting simulation by multiplying by an average constant derived from the dust difference plots in Figs. 6–7, which would be of the order of ∼2. This is an offline solution, which would aid in enhancing the accuracy of a first-order forecast of vertically integrated or surface dust, and/or AOD. This factor would have to be scaled further, as comparison of the WRF-Chem model to AERONET sites and other AOD observations (Saleeby et al., 2019) shows that WRF-Chem underestimates dust under these conditions. Nevertheless, attempting to use this tuning parameter online in the model (i.e., adjusting the tuning constant, C, in Eq. 1) would not reconcile the differences from a dust flux standpoint. Even if more dust were to be emitted from the surface, the parameterized simulations still lack the necessary variability in updrafts and downdrafts, especially updraft strength, to transport the dust upwards and away from the surface, thus misrepresenting the atmospheric lifetime of these particles in the process.
Moreover, tuning the dust concentrations will not change the effect that horizontal resolution has on the soil characteristics, particularly soil moisture, and, hence, on the a priori threshold wind speeds which are important in calculating dust lofting in the first place (Fig. 4). If dust concentrations are inaccurately predicted in the coarse simulations, or erroneously tuned, the higher-order online feedbacks will also be incorrect, such as modifications to the radiative budget and feedbacks to the thermodynamic profile, static stability and mesoscale features, particularly those driven by differences in thermodynamic gradients, such as sea breezes and cold pool propagation.
In this study, we have quantified the response sign and magnitude in modeled dust fields in the WRF-Chem regional model to increasing horizontal resolution and the manner in which convection is represented for a summertime Arabian Peninsula event. We have investigated the variability in dust concentrations and fluxes due to the choice of convective parameterization, the representation of convection in the model (explicit versus parameterized), and the effect that these differences in dust concentrations have on aerosol heating rates. The case study was simulated at three different horizontal resolutions (45, 15, and 3 km), with the two coarsest simulations run with cumulus parameterizations, and the 3 km simulation run at convection-permitting resolution. To understand the uncertainty across different parameterizations, five separate cumulus parameterizations were tested in an ensemble (BMJ, AS, GD, TD, and KF) at 15 km grid spacing.
The convection-permitting simulation exhibited a stronger potential for dust uplift as a function of modeled wind speed, wind threshold, and the location of dust sources. The wind threshold for dust lofting in the 3 km simulation was lower on average than that for the 15 km or 45 km. This is due to differences in grid resolution leading to changes in the soil moisture, whereby the 3 km simulation displays lower soil wetness across the domain. Furthermore, a distinct difference across simulations was identified in the representation of the bimodal daily maximum in dust emissions in the local midmorning (mixing of the NLLJ to the surface) and late afternoon (convective outflow boundaries). Compared with the 3 km case, the 45 km simulation overestimates the contribution from the NLLJ and underestimates the role of convection in dust emissions.
The 3 km simulation also produced higher vertically integrated dust values at every time step as well as higher dust concentrations at every vertical level in the lower troposphere (below 6 km a.g.l.). The uncertainty in dust concentrations for simulations using different cumulus parameterizations (15 km ensemble spread) is much smaller than the difference between the parameterized and convection-permitting convection cases. For the WRF-Chem Arabian Peninsula simulations, the modeled dust fields were most sensitive to the choice of parametrizing or explicitly resolving convective processes. The enhanced dust concentrations in the convection-permitting case are the result of stronger downdrafts lofting more dust from the surface and stronger updrafts carrying dust to higher levels of the atmosphere, thereby increasing the airborne lifetime of the dust particles. The difference in dust mass across the simulations leads to a significant modification of the radiation budget, specifically the aerosol heating rate. The convection-permitting simulation revealed a greater SW and LW effect; moreover, for aerosol heating rates in the lowest levels, the SW cooling is stronger than LW heating, leading to a net cooling effect. Conversely, the opposite radiative response is present in the parameterized cases, resulting in a net warming effect, causing a change in sign in the lowest levels compared with the convection-permitting case.
There are a number of implications these results may have on forecasting and future studies. The dust concentrations in the coarse simulations could be tuned offline to match those in the convection-permitting simulation using the percentage difference plots included in Figs. 5–6. This tuning would be of the order of ∼2. However, because vertical transport is essential to the vertical concentrations and lifetime of the particles, this tuning factor cannot be applied online. Even if such a tuning were applied, this change will not accurately capture higher-order feedbacks to the meteorology, thermodynamic environment, and radiation budget of the Arabian Peninsula, or to the soil moisture wind threshold velocities. Finally, this work also points to the need to better constrain dust concentrations in numerical models and further develop our understanding of the relationship between storm dynamics and dust processes.
The model namelists and the information necessary to reproduce the simulations are available at https://doi.org/10.25675/10217/201142 (Bukowski and van den Heever, 2020). The initialization data for the model were provided by the National Centers for Environmental Prediction: https://doi.org/10.5065/D6M043C6 (National Centers for Environmental Prediction et al., 2000).
JB and SCvdH designed the experiments. JB set up and performed the WRF-Chem simulations and wrote the analysis code. Both JB and SCvdH contributed to the analysis of the model output. JB prepared the paper with contributions and edits from SCvdH.
The authors declare that they have no conflict of interest.
This article is part of the special issue “Holistic Analysis of Aerosol in Littoral Environments – A Multidisciplinary University Research Initiative (ACP/AMT inter-journal SI)”. It is not associated with a conference.
Jennie Bukowski was partially supported by the Cooperative Institute for Research in the Atmosphere (CIRA) – Program of Research and Scholarly Excellence (PRSE) fellowship.
This work was funded by the Office of Naval Research – Multidisciplinary University Research Initiative (ONR-MURI; grant no. N00014-16-1-2040).
This paper was edited by Jui-Yuan Christine Chiu and reviewed by two anonymous referees.
Alizadeh Choobari, O., Zawar-Reza, P., and Sturman, A.: Low level jet intensification by mineral dust aerosols, Ann. Geophys., 31, 625–632, https://doi.org/10.5194/angeo-31-625-2013, 2013.
Almazroui, M.: Calibration of TRMM rainfall climatology over Saudi Arabia during 1998–2009, Atmos. Res., 99, 400–414, https://doi.org/10.1016/J.ATMOSRES.2010.11.006, 2011.
Arakawa, A. and Schubert, W. H.: Interaction of a Cumulus Cloud Ensemble with the Large-Scale Environment, Part I, J. Atmos. Sci., 31, 674–701, https://doi.org/10.1175/1520-0469(1974)031<0674:IOACCE>2.0.CO;2, 1974.
Babu, C. A., Jayakrishnan, P. R., and Varikoden, H.: Characteristics of precipitation pattern in the Arabian Peninsula and its variability associated with ENSO, Arab. J. Geosci., 9, 186, https://doi.org/10.1007/s12517-015-2265-x, 2016.
Baddock, M. C., Strong, C. L., Leys, J. F., Heidenreich, S. K., Tews, E. K., and McTainsh, G. H.: A visibility and total suspended dust relationship, Atmos. Environ., 89, 329–336, https://doi.org/10.1016/J.ATMOSENV.2014.02.038, 2014.
Barnard, J. C., Fast, J. D., Paredes-Miranda, G., Arnott, W. P., and Laskin, A.: Technical Note: Evaluation of the WRF-Chem “Aerosol Chemical to Aerosol Optical Properties” Module using data from the MILAGRO campaign, Atmos. Chem. Phys., 10, 7325–7340, https://doi.org/10.5194/acp-10-7325-2010, 2010.
Beegum, S. N., Gherboudj, I., Chaouch, N., Temimi, M., and Ghedira, H.: Simulation and analysis of synoptic scale dust storms over the Arabian Peninsula, Atmos. Res., 199, 62–81, https://doi.org/10.1016/J.ATMOSRES.2017.09.003, 2018.
Benedetti, A., Baldasano, J. M., Basart, S., Benincasa, F., Boucher, O., Brooks, M. E., Chen, J.-P., Colarco, P. R., Gong, S., Huneeus, N., Jones, L., Lu, S., Menut, L., Morcrette, J.-J., Mulcahy, J., Nickovic, S., Pérez García-Pando, C., Reid, J. S., Sekiyama, T. T., Tanaka, T. Y., Terradellas, E., Westphal, D. L., Zhang, X.-Y., and Zhou, C.-H.: Operational Dust Prediction, in: Mineral Dust: A Key Player in the Earth System, edited by: Knippertz, P. and Stuut, J.-B. W., Springer Netherlands, Dordrecht, 223–265, 2014.
Benedetti, A., Reid, J. S., Knippertz, P., Marsham, J. H., Di Giuseppe, F., Rémy, S., Basart, S., Boucher, O., Brooks, I. M., Menut, L., Mona, L., Laj, P., Pappalardo, G., Wiedensohler, A., Baklanov, A., Brooks, M., Colarco, P. R., Cuevas, E., da Silva, A., Escribano, J., Flemming, J., Huneeus, N., Jorba, O., Kazadzis, S., Kinne, S., Popp, T., Quinn, P. K., Sekiyama, T. T., Tanaka, T., and Terradellas, E.: Status and future of numerical atmospheric aerosol prediction with a focus on data requirements, Atmos. Chem. Phys., 18, 10615–10643, https://doi.org/10.5194/acp-18-10615-2018, 2018.
Bishop, J. K. B., Davis, R. E., and Sherman, J. T.: Robotic Observations of Dust Storm Enhancement of Carbon Biomass in the North Pacific, Science, 298, 817 LP-821, https://doi.org/10.1126/science.1074961, 2002.
Boose, Y., Welti, A., Atkinson, J., Ramelli, F., Danielczok, A., Bingemer, H. G., Plötze, M., Sierau, B., Kanji, Z. A., and Lohmann, U.: Heterogeneous ice nucleation on dust particles sourced from nine deserts worldwide – Part 1: Immersion freezing, Atmos. Chem. Phys., 16, 15075–15095, https://doi.org/10.5194/acp-16-15075-2016, 2016.
Bouet, C., Cautenet, G., Bergametti, G., Marticorena, B., Todd, M. C., and Washington, R.: Sensitivity of desert dust emissions to model horizontal grid spacing during the Bodélé Dust Experiment 2005, Atmos. Environ., 50, 377–380, https://doi.org/10.1016/J.ATMOSENV.2011.12.037, 2012.
Bukowski, J. and van den Heever, S.: Data associated with “Convective distribution of dust over the Arabian Peninsula: the impact of model resolution”, https://doi.org/10.25675/10217/201142, 2020.
Bryan, G. H., and Morrison, H.: Sensitivity of a Simulated Squall Line to Horizontal Resolution and Parameterization of Microphysics, Mon. Weather Rrev., 140, 202–225, https://doi.org/10.1175/MWR-D-11-00046.1, 2012.
Camino, C., Cuevas, E., Basart, S., Alonso-Pérez, S., Baldasano, J. M., Terradellas, E., Marticorena, B., Rodríguez, S., and Berjón, A.: An empirical equation to estimate mineral dust concentrations from visibility observations in Northern Africa, Aeolian Res., 16, 55–68, https://doi.org/10.1016/J.AEOLIA.2014.11.002, 2015.
Chou, M.-D. and Suarez, M. J.: Technical Report Series on Global Modeling and Data Assimilation A Thermal Infrared Radiation Parameterization for Atmospheric Studies Revised May 2003, Nasa Tech. Memo. 15, NASA, 40 pp., 1999.
Cowie, S. M., Marsham, J. H., and Knippertz, P.: The importance of rare, high-wind events for dust uplift in northern Africa, Geophys. Res. Lett., 42, 8208–8215, https://doi.org/10.1002/2015GL065819, 2015.
Dayan, U., Ziv, B., Margalit, A., Morin, E., and Sharon, D.: A severe autumn storm over the middle-east: synoptic and mesoscale convection analysis, Theor. Appl. Climatol., 69, 103–122, https://doi.org/10.1007/s007040170038, 2001.
DeMott, P. J., Sassen, K., Poellot, M. R., Baumgardner, D., Rogers, D. C., Brooks, S. D., Prenni, A. J., and Kreidenweis, S. M.: African dust aerosols as atmospheric ice nuclei, Geophys. Res. Lett., 30, 1732, https://doi.org/10.1029/2003GL017410, 2003.
Dipu, S., Prabha, T. V., Pandithurai, G., Dudhia, J., Pfister, G., Rajesh, K., and Goswami, B. N.: Impact of elevated aerosol layer on the cloud macrophysical properties prior to monsoon onset, Atmos. Environ., 70, 454–467, https://doi.org/10.1016/J.ATMOSENV.2012.12.036, 2013.
Dubovik, O., Sinyuk, A., Lapyonok, T., Holben, B. N., Mishchenko, M., Yang, P., Eck, T. F., Volten, H., Muñoz, O., Veihelmann, B., van der Zande, W. J., Leon, J.-F., Sorokin, M., and Slutsker, I.: Application of spheroid models to account for aerosol particle nonsphericity in remote sensing of desert dust, J. Geophys. Res., 111, D11208, https://doi.org/10.1029/2005JD006619, 2006.
Emmons, L. K., Walters, S., Hess, P. G., Lamarque, J.-F., Pfister, G. G., Fillmore, D., Granier, C., Guenther, A., Kinnison, D., Laepple, T., Orlando, J., Tie, X., Tyndall, G., Wiedinmyer, C., Baughcum, S. L., and Kloster, S.: Description and evaluation of the Model for Ozone and Related chemical Tracers, version 4 (MOZART-4), Geosci. Model Dev., 3, 43–67, https://doi.org/10.5194/gmd-3-43-2010, 2010 (data available at: https://www.acom.ucar.edu/cam-chem/cam-chem.shtml, last access: 20 December 2019).
Fast, J. D., Gustafson Jr., W. I., Easter, R. C., Zaveri, R. A., Barnard, J. C., Chapman, E. G., Grell, G. A., and Peckham, S. E.: Evolution of ozone, particulates, and aerosol direct radiative forcing in the vicinity of Houston using a fully coupled meteorology-chemistry-aerosol model, J. Geophys. Res.-Atmos., 111, D21305, https://doi.org/10.1029/2005JD006721, 2006.
Fiedler, S., Schepanski, K., Heinold, B., Knippertz, P., and Tegen, I.: Climatology of nocturnal low‐level jets over North Africa and implications for modeling mineral dust emission, J. Geophys. Res.-Atmos., 118, 6100–6121, https://doi.org/10.1002/jgrd.50394, 2013.
Field, P. R., Möhler, O., Connolly, P., Krämer, M., Cotton, R., Heymsfield, A. J., Saathoff, H., and Schnaiter, M.: Some ice nucleation characteristics of Asian and Saharan desert dust, Atmos. Chem. Phys., 6, 2991–3006, https://doi.org/10.5194/acp-6-2991-2006, 2006.
Giannakopoulou, E. M. and Toumi, R.: The Persian Gulf summertime low-level jet over sloping terrain, Q. J. Roy. Meteor. Soc., 138, 145–157, https://doi.org/10.1002/qj.901, 2012.
Ginoux, P., Chin, M., Tegen, I., Prospero, J. M., Holben, B., Dubovik, O., and Lin, S.-J.: Sources and distributions of dust aerosols simulated with the GOCART model, J. Geophys. Res.-Atmos., 106, 20255–20273, https://doi.org/10.1029/2000JD000053, 2001.
Ginoux, P., Prospero, J. M., Gill, T. E., Hsu, N. C., and Zhao, M.: Global-scale attribution of anthropogenic and natural dust sources and their emission rates based on MODIS Deep Blue aerosol products, Rev. Geophys., 50, RG3005, https://doi.org/10.1029/2012RG000388, 2012.
Grell, G. A. and Dévényi, D.: A generalized approach to parameterizing convection combining ensemble and data assimilation techniques, Geophys. Res. Lett., 29, https://doi.org/10.1029/2002GL015311, 2002.
Grell, G. A., Peckham, S. E., Schmitz, R., McKeen, S. A., Frost, G., Skamarock, W. C., and Eder, B.: Fully coupled “online” chemistry within the WRF model, Atmos. Environ., 39, 6957–6975, https://doi.org/10.1016/J.ATMOSENV.2005.04.027, 2005.
Han, J. and Pan, H.–L.: Revision of convection and vertical diffusion schemes in the NCEP Global Forecast System, Weather Forecast., 26, 520–533, https://doi.org/10.1175/WAF-D-10-05038.1, 2011.
Hasanean, H. and Almazroui, M.: Rainfall: Features and Variations over Saudi Arabia, A Review, Climate, 3, 578–626, https://doi.org/10.3390/cli3030578, 2015.
Haywood, J. M., Allan, R. P., Culverwell, I., Slingo, T., Milton, S., Edwards, J., and Clerbaux, N.: Can desert dust explain the outgoing longwave radiation anomaly over the Sahara during July 2003?, J. Geophys. Res.-Atmos., 110, D05105, https://doi.org/10.1029/2004JD005232, 2005.
Heald, C. L., Ridley, D. A., Kroll, J. H., Barrett, S. R. H., Cady-Pereira, K. E., Alvarado, M. J., and Holmes, C. D.: Contrasting the direct radiative effect and direct radiative forcing of aerosols, Atmos. Chem. Phys., 14, 5513–5527, https://doi.org/10.5194/acp-14-5513-2014, 2014.
Heinold, B., Knippertz, P., Marsham, J. H., Fiedler, S., Dixon, N. S., Schepanski, K., Laurent, B., and Tegen, I.: The role of deep convection and nocturnal low-level jets for dust emission in summertime West Africa: Estimates from convection-permitting simulations, J. Geophys. Res.-Atmos., 118, 4385–4400, https://doi.org/10.1002/jgrd.50402, 2013.
Huneeus, N., Schulz, M., Balkanski, Y., Griesfeller, J., Prospero, J., Kinne, S., Bauer, S., Boucher, O., Chin, M., Dentener, F., Diehl, T., Easter, R., Fillmore, D., Ghan, S., Ginoux, P., Grini, A., Horowitz, L., Koch, D., Krol, M. C., Landing, W., Liu, X., Mahowald, N., Miller, R., Morcrette, J.-J., Myhre, G., Penner, J., Perlwitz, J., Stier, P., Takemura, T., and Zender, C. S.: Global dust model intercomparison in AeroCom phase I, Atmos. Chem. Phys., 11, 7781–7816, https://doi.org/10.5194/acp-11-7781-2011, 2011.
Iacono, M. J., Delamere, J. S., Mlawer, E. J., Shephard, M. W., Clough, S. A., and Collins, W. D.: Radiative forcing by long–lived greenhouse gases: Calculations with the AER radiative transfer models, J. Geophys. Res., 113, D13103, https://doi.org/10.1029/2008JD009944, 2008.
Janjic, Z. I.: The Step–Mountain Eta Coordinate Model: Further developments of the convection, viscous sublayer, and turbulence closure schemes, Mon. Weather Rev., 122, 927–945, https://doi.org/10.1175/1520-0493(1994)122<0927:TSMECM>2.0.CO;2, 1994.
Jickells, T. and Moore, C. M.: The Importance of Atmospheric Deposition for Ocean Productivity, Annu. Rev. Ecol. Evol. S., 46, 481–501, https://doi.org/10.1146/annurev-ecolsys-112414-054118, 2015.
Jish Prakash, P., Stenchikov, G., Kalenderski, S., Osipov, S., and Bangalath, H.: The impact of dust storms on the Arabian Peninsula and the Red Sea, Atmos. Chem. Phys., 15, 199–222, https://doi.org/10.5194/acp-15-199-2015, 2015.
Jung, E., Shao, Y., and Sakai, T.: A study on the effects of convective transport on regional-scale Asian dust storms in 2002, J. Geophys. Res.-Atmos., 110, D20201, https://doi.org/10.1029/2005JD005808, 2005.
Kain, J. S.: The Kain–Fritsch Convective Parameterization: An Update, J. Appl. Meteorol., 43, 170–181, https://doi.org/10.1175/1520-0450(2004)043<0170:TKCPAU>2.0.CO;2, 2004.
Kalenderski, S. and Stenchikov, G.: High-resolution regional modeling of summertime transport and impact of African dust over the Red Sea and Arabian Peninsula, J. Geophys. Res.-Atmos., 121, 6435–6458, https://doi.org/10.1002/2015JD024480, 2016.
Kalenderski, S., Stenchikov, G., and Zhao, C.: Modeling a typical winter-time dust event over the Arabian Peninsula and the Red Sea, Atmos. Chem. Phys., 13, 1999–2014, https://doi.org/10.5194/acp-13-1999-2013, 2013.
Karydis, V. A., Kumar, P., Barahona, D., Sokolik, I. N., and Nenes, A.: On the effect of dust particles on global cloud condensation nuclei and cloud droplet number, J. Geophys. Res.-Atmos., 116, D23204, https://doi.org/10.1029/2011JD016283, 2011.
Kinne, S., Lohmann, U., Feichter, J., Schulz, M., Timmreck, C., Ghan, S., Easter, R., Chin, M., Ginoux, P., Takemura, T., Tegen, I., Koch, D., Herzog, M., Penner, J., Pitari, G., Holben, B., Eck, T., Smirnov, A., Dubovik, O., Slutsker, I., Tanre, D., Torres, O., Mishchenko, M., Geogdzhayev, I., Chu, D. A., and Kaufman, Y.: Monthly averages of aerosol properties: A global comparison among models, satellite data, and AERONET ground data, J. Geophys. Res.-Atmos., 108, 4634, https://doi.org/10.1029/2001JD001253, 2003.
Kishcha, P., Alpert, P., Barkan, J., Kirschner, I., and Machenhauer, B.: Atmospheric response to Saharan dust deduced from ECMWF reanalysis (ERA) temperature increments, Tellus B, 55, 901–913, https://doi.org/10.3402/tellusb.v55i4.16380, 2011.
Klich, C. A. and Fuelberg, H. E.: The role of horizontal model resolution in assessing the transport of CO in a middle latitude cyclone using WRF-Chem, Atmos. Chem. Phys., 14, 609–627, https://doi.org/10.5194/acp-14-609-2014, 2014.
Klose, M. and Shao, Y.: Stochastic parameterization of dust emission and application to convective atmospheric conditions, Atmos. Chem. Phys., 12, 7309–7320, https://doi.org/10.5194/acp-12-7309-2012, 2012.
Knopf, D. A. and Koop, T.: Heterogeneous nucleation of ice on surrogates of mineral dust, J. Geophys. Res.-Atmos., 111, D12201, https://doi.org/10.1029/2005JD006894, 2006.
Kok, J. F., Mahowald, N. M., Fratini, G., Gillies, J. A., Ishizuka, M., Leys, J. F., Mikami, M., Park, M.-S., Park, S.-U., Van Pelt, R. S., and Zobeck, T. M.: An improved dust emission model – Part 1: Model description and comparison against measurements, Atmos. Chem. Phys., 14, 13023–13041, https://doi.org/10.5194/acp-14-13023-2014, 2014.
Kok, J. F., Ward, D. S., Mahowald, N. M., and Evan, A. T.: Global and regional importance of the direct dust-climate feedback, Nat. Commun., 9, 241, https://doi.org/10.1038/s41467-017-02620-y, 2018.
Largeron, Y., Guichard, F., Bouniol, D., Couvreux, F., Kergoat, L., and Marticorena, B.: Can weuse surface wind fields from meteorological reanalyses for Sahelian dust emission simulations?, Geophys. Res. Lett., 42, 2490–2499, https://doi.org/10.1002/2014GL062938, 2015.
Lee, Y. H., Chen, K., and Adams, P. J.: Development of a global model of mineral dust aerosol microphysics, Atmos. Chem. Phys., 9, 2441–2458, https://doi.org/10.5194/acp-9-2441-2009, 2009.
Mahowald, N. M., Baker, A. R., Bergametti, G., Brooks, N., Duce, R. A., Jickells, T. D., Kubilay, N., Prospero, J. M., and Tegen, I.: Atmospheric global dust cycle and iron inputs to the ocean, Global Biogeochem. Cy., 19, GB4025, https://doi.org/10.1029/2004GB002402, 2005.
Mahowald, N. M., Ballantine, J. A., Feddema, J., and Ramankutty, N.: Global trends in visibility: implications for dust sources, Atmos. Chem. Phys., 7, 3309–3339, https://doi.org/10.5194/acp-7-3309-2007, 2007.
Manktelow, P. T., Carslaw, K. S., Mann, G. W., and Spracklen, D. V.: The impact of dust on sulfate aerosol, CN and CCN during an East Asian dust storm, Atmos. Chem. Phys., 10, 365–382, https://doi.org/10.5194/acp-10-365-2010, 2010.
Marsham, J. H., Parker, D. J., Grams, C. M., Taylor, C. M., and Haywood, J. M.: Uplift of Saharan dust south of the intertropical discontinuity, J. Geophys. Res.-Atmos., 113, D21102, https://doi.org/10.1029/2008JD009844, 2008.
Marsham, J. H., Knippertz, P., Dixon, N. S., Parker, D. J., and Lister, G. M. S.: The importance of the representation of deep convection for modeled dust-generating winds over West Africa during summer, Geophys. Res. Lett., 38, D21102, https://doi.org/10.1029/2011GL048368, 2011.
Marticorena, B. and Bergametti, G.: Modeling the atmospheric dust cycle: 1. Design of a soil-derived dust emission scheme, J. Geophys. Res.-Atmos., 100, 16415–16430, https://doi.org/10.1029/95JD00690, 1995.
Martin, J. H.: Iron still comes from above, Nature, 353, p. 123, https://doi.org/10.1038/353123b0, 1991.
Menut, L.: Sensitivity of hourly Saharan dust emissions to NCEP and ECMWF modeled wind speed, J. Geophys. Res.-Atmos., 113, D16201m https://doi.org/10.1029/2007JD009522, 2008.
Miller, S. D., Kuciauskas, A. P., Liu, M., Ji, Q., Reid, J. S., Breed, D. W., Walker, A. L., and Mandoos, A. Al: Haboob dust storms of the southern Arabian Peninsula, J. Geophys. Res.-Atmos., 113, D01202, https://doi.org/10.1029/2007JD008550, 2008.
Miller, S. D., Grasso, L. D., Bian, Q., Kreidenweis, S. M., Dostalek, J. F., Solbrig, J. E., Bukowski, J., van den Heever, S. C., Wang, Y., Xu, X., Wang, J., Walker, A. L., Wu, T.-C., Zupanski, M., Chiu, C., and Reid, J. S.: A Tale of Two Dust Storms: analysis of a complex dust event in the Middle East, Atmos. Meas. Tech., 12, 5101–5118, https://doi.org/10.5194/amt-12-5101-2019, 2019.
Morrison, H., Curry, J. A., and Khvorostyanov, V. I.: A New Double-Moment Microphysics Parameterization for Application in Cloud and Climate Models. Part I: Description, J. Atmos. Sci., 62, 1665–1677, https://doi.org/10.1175/JAS3446.1, 2005.
Morrison, H., Thompson, G., and Tatarskii, V.: Impact of Cloud Microphysics on the Development of Trailing Stratiform Precipitation in a Simulated Squall Line: Comparison of One- and Two-Moment Schemes, Mon. Weather Rev., 137, 991–1007, https://doi.org/10.1175/2008MWR2556.1, 2009.
Nakanishi, M. and Niino, H.: An Improved Mellor–Yamada Level-3 Model: Its Numerical Stability and Application to a Regional Prediction of Advection Fog, Bound.-Lay. Meteorol., 119, 397–407, https://doi.org/10.1007/s10546-005-9030-8, 2006.
Nakanishi, M. and Niino, H.: Development of an Improved Turbulence Closure Model for the Atmospheric Boundary Layer, J. Meteorol. Soc. Jpn. Ser. II, 87, 895–912, https://doi.org/10.2151/jmsj.87.895, 2009.
National Centers for Environmental Prediction/National Weather Service/NOAA/U.S Department of Commerce: NCEP FNL Operational Model Global Tropospheric Analyses, continuing from July 1999, Research Data Archive at the National Center for Atmospheric Research, Computational and Information Systems Laboratory, https://doi.org/10.5065/D6M043C6, 2000.
National Centers for Environmental Prediction/National Weather Service/NOAA/U.S. Department of Commerce: NCEP GDAS/FNL 0.25 Degree Global Tropospheric Analyses and Forecast Grids, Research Data Archive at the National Center for Atmospheric Research, Computational and Information Systems Laboratory, Boulder, CO, https://doi.org/10.5065/D65Q4T4Z, 2015.
Niu, G.-Y., Yang, Z.-L., Mitchell, K. E., Chen, F., Ek, M. B., Barlage, M., Kumar, A., Manning, K., Niyogi, D., Rosero, E., Tewari, M., and Xia, Y.: The community Noah land surface model with multiparameterization options (Noah-MP): 1. Model description and evaluation with local-scale measurements, J. Geophys. Res.-Atmos., 116, D12109, https://doi.org/10.1029/2010JD015139, 2011.
Pantillon, F., Knippertz, P., Marsham, J. H., and Birch, C. E.: A Parameterization of Convective Dust Storms for Models with Mass-Flux Convection Schemes, J. Atmos. Sci., 72, 2545–2561, https://doi.org/10.1175/JAS-D-14-0341.1, 2015.
Pérez, C., Nickovic, S., Pejanovic, G., Baldasano, J. M., and Özsoy, E.: Interactive dust-radiation modeling: A step to improve weather forecasts, J. Geophys. Res.-Atmos., 111, D16206, https://doi.org/10.1029/2005JD006717, 2006.
Pope, R. J., Marsham, J. H., Knippertz, P., Brooks, M. E., and Roberts, A. J.: Identifying errors in dust models from data assimilation, Geophys. Res. Lett., 43, 9270–9279, https://doi.org/10.1002/2016GL070621, 2016.
Prospero, J. M.: Long-term measurements of the transport of African mineral dust to the southeastern United States: Implications for regional air quality, J. Geophys. Res.-Atmos., 104, 15917–15927, https://doi.org/10.1029/1999JD900072, 1999.
Reinfried, F., Tegen, I., Heinold, B., Hellmuth, O., Schepanski, K., Cubasch, U., Huebener, H., and Knippertz, P.: Simulations of convectively-driven density currents in the Atlas region using a regional model: Impacts on dust emission and sensitivity to horizontal resolution and convection schemes, J. Geophys. Res.-Atmos., 114, D08127, https://doi.org/10.1029/2008JD010844, 2009.
Ridley, D. A., Heald, C. L., Pierce, J. R., and Evans, M. J.: Toward resolution-independent dust emissions in global models: Impacts on the seasonal and spatial distribution of dust, Geophys. Res. Lett., 40, 2873–2877, https://doi.org/10.1002/grl.50409, 2013.
Roberts, A. J., Woodage, M. J., Marsham, J. H., Highwood, E. J., Ryder, C. L., McGinty, W., Wilson, S., and Crook, J.: Can explicit convection improve modelled dust in summertime West Africa?, Atmos. Chem. Phys., 18, 9025–9048, https://doi.org/10.5194/acp-18-9025-2018, 2018.
Saleeby, S. M., van den Heever, S. C., Bukowski, J., Walker, A. L., Solbrig, J. E., Atwood, S. A., Bian, Q., Kreidenweis, S. M., Wang, Y., Wang, J., and Miller, S. D.: The influence of simulated surface dust lofting and atmospheric loading on radiative forcing, Atmos. Chem. Phys., 19, 10279–10301, https://doi.org/10.5194/acp-19-10279-2019, 2019.
Schepanski, K., Knippertz, P., Fiedler, S., Timouk, F., and Demarty, J.: The sensitivity of nocturnal low-level jets and near-surface winds over the Sahel to model resolution, initial conditions and boundary-layer set-up, Q. J. Roy. Meteor. Soc., 141, 1442–1456, https://doi.org/10.1002/qj.2453, 2015.
Seigel, R. B. and van den Heever, S. C.: Dust Lofting and Ingestion by Supercell Storms, J. Atmos. Sci., 69, 1453–1473, https://doi.org/10.1175/JAS-D-11-0222.1, 2012.
Shwehdi, M. H.: Thunderstorm distribution and frequency in Saudi Arabia, J. Geophys. Eng., 2, 252–267, https://doi.org/10.1088/1742-2132/2/3/009, 2005.
Skamarock, W. C., Klemp, J. B., Dudhia, J. O. G. D., and Barker, D. M.: A description of the Advanced Research WRF version 3, NCAR Tech, Note NCAR/TN-4751STR, NCAR, https://doi.org/10.5065/D68S4MVH, Boulder, CO, 2008.
Slingo, A., Ackerman, T. P., Allan, R. P., Kassianov, E. I., McFarlane, S. A., Robinson, G. J., Barnard, J. C., Miller, M. A., Harries, J. E., Russell, J. E., and Dewitte, S.: Observations of the impact of a major Saharan dust storm on the atmospheric radiation balance, Geophys. Res. Lett., 33, L24817, https://doi.org/10.1029/2006GL027869, 2006.
Sokolik, I. N. and Toon, O. B.: Direct radiative forcing by anthropogenic airborne mineral aerosols, Nature, 381, 681–683, https://doi.org/10.1038/381681a0, 1996.
Stafoggia, M., Zauli-Sajani, S., Pey, J., Samoli, E., Alessandrini, E., Basagaña, X., Cernigliaro, A., Chiusolo, M., Demaria, M., Díaz, J., Faustini, A., Katsouyanni, K., Kelessis, A. G., Linares, C., Marchesi, S., Medina, S., Pandolfi, P., Pérez, N., Querol, X., Randi, G., Ranzi, A., Tobias, A., Forastiere, F., and the MED-PARTICLES Study Group: Desert Dust Outbreaks in Southern Europe: Contribution to Daily PM10 Concentrations and Short-Term Associations with Mortality and Hospital Admissions, Environ. Health Persp., 124, 413–419, https://doi.org/10.1289/ehp.1409164, 2016.
Stephens, G. L., L'Ecuyer, T., Forbes, R., Gettelmen, A., Golaz, J.-C., Bodas-Salcedo, A., Suzuki, K., Gabriel, P., and Haynes, J.: Dreary state of precipitation in global models, J. Geophys. Res., 115, D24211, https://doi.org/10.1029/2010JD014532, 2010.
Sun, Y., Solomon, S., Dai, A., and Portmann, R. W.: How often does it rain? J. Climate, 19, 916–934, https://doi.org/10.1175/JCLI3672.1, 2006.
Tanaka, T. Y. and Chiba, M.: A numerical study of the contributions of dust source regions to the global dust budget, Global Planet. Chang., 52, 88–104, https://doi.org/10.1016/J.GLOPLACHA.2006.02.002, 2006.
Tegen, I. and Lacis, A. A.: Modeling of particle size distribution and its influence on the radiative properties of mineral dust aerosol, J. Geophys. Res.-Atmos., 101, 19237–19244, https://doi.org/10.1029/95JD03610, 1996.
Teixeira, J. C., Carvalho, A. C., Tuccella, P., Curci, G., and Rocha, A.: WRF-chem sensitivity to vertical resolution during a saharan dust event, Phys. Chem. Earth Pt. A/B/C, 94, 188–195, https://doi.org/10.1016/J.PCE.2015.04.002, 2016.
Todd, M. C., Bou Karam, D., Cavazos, C., Bouet, C., Heinold, B., Baldasano, J. M., Cautenet, G., Koren, I., Perez, C., Solmon, F., Tegen, I., Tulet, P., Washington, R., and Zakey, A.: Quantifying uncertainty in estimates of mineral dust flux: An intercomparison of model performance over the Bodélé Depression, northern Chad, J. Geophys. Res.-Atmos., 113, D24107, https://doi.org/10.1029/2008JD010476, 2008.
Twohy, C. H., Kreidenweis, S. M., Eidhammer, T., Browell, E. V, Heymsfield, A. J., Bansemer, A. R., Anderson, B. E., Chen, G., Ismail, S., DeMott, P. J., and Van Den Heever, S. C.: Saharan dust particles nucleate droplets in eastern Atlantic clouds, Geophys. Res. Lett., 36, L01807, https://doi.org/10.1029/2008GL035846, 2009.
Uno, I., Wang, Z., Chiba, M., Chun, Y. S., Gong, S. L., Hara, Y., Jung, E., Lee, S.-S., Liu, M., Mikami, M., Music, S., Nickovic, S., Satake, S., Shao, Y., Song, Z., Sugimoto, N., Tanaka, T., and Westphal, D. L.: Dust model intercomparison (DMIP) study over Asia: Overview, J. Geophys. Res.-Atmos., 111, D12213, https://doi.org/10.1029/2005JD006575, 2006.
van Donkelaar, A., Martin, R. V., Brauer, M., Kahn, R., Levy, R., Verduzco, C., and Villeneuve, P. J.: Global estimates of ambient fine particulate matter concentrations from satellite-based aerosol optical depth: development and application, Environ. Health Persp., 118, 847–855, https://doi.org/10.1289/ehp.0901623, 2010.
Woodage, M. J. and Woodward, S.: U.K. HiGEM: Impacts of Desert Dust Radiative Forcing in a High-Resolution Atmospheric GCM, J. Climate, 27, 5907–5928, https://doi.org/10.1175/JCLI-D-13-00556.1, 2014.
Yang, Q., Easter, R. C., Campuzano-Jost, P., Jimenez, J. L., Fast, J. D., Ghan, S. J., Wang, H., Berg, L. K., Barth, M. C., Liu, Y., Shrivastava, M. B., Singh, B., Morrison, H., Fan, J., Ziegler, C. L., Bela, M., Apel, E., Diskin, G. S., Mikoviny, T. and Wisthaler, A.: Aerosol transport and wet scavenging in deep convective clouds: A case study and model evaluation using a multiple passive tracer analysis approach, J. Geophys. Res.-Atmos., 120, 8448–8468, https://doi.org/10.1002/2015JD023647, 2015.
Yang, Z.-L., Niu, G.-Y., Mitchell, K. E., Chen, F., Ek, M. B., Barlage, M., Longuevergne, L., Manning, K., Niyogi, D., Tewari, M., and Xia, Y.: The community Noah land surface model with multiparameterization options (Noah-MP): 2. Evaluation over global river basins, J. Geophys. Res.-Atmos., 116, D12110, https://doi.org/10.1029/2010JD015140, 2011.
Yu, Y., Notaro, M., Kalashnikova, O. V., and Garay, M. J.: Climatology of summer Shamal wind in the Middle East, J. Geophys. Res.-Atmos., 121, 289–305, https://doi.org/10.1002/2015JD024063, 2016.
Yuter, S. E. and Houze, R. A.: Three-Dimensional Kinematic and Microphysical Evolution of Florida Cumulonimbus. Part II: Frequency Distributions of Vertical Velocity, Reflectivity, and Differential Reflectivity, Mon. Weather Rev., 123, 1941–1963, https://doi.org/10.1175/1520-0493(1995)123<1941:TDKAME>2.0.CO;2, 1995.
Zender, C. S., Miller, R. L. R. L., and Tegen, I.: Quantifying mineral dust mass budgets: Terminology, constraints, and current estimates, Eos T. Am. Geophys. Un., 85, 509–512, https://doi.org/10.1029/2004EO480002, 2004.
Zhang, C. and Wang, Y.: Projected Future Changes of Tropical Cyclone Activity over the Western North and South Pacific in a 20-km-Mesh Regional Climate Model, J. Climate, 30, 5923–5941, https://doi.org/10.1175/JCLI-D-16-0597.1, 2017.
Zhao, C., Liu, X., Leung, L. R., Johnson, B., McFarlane, S. A., Gustafson Jr., W. I., Fast, J. D., and Easter, R.: The spatial distribution of mineral dust and its shortwave radiative forcing over North Africa: modeling sensitivities to dust emissions and aerosol size treatments, Atmos. Chem. Phys., 10, 8821–8838, https://doi.org/10.5194/acp-10-8821-2010, 2010.