the Creative Commons Attribution 4.0 License.
the Creative Commons Attribution 4.0 License.
 | 05 Mar 2020
Effect of ammonia on fine-particle pH in agricultural regions of China: comparison between urban and rural sites
Shenbo Wang
Lingling Wang
Yuqing Li
Chen Wang
Weisi Wang
Shasha Yin
Ruiqin Zhang
Particle acidity is a fundamental property that affects atmospheric particulate chemistry. Synchronous online monitoring was performed at two urban sites, Zhengzhou (U-ZZ) and Anyang (U-AY), and three rural sites, Anyang (R-AY), Xinxiang (R-XX), and Puyang (R-PY) in Henan Province, during a haze episode to investigate the pH value and its driving factors in the agricultural regions of China. The pH values of particles calculated by ISORROPIA-II model at rural sites were slightly higher than those at urban sites, with the median (min–max) values of 5.2 (4.8–6.9, R-PY), 5.1 (4.7–6.5, R-AY), 4.9 (4.1–6.8, R-XX), 4.8 (3.9–5.9, U-AY), and 4.5 (3.8–5.2, U-ZZ). Sensitivity tests show that TNHx (total ammonium, gas + aerosol) followed by total sulfate were the most important factors that influenced the predicted pH. Generally, particle pH increased with a cation increase and decreases in anions, temperature, and relative humidity. Similar pH values (∼3.0) at the required NHx concentrations for the five sites indicated that the presence of excess NHx was likely important for the lower acidity of PM2.5 during the severe haze episodes in this region. Moreover, the concentrations of excess NHx may drive the higher pH values at rural sites, because of the higher excess NHx concentrations at rural sites than those at urban sites. The underlying influence of regional transport on local particle pH cannot be neglected, as it differs the chemical components of PM2.5 and meteorological conditions. Air masses transported from rural and agricultural regions may enhance the particle pH value in urban aerosols given the high pH of particles and high ammonia levels. These results suggest that ammonia is urgently needed to be involved in the regional strategy for the improvement of air quality in China.
- Article
(3131 KB) -
Supplement
(2927 KB) - BibTeX
- EndNote


High concentrations of acids and bases contained in the aqueous phase define the acidity of aerosols (Spurny, 1990). Particle acidity, or pH value, is an important parameter for atmospheric particulate chemistry, such as the gas–particle partitioning of semi-volatile and volatile species (e.g., NH3(g)∕, HCl(g)∕, and HNO3(g)∕), the formation of secondary inorganic and organic aerosols, and the dissolution of metallic elements (Bougiatioti et al., 2016; Meskhidze et al., 2003; Seinfeld and Pandis, 2006; Shi et al., 2011, 2019; Surratt et al., 2010; G. Wang et al., 2018). Particle acidity can affect the ecosystem through its influence on wet/dry deposition, atmospheric visibility, and radiative balance (Boucher and Anderson, 1995; Larssen et al., 2006; Pye et al., 2020; Watson, 2002). In addition, high particle acidity has an adverse impact on public health, especially for the cardiopulmonary and respiration systems of humans (Dockery et al., 1996; Ostro et al., 1991).
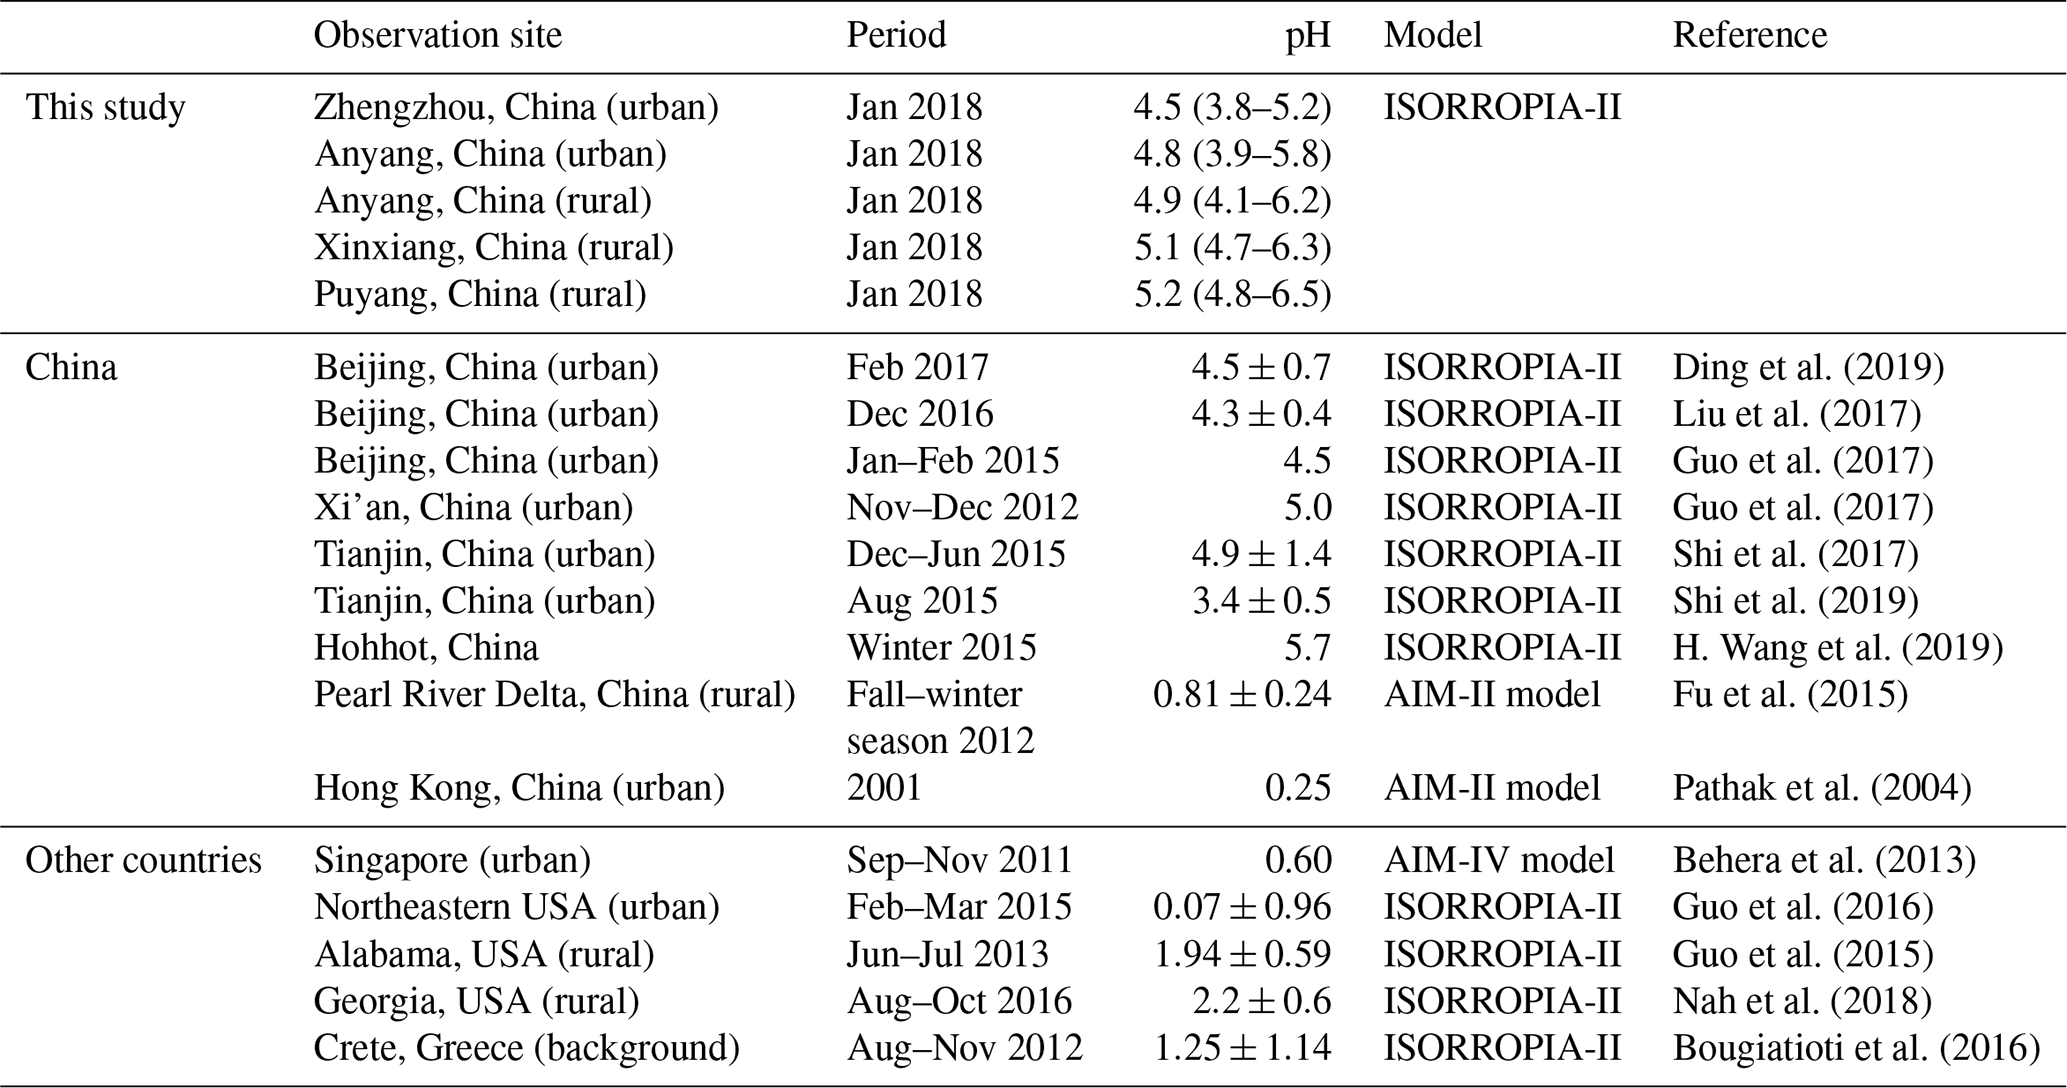
Direct measurements on particle pH are challenging because of the small size and nonideality of chemical species in solvated aerosols. Therefore, thermodynamic models, such as E-AIM (http://www.aim.env.uea.ac.uk/aim/aim.php, last access: 2 October 2019) and ISORROPIA-II (http://isorropia.eas.gatech.edu, last access: 2 October 2019) (Clegg et al., 1998; Nenes et al., 1998), which rely on the measurements of particulate and gaseous species, are widely used in estimating particle pH. Generally, the global distribution of fine particulate matter (PM2.5, aerodynamic diameter ≤2.5 µm) pH is bimodal with a population of particles having a mean pH of 1–3 and another population having an average pH closer to 4–5 (Pye et al., 2020). Table 1 shows that PM2.5 in mainland China was moderately acidic, with pH values that ranged from 3.4 to 5.7 (Ding et al., 2019; Guo et al., 2017; Liu et al., 2017; Shi et al., 2017, 2019; Song et al., 2018; H. Wang et al., 2019), which were 3–5 units higher than those reported in other regions, such as Hong Kong, Singapore, USA, and Greece (Behera et al., 2013; Bougiatioti et al., 2016; Guo et al., 2015, 2016; Pathak et al., 2004).
Table 1Comparison of the particle pH values in this study (median, min–max) and other sites (mean ± SD).
High atmospheric ammonia (TNHx, gas NH3 plus particle ) is a dominant factor that drives the high PM2.5 pH in megacities of China because it suppresses the production of particle hydronium (Cheng et al., 2016; Wang et al., 2016). Liu et al. (2017) argued that excess NH3 and elevated aerosol water content (AWC) were responsible for the high pH in Beijing. Nevertheless, Guo et al. (2017) and Song et al. (2018) demonstrated that high levels of ammonia did not increase the PM2.5 pH into a fully neutralized condition in Beijing and Xi'an, China. Weber et al. (2016) calculated that only large increases in NH3 together with sulfate reductions can lead to an increase in pH. Correspondingly, a pH higher by about 1 unit than urban aerosols was observed in locations of intensive agriculture with high NH3 concentrations in the southeastern USA (Nah et al., 2018). The primary sources for ammonia include agricultural emissions, such as livestock waste, N-fertilizer application, and biomass burning, as well as traffic and industrial emissions (Huang et al., 2012; Shen et al., 2011; C. Wang et al., 2018). Field studies have reported that elevated NH3 and concentrations were recorded at rural sites in the North China Plain (Meng et al., 2011, 2018; Shen et al., 2011; Wen et al., 2015). Therefore, studying in an agriculturally developed region is needed to obtain insight into the effect of ammonia on particle pH. Unfortunately, previous studies mainly concentrated on calculating the particle pH in the megacity of China, and few studies have focused on the agricultural regions of China. In addition to ammonia, particle pH can also be influenced by other chemical compositions and meteorological conditions, such as sulfate, AWC, temperature (T), and relative humidity (RH). Sulfate is often the main acid component of aerosols, and largely determines the acidity of PM2.5 (Weber et al., 2016). Sensitivity tests in Beijing suggested that sulfate, TNHx, and T were the common driving factors, and Ca2+ and RH were the unique factors in special seasons (Ding et al., 2019). The pH sensitivity based on the 10-year record in Canada showed that chemical compositions had various effects on particle pH under different meteorological conditions; moreover, careful examination for any particular region is needed (Tao and Murphy, 2019).
Henan Province is situated in central China; it has a dense rural population and is a top-ranking province in China in terms of agricultural production and chemical fertilizer consumption (National Bureau of Statistics, 2016). The NH3 emission inventory for Henan Province showed that approximately 1031.6 Gg NH3 was released in Henan in 2015, thereby contributing to approximately 10 % of China's total emissions (approximately 10 Tg) (Huang et al., 2012; C. Wang et al., 2018). Livestock waste and N fertilizer application were major sources for ammonia emissions, which may increase TNHx concentrations at rural sites than in urban sites. Furthermore, Henan Province is a severely PM2.5-polluted region in China. In January 2018, a large-scale and long-lasting haze episode that caused PM2.5 concentration to reach 400 µg m−3 occurred in this region (S. Wang et al., 2019b). An experiment was performed in two urban and three rural sites in Henan Province to investigate particle acidity and its driving factor. ISORROPIA-II model was utilized to estimate PM2.5 pH using a high-time-resolution dataset. The novelty of the work addressed in the present study is that this study is the first on PM2.5 acidity that compares urban and rural sites in the agricultural regions of China. The specific objectives of the study are as follows: (1) estimation and comparison of the PM2.5 pH at the five monitoring sites, (2) identification of the factors that determine the pH, and (3) discussion of the effect of ammonia on pH. Our results are helpful to understand the factors that better determine particle acidity.
2.1 Site descriptions
Field sampling was synchronously conducted from 12 to 24 January 2018 at five sites (i.e., two urban sites located in the center of Zhengzhou (U-ZZ) and Anyang (U-AY), and three sites located in the rural areas of Anyang (R-AY), Xinxiang (R-XX), and Puyang (R-PY)). Locations of the five sites (Fig. S1 in the Supplement) with brief descriptions are listed in Table 2. U-ZZ site is surrounded by busy roads, and one freeway is located 3 km to the south and one freeway is located 7 km to the east. Moreover, this site is near a coal-fired power plant, a gas-fired power plant, and several small-scale industries, such as pharmaceutical companies, electronic factories, and equipment manufacturing. U-AY site is surrounded by busy roads, and the Anyang steelworks is located 8 km to the west. R-AY site is surrounded by farmland and is 1 km west of the Jinggang'ao freeway and 1 km north of a belt freeway. R-XX and R-PY sites are surrounded by farmland without other prominent anthropogenic emission sources.
Table 2Descriptions of the five sampling sites.
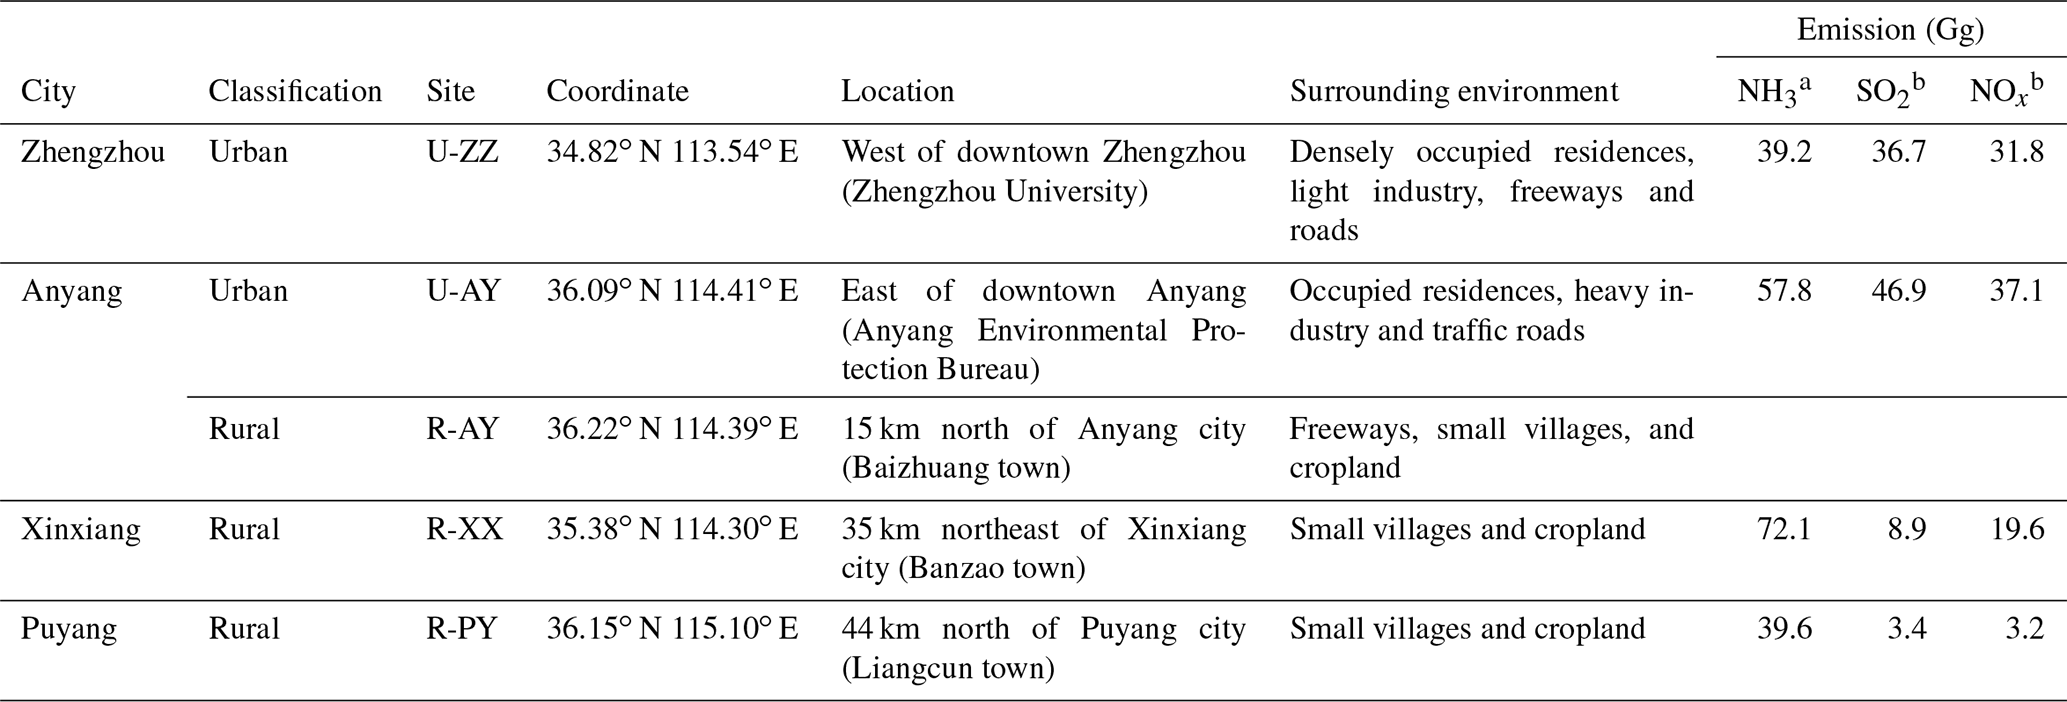
a Data from a 2015 NH3 emission inventory (C. Wang et al., 2018).
b Data from Henan Statistical Yearbook of 2018 (Bureau of Statistics of Henan, 2018).
2.2 Instrumentation
The hourly mass concentrations of water-soluble inorganic ions (WSIIs) in PM2.5, such as , , , Cl−, Na+, Mg2+, Ca2+, and K+ and their gaseous precursors (i.e., NH3, HNO3, and HCl) were measured using an ambient ion monitor (URG-9000D, Thermal Fisher Scientific, USA) at the U-ZZ site and monitor for aerosols and gases (MARGA, Metrohm, Switzerland) at other sites. Both instruments have been successfully deployed in several other field experiments (Li et al., 2017; Shi et al., 2017; S. Wang et al., 2019b), and detailed information is available elsewhere (Markovic et al., 2012; Rumsey et al., 2014). As a brief summary, ambient air is drawn into the systems at a flow rate of 16.7 L min−1. Subsequently, particles and gases are collected by two aerosol sample collectors through a wet parallel plate or wet rotating denuder. Aqueous solution samples are quantified by using two ion chromatography analyzers. Detection limits for all species during the sampling periods were less than 0.1 µg m−3. Measurement uncertainties were assumed to 10 % for URG-9000D here by reference to 10 % of Markovic et al. (2012) and 12 % in Hu et al. (2014). For the MARGA instrument, Song et al. (2018) took 20 % as overall relative uncertainties for major species, and Rumsey et al. (2014) reported that the analytical biases were lower than 10 % for , , and HNO3, but higher than 15 % for NH3 and . Therefore, overall uncertainties were estimated to be 20 % for NH3 and and 10 % for other species. The combined uncertainties for TNHx were calculated to be 14 % and 23 % for U-ZZ and other sites, respectively, and 14 % uncertainties of TNO3 () and TCl () for all sites. Because of the complex interference during sampling periods at the five sites, such as the slope from the internal calibration, the solution volume, temperature, pressure, and airflow rate, the actual uncertainties might be different from the estimated value. Hourly elemental carbon (EC) and organic carbon (OC) concentrations in PM2.5 were simultaneously obtained by the semi-continuous carbon analyzers (Model 4, Sunset Laboratory Inc, USA) in the same place, except for the U-ZZ site, of which data were provided by the Department of Environmental Protection of Henan Province. Detailed information on this instrument can be found in Panteliadis et al. (2015). Briefly, PM2.5 collected by the device was oxidized to carbon dioxide and analyzed by a nondispersive infrared detector. The relative measurement uncertainty for this instrument was estimated to be 20 % (Liu et al., 2013; Healy et al., 2013). Meteorological parameters, including T, RH, wind direction, and wind speed, were recorded by smart weather sensor (LUFFT-WS500, Sutron Corporation, Germany), with the accuracies of , ±2 %, , and 0.1 m s−1, respectively.
2.3 pH prediction
Particle pH was estimated using the ISORROPIA-II thermodynamic model. Input data, including RH, T, concentrations of K+, Ca2+, Mg2+, TNHx, total sulfate (TH2SO4, replaced by observed ), total sodium (TNa, replaced by observed Na+), TCl, and TNO3, were used to calculate the particle hydronium ion concentration per volume of air () and particle water associated with inorganics (AWCinorg) by computing the equilibrium composition for the Na+-K+-Ca2+-Mg2+----Cl−-H2O aerosol system. Considering that forward mode is less sensitive to measurement error than the reverse mode and high RH levels were recorded in sampling periods, ISORROPIA-II was run in the forward model for the aerosol system in the metastable condition (Ding et al, 2019; Guo et al., 2015; Hennigan et al., 2015). Moreover, we excluded data with RH<30 %, a condition where predicted-to-observed partitioning of nitrate between the gas and particle phase are weakly correlated, and thus uncertainties in the pH prediction are expected to be high (Ding et al., 2019; Guo et al., 2016). Aerosol pH was calculated according to the following formula (Bougiatioti et al., 2016):
where the modeled concentrations for AWCinorg and are µg m−3, and AWCorg is the particle water associated with the organics predicted using the following method:
where ms is the mass concentrations of organic matter (OC×1.6), ρs is the organic density (1.35 g cm−3), and korg is the organic hygroscopicity parameter (0.06) (Liu et al., 2017).
2.4 pH uncertainty
Two extreme scenarios were evaluated to estimate the pH uncertainty based on the measurement uncertainties of input data (Murphy et al., 2017). Sensitivity tests of pH to input data (see Sect. 3.3) suggest that simulated pH increase with the cation concentrations (i.e., TNHx, TNa, K+, Ca2+, and Mg2+) increasing as well as the anion concentrations (i.e., TH2SO4, TNO3, and TCl), T, and RH decreasing. Moreover, the pH value has a positive correlation with OC concentrations via Eqs. (1) and (2). Therefore, cation and OC concentrations were adjusted up to within their maximum positive uncertainties; anions, RH, and T were adjusted down within their maximum negative uncertainties, which represented the pHmax case; for the pHmin case, cations and OC concentrations were adjusted down, and anions, RH, and T were adjusted up. Figure 1 suggests that pHmax cases lead to 6 % (slope−1) errors for all sites, and pHmin cases can result in approximately 10 % deviations. Thus, pH uncertainties were set to be −9 to +6 %, −13 to +6 %, −12 to +6 %, −11 to +6 %, and −10 to +5 % for U-ZZ, U-AY, R-AY, R-XX, and R-PY sites, respectively.
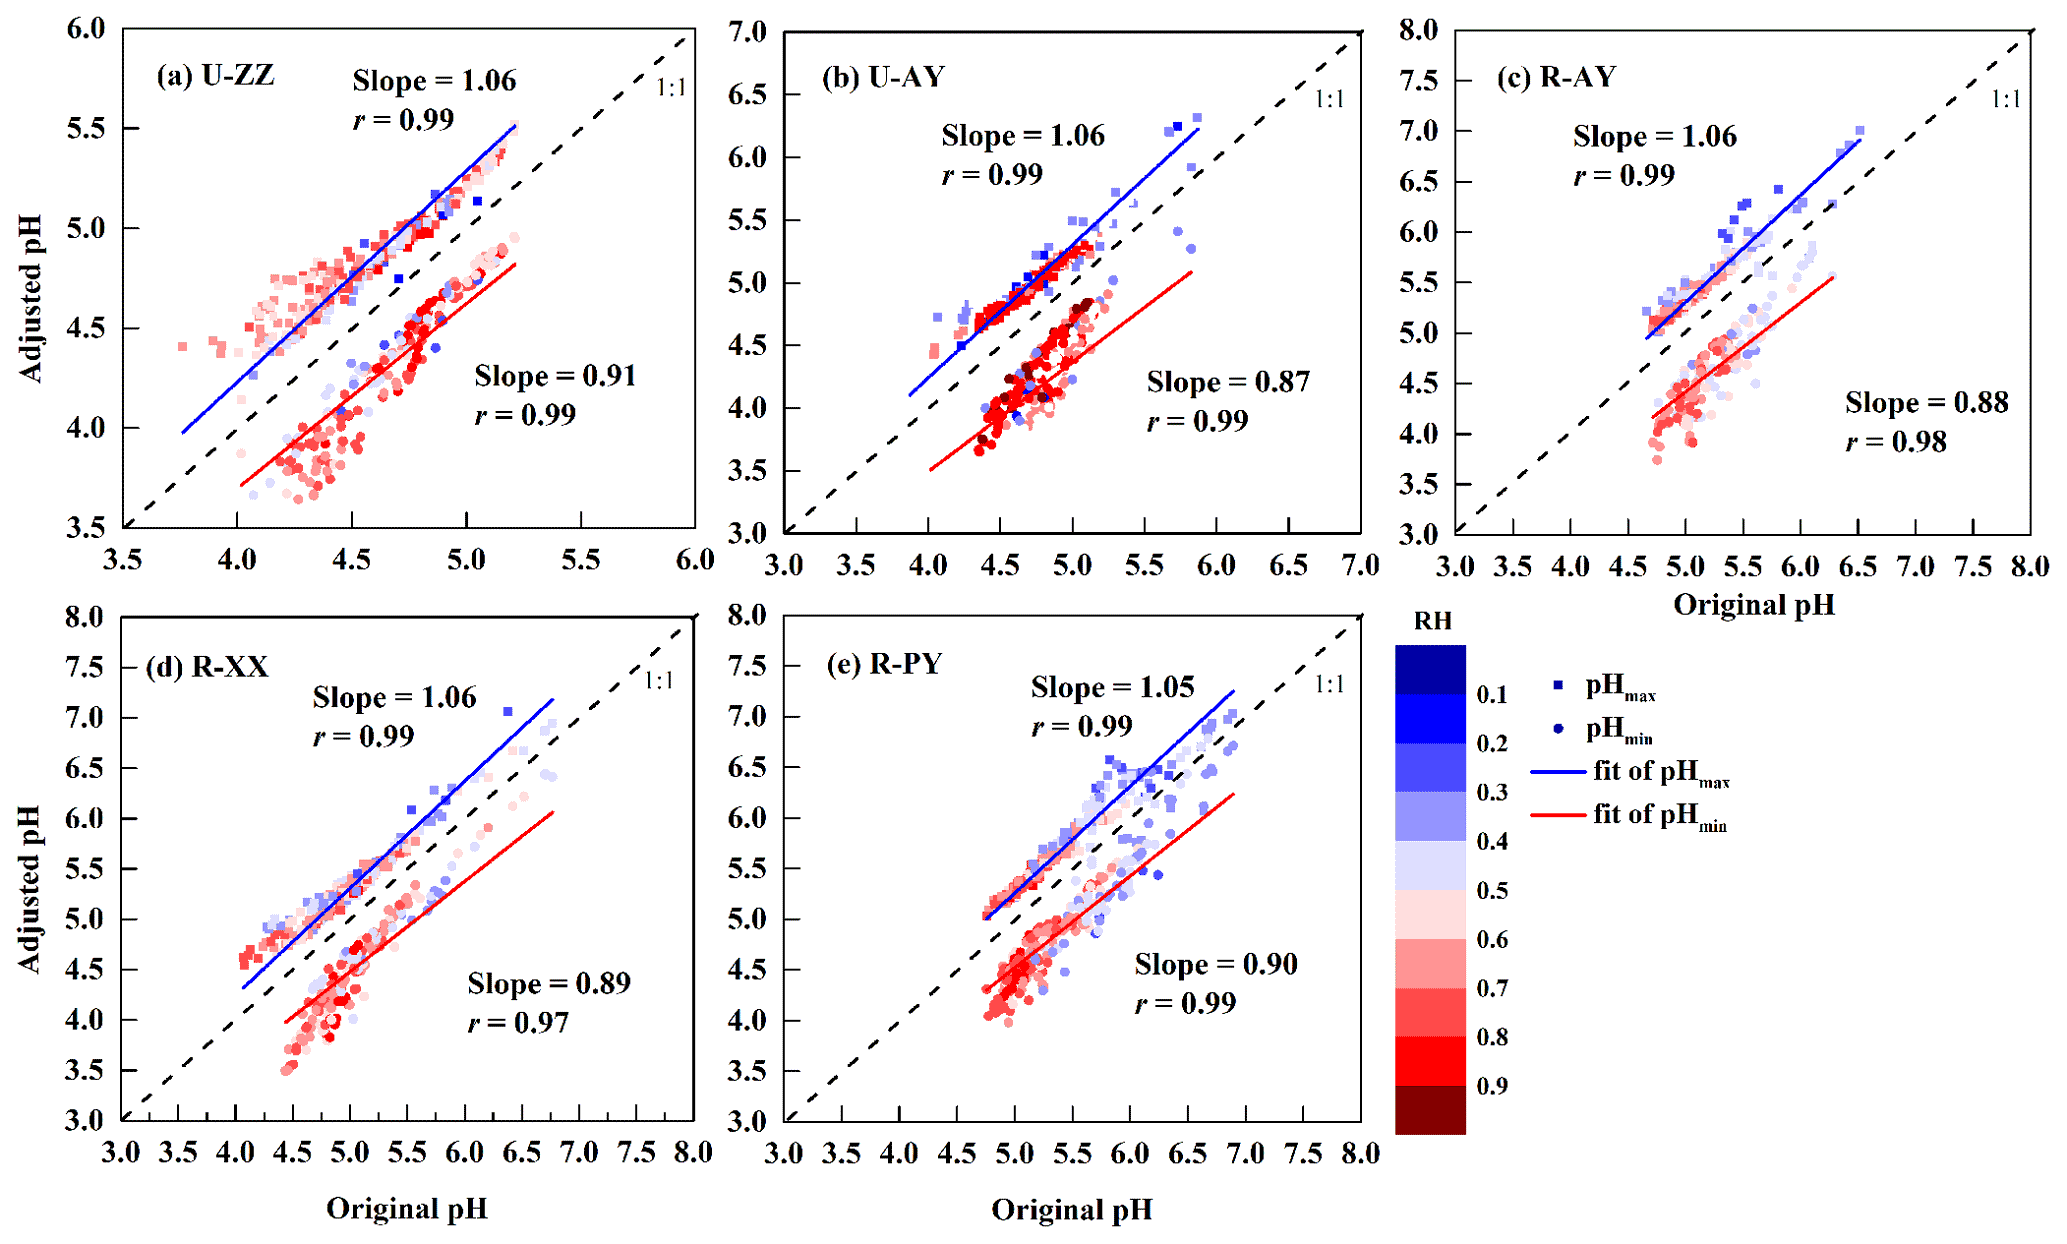
Figure 1pH uncertainties of the five sites based on two extreme scenarios of measurement uncertainty. Cations and organic carbon concentrations (OC) were adjusted up to within their maximum positive uncertainties; anions, relative humidity (RH), and temperature (T) were adjusted down within their maximum negative uncertainties, which represented the pHmax case; for the pHmin case, cations and OC concentrations were adjusted down, and anions, RH, and T were adjusted up. The color scale bar represents adjusted RH.
2.5 Model validation
The reliability of pH estimation using the ISORROPIA-II thermodynamic model depends on several assumptions, such as equilibrated gas and particle phases (Pye et al., 2020). Thus, the predicted and observed semi-volatile species (e.g., NH3(g)∕, HCl(g)∕, and HNO3(g)∕) are compared in Fig. S2 in the Supplement. Observed and predicted , Cl−, and exhibit significant correlations, have correlation coefficients (r) above 0.95 and slopes near 1 at the five sites. In addition, NH3 concentrations are in good agreement (r>0.95) with slopes between 0.89 (U-ZZ) and 1.13 (R-PY). These results suggest the excellent performance of ISORROPIA-II for modeling these species. The differences in the slopes of (Fig. S2b in the Supplement) and NH3 (Fig. S2e in the Supplement) between U-ZZ and R-PY sites were probably attributed to the unbalanced charge of input WSIIs (see Text S1 in the Supplement for more details of calculation) with average equivalent ratios (Fig. S3 in the Supplement) of 0.99±0.13 (U-ZZ) and 1.20±0.12 (R-PY). However, Song et al. (2018) argued that ion balance was not a key factor for pH calculation in the forward mode, because the forward-mode calculations account for additional constraints imposed by the partitioning of semi-volatile species. To verify this, we adjusted the measured concentration, which was most sensitive to pH modeling (see Sect. 3.3), to fit the ion balance, and reran the pH calculation. As shown in Fig. S4 in the Supplement, re-predicted and NH3 concentrations have better performance (r=0.99, ) with input concentrations at two sites than before. However, re-calculated pH values change slightly, and these deviations are included in the range of pH uncertainty discussed in Sect. 2.4. Therefore, the little differences in NHx partitioning between the model and measurement among the five sites were acceptable for pH calculation.
Correlations between the predicted and measured HNO3 and HCl are weak. Similar problems were found in the northeast USA and Beijing. These discrepancies were potentially due to measurement uncertainties brought about by low gas concentrations, the interference of coarse-mode particles, non-volatile cation measurement artifacts, uncertainties in the thermodynamic constants, and kinetic limitations to mass transfer (Ding et al., 2019, Haskins et al., 2018; Pye et al., 2020; Liu et al., 2017). Pye et al. (2020) suggested that ISORROPIA-II yields a mean activity coefficient of (H+, Cl−) that may result in a higher predicted HCl concentration. HNO3 can be partition to both fine and coarse modes, thereby affecting predicted fine-mode nitrate concentrations (Nah et al., 2018). The best semi-volatile species for evaluation of pH modeling depend on the fraction of the gas phase. In this work, most HNO3 and HCl are concentrated in the particle phase, and thus they are not suited to test the model (Guo et al., 2016).
The PM2.5 pH was also calculated by the E-AIM (Version IV) model to evaluate the performance of ISORROPIA-II using the observed data (RH>60 %) of the U-ZZ site as an example. Close correlation (r=0.89) is found between two models with a slope of 0.95 (Fig. S5 in the Supplement). The pH values in ISORROPIA-II are 0.46±0.15 units higher than those in E-AIM. These values are comparable to the founding by Liu et al. (2017) and Song et al. (2018), which is possibly due to the differences of activity coefficient values between the ISORROPIA-II and E-AIM models (Pye et al., 2020). Overall, the predicted pH values using ISORROPIA-II are effective in this work.
3.1 Haze episodes
During the sampling periods, five monitoring sites simultaneously experienced a long-lasting and large-scale haze episode. Time series of the concentrations of major species (i.e., NH3, , , and ) and meteorological parameters at the U-ZZ site as an example are presented in Fig. 2, and other sites are integrated into Fig. S6 in the Supplement with the mean values listed in Table 3. Three study cases were classified on the basis of similar meteorological conditions and WSIIs levels at the five sites. The WSIIs concentration, T, and RH gradually increased in the southern wind during Case 1 (12–14 January). Case 3 (21–25 January) was characterized by decreased WSII concentrations, T, and RH with the northeastern wind. Even though the total WSIIs (TWSIIs) concentrations were comparable, the chemical components of WSIIs were various between Cases 1 and 3 (Table 3). In particular, , , and NH3 concentrations in Case 1 were higher than those in Case 3 at all sites. Conversely, concentrations in Case 1 were lower than those in Case 3. C. Wang et al. (2018) reported that the southern cities of Henan Province (e.g., Nanyang, Shangqiu, Zhoukou, and Zhumadian) had relatively higher ammonia emissions than the cities involved in this study. Moreover, the northeastern air masses from the Jing–Jin–Ji regions were easily enriched with sulfate (S. Wang et al., 2019a, 2018). Evidently, back-trajectory frequency analysis (see Text S2 in the Supplement for more details of the discussion) confirmed that sampling sites during Cases 1 and 3 (Fig. S7a and c in the Supplement) were predominantly influenced by the southern and northeastern air masses, respectively.
Table 3Summary (mean ±standard deviation) of gaseous precursors (µg m−3), water-soluble inorganic ions (µg m−3), T (∘C), and RH (%) during three cases of haze periods at five sites.
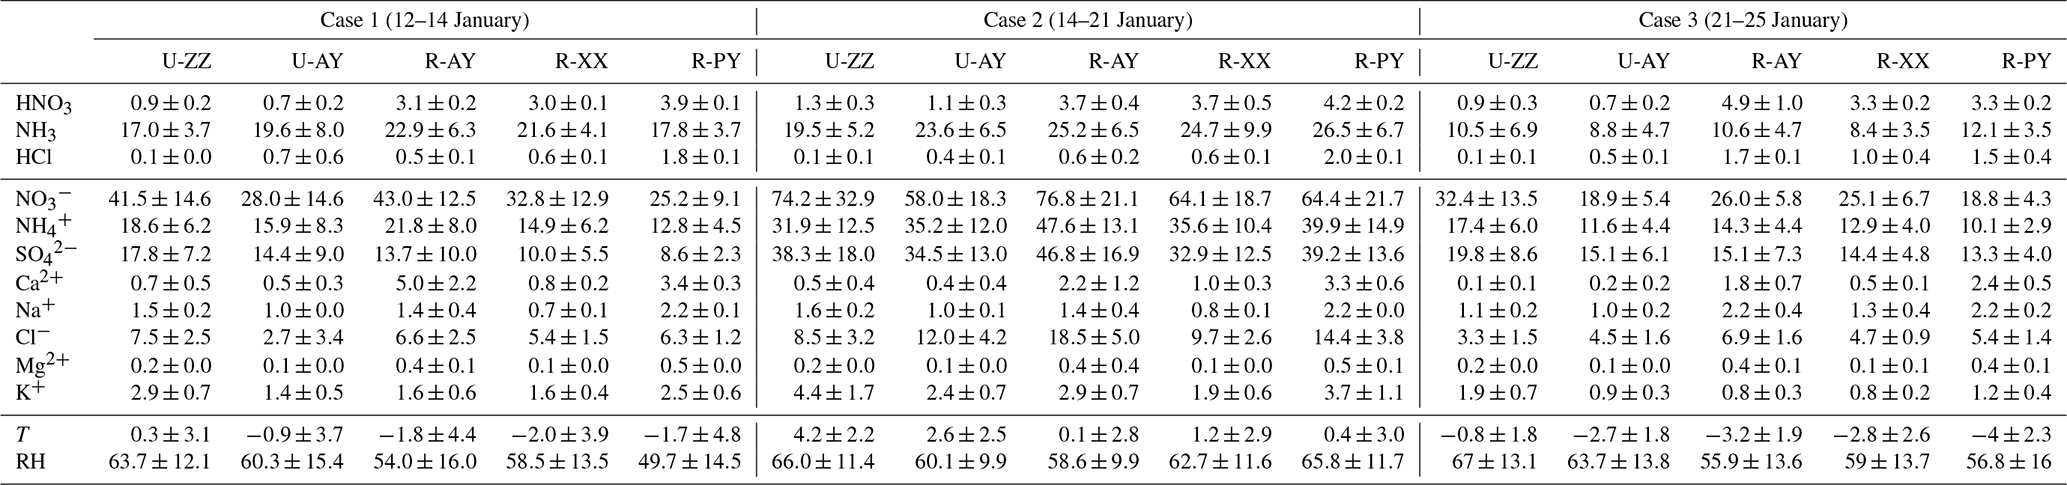
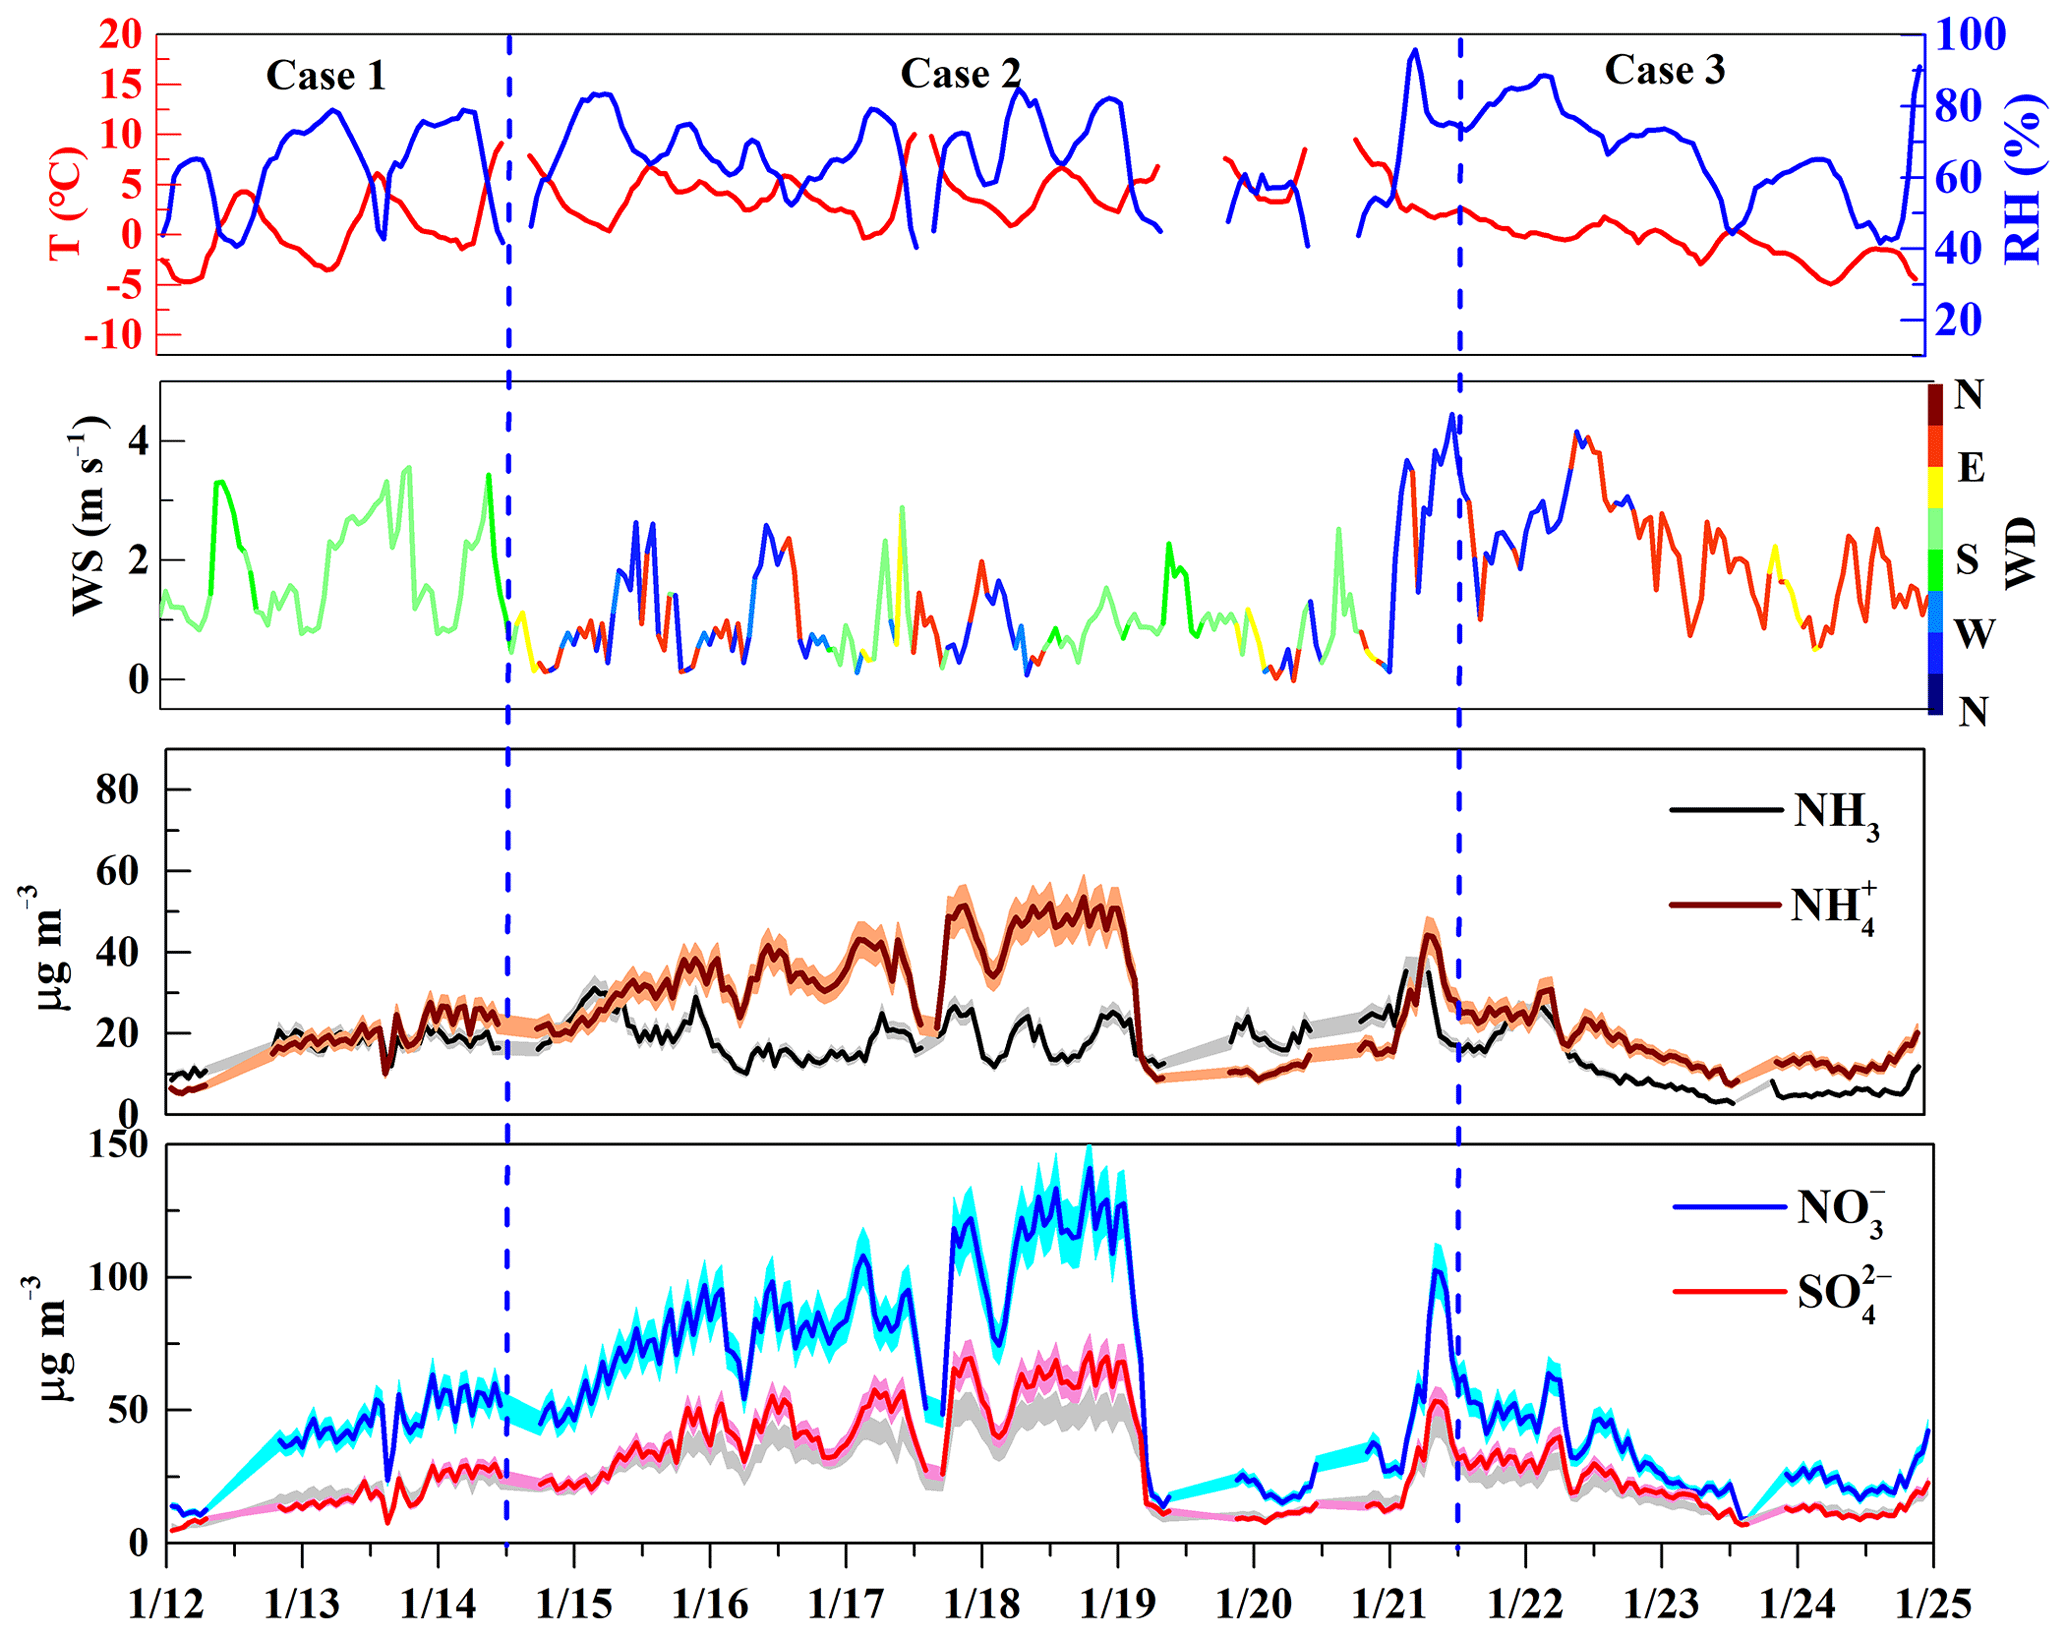
Figure 2Temporal variations of T, RH, wind speed (WS), wind direction (WD), and concentrations of NH3, , , and during three cases at the Zhengzhou (U-ZZ) site. The shaded areas represent the measurement uncertainties.
Elevated WSIIs concentrations during Case 2 (14–21 January) were under high T and RH conditions with variable wind directions. In this case, local emissions played a key role in WSIIs (Fig. S7b in the Supplement) with average , , and concentrations that ranged from (U-ZZ) to (R-AY), (R-XX) to (R-AY), and (U-AY) to (R-AY), respectively. Note that higher concentrations of , NH3, and TNHx during Case 2 were recorded at rural sites than those at urban sites. Moreover, NH3 levels in this work were higher than those in other studies summarized in Table S1 in the Supplement. Agricultural emissions, including livestock waste, N fertilizer application, and humans, were the top three ammonia contributors in Henan Province (C. Wang et al., 2018), which may result in elevated ammonia concentrations at rural sites.
3.2 pH of PM2.5 at the urban and rural sites
Figure 3 exhibits the predicted PM2.5 pH values, , and AWC at the five sites; pH uncertainties based on the pHmax and pHmin calculations are presented in Fig. S8 in the Supplement. PM2.5 shows consistent moderate acidity during this haze episode, with median (min–max) pH values of 4.5 (3.8–5.2), 4.8 (3.9–5.8), 4.9 (4.1–6.2), 5.1 (4.7–6.3), and 5.2 (4.8–6.5,) at U-ZZ, U-AY, R-XX, R-AY, and R-PY, respectively. As summarized in Table 1, PM2.5 pH values were close to the results of other cities in China (e.g., Beijing, Xi'an, and Tianjin), but higher than other countries (e.g., Singapore, USA, and Greece). Compared to the rural sites in the USA, pH values were roughly 3 units higher at the R-AY, R-XX, and R-PY sites. Moreover, statistical values of pH (Table S2 in the Supplement) during three cases show higher pH values at rural sites than those at urban sites, especially for the U-ZZ and R-PY sites during Case 1, despite their pH uncertainties (Sect. 2.4).
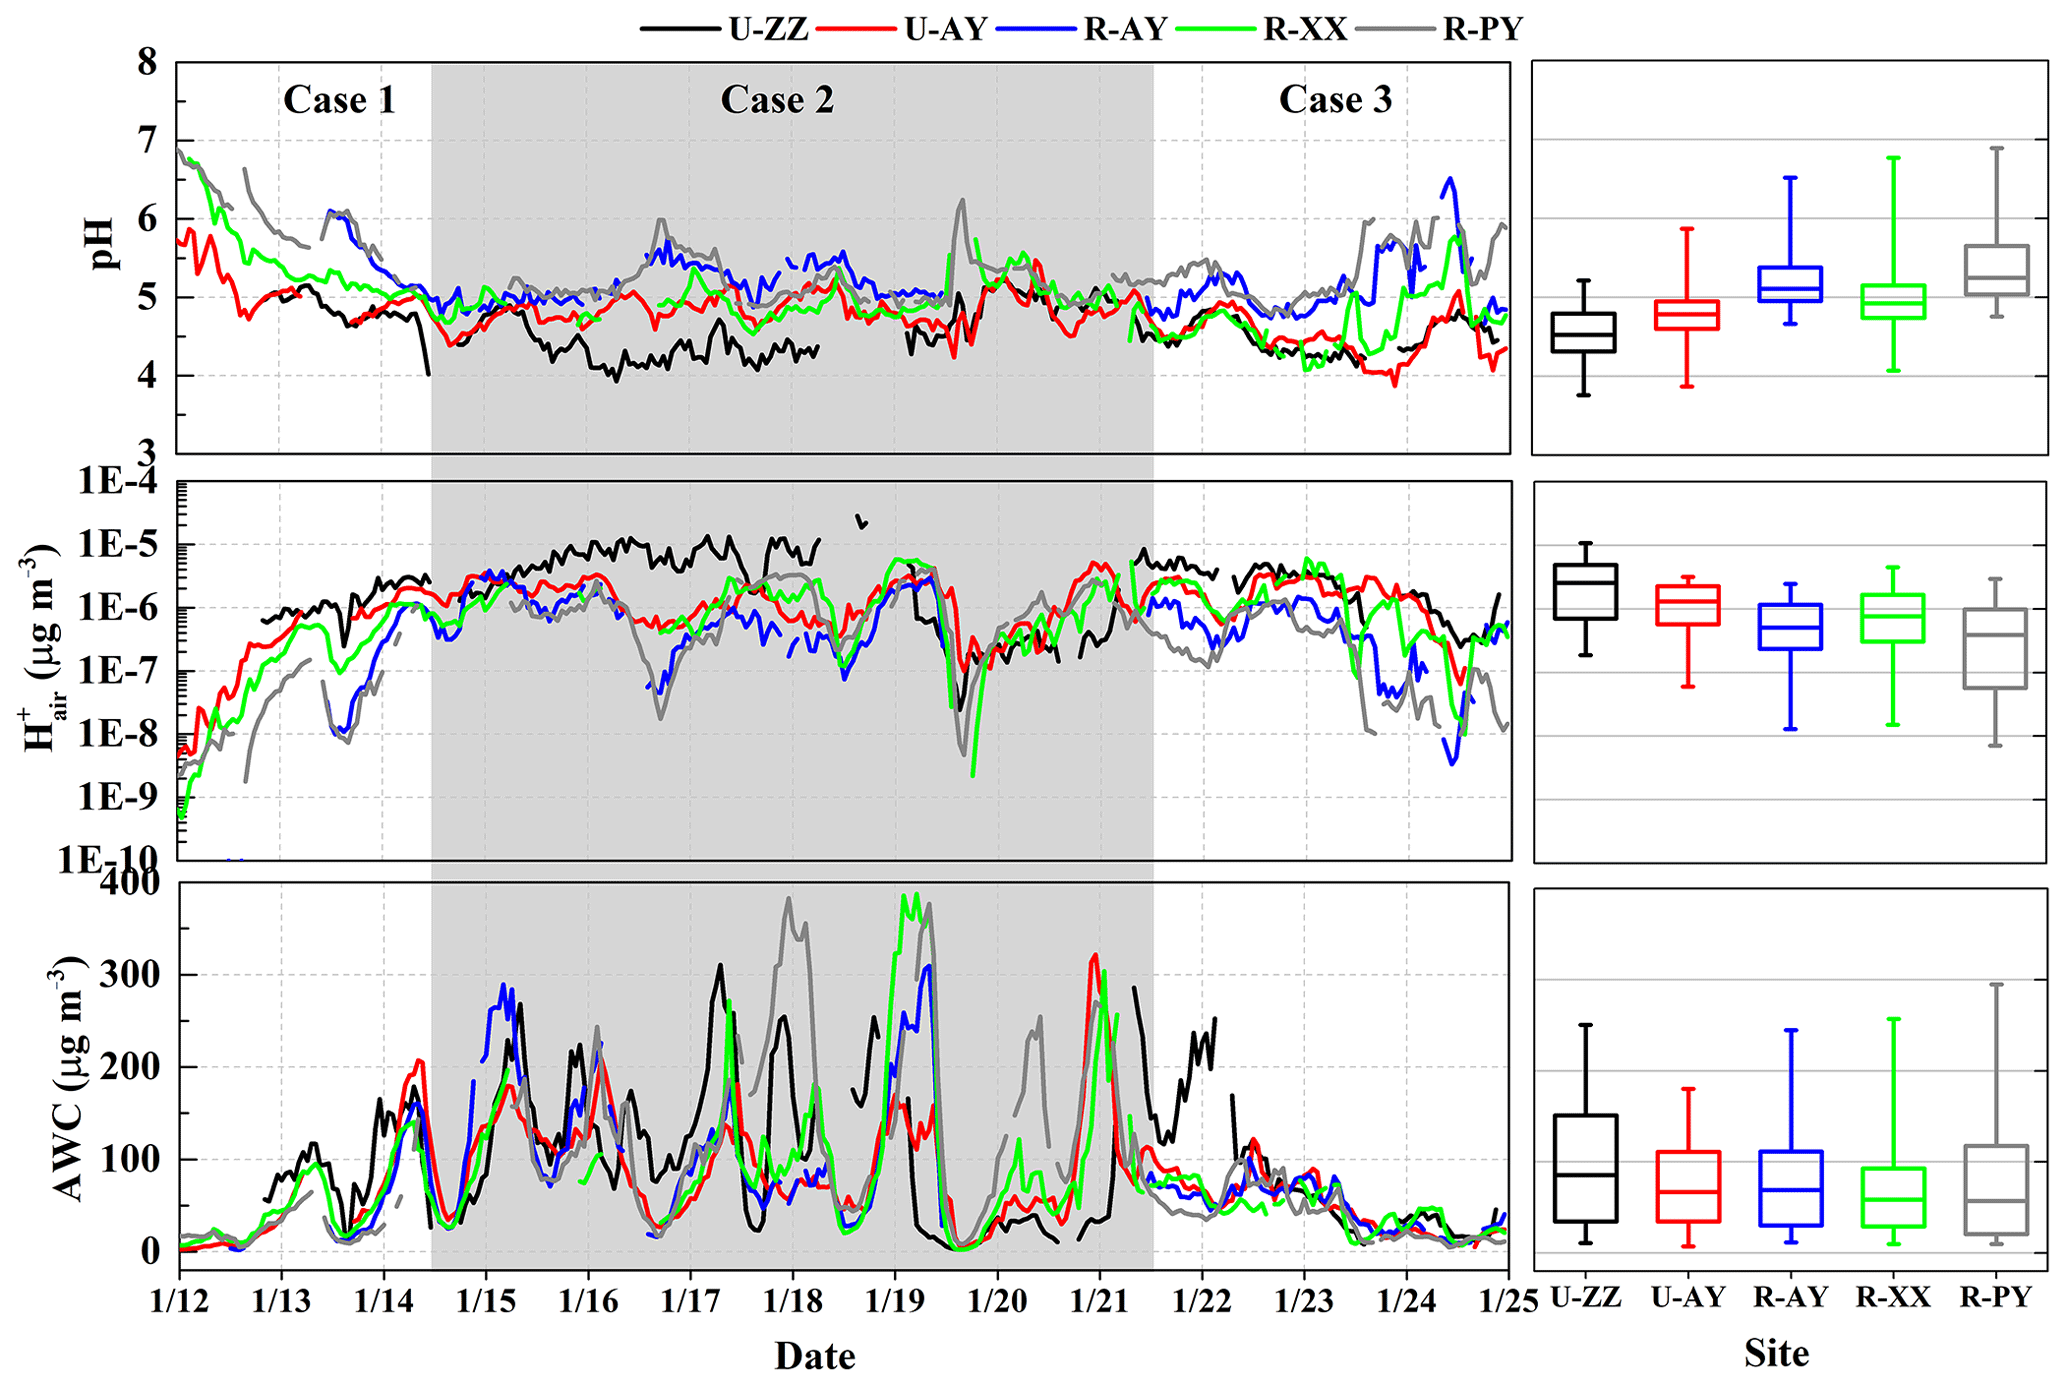
Figure 3Time series and box plot of predicted PM2.5 pH, , and aerosol water content (AWC) at the five sites. In each box, the top, middle, and bottom lines represent the 75, 50, and 25 percentile of statistical data, respectively; the upper and lower whiskers represent the maximum and minimum values, respectively.
The pH values (Table S2 in the Supplement) of the five sites during Cases 2 and 3 were comparable but slightly lower than those during Case 1. As shown in Fig. S9 in the Supplement, predicted pH values present better correlations with concentrations rather than AWC. Particle hydronium ion aqueous concentration depends on both the presence of ions and the amount of particle AWC (Guo et al., 2015). Moreover, was closely associated with the NH3 mixing ratios, and higher NH3 always corresponded to lower (Liu et al., 2017). High correlations (r>0.5) between and TWSIIs (Table S3 in the Supplement) imply that local pH was significantly affected by the TWSIIs levels, and probably resulted in the high acidity during Case 2. was also correlated with individual chemical species (e.g., TNHx, TH2SO4, TNO3, and TCl). Therefore, the diversity of pH in Cases 1 and 3 may be partly owing to the different proportions of particle- and gas-phase constituents that will be discussed in detail below. In addition, high correlations between RH and (Table S3 in the Supplement) suggest that meteorological conditions have major effects on particle pH. Given the Case 2 was less affected by regional transport, the diurnal patterns of median pH values of the five sites (Fig. 4) indicate that pH values during nighttime were 0.3 (R-PY) to 0.5 (U-ZZ) units higher than those during the daytime. Similar results were also found in other cities (e.g., Beijing, Tianjin, southern Canada, and the USA) (Battaglia et al., 2017; Ding et al., 2019; Guo et al., 2015; Murphy et al., 2017; Shi et al., 2019), resulting from the diurnal trends of T and RH (Fig. 4f). After sunrise, high T facilitated the dissociation of particle-phase ammonium (e.g., NH4NO3) and led to a rapid loss of AWC (Guo et al., 2015; Saraswati et al., 2019).
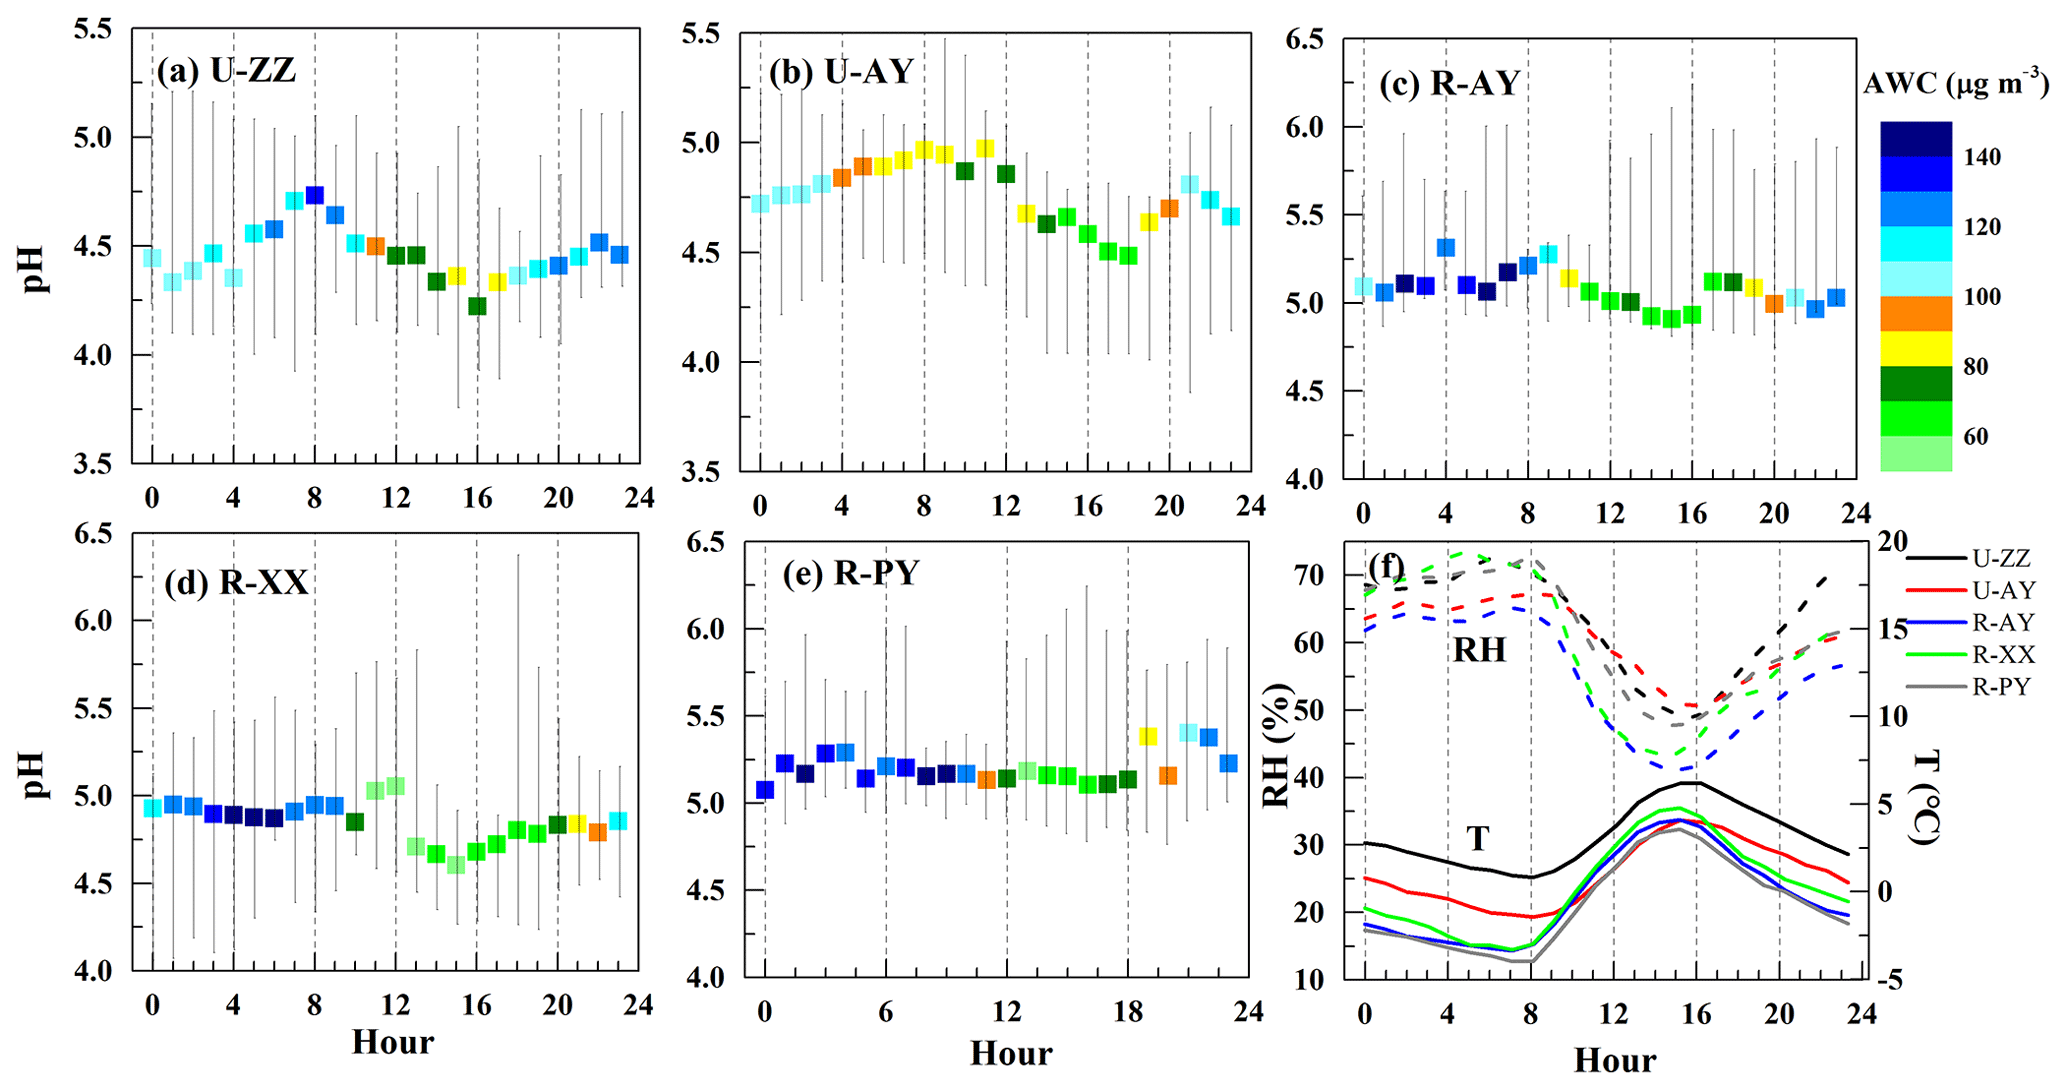
Figure 4(a–e) Diurnal patterns of median pH values, (f) average RH, and T of the five sites in Case 2. The upper and lower ends of the line represent the maximum and minimum values of pH, respectively. The color scale bar represents AWC concentration.
3.3 Sensitivity tests of pH
To explore the dominant factors that determine the local particle pH level and resulting in the high pH at rural sites, sensitivity tests of pH to chemical species (i.e., TNHx, TH2SO4, TNO3, TCl, TNa, K+, Ca2+, and Mg2+) and meteorological parameters (i.e., T and RH) were performed. Firstly, the real-time measured values of a variable (e.g., TNHx) and average values of other parameters (i.e., TH2SO4, TNO3, TCl, TNa, K+, Ca2+, Mg2+, T, and RH) during Case 2 were input into ISORROPIA-II to investigate the sensitivity of local pH to this variable (i.e., TNHx) (Ding et al., 2019), and results are listed in Table 4 and Fig. S10 in the Supplement. In addition, a given range for a variable for all sites with corresponding average values of other parameters was simulated to compare its effects on pH among five sites (Fig. 5 and Fig. S11 in the Supplement). The chosen variation range for each variable was close to the observed minimum and maximum values (Table S4 in the Supplement), which aims to better reflect the actual observation conditions. The degree of sensitivity was represented as the relative standard deviation (% RSD) of the re-calculated pH values. RSD calculates the absolute value of the coefficient of variation, which helps us to determine how small or large the standard deviation is when compared to the mean of the re-calculated pH data set. Therefore, when the re-calculated pH data set has a higher RSD value, this variable can change the pH more easily and is more important for local pH.

Figure 5(a–f) Comparison of the sensitivities of PM2.5 pH to T, RH, TCl (), TNHx (), TNO3 (), and TH2SO4 (replaced by observed ) among the five sites. A given range for a variable for all sites with corresponding average values of other parameters was used as input to the ISORROPIA-II model. The range of the x axis is close to the observed minimum and maximum values in Case 2 (Table S4 in the Supplement). The color scale bar represents the pH values. The relative standard deviation (% RSD) and range (Range) represent the sensitivity degree of pH to this variable and range (min–max) of the re-predicted pH value in the test, respectively. The square plots on the graph represent the average values of each variable observed in Case 2 with standard deviation as an error bar.
As shown in Table 4, the most important factor that influenced particle pH during Case 2 was TNHx, followed by TH2SO4 at the five sites, and the U-ZZ site was also affected by TNO3. The acidity of PM2.5 is governed by the phase partitioning of semi-volatile gases such as NH3, HNO3, and HCl (Pye et al., 2020). (NH4)2SO4, NH4HSO4, and NH4NO3, which are mainly formed through neutralization reactions between NH3 with and HNO3 successively according to the regime of local ammonia, are the most abundant components of PM2.5 in winter haze in this region (S. Wang et al., 2019b; Pathak et al., 2009). Therefore, particle pH was driven by TNHx, TH2SO4, and TNO3. TNa, TCl, and crustal ions (i.e., K+, Ca2+, and Mg2+) have less influence on the predicted pH values, because these species were at low concentrations, together accounting for lower than 10 % of TWSIIs. However, since the low volatility of these cations allows them to preferentially neutralize sulfates over NH3, the effects of crustal dust and sea spray on particle pH cannot be ignored when the mass fraction of these ions are high in typical pollution events (e.g., sandstorms) or areas (e.g., coasts) (Allen et al., 2015; Guo et al., 2018; Vasilakos et al., 2018). In addition to chemical species, T was more sensitive to local pH than RH at the five sites, which is similar to the finding in Beijing and Canada (Ding et al., 2019; Tao and Murphy, 2019). This result can be explained by the remarkable influence of T on the solubility and dissociation constants of the partitioning of NH3(g)∕ (Hennigan et al., 2015).
Table 4Sensitivity of pH to input data. The real-time measured values of a variable and the average values of other parameters during Case 2 were input into the ISORROPIA II. The degree of sensitivity was represented as the relative standard deviation (% RSD) of the re-calculated pH values; higher RSD implied higher sensitivity of this factor to pH and thus is more important for local pH.
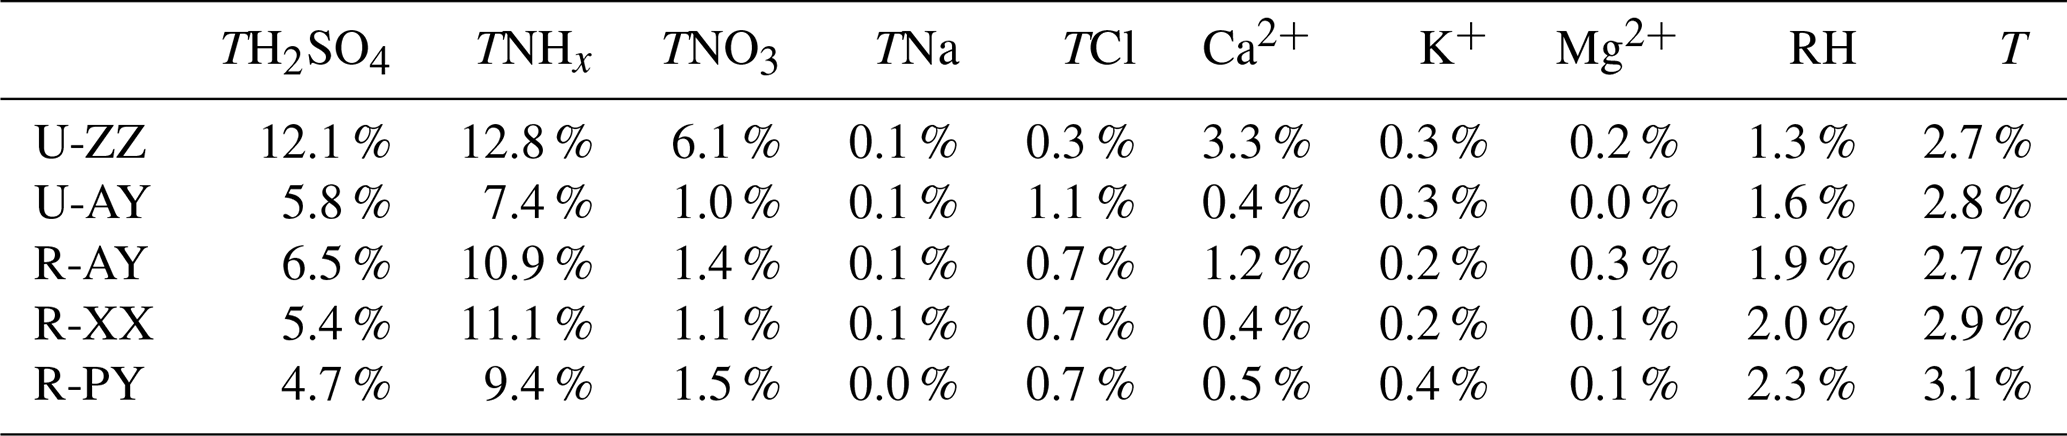
Figure 5 and Fig. S11 in the Supplement compare the sensitive degrees of pH to input data among different sites. Except for TNHx, the sensitivities of pH to TH2SO4, TNO3, and other ions at urban sites were more significant than those at rural sites, particularly at U-ZZ sites of 7.2 % and 14.8 % of RSD to TH2SO4 and TNO3, respectively. To gain insight into the differences of pH sensitivity among the five sites, sensitivity tests of pH to TH2SO4, TNO3, and TNHx were calculated using the fixed TNO3 (67.5 µg m−3) and TH2SO4 (36.5 µg m−3) concentrations under the average meteorological conditions of five sites (i.e., and RH = 60 %). These chosen values were close to the average values of the five sites during Case 2 (i.e., 36.4±15.4 µg m−3 for , 67.5±23.5 µg m−3 for TNO3, for T, and 59.3±14.0 % for RH), and other chemical species were set to be zero. As shown in Fig. 6, sensitivities of pH to TH2SO4 and TNO3 increase with the decrease in TNHx concentration, particularly when the TNHx concentrations are lower than 60 and 40 µg m−3, respectively. Therefore, the pH changes tended to become more sensitive to TH2SO4 and TNO3 at the U-ZZ site (Fig. 5e and f), with the lowest TNHx concentrations (). All these results may be explained by the presence of excess ammonia that will be discussed below.
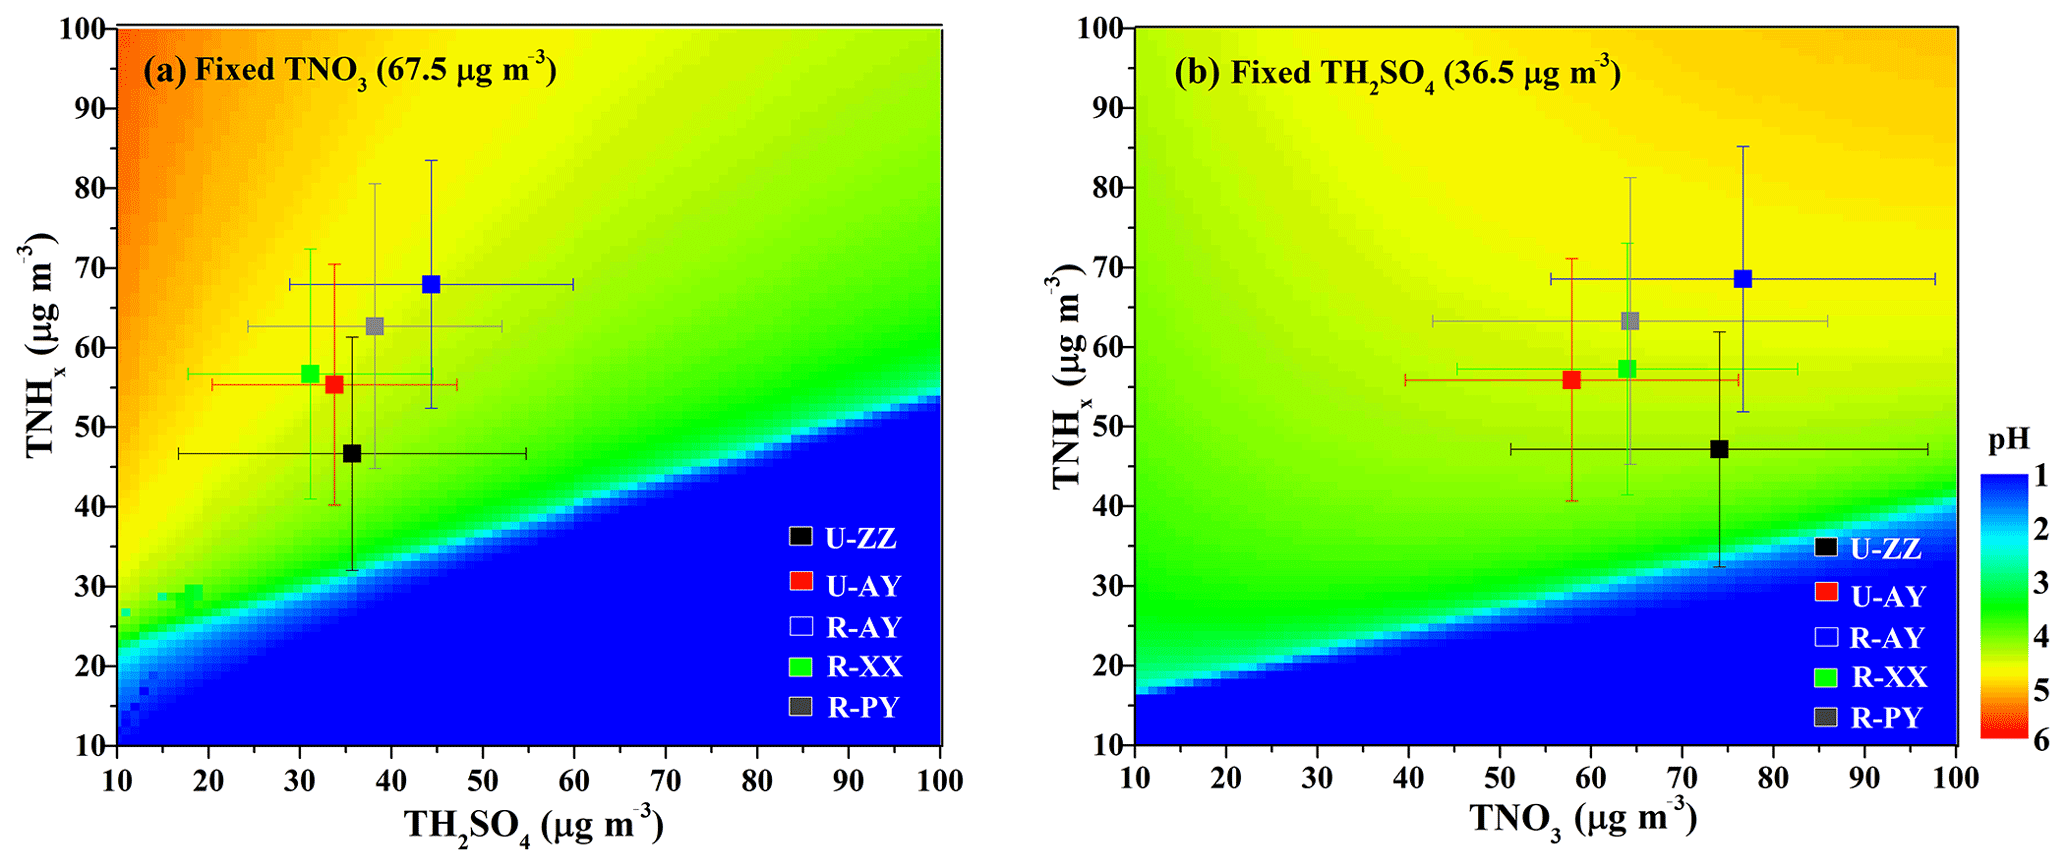
Figure 6Particle pH calculated with fixed meteorological parameters (T=275.5 K and RH=60 %) under different combinations of TNHx and (a) TH2SO4 (Fixed ) and (b) TNO3 (Fixed ). The color scale bar represents the pH values. The markers on the graph represent the average concentrations of TNHx, TH2SO4, and TNO3 at the five sites during Case 2 with standard deviation as error bar.
Sensitivity tests suggest (Fig. 5, Figs. S10 and S11 in the Supplement) that particle pH gradually grows with increased cation and decreased anion concentrations. Specifically, the TNHx concentration that increased from 25 to 90 µg m−3 can promote particle pH by 3.5 (U-ZZ) to 4.5 (R-AY) units. The crustal cations and sea spray have limited effects on pH, but a 10-fold increase in these species still can increase predicted pH values by about 0.1 units. TH2SO4 and TNO3, which increased from 10 to 80 µg m−3 and 1 to 125 µg m−3, can reduce the pH values by 1.5 (R-PY) to 4.0 (U-ZZ) and 0.2 (R-AY) to 1.4 (U-ZZ) units, respectively. In addition, a 20 ∘C (−5 to 15 ∘C) and 65 % (30 % to 95 %) increase drops the pH by approximately 1.3 and 2.7 units at the five sites, respectively. Corresponding to the observed data during Case 2 (Table 3), lower TNHx concentrations and higher T values were probably responsible for the higher acidity at urban sites than those at rural sites. Moreover, Fig. 6 shows that particle pH increase with decreasing TH2SO4 (Fig. 6a) or increasing TNO3 (Fig. 6b), particularly when the TNHx is at high concentration. These results indicate that predicted pH will be enhanced by increasing the TNO3 ∕ TH2SO4 ratio, which is consistent with the observation in Beijing (Xie et al., 2020). All these may be due to the elevated ammonia partitioning with nitrate fraction increase, and nitrate-rich particles would absorb more water compared to the sulfate-rich particles (Xie et al., 2020). Based on the above, higher TNHx (Table 3) and TNO3∕TH2SO4 ratios (2.9±0.6 and 1.7±0.6 for Cases 1 and 3, respectively) during Case 1 may lead to higher pH values than those during Case 3, even though the TWSIIs levels were comparable. In the long run, the decreasing sulfate concentration in PM2.5 accompanied with increasing nitrate concentration has been recorded during haze episodes in China, because strong actions were taken to reduce the coal consumption in recent years (Tian et al., 2017; Wang et al., 2017). Considering the ammonia in the atmosphere of northern China might still be increasing (Liu et al., 2018), future acidity of PM2.5 during winter haze episodes is expected to become increasingly less acidic in this area. A more careful analysis is needed to test this inference, however, because fine-mode particle remains a relatively constant pH of 0–2 despite a 70 % reduction in sulfates in the USA (Vasilakos et al., 2018; Weber et al., 2016).
3.4 Effects of ammonia on pH
It has been suggested that unusually high levels of NH3 can increase pH: on average, a 5-fold to 10-fold increase in the NH3 levels leads to a 1-unit change in pH (Nah et al., 2018; Weber et al., 2016; Guo et al., 2017). To examine the effects of major indicators of ammonia (i.e., TNHx, Required-NHx, and Excess-NHx; see Text S3 in the Supplement for more details of calculation) on aerosol acidity, particle pH was calculated by using a wide range of TNHx (25–130 µg m−3) and average values of other parameters during Case 2 (Table 3) of each site. Simultaneously, the concentrations of TNHx, Required-NHx, Excess-NHx, and corresponding pH values are illustrated in Fig. 7. An “S-curve” growth trend of pH with increasing TNHx appears with the inflection point around the Required-NHx concentration. In the case when the input TNHx concentration is lower than the Required-NHx, the growth rate of pH increases with increasing TNHx; otherwise, the pH growth flattens out, which is similar to the findings of Weber et al. (2016) and Bougiatioti et al. (2016). In the process of increasing NH3 concentration, NH3 reacted with and HNO3 successively, during which large amounts of H+ were consumed and pH values rapidly increased. Theoretically, the Required-NHx plus nonvolatile cations can neutralize all anions regardless of phase partitioning and bisulfate formation, and thus changes in TNHx around the Required-NHx concentrations have a significant impact on particle pH. Subsequently, dissolving Excess-NHx into the particles became difficult, and pH values increased slowly (Ding et al., 2019; Seinfeld and Pandis, 2016). Therefore, the underlying reason why TNHx concentrations lower than 60 and 40 µg m−3 elevated the pH sensitivities (Fig. 6) to TH2SO4 and TNO3 is that the Excess-NHx is exhausted under the case of TH2SO4 and TNO3 that ranged from 10 to 100 µg m−3, respectively. On the other hand, the pH values of the five sites at the Required-NHx concentrations are near 3.0, which coincides with the pH value of Beijing in the no-excess-NHx cases (Liu et al., 2017). Therefore, the presence of Excess-NHx in the aerosol likely was an important factor in the lower acidity of PM2.5, and it might have enhance pH values by 1.5 (U-ZZ) to 2 (R-PY) units. Considering that the Excess-NHx concentrations at rural sites (e.g., at R-PY) were higher than those at urban sites (e.g., at U-ZZ), Excess-NHx concentrations may drive the pH values of rural sites higher than those of urban sites.
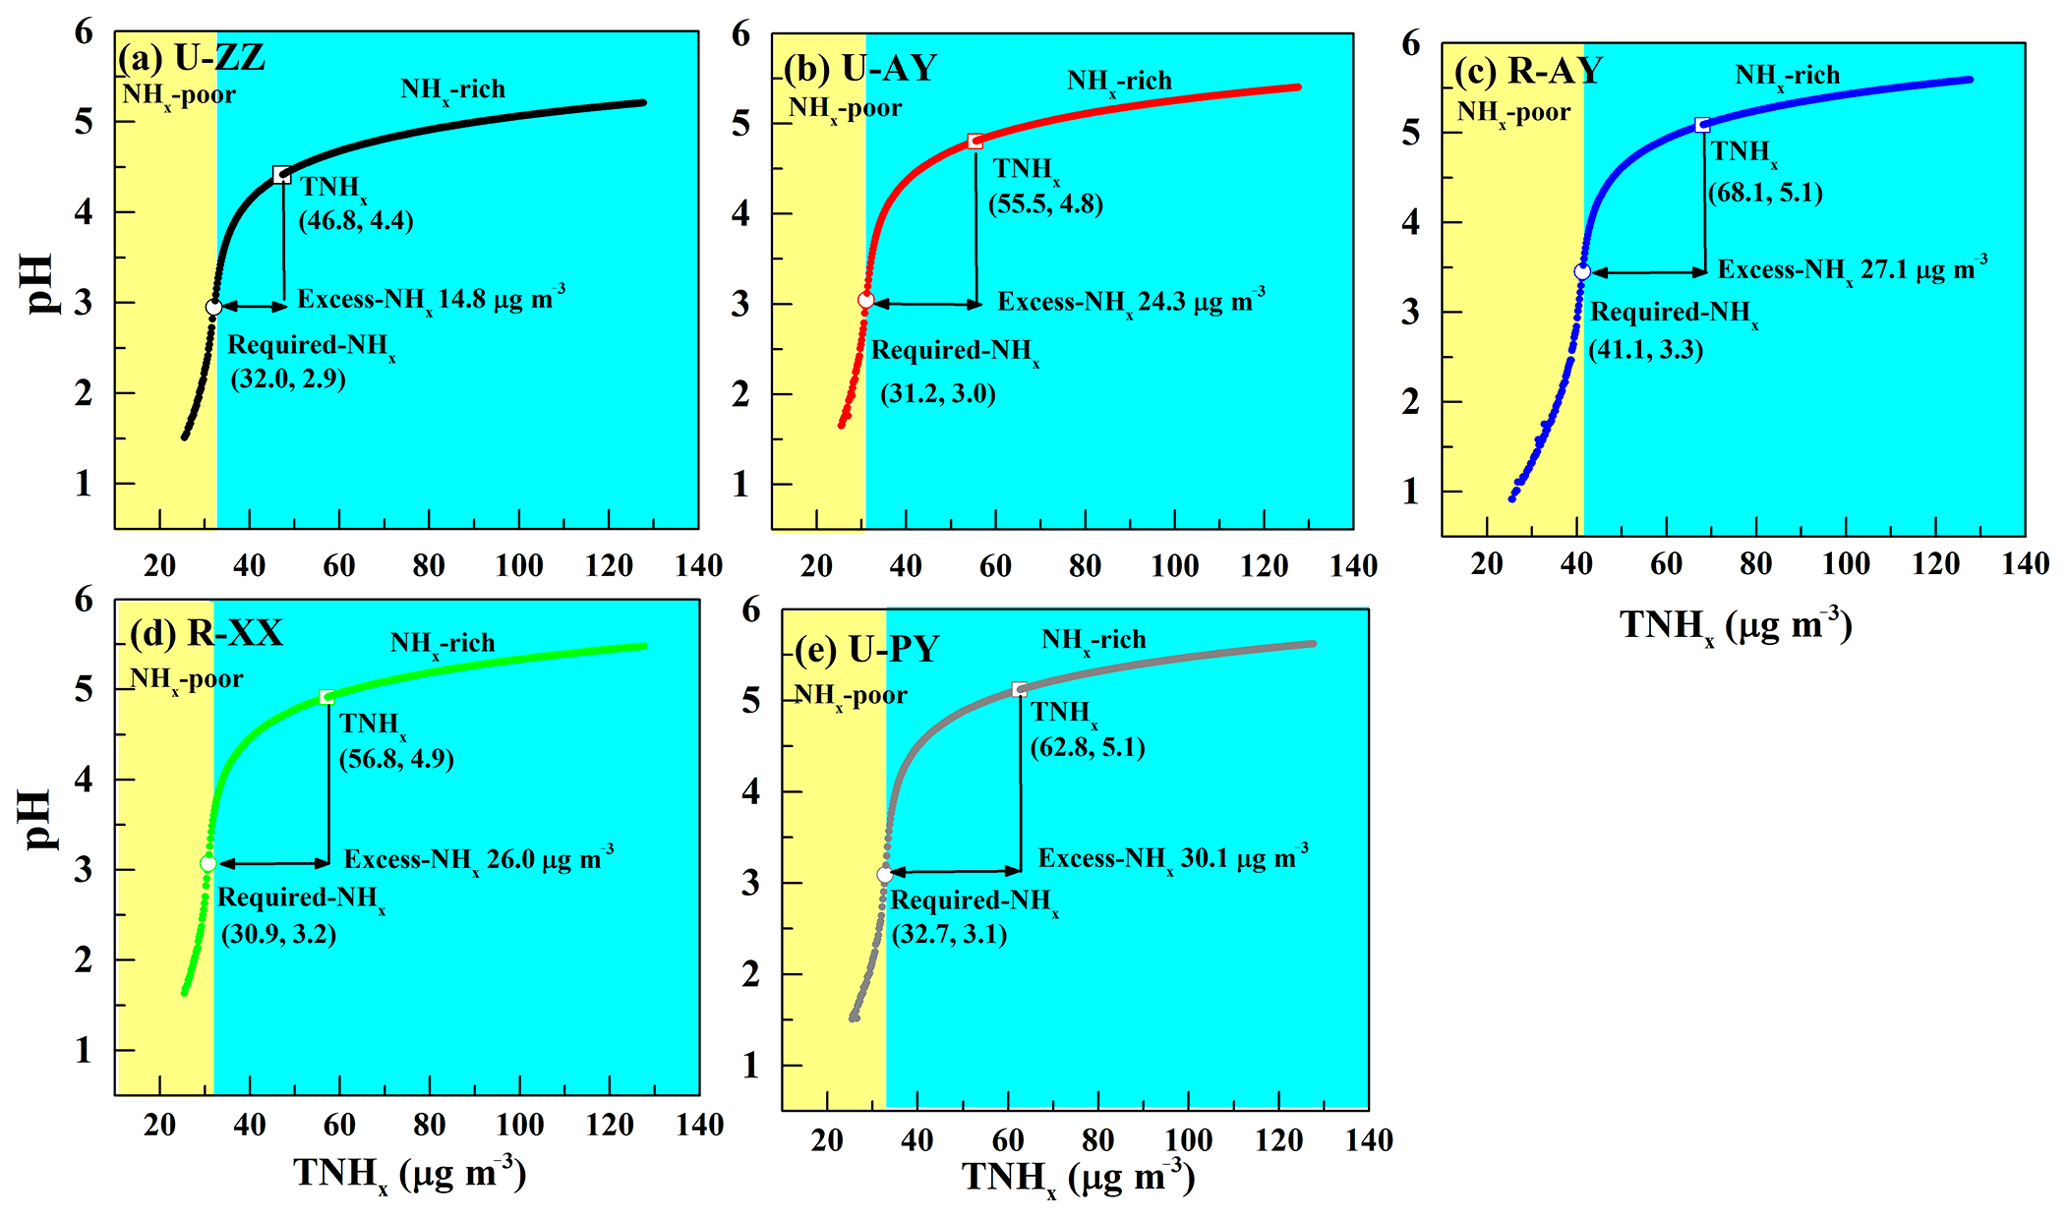
Figure 7(a–e) Particle pH corresponds to increasing TNHx at the five sites, used to examine the effects of major indicators of NH3 (i.e., TNHx, Required-NHx, and Excess-NHx) on aerosol acidity. Particle pH was calculated by using a wide range of TNHx (25–130 µg m−3) and average values of other parameters during Case 2 of each site. The concentrations of TNHx, Required-NHx, and Excess-NHx with corresponding pH values are marked by a hollow box, hollow circle, and arrow, respectively. The yellow and blue background colors correspond to the NHx-poor and NHx-rich regions, respectively.
3.5 Implications of regional transport
From the above discussion, the differences of pH among three cases indicate that the underlying influence of regional transport on local particle pH cannot be neglected, as it differs the chemical components of PM2.5 and meteorological conditions. In particular, the median pH values (Table S2 in the Supplement) of Case 1, during which the air masses were transported from the south of sampling regions, increased by 0.2–0.9 units over those during Cases 2 and 3. Aqueous formations of sulfate are strongly dependent on particle pH. Cheng et al. (2016) reported that the aqueous-phase sulfate production rates from NO2 and O3 oxidation of SO2 had a positive correlation with particle pH during the Beijing haze events. When pH exceeded approximately 4.5 (higher than this value at rural sites in this work), NO2 oxidation dominated the sulfate formation, and its reaction rate increased by 1 order of magnitude with the rise of pH by 1 unit. Thus, air masses transported from rural and agricultural regions may promote the sulfate formation in urban aerosols. In addition to sulfate, higher aerosol pH favors partitioning of TNO3 toward aerosol NO3 rather than gaseous HNO3, thus elevating the particle mass concentration (Nenes et al., 2020; Weber et al., 2016). Sampling regions in this study are located on a transport route for Beijing (MEP, 2017), thereby frequently affecting its local particle pH. The lifetimes of NH3 (1–5 days or less) and (1–15 days) in the atmosphere are sufficient for transport to Beijing during a haze episode (Aneja, 2000; Lefer et al., 1999; Warneck, 1988). Ding et al. (2019) have also observed that PM2.5 pH from the southwest direction was generally higher than that from the northern direction in Beijing. Therefore, the particle pH in Beijing may be enhanced when southern air masses from this region accompany elevated-pH particles and high ammonia levels.
An experiment was performed using a series of high-time-resolution instruments in two urban (i.e., U-ZZ and U-AY) and three rural sites (i.e., R-AY, R-XX, and R-PY) in Henan Province during a large-scale and long-lasting haze episode. The ISORROPIA-II model was used to investigate the pH value and its driving factors. PM2.5 exhibited moderate acidity with median pH values of 4.5 (3.8–5.2), 4.8 (3.9–5.8), 4.9 (4.1–6.2), 5.1 (4.7–6.3), and 5.2 (4.8–6.5,) at U-ZZ, U-AY, R-XX, R-AY, and R-PY, respectively. The pH values at rural sites were slightly higher than those at urban sites.
The predicted pH values of PM2.5 were significantly affected by the WSIIs levels, different proportions of particle- and gas-phase constituents, and meteorological parameters. Sensitivity tests show that TNHx, followed by TH2SO4, were the most important factors influencing the predicted pH at the five sites. In addition, T was more sensitive to local pH than RH. Generally, particle pH rose with the increase in cation and the decrease in the anion, T, and RH. Further study suggests that predicted pH will be enhanced by increasing the TNO3∕TH2SO4 ratio. Therefore, elevated TNHx concentrations and lower T were probably responsible for the higher pH values at rural sites than those at urban sites, and higher TNHx and TNO3∕TH2SO4 ratios during Case 1 may lead to higher pH values than those during Case 3.
An S-curve growth trend of pH to increasing TNHx was found with the inflection point around the Required-NHx concentration. Moreover, the pH values of the five sites at the Required-NHx concentrations are near 3.0, and the presence of Excess-NHx in the aerosol can enhance pH values by 1.5 (U-ZZ) to 2 (R-PY) units, and thus Excess-NHx was likely an important factor leading to the lower acidity of PM2.5 during the severe haze episodes in this region. Considering that the Excess-NHx concentrations at rural sites were higher than those at urban sites, Excess-NHx concentrations may lead the pH values of rural sites to be higher than those of urban sites.
The underlying influence of regional transport on local particle pH cannot be neglected, as it differs the chemical components of PM2.5 and meteorological conditions. Air masses transported from rural and agricultural regions with elevated pH particles and high ammonia levels may promote secondary particle formation in urban aerosols. Therefore, ammonia should be considered in the regional strategy for improving air quality in China.
All data in this work are available by contacting the corresponding author Shasha Yin (shashayin@zzu.edu.cn).
The supplement related to this article is available online at: https://doi.org/10.5194/acp-20-2719-2020-supplement.
SY and RZ designed and led this study. SY was responsible for all observations and data collection. LW, YL, CW, and WW interpreted the data and discussed the results. SW wrote the paper.
The authors declare that they have no conflict of interest.
This work was supported by the National Key R&D Program of China (no. 2017YFC0212403) and the National Natural Science Foundation of China (no. 41907187). We thank Qi Hao and Liuming Yang for their contributions to the field observations.
This research has been supported by the National Key R&D Program of China (grant no. 2017YFC0212403) and the National Natural Science Foundation of China (grant no. 41907187).
This paper was edited by Delphine Farmer and reviewed by two anonymous referees.
This article is part of the special issue “In-depth study of air pollution sources and processes within Beijing and its surrounding region (APHH-Beijing) (ACP/AMT inter-journal SI)”. It is not associated with a conference.
Allen, H. M., Draper, D. C., Ayres, B. R., Ault, A., Bondy, A., Takahama, S., Modini, R. L., Baumann, K., Edgerton, E., Knote, C., Laskin, A., Wang, B., and Fry, J. L.: Influence of crustal dust and sea spray supermicron particle concentrations and acidity on inorganic aerosol during the 2013 Southern Oxidant and Aerosol Study, Atmos. Chem. Phys., 15, 10669–10685, https://doi.org/10.5194/acp-15-10669-2015, 2015.
Aneja, V. P., Chauhan, J. P., and Walker, J. T.: Characterization of atmospheric ammonia emissions from swine waste storage and treatment lagoons, J. Geophys. Res.-Atmos., 105, 11535–11545, 2000.
Battaglia, M. A., Douglas, S., and Hennigan, C. J.: Effect of the urban heat island on aerosol pH, Environ. Sci. Technol., 51, 13095–13103, 2017.
Behera, S. N., Betha, R., Liu, P., and Balasubramanian, R.: A study of diurnal variations of PM2.5 acidity and related chemical species using a new thermodynamic equilibrium model, Sci. Total Environ., 452, 286–295, 2013.
Boucher, O. and Anderson, T. L.: General circulation model assessment of the sensitivity of direct climate forcing by anthropogenic sulfate aerosols to aerosol size and chemistry, J. Geophys. Res.-Atmos., 100, 26117–26134, 1995.
Bougiatioti, A., Nikolaou, P., Stavroulas, I., Kouvarakis, G., Weber, R., Nenes, A., Kanakidou, M., and Mihalopoulos, N.: Particle water and pH in the eastern Mediterranean: source variability and implications for nutrient availability, Atmos. Chem. Phys., 16, 4579–4591, https://doi.org/10.5194/acp-16-4579-2016, 2016.
Bureau of Statistics of Henan (BSH): Henan Statistical Yearbook, China Statistics Press, Beijing, 2018.
Cheng, Y., Zheng, G., Wei, C., Mu, Q., Zheng, B., Wang, Z., Gao, M., Zhang, Q., He, K., and Carmichael, G.: Reactive nitrogen chemistry in aerosol water as a source of sulfate during haze events in China, Sci. Adv., 2, e1601530–e1601530, 2016.
Clegg, S. L., Brimblecombe, P., and Wexler, A. S.: The thermodynamic model of the system H+----H2O at tropospheric temperatures, J. Phys. Chem. A, 102, 2137–2154, 1998.
Ding, J., Zhao, P., Su, J., Dong, Q., Du, X., and Zhang, Y.: Ding, J., Zhao, P., Su, J., Dong, Q., Du, X., and Zhang, Y.: Aerosol pH and its driving factors in Beijing, Atmos. Chem. Phys., 19, 7939–7954, https://doi.org/10.5194/acp-19-7939-2019, 2019.
Dockery, D. W., Cunningham, J., Damokosh, A. L., Neas, L. M., Spengler, J. D., Koutrakis, P., Ware, J. H., Raizenne, M., and Speizer, F. E.: Health effects of acid aerosols on North American children: respiratory symptoms, Environ. Health Persp., 104, 500–505, 1996.
Fu, X., Guo, H., Wang, X., Ding, X., He, Q., Liu, T., and Zhang, Z.: PM2.5 acidity at a background site in the Pearl River Delta region in fall–winter of 2007–2012, J. Hazard Mater., 286, 484–492, 2015.
Guo, H., Xu, L., Bougiatioti, A., Cerully, K. M., Capps, S. L., Hite Jr., J. R., Carlton, A. G., Lee, S.-H., Bergin, M. H., Ng, N. L., Nenes, A., and Weber, R. J.: Fine-particle water and pH in the southeastern United States, Atmos. Chem. Phys., 15, 5211–5228, https://doi.org/10.5194/acp-15-5211-2015, 2015.
Guo, H., Sullivan, A. P., Campuzanojost, P., Schroder, J. C., Lopezhilfiker, F. D., Dibb, J. E., Jimenez, J. L., Thornton, J. A., Brown, S. S., and Nenes, A.: Fine particle pH and the partitioning of nitric acid during winter in the northeastern United States, J. Geophys. Res.-Atmos., 121, 10355–10376, https://doi.org/10.1002/2016JD025311, 2016.
Guo, H., Weber, R. J., and Nenes, A.: High levels of ammonia do not raise fine particle pH sufficiently to yield nitrogen oxide-dominated sulfate production, Sci. Rep., 7, 12109, https://doi.org/10.1038/s41598-017-11704-0, 2017.
Guo, H., Nenes, A., and Weber, R. J.: The underappreciated role of nonvolatile cations in aerosol ammonium-sulfate molar ratios, Atmos. Chem. Phys., 18, 17307–17323, https://doi.org/10.5194/acp-18-17307-2018, 2018.
Haskins, J. D., Jaegle, L., Shah, V., Lee, B. H., Lopez-Hilfiker, F. D., Campuzano-Jost, P., Schroder, J. C., Day, D. A., Guo, H. Y., Sullivan, A. P., Weber, R., Dibb, J., Campos, T., Jimenez, J. L., Brown, S. S., and Thornton, J. A.: Wintertime gas-particle partitioning and speciation of inorganic chlorine in the lower troposphere over the northeast United States and coastal ocean, J. Geophys. Res.-Atmos., 123, 12897–12916, 2018.
Healy, R. M., Sciare, J., Poulain, L., Crippa, M., Wiedensohler, A., Prévôt, A. S. H., Baltensperger, U., Sarda-Estève, R., McGuire, M. L., Jeong, C.-H., McGillicuddy, E., O'Connor, I. P., Sodeau, J. R., Evans, G. J., and Wenger, J. C.: Quantitative determination of carbonaceous particle mixing state in Paris using single-particle mass spectrometer and aerosol mass spectrometer measurements, Atmos. Chem. Phys., 13, 9479–9496, https://doi.org/10.5194/acp-13-9479-2013, 2013.
Hennigan, C. J., Izumi, J., Sullivan, A. P., Weber, R. J., and Nenes, A.: A critical evaluation of proxy methods used to estimate the acidity of atmospheric particles, Atmos. Chem. Phys., 15, 2775–2790, https://doi.org/10.5194/acp-15-2775-2015, 2015.
Hu, G., Zhang, Y., Sun, J., Zhang, L., Shen, X., Lin, W., and Yang, Y.: Variability, formation and acidity of water-soluble ions in PM2.5 in Beijing based on the semi-continuous observations, Atmos. Res., 145, 1–11, 2014.
Huang, X., Song, Y., Li, M., Li, J., Huo, Q., Cai, X., Zhu, T., Hu, M., and Zhang, H.: A high-resolution ammonia emission inventory in China, Global Biogeochem. Cy., 26, GB1030, https://doi.org/10.1029/2011GB004161, 2012.
Larssen, T., Lydersen, E., Tang, D., He, Y., Gao, J., Liu, H., Duan, L., Seip, H. M., Vogt, R. D., and Mulder, J.: Acid rain in China, Environ. Sci. Technol., 40, 418–425, 2006.
Lefer, B. L., Talbot, R. W., and Munger, J. W.: Nitric acid and ammonia at a rural northeastern US site, J. Geophys. Res.-Atmos., 104, 1645–1661, 1999.
Li, Y. J., Sun, Y., Zhang, Q., Li, X., Li, M., Zhou, Z., and Chan, C. K.: Real-time chemical characterization of atmospheric particulate matter in China: A review, Atmos. Environ., 158, 270–304, 2017.
Liu, J., Bergin, M., Guo, H., King, L., Kotra, N., Edgerton, E., and Weber, R. J.: Size-resolved measurements of brown carbon in water and methanol extracts and estimates of their contribution to ambient fine-particle light absorption, Atmos. Chem. Phys., 13, 12389–12404, https://doi.org/10.5194/acp-13-12389-2013, 2013.
Liu, M., Song, Y., Zhou, T., Xu, Z., Yan, C., Zheng, M., Wu, Z., Hu, M., Wu, Y., and Zhu, T.: Fine particle pH during severe haze episodes in northern China, Geophys. Res. Lett., 44, 5213–5221, 2017.
Liu, W., Lin, S., and Hu, G.: Characterizing remarkable changes of severe haze events and chemical compositions in multi-size airborne particles (PM1, PM2.5 and PM10) from January 2013 to 2016–2017 winter in Beijing, China, Atmos. Environ., 189, 133–144, 2018.
Markovic, M. Z., Vandenboer, T. C., and Murphy, J. G.: Characterization and optimization of an online system for the simultaneous measurement of atmospheric water-soluble constituents in the gas and particle phases, J. Environ. Monitor., 14, 1872–1884, 2012.
Meng, Z., Xu, X., Lin, W., Ge, B., Xie, Y., Song, B., Jia, S., Zhang, R., Peng, W., Wang, Y., Cheng, H., Yang, W., and Zhao, H.: Role of ambient ammonia in particulate ammonium formation at a rural site in the North China Plain, Atmos. Chem. Phys., 18, 167–184, https://doi.org/10.5194/acp-18-167-2018, 2018.
Meng, Z. Y., Lin, W. L., Jiang, X. M., Yan, P., Wang, Y., Zhang, Y. M., Jia, X. F., and Yu, X. L.: Characteristics of atmospheric ammonia over Beijing, China, Atmos. Chem. Phys., 11, 6139–6151, https://doi.org/10.5194/acp-11-6139-2011, 2011.
MEP: 2017 air pollution prevention and management plan for the Beijing-Tianjin-Hebei region and its surrounding areas, available at: http://dqhj.mee.gov.cn/dtxx/201703/t20170323_408663.shtml (last access: 18 August 2019), 2017.
Meskhidze, N., Chameides, W. L., Nenes, A., and Chen, G.: Iron mobilization in mineral dust: Can anthropogenic SO2 emissions affect ocean productivity?, Geophys. Res. Lett., 30, https://doi.org/10.1029/2003GL018035, 2003.
Murphy, J. G., Gregoire, P. K., Tevlin, A. G., Wentworth, G. R., Ellis, R. A., Markovic, M. Z., and VandenBoer, T. C.: Observational constraints on particle acidity using measurements and modelling of particles and gases, Faraday Discuss., 200, 379–395, 2017.
Nah, T., Guo, H., Sullivan, A. P., Chen, Y., Tanner, D. J., Nenes, A., Russell, A., Ng, N. L., Huey, L. G., and Weber, R. J.: Characterization of aerosol composition, aerosol acidity, and organic acid partitioning at an agriculturally intensive rural southeastern US site, Atmos. Chem. Phys., 18, 11471–11491, https://doi.org/10.5194/acp-18-11471-2018, 2018.
National Bureau of Statistics (NBS): China Statistical Yearbook, China Statistics Press, Beijing, 2016.
Nenes, A., Pandis, S. N., and Pilinis, C.: ISORROPIA: A new thermodynamic equilibrium model for multiphase multicomponent inorganic aerosols, Aquat. Geochem., 4, 123–152, 1998.
Nenes, A., Pandis, S. N., Weber, R. J., and Russell, A.: Aerosol pH and liquid water content determine when particulate matter is sensitive to ammonia and nitrate availability, Atmos. Chem. Phys. Discuss., https://doi.org/10.5194/acp-2019-840, in review, 2020.
Ostro, B., Lipsett, M., Wiener, M. B., and Selner, J. C.: Asthmatic responses to airborne acid aerosols, Am. J. Public Health, 81, 694–702, 1991.
Panteliadis, P., Hafkenscheid, T., Cary, B., Diapouli, E., Fischer, A., Favez, O., Quincey, P., Viana, M., Hitzenberger, R., Vecchi, R., Saraga, D., Sciare, J., Jaffrezo, J. L., John, A., Schwarz, J., Giannoni, M., Novak, J., Karanasiou, A., Fermo, P., and Maenhaut, W.: ECOC comparison exercise with identical thermal protocols after temperature offset correction – instrument diagnostics by in-depth evaluation of operational parameters, Atmos. Meas. Tech., 8, 779–792, https://doi.org/10.5194/amt-8-779-2015, 2015.
Pathak, R. K., Louie, P. K., and Chan, C. K.: Characteristics of aerosol acidity in Hong Kong. Atmos. Environ., 38, 2965–2974, 2004.
Pathak, R. K., Wu, W. S., and Wang, T.: Summertime PM2.5 ionic species in four major cities of China: nitrate formation in an ammonia-deficient atmosphere, Atmos. Chem. Phys., 9, 1711–1722, https://doi.org/10.5194/acp-9-1711-2009, 2009.
Pye, H. O. T., Nenes, A., Alexander, B., Ault, A. P., Barth, M. C., Clegg, S. L., Collett Jr., J. L., Fahey, K. M., Hennigan, C. J., Herrmann, H., Kanakidou, M., Kelly, J. T., Ku, I.-T., McNeill, V. F., Riemer, N., Schaefer, T., Shi, G., Tilgner, A., Walker, J. T., Wang, T., Weber, R., Xing, J., Zaveri, R. A., and Zuend, A.: The Acidity of Atmospheric Particles and Clouds, Atmos. Chem. Phys. Discuss., https://doi.org/10.5194/acp-2019-889, in review, 2020.
Rumsey, I. C., Cowen, K. A., Walker, J. T., Kelly, T. J., Hanft, E. A., Mishoe, K., Rogers, C., Proost, R., Beachley, G. M., Lear, G., Frelink, T., and Otjes, R. P.: An assessment of the performance of the Monitor for AeRosols and GAses in ambient air (MARGA): a semi-continuous method for soluble compounds, Atmos. Chem. Phys., 14, 5639–5658, https://doi.org/10.5194/acp-14-5639-2014, 2014.
Saraswati, Sharma, S. K., Saxena, M., and Mandal, T. K.: Characteristics of gaseous and particulate ammonia and their role in the formation of secondary inorganic particulate matter at Delhi, India, Atmos. Res., 218, 34–49, 2019.
Seinfeld, J. H. and Pandis, S. N.: Atmospheric Chemistry and Physics: From Air Pollution to Climate Change, 2nd Edn., John Wiley and Sons, Inc., Hoboken, New Jersey, USA, 2006.
Seinfeld, J. H. and Pandis, S. N.: Atmospheric Chemistry and Physics: From Air Pollution to Climate Change, 3rd Edn., John Wiley and Sons, Inc., Hoboken, New Jersey, USA, 2016.
Shen, J., Liu, X., Ying, Z., Fangmeier, A., Goulding, K., and Zhang, F.: Atmospheric ammonia and particulate ammonium from agricultural sources in the North China Plain, Atmos. Environ., 45, 5033–5041, 2011.
Shi, Z., Bonneville, S., Krom, M. D., Carslaw, K. S., Jickells, T. D., Baker, A. R., and Benning, L. G.: Iron dissolution kinetics of mineral dust at low pH during simulated atmospheric processing, Atmos. Chem. Phys., 11, 995–1007, https://doi.org/10.5194/acp-11-995-2011, 2011.
Shi, G., Xu, J., Peng, X., Xiao, Z., Chen, K., Tian, Y., Guan, X., Feng, Y., Yu, H., and Nenes, A.: pH of aerosols in a polluted atmosphere: source contributions to highly acidic aerosol, Environ. Sci. Technol., 51, 4289–4296, 2017.
Shi, X., Nenes, A., Xiao, Z., Song, S., Yu, H., Shi, G., Zhao, Q., Chen, K., Feng, Y., and Russell, A. G.: High-resolution data sets unravel the effects of sources and meteorological conditions on nitrate and its gas-particle partitioning, Environ. Sci. Technol., 53, 3048–3057, 2019.
Song, S., Gao, M., Xu, W., Shao, J., Shi, G., Wang, S., Wang, Y., Sun, Y., and McElroy, M. B.: Fine-particle pH for Beijing winter haze as inferred from different thermodynamic equilibrium models, Atmos. Chem. Phys., 18, 7423–7438, https://doi.org/10.5194/acp-18-7423-2018, 2018.
Spurny, K. R.: Atmospheric acidic aerosols (review), J. Aerosol Sci., 21, S185–S187, https://doi.org/10.1016/0021-8502(90)90215-J, 1990.
Surratt, J. D., Chan, A. W. H., Eddingsaas, N. C., Chan, M. N., Loza, C. L., Kwan, A. J., Hersey, S., Flagan, R. C., Wennberg, P. O., and Seinfeld, J. H.: Reactive intermediates revealed in secondary organic aerosol formation from isoprene, P. Natl. Acad. Sci. USA, 107, 6640–6645, 2010.
Tao, Y. and Murphy, J. G.: The sensitivity of PM2.5 acidity to meteorological parameters and chemical composition changes: 10-year records from six Canadian monitoring sites, Atmos. Chem. Phys., 19, 9309–9320, https://doi.org/10.5194/acp-19-9309-2019, 2019.
Tian, M., Wang, H., Chen, Y., Zhang, L., Shi, G., Liu, Y., Yu, J., Zhai, C., Wang, J., and Yang, F.: Highly time-resolved characterization of water-soluble inorganic ions in PM2.5 in a humid and acidic mega city in Sichuan Basin, China, Sci. Total Environ., 580, 224–234, 2017.
Vasilakos, P., Russell, A., Weber, R., and Nenes, A.: Understanding nitrate formation in a world with less sulfate, Atmos. Chem. Phys., 18, 12765–12775, https://doi.org/10.5194/acp-18-12765-2018, 2018.
Wang, C., Yin, S., Bai, L., Zhang, X., Gu, X., Zhang, H., Lu, Q., and Zhang, R.: High-resolution ammonia emission inventories with comprehensive analysis and evaluation in Henan, China, 2006–2016, Atmos. Environ., 193, 11–23, 2018.
Wang, G., Zhang, R., Gomez, M. E., Yang, L., Levy, Z. M., Hu, M., Lin, Y., Peng, J., Guo, S., and Meng, J.: Persistent sulfate formation from London Fog to Chinese haze, P. Natl. Acad. Sci. USA, 113, 13630–13635, 2016.
Wang, J., Zhao, B., Wang, S., Yang, F., Xing, J., Morawska, L., Ding, A., Kulmala, M., Kerminen, V., and Kujansuu, J.: Particulate matter pollution over China and the effects of control policies, Sci. Total Environ., 584, 426–447, 2017.
Wang, G., Zhang, F., Peng, J., Duan, L., Ji, Y., Marrero-Ortiz, W., Wang, J., Li, J., Wu, C., Cao, C., Wang, Y., Zheng, J., Secrest, J., Li, Y., Wang, Y., Li, H., Li, N., and Zhang, R.: Particle acidity and sulfate production during severe haze events in China cannot be reliably inferred by assuming a mixture of inorganic salts, Atmos. Chem. Phys., 18, 10123–10132, https://doi.org/10.5194/acp-18-10123-2018, 2018.
Wang, H., Ding, J., Xu, J., Wen, J., Han, J., Wang, K., Shi, G., Feng, Y., Ivey, C., and Wang, Y.: Aerosols in an arid environment: The role of aerosol water content, particulate acidity, precursors, and relative humidity on secondary inorganic aerosols, Sci. Total Environ., 646, 564–572, 2019.
Wang, S., Yan, Q., Yu, F., Wang, Q., Yang, L., Zhang, R., Yin, S., Wang, S., Yan, Q., and Yu, F.: Distribution and source of chemical elements in size-resolved particles in Zhengzhou, China: Effects of regional transport, Aerosol Air Qual. Res., 18, 371–385, 2018.
Wang, S., He, B., Yuan, M., Su, F., Yin, S., Yan, Q., Jiang, N., Zhang, R., and Tang, X.: Characterization of individual particles and meteorological conditions during the cold season in Zhengzhou using a single particle aerosol mass spectrometer, Atmos. Res., 219, 13–23, 2019a.
Wang, S., Yin, S., Zhang, R., Yang, L., Zhao, Q., Zhang, L., Yan, Q., Jiang, N., and Tang, X.: Insight into the formation of secondary inorganic aerosol based on high-time-resolution data during haze episodes and snowfall periods in Zhengzhou, China, Sci. Total Environ., 660, 47–56, 2019b.
Warneck, P.: Chemistry of the Natural Atmosphere, Academic Press, San Diego, CA, 1988.
Watson, J. G.: Visibility: science and regulation, J. Air Waste Manage., 52, 973–999, 2002.
Weber, R. J., Guo, H., Russell, A. G., and Nenes, A.: High aerosol acidity despite declining atmospheric sulfate concentrations over the past 15 years, Nat. Geosci., 9, 282–285, 2016.
Wen, L., Chen, J., Yang, L., Wang, X., Xu, C., Sui, X., Yao, L., Zhu, Y., Zhang, J., and Zhu, T.: Enhanced formation of fine particulate nitrate at a rural site on the North China Plain in summer: The important roles of ammonia and ozone, Atmos. Environ., 101, 294–302, 2015.
Xie, Y., Wang, G., Wang, X., Chen, J., Chen, Y., Tang, G., Wang, L., Ge, S., Xue, G., Wang, Y., and Gao, J.: Observation of nitrate dominant PM2.5 and particle pH elevation in urban Beijing during the winter of 2017, Atmos. Chem. Phys. Discuss., https://doi.org/10.5194/acp-2019-541, in review, 2020.