the Creative Commons Attribution 4.0 License.
the Creative Commons Attribution 4.0 License.
 | 05 Mar 2020
Significant seasonal changes in optical properties of brown carbon in the midlatitude atmosphere
Heejun Han
Hojong Seo
Kyung-Hoon Shin
Dong-Hun Lee
Atmospheric brown carbon (BrC) plays significant roles in the light absorption and photochemistry of the atmosphere. Although the sources and occurrences of BrC have been studied extensively, its removal processes and optical characteristics in the atmosphere have been poorly understood. In this study, we examined the seasonal changes in sources and sinks of BrC and water-soluble organic carbon (WSOC) in the atmosphere of Seoul, South Korea. Our results showed that the concentrations of BrC and WSOC decreased by approximately 80 % and 30 %, respectively, from the cold season (October–January) to the warm season (June–September). Excitation–emission matrix (EEM) spectra showed that the humic-like substance (HULIS) was the dominant fraction of BrC as the other components were not measurable. The air mass back trajectories of fire burning practices and the variations in non-crustal potassium (K) and vanadium (V) contents in the water-soluble aerosols during all seasons showed no measurable decrease in input of biomass-burning sources in summer. However, there was a significant shift in photo-resistivity of light-absorbing organic aerosols in the summer, indicating larger removals of ultraviolet (UV) degradable BrC. This trend is supported by laboratory UV radiation experiments on the optical property changes of BrC and WSOC in aerosol samples. Thus, our results suggest that the photodegradation has dominant roles in controlling the quantity and quality of light-absorbing organic aerosols in the different seasons in the midlatitude atmosphere.
- Article
(2918 KB) -
Supplement
(633 KB) - BibTeX
- EndNote


Organic aerosols play a significant role in atmospheric chemistry and the global climate system (Ghan and Schwartz, 2007; Duarte and Duarte, 2013; Kirillova et al., 2014a). Most organic aerosols consist of a significant fraction of carbonaceous organic aerosols absorbing radiation (Laskin et al., 2015). These light-absorbing organic aerosols, referred to as brown carbon (BrC), have attracted increasing attention owing to their significant roles in the radiative forcing of the global climate system by directly absorbing solar radiation (Andreae and Gelencsér, 2006; Graber and Rudich, 2006; Ramanathan et al., 2007; Kirillova et al., 2014a; Saleh et al., 2014) and indirectly acting as cloud condensation nuclei (CCN) for cloud formation (Kanakidou et al., 2005; Andreae and Gelencsér, 2006; Graber and Rudich, 2006; Kirillova et al., 2014a). The light-absorbing property of BrC, which absorbs solar radiation in the range of ultraviolet (UV) to visible wavelengths, is expected to be considerably weaker than that of the black carbon (BC), which absorbs over a wide spectral range from UV to near-infrared radiation (Feng et al., 2013; Laskin et al., 2015). However, its contribution would be significant due to its higher abundances over source regions (Hoffer et al., 2006; Gustafsson et al., 2009; Feng et al., 2013). Previous studies have estimated that the BrC contributes to approximately 19 % of the total atmospheric radiative forcing (Feng et al., 2013).
The origin of BrC is attributed predominantly to the atmospheric humic-like substance (HULIS), which has properties similar to terrestrial and aquatic humic and fulvic acids (Andreae and Gelencsér, 2006; Graber and Rudich, 2006; Lukács et al., 2007; Laskin et al., 2015; Yan and Kim, 2017). Previous studies have identified that HULIS has both direct emission sources from biomass burning, marine aerosols, and soil resuspension and indirect contribution from secondary formation (Graber and Rudich, 2006; Hoffer et al., 2006; Lin et al., 2010; Yan and Kim, 2017). Recently, residential coal combustion was suggested as an important source of HULIS during cold seasons (Tan et al., 2016; Voliotis et al., 2017; Li et al., 2019). Besides HULIS, biological aerosols (e.g., bacteria, algae, pollen, spores, fungi, plant debris, and animal tissue) are another important sources of BrC (Després et al., 2012; Pöhlker et al., 2012). In general, the atmospheric HULIS contributes to approximately 70 % of the water-soluble organic carbon (WSOC) (Laskin et al., 2015; Park and Son, 2017), while the WSOC contributes to 10 %–80 % of the total organic carbon contents in aerosols (Kirillova et al., 2014a, b; Fu et al., 2015). However, current understanding of the optical properties, chemical compositions, and degradation processes of light-absorbing organic aerosols still remain uncertain.
In this study, we evaluated the seasonal changes in optical and chemical characteristics, including photo-resistivity, of light-absorbing organic aerosols in an urban region. Recently, the method of excitation–emission matrix (EEM) characterization combined with a parallel factor analysis (PARAFAC) model has been employed for BrC studies (Kieber et al., 2006; Mladenov et al., 2011; Matos et al., 2015; Chen et al., 2016; Yan and Kim, 2017). This unique multi-analysis method can be used to identify individual chromophores of aerosol samples (i.e., HULIS versus protein-like substance) and light-absorbing properties of each sample. In addition, the stable carbon isotope ratios of WSOC (δ13CWSOC) and various chemical constituents were measured to identify the potential sources of organic aerosols in different seasons. Furthermore, we conducted laboratory experiments on the direct photochemical degradations of aerosol samples to verify the impacts of the UV radiation on the optical properties and carbon compositions of BrC and WSOC in the atmosphere.
2.1 Study site and sample collection
Seoul is the capital city of South Korea and one of the largest metropolitan cities in the world. Korea has been highly affected by severe dust storms known as Asian dust or the yellow dust originating from the Chinese and Mongolian deserts during the spring (March–May) and often during the winter (December–January) (Lin et al., 2012). The increase in contents of fine aerosols associated with anthropogenic emissions is of great concern and a focus of major environmental studies in this region (Seinfeld et al., 2004; Park et al., 2007).
Aerosol samples (N=78) were collected using a high-volume air sampler (HV-1000, SHIBATA) from March 2015 to January 2016 in Seoul, South Korea (37.5∘ N, 127.0∘ E; 20 m above ground level) (Fig. 1). The samples were collected for 24 h at a constant flow rate of 1000 L min−1 through a pre-combusted (450 ∘C for 5 h) glass microfiber filter (GF/F, 8×10 inch, 2 µm pore size, Whatman). A blank sample was collected by shortly exposing a blank filter at the study site and analyzed in the same manner as that for the other samples. The total suspended particulates (TSPs) of the aerosol samples were measured by using the mass differences in desiccated filters between the pre- and post-sampling. The collected samples were covered with an aluminum foil, placed in a polyethylene bag, and stored in the dark at −20 ∘C.
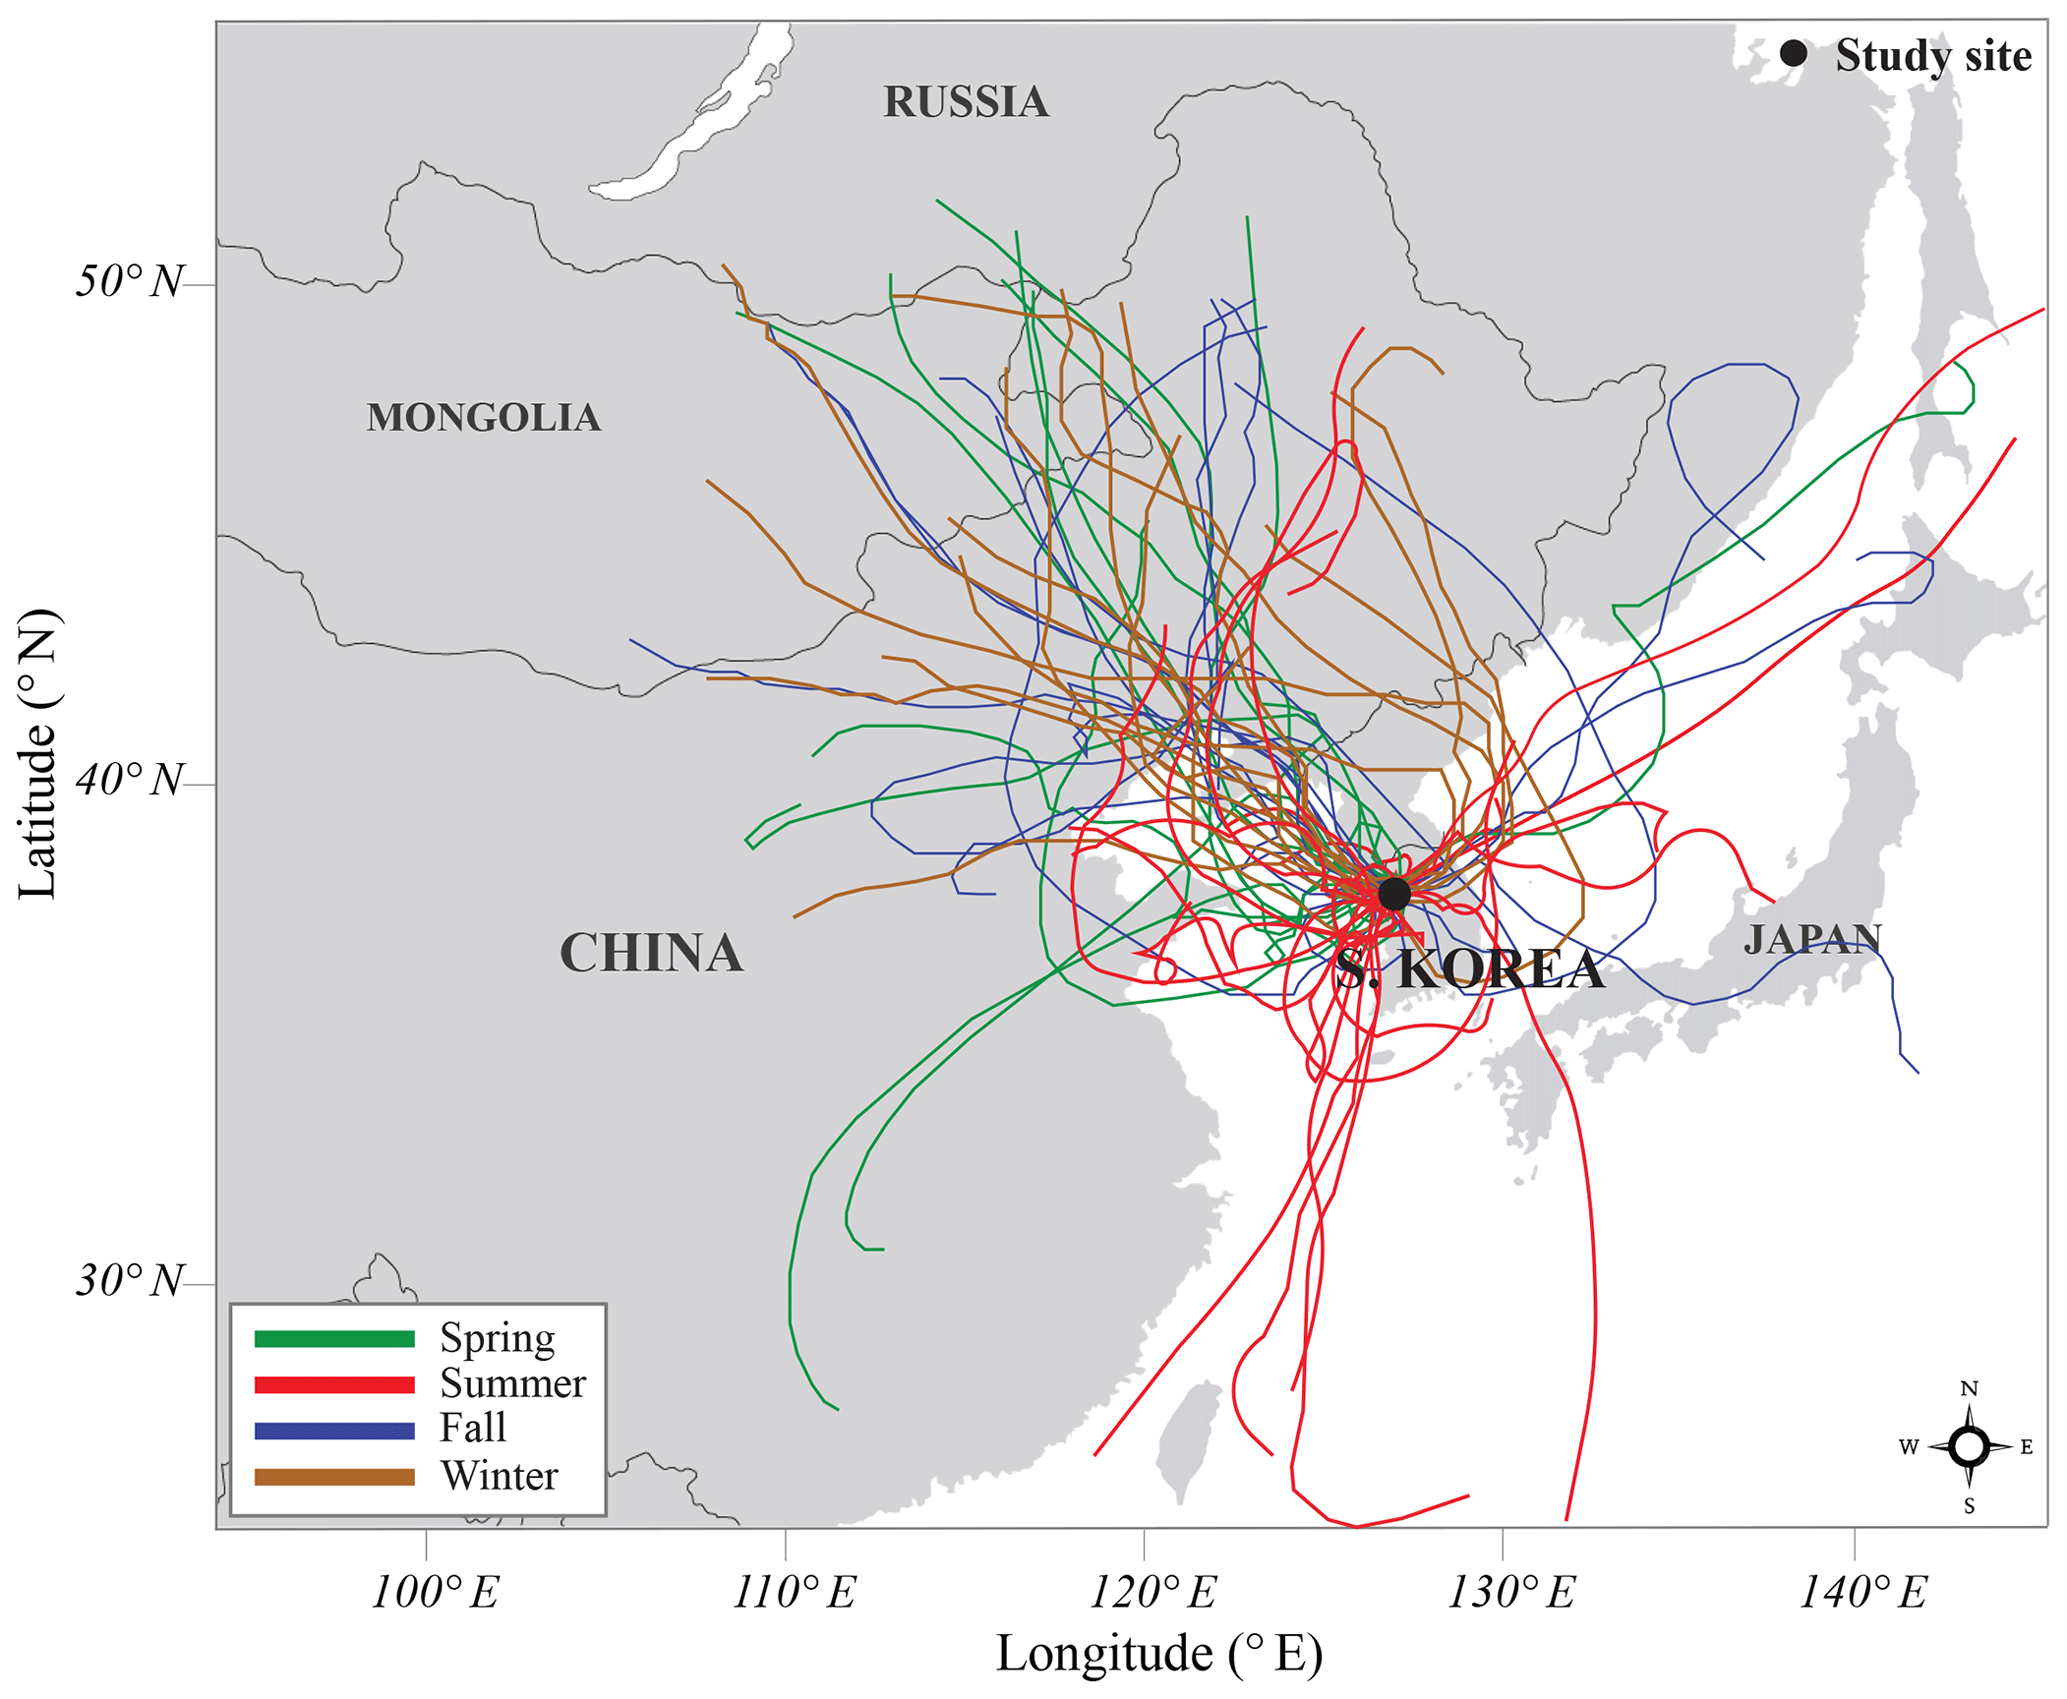
Figure 1Map of the geographical region around the study site and air mass transport pathways in the different seasons: spring (green), summer (red), fall (blue), and winter (brown). The 10 d air mass back trajectory was drawn by using the HYSPLIT model from March 2015 to January 2016 in Seoul, South Korea.
Meteorological parameters of the study site including the temperature and UV radiation rate were obtained from the ambient air quality monitoring network named AirKorea in the Korea Environmental Corporation (KECO) and Korea Meteorological Administration (KMA). Fire maps around the study site were obtained by using the Moderate Resolution Imaging Spectroradiometer (MODIS) fire location data provided by NASA's Fire Information for Resource Management System (FIRMS) (Fig. S1 in the Supplement).
A 10 d air mass back trajectory was drawn by using the Hybrid Single-Particle Lagrangian Integrated Trajectory (HYSPLIT) model to determine the source regions and transport pathways of air masses to the study site (Stein et al., 2015) (Fig. 1). Due to a regional meteorology of the study site, which is dominated by the East Asian monsoonal effect, most air masses are transported from the arid and semiarid regions in the Asian continent for most of the year (Yan and Kim, 2012, 2017).
2.2 Aerosol extraction and chemical analyses
For the analyses of water-soluble organic aerosols, a small portion of filter paper was cut into small pieces and placed in a pre-HCl-rinsed bottle. The organic components in the sample were extracted using Milli-Q water (18.2 MΩ cm) shaken at 125 rpm for 4 h (Wozniak et al., 2012). Then, the extracts were filtered through a syringe filter (0.45 µm pore size Nucleopore, Whatman) and analyzed to evaluate the WSOC and total dissolved nitrogen (TDN) by a high-temperature oxidation method using a total organic carbon (TOC) analyzer (TOC-VCPH, Shimadzu). The major ion species (NOx, , , Ca2+, Cl−, Na+, and K+) were analyzed by using a high-performance liquid chromatography (HPLC) (Waters 2695) system equipped with a conductivity detector (Waters 432) (Yan and Kim, 2015). The subsamples for trace element analyses were acidified to 2 % ultra-pure HNO3 and analyzed by using a high-resolution inductively coupled plasma mass spectrometer (HR-ICP-MS) (Thermo Element 2). In order to correct the instrumental instability, Rh was included as internal standard. The molecular marker compound, levoglucosan, was measured by using a gas-chromatography–mass-spectrometry (GC-MS) (7890N, Agilent) system coupled with a fused silica capillary column (HP-5MS, 25 m length, 0.25 mm i.d. and film thickness of 0.10 µm). Monthly representative filter samples were used for the analysis (N=25). The water-soluble organic nitrogen (WSON) concentration was calculated by using the concentration difference between the TDN and sum of inorganic nitrogen species (, , and ).
The non-crustal potassium (K) and vanadium (V) fractions were estimated by using the following equation (Yan and Kim, 2012):
For these calculations, the element compositions of the upper continental crust for K, Al, and V are assumed to be 2.80, 8.04, and 0.006 wt. %, respectively (Taylor and McLennan, 1995). The sea-spray fraction was estimated by using Cl− and Na+ concentrations assuming that all Cl− and Na+ originate from seawater: sea spray = Cl− +1.4486 Na+ (Maenhaut et al., 2007).
The value of δ13CWSOC was measured by using an isotope ratio mass spectrometer (IRMS) (Isoprime, Elementar) combined with a TOC analyzer (Vario TOC cube, Elementar) (Panetta et al., 2008; Troyer et al., 2010; Kim et al., 2015; Yan and Kim, 2017). The isotopic composition δ13CWSOC was determined using the following equation:
where Vienna Pee Dee Belemnite (VPDB) was used as the isotope standard (Kelly et al., 2005; Troyer et al., 2010; Fu et al., 2015). Analytical tests were made with IAEA-CH6 sucrose (δ13 ‰) and Suwannee River Fulvic Acid (SRFA) (δ13 ‰; International Humic Substances Society) to evaluate the recovery and the accuracy of the measurements (Panetta et al., 2008; Troyer et al., 2010).
The HULIS fraction was separated by solid-phase extraction (SPE) by using DEAE column (GE Healthcare®, HiTrap™ DEAE FF, 0.7 cm ID ×2.5 cm) to validate the humic fraction obtained by using the EEM-PARAFAC results (Baduel et al., 2009). The sample solutions were passed through the column at a constant flow rate of 1.0 mL min−1. The neutral components and hydrophobic bases, mono- and di-carboxylic acids, and inorganic anions were removed with Milli-Q water and 0.04 M NaOH. The polycharged compounds, HULISs, were eluted with 1 M NaCl. The final fractions were analyzed for the HULIS quantification using a TOC analyzer.
2.3 Fluorescence and absorbance measurements
Fluorescence EEM and absorbance spectra of the aerosol samples were measured by using a spectrophotometer (Aqualog, Horiba). The emission and excitation wavelength ranges were 240 to 700 and 250 to 500 nm, respectively, with scanning intervals of 1 nm. The PARAFAC model was performed using the Solo software in order to determine the different fluorescent components in aerosol samples. The results were validated by split-half analysis and random initialization (Bro, 1997; Zepp et al., 2004; Stedmon and Bro, 2008). The Raman and Rayleigh scattering signals, inner-filter effect, and blank subtraction were corrected using the Solo software. The fluorescence intensity was normalized by Raman peak area of water and stated as Raman unit (RU) (Lawaetz and Stedmon, 2009). This is a simple calibration method for quantitative fluorescence spectroscopy using the integrated area of water Raman peak at an excitation wavelength of 350 nm (Lawaetz and Stedmon, 2009).
The absorption coefficient was calculated using the following equation:
where a is the absorption coefficient (m−1); A is the absorbance; l is the optical path length of the quartz cuvette (m). The spectral slope (S) was calculated using following equation:
where a is the Napierian absorption coefficient (m−1); λ is the wavelength; λref is the reference wavelength (Twardowski et al., 2004; Helms et al., 2008). In this study, two distinct spectral ranges were selected in the shorter wavelength (275–295 nm) and the longer wavelength (350–400 nm).
2.4 Photochemical degradation experiments for light-absorbing organic aerosols
Laboratory experiments were conducted for two different durations (12 h and 42 d) using a small portion of the aerosol filter samples inside of the incubator equipped with an internal UV lamp (UV-B; 280–315 nm; 15 W). The filter samples for the experiment were duplicated or triplicated to rule out any experimental bias. The incubator was maintained under positive air pressure with a constant temperature at 20 ∘C. Aerosol samples were directly exposed to the UV radiation as its original particulate form, and each of the non-irradiated aerosol samples was evaluated for the initial conditions. For a long-term test, two representative aerosol filter samples were randomly selected from each of the higher and lower fluorescent groups, which had a similar range of WSOC concentration (winter =19 µM; summer =16 µM). After the UV irradiation, filter samples were completely covered to prevent exposure to any light. The extraction of organic components was performed using the same procedure as described above. Each sample was analyzed for optical and chemical properties after the irradiation.
3.1 BrC compositions
The PARAFAC model identified two humic-like fluorescent components and one protein-like fluorescent component (Fig. S2). The spectral characteristics of component 1 (C1; Ex ∕ Em = 305/416 nm) and component 3 (C3; Ex ∕ Em nm) are known to be highly associated with the atmospheric HULIS (Chen et al., 2016; Yan and Kim, 2017). Component 2 (C2; Ex ∕ Em nm) is associated with a protein-like (tryptophan-like) component, which originates mostly from biological production (Coble, 2007; Birdwell and Engel, 2010; Yan and Kim, 2017) (Supplement Table S1). However, C2 seems to be largely influenced by the dominant fluorophore HULIS, as shown by the EEM spectra (Fig. S7). A good correlation between C1 and C2 (r2=0.9; p < 0.05) was obtained, although, in general, these two components have different sources and sinks in the atmosphere (Yan and Kim, 2017) (Fig. S3). Thus, we assumed that the HULIS (C1 and C3) was the dominant component of BrC in these samples, and C1 was used as a representative component of BrC in this study, as C1 and C3 exhibited a good correlation (r2=0.8; p < 0.05) (Fig. S3).
The HULIS component obtained by the EEM-PARAFAC model agreed very well with the extracted HULIS concentration obtained by using the DEAE column (r2=0.81; p < 0.05), indicating that the C1 component represents the actual HULIS (Fig. S4). In addition, we compared the extraction efficiencies of HULIS (water-soluble BrC) with that of the MeOH-soluble BrC (Fig. S4). Although the efficiency of the water-soluble BrC was approximately 20 % lower than that of the MeOH-soluble BrC, they exhibited a good correlation (r2=0.9; p < 0.05) (Fig. S4b). Therefore, we conclude that the HULIS is a good representative component of BrC in this study.
3.2 Seasonal variations in BrC and WSOC
The WSOC concentrations exhibited seasonal variations in the range of 3 to 40 µg m−3 (average µg m−3) with higher values during the cold seasons (October–January) (average µg m−3) and lower values during the warm seasons (June–September) (average µg m−3) (Fig. 2a). Similarly, the HULIS concentrations exhibited seasonal variations in the range of 13 to 294 RU (average RU) with higher values during the cold seasons (average RU) and lower values during the warm seasons (average RU) (Fig. 2b). After the HULIS content was normalized to the WSOC contents, the seasonal trend of the ratio of the HULIS content to the WSOC content was similar to that of the HULIS concentration indicating that there was a pronounced decrease in the average fraction of HULIS relative to WSOC from the cold to the warm seasons (Fig. 2c).
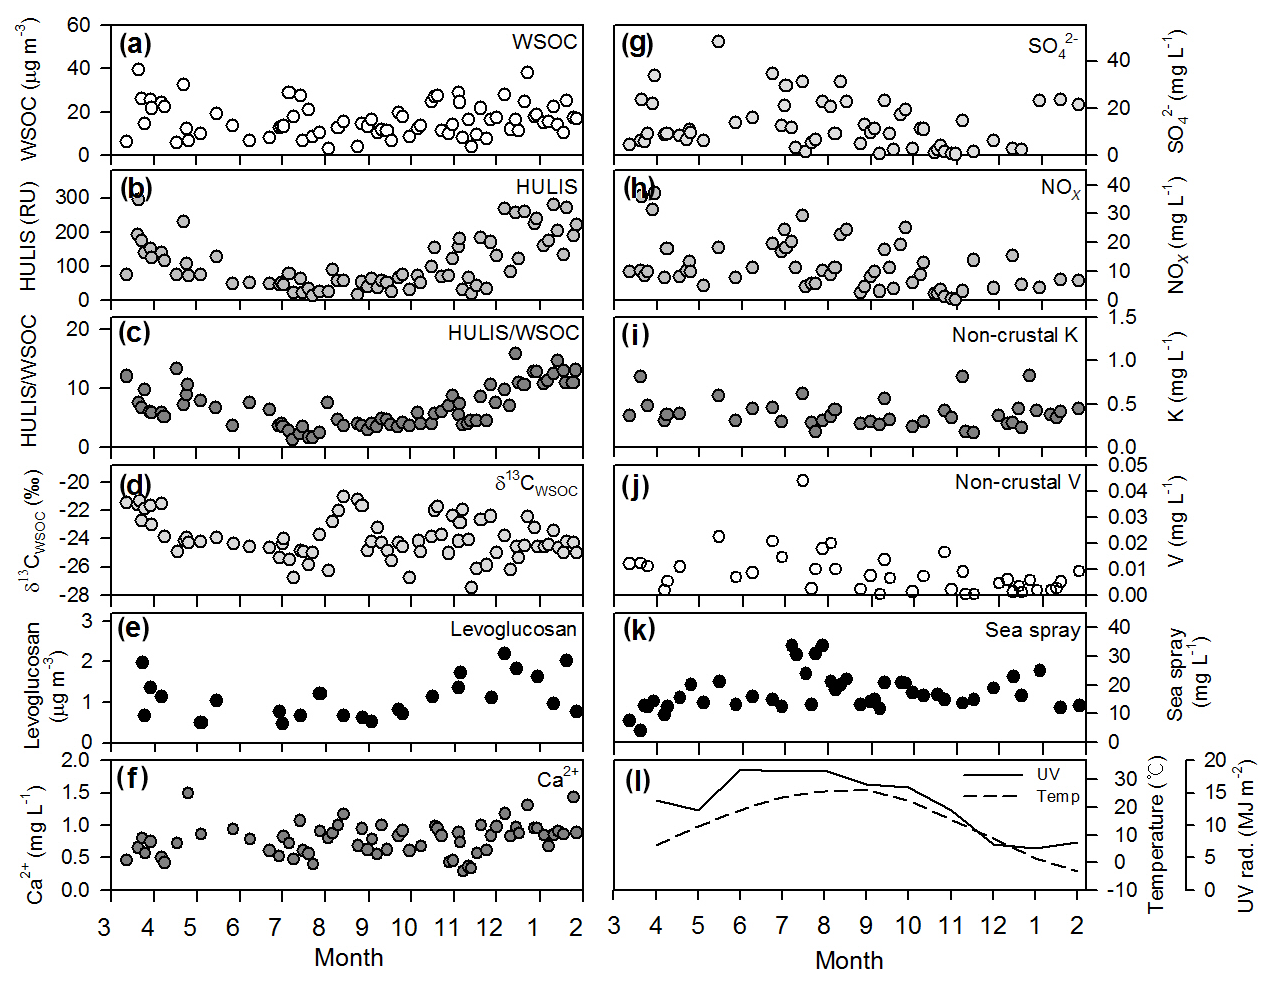
Figure 2Temporal variations in (a) WSOC concentration, (b) fluorescence intensity of HULIS, (c) ratio of HULIS to WSOC, (d) δ13CWSOC values, (e) levoglucosan, (f) Ca2+, (g) , (h) NOx, (i) non-crustal K, (j) non-crustal V, (K) sea-spray concentrations, (l) UV radiation rate, and temperature from March 2015 to January 2016 in Seoul, South Korea.
The δ13CWSOC values ranged from −21.0 ‰ to −27.5 ‰ (average ‰), with no such seasonal variation trend (Fig. 2d). The levoglucosan concentration was in the range of 0.5 to 2.2 µg m−3 (average µg m−3) with relatively higher values during the cold seasons and the lower values during August–September (Fig. 2e). The temporal variations in major ion species concentrations did not show such seasonal behaviors throughout the year (Fig. 2f–k). The temporal variation in Ca2+ concentration (average mg L−1) exhibited a relatively constant level throughout the year (Fig. 2f). The concentrations (average mg L−1) exhibited the highest value during the period of spring to summer and were slightly decreased during the cold seasons (Fig. 2g). The concentration of NOx (average mg L−1) was high during the warm periods (June–October) (Fig. 2h). The concentration of non-crustal K (average mg L−1) also showed a relatively constant level throughout the year (Fig. 2i). The non-crustal V concentrations (average mg L−1) showed no such seasonal variations (Fig. 2j). The sea-spray concentrations ranged from 4.0 to 33.6 mg L−1 (average mg L−1), showing the highest concentration in July (Fig. 2k). Both temperature and UV radiation rate showed the typical patterns of middle latitudes (Fig. 2l).
In order to characterize the sources of HULIS and WSOC in Seoul, which may cause the seasonal variabilities, we analyzed various tracers including δ13CWSOC, major ions, and molecular marker as source indicators (Gabriel et al., 2002; Kelly et al., 2005; Kirillova et al., 2014b; Fu et al., 2015; Yan and Kim, 2015). The average δ13CWSOC ( ‰) suggests that the burning activity of terrestrial C3 plant-origin materials (e.g., grassland, crop residue, fuel wood) could be a major source of WSOC in this region (Kelly et al., 2005; Das et al., 2010; Kawashima and Haneishi, 2012; Fu et al., 2015). The average δ13CWSOC was in good agreement with that of HULIS ( ‰) extracted from precipitation in Seoul, South Korea (Yan and Kim, 2017).
The good correlation (r2=0.6; p > 0.05) between the WSOC and WSON concentrations suggests that these two variables are highly associated with a common organic source (Yan and Kim, 2015) (Fig. 3a). The WSOC and HULIS concentrations also exhibited a good correlation (r2=0.5; p < 0.05) (Fig. 3b). A good linear correlation (r2=0.5; p < 0.05) was also observed between the HULIS and levoglucosan concentrations (Fig. 3c). This relationship indicates that biomass burning is a significant source of HULIS in Seoul, as levoglucosan is commonly used for the tracing of biomass burning (Fu et al., 2015; Kuang et al., 2015). This is consistent with the previous study, which has demonstrated that the BrC in the precipitation was primarily derived from biomass burning and terrestrial biogenic emissions (> 70 %), with minor contributions from fossil-fuel combustion, based on the 14C values in the HULIS (Yan and Kim, 2017). However, we observed significant decreases (35±2 %) in levoglucosan concentrations by the UV irradiation for 12 to 24 h in the laboratory experiments (Fig. S5). This is consistent with the previous studies showing that levoglucosan could be oxidized by the hydroxyl radical in the atmosphere (Hennigan et al., 2010; Hoffmann et al., 2010). Thus, we suggest that the major source of HULIS in our samples was from biomass burning, but low concentrations in WSOC and HULIS in summer could not be evaluated by using the levoglucosan.
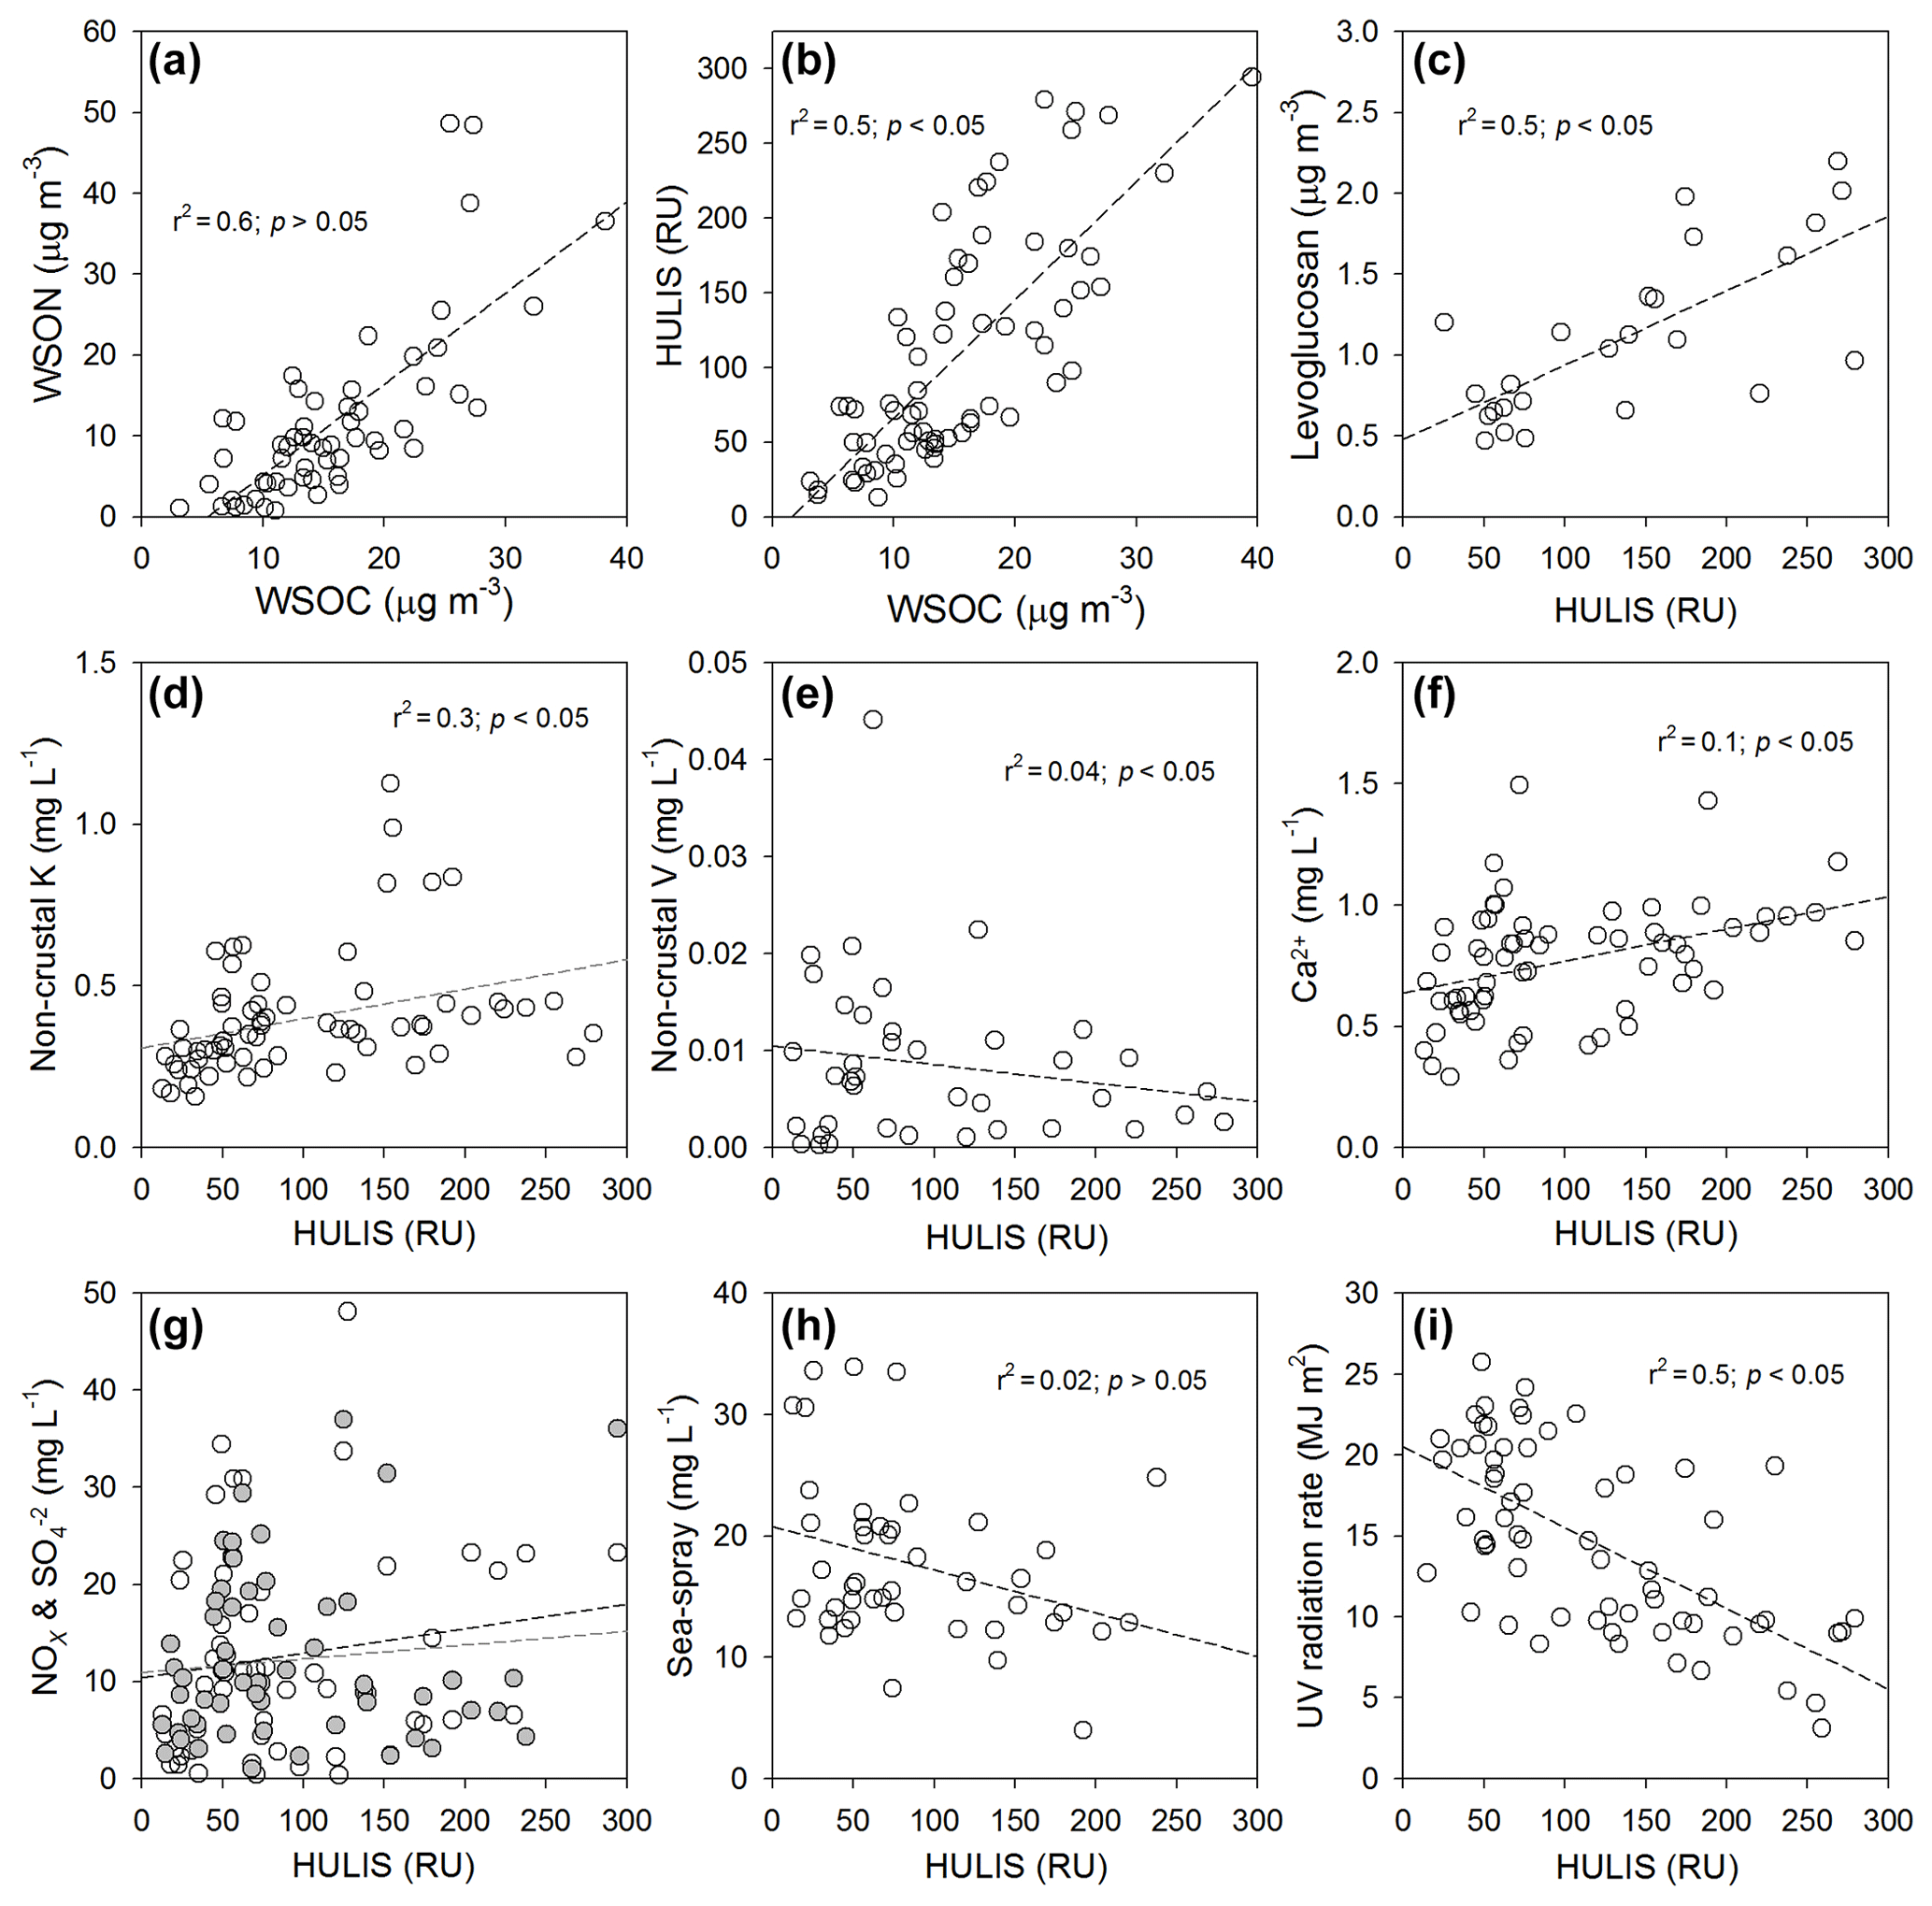
Figure 3Plots of the concentrations of (a) WSOC versus WSON, (b) WSOC versus HULIS, (c) HULIS versus levoglucosan, (d) HULIS versus non-crustal K, (e) HULIS versus non-crustal V, (f) HULIS versus Ca2+, (g) HULIS versus NOx (closed circle; r2=0.1, p > 0.05) and (open circle; r2=0.02, p < 0.05), (h) HULIS versus sea spray, and (i) HULIS versus UV radiation rate. The dashed lines represent the regression lines.
In order to indirectly evaluate the biomass burning during the study period, we compiled the fire maps in combination with air mass back trajectories (Fig. S1). An evidence for the biomass burning effect is provided by the fire maps, where higher occurrences of fire spots correspond to agricultural burning practices in the East Asia continental areas (Fig. S1). The burning practices mainly occurred in the spring and summer in the East Asia continental areas. No significant influence of open burning activity was observed in the winter (Fig. S1). These results suggest that the distinctive biomass burning was not linked to the seasonal variations in WSOC and HULIS concentrations in this study region. On the other hand, non-crustal K, which is an indicator of biomass or fossil fuel burning (Gabriel et al., 2002; Baduel et al., 2010), did not exhibit a seasonal trend (Fig. 2i). The correlation between the HULIS and non-crustal K was also insignificant (r2=0.3; p < 0.05) (Fig. 3d). The K∕V ratio is often used to trace V-purified fossil fuels, since V is mostly removed during the refining processes (Yan et al., 2012). The use of raw materials such as crude oil and coal could be the source of non-crustal V (Tsukuda et al., 2005; Yan and Kim, 2012). However, the correlation between HULIS and non-crustal V was also insignificant (r2=0.04; p < 0.05) (Fig. 3e), with K∕V ratios in the range of 17–673 (average ) in our samples. This result suggests that the V-purified fossil fuel contents in our samples were insignificant (Yan et al., 2012). No significant correlations were observed between the HULIS and Ca2+ (r2=0.1; p < 0.05), NOx (r2=0.1; p > 0.05), (r2=0.02; p < 0.05), and sea-spray fraction (r2=0.02; p > 0.05) (Fig. 3f–h). This also indicates that the seasonal changes in HULIS concentrations were insignificantly influenced by crustal minerals, sea salts, and fossil fuels. All these tracers suggest that the summer decreases in WSOC and HULIS concentrations were not associated with the changes in source inputs.
A significant negative correlation (r2=0.5; p < 0.05) was observed between HULIS and the UV radiation (Fig. 3i). The HULIS was greatly reduced during the warm seasons (June–September) when the solar UV radiation and the temperature reached the annual maxima (Fig. 2b, l). It has been widely accepted that photochemical degradation is an important process for the efficient removal or alteration of photo-resistivity and compositions of chromophoric dissolved organic matter (CDOM) in rainwaters and aerosols (Kieber et al., 2006; Mladenov et al., 2009; Forrister et al., 2015; Dasari et al., 2019; Healy et al., 2019). Significant seasonal changes in ratios of the HULIS concentration to the WSOC concentration, although the WSOC and HULIS concentrations exhibited similar seasonal changes, also suggest that HULIS is more effectively removed by the UV radiation in summer (Fig. 2c). These results are in agreement with the following laboratory experimental results.
In order to quantify the UV-degradable HULIS, we performed the UV radiation experiments for the short term (12 h; 48 samples) and the long term (42 d; 2 samples). After the 12 h of UV irradiation, the HULIS concentrations in the winter samples (characterized by higher average HULIS concentrations; N=35) were greatly reduced by 13 % (Fig. 4a). Similar decreases were observed for the WSOC concentrations for the winter samples (Fig. 4b). However, negligible changes (< 2 %) were observed in the summer samples (characterized by low average HULIS concentrations, N=13) (Fig. 4a). After the 42 d of UV irradiation, the HULIS and WSOC concentrations in the winter sample decreased by approximately 52 % and 25 %, respectively (Figs. S6 and S7). However, there was no significant change in HULIS and WSOC concentrations in the summer sample (Figs. S6 and S7). This result suggests that the summer sample might consist largely of a photo-refractory WSOC pool owing to the high UV radiation, while the winter sample consisted largely of a photolabile WSOC.
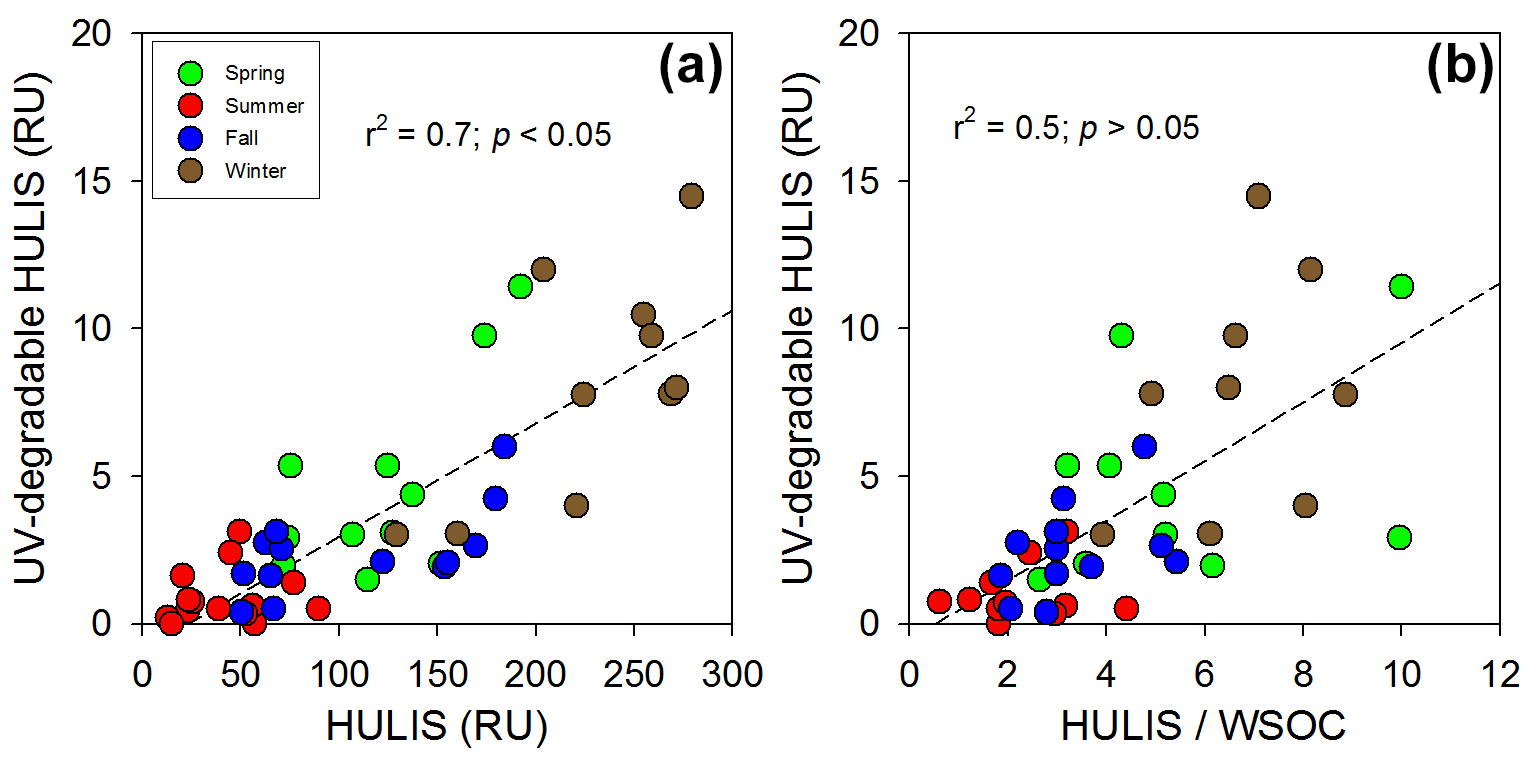
Figure 4Plots of the (a) HULIS versus UV-degradable HULIS and the (b) ratio of HULIS to WSOC versus UV-degradable HULIS in the different seasons: spring (green), summer (red), fall (blue), and winter (brown). The dashed lines represent the regression lines.
The change in light-absorbing property of HULIS for the UV radiation experiment also exhibited a similar change with that of fluorescence property (Fig. 5). The absorption coefficient of the summer sample was not changed after the irradiation, while that of the winter sample exhibited an approximately 2-fold change (Fig. 5). The degradation of HULIS was considerably more effective at shorter wavelengths (S275–295), while no significant change was observed at longer wavelengths (S350–400), as expected from the fact that the absorption losses are higher in shorter wavelengths than the longer wavelengths (Del Vecchio and Blough, 2002). In order to look at the changes in light absorption property, the spectral slope ratios (SR) of shorter wavelength (S275–295) relative to longer wavelength (S350–400) were compared. In general, the SR value increases with increasing irradiation (Del Vecchio and Blough, 2002; Helms et al., 2008). The SR values of non-irradiated samples were 1.1 in the winter and 1.4 in the summer, and the irradiated samples were 1.4 in both winter and summer (Fig. 5). The SR values of non-irradiated and irradiated samples in summer showed no measurable change during the UV experiment (Fig. 5). In addition, if the input of fresh HULIS is constant throughout the seasons, SR should be constant. However, SR values of non-irradiated samples were 1.1 in the winter and 1.4 in the summer (Fig. 5). The SR value of the non-irradiated summer sample was similar to that of the irradiated winter sample (1.4) (Fig. 5). Thus, this suggests that the lower summer HULIS concentration was associated with the UV degradation rather than with the reduced source inputs.
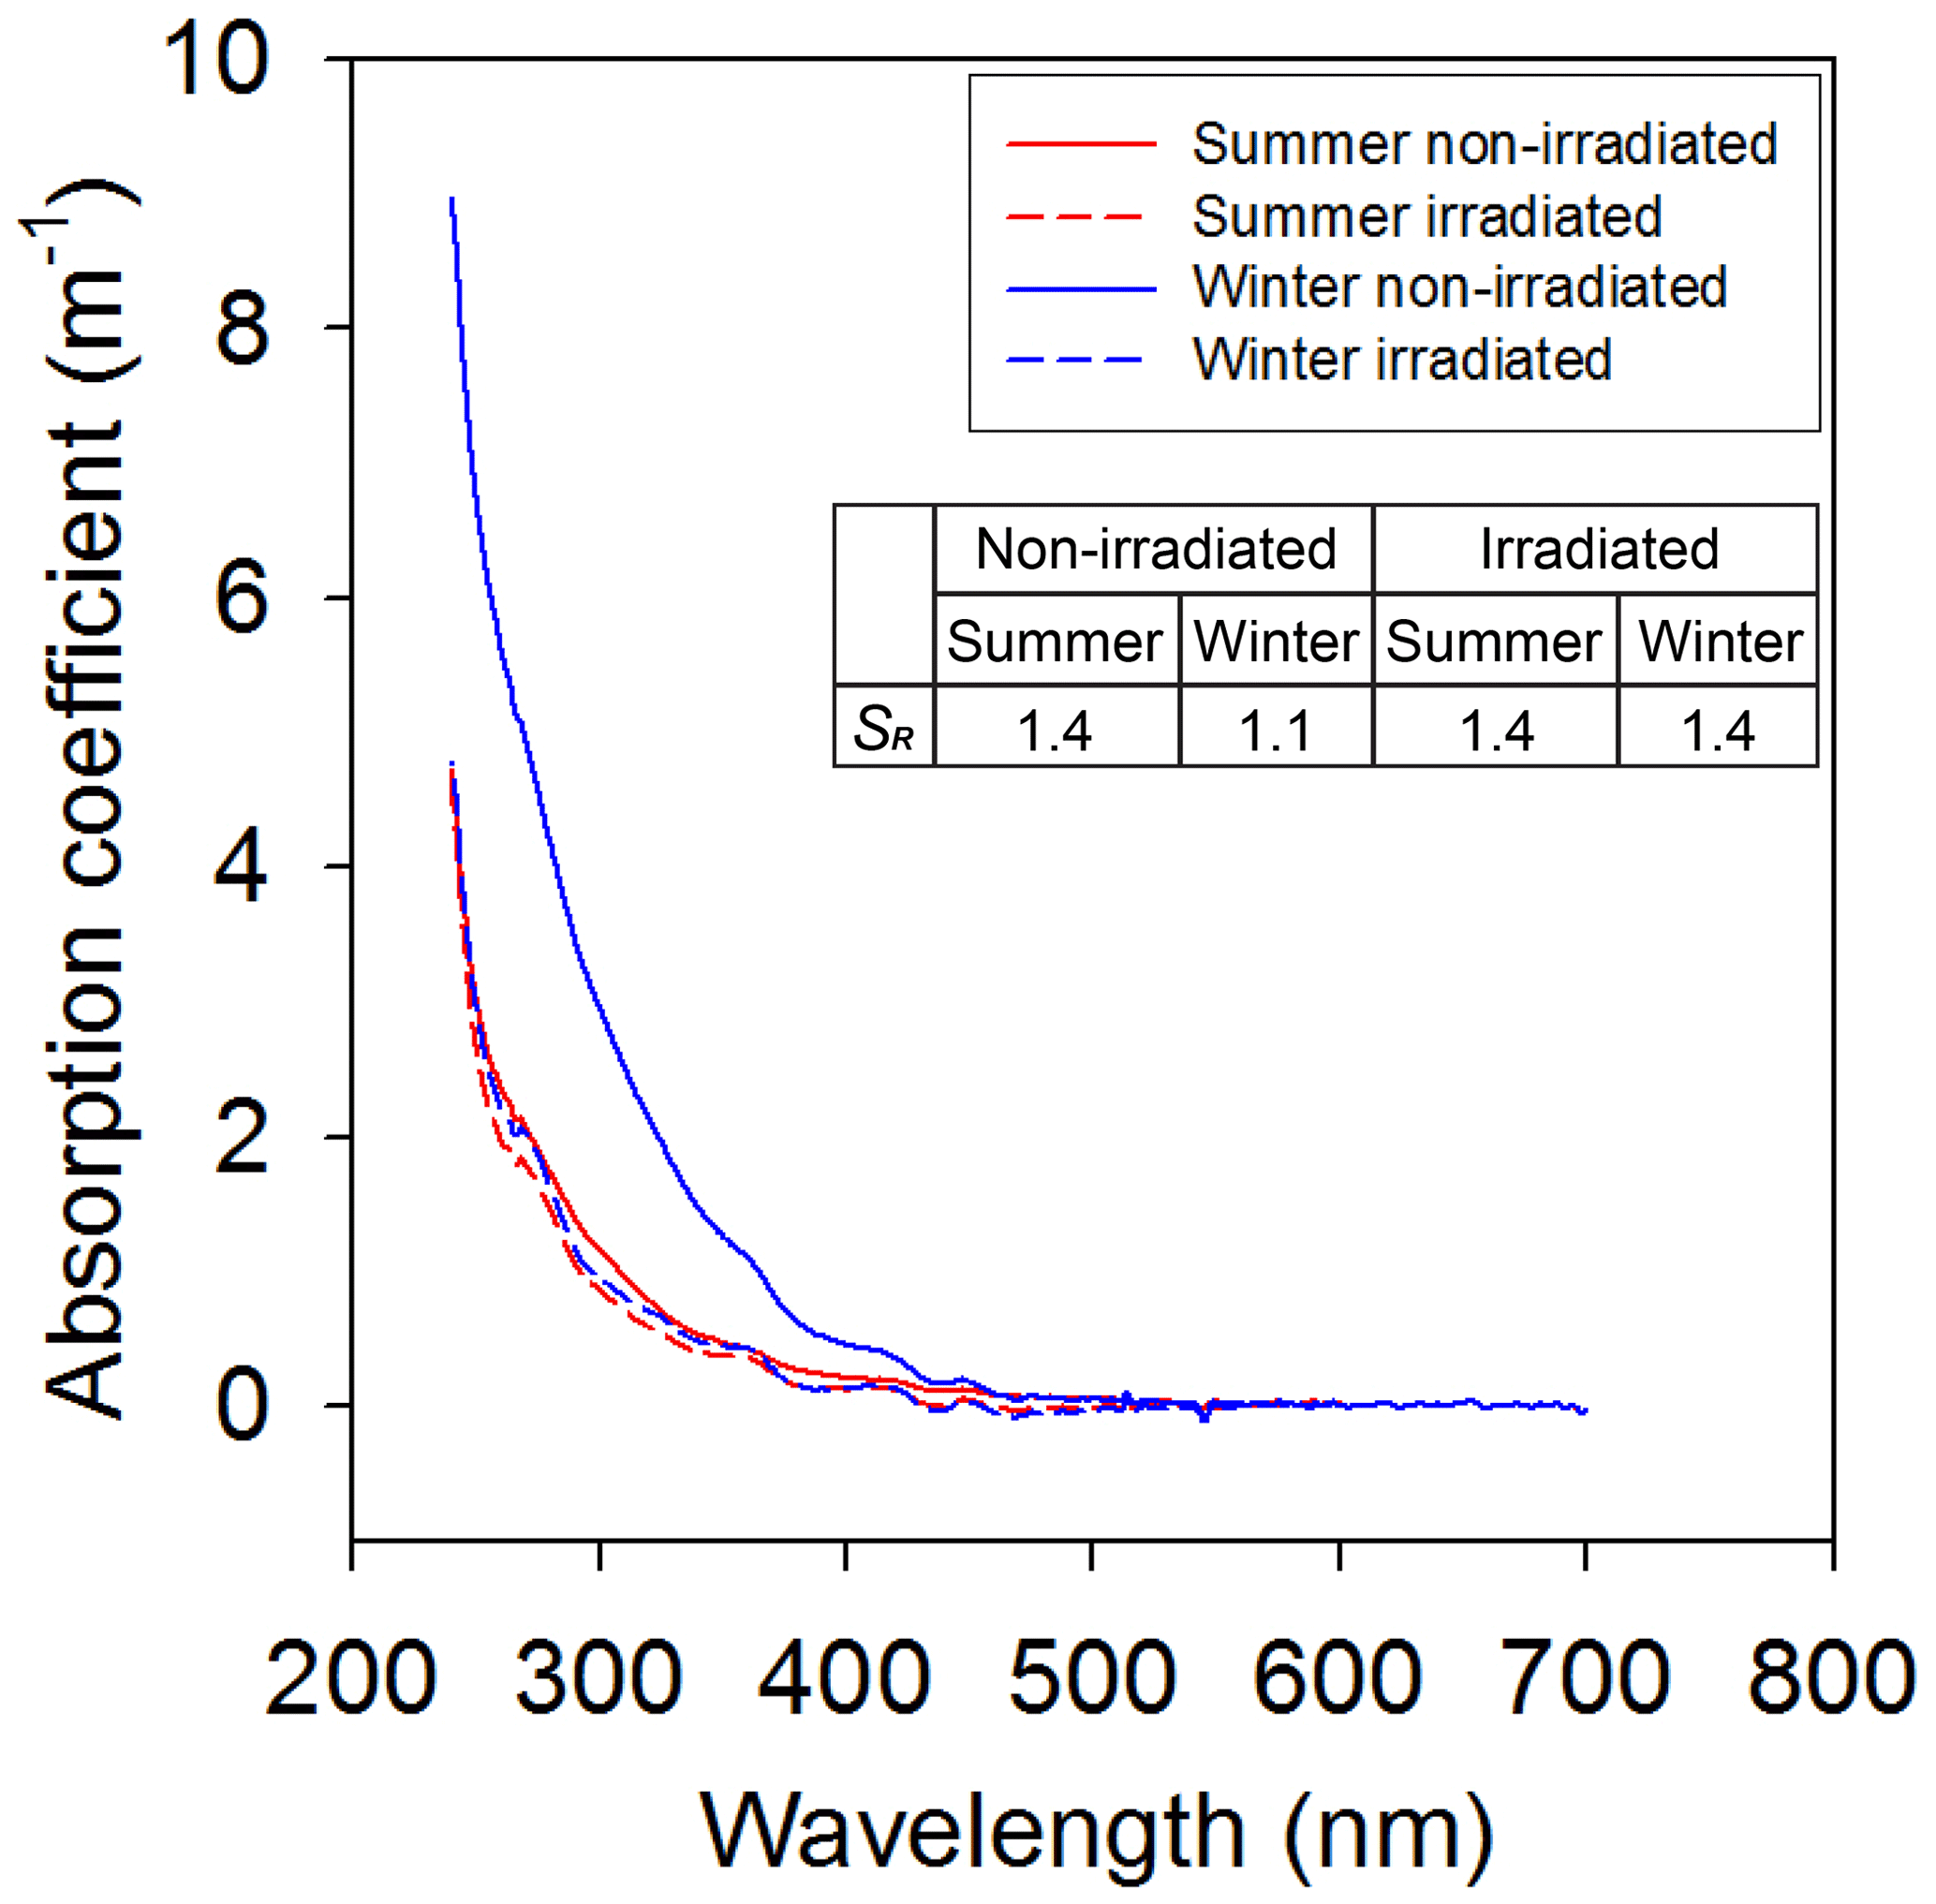
Figure 5The absorption coefficients of the aerosol samples collected in the winter (30 December) (blue) and summer (14 August) (red) in 2015. The solid lines represent the initial values for the non-irradiated samples, and the dashed lines represent the final values for the irradiated samples.
The seasonal variations in optical and chemical properties of the HULIS and WSOC were monitored in different seasons in the urban region. The air mass back trajectories combined with the fire maps and various chemical analyses demonstrated that biomass burning is a significant source contributing to HULIS in all seasons in Seoul, South Korea. Our results suggest that photo-induced degradation plays a significant role in BrC quantity and quality in the atmosphere. In addition, the important role of photochemical degradation as a removal mechanism was supported by the laboratory experiments. This may provide important pieces of evidence regarding the hidden life cycle of light-absorbing organic aerosols in the atmosphere.
The light-absorbing organic aerosols are considerably associated with climate sensitivity owing to their significant roles in the radiative forcing and global climate balance. Thus, this photochemical process needs to be considered in the modeling of climate forcing and biogeochemical cycles of the Earth's surface. Furthermore, the deposition fluxes of organic aerosols with different optical and chemical characteristics can have significant impacts as potential sources of organic carbon on surface waters and soils, which can lead to major effects on the global carbon cycle.
All data are available upon request to the corresponding author.
The supplement related to this article is available online at: https://doi.org/10.5194/acp-20-2709-2020-supplement.
HH and GK were involved in planning the research and designing the experiment. HH collected the data and performed the analyses and experiment. HH and GK were involved in analyzing the results and writing the paper. HS was involved in sample analysis of trace element. KHS and DHL contributed to the sample analysis of molecular compounds. All authors contributed to the final version of the paper.
The authors declare that they have no conflict of interest.
We are grateful to Jeonghyun Kim for his support and assistance. We acknowledge the use of data and imagery from LANCE FIRMS operated by NASA's Earth Science Data and Information System (ESDIS) with funding provided by NASA Headquarters. We also gratefully acknowledge the NOAA Air Resources Laboratory for use of the HYSPLIT model.
This research has been supported by the National Research Foundation of Korea (grant no. NRF-2018 R1A2B3001147).
This paper was edited by Alex Lee and reviewed by two anonymous referees.
Andreae, M. O. and Gelencsér, A.: Black carbon or brown carbon? The nature of light-absorbing carbonaceous aerosols, Atmos. Chem. Phys., 6, 3131–3148, https://doi.org/10.5194/acp-6-3131-2006, 2006.
Baduel, C., Voisin, D., and Jaffrezo, J. L.: Comparison of analytical methods for Humic Like Substances (HULIS) measurements in atmospheric particles, Atmos. Chem. Phys., 9, 5949–5962, https://doi.org/10.5194/acp-9-5949-2009, 2009.
Baduel, C., Voisin, D., and Jaffrezo, J.-L.: Seasonal variations of concentrations and optical properties of water soluble HULIS collected in urban environments, Atmos. Chem. Phys., 10, 4085–4095, https://doi.org/10.5194/acp-10-4085-2010, 2010.
Birdwell, J. E. and Engel, A. S.: Characterization of dissolved organic matter in cave and spring waters using UV-Vis absorbance and fluorescence spectroscopy, Org. Geochem., 41, 270–280, https://doi.org/10.1016/j.orggeochem.2009.11.002, 2010.
Bro, R.: PARAFAC. Tutorial and applications, Chemometr. Intell. Lab., 38, 149–171, https://doi.org/10.1016/S0169-7439(97)00032-4, 1997.
Chen, Q., Ikemori, F., and Mochida, M.: Light absorption and excitation-emission fluorescence of urban organic aerosol components and their relationship to chemical structure, Environ. Sci. Technol., 50, 10859–10868, https://doi.org/10.1021/acs.est.6b02541, 2016.
Coble, P. G.: Marine optical biogeochemistry: the chemistry of ocean color, Chem. Rev., 107, 402–418, https://doi.org/10.1021/cr050350+, 2007.
Das, O., Wang, Y., and Hsieh, Y.-P.: Chemical and carbon isotopic characteristics of ash and smoke derived from burning of C3 and C4 grasses, Org. Geochem., 41, 263–269, https://doi.org/10.1016/j.orggeochem.2009.11.001, 2010.
Dasari, S., Andersson, A., Bikkina, S., Holmstrand, H., Budhavant, K., Satheesh, S., Asmi, E., Kesti, J., Backman, J., Salam, A., Bisht, D. S., Tiwari, S., Hameed, Z., and Gustafsson, Ö.: Photochemical degradation affects the light absorption of water-soluble brown carbon in the South Asian outflow, Sci. Adv., 5, eaau8066, https://doi.org/10.1126/sciadv.aau8066, 2019.
Del Vecchio, R. and Blough, N. V.: Photobleaching of chromophoric dissolved organic matter in natural waters: Kinetics and modelling, Mar. Chem., 78, 231–253, https://doi.org/10.1016/S0304-4203(02)00036-1, 2002.
Després, V. R., Huffman, J. A., Burrows, S. M., Hoose, C., Safatov, A. S., Buryak, G., Fröhlich-Nowoisky, J., Elbert, W., Andreae, M. O., Pöschl, U., and Jaenicke, R.: Primary biological aerosol particles in the atmosphere: a review, Tellus B, 64, 15598, https://doi.org/10.3402/tellusb.v64i0.15598, 2012.
Duarte, R. M. B. O. and Duarte, A. C.: Atmospheric organic matter, eMagRes, 2, 415–426, https://doi.org/10.1002/9780470034590.emrstm1331, 2013.
Feng, Y., Ramanathan, V., and Kotamarthi, V. R.: Brown carbon: a significant atmospheric absorber of solar radiation?, Atmos. Chem. Phys., 13, 8607–8621, https://doi.org/10.5194/acp-13-8607-2013, 2013.
Forrister, H., Liu, J., Scheuer, E., Dibb, J., Ziemba, L., Thornhill, K. L., Anderson, B., Diskin, B., Perring, A. E., Schwarz, J. P., Campuzano-Jost, P., Day, D. A., Palm, B. B., Jimenez, J. L., Nenes, A., and Weber, R. J.: Evolution of brown carbon in wildfire plumes, Geophys. Res. Lett., 42, 4623–4630, https://doi.org/10.1002/2015GL063897, 2015.
Fu, P., Kawamura, K., Chen, J., Qin, M., Ren, L., Sun, Y., Wang, Z., Barrie, L. A., Tachibana, E., Ding, A., and Yamashita, Y.: Fluorescent water-soluble organic aerosols in the High Arctic atmosphere, Sci. Rep.-UK, 5, 9845, https://doi.org/10.1038/srep09845, 2015.
Gabriel, R., Mayol-Bracero, O. L., and Andreae, M. O.: Chemical characterization of submicron aerosol particles collected over the Indian Ocean, J. Geophys. Res., 107, 8005, https://doi.org/10.1029/2000JD000034, 2002.
Ghan, S. J. and Schwartz, S. E.: Aerosol properties and processes: A path from field and laboratory measurements to global climate models, Amer. Meteor. Soc., 88, 1059–1083, 2007.
Graber, E. R. and Rudich, Y.: Atmospheric HULIS: How humic-like are they? A comprehensive and critical review, Atmos. Chem. Phys., 6, 729–753, https://doi.org/10.5194/acp-6-729-2006, 2006.
Gustafsson, Ö., Kruså, M., Zencak, Z., Sheesley, R. J., Granat, L., Engström, E., Praveen, P. S., Rao, P. S. P., Leck, C., and Rodhe, H.: Brown clouds over South Asia: biomass or fossil fuel combustion?, Science, 323, 495–498, https://doi.org/10.1126/science.1164857, 2009.
Healy, R. M., Wang, J. M., Sofowote, U., Su, Y., Debosz, J., Noble, M., Munoz, A., Jeong, C.-H., Hilker, N., Evans, G. J., and Doerksen, G.: Black carbon in the Lower Fraser Valley, British Columbia: Impact of 2017 wildfires on local air quality and aerosol optical properties, Atmos. Environ., 217, 116976, https://doi.org/10.1016/j.atmosenv.2019.116976, 2019.
Helms, J. R., Stubbins, A., Ritchie, J. D., and Minor, E. C.: Absorption spectral slopes and slope ratios as indicators of molecular weight, source, and photobleaching of chromophoric dissolved organic matter, Limnol. Oceanogr., 33, 955–969, https://doi.org/10.4319/lo.2008.53.3.0955, 2008.
Hennigan, C. J., Sullivan, A. P., Collett, J. L., and Robinson, A. L.: Levoglucosan stability in biomass burning particles exposed to hydroxyl radicals, Geophys. Res. Lett., 37, L09806, https://doi.org/10.1029/2010GL043088, 2010.
Hoffer, A., Gelencsér, A., Guyon, P., Kiss, G., Schmid, O., Frank, G. P., Artaxo, P., and Andreae, M. O.: Optical properties of humic-like substances (HULIS) in biomass-burning aerosols, Atmos. Chem. Phys., 6, 3563–3570, https://doi.org/10.5194/acp-6-3563-2006, 2006.
Hoffmann, D., Tilgner, A., Iinuma, Y., and Herrmann, H.: Atmospheric stability of levoglucosan: a detailed laboratory and modeling study, Environ. Sci. Technol., 44, 694–699, https://doi.org/10.1021/es902476f, 2010.
Kanakidou, M., Seinfeld, J. H., Pandis, S. N., Barnes, I., Dentener, F. J., Facchini, M. C., Van Dingenen, R., Ervens, B., Nenes, A., Nielsen, C. J., Swietlicki, E., Putaud, J. P., Balkanski, Y., Fuzzi, S., Horth, J., Moortgat, G. K., Winterhalter, R., Myhre, C. E. L., Tsigaridis, K., Vignati, E., Stephanou, E. G., and Wilson, J.: Organic aerosol and global climate modelling: a review, Atmos. Chem. Phys., 5, 1053–1123, https://doi.org/10.5194/acp-5-1053-2005, 2005.
Kawashima, H. and Haneishi, Y.: Effects of combustion emissions from the Eurasian continent in winter on seasonal δ13C of elemental carbon in aerosols in Japan, Atmos. Environ., 46, 568–579, https://doi.org/10.1016/j.atmosenv.2011.05.015, 2012.
Kelly, S. D., Stein, C., and Jickelle, T. D.: Carbon and nitrogen isotopic analysis of atmospheric organic matter, Atmos. Environ., 39, 6007–6011, https://doi.org/10.1016/j.atmosenv.2005.05.030, 2005.
Kieber, R. J., Whitehead, R. F., Reid, S. N., Willey, J. D., and Seaton, P. J.: Chromophoric dissolved organic matter (CDOM) in rainwater, Southeastern North Carolina, USA, J. Atmos. Chem., 54, 21–41, 2006.
Kim, T.-H., Kim, G., Lee, S.-A., and Dittmar, T.: Extraordinary slow degradation of dissolved organic carbon (DOC) in a cold marginal sea, Sci. Rep.-UK, 5, 13808, https://doi.org/10.1038/srep13808, 2015.
Kirillova, E. N., Andersson, A., Han, J., Lee, M., and Gustafsson, Ö.: Sources and light absorption of water-soluble organic carbon aerosols in the outflow from northern China, Atmos. Chem. Phys., 14, 1413–1422, https://doi.org/10.5194/acp-14-1413-2014, 2014a.
Kirillova, E. N., Andersson, A., Tiwari, S., Sribastava, A. K., Bisht, D. S., and Gustafsson, Ö.: Water-soluble organic carbon aerosols during a fall New Delhi winter: Isotope-based source apportionment and optical properties, J. Geophys. Res.-Atmos., 119, 3476–3485, https://doi.org/10.1002/2013JD020041, 2014b.
Kuang, B. Y., Lin, P., Huang, X. H. H., and Yu, J. Z.: Sources of humic-like substances in the Pearl River Delta, China: positive matrix factorization analysis of PM2.5 major components and source markers, Atmos. Chem. Phys., 15, 1995–2008, https://doi.org/10.5194/acp-15-1995-2015, 2015.
Laskin, A., Laskin, J., and Nizkorodov, S. A.: Chemistry of Atmospheric Brown Carbon, Chem. Rev., 115, 4335–4382, https://doi.org/10.1021/cr5006167, 2015.
Lawaetz, A. J. and Stedmon, C. A.: Fluorescence intensity calibration using the raman scatter peak of water, Appl. Spectrosc., 63, 936–940, https://doi.org/10.1366/000370209788964548, 2009.
Li, X., Han, J., Hopke, P. K., Hu, J., Shu, Q., Chang, Q., and Ying, Q.: Quantifying primary and secondary humic-like substances in urban aerosol based on emission source characterization and a source-oriented air quality model, Atmos. Chem. Phys., 19, 2327–2341, https://doi.org/10.5194/acp-19-2327-2019, 2019.
Lin, C.-Y., Sheng, Y.-F., Chen, W.-N., Wang, Z., Kuo, C.-H., Chen, W.-C., and Yang, T.: The impact of channel effect on Asian dust transport dynamics: a case in southeastern Asia, Atmos. Chem. Phys., 12, 271–285, https://doi.org/10.5194/acp-12-271-2012, 2012.
Lin, P., Huang, X.-F., He, L.-Y., and Yu, J. Z.: Abundance and size distribution of HULIS in ambient aerosols at a rural site in South China, J. Aerosol Sci., 41, 74–87, https://doi.org/10.1016/j.jaerosci.2009.09.001, 2010.
Lukács, H., Gelencsér, A., Hammer, S., Puxbaum, H., Pio, C., Legrand, M., Kasper-Giebl, A., Handler, M., Limbeck, A., Simpson, D., and Preunkert, S.: Seasonal trends and possible sources of brown carbon based on 2-year aerosol measurements at six sites in Europe, J. Geophys. Res., 122, D23S18, https://doi.org/10.1029/2006JD008151, 2007.
Maenhaut, W., Raes, N., Chi, X., Cafmeyer, J., and Wang, W.: Chemical composition and mass closure for PM2.5 and PM10 aerosols at K-puszta, Hungary, in summer 2006, X-RAY Spectrom., 37, 193–197, https://doi.org/10.1002/xrs.1062, 2007.
Matos, J. T. V., Freire, S. M. S. C., Duarte, R. M. B. O., and Duarte, A. C.: Natural organic matter in urban aerosols: comparison between water and alkaline soluble components using excitation-emission matrix fluorescence spectroscopy and multiway data analysis, Atmos. Environ., 102, 1–10, https://doi.org/10.1016/j.atmosenv.2014.11.042, 2015.
Mladenov, N., Lopez-Ramos, J., McKnight, D. M., and Reche, I.: Alpine lake optical properties as sentinels of dust deposition and global change, Limnol. Oceanogr., 54, 2386–2400, https://doi.org/10.4319/lo.2009.54.6_part_2.2386, 2009.
Mladenov, N., Sommaruga, R., Morales-Baquero, R., Laurion, I., Camarero, L., Diéguez, M. C., Camacho, A., Delgado, A., Torres, O., Chen, Z., Felip, M., and Reche, I.: Dust inputs and bacteria influence dissolved organic matter in clear alpine lakes, Nat. Commun., 2, 405, https://doi.org/10.1038/ncomms1411, 2011.
Panetta, R. J., Ibrahim, M., and Gélinas, Y.: Coupling a high-temperature catalytic oxidation total organic carbon analyzer to an isotope ratio mass spectrometer to measure natural-abundance δ13C-dissolved organic carbon in marine and freshwater samples, Anal. Chem., 80, 5232–5239, https://doi.org/10.1021/ac702641z, 2008.
Park, S. S. and Son, S.-C.: Relationship between carbonaceous components and aerosol light absorption during winter at an urban site of Gwangju, Korea, Atmos. Res., 185, 73–83, https://doi.org/10.1016/j.atmosres.2016.11.005, 2017.
Park, S. S., Kim, Y. J., Cho, S. Y., and Kim, S. J.: Characterization of PM2.5 aerosols dominated by local pollution and Asian dust observed at an urban site in Korea during aerosol characterization experiments (ACE)-Asia project, J. Air Waste Manage., 57, 434–443, https://doi.org/10.3155/1047-3289.57.4.434, 2007.
Pöhlker, C., Huffman, J. A., and Pöschl, U.: Autofluorescence of atmospheric bioaerosols – fluorescent biomolecules and potential interferences, Atmos. Meas. Tech., 5, 37–71, https://doi.org/10.5194/amt-5-37-2012, 2012.
Ramanathan, V., Ramana, M. V., Roberts, G., Kim, D., Corrigan, C., Chung, C., and Winker, D.: Warming trends in Asia amplified by brown cloud solar absorption, Nature, 448, 575–578, https://doi.org/10.1038/nature06019, 2007.
Saleh, R., Robinson, E. S., Tkacik, D. S., Ahern, A. T., Liu, S., Aiker, A. C., Sullivan, R. C., Presto, A. A., Dubey, M. K., Yokelson, R. J., Donahue, N. M., and Robinson, A. L.: Brownness of organics in aerosols from biomass burning linked to their black carbon content, Nat. Geosci., 7, 36940, https://doi.org/10.1038/ngeo2220, 2014.
Seinfeld, J. H., Carmichael, G. R., Arimoto, R., Conant, W. C., Brechtel, F. J., Bates, T. S., Cahill, T. A., Clarke, A. D., Doherty, S. J., Flatau, P. J., Huebert, B. J., Kim, J., Markowicz, K. M., Quinn, P. K., Russell, L. M., Russell, P. B., Shimizu, A., Shinozuka, Y., Song, C. H., Tang, Y., Uno, I., Vogelmann, A. M., Weber, R. J., Woo, J.-H., and Zhang, X. Y.: ACE-ASIA: Regional climatic and atmospheric chemical effects of Asian dust and pollution, B. Am. Meteorol. Soc., 85, 367–380, 2004.
Stedmon, C. A. and Bro, R.: Characterizing dissolved organic matter fluorescence with parallel factory analysis: a tutorial, Limnol. Oceanogr. Meth., 6, 572–579, https://doi.org/10.4319/lom.2008.6.572, 2008.
Stein, A. F., Draxler, R. R., Rolph, G. D., Stunder, B. J. B., Cohen, M. D., and Ngan, F.: NOAA's HYSPLIT atmospheric transport and dispersion modeling system, Amer. Meteor. Soc., 96, 2059–2077, https://doi.org/10.1175/BAMS-D-14-00110.1, 2015.
Tan, J., Xiang, P., Zhou, X., Duan, J., Ma, Y., He, K., Cheng, Y., Yu, J., and Querol, X.: Chemical characterization of humic-like substances (HULIS) in PM2.5 in Lanzhou, China, Sci. Total Environ., 573, 1481–1490, https://doi.org/10.1016/j.scitotenv.2016.08.025, 2016.
Taylor, S. R. and McLennan, S. M.: The geochemical evolution of the continental crust, Rev. Geophys., 33, 241–265, https://doi.org/10.1007/s10201-006-0194-9, 1995.
Troyer, I. D., Bouillon, S., Barker, S., Perry, C., Coorevits, K., and Merckx, R.: Stable isotope analysis of dissolved organic carbon in soil solutions using a catalytic combustion total organic carbon analyzer-isotope ratio mass spectrometer with a cryofocusing interface, Rapid Commun. Mass Spectrom., 24, 365–374, https://doi.org/10.1002/rcm.4403, 2010.
Tsukuda, S., Sugiyama, M., Harita, Y., and Nishimura, K.: Atmospheric bulk deposition of soluble phosphorus in Ashiu Experimental Forest, Central Japan: source apportionment and sample contamination problem, Atmos. Environ., 39, 823–836, https://doi.org/10.1016/j.atmosenv.2004.10.028, 2005.
Twardowski, M. S., Boss, E., Sullivan, J. M., and Donaghay, P. L.: Modeling the spectral shape of absorbing chromophoric dissolved organic matter, Mar. Chem., 89, 69–88, https://doi.org/10.1016/j.marchem.2004.02.008, 2004.
Voliotis, A., Prokeš, R., Lammel, G., and Samara, C.: New insights on humic-like substances associated with wintertime urban aerosols from central and southern Europe: Size-resolved chemical characterization and optical properties, Atmos. Environ., 166, 286–299, https://doi.org/10.1016/j.atmosenv.2017.07.024, 2017.
Wozniak, A. S., Bauer, J. E., and Dickhut, R. B.: Characteristics of water-soluble organic carbon associated with aerosol particles in the eastern United States, Atmos. Environ., 46, 181–188, https://doi.org/10.1016/j.atmosenv.2011.10.001, 2012.
Yan, G. and Kim, G.: Dissolved organic carbon in the precipitation of Seoul, Korea: Implications for global wet depositional flux of fossil-fuel derived organic carbon, Atmos. Environ., 59, 117–124, https://doi.org/10.1016/j.atmosenv.2012.05.044, 2012.
Yan, G. and Kim, G.: Sources and fluxes of organic nitrogen in precipitation over the southern East Sea/Sea of Japan, Atmos. Chem. Phys., 15, 2761–2774, https://doi.org/10.5194/acp-15-2761-2015, 2015.
Yan, G. and Kim, G.: Speciation and sources of brown carbon in precipitation at Seoul, Korea: Insights from excitation-emission matrix spectroscopy and carbon isotopic analysis, Environ. Sci. Technol., 51, 11580–11587, https://doi.org/10.1021/acs.est.7b02892, 2017.
Yan, G., Cho, H.-M., Lee, I., and Kim, G.: Significant emissions of 210Po by coal burning into the urban atmosphere of Seoul, Korea, Atmos. Environ., 54, 80–85, https://doi.org/10.1016/j.atmosenv.2012.02.090, 2012.
Zepp, R. G., Sheldon, W. M., and Moran, M. A.: Dissolved organic fluorophores in southeastern US coastal waters: correction method for eliminating Rayleigh and Raman scattering peaks in excitation-emission matrices, Mar. Chem., 89, 15–36, https://doi.org/10.1016/j.marchem.2004.02.006, 2004.