the Creative Commons Attribution 4.0 License.
the Creative Commons Attribution 4.0 License.
 | 02 Mar 2020
First direct observation of sea salt aerosol production from blowing snow above sea ice
Sarah J. Norris
Ian M. Brooks
Philip S. Anderson
Kouichi Nishimura
Anna E. Jones
Michelle G. Nerentorp Mastromonaco
David H. Jones
Eric W. Wolff
Two consecutive cruises in the Weddell Sea, Antarctica, in winter 2013 provided the first direct observations of sea salt aerosol (SSA) production from blowing snow above sea ice, thereby validating a model hypothesis to account for winter time SSA maxima in the Antarctic. Blowing or drifting snow often leads to increases in SSA during and after storms. For the first time it is shown that snow on sea ice is depleted in sulfate relative to sodium with respect to seawater. Similar depletion in bulk aerosol sized ∼0.3–6 µm above sea ice provided the evidence that most sea salt originated from snow on sea ice and not the open ocean or leads, e.g. >90 % during the 8 June to 12 August 2013 period. A temporally very close association of snow and aerosol particle dynamics together with the long distance to the nearest open ocean further supports SSA originating from a local source. A mass budget estimate shows that snow on sea ice contains even at low salinity (<0.1 psu) more than enough sea salt to account for observed increases in atmospheric SSA during storms if released by sublimation. Furthermore, snow on sea ice and blowing snow showed no or small depletion of bromide relative to sodium with respect to seawater, whereas aerosol was enriched at 2 m and depleted at 29 m, suggesting that significant bromine loss takes place in the aerosol phase further aloft and that SSA from blowing snow is a source of atmospheric reactive bromine, an important ozone sink, even during winter darkness. The relative increase in aerosol concentrations with wind speed was much larger above sea ice than above the open ocean, highlighting the importance of a sea ice source in winter and early spring for the aerosol burden above sea ice. Comparison of absolute increases in aerosol concentrations during storms suggests that to a first order corresponding aerosol fluxes above sea ice can rival those above the open ocean depending on particle size. Evaluation of the current model for SSA production from blowing snow showed that the parameterizations used can generally be applied to snow on sea ice. Snow salinity, a sensitive model parameter, depends to a first order on snowpack depth and therefore was higher above first-year sea ice (FYI) than above multi-year sea ice (MYI). Shifts in the ratio of FYI and MYI over time are therefore expected to change the seasonal SSA source flux and contribute to the variability of SSA in ice cores, which represents both an opportunity and a challenge for the quantitative interpretation of sea salt in ice cores as a proxy for sea ice.
- Article
(10239 KB) - Companion paper
-
Supplement
(2251 KB) - BibTeX
- EndNote


Atmospheric aerosol represents the largest source of uncertainty in global climate predictions (Boucher et al., 2013) and includes sea salt aerosol (SSA), which is the main background aerosol above the oceans. In general global climate and aerosol models strongly under-predict Aitken and accumulation mode particle concentrations compared to observations (Mann et al., 2014) and do not capture the winter maximum of SSA observed at several locations in the Arctic and Antarctica (e.g. Huang and Jaeglé, 2017). A quantitative understanding of SSA sources is critical since SSA influences radiative forcing and therefore climate both directly by absorbing and scattering sunlight and indirectly by modifying the reflectivity, lifetime and extent of clouds (O'Dowd et al., 1997; DeMott et al., 2016). Uncertainties in cloud properties explain much of the spread in the modelled climate sensitivity (Flato et al., 2013) and are due in large part to lacking knowledge about aerosol sources. SSA plays also an important role in polar tropospheric ozone and halogen chemistry through the release of active bromine in polar spring contributing to ozone depletion events (ODEs) (e.g. Yang et al., 2010; Kalnajs et al., 2013; Choi et al., 2018). Furthermore, SSA is easily measured in polar ice cores, but its use as a quantitative proxy of past sea ice conditions is complicated by uncertainties related to SSA source contributions and processes as well as transport meteorology (Abram et al., 2013; Levine et al., 2014; Rhodes et al., 2017), and more recently in the case of bromide Br− (e.g. Spolaor et al., 2013) also to post-depositional processing associated with the bromine explosion chemistry of ODEs (Simpson et al., 2005; Pratt et al., 2013).
Globally most SSA originates from the open ocean, where sea spray is produced by wave breaking and bubble bursting generating film and jet drops (de Leeuw et al., 2011). However, previous observations in Antarctica provide twofold evidence of the existence of a significant SSA source associated with sea ice. First, SSA exhibits maxima during winter/spring in the atmosphere (Rankin and Wolff, 2003; Jourdain et al., 2008; Legrand et al., 2017) and in seasonally resolved ice core records (e.g. Frey et al., 2006); in deep ice cores the highest values are seen during glacial periods (Wolff et al., 2003). Thus the highest values are observed when sea ice is at its seasonal or long-term maximum. And, second, SSA in the lower atmosphere above coastal Antarctica is strongly depleted in sulfate () compared to seawater (Wagenbach et al., 1998) as are also brine and frost flowers in the sea ice nearby (Rankin et al., 2000). Fractionation of and to a much lesser extent of sodium (Na+) in sea ice occurs during the cooling of sea ice brine down to its eutectic point due to precipitation of the mineral mirabilite (Na2SO4⋅10 H2O) at temperatures below −6.4 ∘C resulting in ion ratios in liquid and solid phase that are different compared to seawater (Butler et al., 2016). At first it had been thought that observed fractionated SSA originates mostly from highly saline frost flowers, which exhibit a similar sulfate depletion (Rankin et al., 2000). However, recent laboratory (Roscoe et al., 2011; Yang et al., 2017) and model (Huang and Jaeglé, 2017) studies indicate that frost flowers likely play only a minor role in producing SSA because they do not become easily airborne and do not occur widely enough in space and time to produce large enough quantities of SSA. A more recent hypothesis based on a numerical model suggests that salty blowing snow that undergoes sublimation may be a significant source of SSA with a production per unit area equal to or larger than that above the open ocean (Yang et al., 2008). Indeed, model agreement with SSA winter maxima observed at a number of locations in the polar regions is much improved when a SSA source from blowing snow based on the parameterization of Yang et al. (2008) is included in the model (Huang and Jaeglé, 2017; Yang et al., 2019). A recent observational study in the Ross Sea sector of coastal Antarctica also shows a significant association between increased SSA and high wind speed, suggesting a link to blowing snow above sea ice as a source (Giordano et al., 2018).
However, the blowing-snow hypothesis and mechanism lack validation by direct observation. In particular, the applicability of the scheme used by all model studies to date (Huang and Jaeglé, 2017; Rhodes et al., 2017; Yang et al., 2019) for sea ice is not known, because model parameterizations are based on blowing-snow measurements above ice sheets (Budd, 1966; Mann et al., 2000; Nishimura and Nemoto, 2005) and the Canadian Prairies (Déry and Yau, 2001, and references therein). In this study we report the first direct observations of sea salt aerosol from within the Antarctic sea ice zone during winter, when the blowing-snow source is expected to be most active. We discuss the chemical fractionation in aerosol and snow as well as SSA variability and origin during and after blowing-snow events supported by a unique set of measurements of physical and chemical properties of atmospheric aerosol, snow particles and the snowpack on sea ice. We then critically evaluate the current model parameterization of sea salt aerosol production from blowing snow based on the in situ observations and discuss the mass budget of sea salt aerosol above sea ice. A comparison between our observations and a global chemistry transport model is described in a companion study (Yang et al., 2019).
Two consecutive Antarctic expeditions were carried out in the Weddell Sea aboard the German icebreaker RV Polarstern in 2013, the Antarctic Winter Ecosystem Climate Study (AWECS), ANT-XXIX/6 between 8 June and 12 August (Lemke, 2014), and the spring expedition ANT-XXIX/7 between 14 August and 16 October (Meyer, 2014) (Fig. 1). We report mainly on results from ANT-XXIX/6, which provided a significantly more extensive dataset. Atmospheric measurements and sampling were carried out continuously from the crow's nest of RV Polarstern and on the sea ice during nine 3–104 h long ice stations (Table 1). Ice station S3 was occupied for 3 h (Table 1), allowing only for collection of snow samples. Instruments were set up on the sea ice typically at 0.8 to 1.5 km distance from the ship. Sea ice thickness measurements during ANT-XXIX/6 (Arndt and Paul, 2018) showed that ice stations S1–6 in the eastern sector of the Weddell Sea were on first-year sea ice, whereas ice stations S7–S9 near the Antarctic Peninsula were on multi-year sea ice (Fig. 1). This is in agreement with the observation that persistent multi-year sea ice in the Weddell Sea occurs only east of the Antarctic Peninsula due to a circulating ocean current. The distance to the nearest open water was ∼600–1000 km for ice stations S1–6 and ∼200–400 km for ice stations S7–9 (Fig. 1, Table 1). Sea ice concentrations in mid-July 2013 derived from Nimbus-7 satellite microwave radiometer measurements (Comiso, 2017) show areas with 85 %–95 % ice cover near ice stations S2–3 and S7–9 indicating that open leads may be present (Fig. 1). As RV Polarstern travelled south, day lengths decreased until the sun remained entirely below the horizon between 23 June and 7 July, providing only a few hours of twilight per day. All times are in UTC. A summary of instrumentation and temporal coverage is given in Table 2, and experimental details for each measurement are described below.
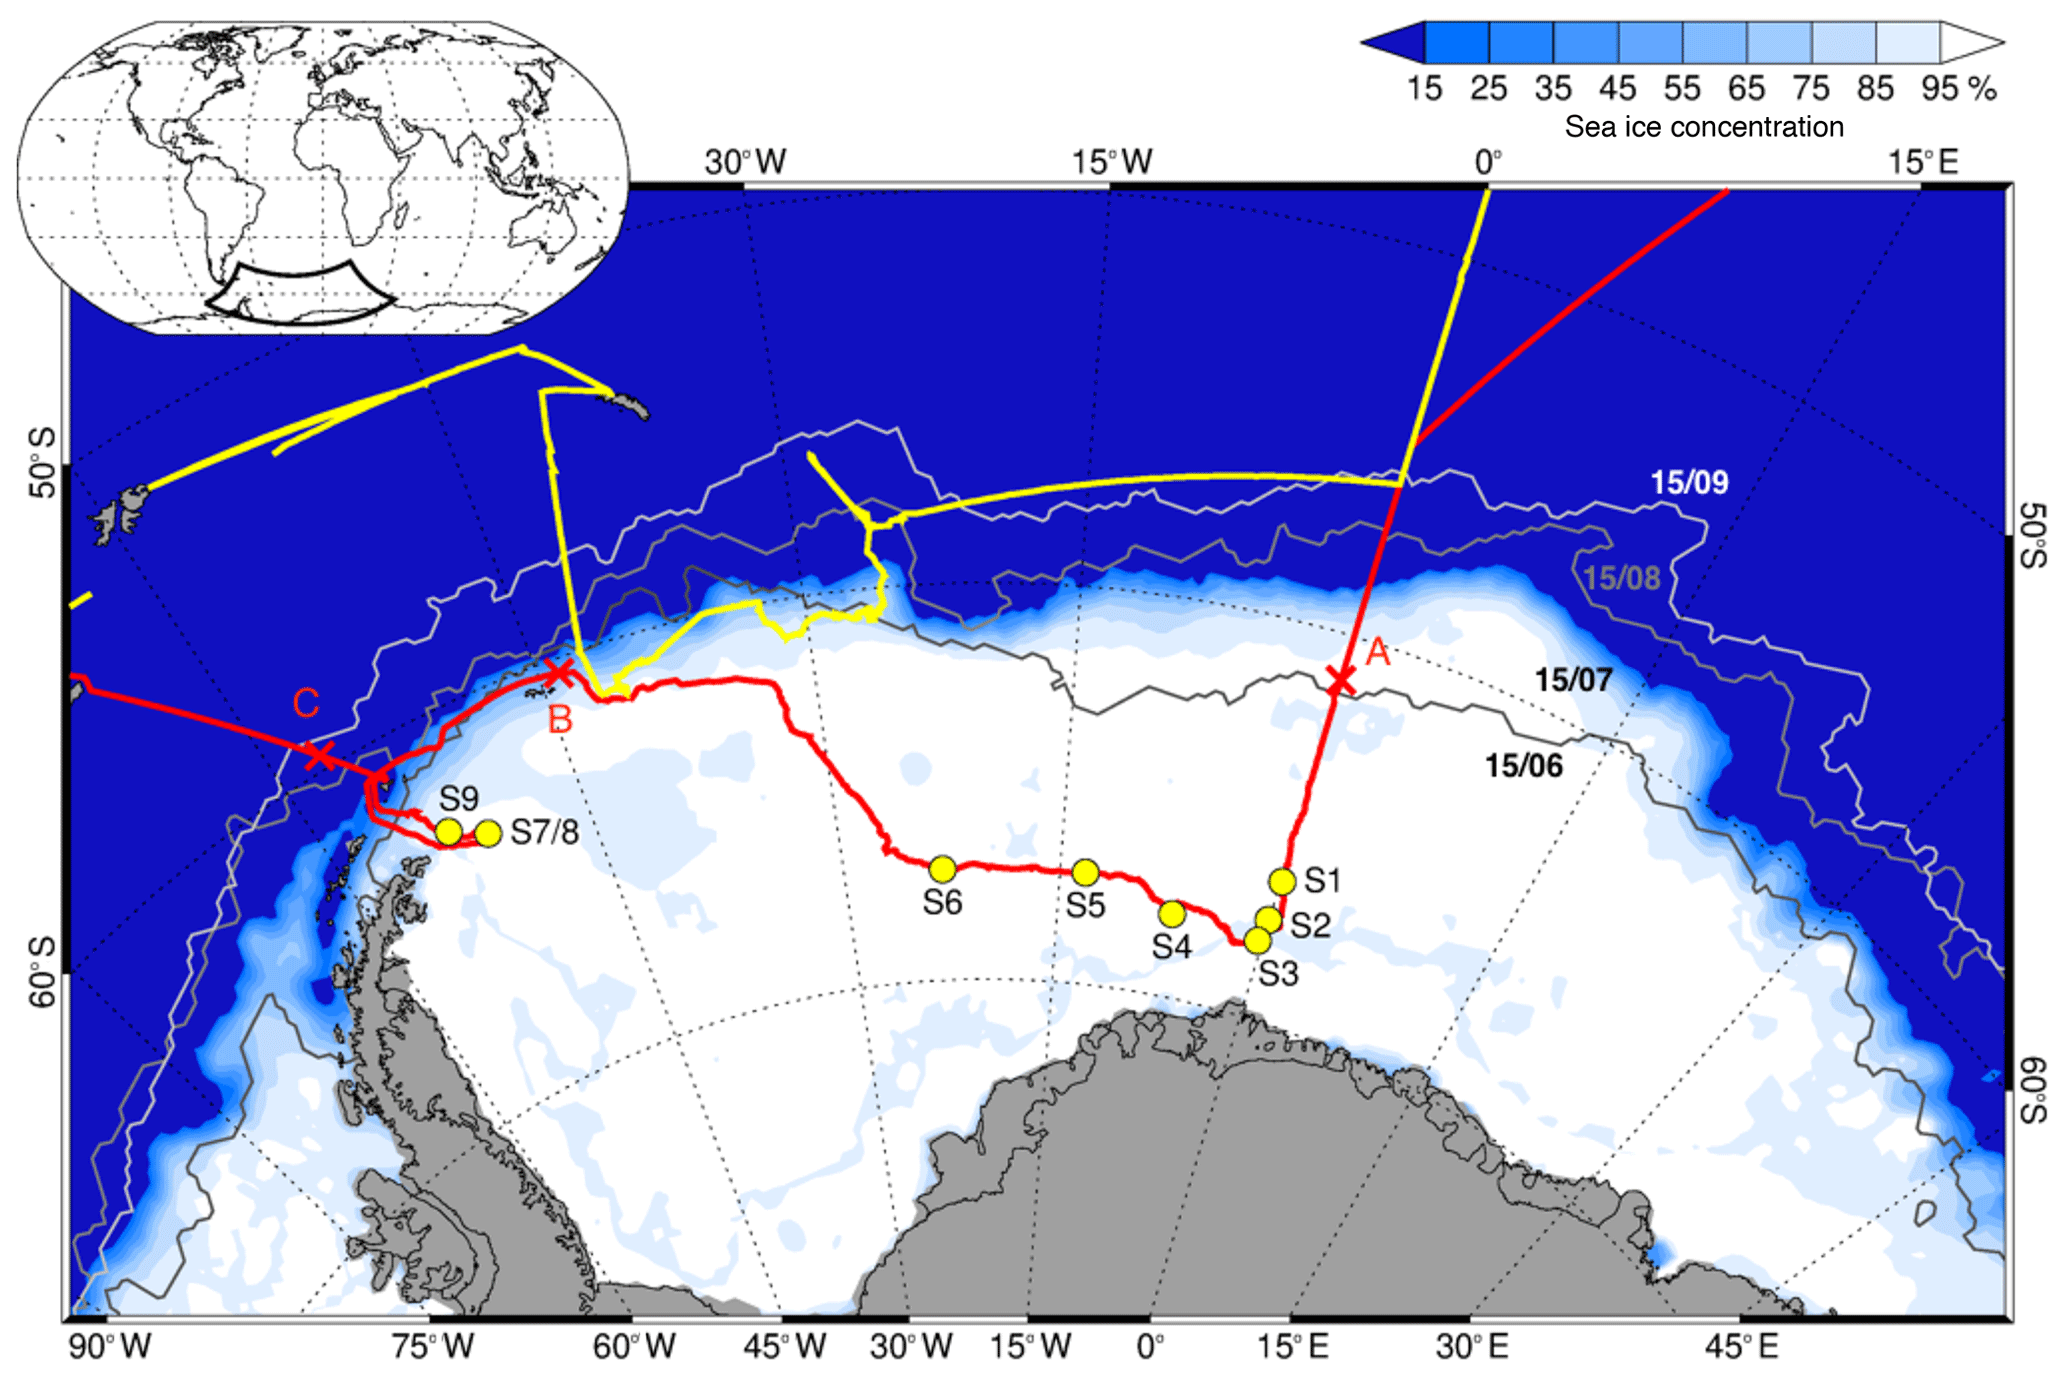
Figure 1Cruise tracks of RV Polarstern in the Weddell Sea for the winter expedition ANT-XXIX/6 from 8 June to 12 August 2013 (red line) and the spring expedition ANT-XXIX/7 from 14 August to 16 October 2013 (yellow line). Circles indicate the location of ice stations S1–9 (Table 1). Crosses show ship positions when entering the sea ice on 17 June (A), reaching the marginal sea ice zone (MIZ) on 22 July (B) and returning to the open ocean on 9 August (C). Sea ice concentrations on 15 July 2013 are shown as areas shaded in white to blue, and sea ice extent on 15 June, 15 August and 15 September 2013 is shown as solid grey lines, all based on Nimbus-7 satellite microwave radiometer measurements (Comiso, 2017).
Table 1Overview of duration Δt, mean position, distance to the nearest open water Δx and meteorology (ambient temperature, Ta; wind speed, U39 m; and wind direction, wdir, at 39 m) for ice stations S1–S9 during ANT-XXIX/6 (8 June to 12 August 2013).

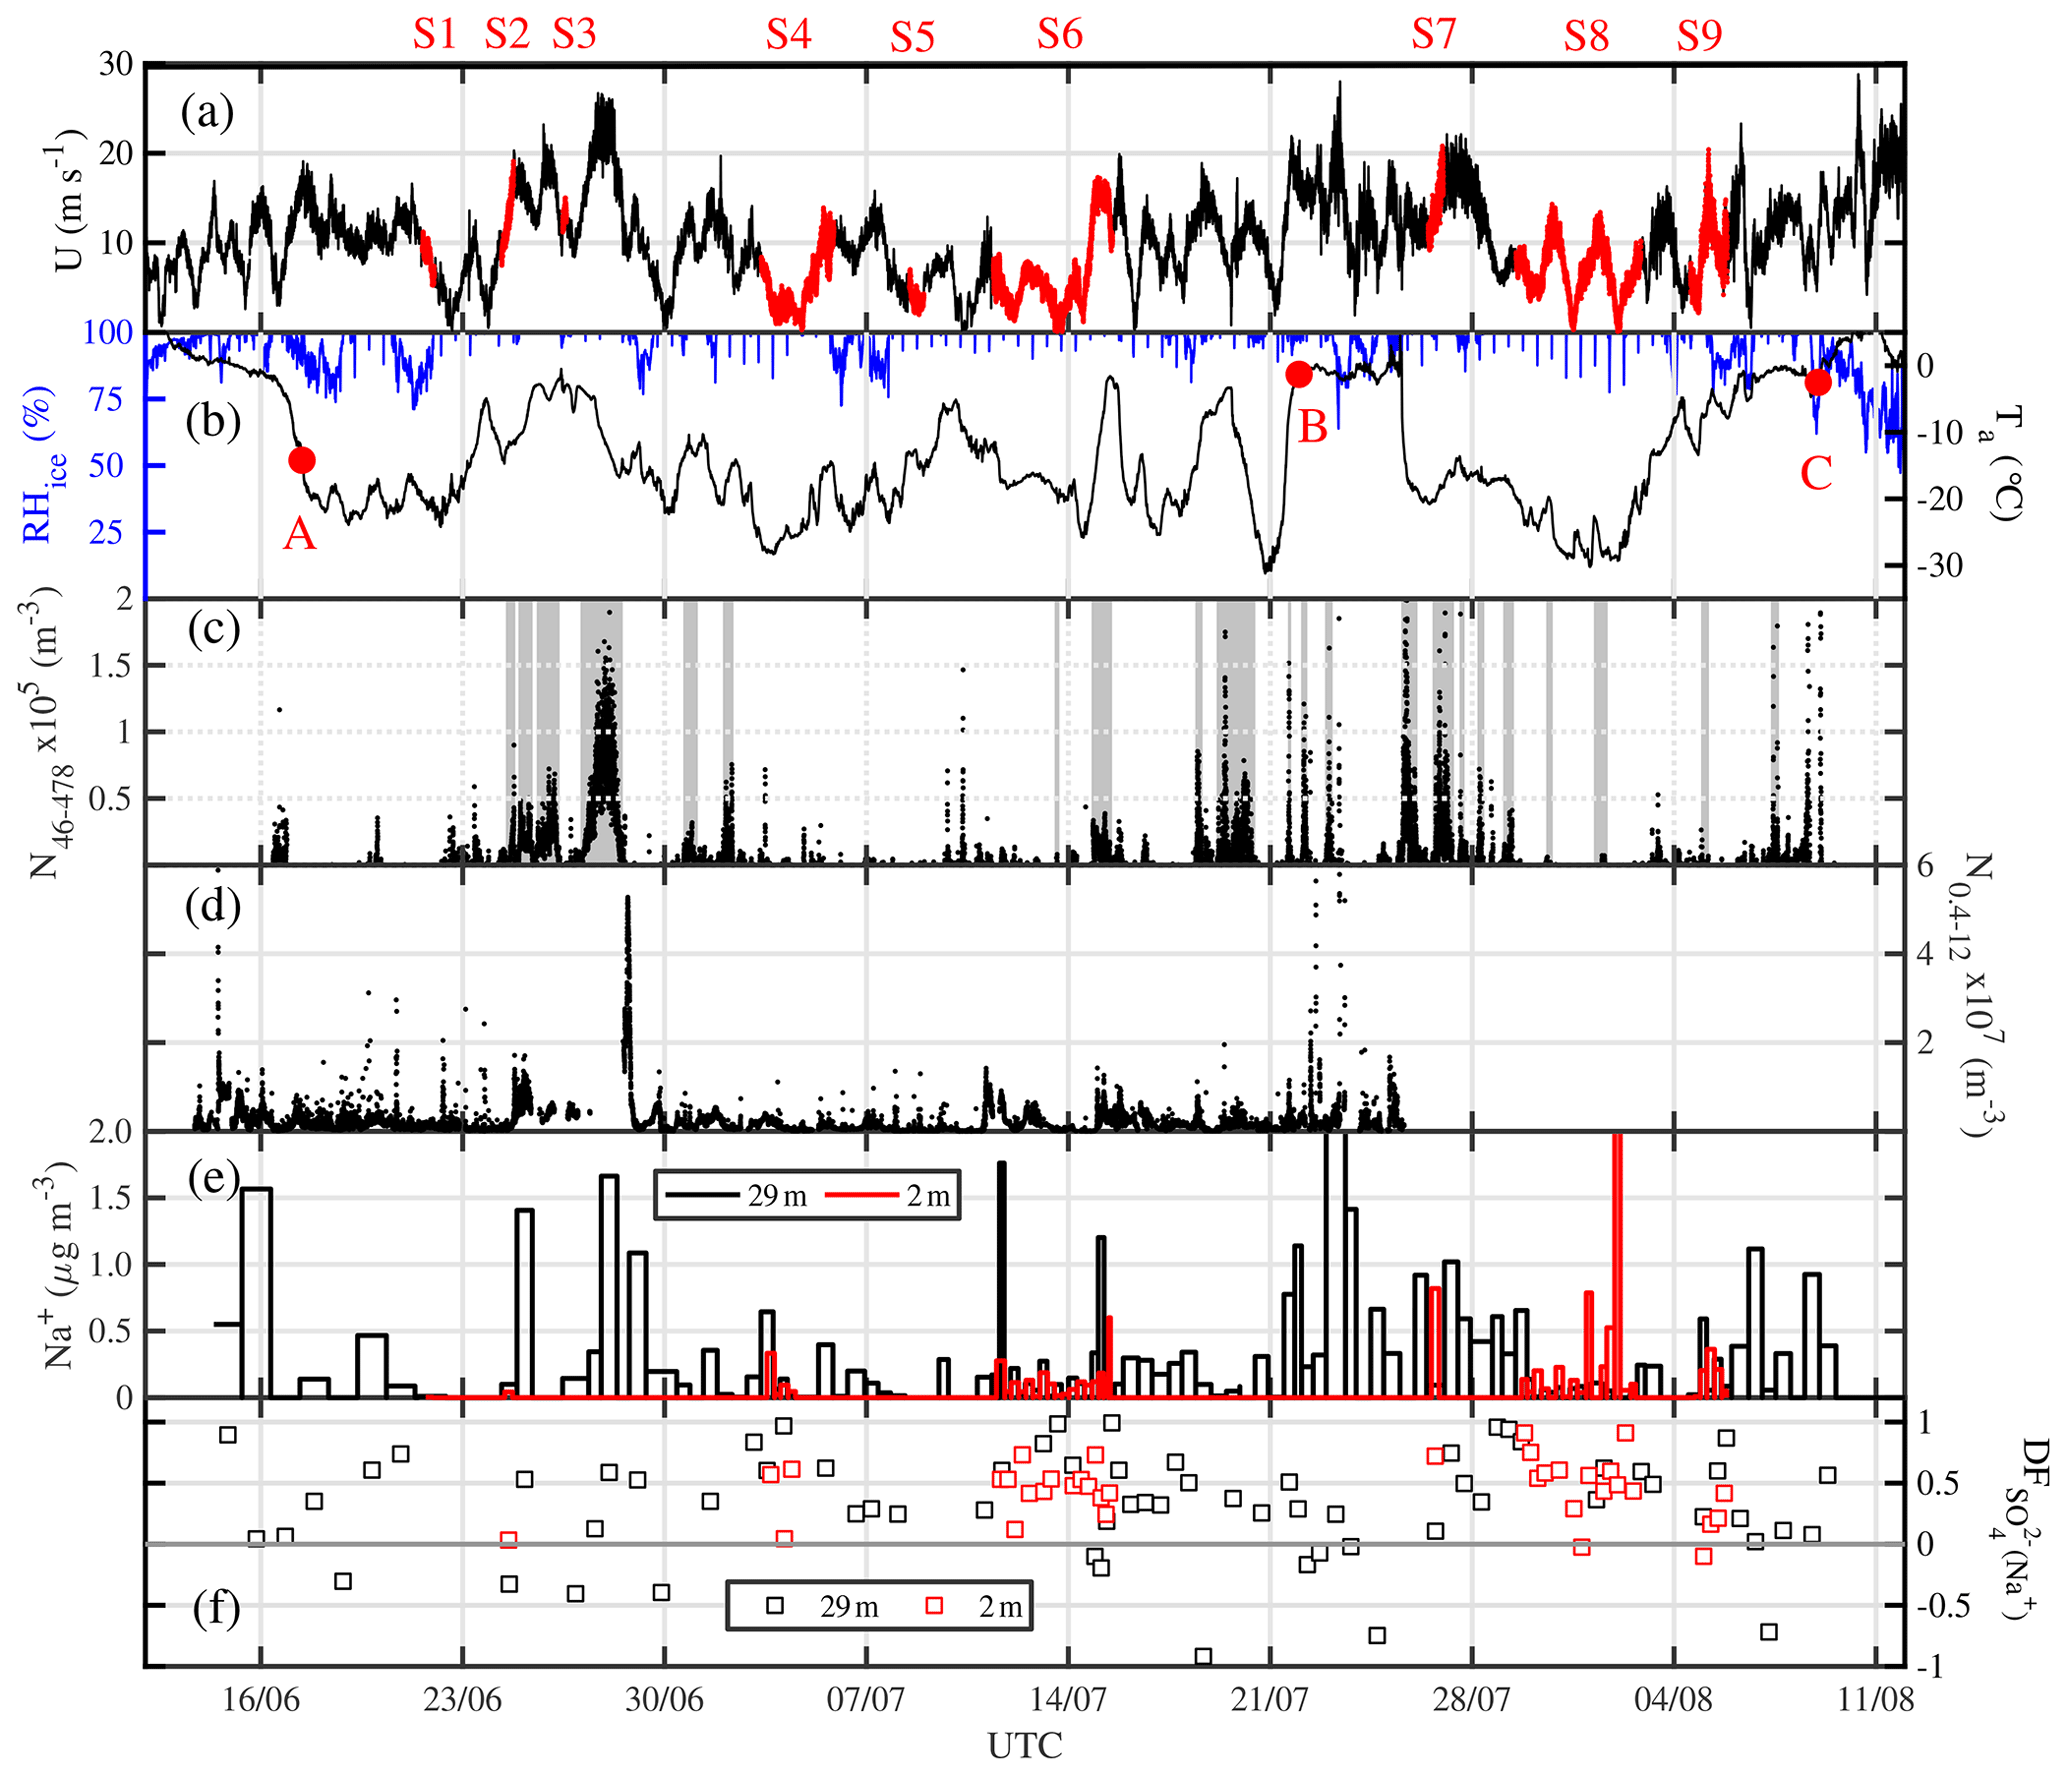
Figure 2Overview of atmospheric observations in the Weddell Sea from 8 June to 12 August 2013 (ANT-XXIX/6): (a) horizontal wind speed U at 39 m; time periods at ice stations S1–9 (Table 1) are highlighted in red. (b) Ambient temperature Ta and relative humidity with respect to ice RHice at 29 m; red symbols refer to RV Polarstern positions shown in Fig. 1, indicating when the ship entered the sea ice on 17 June (A), reached the marginal sea ice zone (MIZ) on 22 July (B) and returned to the open ocean on 9 August (C). (c) Total number densities N46−478 of airborne snow particles at 29 m with grey shaded areas indicating periods with observed drifting or blowing snow. (d) Total number densities N0.4−12 of aerosol at 29 m. (e) Aerosol Na+ concentrations and (f) sulfate depletion factor , both at 29 and 2 m.
Table 2Overview of observed parameters, instruments used, and reported data resolution Δt during ANT-XXIX/6 (ANT6) from 8 June to 12 August 2013 and during ANT-XXIX/7 (ANT7) from 14 August to 16 October 2013.
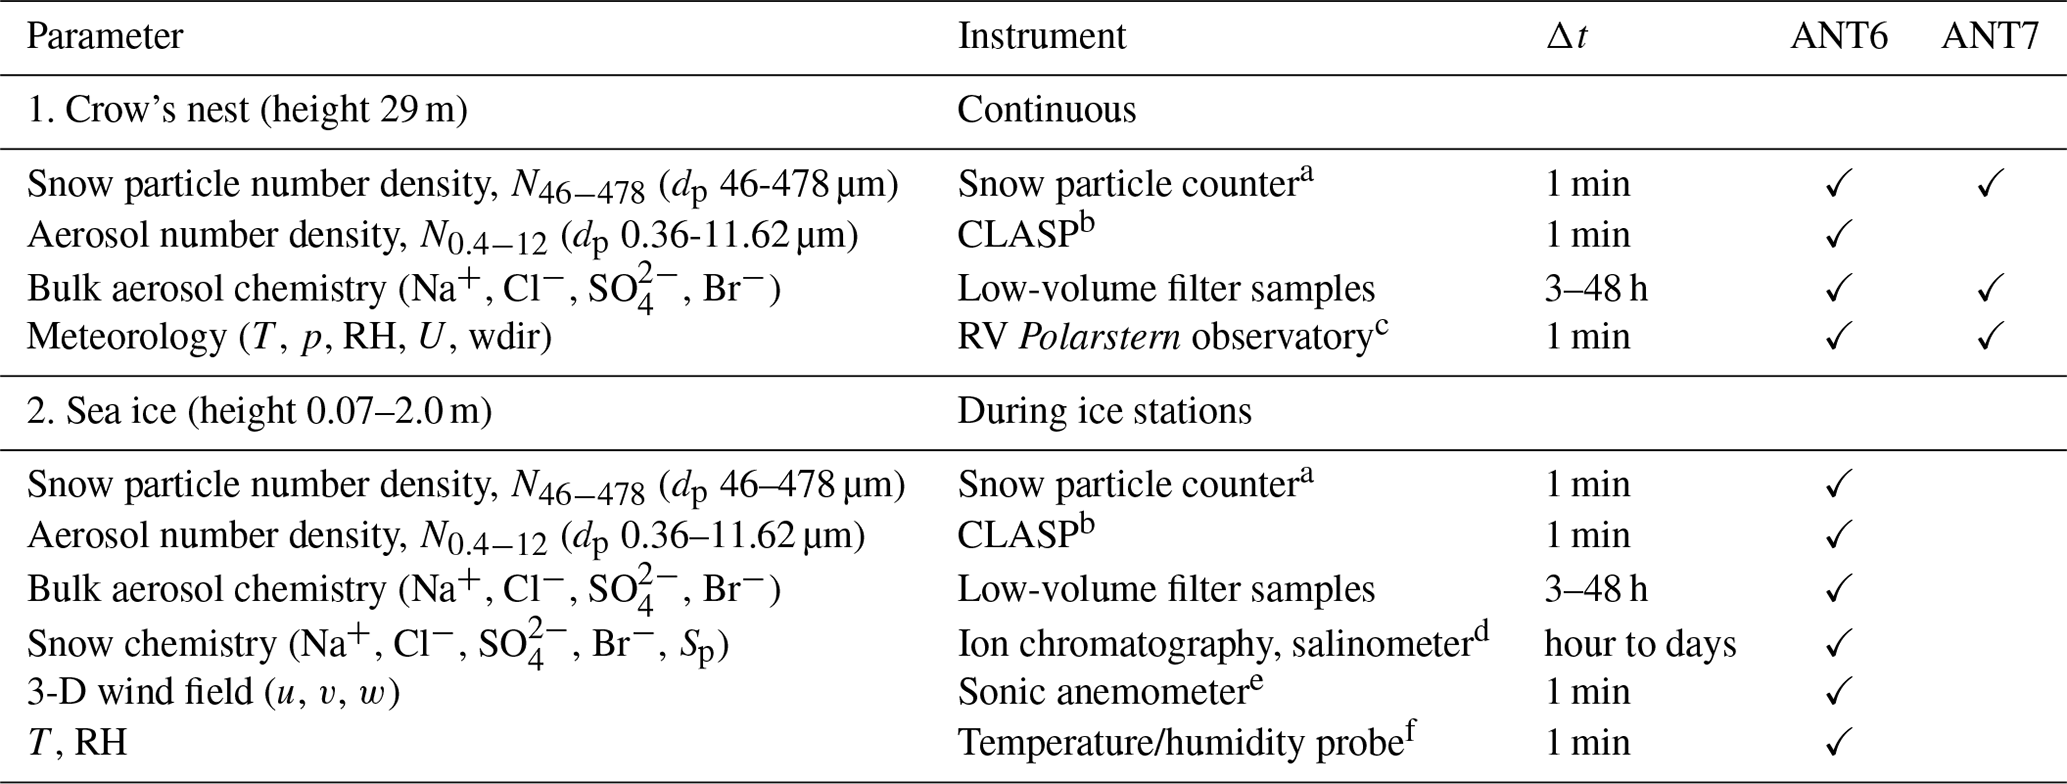
a SPC-95, Niigata Electric Co., Ltd. (Nishimura et al., 2014). b Compact Lightweight Aerosol Spectrometer Probe (CLASP) (Hill et al., 2008; Norris et al., 2008). c Details in König-Langlo (2013a, b). d SensIon 5, Hach. e METEK USA-1. f Vaisala HMP45.
2.1 Airborne snow particles
Size-resolved number densities of airborne snow particles in the diameter range 36–490 µm were measured at a mean height of ∼0.16 m (range 0.07–0.37 m) on the sea ice and at 29 m from the crow's nest of RV Polarstern using an open-path snow particle counter (SPC-95, Niigata Electric Co., Ltd.) described previously (Nishimura and Nemoto, 2005; Nishimura et al., 2014). In brief, the SPC is a single-slit sensor with a laser diode and measures diameter and number of drifting-snow particles by detecting their shadows. The SPC is mounted on a self-steering wind vane, and, hence, the sampling area A () and volume () are maintained perpendicular to the prevailing wind direction. Electric pulse signals resulting from snow particles passing through the sampling volume are sent to a transducer and an analysing data-logging system. Assuming that the detected particle size is the equivalent diameter dp of a sphere, each signal is classified into 1 of 64 mean particle diameter classes between 36 and 490 µm. The SPCs were calibrated by the manufacturer in Japan at −10 and −30 ∘C for particle diameters 137, 229, 314, 399 and 449 µm, respectively. The instrument output at the calibration temperature of −10 ∘C, close to the ANT-XXIX/6 median of −11.8 ∘C, showed very good agreement with the expected representative particle diameter. Therefore, no temperature corrections were applied. Particle counts from the smallest diameter class (dp=36 µm) have large uncertainties due to the instrument's detection limit, whereas particle counts from the largest diameter class (dp=490 µm) showed frequent spikes due to the detection of precipitating snow. Particle counts from the smallest and largest diameter class were therefore discarded. Particle counts h measured at a sampling rate SR of 1 Hz are integrated to 1 min values and divided by sampling area A to obtain particle number flux F in units of per square metre per minute (m−2 min−1). Snow particle number densities for the diameter range 46–478 µm, N46−478, are then computed using with horizontal wind speed U and are reported at ambient temperature, pressure and relative humidity in units of per cubic metre (m−3). Wind speeds measured near the crow's nest at 39 m by the ship's meteorology observatory (see Sect. 2.5) and on the sea ice at 2 m by a sonic anemometer (see Sect. 2.5) were extrapolated to the respective instrument heights. To do this a logarithmic wind profile U(z) is assumed given by (e.g. Li and Pomeroy, 1997), with measurement height z, the von Kármán constant κ (=0.4), friction velocity u* and the surface roughness length of momentum z0 set to m as measured very consistently above snow at Halley (King and Anderson, 1994). Wind speed at the instrument level is then derived using . It should be borne in mind that the distortion of flow caused by the ship may mean that speed at 39 m is not representative of flow in the far field at that height and, further, that the turbulent field strength, which governs the gradient of the logarithmic profile, may be a residual from a different, likely lower, height. Thus, we suggest care when interpreting the data and estimate that the conversion from particle counts to number density be seen as an estimate suitable for comparison rather than quantitative with a well behaved uncertainty.
2.2 Atmospheric aerosol
Size-resolved number densities of SSA sized particles were measured at mean heights of 0.19 m (range 0.13–0.25 m) and 2.16 m (range 1.98–2.2 m) on the sea ice and at 29 m from the crow's nest of RV Polarstern using a Compact Lightweight Aerosol Spectrometer Probe (CLASP) (Hill et al., 2008; Norris et al., 2008). The CLASP is a closed-path optical particle spectrometer, which aspirates sample air at a nominal flow rate Q of ∼3 STP L min−1, which is actively controlled by onboard electronics and recorded to allow subsequent correction of the particle spectra for any minor flow variations. An improved version of the CLASP instrument as used by Norris et al. (2012) was deployed, which measures a 16-channel size spectrum covering particle diameters dp in the range of 0.36–11.62 µm at ambient humidity at a sampling rate SR of 1 Hz. The CLASP pump and scatter cell were calibrated in the lab before and after the cruise. Particle losses to inlet walls are minimized by using a short and straight inlet tube of 0.3 m length similar to the original configuration (Hill et al., 2008, Fig. 9). We assume as an upper limit of particle losses those estimated previously for a similar inlet configuration (Norris et al., 2012), which amount to 43 % at dp=11.32 µm, 19 % at dp=6.06 µm and 0.1 % at dp=0.44 µm. With an estimated cut-off diameter of >11 µm, all but the coarsest SSA particles are expected to be detected. Number densities N0.4−12 are computed from particle counts h with at IUPAC standard temperature (273.15 K) and pressure (1 bar) and then averaged to 1 min means. Due to pump failure of the CLASP unit in the crow's nest, usable data at the 29 m level are only available from 8 June to 26 July 2013. Raw aerosol number concentrations at the crow's nest showed significant spikes, when air came from the direction of the ship's engine stack, whereas no evidence of pollution was detected in the observations on the sea ice. Pollution spikes were effectively filtered out prior to averaging by excluding all data when relative wind direction was in the 135–225∘ sector encompassing the ship's engine stack. A total of 21 % of the available 1 s data were removed from the crow's nest data.
2.3 Aerosol chemical composition
Aerosol was collected on filters via continuous low-volume sampling using open-face filter holders protected by a wind shield following the approach from a previous study in coastal Antarctica (Wolff et al., 1998). One sampling unit was deployed on the sea ice for the duration of each ice station, and another one was operated continuously from the crow's nest of RV Polarstern. Aerosol filters were polytetrafluoroethylene (PTFE) 1.0 µm pore membrane filters of 37 mm diameter (Zefluor® P5PL037, Pall Lab.) with an aerosol retention of >99.99 % as stated by the manufacturer. Filters were pre-mounted prior to the expedition in three-piece styrene acrylonitrile (SAN) filter holders onto porous cellulose support pads (Pall International Sarl). At the head of each sampling unit, the filter holder was mounted, open face downward, inside an upturned polyethylene jar intended to prevent blowing snow blocking the filter. On the sea ice the jar was attached to a metal mast at ∼2 m above the snowpack and on the crow's nest to a horizontal metal arm at ∼29 m above the sea ice surface, and it was free to swing in the wind, aiding the removal of snow and rime. An air pump was attached with PFA tubing ∼10 m downstream of the sampling head to pull ambient air through the filters. The sea ice unit had a 12 VDC diaphragm vacuum pump (22 W, N815-KNDC, KNF Neuberger) powered by a rechargeable lead-acid battery (12-5000X, Sunlyte) with an average flow rate of 9.8 STP L min−1, whereas the crow's nest unit had a 220 VAC diaphragm vacuum pump (420 W, model no. DOA-P725-BN, GAST, Michigan, USA) with a mean flow rate of 8.8 STP L min−1. Total sample air volume was measured upstream of the pump using a diaphragm gas meter (KG-2-G1.6, BES), which was not temperature compensated. However, gas meter temperature continuously recorded with a Tinytag logger (RS, Gemini) and atmospheric pressure available from the ship's meteorology observatory (see Sect. 2.5) allowed us to determine the total air sample volume at IUPAC standard temperature and pressure. Rotameters with a glass float (Cole-Parmer) installed upstream of the gas meter were used to manually check flow rates one to two times daily. Post-season lab tests confirmed accuracy of the crow's nest gas meter, whereas the sea ice gas meter showed a negative bias of 30 %, which is accounted for in the computation of final atmospheric concentrations. Filter sampling intervals were on average 6 h (range 1.5–8.6 h) at 2 m and 12 h (range 3.5–31 h) at 29 m, with more frequent filter changes applied during storms. The resulting sample air STP volumes were 3.3 (0.8–5.1) m3 at 2 m and 6.4 (1.8–17.3) m3 at 29 m.
Filters were estimated to collect aerosol in the diameter range ∼0.3 µm to less than 6 µm. The lower end of the range is based on previous measurements of collection efficiencies of PTFE filters as a function of particle size (Soo et al., 2016). The upper end, the cut-off diameter of the air intake system, which critically controls the observed aerosol load, is estimated as follows. Previously a cut-off diameter of 6 µm was empirically estimated for a similar sampling setup with filter face velocities of 1.1 m s−1 (Wagenbach et al., 1998). In this study average filter face velocities were 0.15 m s−1, implying a cut-off diameter smaller than 6 µm. Since isokinetic sampling could not be applied, sea salt aerosol concentrations are expected to be generally underestimated, especially during high wind speeds. The low filter bias for sea salt is found to depend weakly on wind speed and is on average 26 % compared to median values during filter sampling intervals derived from CLASP measurements as discussed in Sect. 3.5.
Filter units, consisting of filters, support pads and filter holders, were cleaned and assembled prior to shipping to Antarctica in a class 100 clean laboratory in Cambridge (United Kingdom). Filters and support pads were soaked overnight in methanol (ACS>99.9 %, Fisher Scientific) in batches of 25, rinsed four times with ultra-high-purity water (UHP, electric resistivity 18.2 MΩ cm), microwaved for 3 min and then rinsed once more with UHP water. Filters were dried on their support pads under vacuum in a clean dessicator. Filter holders were rinsed with UHP water, placed for 10 min into an ultrasonic bath, rinsed with UHP water three times and microwaved for 5 min, and then soaked overnight in UHP water, followed by four UHP-water rinses and 5 min microwaving. Filter holders were then dried in the incoming, filtered airflow of the class 100 laboratory. Filter units were assembled in the class 100 laboratory, sealed airtight with plugs and then bagged in 2 layers of polyethylene bags. In Antarctica, filter units were removed from the bags, mounted onto the sampling head by removing one plug and then opened to give open-face sampling. Field blanks were collected at regular intervals by placing a filter onto the head and leaving it for a few minutes without pumping. After sampling, the procedure was reversed, and filter units were shipped in a freezer (−20 ∘C) back to the United Kingdom and kept frozen until prior to extraction. Filters were transferred in the class 100 laboratory into 10 mL pre-cleaned polystyrene sample vials (Dionex AS-AP Autosampler vial). Pre-cleaning of the vial, lid and septum involved UHP-water rinsing followed by 3 min microwaving repeated five times, soaking overnight in UHP water, repeating the same set of UHP-water rinsing, and microwaving before drying and double-bagging. Filters were then extracted in 8 mL of UHP water by repeated shaking and immersion into an ultrasonic bath for >30 min. Samples were analysed using ion chromatography (IC) as described in the following section. The field blank, mostly due to the filter itself with contributions from field and extraction procedures, was significant for all ions (Table 3). A mean value has been subtracted from all concentrations leading in some cases to negative values. The combination of small air sample volumes and high field blanks led to relatively high limits of detection (LODs) defined here as 2 times the standard deviation of the field blank (Table 3).
Table 3Overview of mean aerosol filter procedure blanks and resulting limit of detection (LOD): (1) ultra-high-purity (UHP) water, (2) filter extraction, (3) cleaned and unused filter, and (4) field blank (see text). Field blank values are used to correct the raw filter ion concentration.
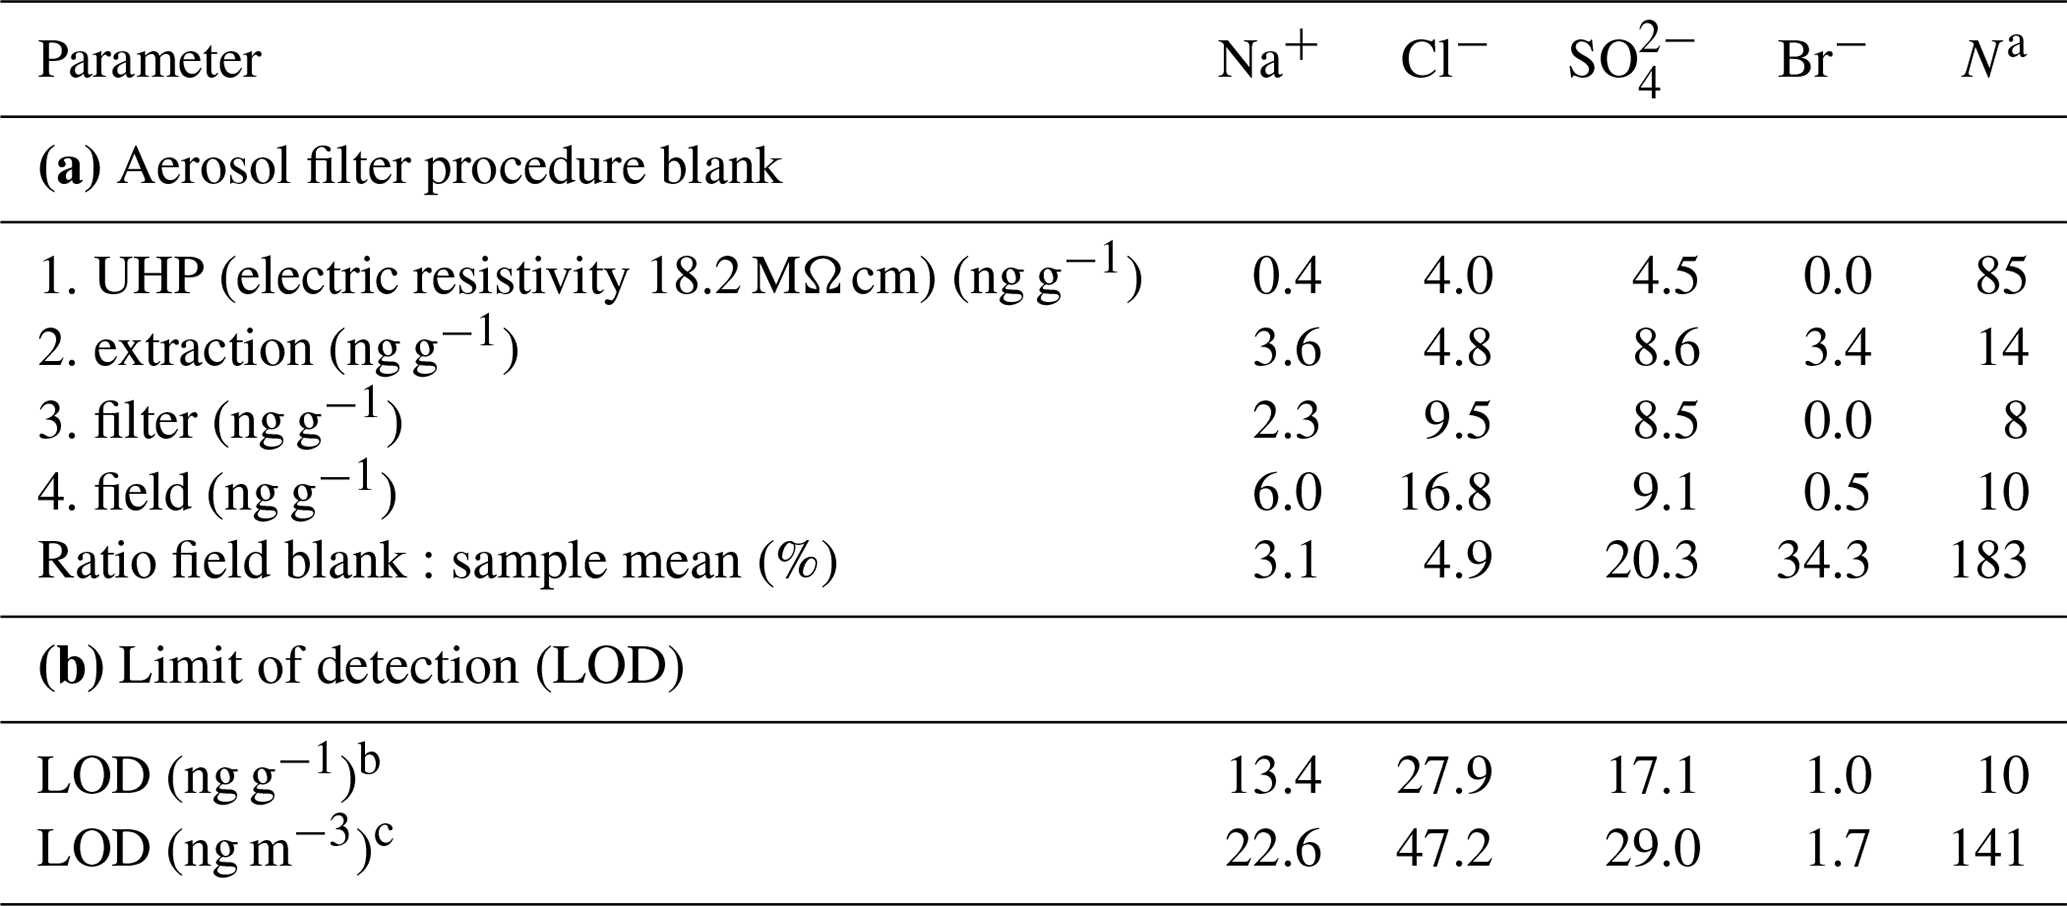
a Sample size. b Defined as of the field blank. c Based on crow's nest mean sample air STP volume (6.4 m3); mean sample air STP volume for filters deployed on the sea ice was 3.3 m3, increasing respective LODs by a factor of 1.6.
Chemical fractionation of ion x (, Br−, Na+) relative to ion y ( or Cl−) in aerosol and snow with respect to seawater is evaluated based on the depletion factor , with R being the x:y mass ratio in sample (spl) and reference seawater (RSW) following Millero et al. (2008). Throughout, and refer to sulfate and bromide depletion relative to Na+, and refers to sodium depletion relative to Cl−. DFx between 0 and 1 indicates 0–100 % depletion, whereas DFx<0 indicates enrichment. For example, or 150 % enrichment means the respective ion concentration is 2.5 times that in reference seawater. A total of six ( % of all crow's nest samples) values were below that of pure mirabilite () and are attributed either to sulfate contamination from the ship's engine emissions discussed below or measurement error. We therefore removed all ion concentrations of the corresponding filter samples from the dataset. Propagation of the analytical error yields mean uncertainties in DFx of 0.03–0.04.
About 7 % (10 out of 151) of all filters collected at the crow's nest during June to September 2013 were visibly grey from exposure to ship exhaust and therefore not analysed in order to protect the IC columns. In order to assess the impact of potential pollution on reported bulk aerosol chemistry from filters collected at the crow's nest, we calculated for each filter sample the fraction of the total filter run time during which relative wind direction was within the 135–225∘ sector encompassing the ship's engine stack. Considering all filters sampled from June to September 2013 (N=141) the fraction of total filter run time with winds from the polluted sector was on average 9.5 %. Polluted time fraction and atmospheric concentrations of Na+ and Cl− were uncorrelated (R<0.05, p>0.1), which did not suggest any impact of pollution on the respective ion concentration. Weak but significant correlations were found between polluted time fraction and (R=0.21, p<0.05), (, p<0.01), Br− (R=0.17, p<0.06) and (, p<0.01), suggesting that enrichment in sulfate (and bromide) may be more likely during polluted conditions. The bulk aerosol chemistry observations on the sea ice showed no evidence of pollution. Thus, in the case of sulfate we cannot rule out that some of the sulfate enrichment in atmospheric aerosol observed at the crow's nest may be due to ship exhaust rather than presence of mirabilite. It follows that estimates of sea ice contributions to total SSA inferred from depletion factors in this study have to be considered as lower bounds of true values.
2.4 Snow chemical composition
In order to determine the snow chemical composition, a total of 24 snow pits was sampled at nine ice stations during ANT-XXIX/6, between one and two snow pits at shorter ice stations, and up to eight snow pits at the multi-day ice stations S6 and S8 (Table 1). Snow pit profiles were sampled at 2 cm depth resolution with a custom-built, cylindrical, stainless-steel sampling tool yielding a sample volume of ∼60 cm3. Blowing or drifting snow was collected at approximately 0.3, 0.9 and 1.6 m above the snow surface using modified Mellor gauges with a clear thermoplastic body (Schmidt et al., 1984) referred to as rocket traps. Snow samples were transferred into 50 mL polypropylene tubes with screw caps (Corning CentriStar), which prior to field deployment had been rinsed with UHP water and dried in a class 100 clean laboratory in Cambridge. One set of snow samples was melted on board RV Polarstern to measure aqueous conductivity using a conductivity meter (SensIon 5, Hach) with a measurement range of 0–200 mS cm−1 and a maximum resolution of 0.1 µS cm−1 at low conductivities (0–199.9 µS cm−1). The conductivity meter has an automatic non-linear temperature compensation based on a NaCl solution and reference temperature of 25 ∘C and was calibrated with a standard salt solution (12.880 mS cm−1 at 25.1 ∘C), certified and traceable to NIST (REAGECON product no. CSKC12880, lot no. CS1288012K1). Conductivity values were converted into practical salinity Sp using the Gibbs SeaWater (GSW) Oceanographic Toolbox (McDougall and Barker, 2011), which applies the algorithm of the Practical Salinity Scale of 1978 (PSS-78) (Unesco, 1981, 1983) with an extension to salinities Sp<2 psu (Hill et al., 1986). Sp is reported in psu (practical salinity unit), approximately equivalent to the weight of dissolved inorganic matter in grams per kilogram of seawater, and has an accuracy as stated by the manufacturer of ±0.001 psu at low salinities (<1 psu).
The other snow samples were shipped frozen back to Cambridge and only melted prior to analysis in spring 2014 and December 2016. Elevated salinities required dilution of samples with UHP water, typically by a factor of 100 for most snow samples and a factor of 10 000 for sea ice and frost flower samples. Samples were analysed for major ions using Dionex ICS2000 ion chromatography systems with reagent-free eluent generation. Cation analysis was performed with a CS12A separator column with isocratic methylsulfonic acid elution and a 250 µL sample loop. Anion analysis was performed using an AS17 separator column, gradient elution with potassium hydroxide and a 250 µL sample loop. Measurement accuracies were evaluated using European reference materials ERM-CA408 (simulated rain water) and CA616 (groundwater) and were all within 5 % and respective LODs ∼2 ng g−1. Here we only report and discuss concentrations of ions relevant to this study: Na+, Cl−, and Br−.
2.5 Ancillary measurements
General meteorology measurements were taken from RV Polarstern onboard sensors described in detail elsewhere (https://spaces.awi.de/display/EFPW/Weather+Station; last access: January 2020) and include ambient temperature Ta and relative humidity with respect to water RHaq at 29 m (HMT337, Vaisala, Finland), wind speed U and direction at 39 m (Sonic 2D, Thies, Germany), and global radiation (Pyranometer CM11, Kipp & Zonen, Netherlands). Still images recorded every minute by a webcam in the crow's nest provided further qualitative information on the presence of airborne snow particles, when light conditions were adequate. During ice stations the three-dimensional wind components (u, v, w) were measured above the sea ice at 25 Hz with an unheated sonic anemometer (Metek USA-1) that was mounted on a mast at ∼2 m. Processing of raw sonic data in 1 min blocks included temperature crosswind correction and a double coordinate rotation to force mean w to zero (Kaimal and Finnigan, 1994; Van Dijk et al., 2006), followed by computation of friction velocity u*. Ta and RHaq were also measured above the sea ice on a 2 m mast at approximately 0.6, 1.2 and 2.0 m using temperature–humidity probes (HMP45, Vaisala). RHaq was converted to relative humidity with respect to ice RHice. RHice from the HMP45 was further corrected following Anderson (1994) to extend the calibrated temperature range to ∘C. Based on the available data the calibration of RHice is most accurate for the −40 to −20 ∘C range and has greater uncertainty in RHice in near-freezing conditions. Accurate correction of the HMT337 output was not possible since available RHaq values are biased as they had been post-processed by accepting only values up to 105 % and setting any values >100 % to 100 %. In general, measuring RHice during blizzards is very difficult, and its estimated non-systematic error of ∼5 % limits its use for blowing-snow calculations. We therefore discuss only RHice trends below.
The presentation and discussion of results in the sections below are organized as follows. An overview of observed meteorology and particle concentrations (Sect. 3.1) is followed by the discussion of chemical fractionation of aerosol and snow and size spectra of aerosol above sea ice (Sect. 3.2). Blowing-snow events are then described in detail during two time periods (Sect. 3.3). We then evaluate the current model mechanism proposed by Yang et al. (2008, 2019) for SSA production from blowing snow (Sect. 3.4) and finally discuss the air–snow budget of sea salt aerosol above sea ice (Sect. 3.5).
3.1 Overview of atmospheric observations
Near-zero or positive ambient temperatures Ta in degrees Celsius occurred when RV Polarstern was in the open ocean at the start and end of ANT-XXIX/6, as well as from the 22 July 2013 onwards, when the ship had moved into the marginal sea ice zone (MIZ) closer to open water (marker B in Figs. 1, 2b). After entry into the sea ice zone on 17 June 2013 (marker A in Fig. 1) Ta decreased to below −20 ∘C but showed thereafter frequent increases associated with storms (Figs. 1, 2a, b). The correlation between Ta and U39 m is weak but significant (R=0.37, p<0.05). Winter storms occurred frequently with wind speeds ranging between 10 and 20 m s−1, occasionally exceeding 20 m s−1 (Fig. 2a), and coincided often with snowfall based on the ship's 3-hourly weather report, occasional webcam images and presence of clouds (data not shown). Bearing in mind that wind direction and origin of air mass depend on the ship's position relative to the path of a low- or high-pressure system, the following is observed: the most of frequent winds were from the W to SSW, advecting cold (−15 to −30 ∘C) air of a low water load with specific humidities qv<3 g kg−1 (Fig. 3). The second most frequent were winds from the SSE to SE, advecting relatively warm air often between −5 and 0 ∘C with higher qv values often between 3 and 5 g kg−1 (Fig. 3), indicating origin from lower latitudes. And the third most frequent were winds from the N coinciding with the highest wind speeds (Fig. 3). The air was (super)saturated with respect to ice most of the time (RHice>100 %), with increased frequency of subsaturation (RHice<100 %) when the winds were from the SE (Fig. 3d). Horizontal wind speed at 2 and 39 m correlated well with friction velocity u* (R=0.9, p<0.05) (Fig. S1 in the Supplement), indicating a well-mixed near-neutral turbulent boundary layer above the sea ice during blowing snow (Nishimura and Nemoto, 2005; Jacobson, 2005).
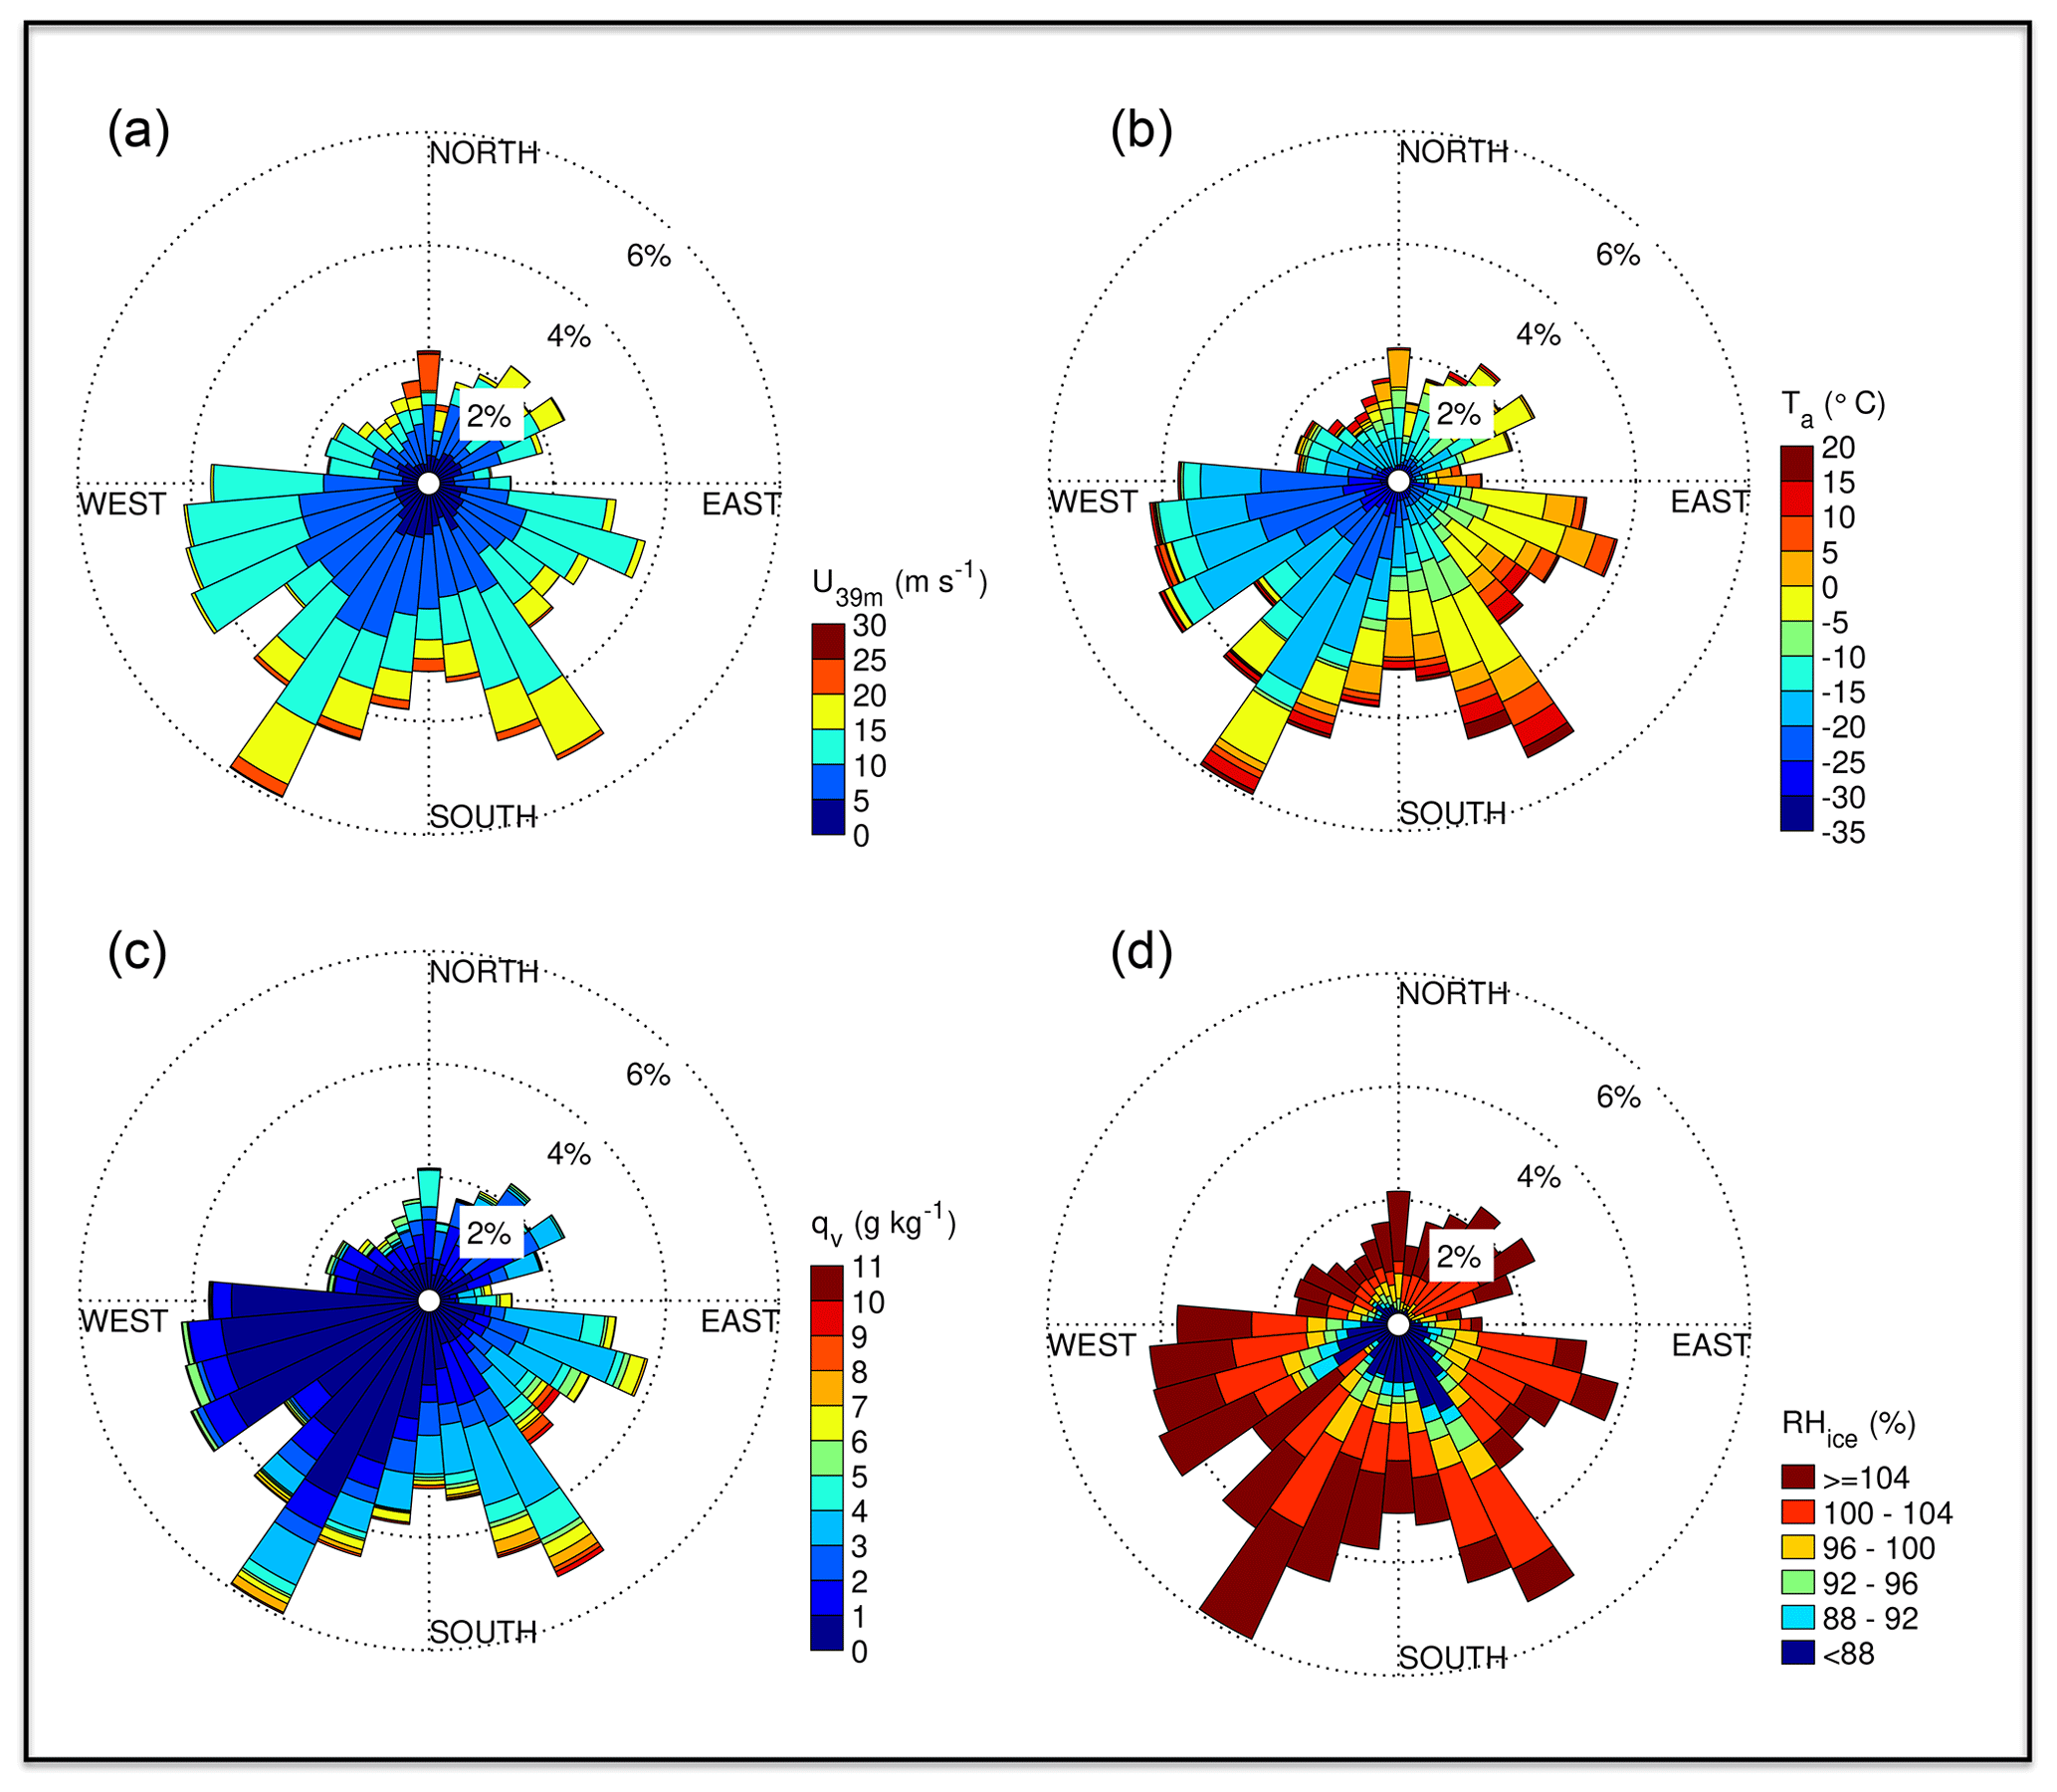
Figure 3Wind rose plots for the position of RV Polarstern during ANT-XXIX/6 (8 June–12 August 2013): (a) horizontal wind speed U at 39 m, (b) ambient temperature Ta, (c) specific humidity of air qv and (d) relative humidity with respect to ice RHice (b–d at 29 m).
Airborne snow particle concentrations at 29 m showed strong variability and a weak but significant correlation with wind speed (R=0.27, p<0.01) (Fig. 2a, c). During most storms, measured snow particle concentrations have contributions from both blowing snow from the sea ice and precipitation from above as further discussed in Sect. 3.4.2. At 29 m, mean total number densities N46−478 were 8.7×10³ m−3 during ANT-XXIX/6 and very similar 7.2×10³ m−3 during ANT-XXIX/7 (Table S1 in the Supplement, Fig. S2c). Near the sea ice surface snow particles were measured for a total sampling time of 6 d and showed a mean N46−478 of 2.6×10⁵ m−3, on average ∼60 times the number density observed during the same time at 29 m.
Aerosol concentrations N0.4−12 at 29 m showed strong variability with many but not all increases associated with storms and blowing snow (Fig. 2d), illustrated by a weak but significant correlation with wind speed (R=0.18, p<0.01). At 29 m, mean total number densities N0.4−12 were 2.1×10⁶ m−3 during ANT-XXIX/6 (Table S2, Fig. 2d). N0.4−12 mean values at 2.0 and 0.2 m during ice stations were 1.4×10⁶ and 1.7×10⁶ m−3, respectively, about the same as the number densities observed during the same time at 29 m (Table S2). The median aerosol particle diameters at the measurement heights 0.2, 2.0 and 29 m ranged between 0.60 and 0.66 µm (Table S2), showing dominance of submicron-sized particles in atmospheric aerosol below the instrument particle size cut-off (>11 µm).
Descriptive statistics of the aerosol chemistry are summarized in Table 4. The Na+ concentrations of bulk aerosol showed strong variability, with most increases coinciding with storms and aerosol number density N0.4−12 peaks (Fig. 2e). Note that as discussed in Sect. 3.5 the correlation between atmospheric sea salt concentrations estimated based on filters and N0.4−12 is weak but significant (R=0.32, p<0.01), indicating that CLASP captures some SSA variability. Na+ and sea salt concentrations were in general higher at 29 m than at 2 m (Table 4) except during S8 (Fig. 2e). values of aerosol at 29 and 2 m showed strong variability ranging most of the time between values near 0 (small depletion) and close to 1 (strong depletion), with occasional indicating enrichment (Fig. 2e). Median values at 29 m were similar during ANT-XXIX/6 (=0.29) and ANT-XXIX/7 (=0.21) but larger near the sea ice surface (=0.48), although vertical differences were not statistically significant based on the Wilcoxon rank-sum test (p<0.01). Non-zero values suggest throughout a significant contribution to the total SSA burden from a fractionated sea ice source (Table 4, Fig. S1e). Conversely, when in open water, at the beginning and end of ANT-XXIX/6 Na+ concentrations of bulk aerosol were relatively large but with small or no sulfate depletion, consistent with the open ocean as the main SSA source, except for the very first and last sample (Fig. 2e).
Table 4Descriptive statistics of the aerosol chemistry during ANT-XXIX/6 (ANT6) and ANT-XXIX/7 (ANT7) with mean and median values weighted by the filter sampling interval. Ion and sea salt concentrations are in units of nanograms per cubic metre (ng m−3). See Sect. 2.3 for definition of depletion factors (DF).
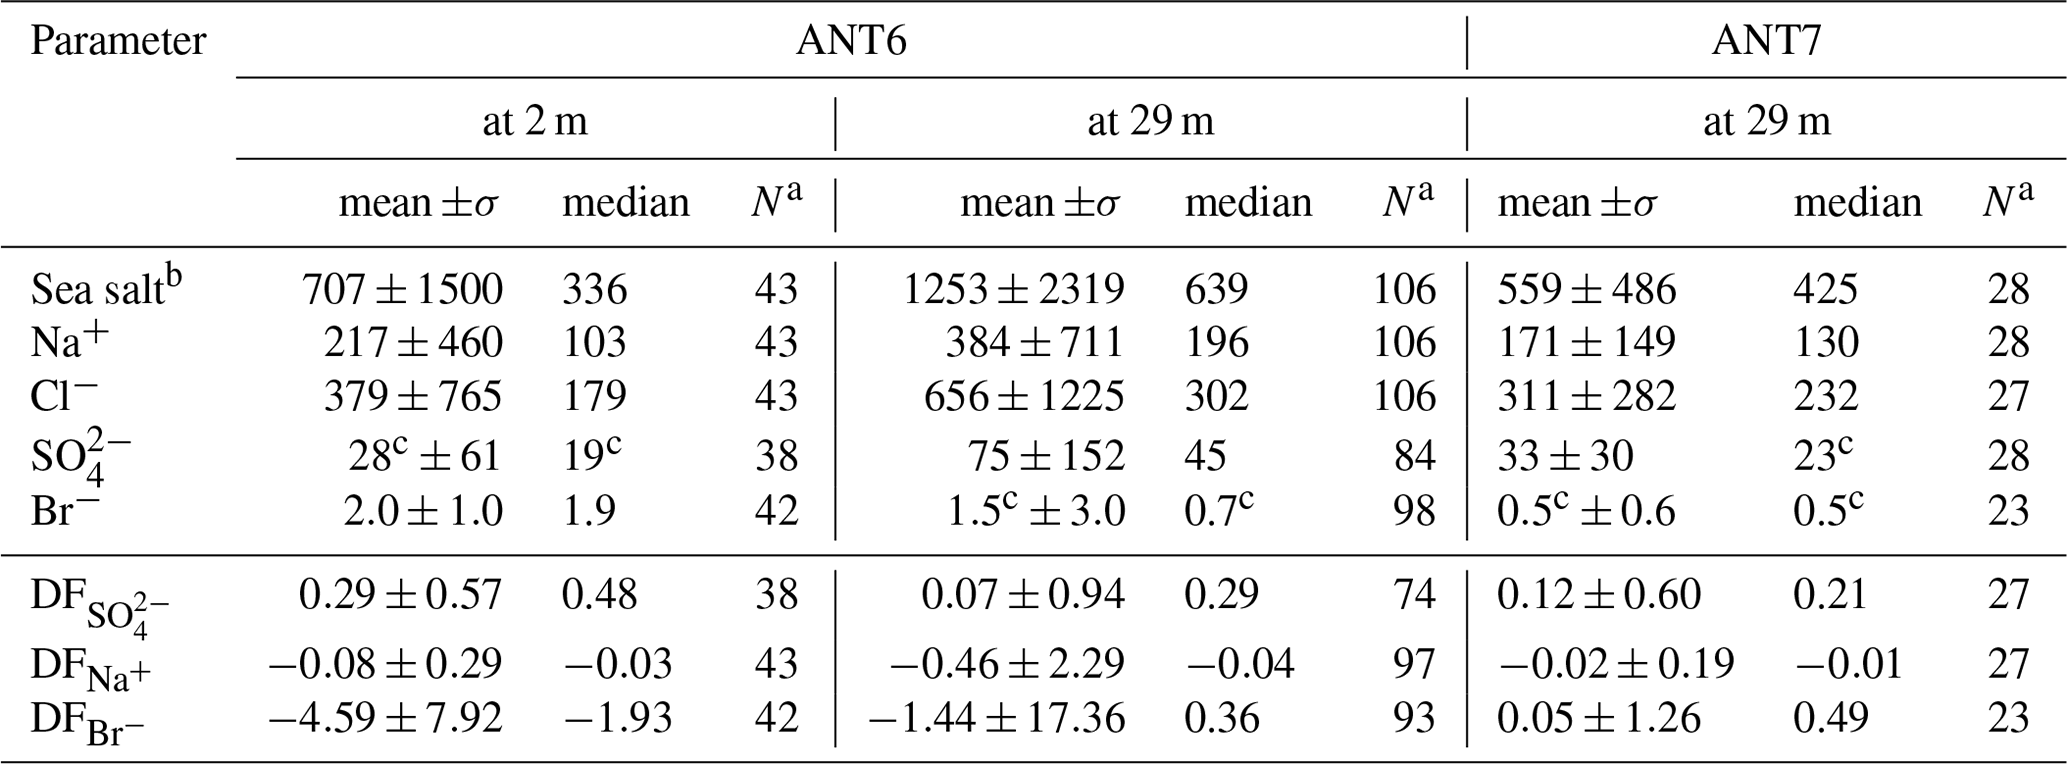
a Sample size. b Sea salt concentration is derived by multiplying the Na+ concentration by 3.262 based on the Na+ mass fraction in reference seawater following Millero et al. (2008). c Below the estimated LOD (Table 3).
3.2 The sea ice source of aerosol
Below we discuss aerosol properties characteristic for a sea ice source from blowing snow, including the chemical fractionation of and Br− as well as aerosol size distributions observed above sea ice.
3.2.1 Chemical fractionation of
In non-summer months when biogenic non-sea-salt is at a minimum, Antarctic aerosol was observed to be depleted in (relative to Na+) and in Na+ (relative to Cl−) (Wagenbach et al., 1998; Legrand et al., 2017). Similar fractionation in brine and frost flowers in the sea ice nearby attributed to precipitation of the mineral mirabilite (Na2SO4⋅10 H2O) suggested that the observed SSA must originate from the sea ice and not from the open ocean (Wagenbach et al., 1998; Rankin et al., 2000). Here we show for the first time that snow on sea ice is depleted in sulfate (Fig. 4a). of most snow samples was positive, showing large scatter and no particular dependence on snowpack depth or sea ice age (Fig. 4a). Negative suggests presence of mirabilite precipitated during freezing. The median volume-integrated in snow ranged between 0.24 and 0.35 (Table 5), overlapping with the sulfate depletion found in aerosol during the period the snow was sampled (ANT6) with median ranging between 0.29 and 0.48 (Table 4). Considering all values, no statistical difference is detected between snow and aerosol based on the Wilcoxon rank-sum test (p<0.01). The similarity of sulfate depletion in both snow and aerosol strongly suggests that snow sea ice in the Weddell Sea is the dominant source of regional sea salt aerosol.
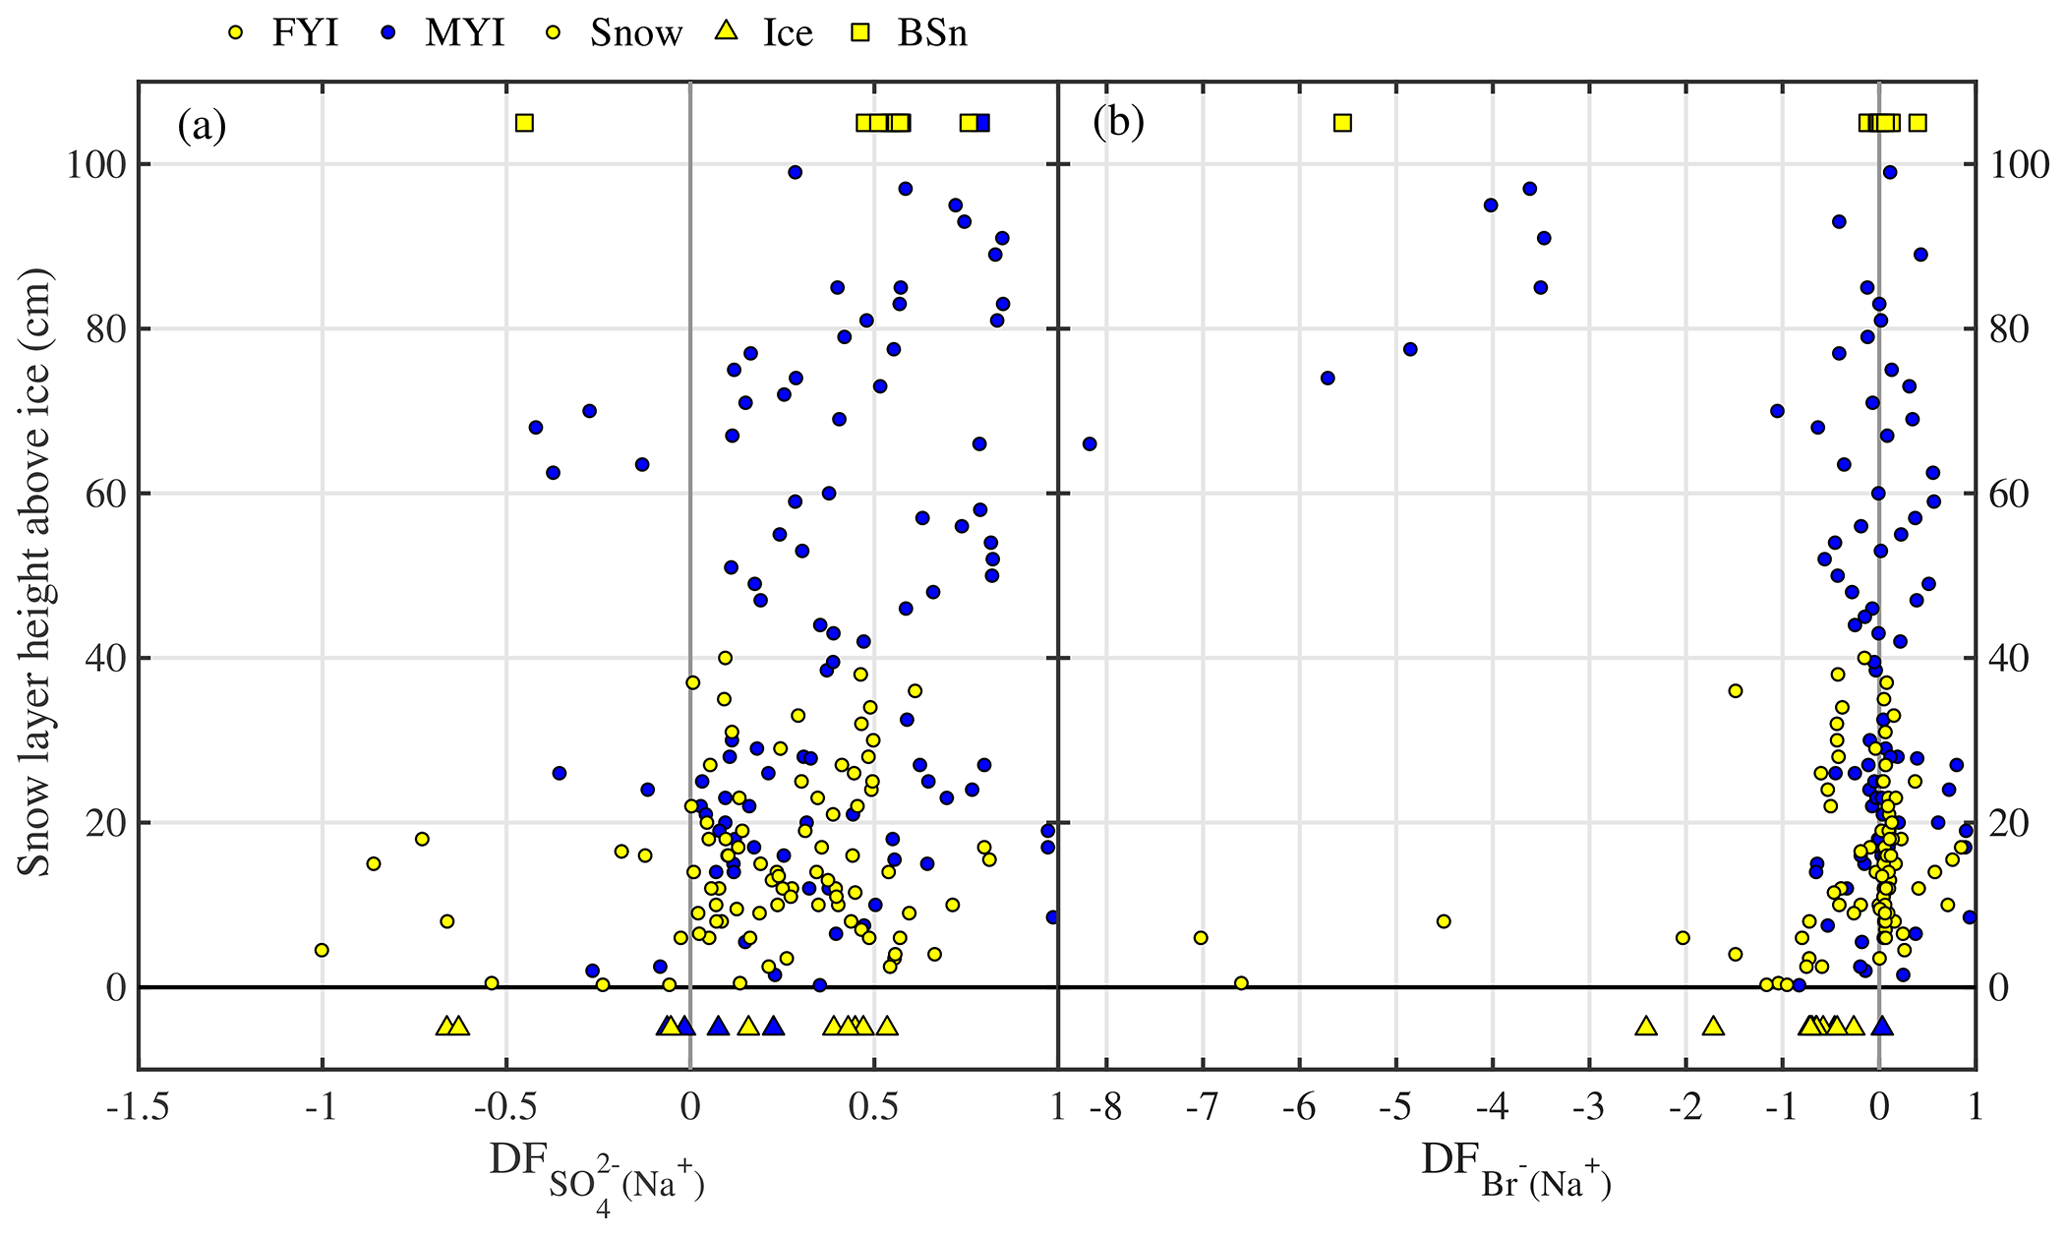
Figure 4Chemical fractionation of snow on sea ice in the Weddell Sea during austral winter 2013. Panel (a) shows sulfate depletion factors (relative to Na+) of snow on first-year sea ice (FYI, yellow symbols) at ice stations S1–6 and multi-year sea ice (MYI, blue symbols) at ice stations S7–9 in the Weddell Sea as a function of snow layer height above the sea ice surface. For comparison, of the sea ice surface (triangles) and blowing snow at 1–17 cm above the snowpack (squares) are shown as well. Panel (b) shows the same but for bromide depletion factors (relative to Na+). The sample statistics are summarized in Table 5.
Table 5Descriptive statistics of the volume-integrated snow chemistry during ANT-XXIX/6 on first-year sea ice (FYI) at ice stations S1–S6, on multi-year sea ice (MYI) at ice stations S7–9 and for snow layers within 10 cm of the snow surface (TOP10). Ion and sea salt concentrations are in units of microgram per gram (µg g−1). See Sect. 2.3 for definition of depletion factors (DF).
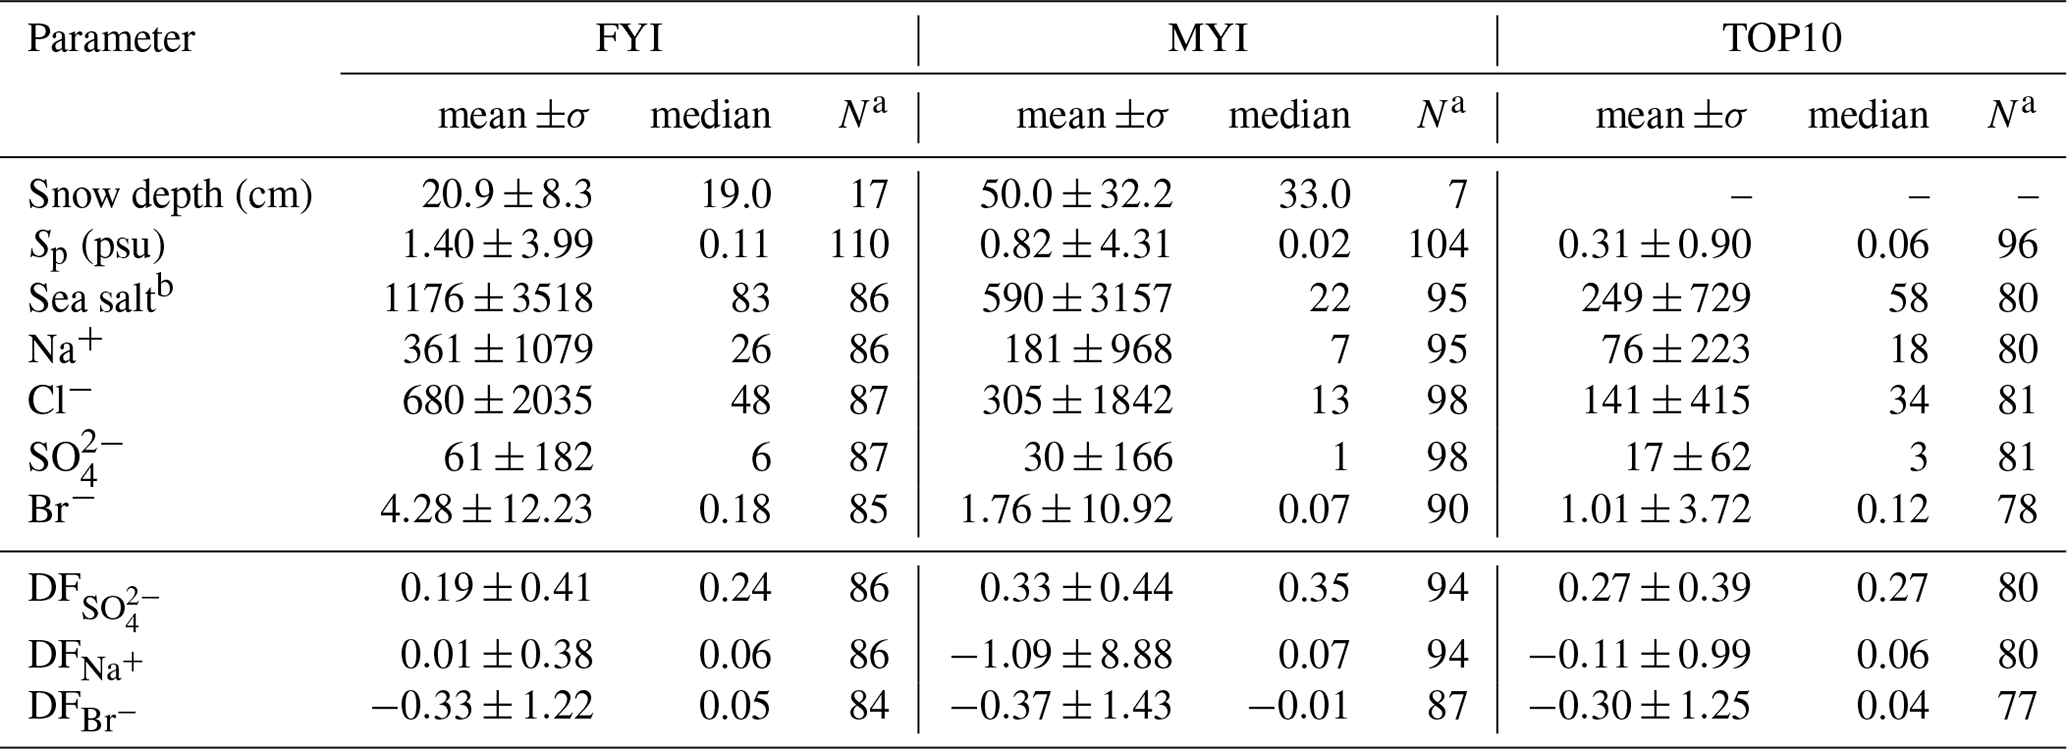
a Sample size. b Sea salt concentration is derived by multiplying the Na+ concentration by 3.262 based on the Na+ mass fraction in reference seawater following Millero et al. (2008).
The sulfate depletion observed in aerosol and snow (Figs. 2f, 4a) is consistent with mirabilite precipitation. Mean temperatures during all ice stations except S3 were below the −6.4 ∘C threshold of mirabilite precipitation (Table 1). And a recent lab study found that mirabilite precipitation results in of 0.93 in seawater brine cooled down to −20.6 ∘C (Butler et al., 2016). Conversely, in snow or aerosol suggests contributions from non-sea-salt or crystallized mirabilite, which has a of −7.3. The latter is supported by the observation that most values occur in or near the sea ice surface, where most of the partitioning between brine and mineral is expected to have occurred during freezing (Fig. 4a). If the partitioning of crystallized Na2SO4⋅10 H2O between brine and the snow–ice matrix is the dominating fractionation process, then Na+ should be depleted as well in the brine. Further Na+ depletion may arise from the precipitation of hydrohalite (NaCl⋅2 H2O) once ambient temperature drops below the threshold of −22.9 ∘C (e.g. Butler et al., 2016), which occurred here during some periods of time (Fig. 2b, Table 1). In the analysis below, however, we consider only the precipitation of mirabilite. Following the approach of Wagenbach et al. (1998) we take Cl− as the reference species for bulk seawater and find from a mass balance calculation that the Cl− to Na+ mass ratio would then be linearly related to the to Na+ ratio with a slope of −0.98 and an intercept of 2.04. From that a theoretical relationship between (with respect to Cl−) and (with respect to Na+) is derived and compared to observations (Fig. 5). The observed fractionation is largely in agreement with the model prediction. Snow on sea ice follows closely the theoretical mirabilite fractionation line, whereas aerosol shows large scatter and a tendency to apparent Na+ enrichment with respect to Cl− of up to 20 %, equivalent to Cl− depletion with respect to Na+ of 17 % (Fig. 5). Dechlorination of sea salt aerosol observed in Antarctica has a maximum in spring/summer, when gaseous acidic species (nitric, sulfuric and methanesulfonic acid) are available to replace chloride on sea salt aerosol (Wagenbach et al., 1998; Rankin and Wolff, 2003; Legrand et al., 2017). Acidic sulfur species are close to zero during winter in coastal Antarctica, e.g. at Neumayer (Weller et al., 2011), whereas nitric acid is low but non-zero, e.g. 1–2 pptv, at Halley (Jones et al., 2011). Thus, nitric-acid-induced Cl− loss from sea salt is a plausible explanation for the observed Cl− depletion either in airborne SSA or as a sampling artefact from sea salt already accumulated on the filter surface as suggested previously (Wagenbach et al., 1998; Legrand et al., 2017). Unfortunately no usable filter data of aerosol nitrate are available from this study to further test the association between nitrate and sea salt due to a very high lab procedure blank. It is noted that if all sulfate is removed by mirabilite precipitation () then sodium depletion reaches a theoretical maximum of ∼12 % () (Fig. 5).

Figure 5Theoretical relationship between depletion factors of sodium (relative to Cl−) and of sulfate (relative to Na+) in freezing seawater if mirabilite (Na2SO4⋅10 H2O) is progressively precipitated and instantaneously removed (red line). When all sulfate is removed () sodium depletion reaches its theoretical maximum (. See Sect. 2.3 for definition of depletion factors (DF), which are zero in reference seawater (RSW) (dashed black lines). Data refer to all observations from this study in snow (solid symbols) and aerosol at 2 and 29 m above the sea ice surface (open symbols).
The median values of bulk aerosol observed during this study were smaller than previous winter observations at coastal Antarctic sites, where the sea ice surface was shown to be the dominant source of sea salt aerosol. Wagenbach et al. (1998) reported sulfate depletion in aerosol corresponding to of 0.72 at Halley (75∘ S, 26∘ W), of 0.76 at Neumayer (70∘ S, 85∘ W) and of 0.62 at Dumont d'Urville (66∘ S, 140∘ E). The main cause of smaller observed in aerosol above the Weddell Sea in winter 2013 appears to be the snow source being less depleted in sulfate during that particular year. In summary, in Antarctic winter aerosol can be used as a tracer to estimate sea ice SSA fractions of the total aerosol burden at a specific location (e.g. Legrand et al., 2017); however, temporal and spatial variability in of the sea ice source introduce additional uncertainty if not accounted for.
3.2.2 Chemical fractionation of Br−
Modelling studies suggest that sea salt may be an important source of atmospheric bromine species in the mid- to high southern latitudes and that SSA from blowing snow releases bromine (Yang et al., 2008, 2010), driving ozone depletion events observed during or after snow storms (Jones et al., 2009). One of a number of processes identified to cause halogen release from aerosol or ice surfaces involves the reaction of HOBr with halides (Br− and Cl−) on acidic ice surfaces forming BrCl and Br2, which are subsequently photolysed to form reactive halogen atoms (Abbatt et al., 2012, and references therein). This is a multi-phase process which, depending upon the substrate, may or may not proceed faster under acidic conditions (Abbatt et al., 2012), and associated uncertainties are currently still significantly limiting the modelling of impacts on tropospheric halogen chemistry (Sander et al., 2003; Long et al., 2014). Multi-phase bromine chemistry models use observed sea salt aerosol depletion of bromide relative to sodium (or chloride) with respect to seawater composition, i.e. bromide depletion factors , to estimate the bromine flux from sea salt aerosol (e.g. Yang et al., 2008; Long et al., 2014). However, to date observations of bromide aerosol depletion are only available from north of 55∘ S (Sander et al., 2003, and references therein), with the exception of two recent pioneering studies in Antarctica (Legrand et al., 2016; Hara et al., 2018). Below we discuss bromine chemistry observations above the Weddell Sea during this study.
Bulk aerosol concentrations of bromide ranged between <1 and 19 ng m−3 (Fig. 6a), showing occasional large increases to levels seen elsewhere in coastal Antarctica only during summer (Legrand et al., 2016). However, median bulk aerosol concentrations of Br− (Table 4) were similar to coastal observations at Dumont d'Urville during winter (Legrand et al., 2016). It should be borne in mind that the bromide aerosol concentrations were often below the estimated LOD due to the short filter exposure times employed (Fig. 6a). Median bromide concentrations in snow ranged between 0.07 and 0.18 µg g−1 (Table 5). Median values show that aerosol at 29 m was strongly depleted in bromide relative to sodium with respect to seawater, whereas aerosol near the sea ice surface at 2 m showed mostly strong enrichment (Table 4, Fig. 6b). Median in the snowpack ranged between −0.01 and 0.05, suggesting overall no or small depletion in bromide (Table 5). However, examination of individual snow layers as well as blowing-snow samples shows large scatter with both positive and negative , suggesting both bromide depletion and enrichment (Fig. 4b). The sea ice surface below the snow was with the exception of one sample always enriched in bromide (Fig. 4b). During the storm on 14–15 July (see Sect. 3.3.2) it is found that the median in blowing snow collected on 15 July at <1 m was close to zero but 0.39 in aerosol at 29 m sampled over the same time interval. These observations are in agreement with previous studies in coastal Antarctica: Legrand et al. (2016) were the first to report year-round bromide depletion in aerosol at Dumont d'Urville (DDU), including during winter months except June. At Syowa Station, Hara et al. (2018) also observed bromide depletion in aerosol year-round, but not in blowing snow, which was enriched. They concluded that heterogeneous chemistry driving bromine activation occurs on sea salt aerosol and not on blowing snow. Lieb-Lappen and Obbard (2015) observed bromide depletion in blowing snow near McMurdo station but only at >5 m above the surface.
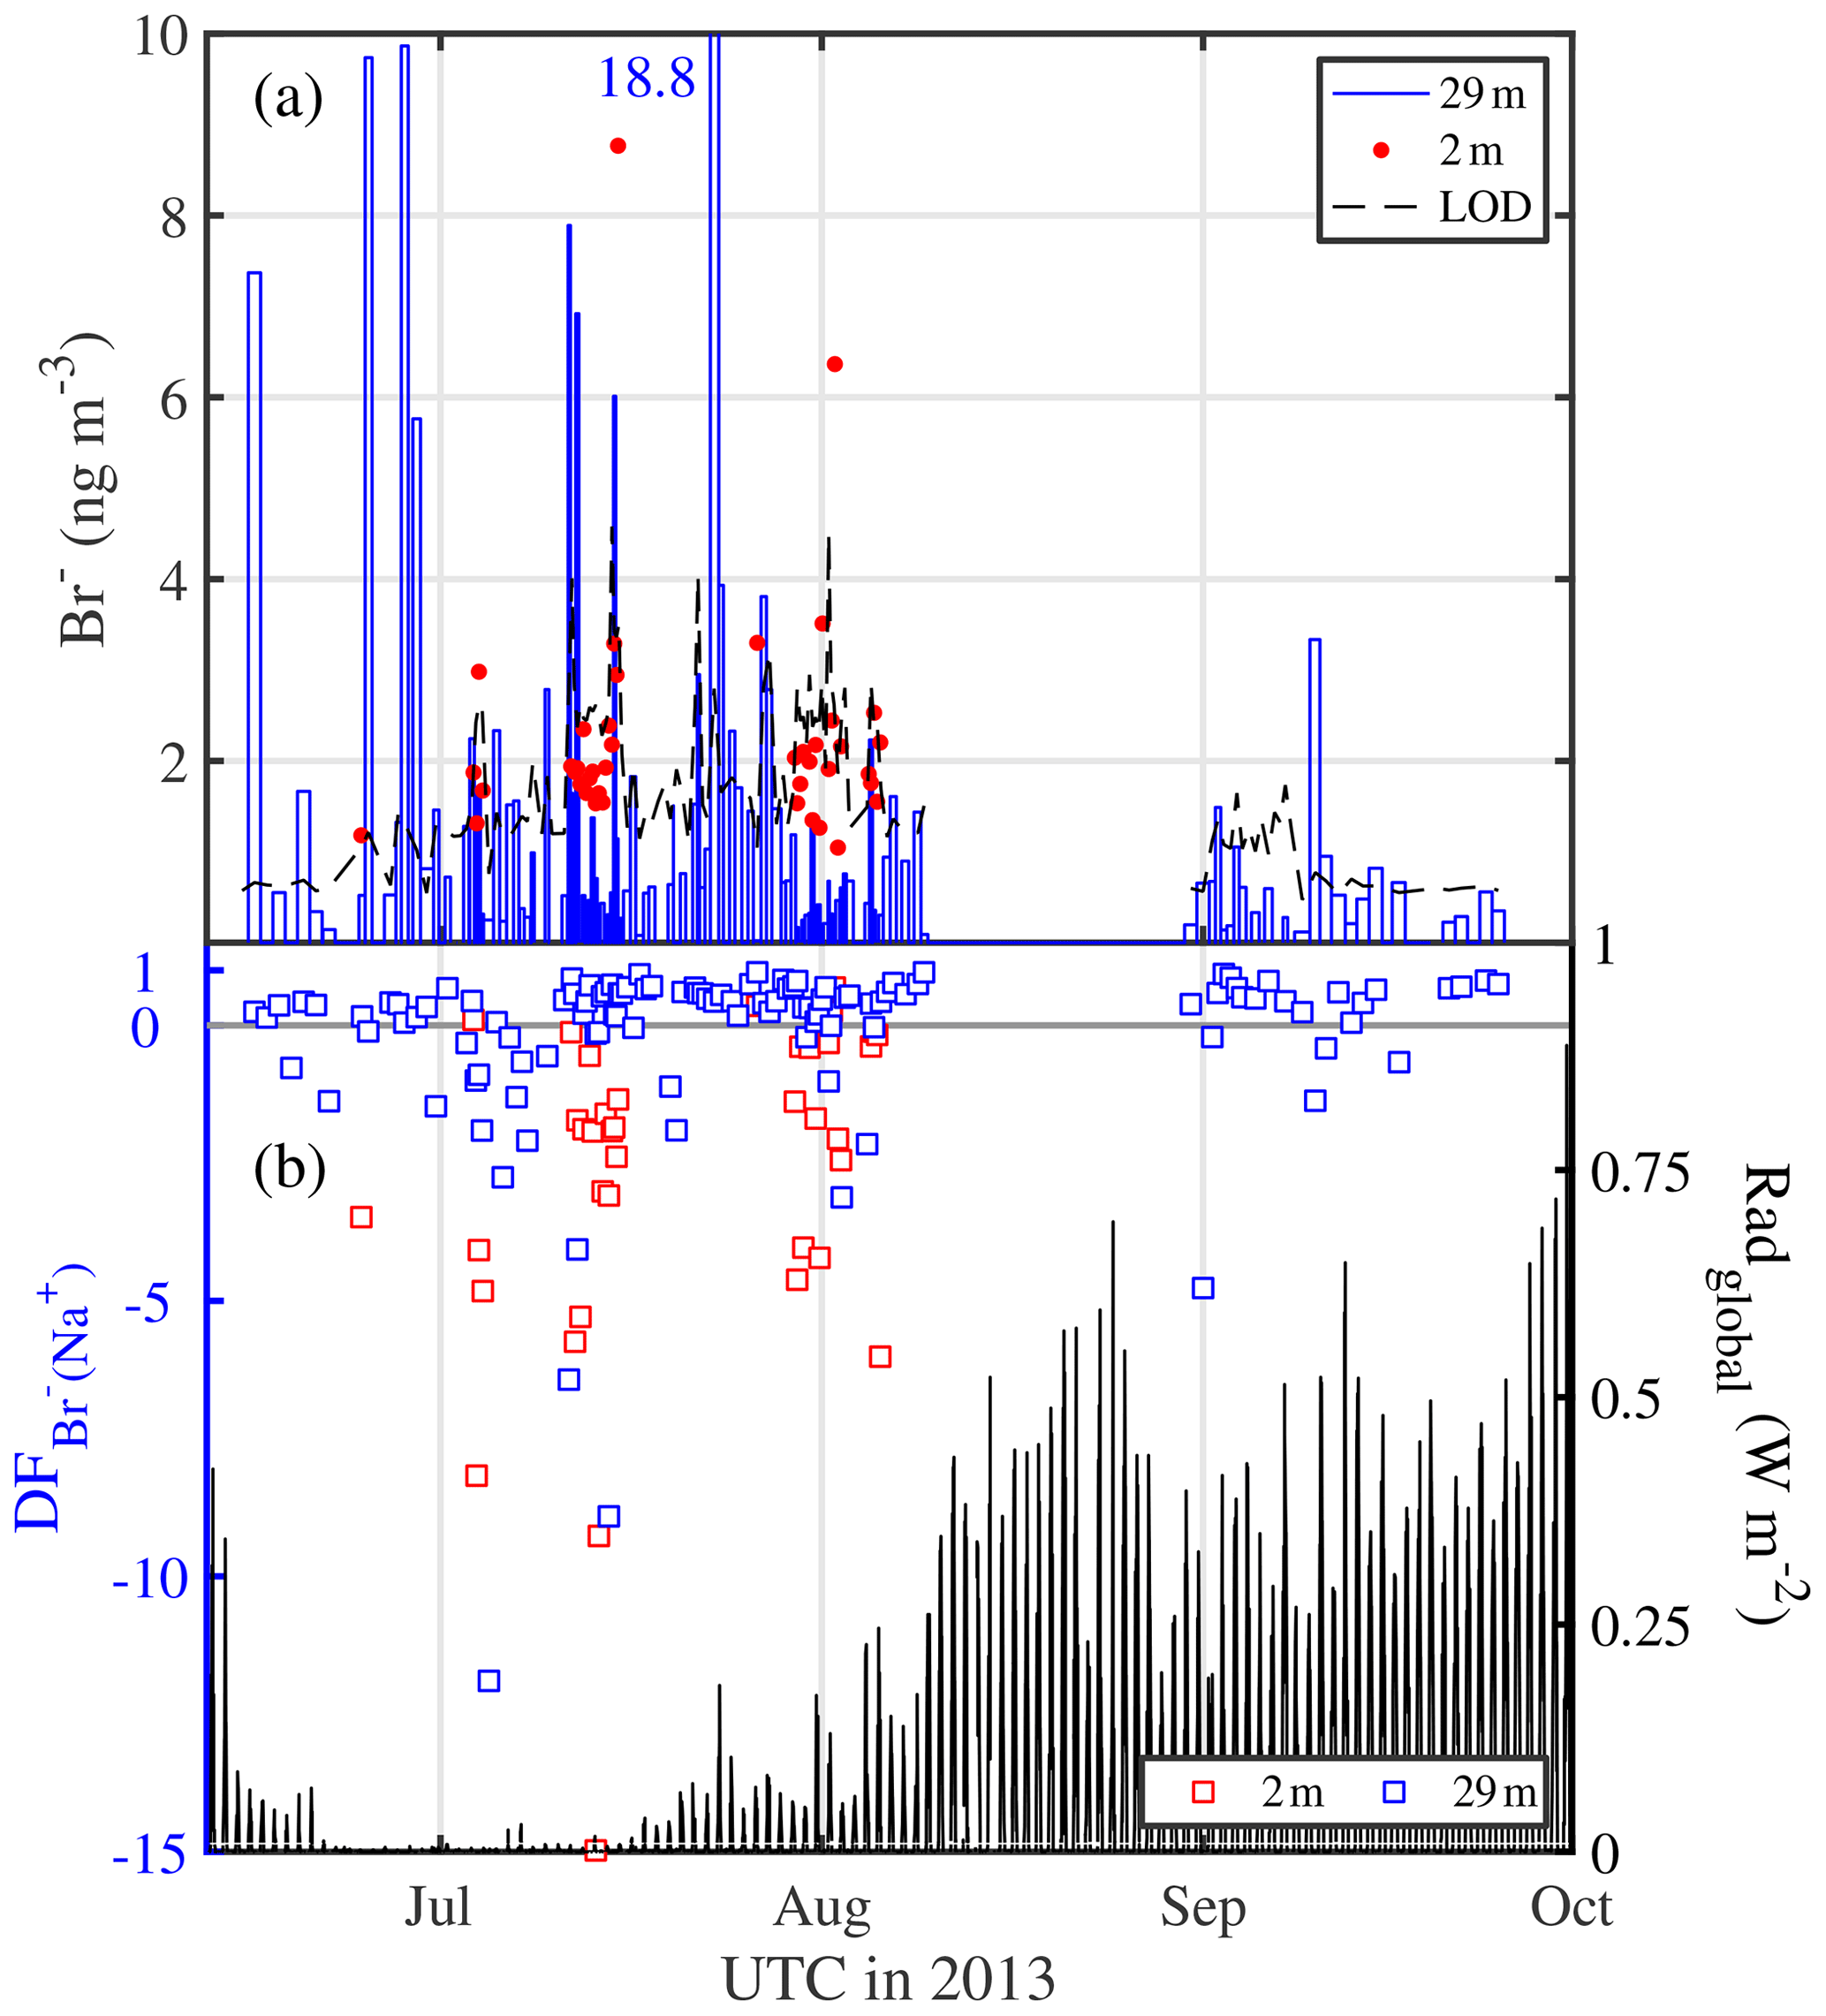
Figure 6Aerosol bromine chemistry above sea ice observed in the Weddell Sea during austral winter/spring 2013. (a) Aerosol Br− concentrations at 29 and 2 m with the dashed line indicating the theoretical LOD (Table 3); (b) depletion factors of bromide (relative to Na+) in aerosol at 29 and 2 m and global radiation to indicate light conditions.
From this study it is concluded that air–ice recycling of bromine occurs on surface snow, airborne snow and aerosol particles. However, the vertical gradient in observed in aerosol suggests that significant net bromine release must take place in the aerosol phase between 2 and 29 m above the sea ice surface. The bromine net release from large snow particles is expected to be reduced compared to aerosol due to a combination of shorter atmospheric lifetime and smaller specific surface area limiting diffusional outgassing. The bromine release from SSA produced by blowing snow may be more efficient because it has a large fraction of micron- to submicron-sized particles (see Sect. 3.2.3) and resides at the well-ventilated top of the blowing-snow layer. Thus sea salt aerosol from blowing snow provides an additional bromine reservoir, which is readily depleted. Detailed measurements of participating bromine species in air, snow and aerosol are needed to further understand relevant processes and constrain the mass budget.
Models assume a dependence of on season and aerosol diameter (Yang et al., 2008; Sander et al., 2003). The observed of aerosol showed a weak but significant trend (R=0.19, p<0.05) from winter into spring largely due to less frequent negative values during August and September (Fig. 6b, Table 4). This becomes more evident considering monthly median values of aerosol at 29 m, which increased from June (0.25) to July (0.43), to August (0.50) and into September (0.59). values would be even higher had they been referenced to a seawater ratio adjusted for the maximum possible removal of sodium due to precipitation of mirabilite as done by Legrand et al. (2016). For comparison, at DDU in bulk aerosol increased gradually from a minimum in June (0.04) to intermediate values in July to September (0.22–0.39) to a maximum in October (0.42) (Legrand et al., 2016). Increasing is consistent with enhanced bromine loss from aerosol as incident radiation increases concurrent with activation of the reactive bromine (BrOx) cycle (Fig. 6b). Assuming that observed is representative of SSA with median particle diameters dp of ∼0.60–0.66 µm (Table S2), it is also found that the observed bromide depletion is larger than that reported by Sander et al. (2003), who state a maximum of 0.4 for a dp of 1.3 µm, dropping to 0.1 at 10 µm.
Contrary to expectation bromide depletion of aerosol was significant even during winter darkness from mid-June to mid-July (Fig. 6b), whereas previous observations at DDU showed a similar trend but less bromide depletion and none in June (Legrand et al., 2016). Light conditions are unlikely a cause of differences in bromide depletion, since DDU is located at a similar latitude (66∘40′ S) to the area covered by this study. However, the early laboratory study by Oum et al. (1998) has shown that HOBr required for Br− oxidation can be chemically produced in darkness through the reaction of ozone with bromide, a reaction which takes place most rapidly at the air–substrate interface, where acidity plays a minor role (Abbatt et al., 2012, and references therein), and where it was recently observed to occur at neutral pH for the case of an aqueous-phase–vapour interface (Artiglia et al., 2017). Furthermore, field observations during the ANT-XXIX/6 expedition show significant bromoform (CH3Br) production in sea ice during winter darkness (Abrahamsson et al., 2018), which requires HOBr (and organic matter) as precursors, and therefore indicates that bromine loss processes were active in the sea ice in the absence of sunlight. It therefore appears plausible that the same reactions may have caused significant bromide depletion observed here in aerosol above sea ice.
3.2.3 Aerosol size distributions
Average aerosol number density and volume distributions observed in the Weddell Sea show that during calm conditions (U10 m<4 m s−1) concentrations across most of the size spectrum were smaller above sea ice than above the open ocean (Fig. 7). Depending on particle size the variability was relatively large as illustrated by the standard deviation of the mean values (Fig. 7). Thus differences in mean size distributions were statistically significant only for dp<2 µm in the case of aerosol number density and dp 1–8 µm in the case of aerosol volume distributions (Fig. 7). The wind speed threshold chosen for calm conditions is well below the mean snowdrift threshold wind speed Ut of 7.1 m s−1 observed during this study (Sect. 3.4.1) and within the range when breaking of waves commences (3–4 m s−1; O'Dowd et al., 1997). Thus a lower aerosol background above sea ice compared to the open ocean during calm conditions is consistent with the inactivity of local sources from blowing snow or potentially open leads combined with the long distance between the ship's position and the nearest open water during 18 June to 21 July 2013 (Fig. 1, Table 1). During stormy conditions (U10 m>9 m s−1) average aerosol number densities above sea ice increased significantly for particle diameters dp<2 µm, reaching at the lower end of the size spectrum levels similar to those observed above the open ocean (Fig. 7a). The average aerosol volume distribution shows two modes, one at 1–2 µm and the other at 5–9 µm (Fig. 7b), indicating that most of the aerosol particle mass resides in the super-micron range as expected for sea salt aerosol. During storms average aerosol volume concentrations above sea ice also showed an increase, which is significant for particle sizes dp 0.8 to 9 µm (Fig. 7b).
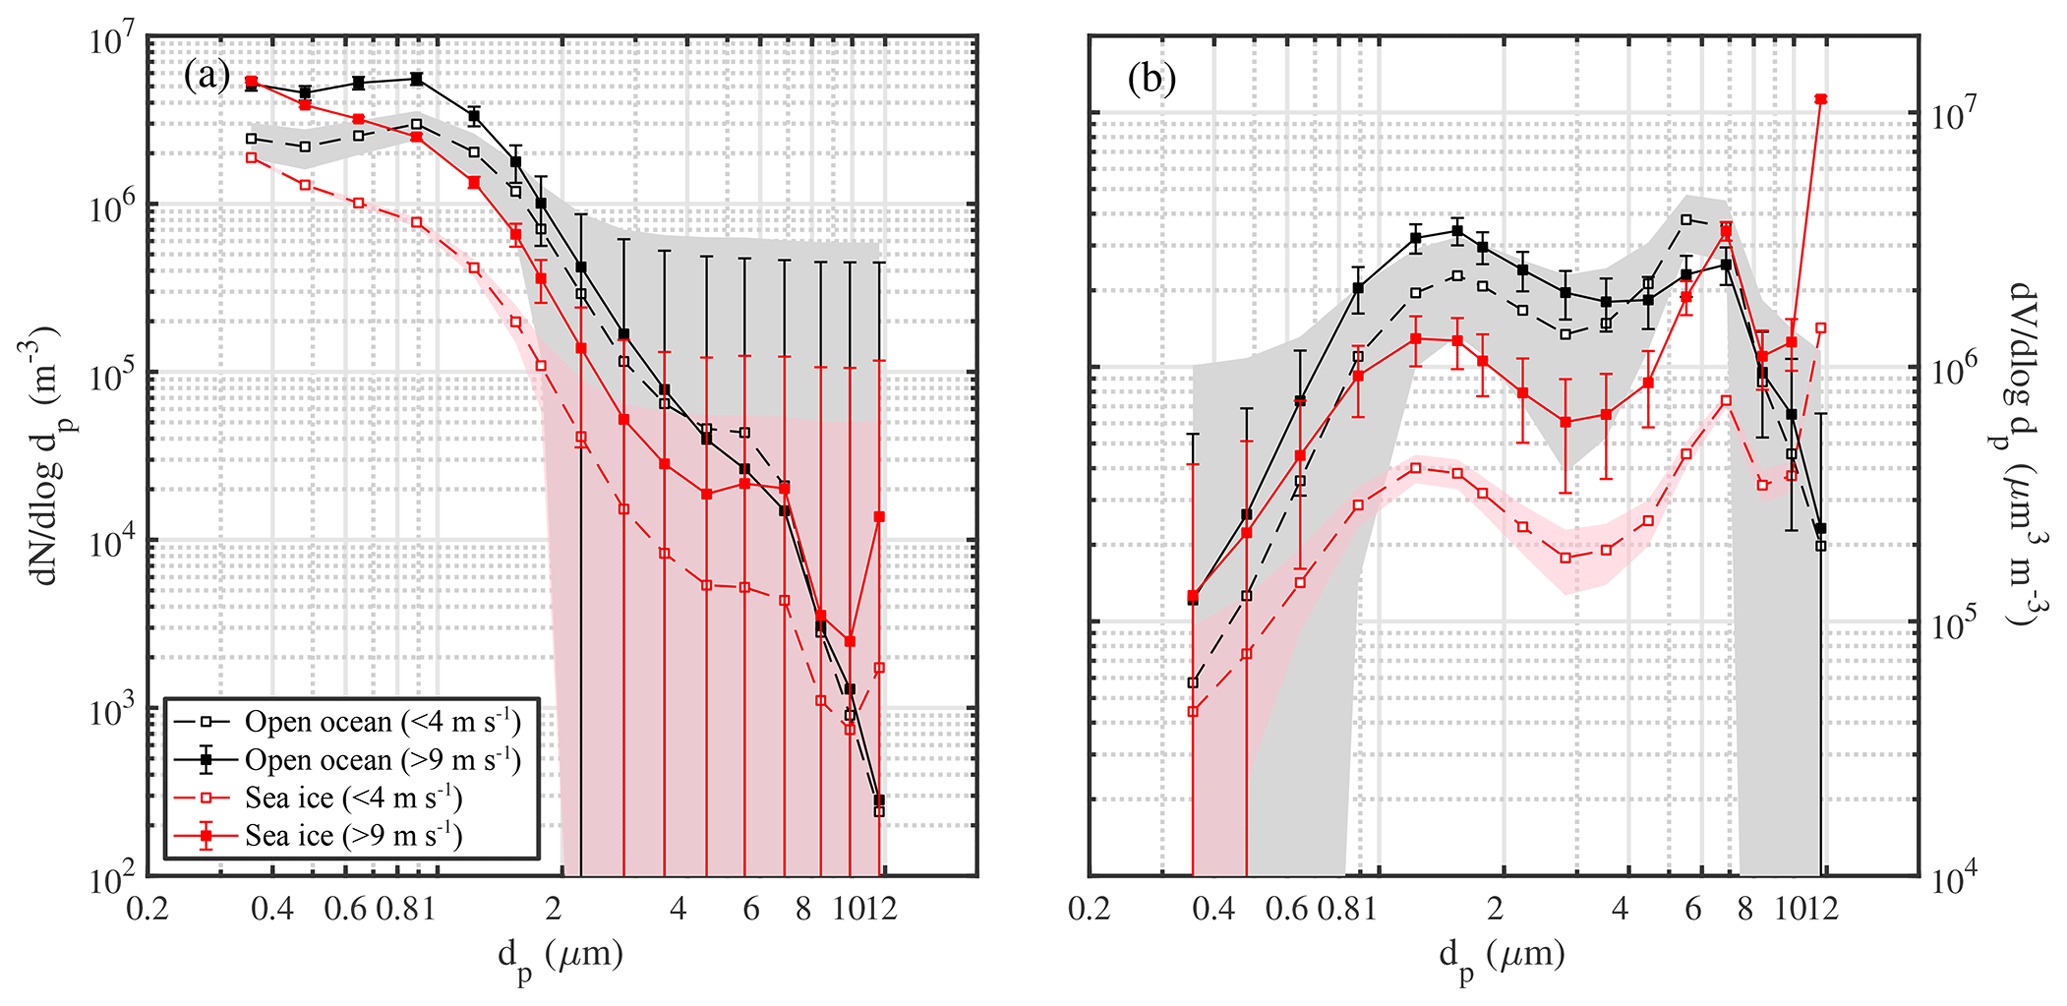
Figure 7Comparison of mean number distributions (a) and volume distributions (b) of aerosol above the open ocean (13 to 16 June 2013) and sea ice in the Weddell Sea (18 June to 21 July 2013) during calm (U10 m<4 m s−1) and windy (U10 m>9 m s−1) conditions. Shaded areas and error bars show the standard deviation of the mean during calm and windy conditions, respectively. Data included are observations from 29 m above the sea surface at ambient RH.
A significant increase in small particle number densities (dp<2 µm) during storms above sea ice (Fig. 7a; Sect. 3.3) is consistent with a blowing-snow SSA source based on physical arguments: snow particles of low salinity as observed during this study can generate a significant proportion of small sea salt particles after complete loss of water ice by sublimation. Assuming one snow particle produces one aerosol the dry particle diameter ddry is given by , where ρice and ρNaCl are densities of ice (=917 kg m−3) and NaCl (=2160 kg m−3), respectively. Taking the medians of salinity observed in surface snow (=0.06 psu) and of mean snow particle size (=115–129 µm) (Tables 5, 6), we would then expect a potential median ddry of 3–4 µm.
Table 6Summary of snow particle size distribution properties during blowing snow, i.e. when U10 m>Ut (=7.1 m s−1 as observed during this study): median, lower (Q0.25), and upper quartile (Q0.75) of particle mean diameter (=α β) in micrometres (µm) and shape parameter α, both derived from fitting a two-parameter gamma probability density function (Eq. 5) to observations; Δt is total sampling time. Note that the parameter range based on near-surface measurements is representative of blowing snow, whereas that based on measurements at 29 m has additional uncertainties due to precipitating snow (see text).
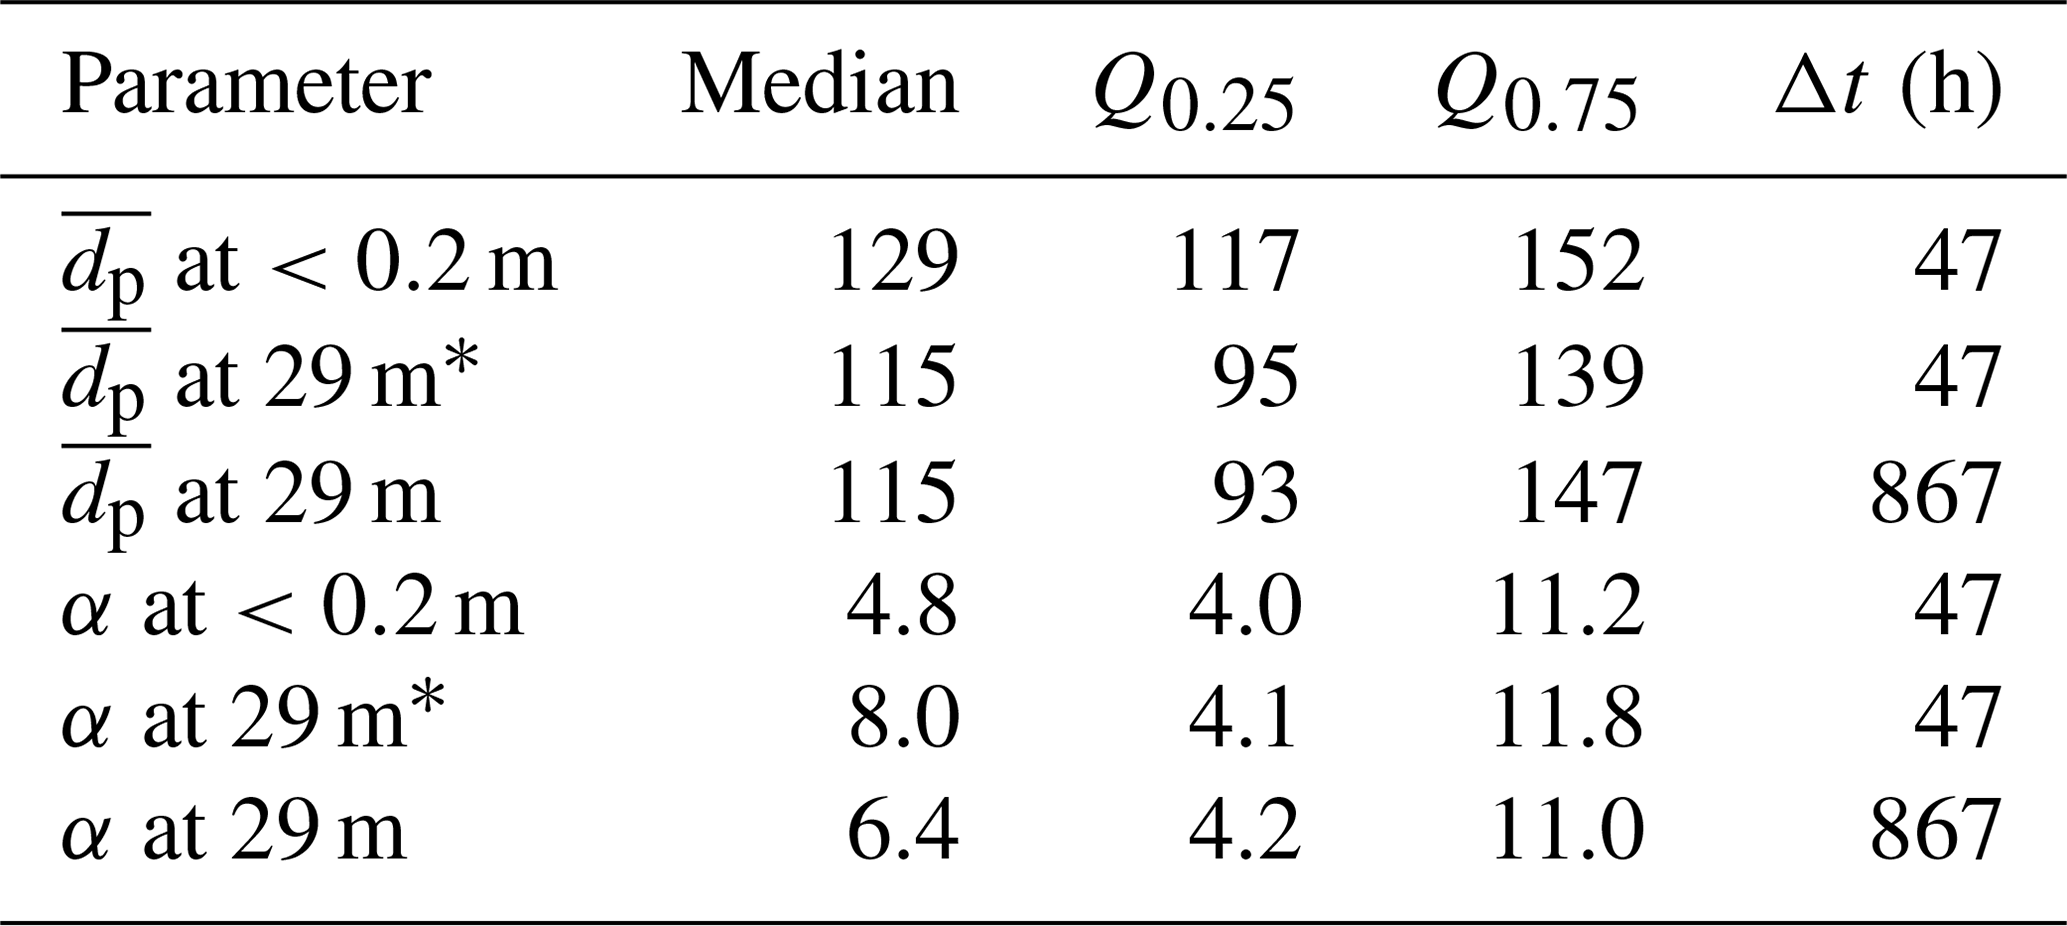
* Including only data when also measurements at <0.2 m are available during blowing snow (U10 m>Ut).
It is striking that the relative increase in aerosol number densities (dp<2 µm) during storms was larger above sea ice compared to the open ocean with mean enhancements by a factor of ∼3.2 and ∼1.8, respectively (Fig. 7a). Similarly, the relative increase in aerosol volume concentrations (dp 1–8 µm) during storms was larger above sea ice compared to the open ocean with mean increases by a factor of ∼3.6 and ∼1.2, respectively (Fig. 7b). The above highlights the importance of a winter time sea ice source for the aerosol burden above sea ice. For comparison, the absolute increase in aerosol number densities (dp<2 µm) during storms above sea ice was larger compared to the open ocean only for the two smallest size bins (dp 0.36–0.48 µm) (Fig. 7a). And the absolute increase in aerosol volume concentrations (dp 1–8 µm) during storms above sea ice was larger compared to the open ocean only for the larger particle sizes (dp 3.5–6.9 µm) (Fig. 7b). This suggests that to a first order corresponding aerosol number and mass fluxes during storms above sea ice can rival those above the open ocean depending on particle size. Direct flux measurements are needed to further corroborate these findings under varying environmental conditions.
3.3 Blowing-snow events
Below we discuss key features of blowing-snow events and associated SSA increases that were frequently observed during ANTXXIX-6 (Fig. 2c). A total of seven events occurred during the 14 d of total time spent at ice stations. Two periods, one lasting 7 d and another 10 d, were chosen based on data coverage.
3.3.1 Period 23 June to 3 July 2013
The period 23 June to 3 July featured a major storm with four wind speed maxima between 15 and 25 m s−1 centred around midnight of the 24, 25, 27 and 28 June (Fig. 8a). Temperature Ta increased during that time from −20 ∘C on 23 June to −3 ∘C on 26 June before dropping again to −20 ∘C on 30 June (Fig. 2b). Wind speed U extrapolated to 10 m increased from <5 m s−1 in the late evening of 23 June over a 24 h period to >20 m s−1 (Fig. 8a). The first snow particles were detected at 29 m once U exceeded a threshold of ∼9 m s−1, with spectral number densities N46−478 reaching values on the order of 104 m−3, including large snow particles with dp>300 µm (Fig. 8b). Near-surface N46−478 measured at ice station S2 on 24 June (Table 1) showed very large number densities on the order of 106 m−3 across the entire particle size spectrum, confirming blowing snow from the sea ice surface as the main snow particle source (Fig. 8c). A decrease in wind speed U always concurred with a drop in snow particle number densities at 29 m and often also in RHice (25, 26 and 28 June), indicative of air being subsaturated with respect to ice (Fig. 8a, b).
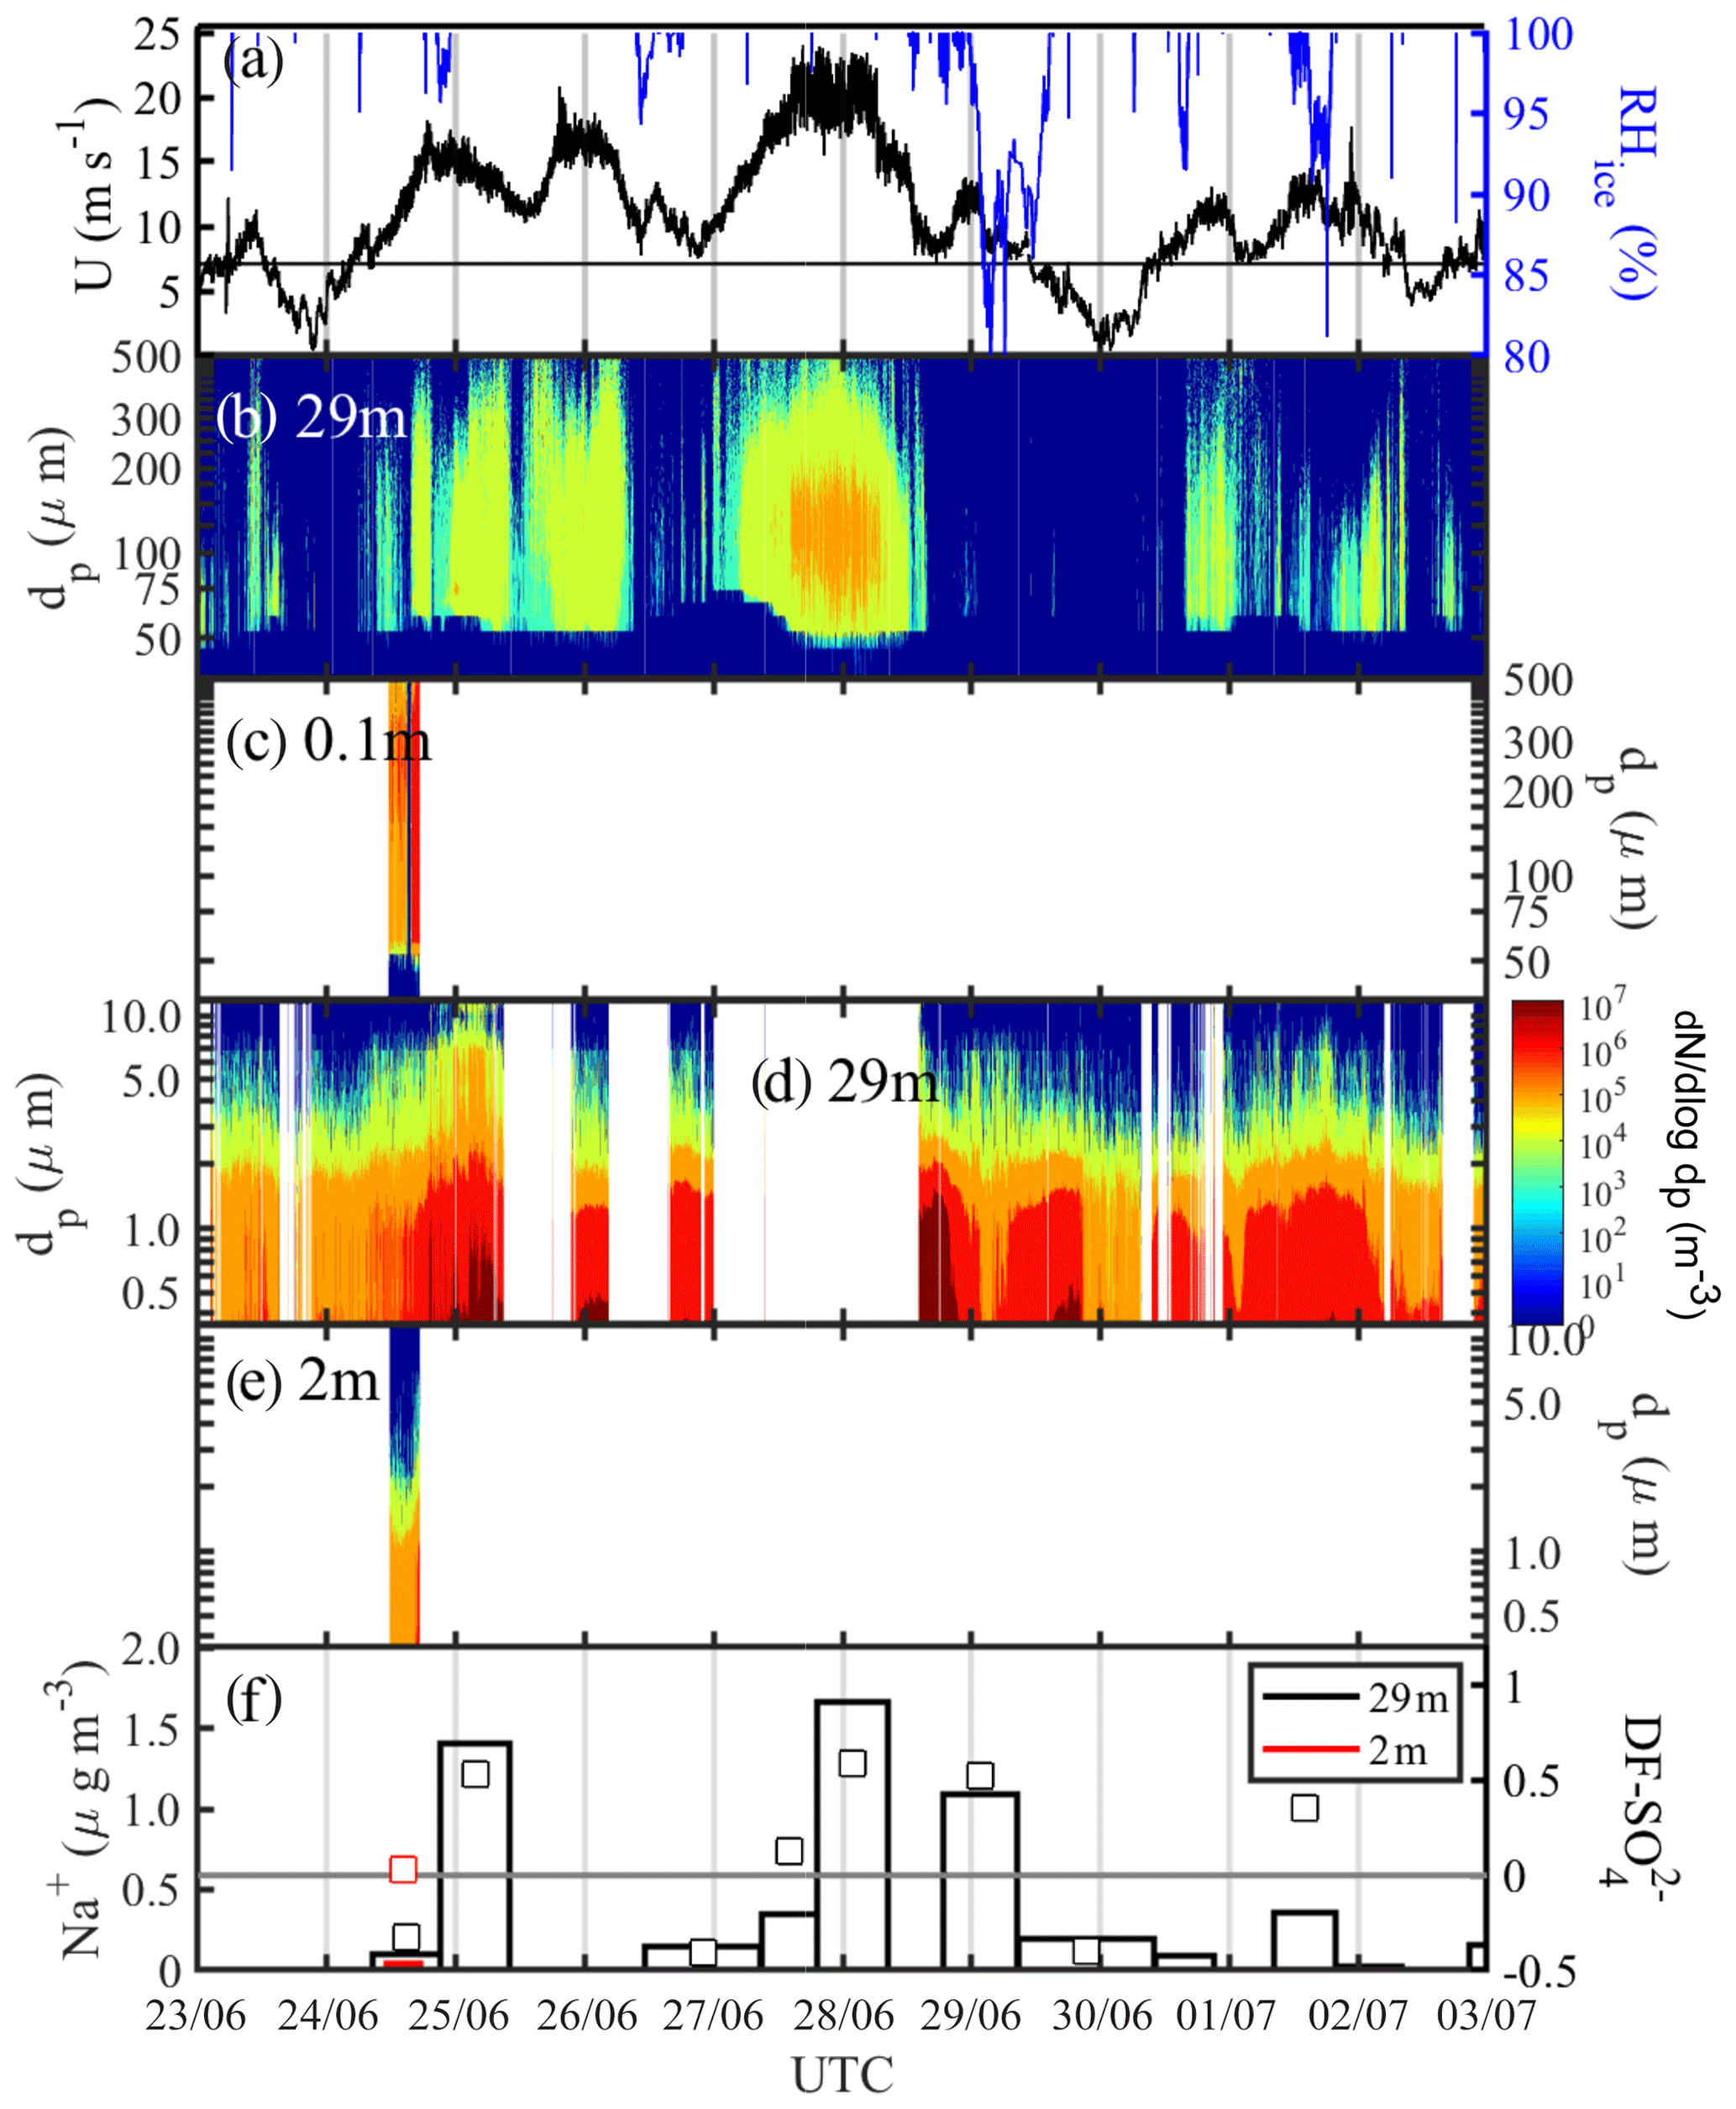
Figure 8Blowing-snow events during the 23 June–3 July 2013 period: (a) wind speed U extrapolated to 10 m with the horizontal black line showing the snow drift threshold wind speed Ut (Sect. 3.4.1) and RHice at 29 m; (b) snow particle size distribution dN∕log dp ( µm) at 29 m and (c) at 0.1 m; (d) aerosol size distribution dN∕log dp ( µm) at 29 m and (e) at 2 m; dark blue shading indicates zero particle counts and white background that no data are available. (f) Aerosol Na+ concentrations (vertical bars) and sulfate depletion factor (open symbols) at 29 and 2 m, respectively.
Aerosol at 29 m showed background spectral number densities N0.4−12 of 105 m−3 for particles with dp<2 µm during the calm periods on 23 June, 30 June and 2 July (U39 m<5 m−1), when no blowing snow or precipitation was present (Fig. 8d). During or after the four wind speed maxima on 24, 25, 27 and 28 June, large increases in aerosol spectral number densities were observed especially of submicron-sized particles reaching up to 107 m−3, often at RHice<100 % (Fig. 8a, d), consistent with a source from sublimating snow particles with low salinity (Sect. 3.2.3). Near the surface spectral number densities N0.4−12 for particles with dp<2 µm during the storm on 24 June remained at 105 m−3, i.e. lower than those seen at 29 m (106 m−3), likely due to scavenging of aerosol by snow particles (Fig. 8d, e). Na+ concentrations in aerosol at 29 m show strong increases from background values of ∼0.1 to 1.4 µg m−3 on 25 June and to 1.1–1.7 µg m−3 during 28–29 June, coinciding with wind speed maxima and increased number densities of aerosol and snow particles (Fig. 8). Na+ concentrations returned to background values after the storm on 30 June, coinciding with low wind speeds U39 m<5 m s−1, a reduction in aerosol number concentrations and the absence of any airborne snow particles (Fig. 8). Na+ concentrations also dropped to background values during the storm on 26–27 June, consistent with the absence of blowing-snow particles due to wind speed falling below the drift threshold (Sect. 3.4.1) and a concurrent slight decrease in aerosol concentrations (Fig. 8). During the calm periods on 24, 26–27 and 29 June, of aerosol was negative or near 0, while during the storm episodes aerosol became increasingly more depleted in sulfate with maxima of 0.53–0.59 coinciding with peaks in aerosol Na+ concentration (Fig. 8f). In order to constrain the origin of the observed aerosol three snow pit profiles were sampled at ice station S2 on 24 June. The mean snow depth was 33 cm; bulk mean Na+ concentrations were 50, 6 and 17 µg g−1; and bulk median values were 0.30, 0.24 and 0.48, respectively. Assuming a linear mixing model and that measured snow chemistry at S2 is representative of the regional snowpack, the values in aerosol and snow suggest that up to 80 %–90 % of the sea salt aerosol observed during the storm originates from snow on sea ice. Negative in aerosol during calm periods may arise either from contamination by the ship's engine exhaust or contributions of non-local non-sea-salt (nss) . The local snowpack near ice station S2 was less likely to be a contributing source as only one snow pit showed some snow layers with .
3.3.2 Period 10 to 16 July 2013
From 10 to 16 July 2013, prior to and during ice station S6 (Table 1), three snow drift episodes on 11, 12 and 14 July 2013 as well as a major blowing-snow event from 14 to 16 July 2013 concurrent with strong warming were observed (Fig. 9). Starting on 14 July ambient temperature Ta rapidly increased over a 12 h period from to −1 ∘C (Fig. 2b). During the snow drift episodes wind speed extrapolated to 10 m, U10 m, peaked at 6–9 m s−1 (Fig. 9a) near or above the estimated snowdrift threshold (Sect. 3.4.1), and snow particle spectral number densities N46−478 reached up to 106 m−3 near the surface but remained relatively low at 29 m with 102–103 m−3 for dp<100 µm except on 11 July (Fig. 9b, c). During the blowing-snow event on 14–16 July, U10 m ranged between 13 and 18 m s−1 (Fig. 9a). Spectral number densities N46−478 reached again up to 106 m−3 near the surface but 104 m−3 at 29 m for particle diameters dp 50–200 µm (Fig. 9b-c). The air within 2 m of the surface was supersaturated with respect to ice during drifting or blowing snow but then became undersaturated towards the end of the snow drift episodes on 11 and 12 July as wind speed and snow particle concentrations decreased (Fig. 9a–c).
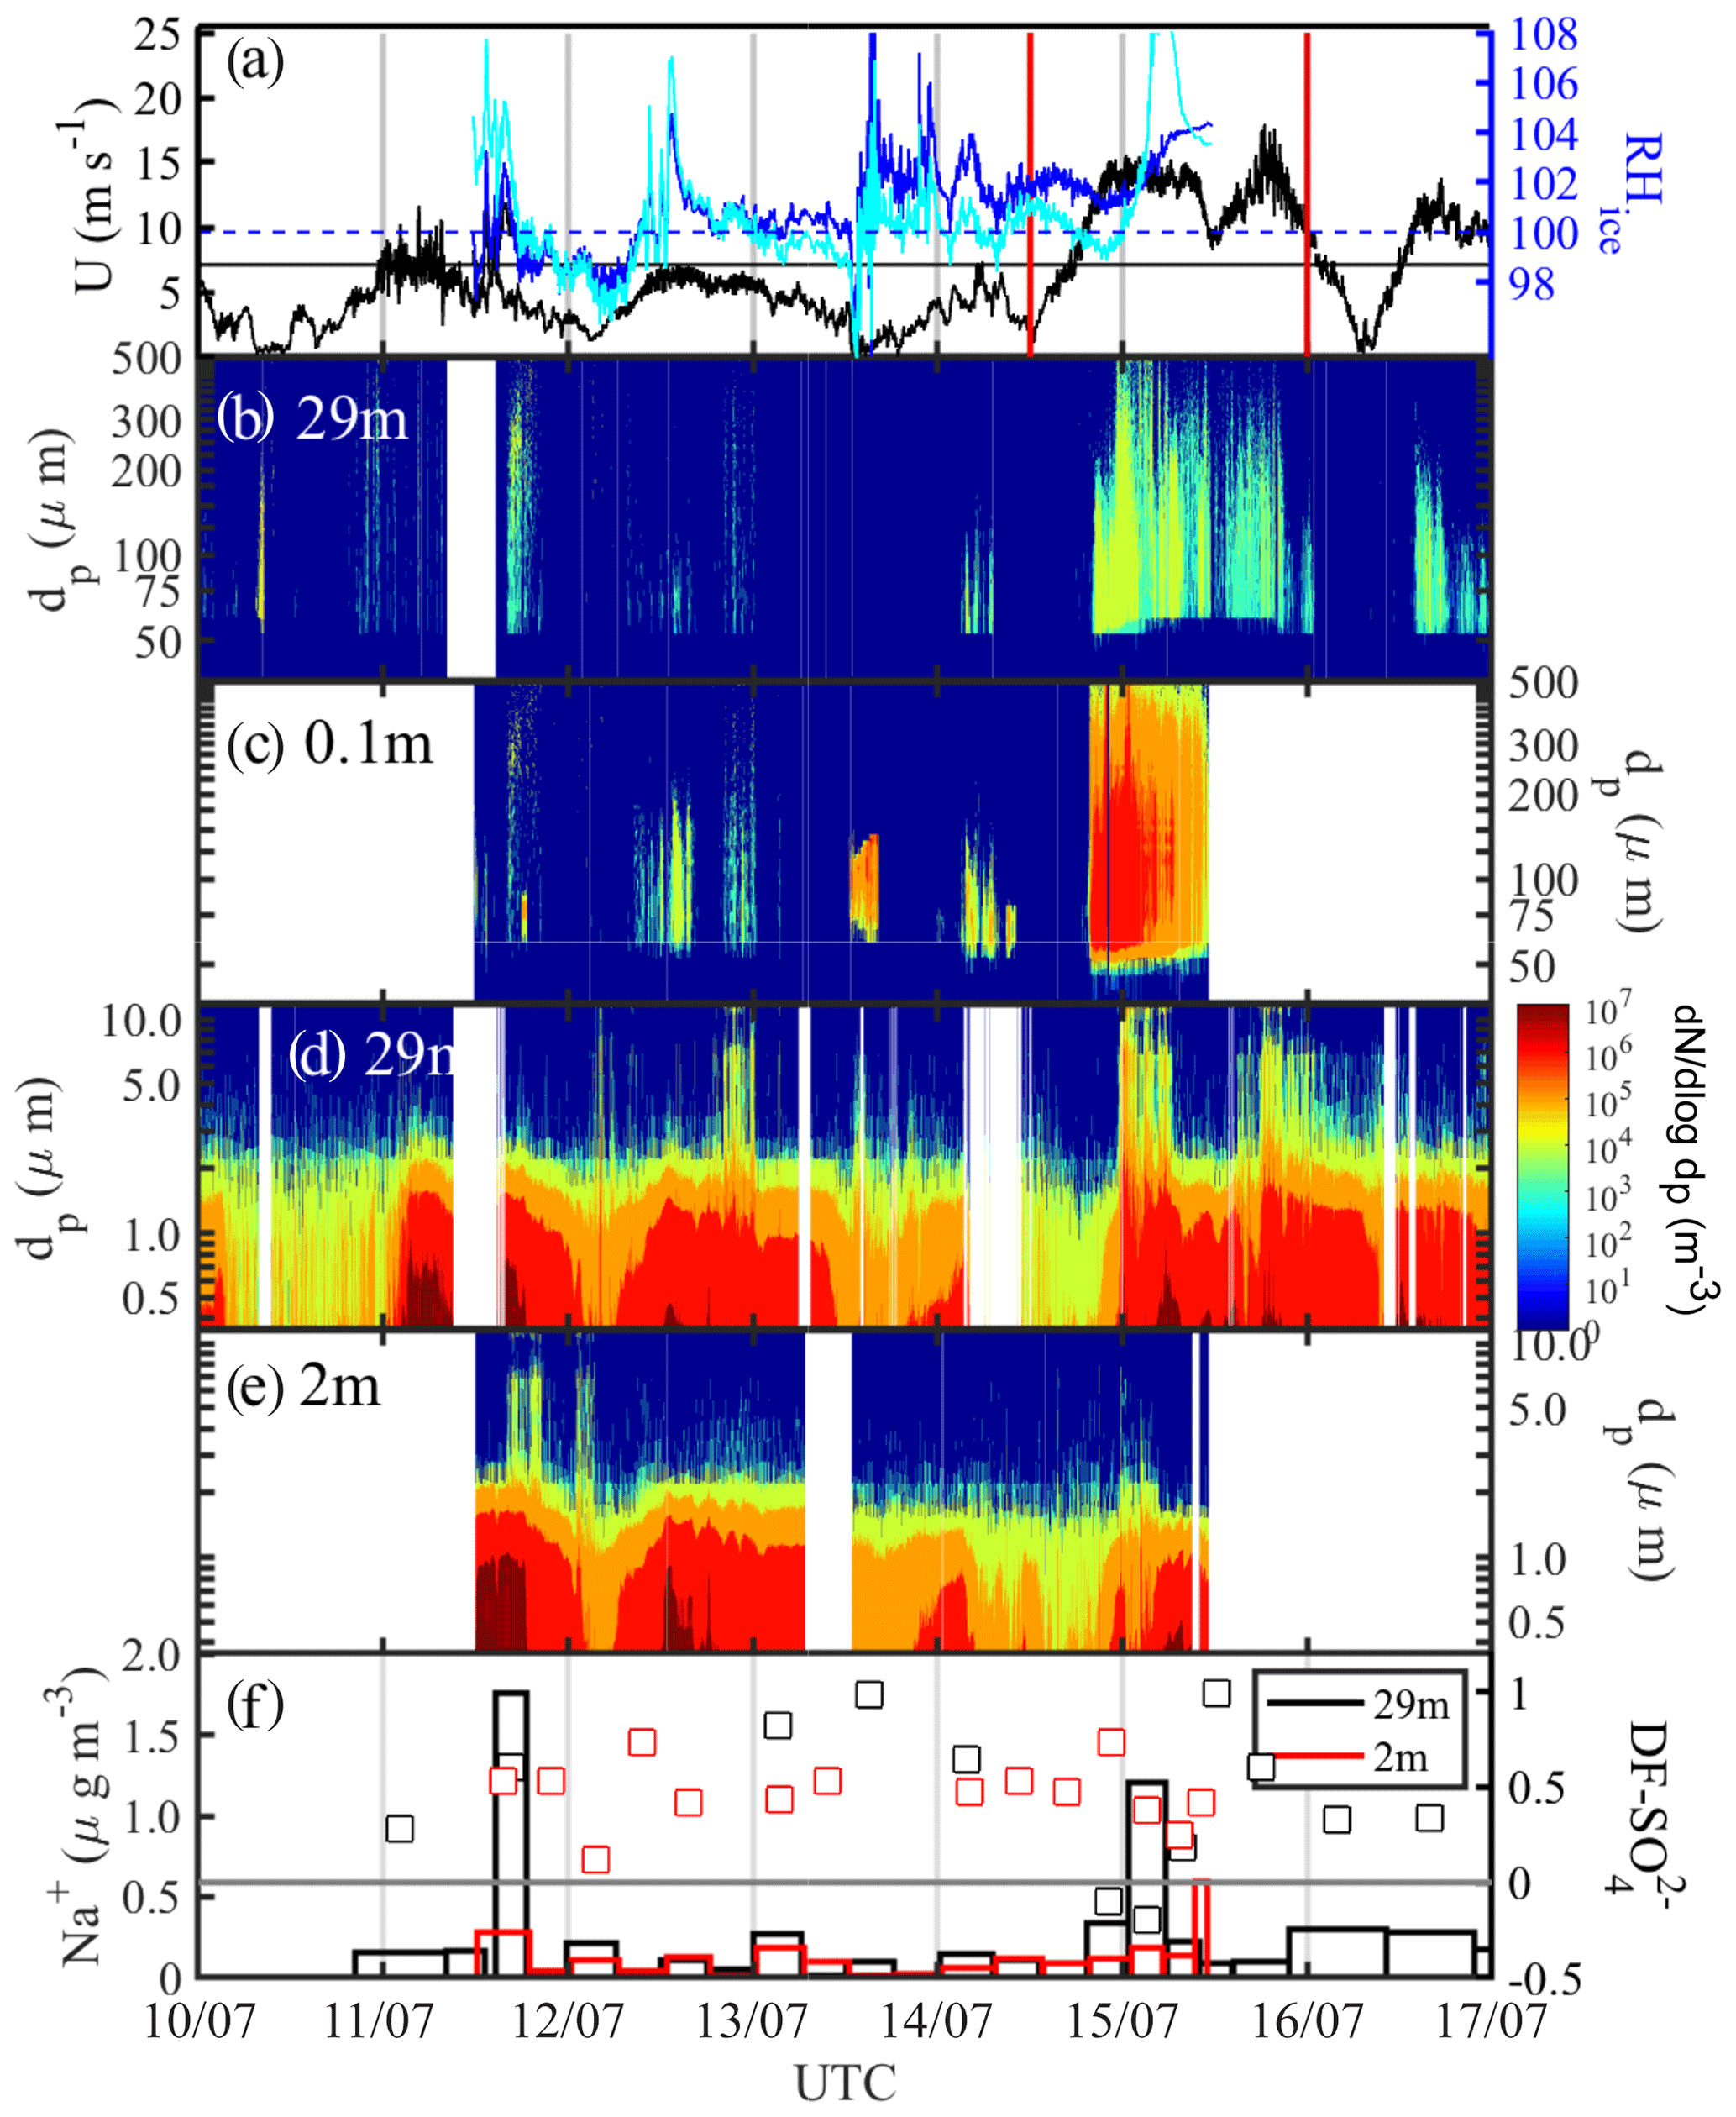
Figure 9Blowing-snow events during the 10–16 July 2013 period: (a) wind speed U extrapolated to 10 m with the horizontal black line showing the snow drift threshold wind speed Ut (Sect. 3.4.1) and RHice at 1.2 and 2.0 m (solid blue and cyan lines, respectively); vertical red lines delimit the period shown in more detail in Fig. 10. (b) Snow particle size distribution dN∕log dp ( µm) at 29 m and (c) at 0.1 m; (d) aerosol size distribution dN∕log dp ( µm) at 29 m and (e) at 2 m; dark blue shading indicates zero particle counts and white background that no data are available; (f) aerosol Na+ concentrations (vertical bars) and sulfate depletion factor (open symbols) at 29 and 2 m, respectively.
Aerosol at 29 and 2 m above the sea ice showed during the calm periods on 10, 12 and 14 July background spectral N0.4−12 of 104 to 105 m−3 for particle sizes dp<2 µm (Fig. 9d, e). During or a few hours after snow drift episodes, aerosol number densities increased significantly, especially those of submicron-sized particles at both measurement heights showing more particles near the surface, with spectral N0.4−12 of up to 107 m−3 for dp<2 µm (Fig. 9d, e). During blowing-snow spectral number densities, N0.4−12 showed similar increases to during drifting snow; however, at 29 m concentrations were higher and particles were larger (dp>9 µm) than at 2 m (Fig. 9d, e). Similar to the observations from 24 June this is consistent with net production of SSA taking place near the top of the layer containing suspended snow particles at RHice<100 %. Within the blowing-snow layer SSA net production is suppressed due to saturated conditions and scavenging by snow particles which is efficient at warmer temperatures. Na+ concentrations in aerosol at 29 m showed strong increases from a background of 0.1 to 1.8 µg m−3 a few hours after the drift episode on 11 July and to 1.2 µg m−3 during the blowing-snow event on 14–16 July (Fig. 9f). During the same times, Na+ concentrations in aerosol at 2 m showed only small increases by 0.1 µg m−3 (Fig. 9f). of aerosol showed large scatter and mostly positive values, with the exception of two samples (15–16 July), varying between 0.1 and 1 (Figs. 9f, 10d). Median values from 11 to 16 July were 0.61 at 29 m and 0.48 at 2 m, confirming that SSA originates from a fractionated sea ice source.

Figure 10Details of the blowing-snow event from 14 to 15 July 2013 (period marked by vertical red lines in Fig. 9a): (a) ambient temperature Ta at 29 m and wind speed U extrapolated to 10 m, with the horizontal black line showing the snow drift threshold wind speed Ut (see Sect. 3.4.1); (b) total number densities N46−478 of airborne snow particles at 29 and 0.1 m; (c) total number densities N0.4−12 of aerosol at 29 and 2 m; (d) aerosol Na+ concentrations (vertical bars) and (open symbols) at 29 and 2 m, respectively; (e) Na+ concentrations and sulfate depletion factor ; and (f) salinity Sp in blowing snow collected 1–17 cm above the surface.
A more detailed view of the blowing-snow event from 14 to 16 July reveals trends and phasing of particle number densities and chemical composition, which are consistent with the hypothesized sequence of processes from the onset of blowing snow to the release of sea salt aerosol due to snow sublimation (Fig. 10). Onset of snow drift at 0.1 m above the snow surface occurred once wind speed U10 m exceeded 11 m s−1, followed about 1 h later by detection of blowing snow at 29 m (Fig. 10b). Total snow particle number densities N46−478 near the surface and at 29 m decreased again a few hours later despite constant wind speeds of 13.5 m s−1 (Fig. 10b) due to strong warming during the storm causing an increase in drift threshold wind speed and therefore less uplift of particles, as shown in Sect. 3.4.1.
Two hours after the onset of snow drift total aerosol number densities N0.4−12 started to gradually increase at 2 and 29 m to reach peak values first at 29 m after an initial spike, and with a delay of 2 h also at 2 m coinciding with a decrease in snow particle concentrations (Fig. 10b, c). Despite RHice>100 % within 2 m of the sea ice surface during the blowing-snow event on 15 July (Fig. 9a), subsaturation cannot be ruled out because of the large error in RHice near 0 ∘C. Thus, the observed anti-correlation between aerosol and snow particle number densities at both measurement heights is consistent with (a) increased aerosol production from snow particle sublimation near the top or above the blowing-snow layer, where undersaturated conditions are more likely; and (b) reduced aerosol scavenging by snow particles. Na+ concentrations in aerosol followed the observed total N0.4−12 showing first a maximum at 29 m and then near the surface at 2 m, albeit of smaller magnitude (Fig. 10d), suggesting that much of the observed increase in aerosol particles consists of sea salt aerosol. Non-zero values in aerosol suggest that the sea salt particles originate from a fractionated sea ice source.
In order to further constrain the origin of the aerosol, Na+ and of the snowpack were measured. Blowing snow was collected during the storm every 2 h over a 12 h period, and snow pit profiles were sampled at various ice floe locations from 11 to 14 July prior to the storm. During the storm blowing-snow Na+ concentrations on average more than doubled from 4.5 to 12 µg g−1 and salinities Sp increased from 0.02 to 0.04 psu, whereas remained fairly constant at a median of ∼0.54 (Fig. 10e, f). The large spatial variability in Na+ concentrations and Sp of the snowpack masked any temporal trend, yet the snowpack profiles could be grouped into two types, one showing a very steep Sp (Na+) decline with snow layer height from 1–10 psu (102 µg g−1) near the bottom to 10−3 psu (10−1 µg g−1) near the surface, and the other showing a less steep decline from 30 psu (103 µg g−1) to 10−2 psu (101 µg g−1) (Fig. 11a, b). profiles exhibited large scatter: except at one location, near-surface snow showed no or small depletion, whereas most profiles showed significant depletion in deeper layers within 5–10 cm of the sea ice surface (Fig. 11c). Negative was found at the snow–ice interface and in some snow layers, suggesting the presence of mirabilite (Fig. 11c).
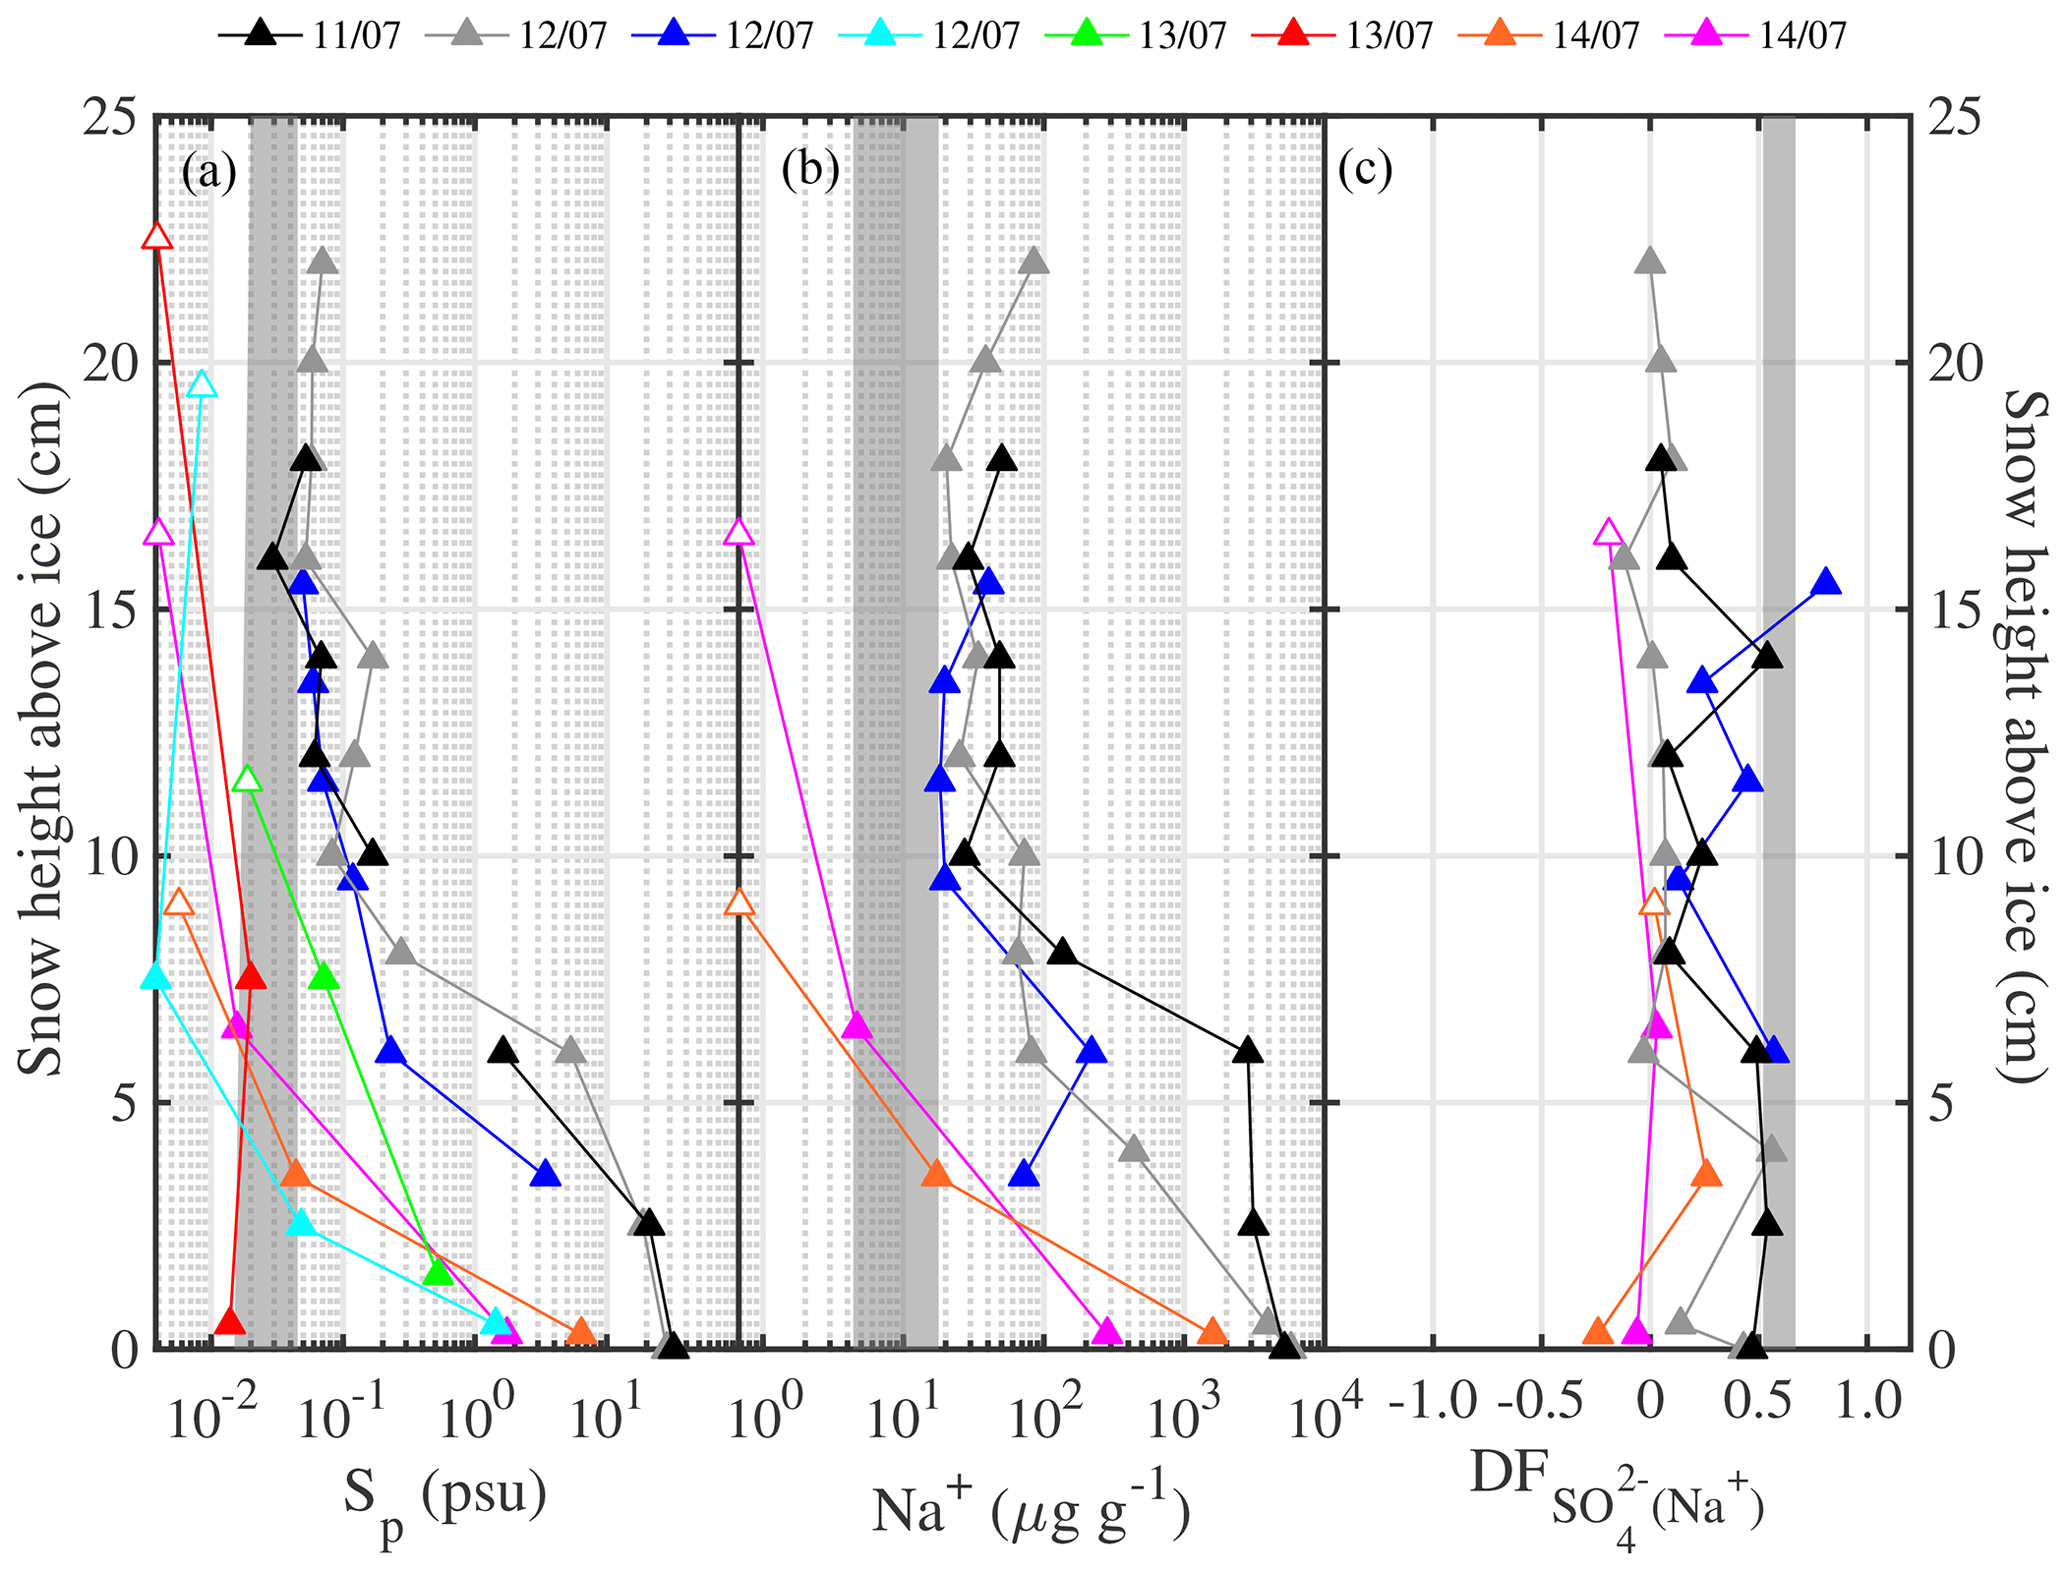
Figure 11Vertical snowpack profiles sampled at various locations on the ice floe of ice station S6 during the 11–14 July 2013 period (colour indicates day of sampling): (a) salinity Sp, (b) Na+ concentrations and (c) sulfate depletion factor with respect to Na+ as a function of snow height above the sea ice surface. Symbols illustrate averages for snow layers of 2 cm thickness, except those with a white face colour indicating 0.5–1.0 cm layer thickness. Data points at the top of each profile represent the surface snow layer; thus adding half the snow layer thickness to snow height yields total snowpack depth. Shaded areas illustrate the range of the respective parameter measured in blowing snow on 15 July 2013 (Fig. 10e–f).
Comparison shows that the range of Na+ concentrations and Sp values observed in blowing snow can be explained by mixing between the two snowpack types (Fig. 11a, b). An increase over time in salinity or Na+ concentration in airborne snow is also consistent with snowpack erosion during the storm and exposure to uplift of deeper and more saline snow layers. However, the values of blowing snow were at the top end of the range observed only in the deeper and more saline local snowpack (Fig. 11c). A plausible explanation for this observation during the storm on 15 July is that blowing snow integrates snow contributions from a wider area. And given the spatial heterogeneity of local snowpack thickness and composition, blowing-snow contributions must have dominated from areas where fractionated snow was at or near the surface such as seen in one of the profiles sampled on 12 July (Fig. 11c). Taking the median values in aerosol (=0.48–0.61) and blowing snow (=0.54), it can be concluded that 89 %–100 % of the observed aerosol comes from the local fractionated snow source.
In summary, observations show that blowing or drifting snow leads to increases in aerosol number densities during and after a storm. Aerosol size spectra show that number densities of particles with size dp<2 µm increased during individual storms by 2–3 orders of magnitude above background levels. Concurrent increases in aerosol Na+ concentration suggest that the observed new particles consist mainly of sea salt aerosol. Observed aerosol gradients suggest that net production of SSA takes place near the top of the blowing- or drifting-snow layer. Furthermore, similar sulfate depletion in aerosol, blowing snow and the local snowpack is strong evidence that the bulk of the observed SSA originated from snow on sea ice and not the open ocean, which is consistent with the independent model results of Yang et al. (2019). Advection of SSA from the open ocean cannot be ruled out during storms with warm and moist air but plays only a minor role due to the large distance to the nearest open water, in particular at ice stations S1–S6 (Table 1). The scale length for SSA removal over an ice shelf had been estimated previously to be ∼30 % per 100 km; thus the reduction of the SSA burden during advection over 600 to 1000 km would be larger than a factor of 6 to 20 (Wagenbach et al., 1998, and refs. therein). Distance to the open ocean together with a temporally very close association of snow particle and aerosol number density dynamics (Fig. 10) further supports the above finding that a local SSA sea ice source dominates over advection. Open leads, which may have been present in areas of reduced sea ice concentration, e.g. near ice stations S2–3 and S7–9 (Fig. 1), are another potential wind-dependent source of SSA from open water as observed in the Arctic (Nilsson et al., 2001; May et al., 2016), albeit with a much smaller flux contribution per surface area compared to the open ocean due to reduced fetch and low fraction of surface coverage (<15 %). Observations show also that snow drift is conceptually not different from a blowing-snow event with the same physical processes leading to SSA production.
3.4 Evaluation of SSA production scheme from blowing snow
It has been proposed that the production or mass flux of SSA from blowing snow, QSSA, is proportional to the bulk sublimation flux of suspended snow particles, Qs in units of kilograms per square metre per second (kg m−2 s−1), and snow salinity, Sp in practical salinity units (Yang et al., 2008, 2019). The model scheme however relies on blowing-snow measurements above ice sheets (Budd, 1966; Mann et al., 2000; Nishimura and Nemoto, 2005) and parameterizations developed for inland regions in the high Arctic (Déry and Yau, 2001, and references therein). Below we briefly summarize the model mechanism and then evaluate its applicability to snow on sea ice based on the Weddell Sea observations.
The mass flux of SSA from blowing snow QSSA in units of kilograms per square metre per second (kg m−2 s−1) is computed as
where dp is the snow particle diameter (m), f(dp) is the particle size distribution of blowing snow and ψ(Sp) the snow salinity probability distribution. The quantities f(dp) and ψ(Sp) are compared to direct observations from this study, whereas the blowing-snow bulk sublimation flux Qs was not amenable to direct measurement under field conditions. However, the model parameterization used for Qs (Déry and Yau, 2001) depends on observable quantities, which are validated below against measurements from this study.
3.4.1 Blowing-snow bulk sublimation flux Qs
The blowing-snow bulk sublimation flux Qs is the local bulk sublimation rate integrated over the entire blowing-snow column. Qs is parameterized following Déry and Yau (1999, 2001),
where K () is a factor to convert into units of kg m−2 s−1; A′ is an empirical snow age factor; is a normalized column-integrated sublimation rate (mm d−1, snow water equivalent); qbsalt is the saltation layer blowing-snow mixing ratio (kg kg−1) under ambient conditions; and qb0 is the value it would have when the 10 m threshold wind speed Ut, below which no snow drift occurs, has its minimum value Ut0 (=6.975 m s−1) based on the empirical model of Li and Pomeroy (1997). The saltation layer is a layer just above the snow surface usually several centimetres thick (e.g. Déry and Yau, 1999). The ratio qbsalt∕qb0 comes from the required introduction of a lower boundary condition for particle number densities in the saltation layer and scales the normalized accordingly. Values for qbsalt are computed with
where U10 m is the 10 m wind speed (m s−1) and u* is the friction velocity (Eq. 24 in Déry and Yau, 1999). For the 10 m threshold wind speed Ut an empirical model for dry snow was previously derived based on observations in the prairies of Western Canada, which applies to dry snow conditions and is a function of ambient temperature Ta (Li and Pomeroy, 1997):
This expression is compared to observations above sea ice from this study as follows. The onset of drifting or blowing snow is defined similar to Mann et al. (2000) as the moment when snow drift density μ right above the snow surface exceeds a critical value μc (=0.005 kg m−3). For comparison a lower value of μc (=0.001 kg m−3) is also considered. The snow drift density is calculated as with the density of ice ρice (=917 kg m−3) and the measured spectral number density Ns. U10 m is extrapolated from the sonic anemometer measurements at 2 m assuming a logarithmic wind profile, and Ta comes from the uppermost sensor on the sea ice at ∼2 m. The observed threshold wind speed Ut and friction velocity u*t are the respective measurements at the onset of drifting or blowing snow. Using the lower threshold μc (=0.001 kg m−3), most observed Ut values fall still within the model range of uncertainty (Fig. 12) and show a mean Ut of 7.1 (2.2–9.8) m s−1 corresponding to u*t of 0.37 (0.08 - 0.58) m s−1. For comparison, u*t for blowing snow above an Antarctic ice shelf during winter was observed to range between 0.18 and 0.38 m s−1 (Dover, 1993; Mann et al., 2000). Earlier work on land-based snowpacks found u*t to range from 0.15 m s−1 for loose, fresh and dry snow to 0.4 m s−1 for old, wind-hardened snow (Dover, 1993, and references therein). Thus, u*t values observed for snow on sea ice are on average at the upper end of previous observations for snow on land or ice shelves. It is concluded that Eq. 4 provides robust estimates of Ut above sea ice for the snowpack conditions encountered during this study exhibiting in general very low salinities (Table 5). However, temperature alone may not be a good predictor of Ut if surface snow on sea ice exposed to wind is very saline, with a relatively larger liquid fraction at a given temperature due to freezing point depression leading to increased snow crystal cohesion.
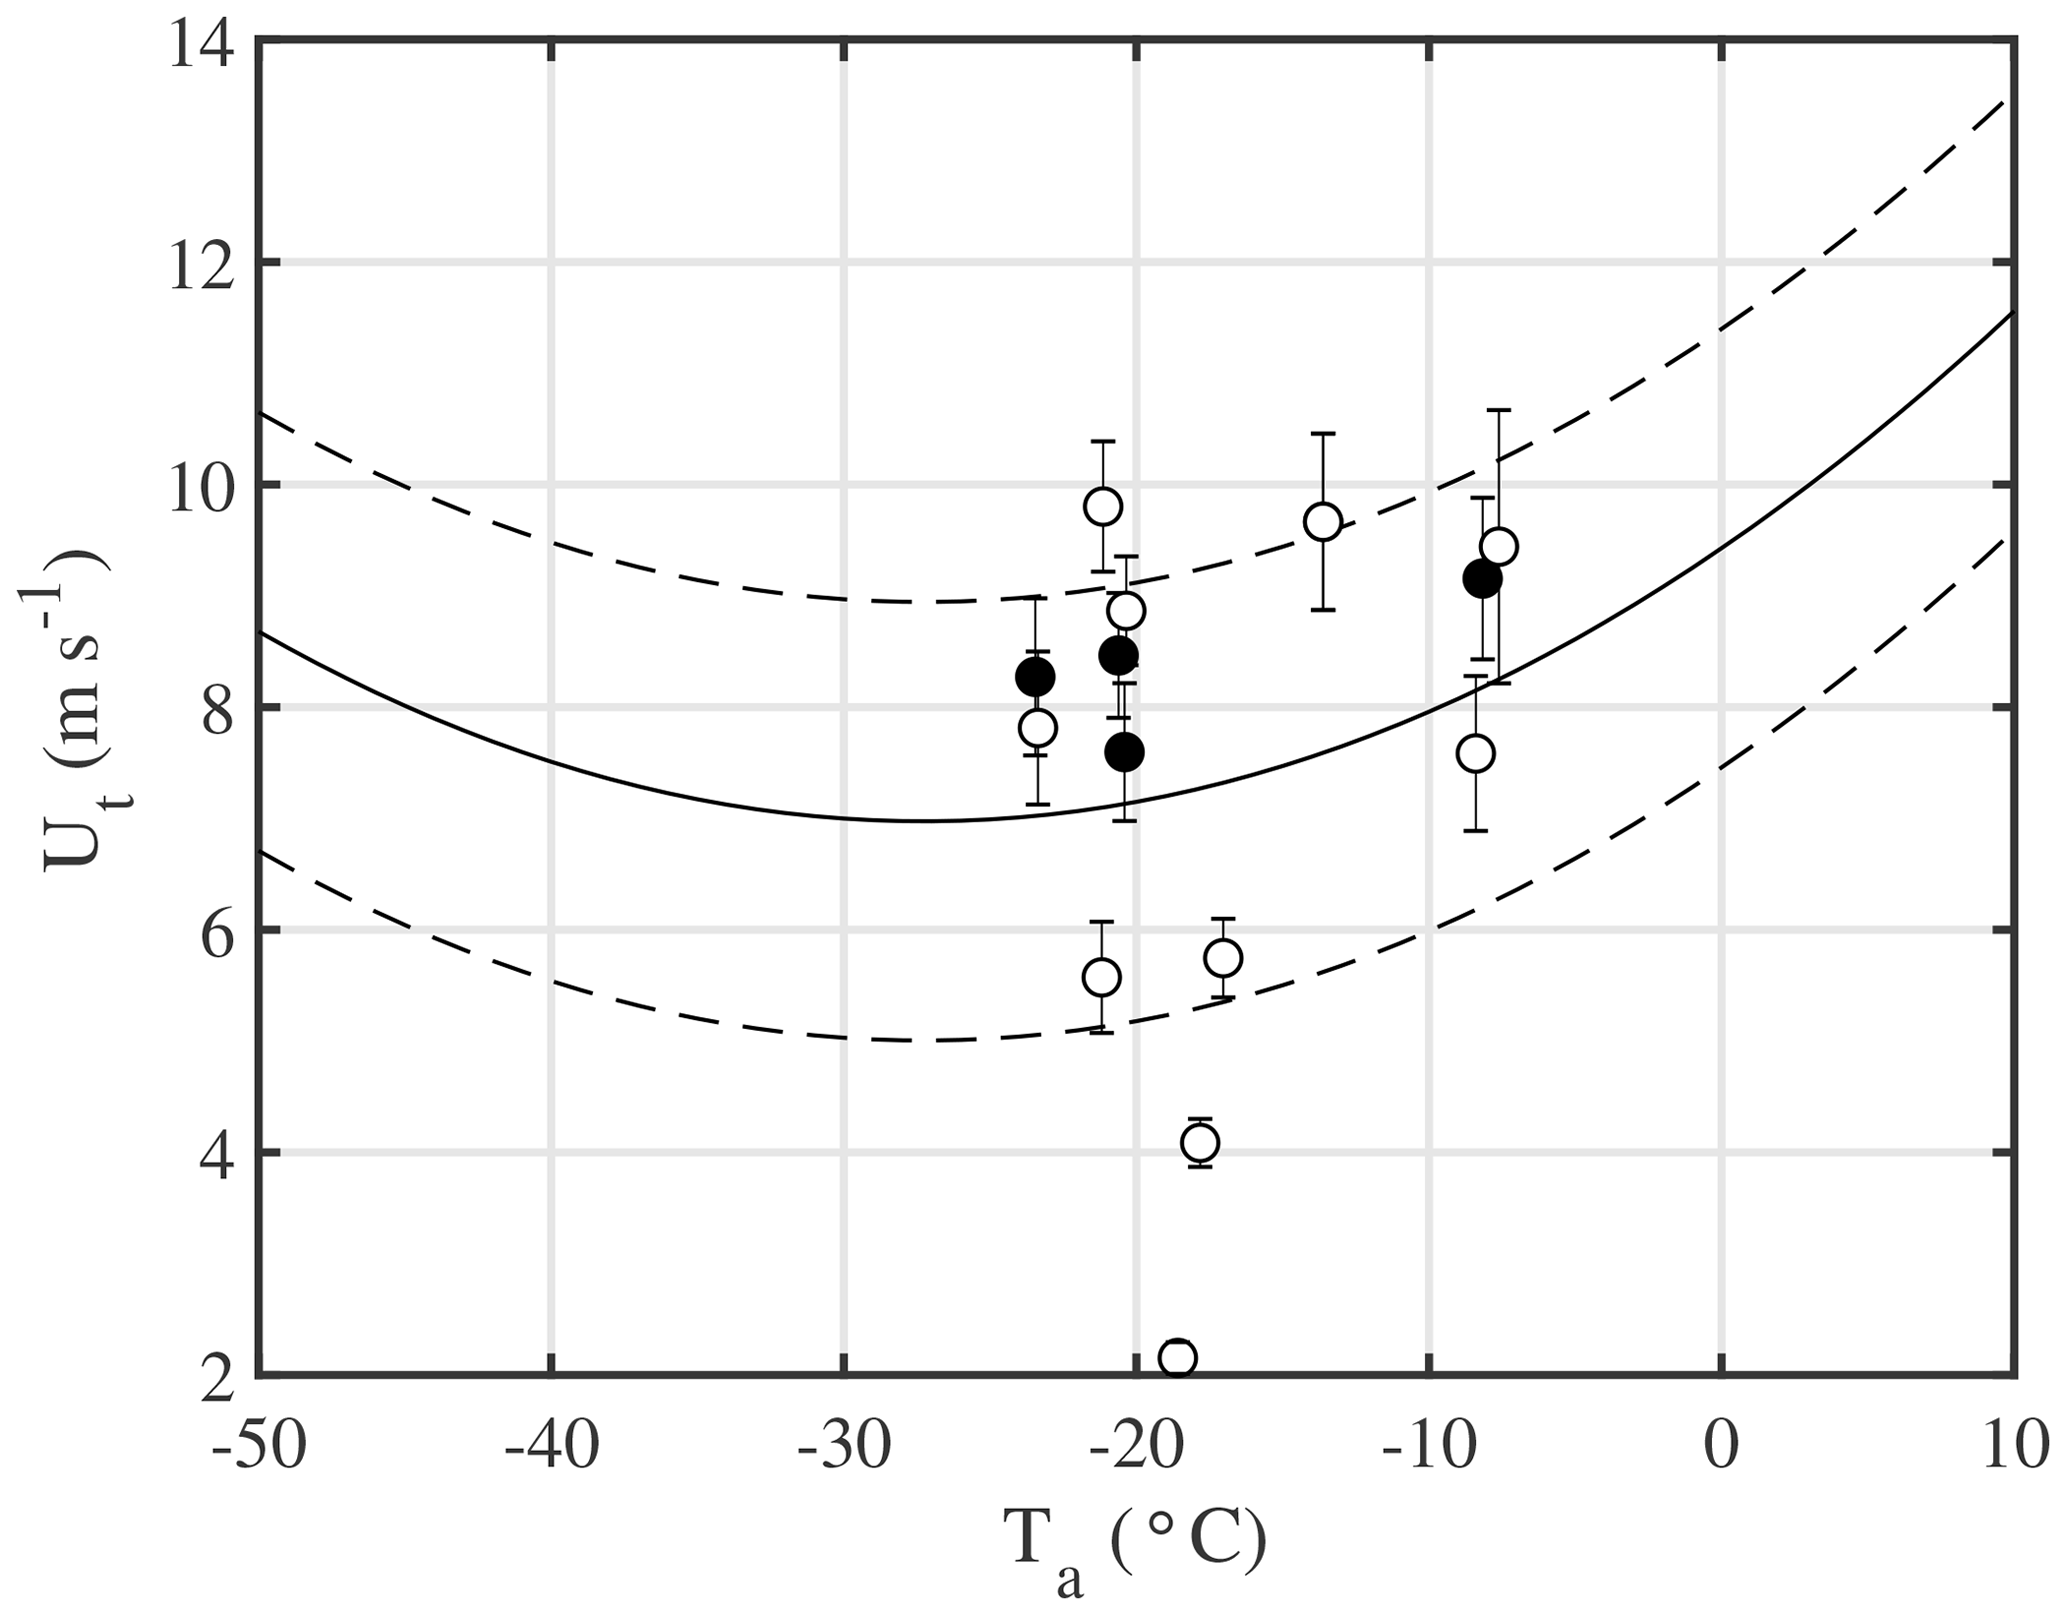
Figure 12The threshold wind speed of blowing snow Ut at 10 m as a function of ambient temperature Ta at 2 m, above the sea ice in the Weddell Sea. Plotted are 10 min means of observations centred on the time when the snow drift density μ right above the snow surface exceeds a threshold of 0.005 kg m−3 (closed symbols) and 0.001 kg m−3 (open symbols); error bars indicate ±1σ. Shown for comparison are predictions by the parameterization of Li and Pomeroy (1997) (Eq. 4), and their stated uncertainties are shown as solid and dashed lines.
In a next step blowing-snow mixing ratios in the saltation layer qbsalt were computed by dividing observed drift density μ by the density of air and then compared to qbsalt predicted by the empirical parameterization following Déry and Yau (1999) (Eq. 3). Considered were only observations when μ>0.001 kg m−3 and when the SPC was mounted below reported values of the saltation layer depth (=0.1 m). It is found that the model overpredicts observed qbsalt on average by at least a factor ∼10 (Fig. 13), suggesting that the conditions during this study were likely different to those in the Canadian Prairies for which Eq. (3) was developed. One model uncertainty is the assumption that the saltation layer is saturated with respect to ice, which has not been confirmed yet for the dry and cold polar boundary layer due to the lack of sufficiently accurate humidity measurements. However, relative changes in qbsalt are well captured by the model, in general showing an increase with wind speed (Fig. 13a, c). Except during the blowing-snow event on 14–15 July (ice station S6) qbsalt decreased even though wind speed remained constant at ∼12 m s−1 (Fig. 13b), as noted above for total N46−478 near the snow surface (Fig. 10b). Strong warming during the storm of ∼20 K increased snow particle cohesion and therefore the drift threshold wind speed Ut as predicted by the model, thereby reducing the uplift of snow particles (Fig. 13b). A similar case occurred during 26–27 June, when warming increased the theoretical drift threshold and wind speed dropped at the same time below Ut, consistent with the absence of blowing-snow particles at 29 m (Fig. 8b). The model bias in qbsalt is expected to cancel out in estimates of the bulk sublimation rate Qs (Eq. 2) and therefore also of SSA production QSSA (Eq. 1) because the calculation uses not absolute values but ratios of actual qbsalt and its maximum qb0.

Figure 13Snow mixing ratios in the saltation layer, qbsalt, during (a) 24 June (ice station S2), (b) 14–15 July (ice station S6) and (c) 26 July (ice station S7), where the snow particle counter was mounted below the reported value of the saltation layer depth (=0.1 m). Observations multiplied by 10 are compared to predictions by the parameterization of Déry and Yau (1999) (Eq. 3). The top panels show observed wind speed U10 m and the 10 m drift threshold wind speed Ut computed with the empirical model of Li and Pomeroy (1997) (Eq. 4), both at 10 m.
3.4.2 Snow particle size distribution f(dp) above sea ice
Previous studies concluded that a two-parameter gamma probability density function gives a reasonable fit to observed distributions of snow particle diameter f(dp) (Budd, 1966; Schmidt, 1982; Dover, 1993):
with shape and scale parameter α and β, and with mean particle diameter . Particle size distributions of blowing snow have been found to vary with wind speed and height: at a given height, increases with wind speed, whereas at a given wind speed, preferential removal of large snow particles due to gravitational settling leads to a decrease in (e.g. Dover, 1993; Mann et al., 2000) and an increase in α with height (Nishimura and Nemoto, 2005). Increasing α is equivalent to a shift from skewed to more symmetrical size distributions. Model predictions of the mass flux of SSA from blowing snow QSSA depend critically on f(dp) (Eq. 1) and therefore on α and β (Eq. 5).
In this study we derived and α by fitting a two-parameter gamma distribution to observed particle size spectra. Confidence in retrieved values of α and β is affected by two limitations of the SPC measurements. Firstly, SPC size spectra are clipped due to instrument configuration and exclude very small snow particles (dp<46 µm). And, secondly, SPC data include noise in the particle number count due to natural variability. A Monte Carlo model, which generates multiple noisy gamma distributions of known α and β, shows that retrieving these parameters is robust, even when the data are limited to ; that is they capture only the tail of the data. Furthermore, the uncertainty from under-sampling and data noise in α and β can be retrieved from the relative scale of the smallest size bin and the residual noise.
During blowing-snow episodes when U10 m was above the mean observed 10 m drift threshold wind speed Ut of 7.1 m s−1, decreased with height, whereas α increased with height as shown by the respective median values (Table 6), consistent with previous observations. An increase in α with height during blowing snow was found previously at Mizuho Station on the Antarctic Plateau, where α was ∼3 near the surface and increased to values >10 further aloft (Nishimura and Nemoto, 2005). Another study at Halley in coastal Antarctica found no gradient in α within the lower 4 m (Dover, 1993), which was set to 2 following the analysis of King et al. (1996). However, the observed decrease in mean particle size with height was much smaller than that inferred from previous studies. For example, median at 29 m was 43 % larger than dp observed between 1.0 and 9.6 m (=80 µm regardless of wind speed) at Mizuho Station (Nishimura and Nemoto, 2005) and ∼4 times the dp predicted by a parameterization based on the Halley vertical dp profiles between 0.1 and 4.0 m (King et al., 2001). Further examination of the snow particle size distributions at 29 m reveals in general an unexpected long tail indicating significant relative contributions from large particles. For example, during the blowing-snow event on 14 July, and α near the surface were 105 µm and 5.2, respectively (Fig. 14b). At 29 m, total N46−478 was, as expected, about 2 orders of magnitude smaller than near the surface. Yet compared to the near-surface values, average was larger (131 µm) and the size distribution more skewed (α=3.2), with a long tail showing significant contributions from particles with dp>200 µm (Fig. 14a).
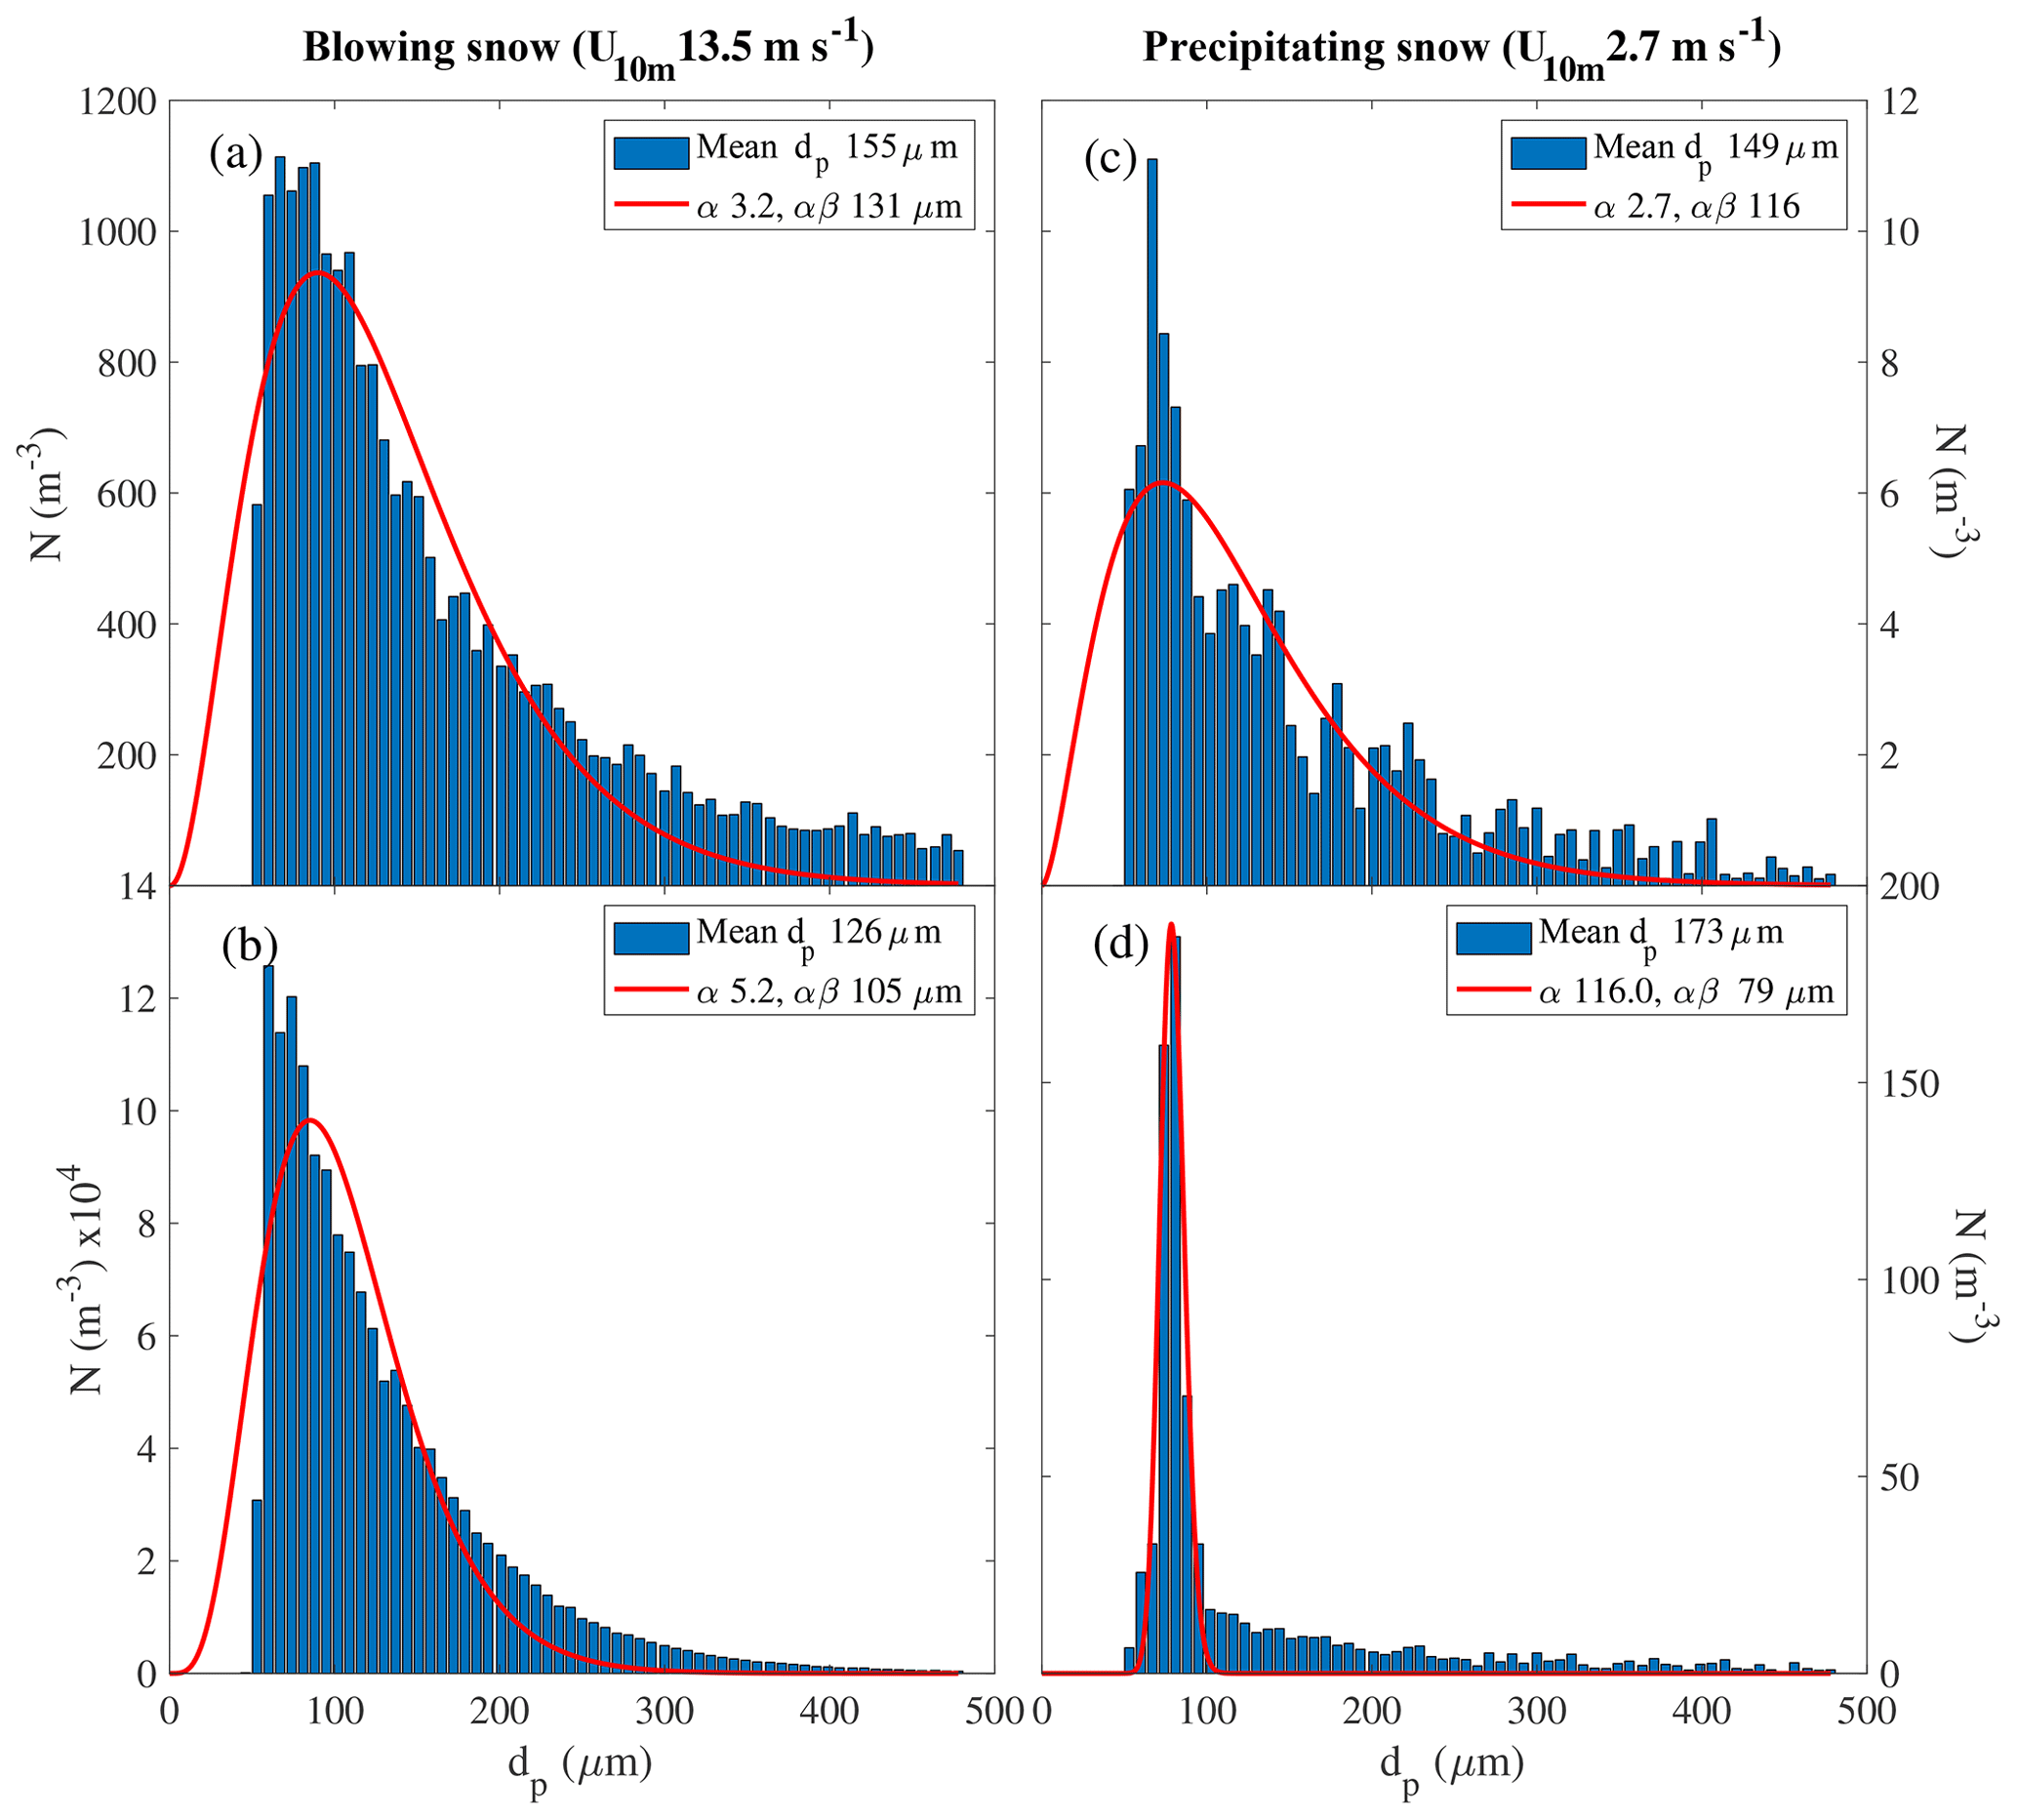
Figure 14Average snow particle size spectra f(dp) during blowing snow on 14 July 23:15–23:25 (a) at 29 m and (b) at <0.2 m, as well as during light snowfall on 3 July 14:30–4 July 07:00 coinciding with very low winds (c) at 29 m and (d) at <0.2 m. Solid lines indicate the fit obtained with a two-parameter gamma probability density function (Eq. 5). Note that values computed from observations show a positive bias compared to (=α β) retrieved from the fitting procedure, since the SPC does not detect small particles below dp=46 µm.
It is suggested that a small or no decrease in with height and the long tail in f(dp) at 29 m can be explained by contributions from falling snow particles since blowing snow frequently coincided with precipitation. In order to analyse f(dp) of snow precipitation only, a calm 17 h period (3 July 14:30 to 4 July 07:00) was chosen during which light snowfall ( m−3 at both levels) but no snow drift occurred with U10 m (=2.7 m s−1) <Ut. For the early morning of 4 July 2013 webcam images from the crow's nest confirmed the presence of large airborne snow crystals visible during darkness in the beam of the ship's search lights, whereas the ship's 3-hourly weather report noted the presence of airborne ice needles. It is found that the size distribution (, α) of precipitation at 29 m (Fig. 14c) was very similar to that during a blowing-snow event (Fig. 14a). The size spectrum of falling snow also showed no preferential large size mode as observed previously at Mizuho Station (Nishimura and Nemoto, 2005), which prevents a correction of blowing-snow particle spectra for snow precipitation based on particle size. The spectral shift to smaller particles near the surface during the snowfall event (Fig. 14d) was likely due to a combination of two processes: (i) sublimation of larger snow particles supported by a mean RHice of 98.0 % between 0.2 and 2.0 m and (ii) fragmentation of snow particles by more vigorous and smaller eddies near the surface during calm conditions, either through direct break-up of the dendrites or through separation of snow flakes that have loosely adhered on the descent. Similar size distributions (, α) near the snow surface and at 29 m during blowing snow imply that at 29 m particle sizes lost from the blowing-snow size spectrum due to gravitational settling were being replenished by falling snow. Plotting the fitted parameters and α against wind speed allows us to evaluate the parameter range characteristic for blowing snow: shows the expected increase near the surface but large scatter and little change at 29 m (Fig. 15a, b). Values of α show at both heights some dependence on wind speed (Fig. 15c, d) and cluster between 3 and 6 when U10 m>Ut. Median, lower and upper quartiles of and α for blowing snow, i.e. when wind speed U10 m is above the observed mean drift threshold wind speed Ut (=7.1 m s−1), are summarized in Table 6 as guidance for model sensitivity studies. Due to the increase in the fraction of precipitating snow with height, snow particle size distributions measured at 29 m have additional uncertainty, whereas those observed near the surface are representative of blowing snow.
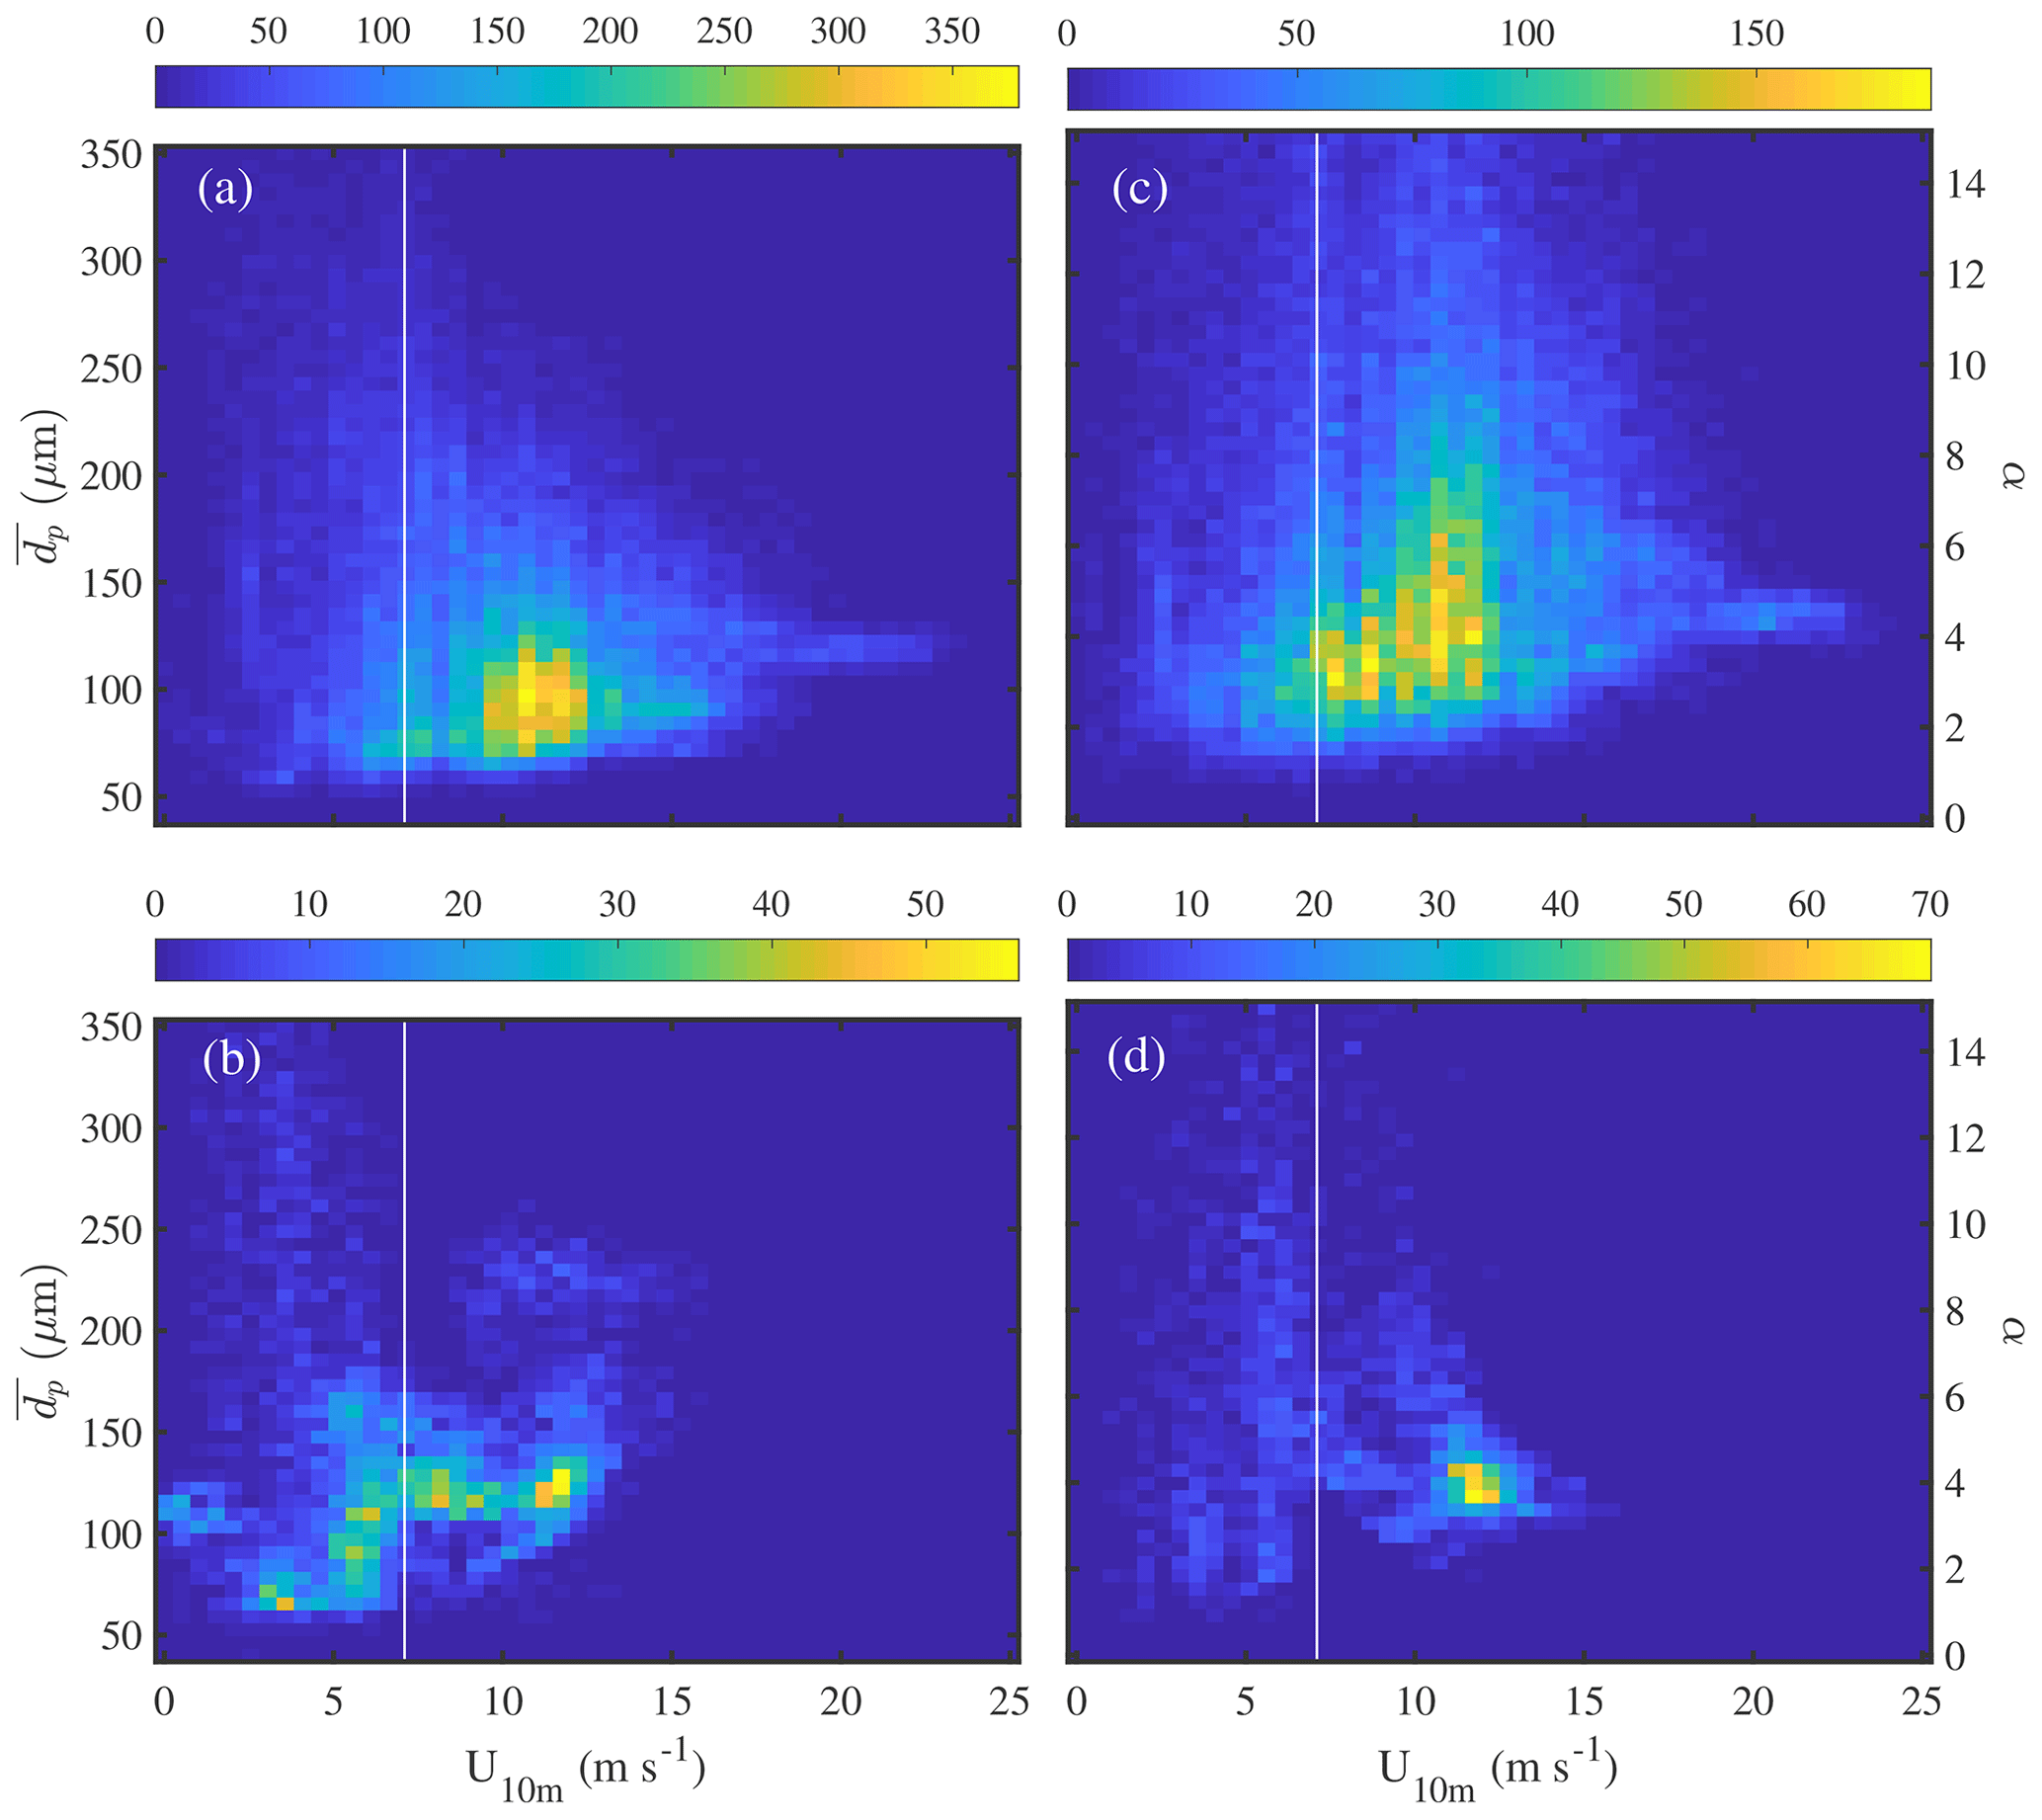
Figure 15Properties of blowing-snow particle size distributions above sea ice as a function of the 10 m wind speed U10 m retrieved from fitting a two-parameter gamma probability density function (Eq. 5) to observations. Mean snow particle diameters (=α β) (a) at 29 m during ANT-XXIX/6 and 7 and (b) at <0.2 m during ANT-XXIX/6. The shape parameter α (c) at 29 m and (d) at <0.2 m. The vertical line represents the observed mean snowdrift threshold wind speed Ut of 7.1 m s−1 corresponding to u*t of 0.37 m s−1. Data were binned into 50 bins in the x and y direction, with the colour indicating the sample density in each bin.
3.4.3 Salinity probability distribution ψ(Sp) of snow on sea ice
Correct modelling of SSA production from blowing snow (Eq. 1) requires choosing a snow salinity probability distribution ψ(Sp) representative of the region and season under consideration (Massom et al., 2001). High salinities near the snow–sea-ice interface originate from incorporation of frost flowers or upwards migration of brine due to capillary action. Brine is found at the top of sea ice as a result of ion exclusion during the freezing of seawater or of flooding due to negative freeboard. Top snow layers in deeper snowpacks not affected by brine migration receive sea salt aerosol through dry or wet deposition of background aerosol or sea spray. Vertical profiles of snow salinity Sp measured during this study (Frey, 2017) showed a marked decrease with height above the sea ice surface (Fig. 16a) in agreement with previous sea ice surveys in Antarctica (Massom et al., 2001). High salinities Sp (1–43 psu) were found in basal snow, the sea ice surface and frost flowers, whereas very low salinities (<0.2 psu) were observed in snow layers >20 cm above the snow–ice interface and in blowing snow (range 0.01–0.12 psu) (Fig. 16a). The inferred mean migration distance of ∼20 cm above sea ice where brine can affect the snowpack falls within the range of those reported by previous studies, up to 17 cm in the Arctic (Dominé et al., 2004) and 30 cm in the Weddell Sea (Massom et al., 2001).
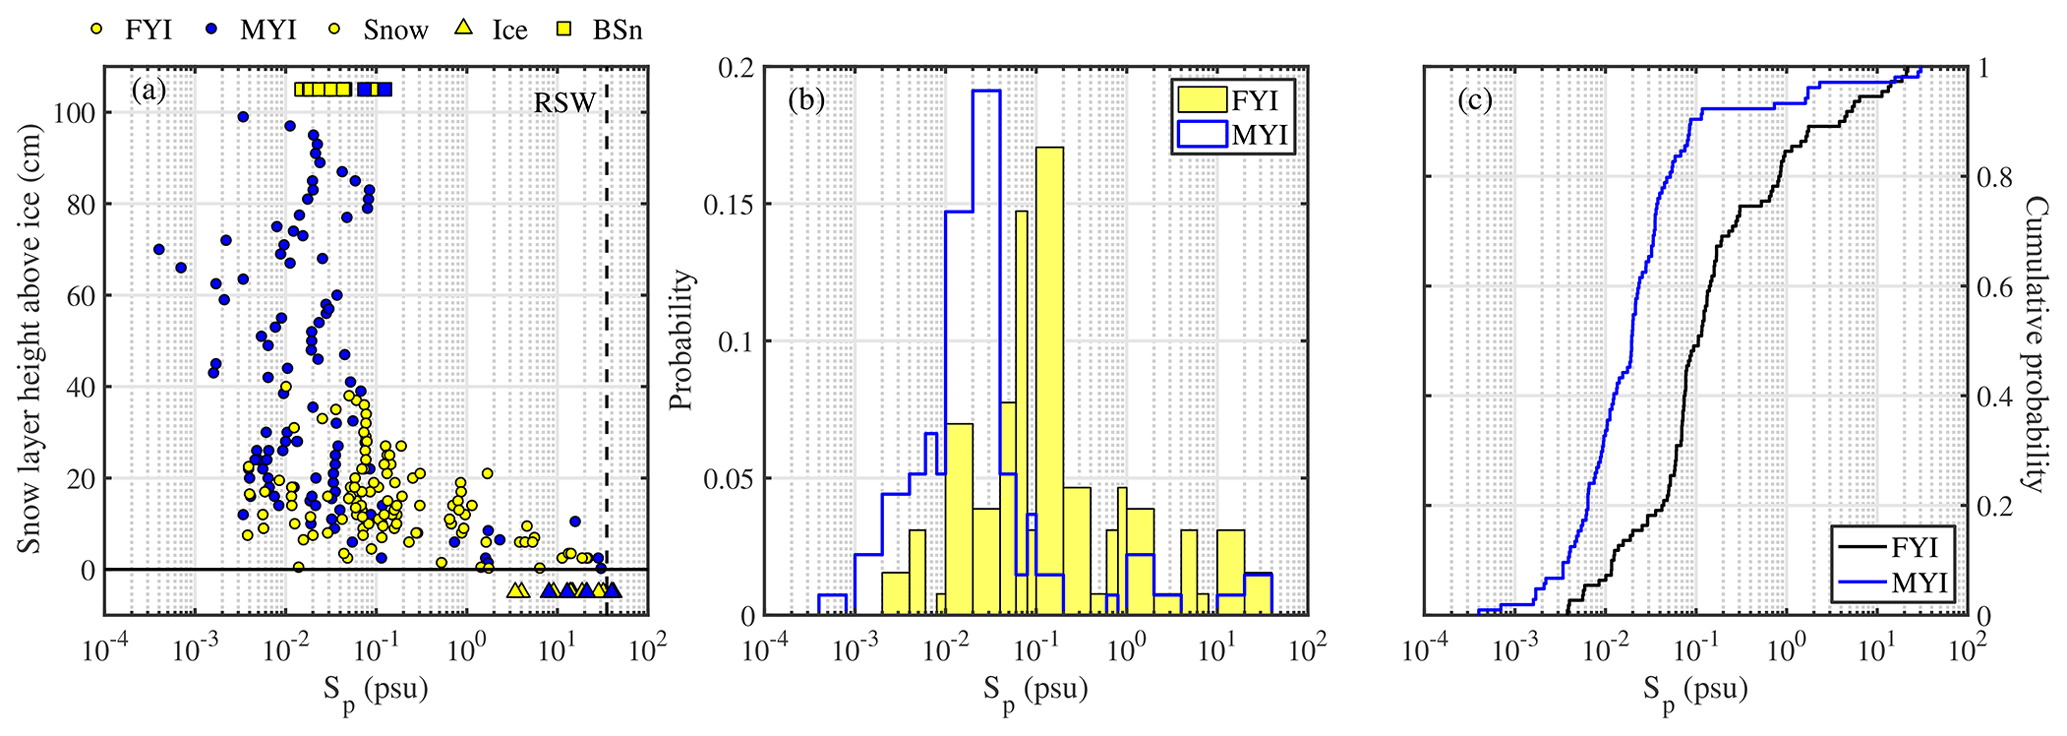
Figure 16Panel (a) shows salinity Sp of snow on first-year sea ice (FYI, yellow symbols) at ice stations S1–6 and multi-year sea ice (MYI, blue symbols) at ice stations S7–9 in the Weddell Sea during austral winter 2013 as a function of snow layer height above the sea ice surface. For comparison, Sp of the sea ice surface (triangles) and blowing snow at 1–17 cm above the snowpack (squares) are shown as well. The vertical dashed line indicates Sp (=35.165 psu) of reference seawater (RSW). Panel (b) shows salinity Sp probability distributions for shallow snowpacks (mean depth 21 cm) above first-year sea ice (FYI) at ice stations S1–6 and for deep snowpacks (mean depth 50 cm) above multi-year sea ice (MYI) at ice stations S7–S9 in the Weddell Sea during austral winter 2013. Panel (c) shows respective cumulative probabilities of Sp. The distribution statistics are summarized in Table 5.
From the above follows that to a first order the distance of individual snow layers to the sea ice surface determines their salinity, and therefore snowpack depth determines to a first-order the mean volume-integrated salinity and salinity probability distributions ψ(Sp) in snow on sea ice. Average (±σ) snowpack depth based on snow pits from this study was 21 (±8) cm above first-year sea ice (FYI) and 50 (±32) cm above multi-year sea ice (MYI) (Table 5), in the range of previous observations in the Weddell Sea sector; e.g. mean snowpack depth during winter 1992 was 14 cm (Massom et al., 2001, and references therein). As expected the median salinity of the shallow FYI snowpack (0.11 psu) was significantly larger than that of the deep MYI snowpack (0.02 psu) (Table 5) based on the Wilcoxon rank-sum test (p<0.01), and corresponding salinity probability distributions ψ(Sp) for snow on FYI are shifted to higher salinities when compared to ψ(Sp) above MYI (Fig. 16b). Secondary factors identified previously (e.g. Massom et al., 2001), which contribute to higher salinities of snow on FYI in comparison to snow on MYI, are more frequent flooding of thin FYI with seawater due to negative freeboard and brine rejection and drainage, which decrease MYI salinity over time.
Previous modelling of SSA production from blowing snow based ψ(Sp) on much higher mean snow salinities Sp than observed during this study: 8.5 psu from observations in the Indian Ocean sector in August 1995 (Yang et al., 2008) and half that value in a later study (Levine et al., 2014). Bearing in mind that only surface snow, which often has lower density and crystal cohesion, is likely to become airborne, it is sensible to include only the top snow layers in the calculation of average snow salinity. For example, in this study the mean Sp of snow layers within the top 10 cm of the snow surface was 0.31 psu (Table 5), a factor of 28 smaller than that used for ψ(Sp) by Yang et al. (2008). More recent studies updated the model scheme accordingly using the very low salinities found here in surface and blowing snow (Rhodes et al., 2017; Yang et al., 2019). It should be noted that snow on sea ice even at the lower end of the Sp spectrum contains amounts of sea salt large enough to produce significant SSA especially in the submicron range (e.g. Yang et al., 2019) and is on average significantly saltier than snow in inner Antarctica. For example, mean ice core Cl− or Na+ concentrations on the West Antarctic ice sheet are ∼100 ng g−1 or less (Frey et al., 2006), equivalent to Sp of psu, thus up to 4 orders of magnitude smaller than in snow on sea ice (Fig. 16a). In summary, model parameterizations for SSA production from blowing snow require a snow salinity probability distribution ψ(Sp), which takes into account regional and seasonal variabilities. Snow depth on sea ice, retrievable from satellite measurements, may be a good predictor of mean snow salinity as more field measurements become available.
3.5 The sea salt atmosphere–snow mass budget
Assessing the sea salt mass distribution between atmosphere and snow during calm and blowing-snow conditions provides further evidence for the importance of snow on sea ice as a SSA source (Fig. 17). To do this atmospheric sea salt mass concentrations were estimated in two ways for the time period when RV Polarstern was well within the FYI zone (18 June to 21 July 2013; Fig. 1). One way was by converting spectral particle number densities N0.4−12 at 29 m into sea salt mass concentration assuming that all particles are spherical and consist of sea salt with the density of NaCl. Contributions from non-sea-salt aerosol to CLASP N0.4−12 can lead to an overestimate of the calculated sea salt mass but are considered to be small as nss aerosol has a winter minimum in coastal Antarctica (e.g. Weller et al., 2011; Abram et al., 2013). And the other was by multiplying the Na+ concentration measured on aerosol filters at 29 m with a conversion factor of 3.262 based on the Na+ mass fraction in reference seawater (Millero et al., 2008). Note that as shown in Sect. 3.2.1 depletion of due to the precipitation of mirabilite decreases Na+ by up to 12 %. Reduction in both ions decreases the mass fraction of Na+ in the depleted sea salt aerosol by a maximum of ∼0.7 % compared to reference seawater. Thus, by not considering the depletion effect, the conversion factor and calculated SSA mass are underestimated by up to ∼0.7 %, which is negligible given all other uncertainties. The sea salt mass estimates show that most filter-based values have a low bias compared to median sea salt concentrations derived from N0.4−12 during filter sampling intervals (Fig. S3), on average of ∼26 %. The bias also shows a weak but significant positive correlation with wind speed (R=0.40, p<0.01) (Fig. S3). A low bias of the filter samples especially during high wind speeds is expected because the smaller cut-off diameter (<6 µm) compared to the CLASP (>11 µm) limits capture of coarse sea salt aerosol, where much of the particle mass is located (Fig. 7b).

Figure 17The partitioning of sea salt between atmosphere and snow, and sulfate depletion above first-year sea ice from 18 June to 21 July 2013. Panel (a) shows median atmospheric sea salt concentrations during calm (U10 m<4 m s−1) and windy (U10 m>9 m s−1) conditions derived from aerosol filter measurements (filter) and spectral particle number densities N0.4−12 (CLASP) (see text). For comparison, a potential atmospheric concentration is calculated assuming that all sea salt observed in the top 0.1 mm of snow on sea ice was released by sublimation and mixed into a 100 m thick boundary layer (for better comparison multiplied here by 0.1). Panel (b) shows for the same time period median sulfate depletion factors (with respect to Na+) in surface snow and in aerosol during windy (U10 m>9 m s−1) conditions. Symbols and error bars represent median and lower and upper quartiles, respectively.
During storms median atmospheric sea salt concentrations from both estimates showed increases above background values (Fig. 17a) that were statistically significant based on the Wilcoxon rank-sum test (p<0.01). For example, median sea salt concentration based on N0.4−12 increased by a factor of ∼4, from 0.37 to 1.48 µg m−3 when comparing calm (<4 m s−1) with windy (>9 m s−1) conditions (Fig. 17a). A potential atmospheric sea salt concentration if surface snow released its sea salt content by blowing-snow sublimation is estimated as follows: taking a typical column total blowing-snow sublimation rate of 0.1 mm d−1 observed at Halley during winter (King et al., 2001) and assuming a mean storm duration of 1 d then, on average, the sea salt within the top 0.1 mm of snow can potentially be released. Total sea salt mass concentration observed in the top 0.1 mm of surface snow was converted into atmospheric mass concentration assuming a snow density ρsnow of 300 kg m−3 and complete mixing into a winter atmospheric boundary layer with an estimated mean depth of 100 m (Fig. 17a). Further assuming that the atmospheric concentration measured at 29 m is constant throughout the 100 m atmospheric column it is found that the potential snow reservoir is more than a factor of 10 larger in comparison to the total atmospheric burden during calm or windy conditions and therefore easily accounts for the sea salt aerosol increase observed during blowing snow (Fig. 17a).
Sulfate depletion in winter aerosol and snow in Antarctica provides a means to estimate source contributions from the open ocean and the blowing-snow source above sea ice as discussed in Sect. 3.2.1. The overlap in (relative to Na+) in aerosol and snow suggests that most of the aerosol observed during storms (U10 m>9 m s−1) had its origin in the regional snow on sea ice (Fig. 17b). During 8 June to 12 August 2013 (ANT6) the median of aerosol at 29 m was 0.29 and that of the top 10 cm of snowpack was 0.27 (Tables 4, 5). Assuming linear mixing between two end members, i.e. SSA from the open ocean and the snow source, and assuming they are constant in space and time, one finds based on the median values that >90 % of the aerosol observed originated from snow on sea ice.
Two consecutive sea ice cruises in the Weddell Sea, Antarctica, during winter/spring 2013 provided the first direct observations of sea salt aerosol production from blowing-snow above sea ice, thereby validating a model hypothesis to account for winter time sea salt maxima in the Antarctic. Blowing or drifting snow often leads to increases in aerosol during and after storms consisting mostly of sea salt inferred from the concurrent increase in atmospheric sodium concentrations. Observed aerosol gradients suggest that net production of SSA takes place near the top of the atmospheric layer containing suspended snow particles at RHice<100 %. Within the blowing-snow layer SSA net production is suppressed due to saturated conditions and scavenging by snow particles which is efficient at the warmer temperatures encountered during storms.
The main evidence for the sea ice origin of the observed sea salt aerosol comes from its chemical fractionation: for the first time we show that snow on sea ice is depleted in sulfate relative to sodium with respect to seawater. Similar sulfate depletion in bulk aerosol above the sea ice sized ∼0.3–6 µm suggests that most sea salt originated from snow on sea ice with possibly minor contributions from frost flowers and not the open ocean or leads, e.g. >90 % during the 8 June and 12 August 2013 period based on median values. This finding is consistent with the independent modelling results of Yang et al. (2019). A temporally very close association of snow particle and aerosol number density dynamics together with the far distance to the open ocean further support that the local blowing-snow source of SSA dominates over advection. A mass budget calculation shows that sublimation of <1 mm of snow on sea ice at even low salinity (<0.1 psu) can account for increases in atmospheric sea salt observed during storms. Significant enhancement of small aerosol particles (dp<2 µm) during storms is consistent with sublimation of low-salinity (<0.1 psu) snow particles assuming complete loss of water ice. The degree of ice loss from particles has implications for particle surface area and heterogeneous chemistry, which future experiments will need to address.
It is found that SSA further aloft produced by blowing snow is depleted in bromide, suggesting it is a source of reactive bromine to the atmosphere even in winter, which then can contribute to ozone depletion events. On average snow on sea ice and blowing snow showed no or small depletion of bromide relative to sodium with respect to seawater, whereas aerosol at 2 m was enriched and at 29 m depleted, suggesting that significant bromine loss takes place in the aerosol phase between 2 and 29 m above the sea ice surface.
During storms average size spectra of aerosol number densities over the sea ice showed a significant increase above background concentrations for particle diameters <2 µm, with submicron particles reaching levels similar to those observed above the open ocean. The relative increase in aerosol concentrations with wind speed was much larger above sea ice than above the open ocean, highlighting the importance of a sea ice source in winter and early spring for the aerosol burden above sea ice. Comparison of absolute increases in aerosol concentrations during storms suggests that to a first order corresponding aerosol number and mass fluxes above sea ice can rival those above the open ocean depending on particle size. Lower SSA concentrations above sea ice relative to the open ocean may have been due to a combination of low storm frequency and low snow salinities in the area sampled. Indeed, model calculations suggest that size distribution and associated flux of SSA originating from blowing snow are very sensitive to snow salinity Sp; e.g. decreasing Sp from 0.92 to 0.06 psu causes SSA spectral number densities to decrease by about 1 order of magnitude (Yang et al., 2019). Upscaling of the SSA source flux of Weddell Sea ice and atmospheric modelling similar to the study of Levine et al. (2014) are needed to address this issue as well as implications for the interpretation of sea salt in ice cores as a proxy for sea ice.
Evaluation of the current model mechanism for sea salt aerosol production from blowing snow (Yang et al., 2008, 2019) showed that the model parameterizations used can generally be applied to snow on sea ice:
-
Estimates of snow drift threshold wind speed based on the empirical model of Li and Pomeroy (1997) that depends on temperature agreed well with observations above the low-salinity snow encountered during this study. However, temperature alone may not be a good predictor if the surface snow is very saline, implying a relatively larger liquid fraction at a given temperature and therefore increased snow crystal cohesion and drift threshold wind speed. Further measurements above a variety of sea ice surfaces will be needed to address this issue.
-
Modelled saltation layer snow mixing ratios exceed absolute values by a factor of 10, but the relative changes match the observations, and so the impact on calculating the SSA mass flux from blowing snow QSSA is minor.
-
Retrieval of mean particle diameter and shape parameter α from fitting a two-parameter gamma distribution to observed snow particle size spectra is robust, even when data exclude very small snow particles (dp<46 µm); a recommended range of and α values is given for blowing-snow episodes. Relative contributions from precipitating snow to total suspended snow particles become more important a few tens of metres above the sea ice surface and need to be accounted for when interpreting snow particle size spectra. Future work needs to fill the observational gap (dp 12–46 µm) between very small snow particles and aerosol due to the importance for the formation of submicron aerosol and associated climate impacts.
-
At a given salt migration distance from the sea ice surface it is total snowpack depth that determines the salinity probability distribution of snow on sea ice, consistent with previous studies (Dominé et al., 2004; Massom et al., 2001). Since snow on FYI is in general more shallow than on MYI, salinity probability distributions of FYI and MYI are different, which needs to be accounted for in model studies. Secondary factors potentially increasing the difference in salinity between FYI and MYI and identified previously (e.g. Massom et al., 2001) are more frequent flooding of FYI with seawater due to negative freeboard and MYI desalination due to brine drainage. Snow depth retrieved from satellites may allow estimating snow salinity in the absence of ground-based measurements.
Snow salinity was shown to be a sensitive model parameter (Yang et al., 2019), which implies that SSA production above FYI should be larger than above MYI. Therefore, shifts in the ratio of FYI and MYI over time are expected to contribute to the variability of SSA in ice cores, which represents both an opportunity and a challenge for the quantitative interpretation of the ice core proxy for sea ice. Similar in situ measurements are needed to corroborate the importance of sea salt aerosol production from blowing snow also in the Arctic to validate atmospheric and ice core models (e.g. Rhodes et al., 2017; Huang and Jaeglé, 2017).
Concentration, size distribution, and chemical composition of snow particles, sea salt aerosol, and snow on sea ice are stored in the UK Polar Data Centre, Natural Environment Research Council, UK Research and Innovation (https://doi.org/10.5285/853dd176-bc7a-48d4-a6be-33bcc0f17eeb, Frey et al., 2019). Meteorological data are available via the World Data Centre PANGAEA (https://doi.org/10.1594/PANGAEA.819610, König-Langlo, 2013a; and https://doi.org/10.1594/PANGAEA.820843, König-Langlo, 2013b).
The supplement related to this article is available online at: https://doi.org/10.5194/acp-20-2549-2020-supplement.
MF, EW, AJ and PA designed the field experiments. MF, DJ and MNM carried out the field measurements. SN and IB contributed to CLASP; KN and PA contributed to SPC instruments and data interpretation. MF prepared the manuscript and led the data interpretation with contributions from all co-authors.
The authors declare that they have no conflict of interest.
We are grateful to the Alfred Wegener Institute for Polar and Marine Research for enabling our participation in expedition ANT-XXIX/6 and ANT-XXIX/7, cruise leader Peter Lemke, the captain and crew of RV Polarstern, and participating scientists for providing scientific and logistical support. We thank Emily Ludlow and Rebecca Tuckwell for support of the IC analysis at BAS; Julian Klepacki, Andrew Webb (BAS) and Shane Rodwell (SAMS) for invaluable engineering support; Katherine Leonard for helpful discussions and lending the rocket traps; Tony Phillips for generating the Antarctic sea ice map.
This research has been supported by the Natural Environment Research Council (UK) through the BLOWSEA project (grant nos. NE/J023051/1 and NE/J020303/1).
This paper was edited by Thorsten Bartels-Rausch and reviewed by two anonymous referees.
Abbatt, J. P. D., Thomas, J. L., Abrahamsson, K., Boxe, C., Granfors, A., Jones, A. E., King, M. D., Saiz-Lopez, A., Shepson, P. B., Sodeau, J., Toohey, D. W., Toubin, C., von Glasow, R., Wren, S. N., and Yang, X.: Halogen activation via interactions with environmental ice and snow in the polar lower troposphere and other regions, Atmos. Chem. Phys., 12, 6237–6271, https://doi.org/10.5194/acp-12-6237-2012, 2012. a, b, c
Abrahamsson, K., Granfors, A., Ahnoff, M., Cuevas, C. A., and Saiz-Lopez, A.: Organic bromine compounds produced in sea ice in Antarctic winter, Nat. Commun., 9, 5291, https://doi.org/10.1038/s41467-018-07062-8, 2018. a
Abram, N. J., Wolff, E. W., and Curran, M. A.: A review of sea ice proxy information from polar ice cores, Quaternary Sci. Rev., 79, 168–183, https://doi.org/10.1016/j.quascirev.2013.01.011, 2013. a, b
Anderson, P. S.: A Method for Rescaling Humidity Sensors at Temperatures Well below Freezing, J. Atmos. Ocean Tech., 11, 1388–1391, https://doi.org/10.1175/1520-0426(1994)011<1388:AMFRHS>2.0.CO;2, 1994. a
Arndt, S. and Paul, S.: Variability of winter snow properties on different spatial scales in the Weddell Sea, J. Geophys. Res., https://doi.org/10.1029/2018JC014447, 2018. a
Artiglia, L., Edebeli, J., Orlando, F., Chen, S., Lee, M.-T., Corral Arroyo, P., Gilgen, A., Bartels-Rausch, T., Kleibert, A., Vazdar, M., Andres Carignano, M., Francisco, J. S., Shepson, P. B., Gladich, I., and Ammann, M.: A surface-stabilized ozonide triggers bromide oxidation at the aqueous solution-vapour interface, Nat. Commun., 8, 700, https://doi.org/10.1038/s41467-017-00823-x, 2017. a
Boucher, O., Randall, D., Artaxo, P., Bretherton, C., Feingold, G., Forster, P., Kerminen, V.-M., Kondo, Y., Liao, H., Lohmann, U., Rasch, P., Satheesh, S. K., Sherwood, S., Stevens, B., and Zhang, X. Y.: Clouds and Aerosols, in: Climate Change 2013: The Physical Science Basis. Contribution of Working Group I to the Fifth Assessment Report of the Intergovernmental Panel on Climate Change, edited by: Stocker, T. F., Qin, D., Plattner, G.-K., Tignor, M., Allen, S. K., Boschung, J., Nauels, A., Xia, Y., Bex, V., and Midgley, P. M., Cambridge University Press, Cambridge, United Kingdom and New York, NY, USA, chap. 7, 571–658, 2013. a
Budd, W.: The drifting of non-uniform snow particles, in: Studies in Antarctic Meteorology, edited by: Rubin, M. J., American Geophysical Union, Antarct. Res. Ser., 9, 59–70, 1966. a, b, c
Butler, B. M., Papadimitriou, S., Santoro, A., and Kennedy, H.: Mirabilite solubility in equilibrium sea ice brines, Geochim. Cosmochim. Ac., 182, 40–54, https://doi.org/10.1016/j.gca.2016.03.008, 2016. a, b, c
Choi, S., Theys, N., Salawitch, R. J., Wales, P. A., Joiner, J., Canty, T. P., Chance, K., Suleiman, R. M., Palm, S. P., Cullather, R. I., Darmenov, A. S., Silva, A., Kurosu, T. P., Hendrick, F., and Van Roozendael, M.: Link Between Arctic Tropospheric BrO Explosion Observed From Space and Sea-Salt Aerosols From Blowing Snow Investigated Using Ozone Monitoring Instrument BrO Data and GEOS-5 Data Assimilation System, J. Geophys. Res., 123, 6954–6983, https://doi.org/10.1029/2017JD026889, 2018. a
Comiso, J. C.: Bootstrap Sea Ice Concentrations from Nimbus-7 SMMR and DMSP SSM/I-SSMIS, Version 3, NASA National Snow and Ice Data Center Distributed Active Archive Center, Boulder, Colorado USA, https://doi.org/10.5067/7Q8HCCWS4I0R, 2017. a, b
de Leeuw, G., Andreas, E. L., Anguelova, M. D., Fairall, C. W., Lewis, E. R., O'Dowd, C., Schulz, M., and Schwartz, S. E.: Production flux of sea spray aerosol, Rev. Geophys., 49, RG2001, https://doi.org/10.1029/2010RG000349, 2011. a
DeMott, P. J., Hill, T. C. J., McCluskey, C. S., Prather, K. A., Collins, D. B., Sullivan, R. C., Ruppel, M. J., Mason, R. H., Irish, V. E., Lee, T., Hwang, C. Y., Rhee, T. S., Snider, J. R., McMeeking, G. R., Dhaniyala, S., Lewis, E. R., Wentzell, J. J. B., Abbatt, J., Lee, C., Sultana, C. M., Ault, A. P., Axson, J. L., Diaz Martinez, M., Venero, I., Santos-Figueroa, G., Stokes, M. D., Deane, G. B., Mayol-Bracero, O. L., Grassian, V. H., Bertram, T. H., Bertram, A. K., Moffett, B. F., and Franc, G. D.: Sea spray aerosol as a unique source of ice nucleating particles, P. Natl. Acad. Sci. USA, 113, 5797–5803, https://doi.org/10.1073/pnas.1514034112, 2016. a
Déry, S. J. and Yau, M.: A Bulk Blowing Snow Model, Bound.-Lay. Meteorol., 93, 237–251, https://doi.org/10.1023/A:1002065615856, 1999. a, b, c, d, e
Déry, S. J. and Yau, M. K.: Simulation Of Blowing Snow In The Canadian Arctic Using A Double-Moment Model, Bound.-Lay. Meteorol., 99, 297–316, https://doi.org/10.1023/A:1018965008049, 2001. a, b, c, d
Dominé, F., Sparapani, R., Ianniello, A., and Beine, H. J.: The origin of sea salt in snow on Arctic sea ice and in coastal regions, Atmos. Chem. Phys., 4, 2259–2271, https://doi.org/10.5194/acp-4-2259-2004, 2004. a, b
Dover, S. E.: Numerical Modelling of Blowing Snow, PhD thesis, University of Leeds, Leeds, 233 pp., 1993. a, b, c, d, e
Flato, G., Marotzke, J., Abiodun, B., Braconnot, P., Chou, S. C., Collins, W., Cox, P., Driouech, F., Emori, S., Eyring, V., Forest, C., Gleckler, P., Guilyardi, E., Jakob, C., Kattsov, V., Reason C., and Rummukainen, M.: Evaluation of Climate Models, in: Climate Change 2013: The Physical Science Basis. Contribution of Working Group I to the Fifth Assessment Report of the Intergovernmental Panel on Climate Change, edited by: Stocker, T. F., Qin, D., Plattner, G.-K., Tignor, M., Allen, S. K., Boschung, J., Nauels, A., Xia, Y., Bex, V., and Midgley, P. M., Cambridge University Press, Cambridge, United Kingdom and New York, NY, USA, chap. 9, 741–866, https://doi.org/10.1017/CBO9781107415324.020, 2013. a
Frey, M. M.: Salinity profiles of snow on sea ice in the Weddell Sea (Antarctica) during austral winter 2013, Tech. rep., NERC – Polar Data Centre, Cambridge, UK, https://doi.org/10.5285/c0261633-fd14-4d45-a58d-72998816c4cd, 2017. a
Frey, M. M., Bales, R. C., and McConnell, J. R.: Climate sensitivity of the century-scale hydrogen peroxide (H2O2) record preserved in 23 ice cores from West Antarctica, J. Geophys. Res., 111, D21301, https://doi.org/10.1029/2005JD006816, 2006. a, b
Frey, M. M., Norris, S., Brooks, I., Anderson, P., Nishimura, K., Yang, X., Jones, A., Nerentorp Mastromonaco, M., Jones, D., and Wolff, E.: Concentration, size distribution and chemical composition of snow particles, sea salt aerosol and snow on sea ice in the Weddell Sea (Antarctica) during austral winter/spring 2013, Polar Data Centre,Natural Environment Research Council, UK Research & Innovation, https://doi.org/10.5285/853dd176-bc7a-48d4-a6be-33bcc0f17eeb, 2019. a
Giordano, M. R., Kalnajs, L. E., Goetz, J. D., Avery, A. M., Katz, E., May, N. W., Leemon, A., Mattson, C., Pratt, K. A., and DeCarlo, P. F.: The importance of blowing snow to halogen-containing aerosol in coastal Antarctica: influence of source region versus wind speed, Atmos. Chem. Phys., 18, 16689–16711, https://doi.org/10.5194/acp-18-16689-2018, 2018. a
Hara, K., Osada, K., Yabuki, M., Takashima, H., Theys, N., and Yamanouchi, T.: Important contributions of sea-salt aerosols to atmospheric bromine cycle in the Antarctic coasts, Scientific Reports, 8, 13852, https://doi.org/10.1038/s41598-018-32287-4, 2018. a, b
Hill, K. D., Dauphinee, T. M., and Woods, D. J.: The extension of the Practical Salinity Scale 1978 to low salinities, IEEE J. Oceanic Eng., 11, 109–112, 1986. a
Hill, M. K., Brooks, B. J., Norris, S. J., Smith, M. H., Brooks, I. M., and de Leeuw, G.: A Compact Lightweight Aerosol Spectrometer Probe (CLASP), J. Atmos. Ocean. Tech., 25, 1996–2006, https://doi.org/10.1175/2008JTECHA1051.1, 2008. a, b, c
Huang, J. and Jaeglé, L.: Wintertime enhancements of sea salt aerosol in polar regions consistent with a sea ice source from blowing snow, Atmos. Chem. Phys., 17, 3699–3712, https://doi.org/10.5194/acp-17-3699-2017, 2017. a, b, c, d, e
Jacobson, M. Z.: Fundamentals of Atmospheric Modeling, Cambridge University Press, Cambridge, United Kingdom, 2005. a
Jones, A. E., Wolff, E. W., Ames, D., Bauguitte, S. J.-B., Clemitshaw, K. C., Fleming, Z., Mills, G. P., Saiz-Lopez, A., Salmon, R. A., Sturges, W. T., and Worton, D. R.: The multi-seasonal NOy budget in coastal Antarctica and its link with surface snow and ice core nitrate: results from the CHABLIS campaign, Atmos. Chem. Phys., 11, 9271–9285, https://doi.org/10.5194/acp-11-9271-2011, 2011. a
Jones, A. E., Anderson, P. S., Begoin, M., Brough, N., Hutterli, M. A., Marshall, G. J., Richter, A., Roscoe, H. K., and Wolff, E. W.: BrO, blizzards, and drivers of polar tropospheric ozone depletion events, Atmos. Chem. Phys., 9, 4639–4652, https://doi.org/10.5194/acp-9-4639-2009, 2009. a
Jourdain, B., Preunkert, S., Cerri, O., Castebrunet, H., Udisti, R., and Legrand, M.: Year-round record of sizesegregated aerosol composition in central Antarctica (Concordia station): Implications for the degree of fractionation of sea-salt particles, J. Geophys. Res., 113, D14308, https://doi.org/10.1029/2007JD009584, 2008. a
Kaimal, J. and Finnigan, J. J.: Atmospheric Boundary Layer Flows, Oxford University Press, Oxford, United Kingdom, 1994. a
Kalnajs, L. E., Avallone, L. M., and Toohey, D. W.: Correlated measurements of ozone and particulates in the Ross Island region, Antarctica, Geophys. Res. Lett., 40, 6319–6323, https://doi.org/10.1002/2013GL058422, 2013. a
King, J. C., Anderson, P. S., and Mann, G. W.: The seasonal cycle of sublimation at Halley, Antarctica, J. Glaciol., 47, 1–8, 2001. a, b
King, J. C., Anderson, P. S., Smith, M. C., and Mobbs, S. D.: The surface energy and mass balance at Halley, Antarctica during winter, J. Geophys. Res., 101, 19119–19128, 1996. a
King, J. C. and Anderson, P. S.: Heat and water vapor fluxes and scalar roughness lengths over an Antarctic ice shelf, Bound.-Lay. Meteorol., 69, 101–121, 1994. a
König-Langlo, G.: Meteorological observations during POLARSTERN cruise ANT-XXIX/6 (AWECS), Alfred Wegener Institute, Helmholtz Centre for Polar and Marine Research, Bremerhaven, PANGAEA, https://doi.org/10.1594/PANGAEA.819610, 2013a. a, b
König-Langlo, G.: Meteorological observations during POLARSTERN cruise ANT-XXIX/7, Alfred Wegener Institute, Helmholtz Centre for Polar and Marine Research, Bremerhaven, PANGAEA, https://doi.org/10.1594/PANGAEA.820843, 2013b. a, b
Legrand, M., Yang, X., Preunkert, S., and Theys, N.: Year-round records of sea salt, gaseous, and particulate inorganic bromine in the atmospheric boundary layer at coastal (Dumont d'Urville) and central (Concordia) East Antarctic sites, J. Geophys. Res.-Atmos., 121, 997–1023, https://doi.org/10.1002/2015JD024066, 2016. a, b, c, d, e, f, g
Legrand, M., Preunkert, S., Wolff, E., Weller, R., Jourdain, B., and Wagenbach, D.: Year-round records of bulk and size-segregated aerosol composition in central Antarctica (Concordia site) – Part 1: Fractionation of sea-salt particles, Atmos. Chem. Phys., 17, 14039–14054, https://doi.org/10.5194/acp-17-14039-2017, 2017. a, b, c, d, e
Lemke, P.: The Expedition of the Research Vessel Polarstern to the Antarctic in 2013 (ANT-XXIX/6), Reports on Polar and Marine Research, 679, 154 pp., https://doi.org/10.2312/BzPM_0679_2014, 2014. a
Levine, J. G., Yang, X., Jones, A. E., and Wolff, E. W.: Sea salt as an ice core proxy for past sea ice extent: A process-based model study, J. Geophys. Res.-Atmos., 119, 5737–5756, https://doi.org/10.1002/2013JD020925, 2014. a, b, c
Li, L. and Pomeroy, J. W.: Estimates of Threshold Wind Speeds for Snow Transport Using Meteorological Data, J. Appl. Meteorol., 36, 205–213, https://doi.org/10.1175/1520-0450(1997)036<0205:EOTWSF>2.0.CO;2, 1997. a, b, c, d, e, f
Lieb-Lappen, R. M. and Obbard, R. W.: The role of blowing snow in the activation of bromine over first-year Antarctic sea ice, Atmos. Chem. Phys., 15, 7537–7545, https://doi.org/10.5194/acp-15-7537-2015, 2015. a
Long, M. S., Keene, W. C., Easter, R. C., Sander, R., Liu, X., Kerkweg, A., and Erickson, D.: Sensitivity of tropospheric chemical composition to halogen-radical chemistry using a fully coupled size-resolved multiphase chemistry–global climate system: halogen distributions, aerosol composition, and sensitivity of climate-relevant gases, Atmos. Chem. Phys., 14, 3397–3425, https://doi.org/10.5194/acp-14-3397-2014, 2014. a, b
Mann, G. W., Anderson, P., and Mobbs, S.: Profile measurements of blowing snow at Halley, Antarctica, J. Geophys. Res., 105, 24491–24508, https://doi.org/10.1029/2000JD900247, 2000. a, b, c, d, e
Mann, G. W., Carslaw, K. S., Reddington, C. L., Pringle, K. J., Schulz, M., Asmi, A., Spracklen, D. V., Ridley, D. A., Woodhouse, M. T., Lee, L. A., Zhang, K., Ghan, S. J., Easter, R. C., Liu, X., Stier, P., Lee, Y. H., Adams, P. J., Tost, H., Lelieveld, J., Bauer, S. E., Tsigaridis, K., van Noije, T. P. C., Strunk, A., Vignati, E., Bellouin, N., Dalvi, M., Johnson, C. E., Bergman, T., Kokkola, H., von Salzen, K., Yu, F., Luo, G., Petzold, A., Heintzenberg, J., Clarke, A., Ogren, J. A., Gras, J., Baltensperger, U., Kaminski, U., Jennings, S. G., O'Dowd, C. D., Harrison, R. M., Beddows, D. C. S., Kulmala, M., Viisanen, Y., Ulevicius, V., Mihalopoulos, N., Zdimal, V., Fiebig, M., Hansson, H.-C., Swietlicki, E., and Henzing, J. S.: Intercomparison and evaluation of global aerosol microphysical properties among AeroCom models of a range of complexity, Atmos. Chem. Phys., 14, 4679–4713, https://doi.org/10.5194/acp-14-4679-2014, 2014. a
Massom, R. A., Eicken, H., Hass, C., Jeffries, M. O., Drinkwater, M. R., Sturm, M., Worby, A. P., Wu, X., Lytle, V. I., Ushio, S., Morris, K., Reid, P. A., Warren, S. G., and Allison, I.: Snow on Antarctic Sea Ice, Rev. Geophys., 39, 413–445, https://doi.org/10.1029/2000RG000085, 2001. a, b, c, d, e, f, g
May, N. W., Quinn, P. K., McNamara, S. M., and Pratt, K. A.: Multiyear study of the dependence of sea salt aerosol on wind speed and sea ice conditions in the coastal Arctic, J. Geophys. Res., 121, 9208–9219, https://doi.org/10.1002/2016JD025273, 2016JD025273, 2016. a
McDougall, T. and Barker, P.: Getting started with TEOS-10 and the Gibbs Seawater (GSW) Oceanographic Toolbox, Tech. Rep. ISBN 978-0-646-55621-5, SCOR/IAPSO WG127, available at: http://www.teos-10.org (last access: 14 February 2020), 2011. a
Meyer, B.: The Expedition of the Research Vessel “Polarstern” to the Antarctic in 2013 (ANT-XXIX/7), Reports on Polar and Marine Research, 674, 130 pp., https://doi.org/10.2312/BzPM_0674_2014, 2014. a
Millero, F. J., Feistel, R., Wright, D. G., and McDougall, T. J.: The composition of standard seawater and the definition of the reference-composition salinity scale, Deep-Sea Res. Pt. I, 55, 50–72, 2008. a, b, c, d
Nilsson, E. D., Rannik, Ü., Swietlicki, E., Leck, C., Aalto, P. P., Zhou, J., and Norman, M.: Turbulent aerosol fluxes over the Arctic Ocean: 2. Wind-driven sources from the sea, J. Geophys. Res., 106, 32139–32154, https://doi.org/10.1029/2000JD900747, 2001. a
Nishimura, K. and Nemoto, M.: Blowing snow at Mizuho station, Antarctica, Philos. T. Roy. Soc. A, 363, 1647–1662, https://doi.org/10.1098/rsta.2005.1599, 2005. a, b, c, d, e, f, g, h
Nishimura, K., Yokoyama, C., Ito, Y., Nemoto, M., Naaim-Bouvet, F., Bellot, H., and Fujita, K.: Snow particle speeds in drifting snow, J. Geophys. Res.-Atmos., 119, 9901–9913, https://doi.org/10.1002/2014JD021686, 2014. a, b
Norris, S. J., Brooks, I. M., de Leeuw, G., Smith, M. H., Moerman, M., and Lingard, J. J. N.: Eddy covariance measurements of sea spray particles over the Atlantic Ocean, Atmos. Chem. Phys., 8, 555–563, https://doi.org/10.5194/acp-8-555-2008, 2008. a, b
Norris, S. J., Brooks, I. M., Hill, M. K., Brooks, B. J., Smith, M. H., and Sproson, D. A. J.: Eddy covariance measurements of the sea spray aerosol flux over the open ocean, J. Geophys. Res., 117, D07210, https://doi.org/10.1029/2011JD016549, 2012. a, b
O'Dowd, C. D., Smith, M. H., Consterdine, I. E., and Lowe, J. A.: Marine aerosol, sea-salt, and the marine sulphur cycle: a short review, Atmos. Environ., 31, 73–80, https://doi.org/10.1016/S1352-2310(96)00106-9, 1997. a, b
Oum, K. W., Lakin, M. J., and Finlayson-Pitts, B. J.: Bromine activation in the troposphere by the dark reaction of O3 with seawater ice, Geophys. Res. Lett., 25, 3923–3926, https://doi.org/10.1029/1998GL900078, 1998. a
Pratt, K. A., Custard, K. D., Shepson, P. B., Douglas, T. A., Pohler, D., General, S., Zielcke, J., Simpson, W. R., Platt, U., Tanner, D. J., Huey, G., Carlsen, M., and Stirm, B. H.: Photochemical production of molecular bromine in Arctic surface snowpacks, Nat. Geosci., 6, 351–356, https://doi.org/10.1038/ngeo1779, 2013. a
Rankin, A. M. and W. Wolff, E.: A year-long record of size-segregated aerosol composition at Halley, Antartica, J. Geophys. Res., 108, 4775, https://doi.org/10.1029/2003JD003993, 2003. a, b
Rankin, A. M., Auld, V., and Wolff, E. W.: Frost flowers as a source of fractionated sea salt aerosol in the polar regions, Geophys. Res. Lett., 27, 3469–3472, https://doi.org/10.1029/2000GL011771, 2000. a, b, c
Rhodes, R. H., Yang, X., Wolff, E. W., McConnell, J. R., and Frey, M. M.: Sea ice as a source of sea salt aerosol to Greenland ice cores: a model-based study, Atmos. Chem. Phys., 17, 9417–9433, https://doi.org/10.5194/acp-17-9417-2017, 2017. a, b, c, d
Roscoe, H. K., Brooks, B., Jackson, A. V., Smith, M. H., Walker, S. J., Obbard, R. W., and Wolff, E. W.: Frost flowers in the laboratory: Growth, characteristics, aerosol, and the underlying sea ice, J. Geophys. Res., 116, D12301, https://doi.org/10.1029/2010JD015144, 2011. a
Sander, R., Keene, W. C., Pszenny, A. A. P., Arimoto, R., Ayers, G. P., Baboukas, E., Cainey, J. M., Crutzen, P. J., Duce, R. A., Hönninger, G., Huebert, B. J., Maenhaut, W., Mihalopoulos, N., Turekian, V. C., and Van Dingenen, R.: Inorganic bromine in the marine boundary layer: a critical review, Atmos. Chem. Phys., 3, 1301–1336, https://doi.org/10.5194/acp-3-1301-2003, 2003. a, b, c, d
Schmidt, R. A.: Vertical profiles of wind speed, snow concentration, and humidity in blowing snow, Bound.-Lay. Meteorol., 23, 223–246, https://doi.org/10.1007/BF00123299, 1982. a
Schmidt, R. A., Meister, R., and Gubler, H.: Comparison of snow drifting measurements at an alpine ridge crest, Cold Reg. Sci. Technol., 9, 131–141, https://doi.org/10.1016/0165-232X(84)90005-3, 1984. a
Simpson, W. R., Alvarez-Aviles, L., Douglas, T. A., Sturm, M., and Domine, F.: Halogens in the coastal snow pack near Barrow, Alaska: Evidence for active bromine air-snow chemistry during springtime, Geophys. Res. Lett., 32, L04811, https://doi.org/10.1029/2004GL021748, 2005. a
Soo, J.-C., Monaghan, K., Lee, T., Kashon, M., and Harper, M.: Air sampling filtration media: Collection efficiency for respirable size-selective sampling, Aerosol Sci. Tech., 50, 76–87, 2016. a
Spolaor, A., Vallelonga, P., Plane, J. M. C., Kehrwald, N., Gabrieli, J., Varin, C., Turetta, C., Cozzi, G., Kumar, R., Boutron, C., and Barbante, C.: Halogen species record Antarctic sea ice extent over glacial–interglacial periods, Atmos. Chem. Phys., 13, 6623–6635, https://doi.org/10.5194/acp-13-6623-2013, 2013. a
Unesco: The Practical Salinity Scale 1978 and the International Equation of State of Seawater 1980, Unesco technical papers in marine science, 36, 25 pp., 1981. a
Unesco: Algorithms for computation of fundamental properties of seawater, Unesco technical papers in marine science, 44, 53 pp., 1983. a
Van Dijk, A., Moen, A., and De Bruin, H.: The principles of surface flux physics: theory, practice and description of the ECPACK library, Internal Report 2004/1, Meteorology and Air Quality Group, Wageningen University, Wageningen, The Netherlands, 2006. a
Wagenbach, D., Ducroz, F., Mulvaney, R., Keck, L., Minikin, A., Legrand, M., Hall, J. S., and Wolff, E. W.: Sea-salt aerosol in coastal Antarctic regions, J. Geophys. Res., 103, 10961–10974, https://doi.org/10.1029/97JD01804, 1998. a, b, c, d, e, f, g, h, i
Weller, R., Wagenbach, D., Legrand, M., Elsässer, C., Tian-Kunze, X., and König-Langlo, G.: Continuous 25-yr aerosol records at coastal Antarctica – I: inter-annual variability of ionic compounds and links to climate indices, Tellus B, 63, 901–919, https://doi.org/10.1111/j.1600-0889.2011.00542.x, 2011. a, b
Wolff, E. W., Rankin, A. M., and Rothlisberger, R.: An ice core indicator of Antarctic sea ice production?, Geophys. Res. Lett., 30, 2158, https://doi.org/10.1029/2003GL018454, 2003. a
Wolff, E. W., Legrand, M. R., and Wagenbach, D.: Coastal Antarctic aerosol and snowfall chemistry, J. Geophys. Res., 103, 10927–10934, 1998. a
Yang, X., Pyle, J. A., and Cox, R. A.: Sea salt aerosol production and bromine release: Role of snow on sea ice, Geophys. Res. Lett., 35, L16815, https://doi.org/10.1029/2008GL034536, 2008. a, b, c, d, e, f, g, h, i, j
Yang, X., Pyle, J. A., Cox, R. A., Theys, N., and Van Roozendael, M.: Snow-sourced bromine and its implications for polar tropospheric ozone, Atmos. Chem. Phys., 10, 7763–7773, https://doi.org/10.5194/acp-10-7763-2010, 2010. a, b
Yang, X., Neděla, V., Runštuk, J., Ondrušková, G., Krausko, J., Vetráková, Ľ., and Heger, D.: Evaporating brine from frost flowers with electron microscopy and implications for atmospheric chemistry and sea-salt aerosol formation, Atmos. Chem. Phys., 17, 6291–6303, https://doi.org/10.5194/acp-17-6291-2017, 2017. a
Yang, X., Frey, M. M., Rhodes, R. H., Norris, S. J., Brooks, I. M., Anderson, P. S., Nishimura, K., Jones, A. E., and Wolff, E. W.: Sea salt aerosol production via sublimating wind-blown saline snow particles over sea ice: parameterizations and relevant microphysical mechanisms, Atmos. Chem. Phys., 19, 8407–8424, https://doi.org/10.5194/acp-19-8407-2019, 2019. a, b, c, d, e, f, g, h, i, j, k, l