the Creative Commons Attribution 4.0 License.
the Creative Commons Attribution 4.0 License.
 | 02 Mar 2020
Molecular compositions and optical properties of dissolved brown carbon in biomass burning, coal combustion, and vehicle emission aerosols illuminated by excitation–emission matrix spectroscopy and Fourier transform ion cyclotron resonance mass spectrometry analysis
Jiao Tang
Tao Su
Yong Han
Yangzhi Mo
Hongxing Jiang
Min Cui
Bin Jiang
Yingjun Chen
Jianhui Tang
Jianzhong Song
Ping'an Peng
Gan Zhang
Brown carbon (BrC) plays an essential impact on radiative forcing due to its ability to absorb sunlight. In this study, the optical properties and molecular characteristics of water-soluble and methanol-soluble organic carbon (OC; MSOC) emitted from the simulated combustion of biomass and coal fuels and vehicle emissions were investigated using ultraviolet–visible (UV–vis) spectroscopy, excitation–emission matrix (EEM) spectroscopy, and Fourier transform ion cyclotron resonance mass spectrometry (FT-ICR MS) coupled with electrospray ionization (ESI). The results showed that these smoke aerosol samples from biomass burning (BB) and coal combustion (CC) had a higher mass absorption efficiency at 365 nm (MAE365) than vehicle emission samples. A stronger MAE365 value was also found in MSOC than water-soluble organic carbon (WSOC), indicating low polar compounds would possess a higher light absorption capacity. Parallel factor (PARAFAC) analysis identified six types of fluorophores (P1–6) in WSOC including two humic-like substances (HULIS-1) (P1 and P6), three protein-like substances (PLOM) (P2, P3, and P5), and one undefined substance (P4). HULIS-1 was mainly from aging vehicle exhaust particles; P2 was only abundant in BB aerosols; P3 was ubiquitous in all tested aerosols; P4 was abundant in fossil burning aerosols; and P5 was more intense in fresh vehicle exhaust particles. The MSOC chromophores (six components; C1–6) exhibited consistent characteristics with WSOC, suggesting the method could be used to indicate the origins of chromophores. FT-ICR mass spectra showed that CHO and CHON were the most abundant components of WSOC, but S-containing compounds appeared in a higher abundance in CC aerosols and vehicle emissions than BB aerosols, while considerably fewer S-containing compounds largely with CHO and CHON were detected in MSOC. The unique formulas of different sources in the van Krevelen (VK) diagram presented different molecular distributions. To be specific, BB aerosols with largely CHO and CHON had a medium H ∕ C and low O ∕ C ratio, while CC aerosols and vehicle emissions largely with S-containing compounds had an opposite H ∕ C and O ∕ C ratio. Moreover, the light absorption capacity of WSOC and MSOC was positively associated with the unsaturation degree and molecular weight in the source aerosols. The above results are potentially applicable to further studies on the EEM-based or molecular-characteristic-based source apportionment of chromophores in atmospheric aerosols.
- Article
(5093 KB) -
Supplement
(3124 KB) - BibTeX
- EndNote


Carbonaceous aerosols play an important role in the Earth's radiative balance. One such aerosol, black carbon (BC), absorbs significant amounts of light and exerts a warming effect, while organic carbon (OC) was initially thought to only scatter solar radiation (Wong et al., 2017; Mo et al., 2017; Saleh et al., 2014). However, recent studies show that there are certain types of OC that absorb radiation efficiently in the near-ultraviolet (UV) (300–400 nm) and visible ranges, which are called brown carbon (BrC). They can positively shift the net direct radiation forcing (DRF) (Saleh et al., 2014; Laskin et al., 2015; Kirchstetter and Thatcher, 2012). According to a simulation model, the inclusion of BrC may enhance total aerosol absorption by 7 %–19 % (Feng et al., 2013). According to previous studies, BrC in atmospheric aerosols mainly originates from emissions from biomass burning (BB) and coal combustion (CC), vehicle exhaust, and the formation of secondary organic aerosol (SOA) (Zhu et al., 2018; Laskin et al., 2015; Xie et al., 2017; Kumar et al., 2018). Among them, primary emissions contribute significantly to BrC absorption (Fan et al., 2012; Yan et al., 2015; Zhang et al., 2011). Recently, many studies have investigated the optical properties and molecular characteristics of BrC in laboratory-simulated combustion (Budisulistiorini et al., 2017; Lin et al., 2018, 2016; Song et al., 2019) and their light absorption in controlled vehicle emissions (Xie et al., 2017). However, there were no available studies on the comprehensive characteristics of BrC in various sources and their variations in optical and chemical information impacted by these sources. Therefore, investigating BrC in different sources would improve our understanding of the evolution of BrC absorption.
Excitation–emission matrix (EEM) spectroscopy can provide structural information of chromophores and thus has been widely applied to identify the sources and chemical nature of chromophoric dissolved organic matter (CDOM) in aquatic environments since the 1990s (Shimabuku et al., 2017; Wells et al., 2017; Bhattacharya and Osburn, 2017; Coble, 1996). As the optical properties of chromophoric water-soluble organic carbon (WSOC) in the atmosphere were similar to CDOM in aquatic environments (Qin et al., 2018; Fu et al., 2015; Graber and Rudich, 2006), this technique could extend to atmospheric research. It has to be mentioned that fluorescence is a radiative process that occurs between two energy levels of the same multiplicity (Andrade-Eiroa et al., 2013). Generally, compounds with rigid planar structures and highly conjugated systems have intrinsic fluorescence emission characteristics and are important BrC chromophores, such as aromatic acids, phenols, nitroaromatics, polycyclic aromatic hydrocarbons (PAHs), quinones, and so on (Lin et al., 2018; Zhang et al., 2013). In addition, chromophores in fluorescence spectra could be considered as a “fingerprinting” tool, especially when combining it with parallel factor (PARAFAC) analysis, which can decompose EEM signals into their underlying chemical components (Murphy et al., 2013). For instance, Chen et al. (2016b) observed that the water-extracted chromophores identified by PARAFAC from the urban, forest, and marine aerosols were varied with the sampling sites and periods and were affected by oxidative and functional groups. Lee et al. (2013) illustrated that SOA derived from the oxidation of limonene and decene with O3 and OH had different fluorescence spectra. Therefore, BrC characteristics from various sources may differ. However, when analyzing chromophoric BrC using fluorescence spectra, the challenges are the lack of a classification system for fluorescence spectra, to distinguish chromophores from most non-absorbing constituents, and to determine the chemical structures of the chromophores.
Fourier transform ion cyclotron resonance mass spectrometry (FT-ICR MS) coupled with electrospray ionization (ESI) is a powerful platform for investigating the detailed characteristics of organic material at the molecular level. With the advantage of ultrahigh resolution, the accuracy of mass measurements, and high sensitivity (Feng et al., 2016), FT-ICR MS has been successfully used to characterize organic aerosols (Jiang et al., 2016; Song et al., 2018; Mo et al., 2018), cloud water (Zhao et al., 2013), and natural organic matter (Sleighter et al., 2012; Feng et al., 2016). For example, a previous study has determined their molecular families of dissolved organic matter (DOM) associated with fluorescent components by using FT-ICR MS (Stubbins et al., 2014), which could provide more chemical information about chromophores.
Residential CC and BB emissions and motor vehicle emissions are significant anthropogenic sources of air pollutants, especially fine particulate matter (PM) on urban and regional scales (Gentner et al., 2017; Yan et al., 2015; Zhang et al., 2018; Chen et al., 2015). In this study, to obtain a comprehensive understanding of BrC originating from various sources, ultraviolet–visible (UV–vis), EEM, and FT-ICR MS analyses were performed for WSOC and methanol-soluble organic carbon (MSOC) from the smoke particles of simulated combustion of biomass fuels and coals and vehicle emission aerosols. Statistical analysis of PARAFAC was applied to EEM spectra to resolve the fluorescent compounds. All of these and unique molecular characteristics of WSOC and MSOC were analyzed and discussed on the basis of FT-ICR MS. Relationships between optical properties and chemical structures were discussed by using a linear regression coefficient.
2.1 Sample collection and preparation
The smoke particles were collected by the instrument coupled with a dilution channel which was designed to simulate fire emissions representative of “real-world” open BB and household CC activities (Fig. S1 in the Supplement). In the present study, a total of 27 BB samples (IDs1–27) were collected at Xishuangbanna, Yunnan, from 20 May to 3 June 2016, and the detailed sampling process was described in our previous article (Cui et al., 2018). Briefly, raw fuels (rough cm3) were air-dried for several days and ignited in a stainless-steel bowl, and then the rising smoke was collected through a dilution system. The sampling system mainly consists of a dilution tunnel, a residence time chamber, three PM samplers, and so on. Every biomass was burned three times at about 1–2 kg of fuel per burn. Every combustion process lasted for 20 min. The collection of smoke particles started when the fuel ignited, and it ended when the concentration of CO2 was down to atmospheric CO2 level. Dilution ratios of each experimental process were calculated using the CO2 concentrations before and after dilution. The collection flow rate and average dilution ratio were 180 L min−1 and 2.1, respectively. And the other six BB samples (IDs 28–33) were collected in Guangzhou, Guangdong.
The smoke particles of CC (IDs 34–50) were collected in the same way as that of the BB experiment, but they used a stove in Guangzhou, Guangdong, from 18 November 2017 to 23 January 2018. The tested stove is a technically improved stove (named Jin-Yin stove). Due to the difficulty of ignition of coal, we used smokeless charcoal to ignite one third (about 300 g) of the raw-coal chunk (2–5 cm in size) in the stove, removed the charcoal after ignition, and then added the remaining raw-coal chunk (about 700 g) to start to collect the smoke particles. Every coal was also burned three times at about 1 kg of fuel per burn. Every combustion process lasted for about 40–150 min. The collection flow rate and average dilution ratio were 150 L min−1 and 1.5, respectively. Additionally, the modified combustion efficiency (MCE) was calculated to characterize the relative amount of smoldering and flaming combustion phase (Lin et al., 2016; Cui et al., 2018). The average MCE value was 0.73±0.08 for CC experiments, but it was unavailable for the BB experiments because the CO sensor did not work in the field work, which was mentioned in our previous paper (Cui et al., 2018).
Tunnel aerosols (total eight samples; IDs 51–58) were collected at the Siping tunnel from 1 to 2 November 2017 and the Xiaoyang Shan tunnel from 1 to 2 December 2017, in Shanghai and two vehicle exhaust particles (IDs 59–60) were collected from the direct emission of two different trucks (more fresh aerosols). With no other instructions, we used “vehicle emissions” to represent all tunnel aerosols and vehicle exhaust particle samples. These filters were wrapped in aluminum foil and pre-baked at 450 ∘C for 5 h before sampling and stored at −20 ∘C after sampling. Overall, there was a total of 60 total suspended particulate (TSP) matter samples on source emissions in this study, and blank samples that were collected at different times and locations were used for correcting filter samples.
WSOC for UV–vis absorption and EEM analysis were extracted with purified water (resistivity of >18.2Ω) via the ultra sonication of quartz filter punches for 30 min. Because water cannot effectively extract the BrC (Liu et al., 2013; Shetty et al., 2019), the remaining filter was further freeze-dried and extracted with methanol (high-performance liquid chromatography grade; HLPC) to obtain the MSOC constituent for a better understanding of the optical properties and molecular compositions of BrC. It is worth noting that the MSOC in this study is not necessarily like that of the same name in other studies. All the extracts were filtered through a 0.22 µm polytetrafluoroethylene membrane into amber colored-glass vials to remove the insoluble material.
2.2 Carbon analysis
We measured both OC and elemental carbon (EC) using an aerosol carbon analyzer (Sunset Laboratory, Inc., USA), following the National Institute for Occupational Safety and Health (NIOSH) thermal–optical transmittance (TOT) standard method (Mo et al., 2017), and the emission factors (EFs) of PM, OC, and EC were calculated, and detailed information was presented in the Supplement. We also analyzed the elements of biomass (C, H, O, and N) and coal (C, H, O, N, and S) using an elemental analyzer (Vario EL cube, Elementar, Germany), and the results were listed in Tables S1 and S2. The carbon content of WSOC was measured using total organic carbon analysis (Vario TOC cube, Elementar, Germany) before acidification with phosphoric acid to remove inorganic carbon, while the concentration of MSOC was assessed using the method developed by a previous study (Chen et al., 2017b). Briefly, the extracted MSOC was dried gently under nitrogen and then re-dissolved in 500 µL of methanol. Subsequently, 50 µL of the solution was added to the clear quartz filter (area of 1.5 cm2) until dry and analyzed using the TOT standard method.

Figure 1Comparison of MAE365 in the WSOC fraction of source emission aerosols with the other studies. The references were listed as follows: Liu et al., 2018; Mo et al., 2018; Yan et al., 2015; Cheng et al., 2011; Cheng et al., 2016; Xie et al., 2019; Hecobian et al., 2010; Zhang et al., 2013; Park et al., 2018; Wu et al., 2019; Fan et al., 2016; Park and Yu, 2016; Chen et al., 2018.
2.3 UV–vis absorption spectra and EEM fluorescence spectra
The UV–vis absorption and EEM spectra of WSOC and MSOC were analyzed using a UV–vis spectrophotometer (UV-4802, Unico, China) and an Aqualog fluorometer (HORIBA Scientific, USA), respectively. The wavelengths used to characterize the UV–vis spectra were between 200 to 800 nm at a step size of 2 nm. Purified water and methanol were used as a baseline correction for WSOC and MSOC before measurement, respectively. Mass absorption efficiency (MAE; m2 g−1C) was obtained from the following equation (Li et al., 2018):
where Aλ is the value of light absorption at the given wavelength of the spectrophotometer, C (µg C mL−1) is the concentration of WSOC and MSOC, and L is the optical path length (in this study, 0.01 m). Moreover, the pH of WSOC was measured for all samples within the ranges of 5.5–6.5, which generally did not affect the absorbance according to the prior study (Chen et al., 2016a).
The emission and excitation wavelengths of the fluorescence spectra were from 245 to 580 nm and 240 to 500 nm, respectively. The wavelength increments of the emission and excitation scans were 4.66 and 3 nm, respectively. Further, the contributions of solvents to the fluorescence spectra were subtracted.
2.4 Ultrahigh-resolution ESI FT-ICR MS analysis
The WSOC and MSOC of six selected samples including two BB aerosols (Musa and Hevea), two CC aerosols (a anthracite and a bituminous coal), 1 d of tunnel aerosol (combining the aerosols in the inlet and outlet of the tunnel in the same day), and one vehicle exhaust particle sample were analyzed using FT-ICR MS. To remove inorganic ions before instrumental analysis, WSOC was further adjusted to a pH of 2 by the addition of hydrochloric acid (HCl) and then passed through a solid-phase extraction (SPE) cartridge (Oasis HLB – hydrophilic-lipophilic balance, 30 µm, 60 mg/cartridge, Waters Corporation, USA). The constituent retained on the SPE cartridge was eluted with methanol containing 2 % ammonia (v∕v). Eluants were evaporated until dry under a gentle nitrogen gas stream. The solutions extracted by methanol were evaporated under a gentle nitrogen gas stream for preparation.
We used the analysis method of FT-ICR MS described in detail in our previous study (Mo et al., 2018). Briefly, ultrahigh-resolution mass spectra were obtained using a solariX XR FT-ICR MS (Bruker Daltonics GmbH, Bremen, Germany) equipped with a 9.4 T superconducting magnet and an ESI ion source. The system was operated in negative-ionization mode. The ion accumulation time was set to 0.6 s. The lower and upper mass limit was set to a mass-to-charge ratio (m∕z) of 150 and 800 Da, respectively. The mass spectra were externally calibrated with arginine clusters using a linear calibration and then internally recalibrated with typical O6S1 class species peaks using quadratic calibration in DataAnalysis version 4.4 (Bruker Daltonics). A typical mass-resolving power of >450 000 at m∕z 319 with <0.2 ppm absolute mass error was achieved. The mass spectra of field blank filters was analyzed to detect possible contamination following the same procedures. More data processing was presented in Sect. S1 of the Supplement.
2.5 PARAFAC analysis for EEM spectra
PARAFAC analysis with non-negativity constraints was used to explore the fluorescent components in dissolved BrC based on the method established by the previous studies (Murphy et al., 2013; Andersson and Bro, 2000), which was performed using the decomposition routines for Excitation Emission Matrices (drEEM) toolbox version 2.0 using MATLAB (http://models.life.ku.dk/drEEM, last access: June 2014). This method had been widely used in the analysis of fluorescence spectra in aerosols (Chen et al., 2016a, b; Matos et al., 2015; Wu et al., 2019). Absorbance measurements were used to correct the EEM for inner-filter effects (IFEs) according to the previous studies (Luciani et al., 2009; Gu and Kenny, 2009; Fu et al., 2015). The highest light absorbance in the calibrated wavelength range of WSOC and MSOC was not greater than 2 (mostly below 1 at 254 nm), which was appropriate for the inner-filter corrections of the EEMs (Gu and Kenny, 2009; Murphy et al., 2013). Each EEM was normalized to the Raman peak area of purified water collected on the same day to correct fluorescence in Raman units (RUs) at an excitation of 350 nm and corrected for the dilution factor (Murphy et al., 2013, 2010). Additionally, the signals of the first-order and second-order Rayleigh and Raman scattering in the EEM were removed by an interpolation method (Bahram et al., 2006). Repeated convergence of the model was examined based on the iteration of the minimum square principle. The exploration phases of two- to seven-component PARAFAC models contained an evaluation of the shape of spectral loading, leverage analysis, an examination of the core consistency, residual analysis, and split-half analysis (Figs. S2–S7). A six-component PARAFAC model was identified and successfully passed the split-half validation with the split style of S4C6T3 for the WSOC and MSOC in 60 samples, respectively.
3.1 Emission characteristics and light absorption of extracts
The PM, OC, and EC EFs of 27 biomass and 17 coal combustion experiments were summarized in Table S3. The relevant EFs of some biomass species have been previously reported (Cui et al., 2018). In this experiment, the EFs of PM, OC, and EC from 27 types of biomass burning were 15±11 g kg−1 fuel, 8.0±6.4 g kg−1 fuel, and g kg−1 fuel, respectively. The EFs emitted from bituminous CC (PM = g kg−1 fuel, OC = g kg−1 fuel, and EC = g kg−1 fuel) were much higher than those of anthracite combustion (PM = g kg−1 fuel, OC = g kg−1 fuel, and EC = g kg−1 fuel) in the same stove. These differences could be attributed to the high volatile matter content of bituminous coal (Tian et al., 2017; Chen et al., 2005). Note that the CC smoke collection began when the flame had been ignited with one third of the material, and the rest was added. Therefore, the results of our study would be lower than the real values.
MAE can be used to characterize the efficiency of solar energy absorption, which is represented by the degree of conjugation and the amount of electron delocalization in molecules (Chen et al., 2016a). As shown in Fig. 1 and Table S4, MAE at 365 nm (MAE365) was significantly higher in the case of BB and CC aerosols than in vehicle emissions in this study, consistent with the previous findings (Xie et al., 2017; Fan et al., 2016). Bituminous CC aerosols had higher MAE365 values than anthracite combustion aerosols. Here, we introduced the EC ∕ OC ratios, which could be used as an indicator of fire conditions (Xie et al., 2017). Figure S8 showed the MAE365 of WSOC vs. EC ∕ OC relationships for all BB and CC aerosols. The data clearly showed that the WSOC light absorption of BB aerosols was dependent on combustion conditions. However, a weak relationship (p>0.05) in CC aerosols suggested another factor might influence the light absorption, such as maturity (Li et al., 2018). Compared to WSOC, higher MAE365 values were observed in the MSOC collected from BB (2.3±1.1 m2 g−1C) and bituminous CC (3.2±1.1 m2 g−1C) aerosols. This could be due to the fact that these strongly light-absorbing fat-soluble components are likely to be PAHs of a large molecular weight and quinones from BB and fossil fuel combustion (Sun et al., 2007; Chen and Bond, 2010), which were more soluble in a low-polarity solution, but we obtained the opposite results in the case of anthracite combustion and vehicle emissions.
The MAE365 of WSOC in this study was compared with the other studies (Fig. 1). The BB aerosols in this study had a higher MAE365 value than those in other controlled BB experiments, while it was comparable to corn straw burning emissions (Park and Yu, 2016; Fan et al., 2016). Further, the simulated BB aerosols exhibited a higher MAE365 value than those in highly BB-impacted areas (Hecobian et al., 2010), indicating that the aging in the transport process could reduce the light absorption (Dasari et al., 2019). The CC aerosols showed a higher MAE365 value than the other coal experiments (Li et al., 2018; Fan et al., 2016), while comparable values to water-soluble BrC were observed in winter of Beijing (Cheng et al., 2011; Yan et al., 2015). The result indicated the strong influence of BrC in this season in this region. In addition, the simulated combustion aerosols in this study exhibited higher MAE365 values than the other areas (such as Guangzhou, Nanjing, Los Angeles, South Korea, Nepal, and so on) (see Fig. 1).
Methanol has a lower polarity than water and can extract the water-insoluble compounds that are generally stronger chromophores. Chen et al. (2017b) extracted organic matters in aerosols using different polar solutions, and they found water-insoluble organic matter (WIOM) had a higher MAE value than the water-soluble organic matter (WSOM), consistent with our result for the BB and bituminous CC aerosols. Vehicle emission aerosols generally had a lower MAE value such as methanol-soluble BrC (0.62±0.76 m2 g−1C) in the controlled emission experiment (Xie et al., 2017), which was comparable to WSOC (0.71±0.30 m2 g−1C) but higher than MSOC (0.26±0.09 m2 g−1C) in this study.
3.2 EEM spectra of WSOC and MSOC
Fluorescence spectra was used to characterize the organic chromophores of different sources. We applied the PARAFAC model (Murphy et al., 2013) to determine the underlying chromophore components of the 60 source samples. Six typically independent components (abbreviated P1–6) in WSOC were resolved, as shown in the top of Fig. 2 and Table 1. Compared to the previous studies, the fluorescence of P1 and P6 were similar to those of 7CM–C1 (the C1 component of a seven-component model) and 7CM–C3, named humic-like substances (HULIS-1) (Chen et al., 2016b). Further, there were peaks in the emission wavelengths (>400 nm) of P1 and P6, which were probably derived from conjugated systems (Chen et al., 2016b). The peak of the P3 component was mostly located in the region categorized as protein-like (cytidine) or tryptophan-like fluorophore (Qin et al., 2018; Fan et al., 2016). Generally, peaks at shorter excitation wavelengths (<250 nm) and shorter emission wavelengths (<350 nm) were associated with simple aromatic proteins such as tyrosine (Cory and Mcknight, 2005), which was similar to the fluorescence of the P2 component observed in this study. The P5 component was similar to tryptophan- and tyrosine-like components (Chen et al., 2017a). Therefore, the P2, P3, and P5 components were named protein-like substances (PLOM). The P4 component was reported relatively rarely but was similar to previously observed peaks that were considered to arise mainly in surface water and algal secretions (Yu et al., 2015). It is worth noting that the origins and chemical structures of the chromophores studied are not necessarily like those of chromophores with the same name in other types of organic matter.
Table 1The maximum excitation and emission wavelengths of the PARAFAC components in WSOC and MSOC extracted from the three origins.
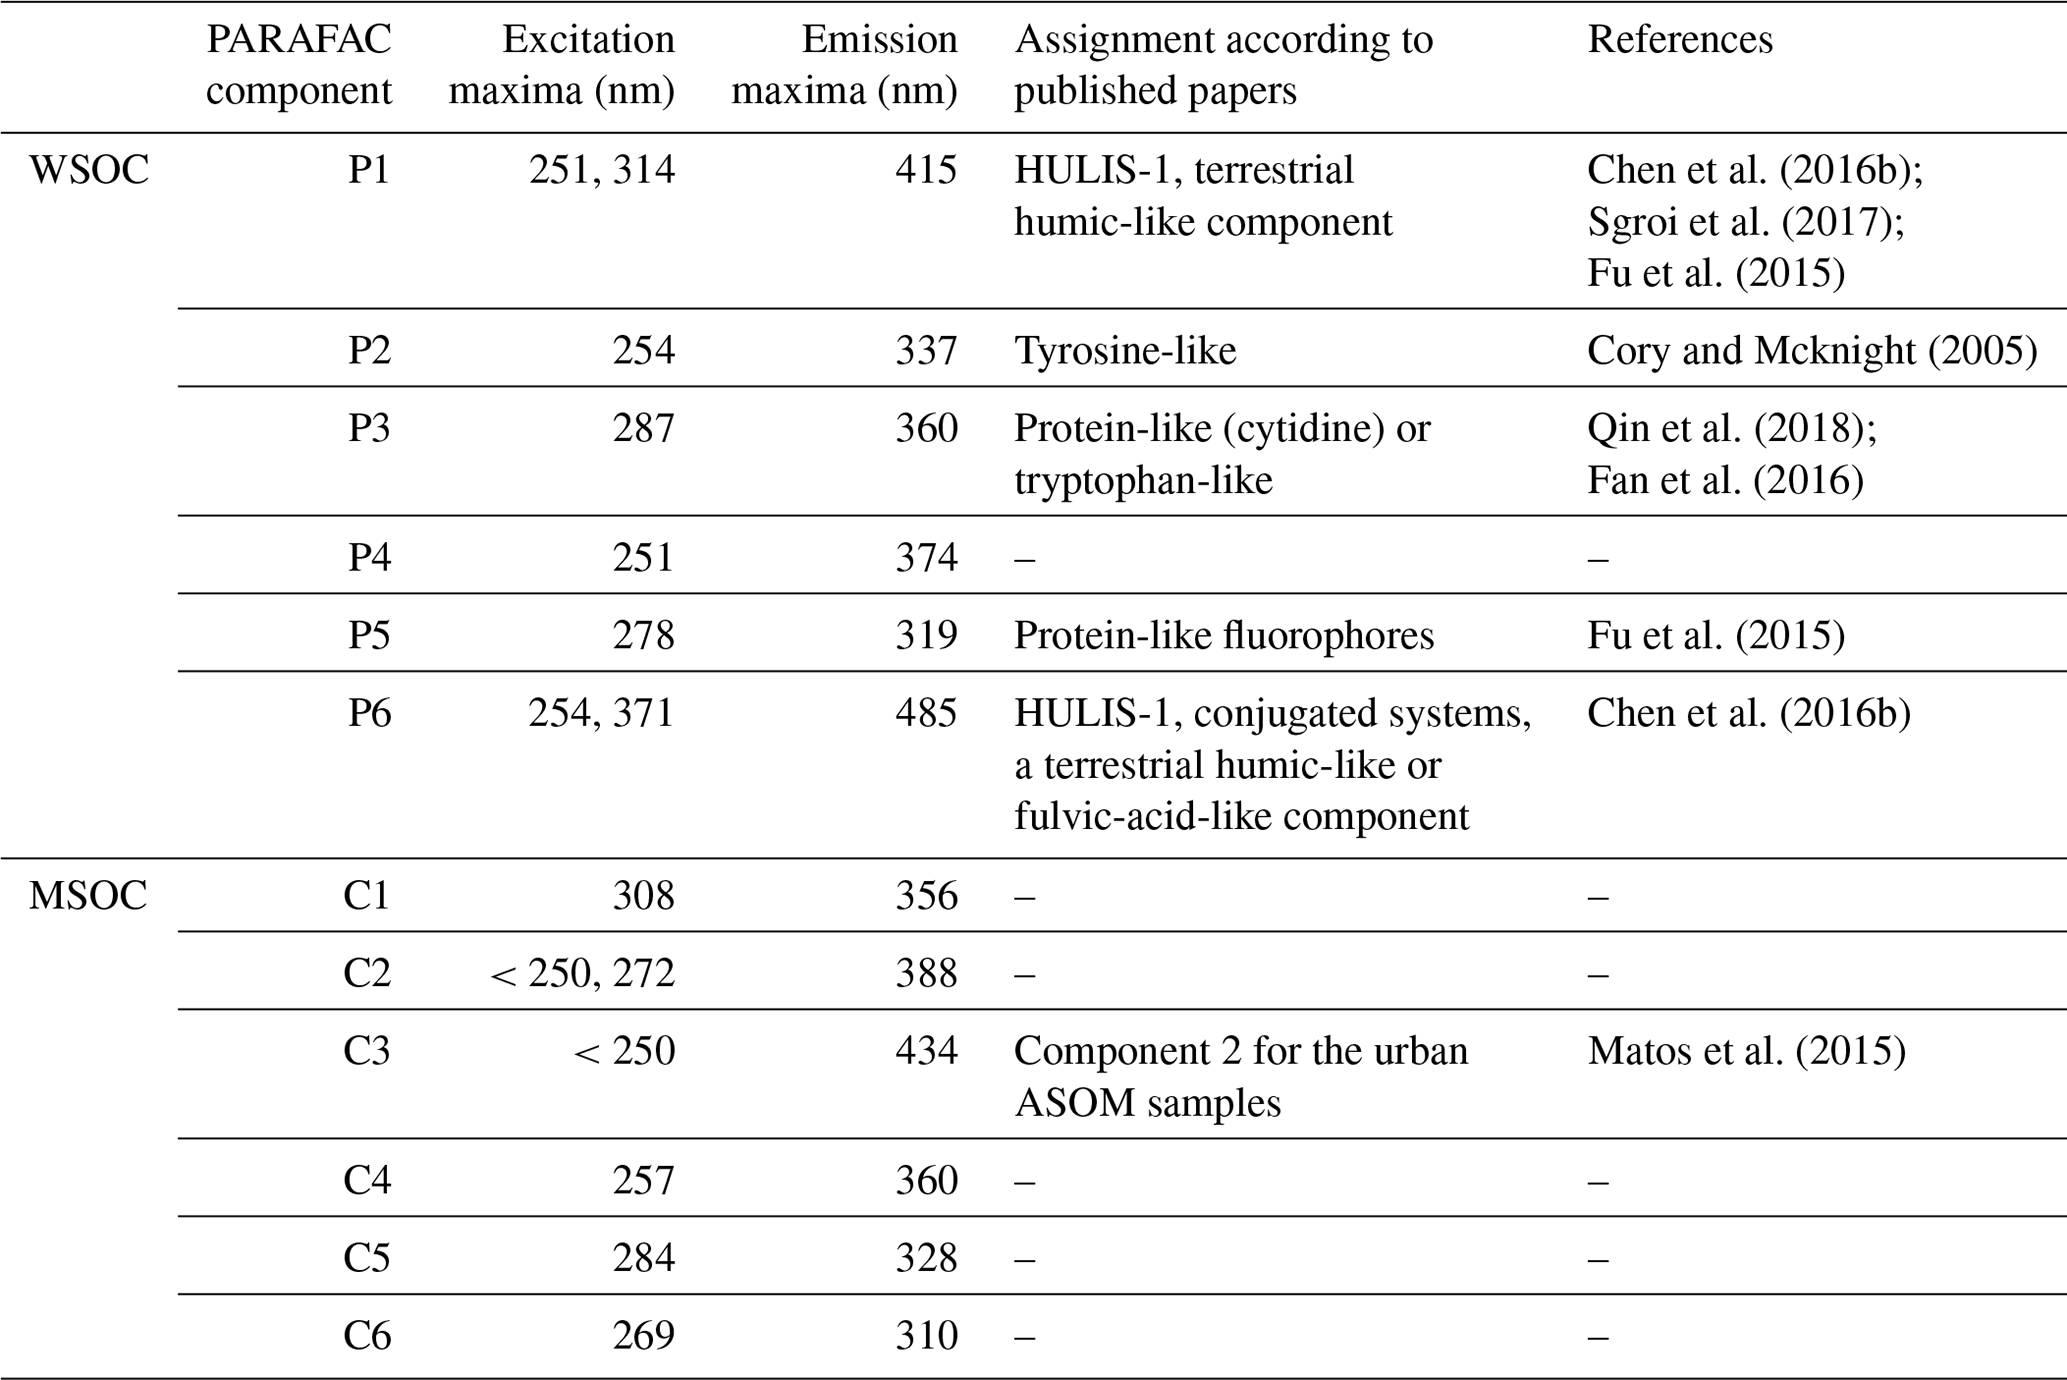
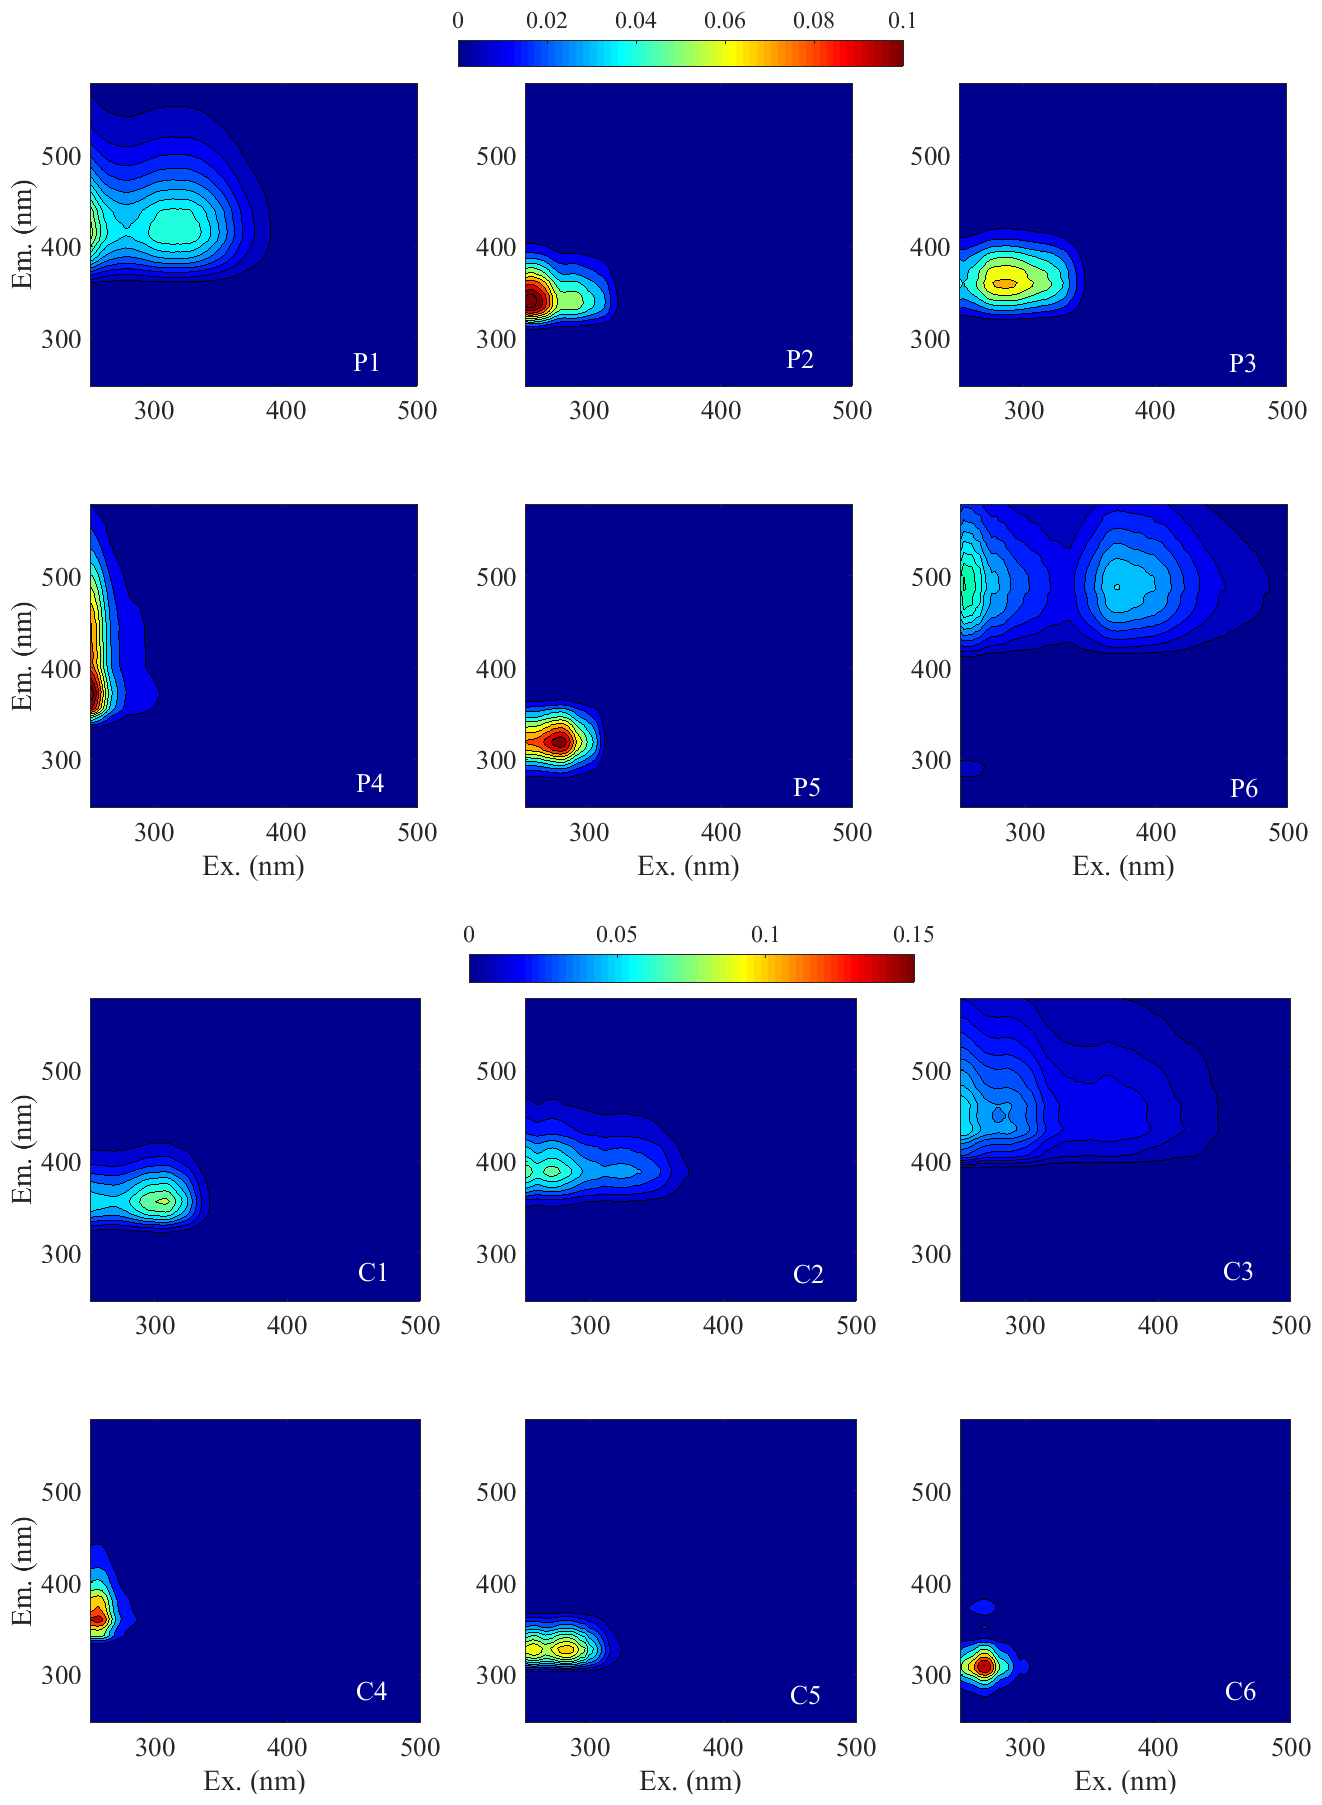
Figure 2The EEM components identified by PARAFAC of WSOC (P1–6) and MSOC (C1–6) from the three origins. Em.: emission wavelength. Ex.: excitation wavelength.
The results from the six-component model (abbreviated C1–6) of MSOC identified by PARAFAC, as described in the bottom of Table 1 and Fig. 2, were different from those observed in WSOC, indicating MSOC contained different compound types from WSOC after water extraction. The peak of the C1 component was similar to that of the P3 component of WSOC, but the excitation wavelength was higher than that of the P3 component. The higher excitation wavelength indicated the presence of conjugated unsaturated bond systems shifting towards the high wavelengths of the C1 component (Matos et al., 2015). Moreover, as reported, the C3 component was similar to component 2 of urban alkaline-soluble organic matter (ASOM) collected from the city of Aveiro, Portugal (Matos et al., 2015).
The maximum fluorescence intensity (Fmax) was calculated by multiplying the maximum excitation loading and maximum emission loading for each component by its score (Murphy et al., 2013). Generally, changes in the relative abundance of a component () could indicate changes in its overall importance, which had been successfully applied to study the origins of chromophores (Yan and Kim, 2017; Chen et al., 2017a, b; Wu et al., 2019). In this study, the relative abundances of fluorescent components in different types of samples were highly variable, depending on the sources (Fig. 3a). The P1 component accounted for an average of 34±4.7 % of the total fluorescence intensities in the case of tunnel aerosols, which was higher than BB aerosols (mean ± SD: 19±4.8 %), CC aerosols (14±3.8 %), and vehicle exhaust particles (17±1.0 %). The difference of the P1 component between tunnel aerosols and vehicle exhaust particles indicated that the P1 component had an aged vehicle exhaust origin. In contrast, the fluorescence of the P6 component was weak in all the samples, but higher in vehicle emissions (9.4±2.3 %) than in BB and CC aerosols (both 2.5 %). The P5 component was more intense in vehicle exhaust particles (30±1.6 %) than in other sources. The P2 component was abundant only in BB aerosols (33±11 %), but not in vehicle emissions, which suggested that some structures responsible for this chromophore could not exist in vehicle emissions. The P4 component was the more abundant chromophore in CC aerosols (34 ± 7.7 %) and vehicle emissions (29±5.9 %), especially in vehicle exhaust particles (38±1.1 %). In contrast, the P4 component in BB aerosols was weak (11±7.9 %), indicating a fossil origin. The P3 component was almost equal across all samples. The possible reason was that the P3 component was similar to the peak of tryptophan-like compounds which were common in practically all published models and were likely to be found in almost all sources (Yu et al., 2015).
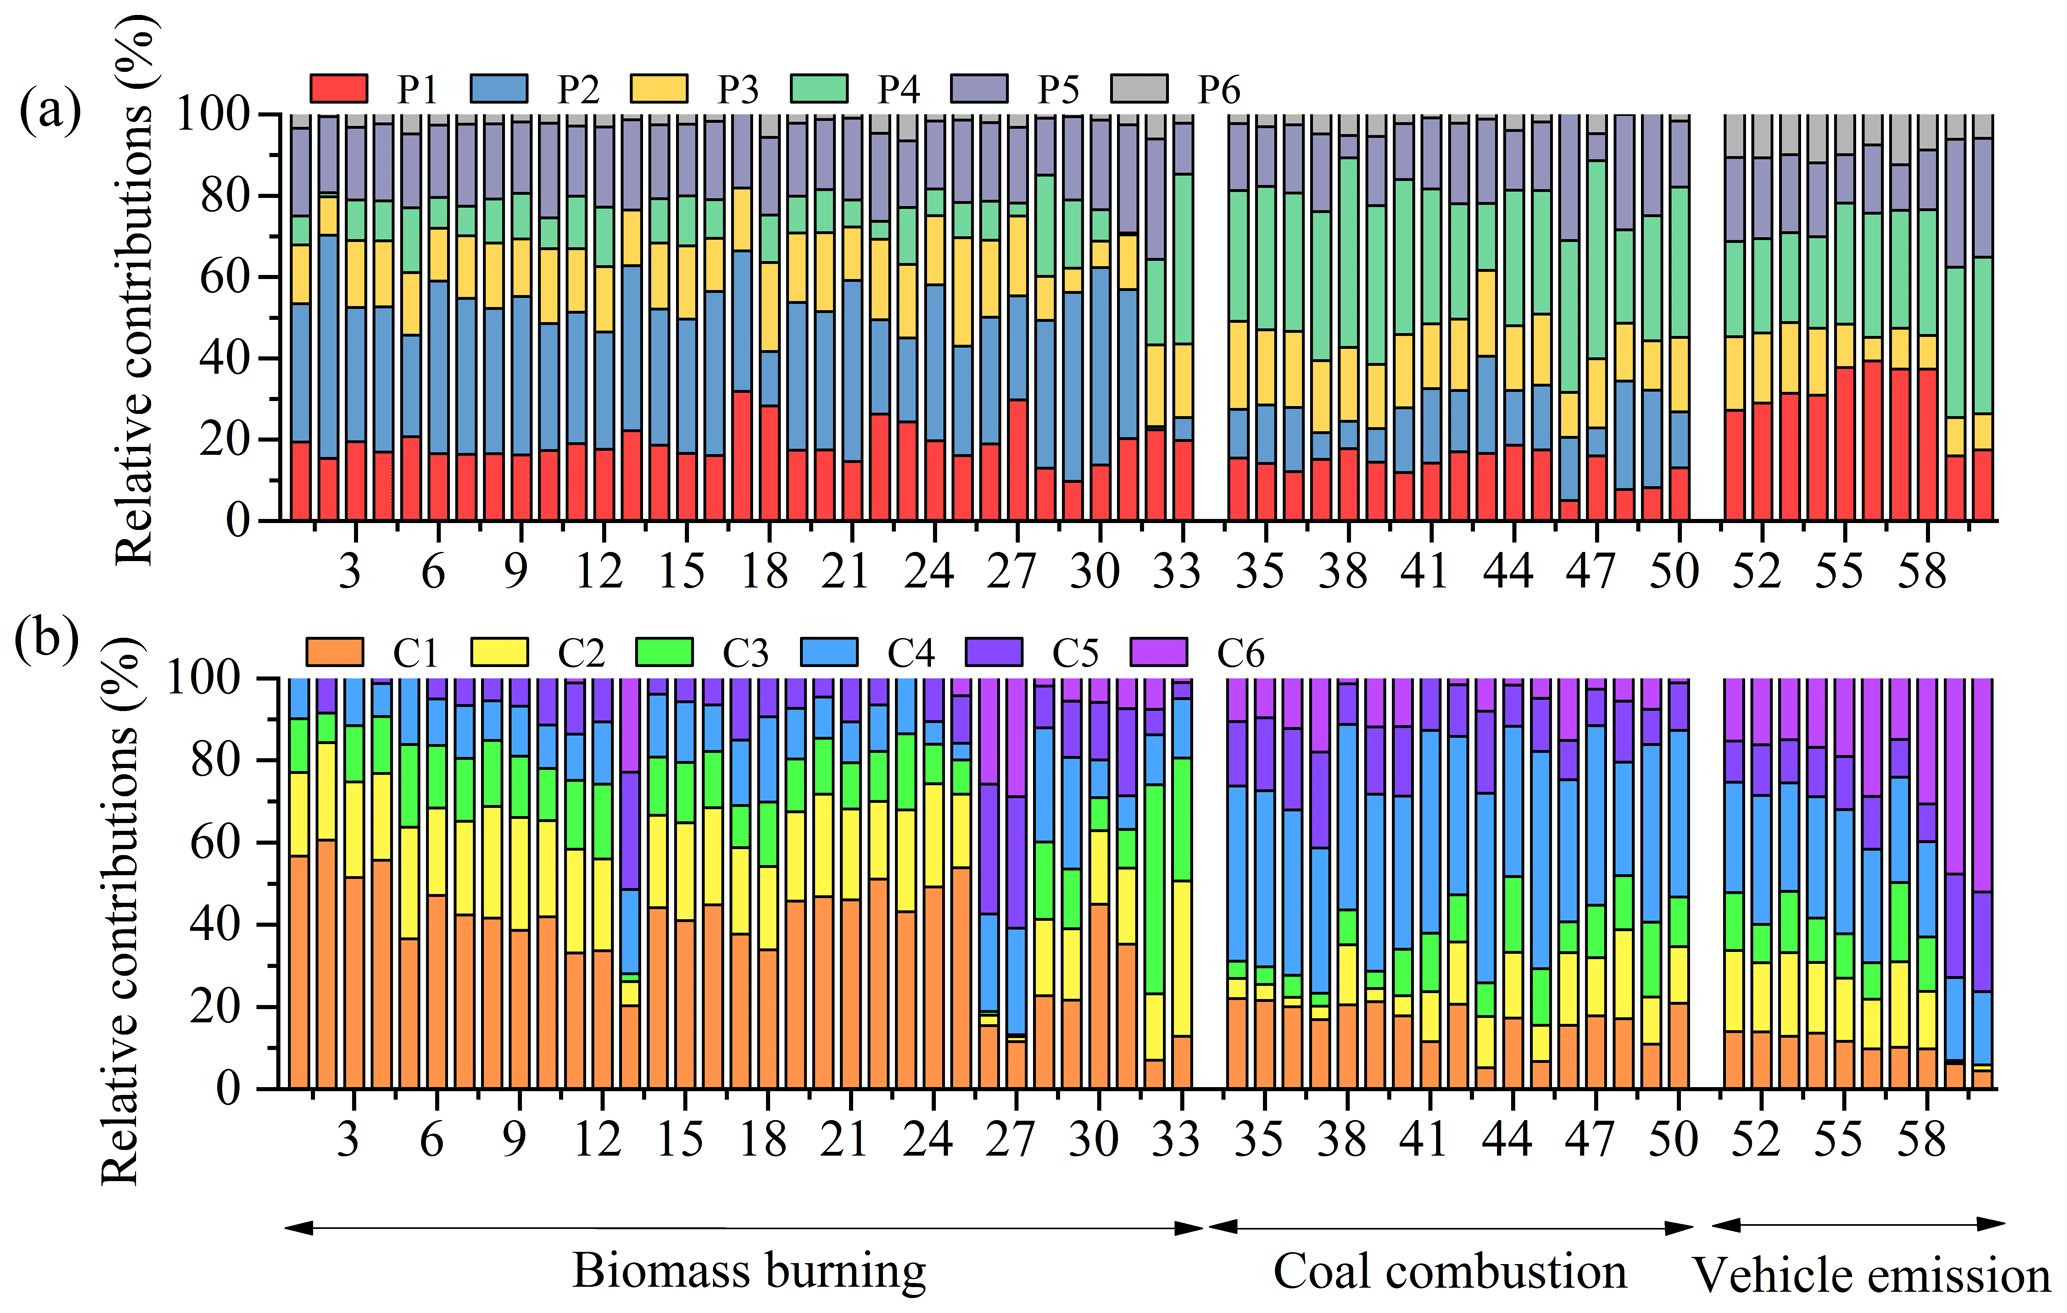
Figure 3The relative contributions of each PARAFAC component of WSOC (a) and MSOC (b) from the three sources.
The relative intensities of fluorescent components in MSOC exhibited similar characteristics to WSOC (Fig. 3b). The C1 component was the most intense substance in the case of BB aerosols (38±14 %) compared to the other sources. The C2 component was enriched in BB aerosols (21±6.9 %) and tunnel aerosols (17±6.9 %) compared to those in CC aerosols and vehicle exhaust particles. In addition, C2 exhibited a difference between bituminous CC and anthracite combustion aerosols, as well as tunnel aerosols and vehicle exhaust particles, indicating that the C2 component could be used to identify these sources. The C4 component was intense in CC aerosols (41±6.0 %) and vehicle emissions (26±4.4 %). The C3 component was not abundant among the three sources and not observed in the vehicle exhaust particles, not suggesting a fresh vehicle exhaust emission origin. The C5 and C6 components were more intense in vehicle exhaust particles (25±6.8 % and 50±6.8 %, respectively), suggesting they were the primary vehicle emission chromophores. The last study observed that the relative abundances of various chromophores in aerosols with different particle sizes were different (Chen et al., 2019). Therefore, the fluorescence technique is sensitive for chromophores with different sources, sizes, and chemical structures, and so on. In summary, the variation of the fluorescent components from different sources obtained by EEM–PARAFAC method could be helpful to the source apportionment of BrC in environmental applications.
3.3 Molecular composition detected by FT-ICR MS
The molecular compositions of WSOC and MSOC extracted from BB and CC aerosols and vehicle emissions were determined by negative ESI-FT-ICR MS. ESI is a soft ionization method, and it can only ionize polar organic compounds and hydrophilic molecules (Wozniak et al., 2008), but nonpolar or less polar compounds such as polycyclic aromatic hydrocarbons and saturated hydrocarbons are not easily ionized by ESI (Lin et al., 2018). In addition, ESI- cannot detect the N-heterocyclic alkaloid compounds (Laskin et al., 2009). Thus, this study mainly discussed these readily ionizable polar organic compounds by ESI-.
Figure 4 showed the reconstructed negative-ion ESI FT-ICR mass spectra of WSOC for the six selected samples. Lots of peaks with intensive mass ranges between m∕z 150 and 600 were showed in the mass spectra, with the most massive numbers of ions within the ranges of m∕z 200–400. Additionally, more formulas were detected in BB aerosols (total of 7708) than CC aerosols (5305) and vehicle emissions (4047) (Table 2), suggesting a higher observed chemical complexity (i.e., the observed peaks). According to the intensity of each ion, the average molecular formulas of WSOC in the six aerosol samples were calculated and listed as follows: C18.7H23.5O6.99N0.73S0.09, C19.9H21.5O7.65N0.34S0.03, C16.1H13.3O5.37N0.68S0.23, C15.2H13.7O4.24N0.45S0.41, C13.4H18.0O7.52N0.45S0.40, and C17.3H21.1O5.65N0.53S0.08 for Musa, Hevea, anthracite, bituminous coal, tunnel, and vehicle exhaust, respectively. The BB aerosols had higher contents of C and H, while the CC aerosols and tunnel aerosol had higher contents of S.
Table 2Number of formulas in each compound category and the average values of elemental ratios, molecular weight (MW), double-bond equivalents (DBE), and modified aromaticity index (AImod) in WSOC from the six aerosol samples.

In this study, these identified molecular formulas were classified into four main compound groups based on their compositions: CHO, CHON, CHOS, and CHONS. CHO compounds refer to the compounds that contain carbon, hydrogen, oxygen, and the other compound groups that are defined analogously. The relative abundances of the four compound groups were calculated by the magnitude of each peak divided by the sum of magnitudes of all identified peaks and showed in Fig. 4. CHO was the most abundant component in WSOC, accounting for 43 %–69 % of the total intensities of BB aerosols, 36 %–37 % of CC aerosols, and 36 %–47 % of vehicle emissions, respectively. CHO values in BB and CC aerosols were lower than those of mass spectra from simulated combustion experiments (BB of 53 %–72 % and CC of 43 %; Song et al., 2018). Generally, CHO formulas were consistent with species reported previously as lignin-pyrolysis products (Fleming et al., 2017), and they detected this fraction with 43.1±14.6 % in brushwood chulha cook firers. CHON was abundant in the three sources. This result was different from the findings that CHON species had a higher percentage in BB smoke and were not abundant in CC smoke (Song et al., 2018). The high fraction of CHON in CC aerosols could be due to that the N-containing compounds in the BB smoke PM2.5 coming from the nitrogen content in the fuels (Coggon et al., 2016), and the contents in coal fuels were comparable to biomass fuels (See Tables S1 and S2). However, S-containing compounds were more abundant in CC aerosols (9.2 %–21 % for CHOS and 13 %–20 % for CHONS, respectively) and tunnel aerosol (24 % for CHOS and 16 % for CHONS, respectively) than those in BB aerosols (2.0 %–5.6 % for CHOS and 0.62 %–3.7 % for CHONS, respectively) and vehicle exhaust particle (7.5 % for CHOS and 0.25 % for CHONS, respectively), consistent with the previous studies (Song et al., 2018; Wang et al., 2017). ESI was more efficient in ionizing S-containing compounds and most of them were selectively ionized by ESI-, suggesting that they were polar species such as organosulfates (Lin et al., 2018). Our study reported that S-containing compounds in WSOC were associated with CC emissions by combining with carbon isotope data (14C) (Mo et al., 2018). Furthermore, the relative abundances of group species in CC aerosols and tunnel aerosol were similar to those of water extracts in the hazy day (Jiang et al., 2016), indicating both sources could be important contributors of haze. However, differences between tunnel aerosol and vehicle exhaust particles were observed, indicating S-containing compounds in the tunnel aerosol were more secondary formation.

Figure 4Negative ESI FT-ICR mass spectra of WSOC from the six aerosol samples. Different formula groups were color-coded. The six pie charts showed the relative intensities of different formula groups.
Van Krevelen (VK) diagrams are a useful tool that provides a visual graphic display of compound distribution, and to some extent, are used to qualitatively identify different composition domains in organic mixtures (Song et al., 2018; Lv et al., 2016; Smith et al., 2009). In this study, each source showed similar VK patterns. As shown in Fig. S9, Musa and Hevea burning had a VK diagram similar to that of WSOC in straw burning and fog water (Schmitt-Kopplin et al., 2010; Mazzoleni et al., 2010). S-containing compounds in tunnel aerosol with high O ∕ C and H ∕ C ratios were similar to the aerosol-derived WSOC in New York and Virginia (Wozniak et al., 2008). Six dominate domains were identified in WSOC, including lignins, carbohydrates, tannins, proteins, condensed aromatic, and unsaturated hydrocarbons. In addition, results showed that compounds observed in CC aerosols had lower H ∕ C and O ∕ C ratios than those in BB aerosols and vehicle emissions, indicating a higher unsaturated degree and lower oxidation level. There were compounds outside the specified regions, which had a high H ∕ C ratio (≥2.2) and DBE of 0, corresponding to saturated oxygenated species, and there could be some long-chain polyalcohols (Lin et al., 2012a).
The mass spectra of MSOC exhibited differences from WSOC (Fig. S10), especially in BB aerosols and vehicle emissions that exhibited larger m∕z values in the range of 350–600. The detected formulas in MSOC were much lower than those in WSOC, with the total number of 4502, 3628, and 1069 for BB, CC, and vehicle emission aerosols, respectively (Table S5). The reason could be that ESI- can efficiently ionize the polar compounds, and the methanol extracts after water-extracted may contain more moderate- and low-polarity compounds that were not easily ionized. The average molecular formulas were C26.9H46.2O4.27N0.24S0.02, C23.3H34.9O5.18N0.20S0.02, C18.2H19.2O4.24N0.92S0.03, C22.4H20.7O3.01N0.38S0.05, C22.6H44.1O5.70N0.74S0.11, and C25.2H48.5O4.86N0.58S0.08 of MSOC in the six aerosol samples, respectively, showing higher C and H content than their corresponding formulas of WSOC but a decreasing trend in O content.
CHO and CHON were the main components in MSOC, accounting for about 90 % of the total intensities (CHO plus CHON). CHO was the most abundant category observed in BB aerosols (78 %–80 %). The elemental compositions observed in CC aerosols were different between bituminous coal and anthracite combustion. The abundance of CHON in anthracite combustion was higher (73 %), while the CHO in bituminous combustion was higher (60 %), which was consistent with the corresponding WSOC. It might be due to a higher N content and lower O content of anthracite than that of bituminous coal (see Table S2). However, CHON in BB aerosols (18 %–20 %) exhibited lower abundances than those in CC aerosols and vehicle emissions. S-containing compounds were not abundant in MSOC. It may be due to the combination of an S element and an O atom showing higher polarity.
Figure S11 showed the VK diagram of MSOC in the six aerosol samples. More formulas in BB aerosols exhibited two distinct groups with H ∕ C of 1.4–2.2 and 0.6–1.4 vs. O ∕ C of 0.1–0.5 in three domains (lignins, proteins, and lipids). Compounds in CC aerosols with lower H ∕ C and O ∕ C ratios were dominant in the domains of lignins and condensed aromatic, especially in bituminous CC aerosol with more unsaturated hydrocarbon. Tunnel aerosol showed a wide range of O ∕ C in S-containing compounds and a wide range of H ∕ C in non-S-containing compounds. In contrast, compounds in vehicle exhaust particles had a wide range of H ∕ C but a narrow O ∕ C ratio. The VK diagram with fewer S-containing compounds in vehicle exhaust particle showed a similar characteristic to the distribution of non-S-containing compounds in tunnel aerosol, indicating the difference was mainly due to the S-containing compounds.
Tables 2 and S5 presented the relative abundance of weighted molecular weight (MWw), double-bond equivalence (DBEw), and modified aromaticity index (AImod,w) of WSOC and MSOC, respectively. DBE was used as a measure of the unsaturated level in a molecule, and AImod could be used to estimate the fraction of aromatic and condensed aromatic structures (Song et al., 2018; Lv et al., 2016; Koch and Dittmar, 2006). BB aerosols had higher MWw values than CC and vehicle emissions in WSOC. Further, higher DBEw and AImod,w values were observed in CC aerosols than the others. MSOC had higher MWw but lower AImod values than the corresponding WSOC. Furthermore, CHO and CHON compounds had higher DBEw and AImod,w values than S-containing substances, consistent with the earlier results (Lin et al., 2012a, b).
Figure S12 showed the fraction of AImod values of WSOC in the six aerosol samples, where the formulas were classified according to their AImod (aliphatic – AImod=0, olefinic – 0<AImod ≤0.5, and aromatic – AImod>0.5). The results illustrated that the fraction of the aromatic structure in non-S-containing compounds was higher than those in S-containing compounds. CC aerosols had a higher aromatic fraction than BB aerosols and vehicle emissions, especially in CHO and CHON (up to 89 % of total ion intensities). In BB aerosols, the non-S-containing compounds had a high fraction of the olefinic structure, followed by the aromatic structure, but the S-containing compounds had a higher aliphatic and olefinic structure than the aromatic structure. A higher fraction of the aliphatic structure in vehicle emissions was observed in the S-containing compounds (especially in tunnel aerosol; exceeding 81 %). These aliphatic S-containing compounds might form by the precursors (long-chain alkanes) from vehicle emissions (Tao et al., 2014), which had higher H ∕ C and lower DBE values (see Table 2). However, the previous study showed that AI must be regarded as the most conservative approach and may result in an underestimate of the aromatic structures (Koch and Dittmar, 2006), which was observed in Beijing aerosols (Mo et al., 2018). Although AImod identified more compounds as aromatic and condensed aromatic components than AI, the AImod may introduce uncertainties for individual molecules, which was demonstrated by Koch and Dittmar (2006).
For MSOC, the aromatic structure fractions in non-S-containing compounds were higher than those in S-containing compounds, and the aromatic structure fractions in CC aerosols were higher than those in BB aerosols and vehicle emissions (Fig. S13), which was consistent with WSOC. Furthermore, we found that the fraction of the aliphatic structure in MSOC was higher than that in WSOC, indicating more fat-like compounds.
3.3.1 Different chemical characteristics of BB, CC, and vehicle emissions
Figure S14 shows the plotted Venn diagram of formulas in WSOC in the six aerosol samples for determining the unique elements in the mass spectra. The previous study identified the unique elements of water-soluble HULIS in simulated BB and CC smokes, which presented different molecular characteristics between biomasses, as well as between biomass and coal (Song et al., 2018). In this study, we combined more formulas of different sources to determine the unique molecules, and more limitations were set, which would provide more identified characteristics for each source. A total of 212 molecular formulas were detected simultaneously in the six aerosol samples. It is worth noting that without any further information, it is not possible to decide whether these common formulas represent the same compounds. Of 212, there were 112 unique molecules of CHO and 98 of CHON but only 2 of CHOS. CHO compounds were relatively small aromatic compounds with 8–20 C atoms and 3–8 O atoms with DBE values of 5–13 and multiple acidic polar functional groups (Fig. S15). It is noting that lines in Fig. S15 indicate DBE reference values of linear conjugated polyenes CxHx+2 with a DBE value of 0.5 × C and fullerene-like hydrocarbons with a DBE value of 0.9 × C, where the data points inside this region are potential BrC chromophores (Lin et al., 2018). For example, organic acids (C8H6O5; DBE of 6) were detected in urban PM2.5 (Yassine et al., 2012), as well as C9H8O5 (6), C14H14O4 (8), and C13H14O5 (7), which allowed them to ionize in the ESI mode and were identified as potential BrC chromophores. In total, all of the CHON compounds had O ∕ N of >2 (5.3±1.28, 2.5–8) (Fig. S15), allowing for the assignment of at least one nitro (-NO2) or nitrooxy (-ONO2) group and other oxygen-containing groups (i.e., -OH and -COOH). Except for C19H41O7N (DBE of 0), the remaining compounds with DBE ≥ 5 were suggested as nitro-aromatic and nitrophenol derivatives (Mo et al., 2018; Lin et al., 2018). CHOS species only had two formulas including C18H38O7S (0) and C20H38O7S (2). It was reported that O7S groups were the most abundant species class in CHOS identified in water extracts of PM2.5 (Jiang et al., 2016).
There were more observed unique peaks of WSOC in BB aerosols (total of 1947) compared to CC aerosols (1583) and vehicle emissions (813). However, only 143 and 83 molecular were identified in bituminous CC and vehicle exhaust particles, respectively. Among the observed compounds, 1353 and 1440 unique molecular formulas were detected in the combustion of Musa and anthracite, respectively, implying a significant difference from the others. Figure 5a showed the VK diagram of these unique formulas of WSOC for each sample, where four regions were circled for representing different sources. The results indicated that these unique compounds in different sources had a distinctive chemical characteristic. That may be the reason that resulted in variable fluorescent spectra in different sources (discussed above). Additionally, the diagram showed that the unique molecules in CC aerosols were located in the region with lower H ∕ C and O ∕ C values, and vehicle emissions containing tunnel aerosol and vehicle exhaust particles were located in two distinct regions.
Figure 6 showed plots of the DBE vs. the number of carbon atoms in the unique molecular formulas of all aerosol samples. These compounds observed in BB aerosols were largely CHO and CHON (CHO and CHON of 88 %–93 %) with C numbers ranging from 6 to 40 and DBE ranging from 0 to 31, with no regular distribution. S-containing compounds were the important components in the unique molecular formulas of CC aerosols (CHOS and CHONS of 38 %–75 %) and vehicle emissions (CHOS and CHONS of 41 %–66 %). However, only 7 %–12 % of the total unique molecular formulas were observed in BB aerosols. As shown in Fig. 6, the region marked by a blue box denote the high intensities of compounds in unique formulas of each sample. The high-intensity compounds detected in Musa-burning aerosol mainly had a C number from 14 to 24, DBE from 7 to 13, and 2 N atoms, such as C20H26O7N2 (9), C18H24O5N2 (8), C22H28O6N2 (10), C19H26O7N2 (8), C21H28O6N2 (9), C14H18O3N2 (7), C24H30O8N2 (11), and C21H24O5N2 (11), and so on. Instead of Musa, the abundant compounds in Hevea burning were mainly C24H22O9 (14), C28H28O11 (15), and C28H26O11 (16), and so on. Although the difference between burning of Musa and Hevea appeared, the VK diagram (Fig. 5) did not show distinct changes. The high-intensity compounds in anthracite combustion with lower C atoms than in bituminous CC were mainly C14H8O5N2 (12), C12H11O4NS (8), and C12H10O8N2 (9), while in bituminous CC was mainly C28H28O4S (15) and its homolog of C27H26O4S (15) and C19H16O3S (12). The abundant compounds in tunnel aerosol had a lower unsaturation degree, such as C4H9O7NS (1), C5H11O7NS (1), or C7H14O5S (1). In vehicle exhaust particles, the high intensity of compounds was one fraction with few C atoms and a low DBE value (C21H40O8N2S (3) and C26H46O3S (4)) and the other fraction with many C atoms and a high DBE value (C32H34O8S (16), C30H34O5S (14)). These findings are essential because these unique molecular formulas in different sources may have specific chemical composition, which would help the source apportionment of aerosols.
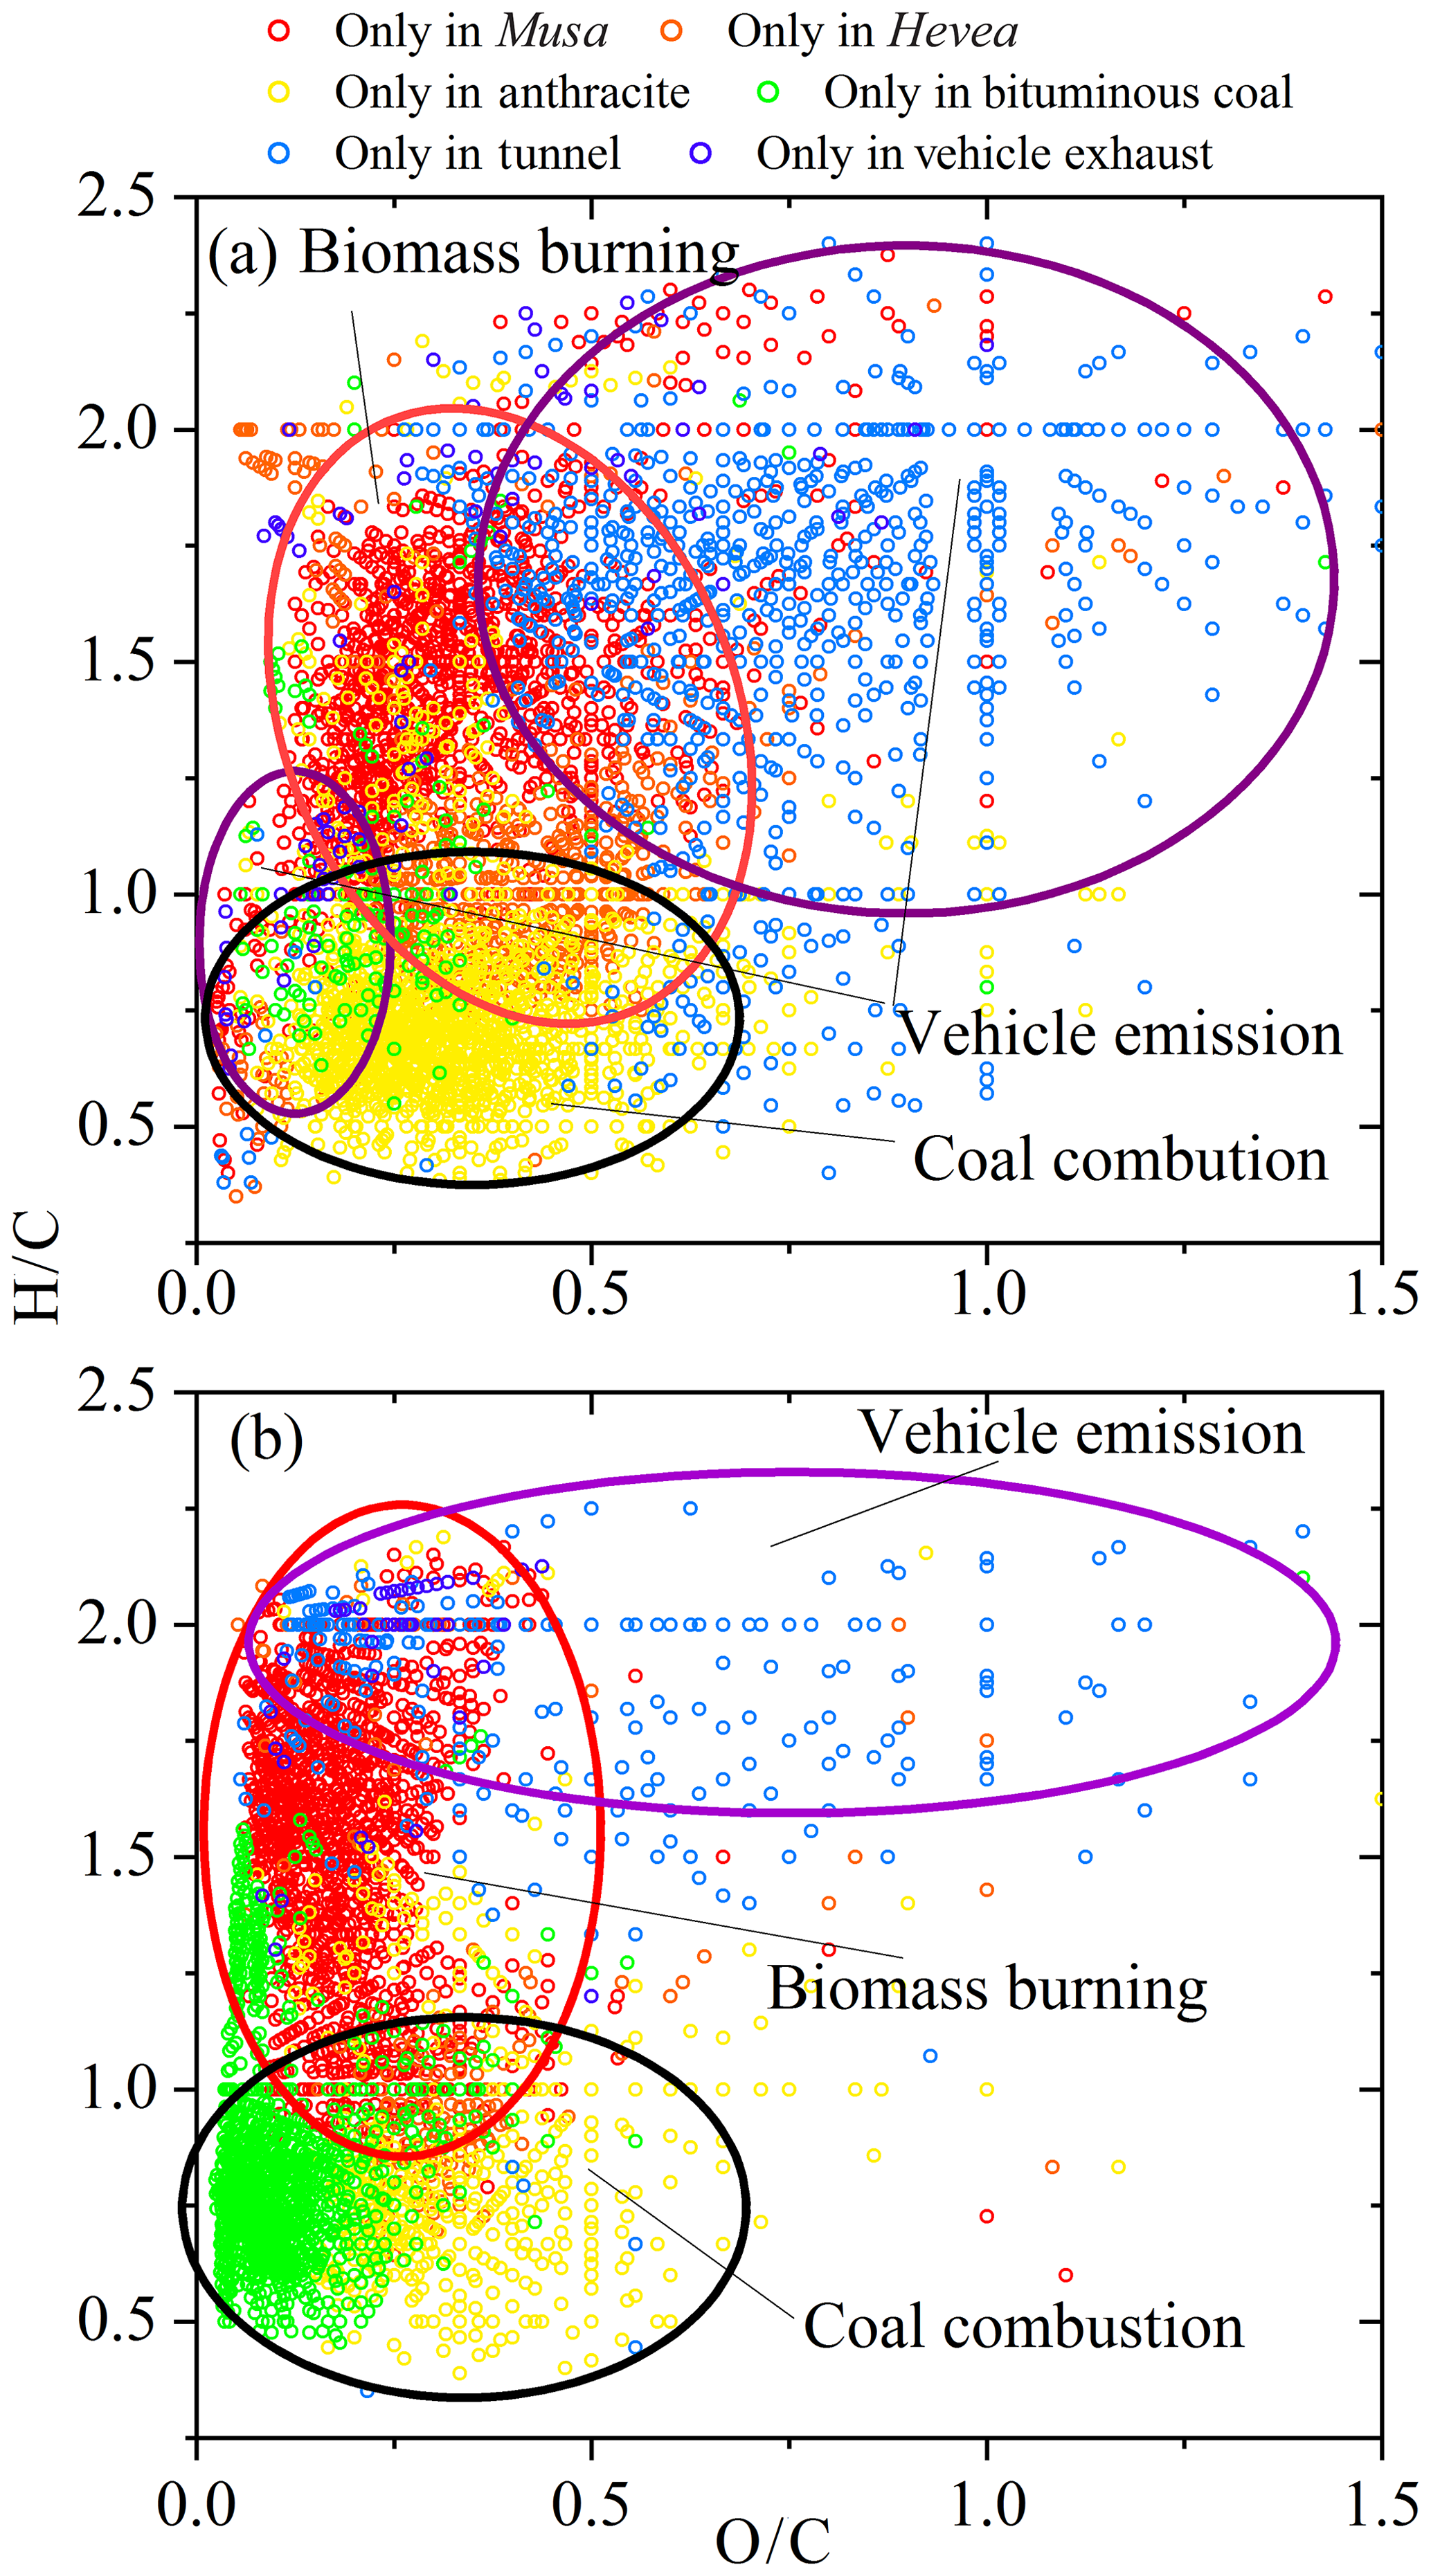
Figure 5A van Krevelen diagram of WSOC (a) and MSOC (b) from the six aerosol samples. Different color indicates unique formulas detected in each sample.
Compared to WSOC, Fig. S16 showed fewer compounds in common in MSOC for the six aerosol samples. There were only 44 compounds common to the six aerosol samples. A total of 26 and 14 of the 44 formulas were CHO and CHON, respectively, but only 4 of the 44 formulas were S-containing compounds. As shown in Fig. S17, there were only three compounds (C17H10O2 (13), C18H14O (12), and C18H12O2 (13)) in the CHO group and one compound (C14H11O4N (10)) in the CHON group inside the potential BrC region. The remaining compounds had a high C number (18–35), few O atoms (1–7), and low DBE (0–2), suggesting that they mostly had fatty acid structures.
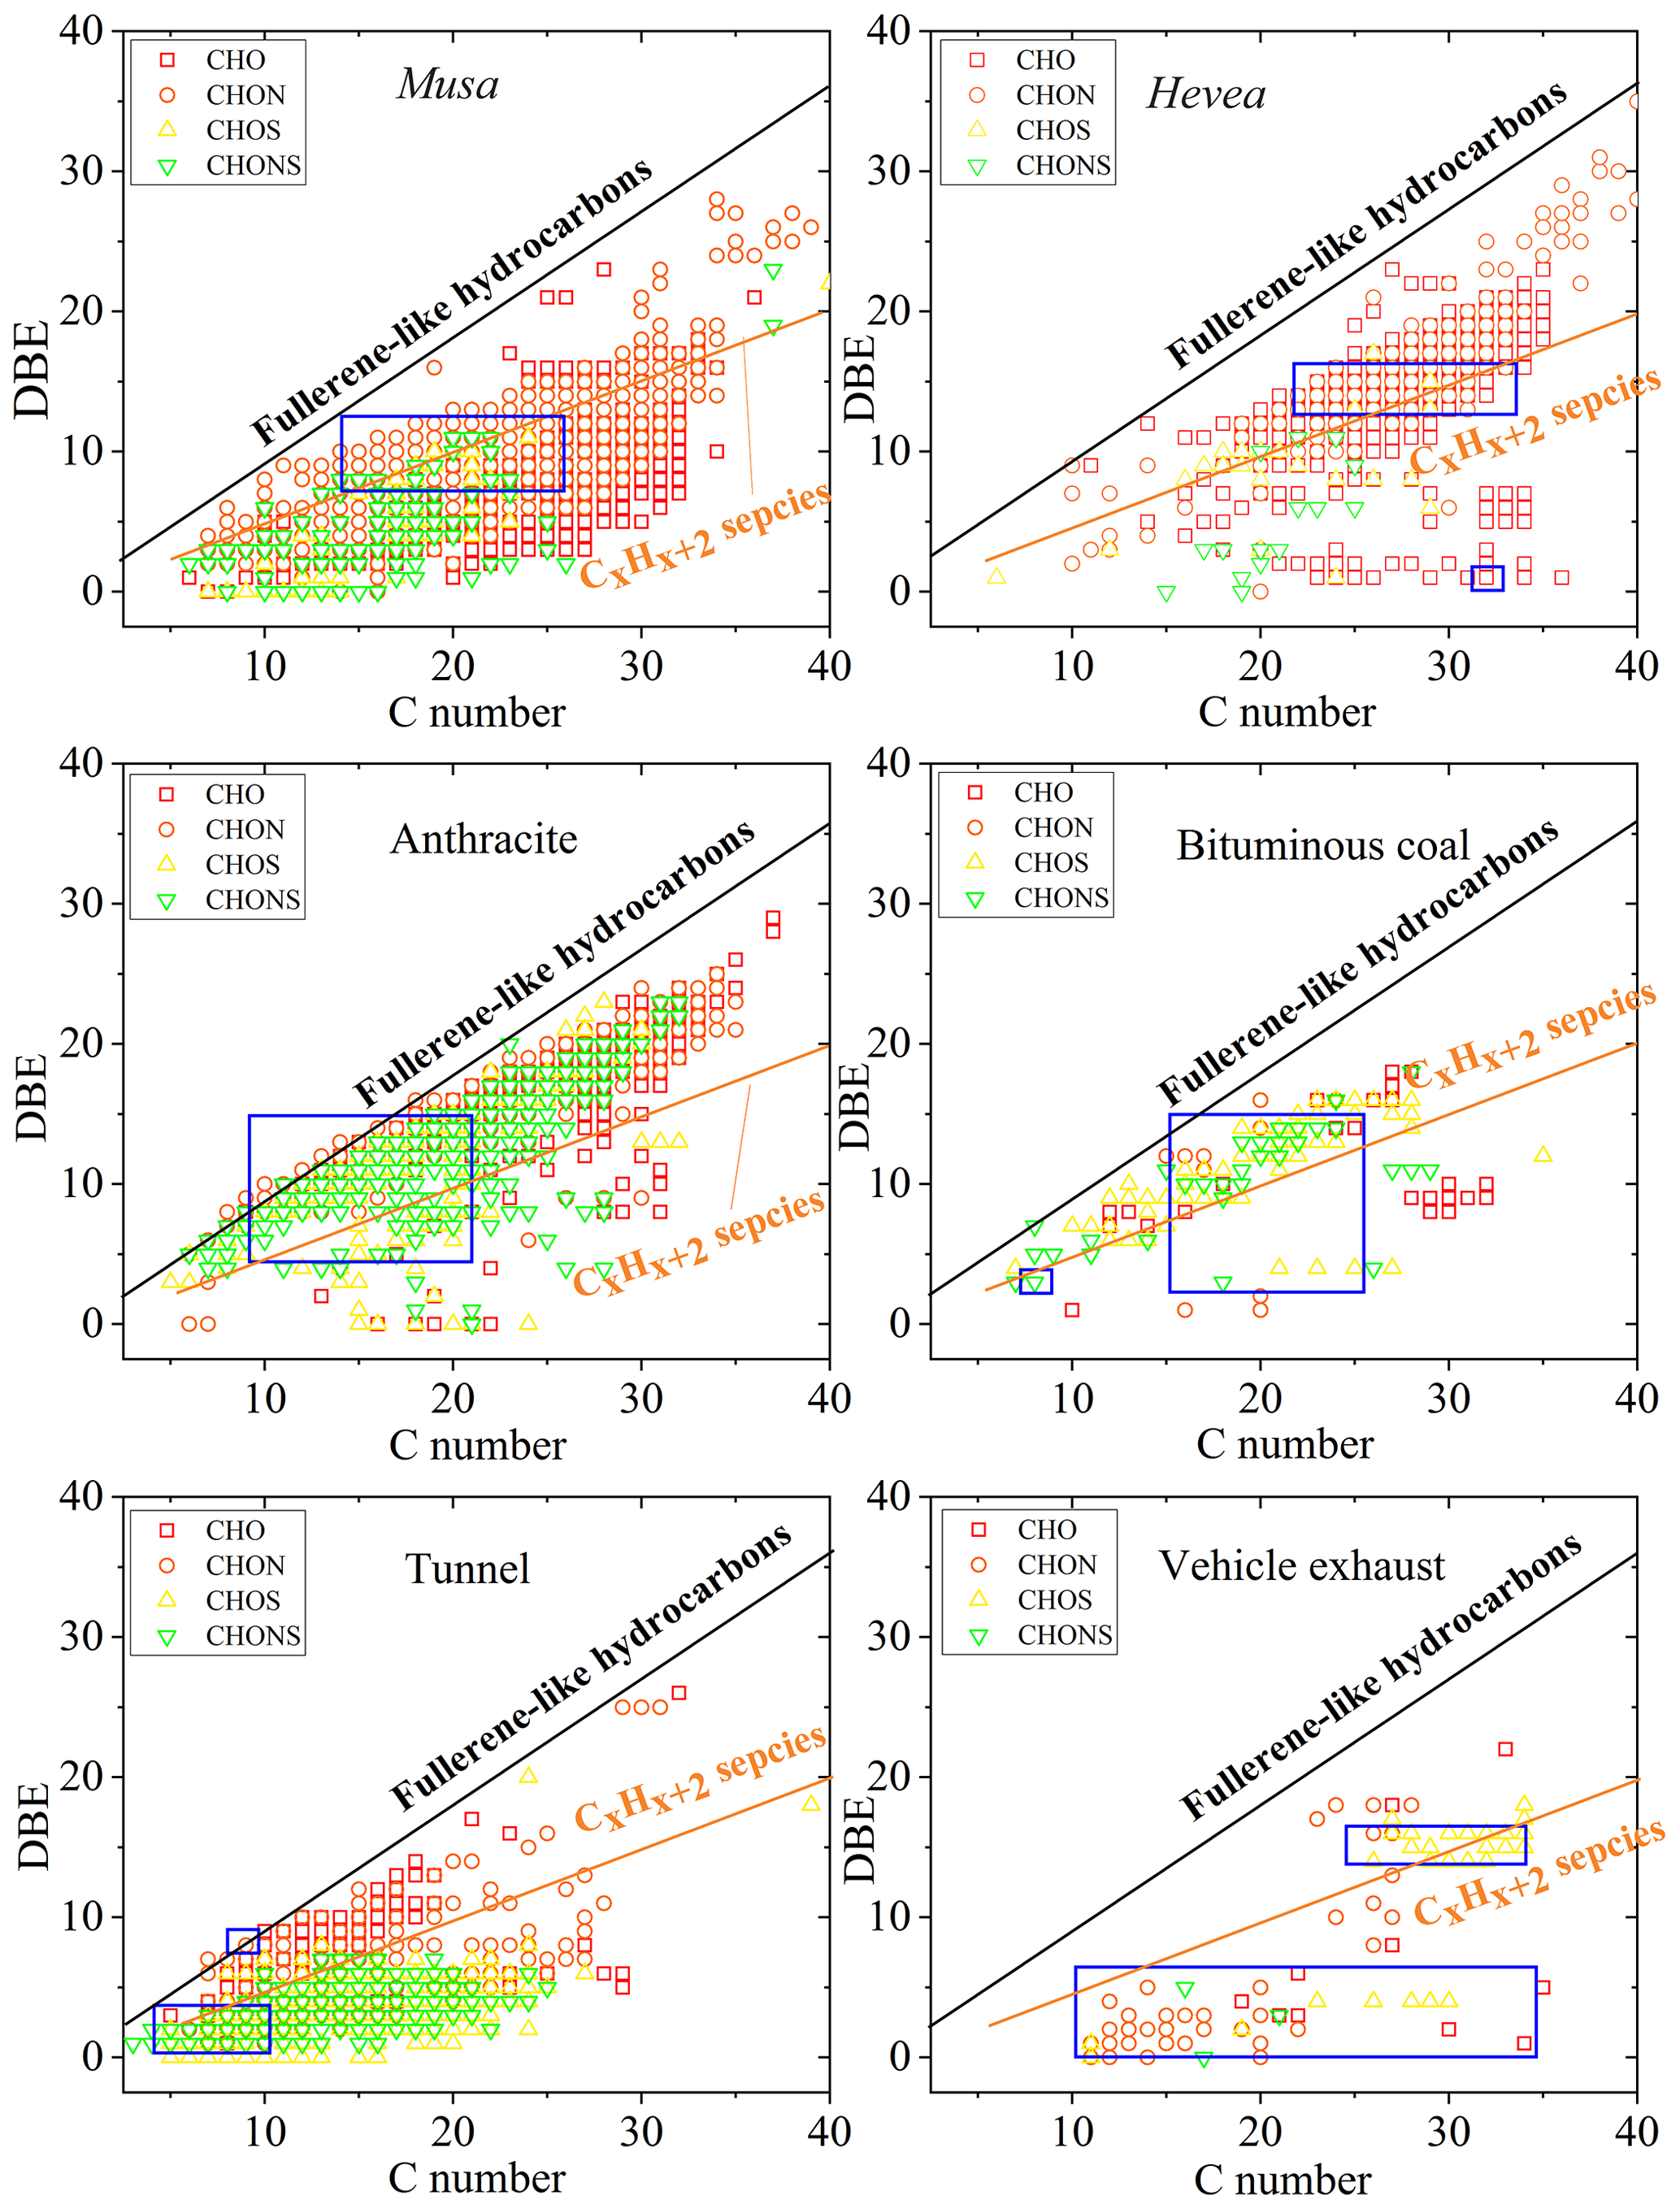
Figure 6DBE vs. C number for unique molecular compounds of WSOC from the six aerosol samples. Lines indicate DBE reference values of linear conjugated polyenes CxHx+2 with DBE = 0.5 × C and fullerene-like hydrocarbons with DBE = 0.9 × C. The regions marked by a blue box denote the high intensities of compounds.
These unique molecules in the VK diagram also showed similar results compared to WSOC (Fig. 5b), further confirming the special characters in different sources. Expect for tunnel aerosol (about 50 %), these unique formulas in the BB aerosols, CC aerosols, and vehicle exhaust particle were dominated by the CHO and CHON groups (Fig. S18). The high-intensity compounds were C35H69O5N (2) and C38H76O4 (1) for Musa burning; C26H22O7 (16) and C28H26O7 (16) for Hevea burning; C14H12O6N2 (10) and C17H14O5N2 (12) for anthracite combustion; C23H16O (16), C24H18O (16), and C24H14O (18) for bituminous CC; C4H9O7NS (1), C24H42O3S (4), and C8H16O5S (1) for tunnel aerosol; and C26H37O5NS (7) and C22H46O7 (0) for vehicle exhaust particles, respectively.
3.4 Link of molecular compositions and optical properties
In the above statements, we discussed the light absorption and fluorescence properties from aerosols in the three different sources. The light absorption capacity of WSOC and MSOC was essential to assess the evolution of BrC, and fluorescence spectra were sensitive to different sources and could help for the source apportionment of BrC. In addition, we evaluated the molecular compositions of the three sources. Therefore, understanding the factors affecting the optical properties of BrC is important. It was reported that the MAE value in the BB experiments depended largely on burning conditions (Chen and Bond., 2010), and in the CC experiments it depended on coal maturity (Li et al., 2018). Chen et al. (2017b) illustrated that the higher light absorption capacity was associated with the low- and medium-polarity fractions that contained aromatic and polar functional groups (O or both O and N atoms). Sources play an important role in light absorption capacity, consistent with our current study. The MAE365 values of WSOC in highly BB-impacted areas were 2 times higher than in lowly BB-impacted areas in the southeastern United States (Hecobian et al., 2010). Atmospheric aging has a significant effect on the light absorption capacity of BrC (Li et al., 2019), but the mechanism involved is very complex. The response of the light absorption capacity of different types of BrC to aging is highly variable, and enhancement or reduction in the light absorption capacity of BrC is possible (Li et al., 2019). These results indicated that light absorption capacity might be affected by various factors. In this study, the higher MAE365 values were observed in BB and CC aerosols than vehicle emissions, and the chemical structures and unsaturation degree of different sources were discussed. Next, we further discussed the relationship between optical properties and chemical structures below.
Before discussing their relationship, we firstly determined the compounds that were potentially able to absorb light radiation based on the above statement to reduce the influence of non-absorbing substances (Lin et al., 2018). Mo et al. (2018) reported that MAE365 of HULIS in aerosols was affected by oxidation level and unsaturation degree. In this study, the MAE365 value had no significant correlation with O ∕ C, indicating that light absorption capacity does not appear to be affected by their oxidized properties in the source emission aerosols. Instead of O ∕ C, the MAE365 value had a significant positive correlation with the average DBE and MW, respectively (Fig. 7), suggesting the unsaturation level and MW played a vital role in the light absorption capacity of source samples. Field experiments indicated that the majority of absorption was the larger molecules (>500 Da) (Di Lorenzo et al., 2017). It is crucial to understand the relationship between light absorption of the source samples and their molecular compositions due to the compounds in fresh emissions that may undergo a secondary process and introduce more uncertainty for their optical properties.
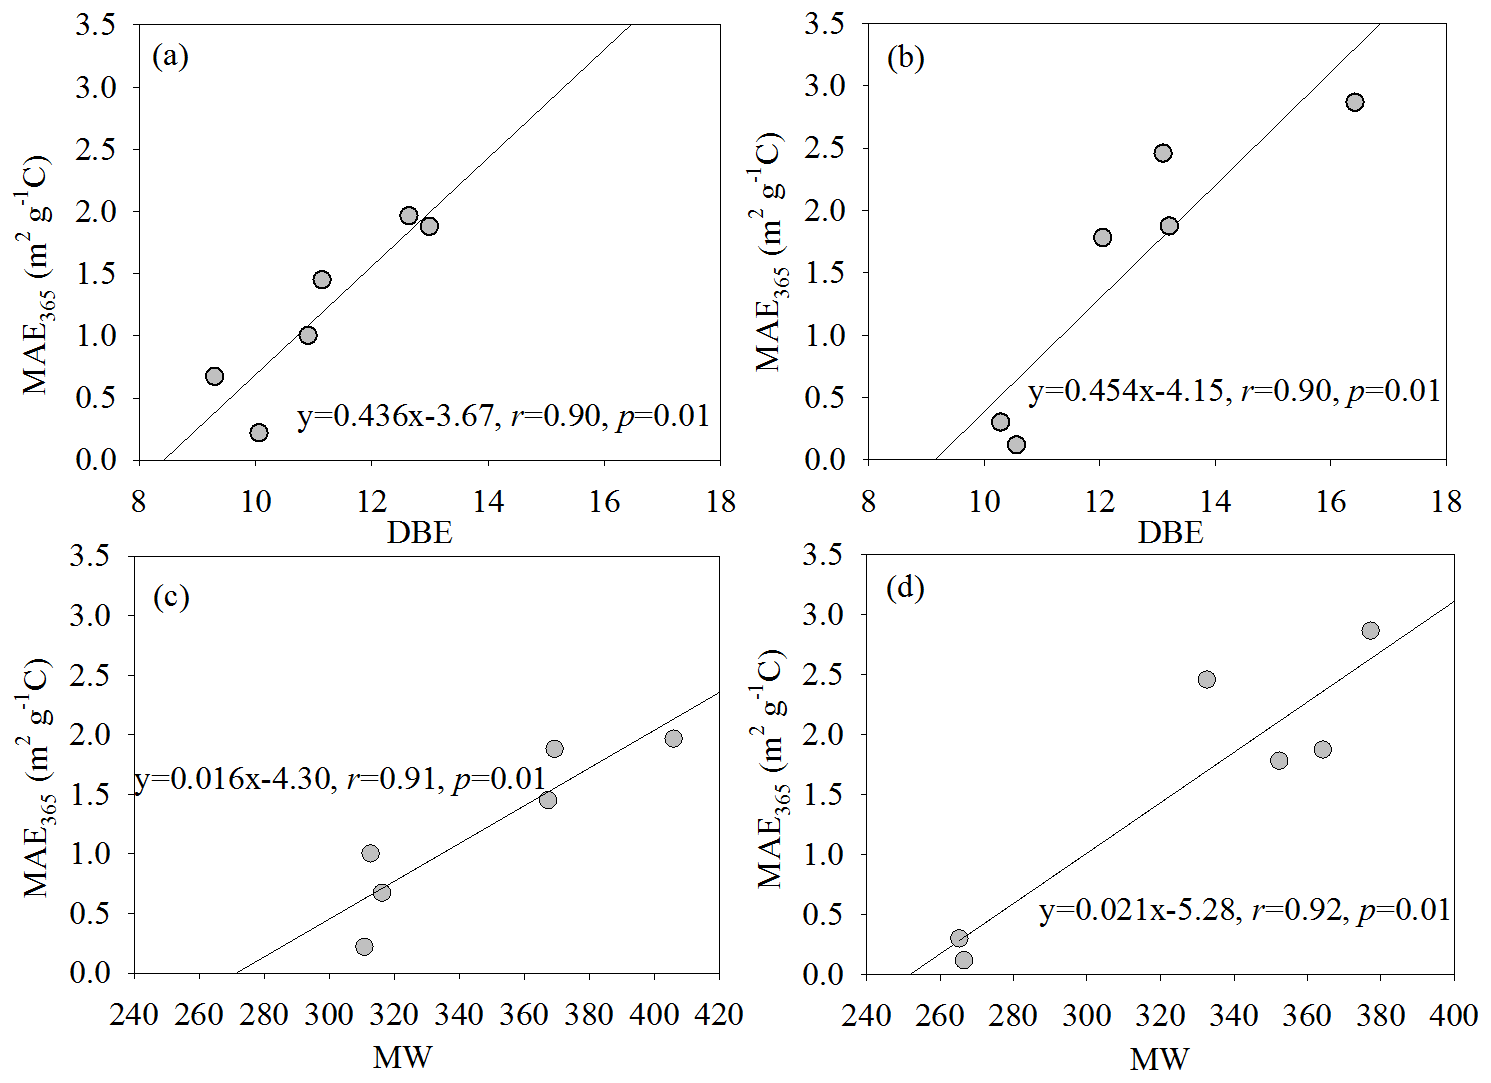
Figure 7Relationships between DBE and MW of the potential BrC molecules and the MAE365 of WSOC (a, c) and MSOC (b, d) from the six aerosol samples, respectively.
Fluorescence spectra can provide more information than UV–vis spectra. A red shift in the excitation–emission maximum could indicate increased aromaticity and higher molecular weight (Ghidotti et al., 2017). Field observations have demonstrated that chromophore components were associated with chemical structures (Chen et al., 2016a, b; Stubbins et al., 2014). Chen et al. (2016b) illustrated that the fluorescent components of HULIS-1 and HULIS-2 were correlated positively with CO+ and and and groups ions, respectively, using the correlation analysis of the relative intensities of ion groups in high-resolution aerosol mass spectrometers (HR-AMSs) and the relative content of fluorescence components. In another study, Chen et al. (2016a) demonstrated that fluorescent components had strong links with chemical groups in the Fourier transform infrared (FT-IR) spectra, including the oxygenated functional groups (nonacidic carbonyl C = O and carboxylic COOH groups), aliphatic C-H group, amine C-NH2, and alcohol C-OH groups. The chromophores are sensitive to sources, and it is very important to understand the molecular composition of chromophores for the classification and source apportionment of atmospheric BrC. However, the ESI- cannot ionize the most typical BrC chromophores such as O-heterocyclic PAHs (O-PAHs) or N-heterocyclic PAHs (N-PAHs) (Lin et al., 2018), which was not enough to discuss the relationship between the fluorescence spectra and molecular composition. The combination of atmospheric pressure photoionization (APPI+ and APPI-) and ESI (+ and −) may provide more ionizable compounds, but these techniques were not within the scope of our study.
We conducted comprehensive measurements on light absorption, fluorescence, and molecular compositions of dissolved BrC derived from smoke particles during the simulated combustion of biomass and coal as well as vehicle emission aerosols. We observed that BB and CC aerosols had higher MAE365 values than vehicle emissions, on average, 1.6±0.55, 1.3±0.34, 2.0±0.75, and 0.71±0.30 m2 g−1 C for BB, anthracite combustion, bituminous CC, and vehicle emission aerosols, respectively. In addition, BrC emitted from BB (2.3±1.1 m2 g−1 C) and bituminous CC (3.2±1.1 m2 g−1 C) in MSOC exhibited stronger light absorption capacity than those in WSOC, but opposite results were found in anthracite combustion aerosols (0.88±0.74 m2 g−1 C) and vehicle emissions (0.26±0.09 m2 g−1 C). EEM combining with PARAFAC analysis determined six types of fluorescent components that were categorized as two HULIS-1 substances (P1 and P6), three PLOM substances (P2, P3, and P5), and one undefined (P4) substance in WSOC from the three sources. The relative intensities of the fluorescent components mainly depended on the different types of sources. For example, HULIS-1 was abundant in tunnel aerosols; P2 was more intense in BB aerosols but not observed in vehicle emissions; P4 was intense in CC aerosols and vehicle emissions; P5 was more abundant in fresh vehicle exhaust particles; although P3 was not abundant, it was ubiquitous in all tested aerosols. Similar to WSOC, six fluorescent components were identified in MSOC. Although the methanol-soluble chromophores were poorly understood, different characteristics were observed in different sources.
FT-ICR mass spectra showed the m∕z values of the compounds with an m∕z value of 200–400 in WSOC and an m∕z value of 350–600 in MSOC (except for CC aerosols), respectively. CHO and CHON were the main components in the six aerosol samples, but S-containing compounds were more abundant in CC and tunnel aerosols than BB aerosols and vehicle exhaust particles in WSOC. Similarly, MSOC mainly contained CHO and CHON species but fewer S-containing compounds. BB aerosols had higher CHO species in MSOC but showed lower CHON than CC aerosols and vehicle emissions. The VK diagram showed that CC aerosols had a higher unsaturation degree and lower oxidation level than the other two sources. This finding was further confirmed by a higher fraction of aromatics in CC aerosols. Unique formulas determined by the Venn diagram showed certain specific chemical characteristics in the VK diagram. BB aerosols emitted unique formulas with more CHO and CHON (88 %–93 %), while CC aerosols and vehicle emissions contained more S-containing compounds (38 %–75 % and 41 %–46 %, respectively). The relationship between optical properties and chemical structures showed the light absorption capacity was positively associated with an unsaturation degree and MW in the source emission samples. Our study illustrated the important roles of sources in light-absorbing BrC and molecular compositions and the EEMs-based and molecular-characteristic-based method for the classification and source apportionment of chromophores in atmospheric aerosols.
The data used in this study are available upon request. Please contact Gan Zhang (zhanggan@gig.ac.cn) and Jun Li (junli@gig.ac.cn).
The supplement related to this article is available online at: https://doi.org/10.5194/acp-20-2513-2020-supplement.
JT, GZ, JL, and YC designed the experiment. JT and MC carried out the measurements and analyzed the data. JT, TS, YH, and HJ organized and performed the samplings. JT (Jianhui Tang) and BJ supported the fluorescence and FT-ICR MS instruments. JT wrote the paper. JL, YM, JS, PP, and GZ reviewed and commented on the paper.
The authors declare that they have no conflict of interest.
This is contribution no. IS-2811 from GIGCAS.
This research has been supported by the National Natural Science Foundation of China (grant nos. 41430645 and 41773120), the National Key R&D Program of China (grant no. 2017YFC0212000), the International Partnership Program of Chinese Academy of Sciences (grant no. 132744KYSB20170002), and the Guangdong Foundation for Program of Science and Technology Research (grant no. 2017B030314057).
This paper was edited by Alex Lee and reviewed by two anonymous referees.
Andersson, C. A. and Bro, R.: The N-way Toolbox for MATLAB, Chemom. Intell. Lab. Syst., 52, 1–4, https://doi.org/10.1016/s0169-7439(00)00071-x, 2000.
Andrade-Eiroa, Á., Canle, M., and Cerdá, V.: Environmental Applications of Excitation-Emission Spectrofluorimetry: An In-Depth Review I, Appl. Spectrosc. Rev., 48, 1–49, https://doi.org/10.1080/05704928.2012.692104, 2013.
Bahram, M., Bro, R., Stedmon, C., and Afkhami, A.: Handling of Rayleigh and Raman scatter for PARAFAC modeling of fluorescence data using interpolation, J. Chemom., 20, 99–105, https://doi.org/10.1002/cem.978, 2006.
Bhattacharya, R. and Osburn, C. L.: Multivariate Analyses of Phytoplankton Pigment Fluorescence from a Freshwater River Network, Environ. Sci. Technol., 51, 6683–6690, https://doi.org/10.1021/acs.est.6b05880, 2017.
Budisulistiorini, S. H., Riva, M., Williams, M., Chen, J., Itoh, M., Surratt, J. D., and Kuwata, M.: Light-Absorbing Brown Carbon Aerosol Constituents from Combustion of Indonesian Peat and Biomass, Environ. Sci. Technol., 51, 4415–4423, https://doi.org/10.1021/acs.est.7b00397, 2017.
Chen, H., Liao, Z. L., Gu, X. Y., Xie, J. Q., Li, H. Z., and Zhang, J.: Anthropogenic Influences of Paved Runoff and Sanitary Sewage on the Dissolved Organic Matter Quality of Wet Weather Overflows: An Excitation-Emission Matrix Parallel Factor Analysis Assessment, Environ. Sci. Technol., 51, 1157–1167, https://doi.org/10.1021/acs.est.6b03727, 2017a.
Chen, Q., Ikemori, F., and Mochida, M.: Light Absorption and Excitation-Emission Fluorescence of Urban Organic Aerosol Components and Their Relationship to Chemical Structure, Environ. Sci. Technol., 50, 10859–10868, https://doi.org/10.1021/acs.est.6b02541, 2016a.
Chen, Q., Miyazaki, Y., Kawamura, K., Matsumoto, K., Coburn, S., Volkamer, R., Iwamoto, Y., Kagami, S., Deng, Y., Ogawa, S., Ramasamy, S., Kato, S., Ida, A., Kajii, Y., and Mochida, M.: Characterization of Chromophoric Water-Soluble Organic Matter in Urban, Forest, and Marine Aerosols by HR-ToF-AMS Analysis and Excitation-Emission Matrix Spectroscopy, Environ. Sci. Technol., 50, 10351–10360, https://doi.org/10.1021/acs.est.6b01643, 2016b.
Chen, Q., Ikemori, F., Nakamura, Y., Vodicka, P., Kawamura, K., and Mochida, M.: Structural and Light-Absorption Characteristics of Complex Water-Insoluble Organic Mixtures in Urban Submicrometer Aerosols, Environ. Sci. Technol., 51, 8293–8303, https://doi.org/10.1021/acs.est.7b01630., 2017b.
Chen, Q., Mu, Z., Song, W., Wang, Y., Yang, Z., Zhang, L., and Zhang, Y. L.: Size Characterization of the Chromophores in Atmospheric Particulate Matter From a Typical Coal City in China, J. Geophys. Res.-Atmos, 124, 10546–10563, https://doi.org/10.1029/2019jd031149, 2019.
Chen, Y., Sheng, G., Bi, X., Feng, Y., Bixian Mai, A., and Fu, J.: Emission Factors for Carbonaceous Particles and Polycyclic Aromatic Hydrocarbons from Residential Coal Combustion in China, Environ. Sci. Technol., 39, 1861–1687, https://doi.org/10.1021/es0493650, 2005.
Chen, Y. and Bond, T. C.: Light absorption by organic carbon from wood combustion, Atmos. Chem. Phys., 10, 1773–1787, https://doi.org/10.5194/acp-10-1773-2010, 2010.
Chen, Y., Tian, C., Feng, Y., Zhi, G., Li, J., and Zhang, G.: Measurements of emission factors of PM2.5, OC, EC, and BC for household stoves of coal combustion in China, Atmos. Environ., 109, 190–196, https://doi.org/10.1016/j.atmosenv.2015.03.023, 2015.
Chen, Y., Ge, X., Chen, H., Xie, X., Chen, Y., Wang, J., Ye, Z., Bao, M., Zhang, Y., and Chen, M.: Seasonal light absorption properties of water-soluble brown carbon in atmospheric fine particles in Nanjing, China, Atmos. Environ., 187, 230–240, https://doi.org/10.1016/j.atmosenv.2018.06.002, 2018.
Cheng, Y., He, K.-B., Zheng, M., Duan, F.-K., Du, Z.-Y., Ma, Y.-L., Tan, J.-H., Yang, F.-M., Liu, J.-M., Zhang, X.-L., Weber, R. J., Bergin, M. H., and Russell, A. G.: Mass absorption efficiency of elemental carbon and water-soluble organic carbon in Beijing, China, Atmos. Chem. Phys., 11, 11497–11510, https://doi.org/10.5194/acp-11-11497-2011, 2011.
Cheng, Y., He, K.-B., Du, Z.-Y., Engling, G., Liu, J.-M., Ma, Y.-L., Zheng, M., and Weber, R. J.: The characteristics of brown carbon aerosol during winter in Beijing, Atmos. Environ., 127, 355–364, https://doi.org/10.1016/j.atmosenv.2015.12.035, 2016.
Coble, P. G.: Characterization of marine and terrestrial DOM in seawater using excitation-emission matrix spectroscopy, Mar. Chem., 51, 325–346, https://doi.org/10.1016/0304-4203(95)00062-3, 1996.
Coggon, M. M., Veres, P. R., Yuan, B., Koss, A., Warneke, C., Gilman, J. B., Lerner, B. M., Peischl, J., Aikin, K. C., Stockwell, C. E., Hatch, L. E., Ryerson, T. B., Roberts, J. M., Yokelson, R. J., and de Gouw, J. A.: Emissions of nitrogen-containing organic compounds from the burning of herbaceous and arboraceous biomass: Fuel composition dependence and the variability of commonly used nitrile tracers, Geophys. Res. Lett., 43, 9903–9912, https//doi.org/10.1002/2016gl070562, 2016.
Cory, R. M. and Mcknight, D. M.: Fluorescence Spectroscopy Reveals Ubiquitous Presence of Oxidized and Reduced Quinones in Dissolved Organic Matter, Environ. Sci. Technol., 39, 8142–8149, https://doi.org/10.1021/es0506962, 2005.
Cui, M., Chen, Y., Zheng, M., Li, J., Tang, J., Han, Y., Song, D., Yan, C., Zhang, F., Tian, C., and Zhang, G.: Emissions and characteristics of particulate matter from rainforest burning in the Southeast Asia, Atmos. Environ., 191, 194–204, https://doi.org/10.1016/j.atmosenv.2018.07.062, 2018.
Dasari, S., Andersson, A., Bikkina, S., Holmstrand, H., Budhavant, K., Satheesh, S. K., Asmi, E., Kesti, J., Backman, J., and Salam, A.: Photochemical degradation affects the light absorption of water-soluble brown carbon in the South Asian outflow, Sci. Adv., 5, https://doi.org/10.1126/sciadv.aau8066, 2019.
Di Lorenzo, R. A., Washenfelder, R. A., Attwood, A. R., Guo, H., Xu, L., Ng, N. L., Weber, R. J., Baumann, K., Edgerton, E., and Young, C. J.: Molecular-Size-Separated Brown Carbon Absorption for Biomass-Burning Aerosol at Multiple Field Sites, Environ. Sci. Technol., 51, 3128–3137, https://doi.org/10.1021/acs.est.6b06160, 2017.
Fan, X., Song, J., and Peng, P. A.: Comparison of isolation and quantification methods to measure humic-like substances (HULIS) in atmospheric particles, Atmos. Environ., 60, 366–374, https://doi.org/10.1016/j.atmosenv.2012.06.063, 2012.
Fan, X., Wei, S., Zhu, M., Song, J., and Peng, P.: Comprehensive characterization of humic-like substances in smoke PM2.5 emitted from the combustion of biomass materials and fossil fuels, Atmos. Chem. Phys., 16, 13321–13340, https://doi.org/10.5194/acp-16-13321-2016, 2016.
Feng, S., Zhang, L., Wang, S., Nadykto, A. B., Xu, Y., Shi, Q., Jiang, B., and Qian, W.: Characterization of dissolved organic nitrogen in wet deposition from Lake Erhai basin by using ultrahigh resolution FT-ICR mass spectrometry, Chemosphere, 156, 438–445, https://doi.org/10.1016/j.chemosphere.2016.04.039, 2016.
Feng, Y., Ramanathan, V., and Kotamarthi, V. R.: Brown carbon: a significant atmospheric absorber of solar radiation?, Atmos. Chem. Phys., 13, 8607–8621, https://doi.org/10.5194/acp-13-8607-2013, 2013.
Fleming, L. T., Lin, P., Laskin, A., Laskin, J., Weltman, R., Edwards, R. D., Arora, N. K., Yadav, A., Meinardi, S., Blake, D. R., Pillarisetti, A., Smith, K. R., and Nizkorodov, S. A.: Molecular composition of particulate matter emissions from dung and brushwood burning household cookstoves in Haryana, India, Atmos. Chem. Phys., 18, 2461–2480, https://doi.org/10.5194/acp-18-2461-2018, 2018.
Fu, P., Kawamura, K., Chen, J., Qin, M., Ren, L., Sun, Y., Wang, Z., Barrie, L. A., Tachibana, E., Ding, A., and Yamashita, Y.: Fluorescent water-soluble organic aerosols in the High Arctic atmosphere, Sci. Rep., 5, 9845, https://doi.org/10.1038/srep09845, 2015.
Gentner, D. R., Jathar, S. H., Gordon, T. D., Bahreini, R., Day, D. A., El Haddad, I., Hayes, P. L., Pieber, S. M., Platt, S. M., de Gouw, J., Goldstein, A. H., Harley, R. A., Jimenez, J. L., Prevot, A. S., and Robinson, A. L.: Review of Urban Secondary Organic Aerosol Formation from Gasoline and Diesel Motor Vehicle Emissions, Environ. Sci. Technol., 51, 1074–1093, https://doi.org/10.1021/acs.est.6b04509, 2017.
Ghidotti, M., Fabbri, D., Masek, O., Mackay, C. L., Montalti, M., and Hornung, A.: Source and Biological Response of Biochar Organic Compounds Released into Water; Relationships with Bio-Oil Composition and Carbonization Degree, Environ. Sci. Technol., 51, 6580–6589, https://doi.org/10.1021/acs.est.7b00520, 2017.
Graber, E. R. and Rudich, Y.: Atmospheric HULIS: How humic-like are they? A comprehensive and critical review, Atmos. Chem. Phys., 6, 729–753, https://doi.org/10.5194/acp-6-729-2006, 2006.
Gu, Q. and Kenny, J. E.: Improvement of Inner Filter Effect Correction Based on Determination of Effective Geometric Parameters Using a Conventional Fluorimeter, Anal. Chem., 81, 420–426, https://doi.org/10.1021/ac801676j, 2009.
Hecobian, A., Zhang, X., Zheng, M., Frank, N., Edgerton, E. S., and Weber, R. J.: Water-Soluble Organic Aerosol material and the light-absorption characteristics of aqueous extracts measured over the Southeastern United States, Atmos. Chem. Phys., 10, 5965–5977, https://doi.org/10.5194/acp-10-5965-2010, 2010.
Jiang, B., Kuang, B. Y., Liang, Y., Zhang, J., Huang, X. H. H., Xu, C., Yu, J. Z., and Shi, Q.: Molecular composition of urban organic aerosols on clear and hazy days in Beijing: a comparative study using FT-ICR MS, Environ. Chem., 13, 888–901, https://doi.org/10.1071/en15230, 2016.
Kirchstetter, T. W. and Thatcher, T. L.: Contribution of organic carbon to wood smoke particulate matter absorption of solar radiation, Atmos. Chem. Phys., 12, 6067–6072, https://doi.org/10.5194/acp-12-6067-2012, 2012.
Koch, B. and Dittmar, T.: From mass to structure: An aromaticity index for high-resolution mass data of natural organic matter, Rapid Commun. Mass Spectrom., 20, 926–932, https://doi.org/10.1002/rcm.2386, 2006.
Kumar, N. K., Corbin, J. C., Bruns, E. A., Massabó, D., Slowik, J. G., Drinovec, L., Močnik, G., Prati, P., Vlachou, A., Baltensperger, U., Gysel, M., El-Haddad, I., and Prévôt, A. S. H.: Production of particulate brown carbon during atmospheric aging of residential wood-burning emissions, Atmos. Chem. Phys., 18, 17843–17861, https://doi.org/10.5194/acp-18-17843-2018, 2018.
Laskin, A., Laskin, J., and Nizkorodov, S. A.: Chemistry of atmospheric brown carbon, Chem. Rev., 115, 4335–4382, https://doi.org/10.1021/cr5006167, 2015.
Laskin, A., Smith, J. S., and Laskin, J.: Molecular Characterization of Nitrogen-Containing Organic Compounds in Biomass Burning Aerosols Using High-Resolution Mass Spectrometry, Environ. Sci. Technol., 43, 3764–3771, https://doi.org/10.1021/es803456n, 2009.
Lee, H. J., Laskin, A., Laskin, J., and Nizkorodov, S. A.: Excitation-emission spectra and fluorescence quantum yields for fresh and aged biogenic secondary organic aerosols, Environ. Sci. Technol., 47, 5763–5770, https://doi.org/10.1021/es400644c, 2013.
Li, C., He, Q., Schade, J., Passig, J., Zimmermann, R., Meidan, D., Laskin, A., and Rudich, Y.: Dynamic changes in optical and chemical properties of tar ball aerosols by atmospheric photochemical aging, Atmos. Chem. Phys., 19, 139–163, https://doi.org/10.5194/acp-19-139-2019, 2019.
Li, M., Fan, X., Zhu, M., Zou, C., Song, J., Wei, S., Jia, W., and Peng, P.: Abundances and light absorption properties of brown carbon emitted from residential coal combustion in China, Environ. Sci. Technol., 53, 595–603, https://doi.org/10.1021/acs.est.8b05630, 2018.
Lin, P., Rincon, A. G., Kalberer, M., and Yu, J. Z.: Elemental composition of HULIS in the Pearl River Delta Region, China: results inferred from positive and negative electrospray high resolution mass spectrometric data, Environ. Sci. Technol., 46, 7454–7462, https://doi.org/10.1021/es300285d, 2012a.
Lin, P., Yu, J. Z., Engling, G., and Kalberer, M.: Organosulfates in humic-like substance fraction isolated from aerosols at seven locations in East Asia: a study by ultra-high-resolution mass spectrometry, Environ. Sci. Technol., 46, 13118–13127, https://doi.org/10.1021/es303570v, 2012b.
Lin, P., Aiona, P. K., Li, Y., Shiraiwa, M., Laskin, J., Nizkorodov, S. A., and Laskin, A.: Molecular Characterization of Brown Carbon in Biomass Burning Aerosol Particles, Environ. Sci. Technol., 50, 11815–11824, https://doi.org/10.1021/acs.est.6b03024, 2016.
Lin, P., Fleming, L. T., Nizkorodov, S. A., Laskin, J., and Laskin, A.: Comprehensive Molecular Characterization of Atmospheric Brown Carbon by High Resolution Mass Spectrometry with Electrospray and Atmospheric Pressure Photoionization, Anal. Chem., 90, 12493–12502, https://doi.org/10.1021/acs.analchem.8b02177, 2018.
Liu, J., Bergin, M., Guo, H., King, L., Kotra, N., Edgerton, E., and Weber, R. J.: Size-resolved measurements of brown carbon in water and methanol extracts and estimates of their contribution to ambient fine-particle light absorption, Atmos. Chem. Phys., 13, 12389–12404, https://doi.org/10.5194/acp-13-12389-2013, 2013.
Liu, J., Mo, Y., Ding, P., Li, J., Shen, C., and Zhang, G.: Dual carbon isotopes (14C and 13C) and optical properties of WSOC and HULIS-C during winter in Guangzhou, China, Sci. Total Environ., 633, 1571–1578, https://doi.org/10.1016/j.scitotenv.2018.03.293, 2018.
Luciani, X., Mounier, S., Redon, R., and Bois, A.: A simple correction method of inner filter effects affecting FEEM and its application to the PARAFAC decomposition, Chemom. Intell. Lab. Syst., 96, 227–238, https://doi.org/10.1016/j.chemolab.2009.02.008, 2009.
Lv, J., Zhang, S., Wang, S., Luo, L., Cao, D., and Christie, P.: Molecular-Scale Investigation with ESI-FT-ICR-MS on Fractionation of Dissolved Organic Matter Induced by Adsorption on Iron Oxyhydroxides, Environ. Sci. Technol., 50, 2328–2336, https://doi.org/10.1021/acs.est.5b04996, 2016.
Matos, J. T. V., Freire, S. M. S. C., Duarte, R. M. B. O., and Duarte, A. C.: Natural organic matter in urban aerosols: Comparison between water and alkaline soluble components using excitation–emission matrix fluorescence spectroscopy and multiway data analysis, Atmos. Environ., 102, 1–10, https://doi.org/10.1016/j.atmosenv.2014.11.042, 2015.
Mazzoleni, L. R., Ehrmann, B. M., Shen, X. H., Marshall, A. G., and Collett, J. L.: Water-Soluble Atmospheric Organic Matter in Fog: Exact Masses and Chemical Formula Identification by Ultrahigh-Resolution Fourier Transform Ion Cyclotron Resonance Mass Spectrometry, Environ. Sci. Technol., 44, 3690–3697, https://doi.org/10.1021/es903409k, 2010.
Mo, Y., Li, J., Jiang, B., Su, T., Geng, X., Liu, J., Jiang, H., Shen, C., Ding, P., Zhong, G., Cheng, Z., Liao, Y., Tian, C., Chen, Y., and Zhang, G.: Sources, compositions, and optical properties of humic-like substances in Beijing during the 2014 APEC summit: Results from dual carbon isotope and Fourier-transform ion cyclotron resonance mass spectrometry analyses, Environ. Pollut., 239, 322–331, https://doi.org/10.1016/j.envpol.2018.04.041, 2018.
Mo, Y. Z., Li, J., Liu, J. W., Zhong, G. C., Cheng, Z. N., Tian, C. G., Chen, Y. J., and Zhang, G.: The influence of solvent and pH on determination of the light absorption properties of water-soluble brown carbon, Atmos. Environ., 161, 90–98, https://doi.org/10.1016/j.atmosenv.2017.04.037, 2017.
Murphy, K. R., Butler, K. D., Spencer, R. G., Stedmon, C. A., Boehme, J. R., and Aiken, G. R.: Measurement of dissolved organic matter fluorescence in aquatic environments: an interlaboratory comparison, Environ. Sci. Technol., 44, 9405–9412, https://doi.org/10.1021/es102362t, 2010.
Murphy, K. R., Stedmon, C. A., Graeber, D., and Bro, R.: Fluorescence spectroscopy and multi-way techniques, PARAFAC, Anal. Methods, 5, 6557–6566, https://doi.org/10.1039/c3ay41160e, 2013.
Park, S., Yu, G.-H., and Lee, S.: Optical absorption characteristics of brown carbon aerosols during the KORUS-AQ campaign at an urban site, Atmos. Res., 203, 16–27, https://doi.org/10.1016/j.atmosres.2017.12.002, 2018.
Park, S. S. and Yu, J.: Chemical and light absorption properties of humic-like substances from biomass burning emissions under controlled combustion experiments, Atmos. Environ., 136, 114–122, https://doi.org/10.1016/j.atmosenv.2016.04.022, 2016.
Qin, J., Zhang, L., Zhou, X., Duan, J., Mu, S., Xiao, K., Hu, J., and Tan, J.: Fluorescence fingerprinting properties for exploring water-soluble organic compounds in PM2.5 in an industrial city of northwest China, Atmos. Environ., 184, 203–211, https://doi.org/10.1016/j.atmosenv.2018.04.049, 2018.
Saleh, R., Robinson, E. S., Tkacik, D. S., Ahern, A. T., Liu, S., Aiken, A. C., Sullivan, R. C., Presto, A. A., Dubey, M. K., Yokelson, R. J., Donahue, N. M., and Robinson, A. L.: Brownness of organics in aerosols from biomass burning linked to their black carbon content, Nat. Geosci., 7, 647–650, https://doi.org/10.1038/ngeo2220, 2014.
Schmitt-Kopplin, P., Gelencser, A., Dabek-Zlotorzynska, E., Kiss, G., Hertkorn, N., Harir, M., Hong, Y., and Gebefugi, I.: Analysis of the Unresolved Organic Fraction in Atmospheric Aerosols with Ultrahigh-Resolution Mass Spectrometry and Nuclear Magnetic Resonance Spectroscopy: Organosulfates As Photochemical Smog Constituents, Anal. Chem., 82, 8017–8026, https://doi.org/10.1021/ac101444r, 2010.
Sgroi, M., Roccaro, P., Korshin, G. V., and Vagliasindi, F. G. A.: Monitoring the Behavior of Emerging Contaminants in Wastewater-Impacted Rivers Based on the Use of Fluorescence Excitation Emission Matrixes (EEM), Environ. Sci. Technol., 51, 4306–4316, https://doi.org/10.1021/acs.est.6b05785, 2017.
Shetty, N. J., Pandey, A., Baker, S., Hao, W. M., and Chakrabarty, R. K.: Measuring light absorption by freshly emitted organic aerosols: optical artifacts in traditional solvent-extraction-based methods, Atmos. Chem. Phys., 19, 8817–8830, https://doi.org/10.5194/acp-19-8817-2019, 2019.
Shimabuku, K. K., Kennedy, A. M., Mulhern, R. E., and Summers, R. S.: Evaluating Activated Carbon Adsorption of Dissolved Organic Matter and Micropollutants Using Fluorescence Spectroscopy, Environ. Sci. Technol., 51, 2676–2684, https://doi.org/10.1021/acs.est.6b04911, 2017.
Sleighter, R. L., Chen, H., Wozniak, A. S., Willoughby, A. S., Caricasole, P., and Hatcher, P. G.: Establishing a measure of reproducibility of ultrahigh-resolution mass spectra for complex mixtures of natural organic matter, Anal. Chem., 84, 9184–9191, https://doi.org/10.1021/ac3018026, 2012.
Smith, J. S., Laskin, A., and Laskin, J.: Molecular Characterization of Biomass Burning Aerosols Using High-Resolution Mass Spectrometry, Anal. Chem., 81, 1512–1521, https://doi.org/10.1021/ac8020664, 2009.
Song, J., Li, M., Jiang, B., Wei, S., Fan, X., and Peng, P.: Molecular Characterization of Water-Soluble Humic like Substances in Smoke Particles Emitted from Combustion of Biomass Materials and Coal Using Ultrahigh-Resolution Electrospray Ionization Fourier Transform Ion Cyclotron Resonance Mass Spectrometry, Environ. Sci. Technol., 52, 2575–2585, https://doi.org/10.1021/acs.est.7b06126, 2018.
Song, J., Li, M., Fan, X., Zou, C., Zhu, M., Jiang, B., Yu, Z., Jia, W., Liao, Y., and Peng, P. A.: Molecular characterization of water- and methanol-soluble organic compounds emitted from residential coal combustion using ultrahigh-resolution electrospray ionization Fourier transform ion cyclotron resonance mass spectrometry, Environ. Sci. Technol., 53, 13607–13617, https://doi.org/10.1021/acs.est.9b04331, 2019.
Stubbins, A., Lapierre, J. F., Berggren, M., Prairie, Y. T., Dittmar, T., and del Giorgio, P. A.: What's in an EEM? Molecular signatures associated with dissolved organic fluorescence in boreal Canada, Environ. Sci. Technol., 48, 10598–10606, https://doi.org/10.1021/es502086e, 2014.
Sun, H., Biedermann, L., and Bond, T. C.: Color of brown carbon: A model for ultraviolet and visible light absorption by organic carbon aerosol, Geophys. Res. Lett., 34, L17813, https://doi.org/10.1029/2007gl029797, 2007.
Tao, S., Lu, X., Levac, N., Bateman, A. P., Nguyen, T. B., Bones, D. L., Nizkorodov, S. A., Laskin, J., Laskin, A., and Yang, X.: Molecular Characterization of Organosulfates in Organic Aerosols from Shanghai and Los Angeles Urban Areas by Nanospray-Desorption Electrospray Ionization High-Resolution Mass Spectrometry, Environ. Sci. Technol., 48, 10993–11001, https://doi.org/10.1021/es5024674, 2014.
Tian, J., Ni, H., Cao, J., Han, Y., Wang, Q., Wang, X., Chen, L. W. A., Chow, J. C., Watson, J. G., Wei, C., Sun, J., Zhang, T., and Huang, R.: Characteristics of carbonaceous particles from residential coal combustion and agricultural biomass burning in China, Atmos. Pollut. Res., 8, 521–527, https://doi.org/10.1016/j.apr.2016.12.006, 2017.
Wang, Y., Hu, M., Lin, P., Guo, Q., Wu, Z., Li, M., Zeng, L., Song, Y., Zeng, L., Wu, Y., Guo, S., Huang, X., and He, L.: Molecular Characterization of Nitrogen-Containing Organic Compounds in Humic-like Substances Emitted from Straw Residue Burning, Environ. Sci. Technol., 51, 5951–5961, https://doi.org/10.1021/acs.est.7b00248, 2017.
Wells, M. J. M., Mullins, G. A., Bell, K. Y., Da Silva, A. K., and Navarrete, E. M.: Fluorescence and Quenching Assessment (EEM-PARAFAC) of de Facto Potable Reuse in the Neuse River, North Carolina, United States, Environ. Sci. Technol., 51, 13592–13602, https://doi.org/10.1021/acs.est.7b03766, 2017.
Wong, J. P. S., Nenes, A., and Weber, R. J.: Changes in Light Absorptivity of Molecular Weight Separated Brown Carbon Due to Photolytic Aging, Environ. Sci. Technol., 51, 8414–8421, https://doi.org/10.1021/acs.est.7b01739, 2017.
Wozniak, A. S., Bauer, J. E., Sleighter, R. L., Dickhut, R. M., and Hatcher, P. G.: Technical Note: Molecular characterization of aerosol-derived water soluble organic carbon using ultrahigh resolution electrospray ionization Fourier transform ion cyclotron resonance mass spectrometry, Atmos. Chem. Phys., 8, 5099–5111, https://doi.org/10.5194/acp-8-5099-2008, 2008.
Wu, G., Ram, K., Fu, P., Wang, W., Zhang, Y., Liu, X., Stone, E. A., Pradhan, B. B., Dangol, P. M., Panday, A. K., Wan, X., Bai, Z., Kang, S., Zhang, Q., and Cong, Z.: Water-Soluble Brown Carbon in Atmospheric Aerosols from Godavari (Nepal), a Regional Representative of South Asia, Environ. Sci. Technol., 53, 3471–3479, https://doi.org/10.1021/acs.est.9b00596, 2019.
Xie, M., Hays, M. D., and Holder, A. L.: Light-absorbing organic carbon from prescribed and laboratory biomass burning and gasoline vehicle emissions, Sci. Rep., 7, 7318, https://doi.org/10.1038/s41598-017-06981-8, 2017.
Xie, M., Chen, X., Holder, A. L., Hays, M. D., Lewandowski, M., Offenberg, J. H., Kleindienst, T. E., Jaoui, M., and Hannigan, M. P.: Light absorption of organic carbon and its sources at a southeastern U.S. location in summer, Environ. Pollut., 244, 38–46, https://doi.org/10.1016/j.envpol.2018.09.125, 2019.
Yan, C., Zheng, M., Sullivan, A. P., Bosch, C., Desyaterik, Y., Andersson, A., Li, X., Guo, X., Zhou, T., Gustafsson, Ö., and Collett, J. L.: Chemical characteristics and light-absorbing property of water-soluble organic carbon in Beijing: Biomass burning contributions, Atmos. Environ., 121, 4–12, https://doi.org/10.1016/j.atmosenv.2015.05.005, 2015.
Yan, G. and Kim, G.: Speciation and Sources of Brown Carbon in Precipitation at Seoul, Korea: Insights from Excitation-Emission Matrix Spectroscopy and Carbon Isotopic Analysis, Environ. Sci. Technol., 51, 11580–11587, https://doi.org/10.1021/acs.est.7b02892, 2017.
Yassine, M. M., Dabek-Zlotorzynska, E., Harir, M., and Schmitt-Kopplin, P.: Identification of weak and strong organic acids in atmospheric aerosols by capillary electrophoresis/mass spectrometry and ultra-high-resolution Fourier transform ion cyclotron resonance mass spectrometry, Anal. Chem., 84, 6586–6594, https://doi.org/10.1021/ac300798g, 2012.
Yu, H., Liang, H., Qu, F., Han, Z. S., Shao, S., Chang, H., and Li, G.: Impact of dataset diversity on accuracy and sensitivity of parallel factor analysis model of dissolved organic matter fluorescence excitation-emission matrix, Sci. Rep., 5, 10207, https://doi.org/10.1038/srep10207, 2015.
Zhang, X., Lin, Y. H., Surratt, J. D., Zotter, P., Prevot, A. S. H., and Weber, R. J.: Light soluble organic aerosol in Los Angeles and Atlanta: A contrast in secondary organic aerosol, Geophys. Res. Lett., 38, L21810, https://doi.org/10.1029/2011GL049385, 2011.
Zhang, X., Lin, Y. H., Surratt, J. D., and Weber, R. J.: Sources, composition and absorption Angstrom exponent of light-absorbing organic components in aerosol extracts from the Los Angeles Basin, Environ. Sci. Technol., 47, 3685–3693, https://doi.org/10.1021/es305047b, 2013.
Zhang, Y., Yuan, Q., Huang, D., Kong, S., Zhang, J., Wang, X., Lu, C., Shi, Z., Zhang, X., Sun, Y., Wang, Z., Shao, L., Zhu, J., and Li, W.: Direct Observations of Fine Primary Particles From Residential Coal Burning: Insights Into Their Morphology, Composition, and Hygroscopicity, J. Geophys. Res.-Atmos, 123, 12964–12979, https://doi.org/10.1029/2018jd028988, 2018.
Zhao, Y., Hallar, A. G., and Mazzoleni, L. R.: Atmospheric organic matter in clouds: exact masses and molecular formula identification using ultrahigh-resolution FT-ICR mass spectrometry, Atmos. Chem. Phys., 13, 12343–12362, https://doi.org/10.5194/acp-13-12343-2013, 2013.
Zhu, C. S., Cao, J. J., Huang, R. J., Shen, Z. X., Wang, Q. Y., and Zhang, N. N.: Light absorption properties of brown carbon over the southeastern Tibetan Plateau, Sci. Total Environ., 625, 246–251, https://doi.org/10.1016/j.scitotenv.2017.12.183, 2018.