the Creative Commons Attribution 4.0 License.
the Creative Commons Attribution 4.0 License.
 | 26 Feb 2020
Conceptual model of diurnal cycle of low-level stratiform clouds over southern West Africa
Norbert Kalthoff
Bianca Adler
Karmen Babić
Cheikh Dione
Marie Lothon
Xabier Pedruzo-Bagazgoitia
Maurin Zouzoua
The DACCIWA (Dynamics Aerosol Chemistry Cloud Interactions in West Africa) project and the associated ground-based field experiment, which took place during summer 2016, provided a comprehensive dataset on the low-level stratiform clouds (LLSCs), which develop almost every night over southern West Africa. The LLSCs, inaccurately represented in climate and weather forecasts, form in the monsoon flow during the night and break up during the following morning or afternoon, affecting considerably the radiation budget. Several published studies give an overview of the measurements during the campaign, analyse the dynamical features in which the LLSCs develop, and quantify the processes involved in the LLSC formation. Based on the main results of these studies and new analyses, we propose in this paper a conceptual model of the diurnal cycle of the LLSCs over southern West Africa. Four main phases compose the diurnal cycle of the LLSC. The stable and the jet phases are the two steps during which the relative humidity increases, due to cooling of the air, until the air is saturated and the LLSCs form. Horizontal advection of cold air from the Guinean coast by the maritime inflow and the nocturnal low-level jet (NLLJ) represents 50 % of the local total cooling. The remaining half is mainly due to divergence of net radiation and turbulence flux. The third step of the LLSC diurnal cycle is the stratus phase, which starts during the night and lasts until the onset of surface-buoyancy-driven turbulence on the following day. During the stratus phase, interactions between the LLSCs and the NLLJ lead to a modification of the wind speed vertical profile in the cloud layer, and a mixing of the sub-cloud layer by shear-driven turbulence below the NLLJ core. The breakup of the LLSC occurs during the convective phase and follows three different scenarios which depend on the intensity of the turbulence observed during the night in the sub-cloud layer. The breakup time has a considerable impact on the energy balance of the Earth's surface and, consequently, on the depth of the convective boundary layer, which could vary by a factor of 2 from day-to-day.


Low-level stratiform clouds (LLSCs) frequently develop over southern West Africa during the monsoon season. They form during the night, cover an extensive area, and break up on the following day (Schrage and Fink, 2012; Schuster et al., 2013; Linden et al., 1955). LLSCs significantly affect the radiation, the diurnal cycle of the convective boundary layer (CBL), and consequently, the regional climate (Knippertz et al., 2011; Hannak et al., 2017). However, strong biases exist between LLSC representation in weather and climate models and observations, which leads to an overestimation of the solar radiation across southern West Africa by the models (Knippertz et al., 2011; Hannak et al., 2017).
Before the DACCIWA (Dynamics Aerosol Chemistry Cloud Interactions in West Africa) project (Knippertz et al., 2015), most of the knowledge about the physical processes involved in the diurnal cycle of the LLSC was based on numerical simulations, satellite images, or synoptic meteorological station network measurements. LLSCs form in the monsoon flow, where meteorological phenomena and geographical features have combined impacts on them. Schrage and Fink (2012), Schuster et al. (2013), Adler et al. (2017), and Deetz et al. (2018) suggested that orographic and gravity-wave lifting, horizontal cold-air advection, and shear-driven turbulence associated with the nocturnal low-level jet (NLLJ) could all play a role in the LLSC formation.
The continuous horizontal advection of cold air from the Guinean coast is maintained by the monsoon flow, but continental southern West Africa is also impacted by the sea breeze. During the daytime, the turbulence in the CBL over land decelerates the south-westerly flow, which leads to a convergence zone along a line parallel to the coast (Knippertz et al., 2017; Adler et al., 2017; Deetz et al., 2018) between the cold maritime air to the south and the warmer air in the CBL to the north. Grams et al. (2010) investigated such a stationary sea-breeze front during the day along the Mauritanian coast, which propagates farther inland at the end of the afternoon when the turbulence collapses. In numerical simulations, the convergence zone has been shown to move slowly several tens of kilometres inland during the day. In the late afternoon, when turbulence vanishes in the CBL, the flow accelerates and the convergence zone moves farther and faster northwards over land (Adler et al., 2017; Deetz et al., 2018). This phenomenon is called the Gulf of Guinea Maritime Inflow (MI) in Adler et al. (2019).
Schrage and Fink (2012) and Schuster et al. (2013) suggested a dominant role played by the NLLJ on the LLSC formation over southern West Africa, because it intensifies the cold air advection and generates shear-driven turbulent mixing. The NLLJ typically forms over land at the end of the day when daytime buoyancy-driven turbulence ceases and the Coriolis force predominates, accelerating the wind towards low pressure (Blackadar, 1957). Although the NLLJ is observed almost every night in West Africa during the monsoon season (Parker et al., 2005; Lothon et al., 2008), this formation mechanism may not be applicable at these low latitudes where the Coriolis force is weak. Parker et al. (2005) interpreted a laboratory experiment of Linden and Simpson (1986) to suggest that when turbulence rapidly diminishes, the flow is then able to respond to the pressure-gradient force. So, when the flow at low layers is decoupled from the surface and the friction force is reduced, the NLLJ develops.
One of the objectives of the DACCIWA project was to enhance, with extensive local observations, the knowledge about the LLSC diurnal cycle and determine the important processes that need to be included in the weather and climate models to correctly simulate the LLSCs. Comprehensive measurement systems were deployed at three supersites, Kumasi (Ghana), Savè (Benin), and Ile-Ife (Nigeria), from mid-June to the end of July 2016. Figure 1 shows LLSC occurrence and average cloud fraction during the DACCIWA field campaign reported over a synoptic 55-station network at 06:00 UTC. Only LLSC with more than 4 octas are considered in the statistics. In Kumasi and Ile-Ife, a 5–6 octas LLSC coverage is observed with an occurrence of 80 %–90 %, whereas the cloud fraction is 7–8 octas with a slightly lower occurrence (70 %–80 %) in Savè than in Kumasi and Ile-Ife. Kalthoff et al. (2018) provide an overview of the measurements during the DACCIWA field experiment at the three sites, and they present the datasets in the BAOBAB (Base Afrique de l'Ouest Beyond AMMA Base) database.
The most comprehensive dataset, acquired in Savè (180 km north of the Gulf of Guinea), allowed for three complementary studies on the LLSC. Using the 41 d period, Dione et al. (2019) give a statistical overview and a day-to-day quantification of the LLSC appearance and breakup times, as well as the MI and NLLJ arrival times at Savè. Statistical characteristics of the monsoon flow and the NLLJ are also provided. In addition to this statistical overview, the days with occurrence of a density current, due to convection in the surroundings of Savè, or rain, which are common phenomena during the summer season and likely influence the LLSC formation, are listed. Babić et al. (2019a) analyse the diurnal cycle of the LLSC at Savè on 8 July 2016, which is representative of the typical LLSC development at Savè. Babić et al. (2019a) split the diurnal cycle into five phases (stable, jet, stratus I, stratus II, and convective phases) whose characteristics are analysed. The terms of the relative humidity tendency equation are quantified and show that the cooling occurring during the two first phases is the main contribution leading to saturation. Heat budget terms during the different phases are then analysed to study the processes involved in the LLSC formation. Adler et al. (2019) generalize this approach from a selection of 11 out of 15 intensive operational periods (IOPs). The first locations of an LLSC appearance in southern West Africa and the way the LLSCs extend horizontally during the night varied considerably from one IOP to the next, but they confirm that the LLSCs are not advected from the Guinean coast. Adler et al. (2019) and Babić et al. (2019a) quantify and confirm the importance of the MI and NLLJ as the main processes for the low layer cooling before the cloud formation. The shear-driven turbulence in the sub-cloud layer, below the NLLJ core, is also a driver of the coupling between the LLSC and the surface. Additionally, Babić et al. (2019b) compared conditions during cloudy and clear nights and found that the interplay between the onset time and strength of the NLLJ, horizontal cold-air advection, and background moisture level are crucial for LLSC formation during the monsoon season.
The objective of this paper is to draw the most important lessons learnt from Adler et al. (2019), Babić et al. (2019a), and Dione et al. (2019) in order to build a conceptual model of the LLSC diurnal cycle observed over southern West Africa. The LLSC breakup stage and the LLSC impact on radiation and CBL vertical development, not addressed in Adler et al. (2019), Babić et al. (2019a), or Dione et al. (2019), are also analysed in this study. Our synthetic analysis is mostly based on the Savè supersite dataset. When possible, according to the instrumentation availability, we also apply our conceptual model to the Kumasi and Ile-Ife datasets in order to test it at different geographical places.
Section 2 presents the three instrumented supersites of the DACCIWA campaign. The differences in instrumentation and operations between Savè and the two other supersites are emphasized to explain whether the analyses can also be applied to the Kumasi or Ile-Ife datasets. Section 3 introduces the four-phase representation of the diurnal cycle of the LLSCs. In Sect. 3.1, the two phases prior to LLSC formation are described, and the main processes responsible for the LLSC formation are addressed and quantified. In Sect. 3.2, LLSC and lower troposphere characteristics and their interactions are analysed during nocturnal and turbulent convection conditions until LLSC breakup. Discussion and conclusions are presented in Sect. 4.
Three supersites were deployed for the DACCIWA field campaign between 14 June and 31 July 2016: Kumasi in Ghana, Ile-Ife in Nigeria, and Savè in Benin (Kalthoff et al., 2018). UTC and local solar time are only about 6, 10, and 18 min apart at Kumasi (6.6796 ∘N, 1.5601 ∘W), Savè (8.0009 ∘N, 2.4275 ∘E), and Ile-Ife (7.5532 ∘N, 4.5574 ∘E), respectively. The results are henceforth presented in UTC. The ground-based campaign consisted of a 48 d period with continuous in situ and remote sensing observations during which 15 IOPs were conducted at the three supersites. In addition to the continuous measurements, frequent radiosondes were released at the three sites during the IOPs.
The study of the diurnal cycle of the LLSCs was conducted using the comprehensive instrumentation at the Savè site (Adler et al., 2019; Babić et al., 2019a; Dione et al., 2019). If data availability allows, we apply the same approach and methodology to the two other sites. The instruments used most to support the conceptual model are listed below.
-
Radiosondes were launched in Savè every 1.0 to 1.5 h, depending on the IOP, between 17:00 UTC on day D and 11:00 UTC on day D+1 in Savè. The temperature, relative humidity, and wind vertical profiles in the lower (0.0–1.5 km) atmosphere were used at Savè to study the processes involved in LLSC formation (Adler et al., 2019; Babić et al., 2019a) and dissolution. The same methodology was partly applied to the Kumasi dataset, where the radiosondes were released every 1.5–3.0 h during some IOPs. Unfortunately, this approach was not applicable to the Ile-Ife site, where the soundings with a tethered balloon were sparse (every 3 h at the best) and did not reach a sufficiently high level.
-
A ceilometer was deployed at the Savè and Kumasi sites, providing the cloud-base height (CBH) continuously. The LLSC fraction (Adler et al., 2019) was deduced from the percentage of CBHs measured below 1000 m. Adler et al. (2019) used a 600 m height threshold for the stratus phase analysis. This threshold is increased up to 1000 m in the present study, consistently with Dione et al. (2019), to allow the stratus to cumulus transition analysis during the convective phase. A cloud fraction larger than 95 % is chosen as a criterion to determine the presence of stratus clouds above the supersite, from which the stratus appearance and breakup times are deduced. Stratus appearance and breakup times were additionally determined by the use of an infrared cloud camera (Dione et al., 2019).
-
The three sites were equipped with surface energy balance and meteorological surface stations, which were used to study the impact of the LLSCs on the surface energy balance and CBL vertical development.
-
Images from infrared and visible cameras deployed at the Savè supersite were used in this study to illustrate the evolution of the state of the cloudy layer before it breaks up. The visible images were full-sky images and the aperture angles for the IR camera were , which corresponds to a 158 m×114 m area at a height of 200 m.
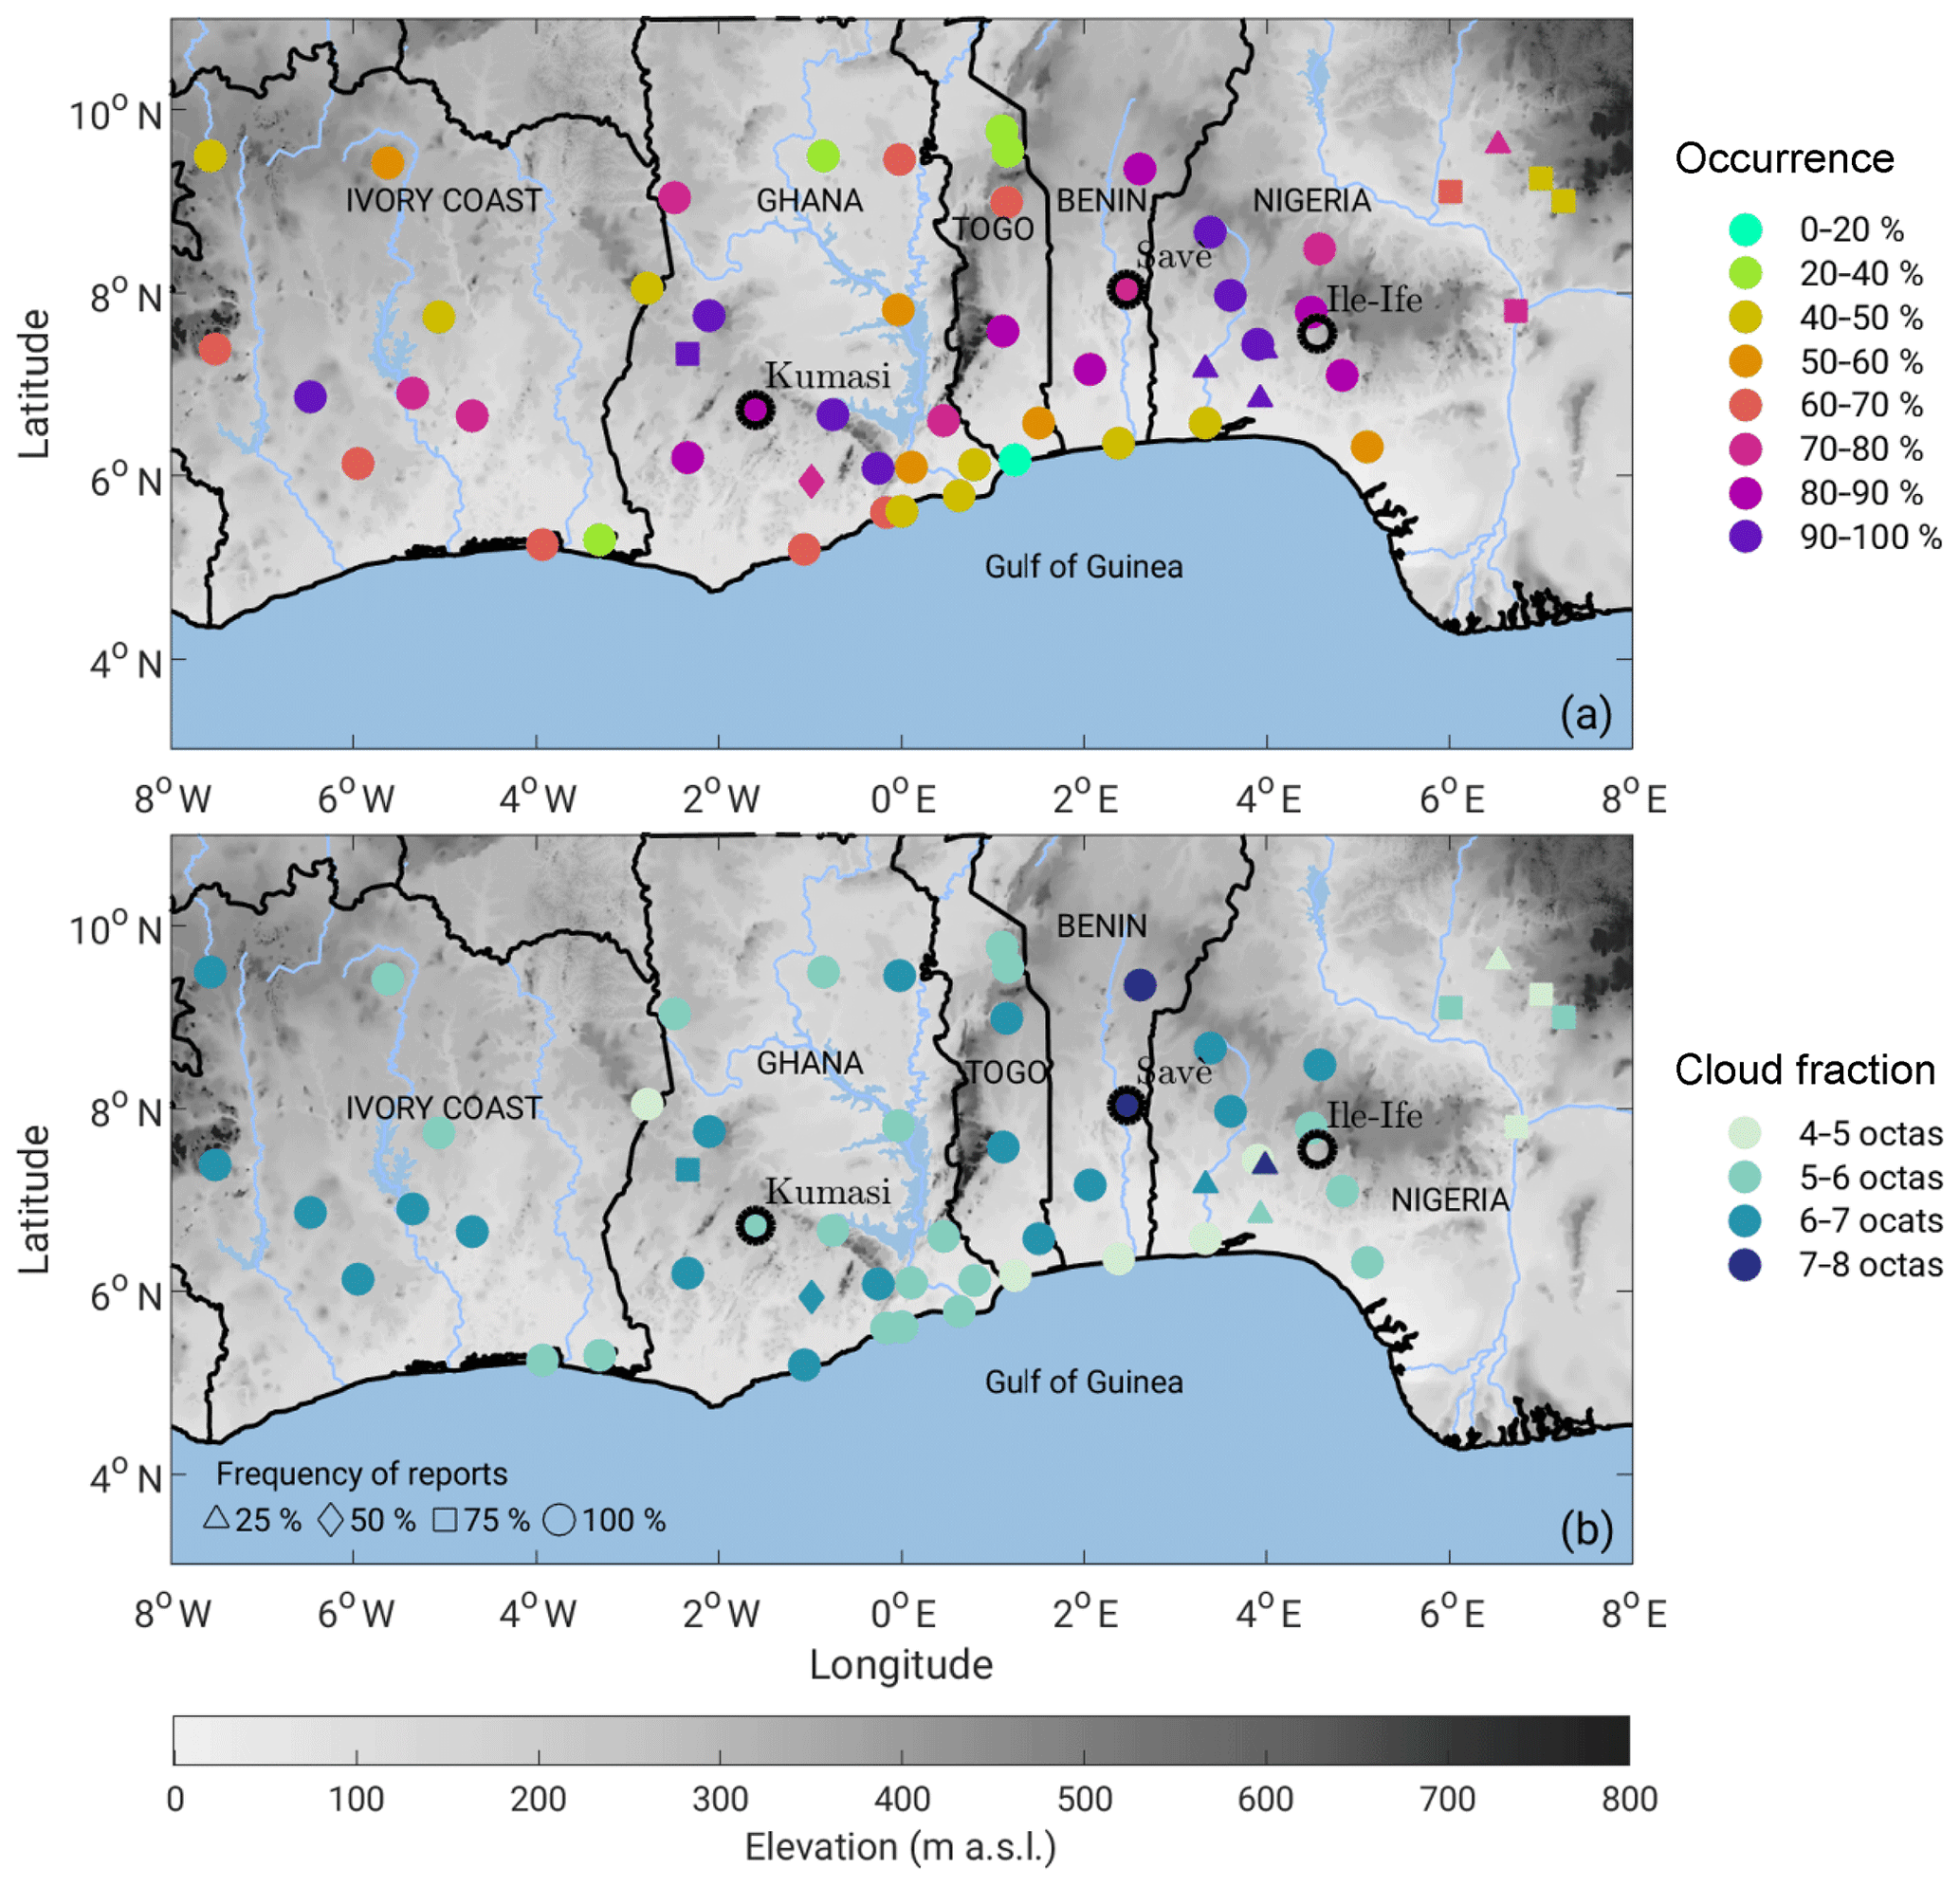
Figure 1Topography (grey shading) of southern West Africa with superimposed (colour scale) (a) occurrence and (b) average cloud fraction of low-level clouds reported by the synoptic 55-station network at 06:00 UTC during the DACCIWA field campaign (14 June–31 July 2016). Only low clouds with more than 4 octas coverage are considered in the statistics. Frequency of reports (shape of the markers) indicates the percentage of days with available data during the whole period. The three supersites, Kumasi in Ghana, Savè in Benin, and Ile-Ife in Nigeria, are indicated with black circles.
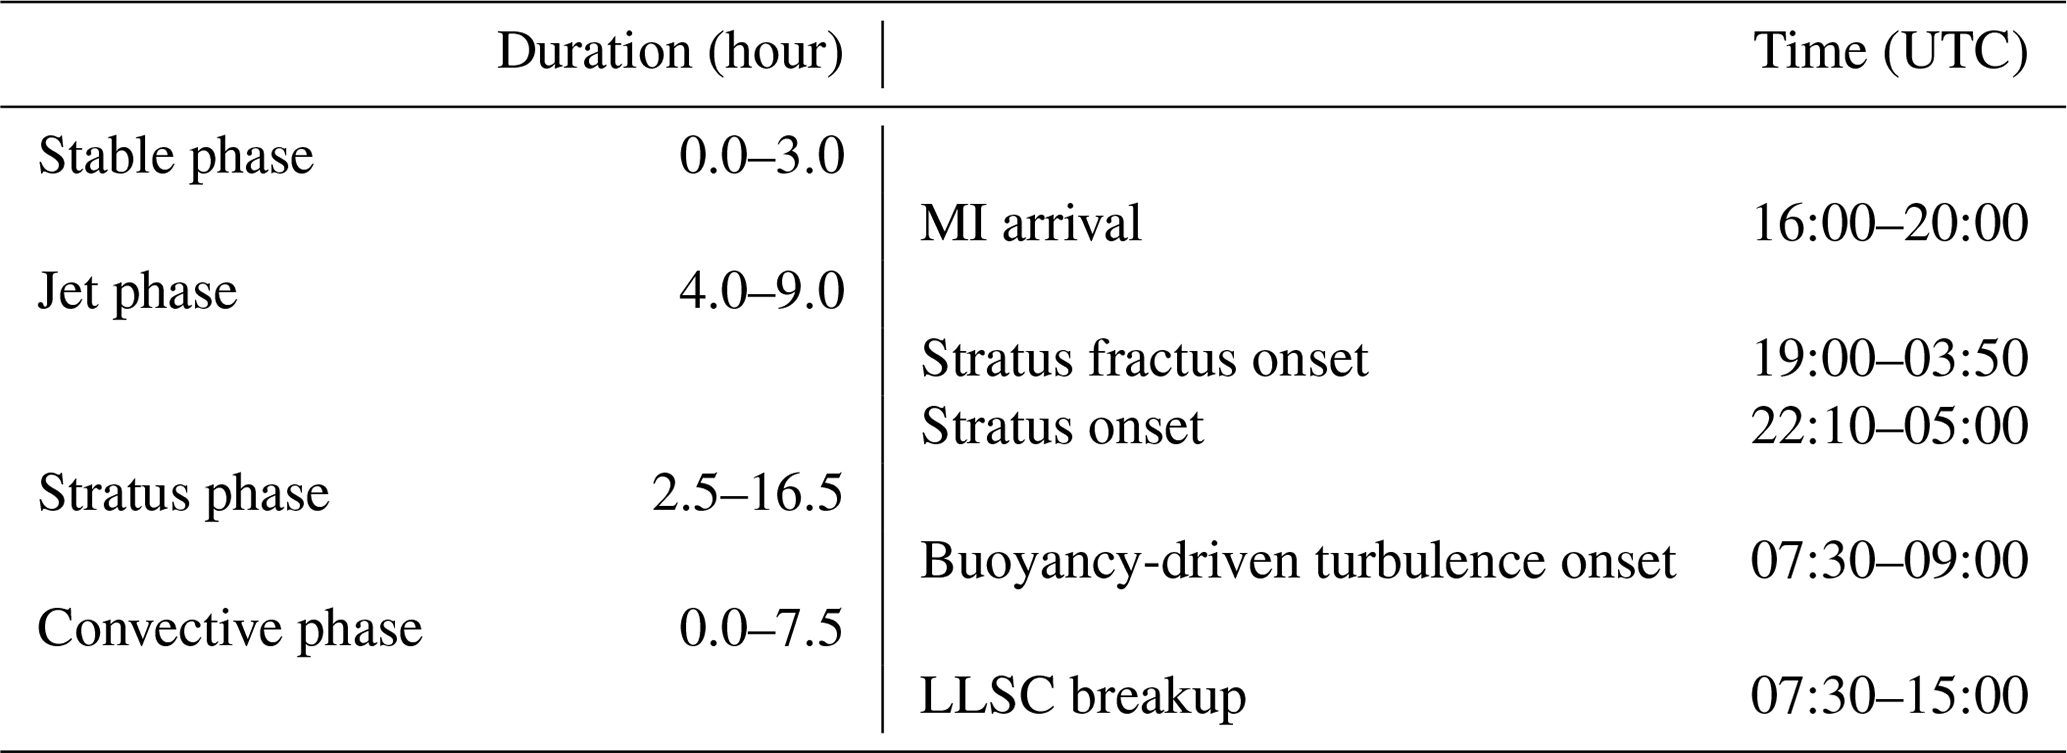
A scheme representing our conceptual model of the diurnal cycle of LLSC is presented in Fig. 2. The diurnal cycle is decomposed into four main phases, each of which will be addressed in more detail in the subsections. The height in Fig. 2 is normalized by the CBH when the LLSCs form (). The first phase, named the stable phase, starts around sunset. During this phase, the monsoon flow is weak and buoyancy-driven convection stops. A stable layer forms close to the surface. The stable-phase duration lasts 0–3 h, depending on the IOPs that the conceptional model is based on (Table 1). The second phase is named the jet phase. It starts with the MI arrival at the site and is characterized by the NLLJ settlement. Stable and jet phases are key phases, because the processes which take place during the two periods lead to an increase in the relative humidity up to saturation. The jet phase ends when the LLSCs form, and, depending in IOP, lasts 4 to 9 h (Table 1). The third phase is the stratus phase. In some cases, a stratus fractus deck forms before the appearance of a more homogeneous deck. During this phase, strong interactions between the LLSC and the vertically sheared wind in the NLLJ exist. The stratus phase lasts between 2.5 and 16.5 h (Table 1). Lastly, the convective phase starts with the increase in buoyancy-driven turbulence and ends with the LLSC breakup between 07:30 and 15:00 UTC. Three different scenarios explaining LLSC breakup have been proposed.
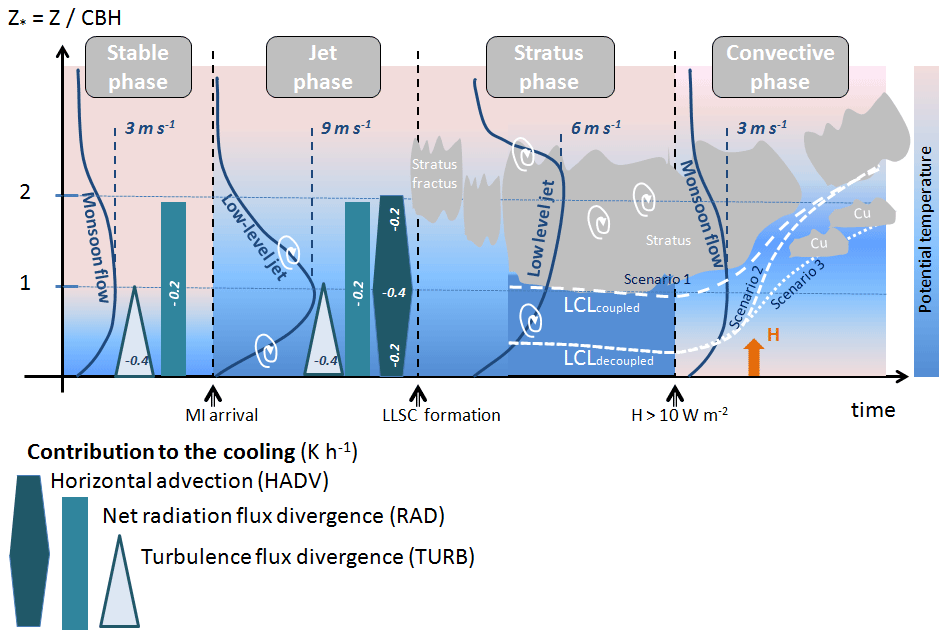
Figure 2Conceptual model for the LLSC diurnal cycle over southern West Africa. The height is normalized by the LLSC base height when the stratus clouds form (). The grey shades represent the LLSC (stratus fractus or stratus) or cumulus cloud (Cu). The three dashed white curves indicate the lifting condensation level (LCL). Each of them represents one scenario (of three) of CBL development found during the DACCIWA field campaign (Sect. 3.2.3). The dark blue lines reproduce the vertical profiles of the wind with an indication of its maximum value for each phase. The various blue symbols at the bottom represent the processes involved in the potential temperature tendency equation (The shape is adapted to the contribution of each term to the local total cooling, as a function of height.) (Sect. 3.1.2). H stands for the surface sensible heat flux and is symbolized by an orange arrow during the convective phase. The curled white arrows symbolize nocturnal dynamical turbulence either due to the radiative cooling at the cloud top or to the wind shear in the NLLJ.
Table 1Variation in the duration of the four phases and variation range of MI arrival, stratus fractus, and stratus onset and breakup times for the 11 IOPs included in the statistics for Fig. 3.
The characteristics of the four phases in terms of horizontal wind speed, potential temperature, relative humidity, and bulk Richardson number are presented in Fig. 3. The height–time sections composing Fig. 3 are built by (i) normalizing the height by the CBH when the stratus clouds form for each individual radiosounding launched at the Savè supersite, (ii) setting the origin of time with a time reference appropriately chosen according to the considered phase, and (iii) hourly averaging the radiosoundings. In the left column, the origin of time is set to the MI arrival time (Dione et al., 2019): the negative and positive times stand for stable and jet phases, respectively. The jet phase stops when the stratus fractus or the stratus clouds form. On the right column, the origin of time is set to the start of the convective phase defined by surface sensible heat flux values (H) above 10 W m−2. These panels present the conditions from the LLSC appearance to the LLSC breakup. The negative and positive times stand for stratus phase and the convective phase, respectively. The nine IOPs included in the statistics for the stable and jet phases are those performed after the 30 June, when the ultra-high-frequency wind profiler and the microwave radiometer data are available to determine the MI arrival time (Dione et al., 2019) (Sect. 3.1.1). The other panels (stratus and convective phases) include 11 IOPs during which stratus clouds form and which are not disturbed by rain or mesoscale convective systems close to Savè (Dione et al., 2019).
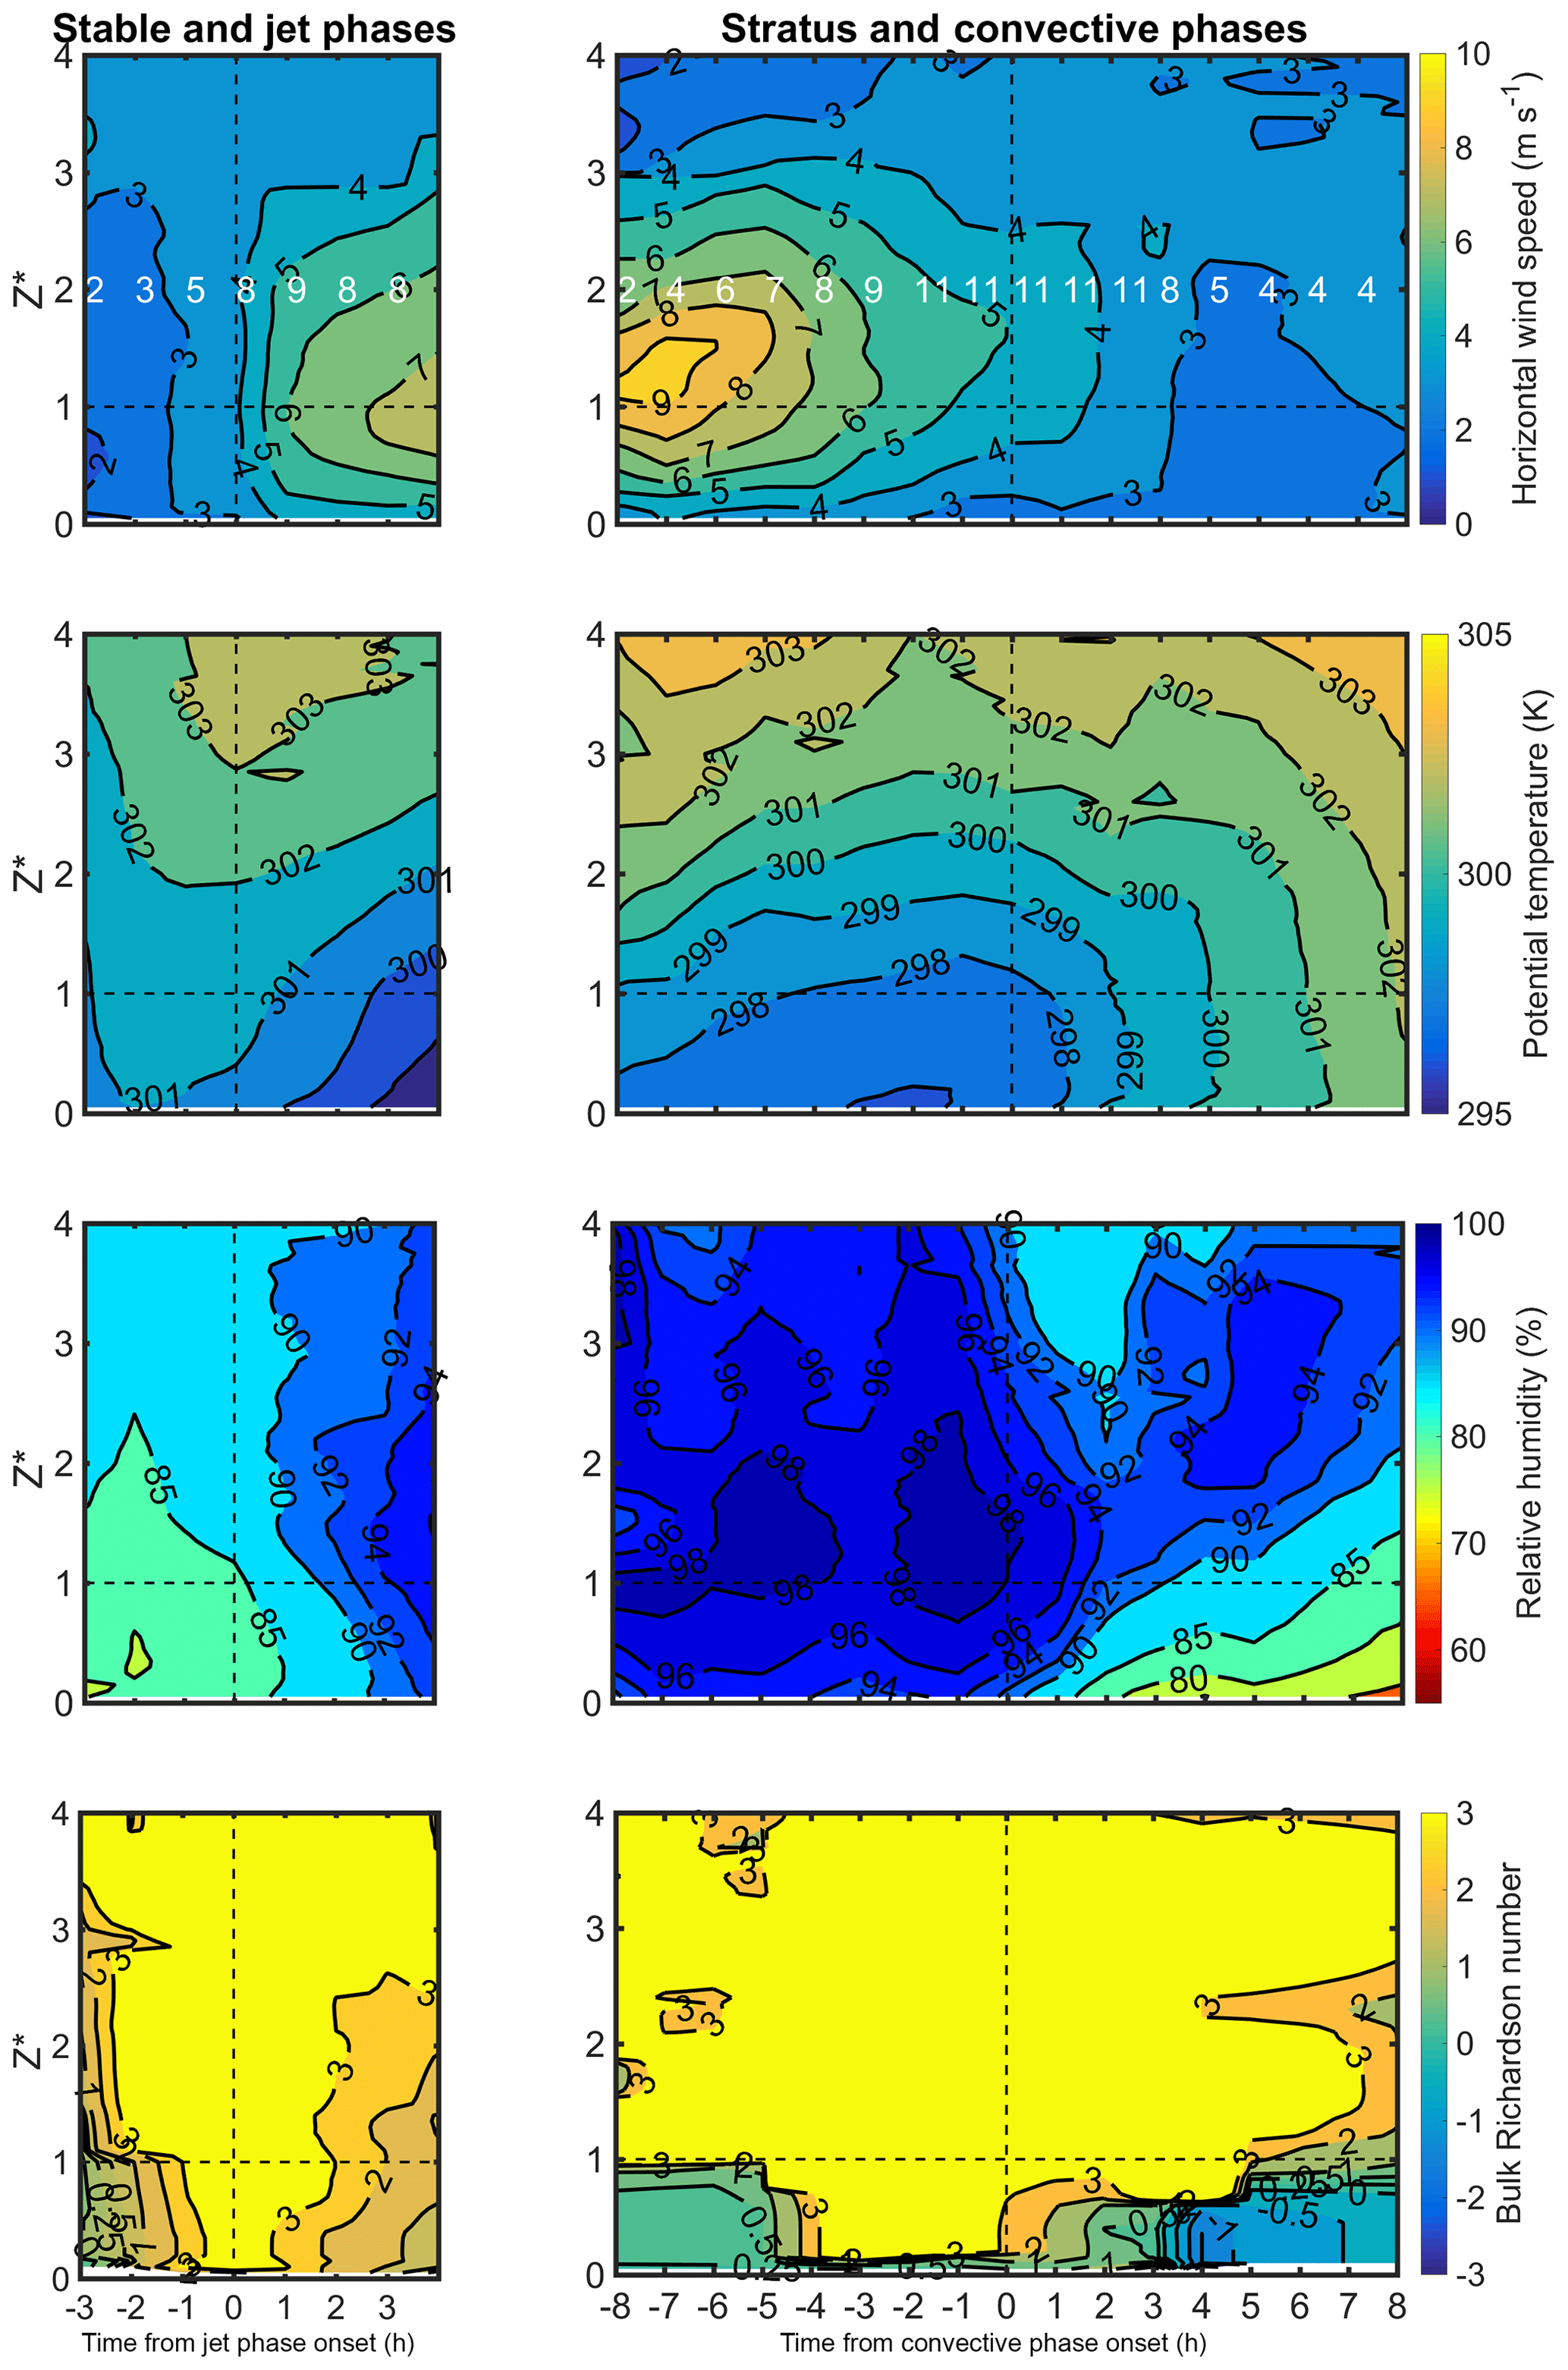
Figure 3Mean height–time sections for, from top to bottom, horizontal wind speed (m s−1), potential temperature (K), relative humidity (%), and bulk Richardson number (colour scale and isolines). These height–time sections are built by (i) normalizing the height by the CBH when the stratus clouds form for each individual radiosounding, (ii) setting the origin of time with a time reference appropriately chosen according to the considered phase, and (iii) hourly averaging the radiosoundings. The origin of time is set to (left column) MI arrival time (negative and positive times standing for stable and jet phases, respectively) and (right column) start of the convective phase (H>10 W m−2) (negative and positive times standing for stratus phase and convective phase, respectively). The horizontal dashed line () indicates the CBH when the stratus clouds form. White numbers in the top panels indicate the number of radio soundings available for the hourly average.
3.1 Before cloud formation
3.1.1 The stable and jet phases
The MI arrival time, used here as the reference time for the stable and jet phases, has been determined by Dione et al. (2019) using a fuzzy logic method that combines an increase in the wind and a decrease in the temperature. The MI arrival time ranges from 16:00 to 20:00 UTC and is negatively correlated to the monsoon strength in the afternoon. Indeed, a strong monsoon flow favours an early MI arrival (Dione et al., 2019). When the MI arrival occurs before the establishment of the stable conditions near the surface (with negative surface sensible heat flux), the stable phase cannot be defined. This situation occurred in four IOPs out of the nine.
The stable phase is characterized by a weak monsoon flow, which persists until the MI arrival time (Fig. 3). The low layer stabilizes with an increase in the bulk Richardson number because of the decrease in the temperature near the ground. The jet phase starts when the MI reaches the site. The NLLJ usually sets in shortly thereafter (about 1 h) (Dione et al., 2019). Because the MI and NLLJ are both associated with cessation of the buoyancy-driven turbulence, due to the distance from the coast to Savè, both processes settle almost at the same time at Savè (Adler et al., 2019; Babić et al., 2019a; Dione et al., 2019). They lead to a progressive increase in the wind, which reaches 9 m s−1 at the end of the jet phase. The jet core height is located at . At the same time, a cooling and an increase in relative humidity occur up to . An additional impact of the wind increase during the jet phase is the decrease in the bulk Richardson number below the height , due to the wind shear in the layer below the jet core. Wind speed and potential temperature vertical profiles are shown schematically for stable and jet phases in Fig. 2.
3.1.2 Relevant processes leading to saturation
The contributions of temperature and specific humidity changes to the relative humidity (RH) changes have been quantified for a case study (Babić et al., 2019a) and for 11 IOPs (Adler et al., 2019) using radiosondes released at the Savè site. Figure 4 shows averaged vertical profiles, over stable and jet phases, of specific humidity and temperature contributions to the total change in RH at the Savè and Kumasi sites. The height is normalized by the cloud base when the stratus clouds form. The median values of the cloud-base at Savè and Kumasi are 227 and 137 m a.g.l., respectively (Kalthoff et al., 2018). At Savè, the cooling causes at least 80 % of the RH increase. Adler et al. (2019), who analysed the moistening for separated stable and jet phases at Savè, pointed out a weak moistening during the stable phase, which is almost compensated by a drying occurring during the jet phase, leading to a 20 % contribution of the moisture to the increase in RH at the end of the two phases (Fig. 4a). Using the frequent radiosondes released at Kumasi, the temperature and moisture contributions to the RH change have been estimated with the same method (Fig. 4b). The results for the two sites are similar, and they confirm that the cooling is mainly responsible for the saturation of the lower layer of the atmosphere.
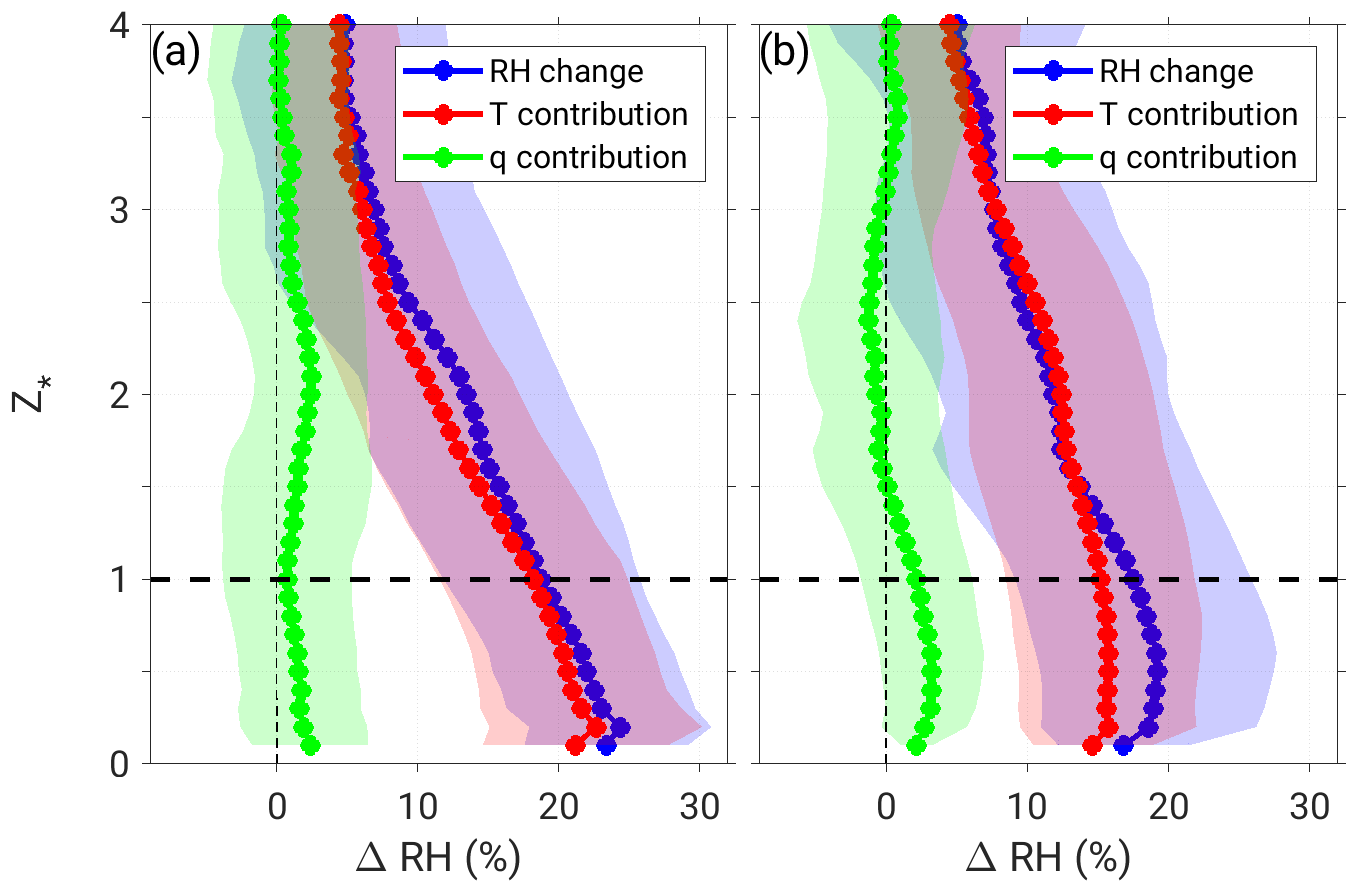
Figure 4Specific humidity (q) and temperature (T) mean contributions to the mean total change in relative humidity (RH) at (a) Savè and (b) Kumasi averaged over all available IOPs. The shading indicates the standard deviation. The horizontal dashed line () indicates the CBH when the stratus clouds form.
In order to quantify the processes responsible for the cooling, Babić et al. (2019a) and Adler et al. (2019) used the budget equation for the mean potential temperature (θ) (Stull, 1988):
where u, v, and w are the wind components; ρ is the mean air density; Q is the net radiation flux; cp is the specific heat capacity of the air at constant pressure; H is the sensible heat flux; Lv is the latent heat of water vaporization; and E is the evaporation rate. The contributions to the local tendency of the potential temperature (TOT) are the horizontal advection (HADV) and vertical advection (VADV) of potential temperature, the divergence of the net radiation flux (RAD) and of the sensible heat flux (TURB), and the phase change (SQ). However, SQ can be neglected because the heat budget analysis is applied before the cloud formation. As the vertical component of the wind (w) is very difficult to retrieve from the observations, VADV is not estimated, but it is expected to be small. The two remaining terms, TOT and HADV, are then estimated using the measurements at the Kumasi and Savè supersites. TOT is deduced from the radiosonde profiles launched at the supersite. HADV is calculated by combining radiosondes launched at the supersite and at three coastal stations (Abidjan, Accra, and Cotonou) (see Adler et al. (2019), for details of the method). At last, the Santa Barbara DISORT Atmospheric Radiative Transfer (SBDART) model (Ricchiazzi et al., 1998) is applied to estimate RAD (see Babić et al., 2019a for details of the method) at the Savè site only. This method could not be applied to the Kumasi dataset because too few radiosoundings were launched during the jet phase. Additionally, applying the SBDART model to atmospheric soundings with clouds requires some cloud characteristics (cloud top, liquid water content) which are not available at the Kumasi site. Finally, the residual term (RES) includes TURB at the Savè site and both TURB and RAD at the Kumasi site. The vertical profiles for all these terms, averaged over stable and jet phases, are presented in Fig. 5. Although such an analysis was performed separately for the jet phase at the Savè site (Adler et al., 2019) (not shown), it is, however, not feasible at the Kumasi site because, among other reasons, the MI and NLLJ arrival times were not established, so the start of the jet phase is unknown.
Figure 5a shows a local total cooling that decreases with height from −0.80 K h−1 at the surface to −0.15 K h−1 at . HADV is also height dependent, with a vertical profile closely linked to the horizontal wind profile of the NLLJ (Adler et al., 2019; Dione et al., 2019). HADV is −0.20 K h−1 at the surface and at , with a maximum cooling of −0.40 K h−1 at the jet core height. RAD slightly increases with height from −0.15 K h−1 at surface to −0.10 K h−1 at . This means that RES, which is mainly the sensible heat flux divergence term at Savè, is the main contribution to the cooling close to the ground, with a decreasing effect with height. Above , the sum of RAD and HADV is nearly equal to TOT. These three processes and their respective role during the stable and jet phases are indicated in Fig. 2. Adler et al. (2019) conclude, when integrating the vertical profiles with height for Savè, that the advection is the main cooling process, responsible for 50 % of the cooling of the atmosphere during the stable and jet phases. Each of the radiation and heat flux divergences contributes around 22 % to the local total cooling.
Very similar results are obtained with the Kumasi dataset, though a slightly lower local total cooling is observed at Kumasi. Close to the surface, it is 25 % lower than the one observed at Savè, with a cooling of −0.60 K h−1 at Kumasi instead of −0.80 K h−1 at Savè. It remains 16 % lower at . Nevertheless, as for Savè, HADV contributes about 50 % to the local total cooling at around and above, while cooling near the surface is mainly caused by the sensible and radiation flux divergence.
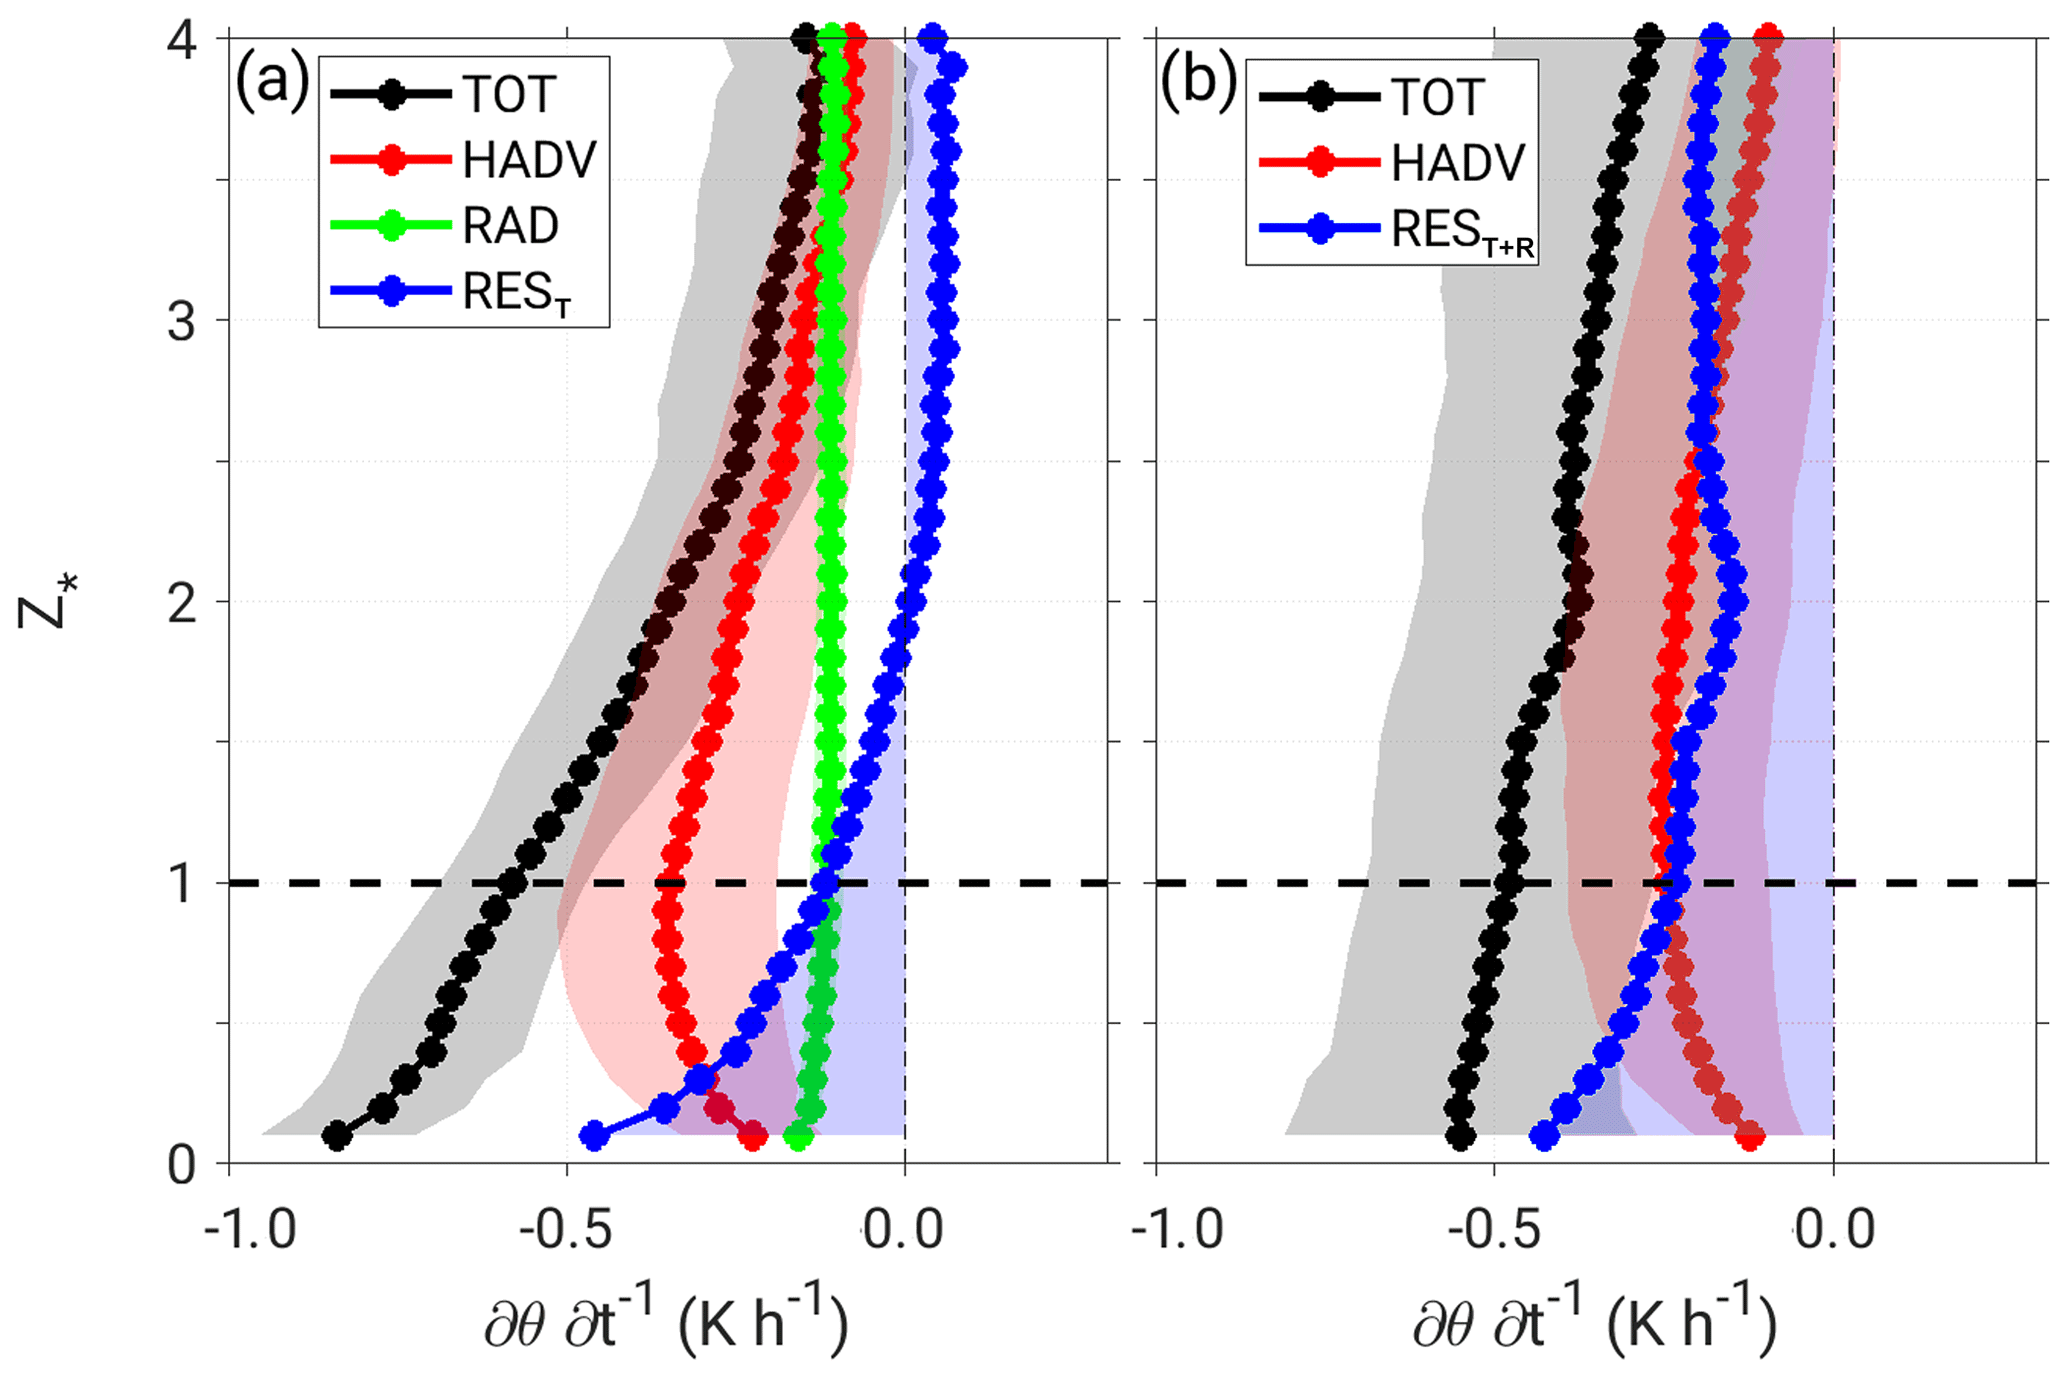
Figure 5(a) Vertical profiles of local total cooling rate (TOT) and estimates of contribution of horizontal advection (HADV) and net radiation flux divergence (RAD) terms for the Savè site during the stable and jet phases. (b) Vertical profiles of TOT and HADV for the Kumasi site during the stable and jet phases. The residual term includes the turbulent flux divergence at Savè (REST) and both the net radiation and turbulent flux divergences at Kumasi (REST+R) . The shading indicates the standard deviation. The horizontal dashed line () indicates the CBH when the stratus clouds form.
3.2 From LLSC onset to breakup
The two phases presented in this section are the stratus phase (stratus fractus and stratus) and the convective phase during which the LLSC breakup occurs. Dione et al. (2019) show that the LLSCs occur on average 3 h after the NLLJ settlement at the Savè site. The LLSCs appear after 22:00 UTC on day D and, for most of the cases, between 00:00 and 05:00 UTC on day D+1. The breakup occurs before 15:00 UTC on day D+1. Kalthoff et al. (2018), using net long-wave radiation from surface measurements (available at the three supersites) as an indicator for the mean onset of LLSC, show that on average the LLSCs appear earlier at Ile-Ife (21:00 UTC) and Kumasi (00:00 UTC) than at Savè (03:00 UTC).
3.2.1 The stratus and convective phases
According to the right column in Fig. 3 presenting the stratus and convective phases, the highest values of the horizontal wind speed, defining the NLLJ core, are observed between and at the beginning of the stratus phase. The correspondence of the LLSC base height with the NLLJ core can be explained by the high cooling due to horizontal advection at this level during the stable and stratus phases (Fig. 5). During the stratus phase, the wind speed decreases and becomes more constant with height between and (Fig. 3). The modification of the wind vertical profile is likely due to the turbulent mixing within the cloudy layer as induced by long-wave cooling at the cloud top. Although reduced, the maximum values of the wind speed are found towards the top of the cloudy layer during the stratus phase (Adler et al., 2019; Babić et al., 2019a; Dione et al., 2019) as schematically represented in Fig. 2. The potential temperature in the sub-cloud layer is often well mixed and two processes could contribute to this: the shear-driven turbulence below the NLLJ core and the turbulence induced by the LLSC due to the radiative cooling at the cloud top. When the convective phase starts, the wind speed is almost back to monsoon flow daytime conditions, i.e. a weak wind of about 4 m s−1. The relative humidity decreases with time close to the surface and above , which indicates a thinning of the LLSC from both the base and the top. The cloudy layer rises as the CBL develops, with the typical features of a convective mixed layer: a warming of the near-neutral stratified sub-cloud layer and a decrease in the bulk Richardson number.
3.2.2 Relevant processes linking the LLSC to the surface
As shown in Fig. 3, the LLSCs and the NLLJ could interact in two ways. First, the LLSCs could reduce the NLLJ strength because of the turbulent mixing in the cloudy layer. Such an effect of the LLSC turbulent mixing on a mesoscale phenomenon like the NLLJ is possible, because the LLSCs extend over more than 800 000 km2 from the Guinean coast up to 10∘ N latitude. Secondly, the turbulence below the NLLJ core modifies the conditions in the sub-cloud layer. As already observed during the AMMA experiment (African Monsoon Multidisciplinary Analysis; Redelsperger et al., 2006) by Lothon et al. (2008), the NLLJ can induce dynamical turbulence down to the surface, reflected by an increase in night-time turbulent kinetic energy up to 0.6 and 0.3 m2 s−2, on average, at Kumasi and Savè, respectively (Kalthoff et al., 2018). If the shear-driven and the cloud-top-driven turbulence are strong enough, the sub-cloud layer is well mixed and the lifting condensation level (LCL) (Romps, 2017) will correspond to the LLSC base. The LLSC is considered coupled to the surface (Adler et al., 2019) (indicated by LCLcoupled in Fig. 2). On the contrary, a sub-cloud layer with low turbulence will be less mixed. The cloud is then decoupled from the surface, with its base higher than the LCL (indicated by LCLdecoupled in Fig. 2). This is shown in Figure 6, where the bulk Richardson number in the sub-cloud layer is plotted versus the difference between the CBH and the LCL estimated from the radiosondes launched during the stratus phase at Savè and at Kumasi. For a bulk Richardson number below 0.1, the CBH is less than 75 m below or above the LCL. For larger values of the bulk Richardson number, the CBH is at least 150 m above the LCL. One can note only four radiosoundings for which the bulk Richardson number is above 0.1 at Kumasi, indicating larger turbulence in the sub-cloud layer at Kumasi than at Savè.
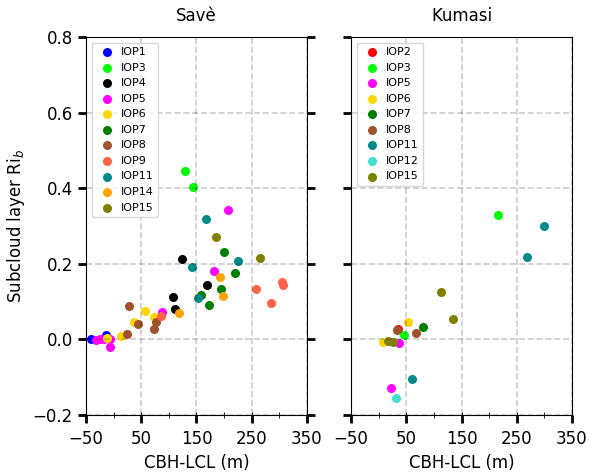
Figure 6Bulk Richardson number (Rib) in the sub-cloud layer versus height difference between cloud base height (CBH) and lifting condensation level (LCL) estimated from the radiosondes launched during the stratus phase at Savè and at Kumasi. Colours stand for the different IOPs.
3.2.3 LLSC breakup and boundary layer evolution
The LLSC breakup occurs during the convective phase, when the CBL develops vertically due to heating of the surface. The frequent radiosondes released during the convective phase are unfortunately not suitable for determining the CBL height, because the potential temperature gradients were very weak. An estimate of the sub-cloud layer height is given by the LCL. This LCL-based estimate is motivated by the very good accordance between this level and the base height of the cumulus cloud forming in the afternoon. In addition, this method has the advantage to continuously provide the sub-cloud layer height, and it can easily be applied to the Kumasi and Ile-Ife sites where the radiosondes are less frequent.
The way in which the LLSC and the surface are coupled (or not), as discussed in the previous section, plays a determining role in the breakup. Based on CBH evolution, relative to LCL and CBH standard deviation along the stratus and convective phases, three scenarios have been defined at Savè, as illustrated in Fig. 7. For each scenario, Fig. 7 presents, in the top panel (Fig. 7a), the temporal evolution, from 00:00 to 16:00 UTC, of the CBH and cloud top (measured by the cloud radar; see Adler et al., 2019, for the method) and LCL. The half-hourly standard deviation of the cloud base, the cloud fraction (percentage of cloud base below 1000 m a.g.l. over 30 min), and the difference between cloud base and LCL are indicated in the bottom panel (Fig. 7e). A cloud fraction larger than 95 % is chosen as a criterion to determine the presence of LLSC above the supersite (Adler et al., 2019). Examples of visible and infrared images from the cloud cameras at two distinct times illustrate the cloud coverage, and they allow one to make the link between the quantified parameters presented previously and the state of the sky as recorded by the cameras.
-
Scenario 1 (Fig. 7a and b) is LLSC coupled to the surface. It is illustrated by the 8 July case (IOP 8) (Babić et al., 2019a). During the night, the CBH is very close to the LCL (LCLcoupled in Fig. 2), and the CBH standard deviation is very small, which indicates a very regular and constant LLSC base. The visible and infrared images indicate a homogeneous stratus layer at 08:14 UTC. After 08:00 UTC, the LCL steadily increases to reach 1000 m a.g.l. at 16:00 UTC. Until 12:00 UTC, the increases of the LCL and CBH are simultaneous and identical. After that time, the cloud base fraction decrease indicates the LLSC breakup. The low values of the standard deviation of the CBH during daytime and the visible and infrared images at 10:28 UTC indicate a LLSC evolution towards a thinner cloud layer and stratocumulus clouds. Among the eight IOPs for which the LLSC breakup has been analysed, three follow this scenario. This breakup scenario is schematically presented in Fig. 2 with an LCL close to the CBH during the convective phase (Scenario 1).
When the LLSC is decoupled from the surface during the night, meaning that the LLSC base is above the LCL (LCLdecoupled in Fig. 2), two scenarios occur.
-
Scenario 2 (Fig. 7c and d) is progressive coupling of the LLSC to the surface. In this scenario, the LCL rises up to the CBH, as illustrated with the 27 July case (IOP 14) and schematized in Fig. 2 (Scenario 2). After 08:00 UTC, once the LLSC is coupled to the surface, the CBH rises with the sub-cloud layer height as in Scenario 1. In IOP 14, the LLSC breakup occurs at 12:00 UTC, shown by the decrease in the cloud base fraction. In that case, the high standard deviation of the CBH indicates cumulus cloud development. The ceilometer is not only sensitive to the base of clouds, but also to the edges when the clouds pass over the instrument. In the case of cumulus clouds, the ceilometer indicates scattered heights. Visible and infrared images illustrate the passage from the LLSC at 07:18 UTC to cumulus clouds at 12:14 UTC. Two IOPs among eight follow Scenario 2.
-
Scenario 3 (Fig. 7e and f) is cumulus cloud formation below the LLSC. This scenario is illustrated by IOP 11. The LLSC is decoupled from the surface with a CBH base 150 m above the LCL during the night, increasing to 300 m at 07:00 UTC. The infrared image is a mix of orange and yellow colours, which indicates colder bases than the ones observed in IOP 8 and IOP 14 early in the morning. After 07:15 UTC, the ceilometer measures a quite scattered cloud base but coupled to the surface. This indicates some cumulus cloud formation below the LLSC. Two cloudy layers coexist until 08:30 UTC, as indicated by the 100 % cloud coverage. A thin stratocumulus layer persists after 09:00 UTC with a very low standard deviation of the base, which is at about 400 m a.g.l. When the low stratocumulus layer is broken enough, higher cloud bases at around 1500 m a.g.l. are detected by the ceilometer between 10:00 and 11:00 UTC. Visible and infrared images at 10:36 UTC illustrate this higher stratocumulus layer. Three IOPs among eight follow Scenario 3. This breakup scenario is schematically presented in Figure 2 with an LCL below the CBH for the entire convective phase and with some boundary layer cumulus formation below the LLSC (Scenario 3).
-
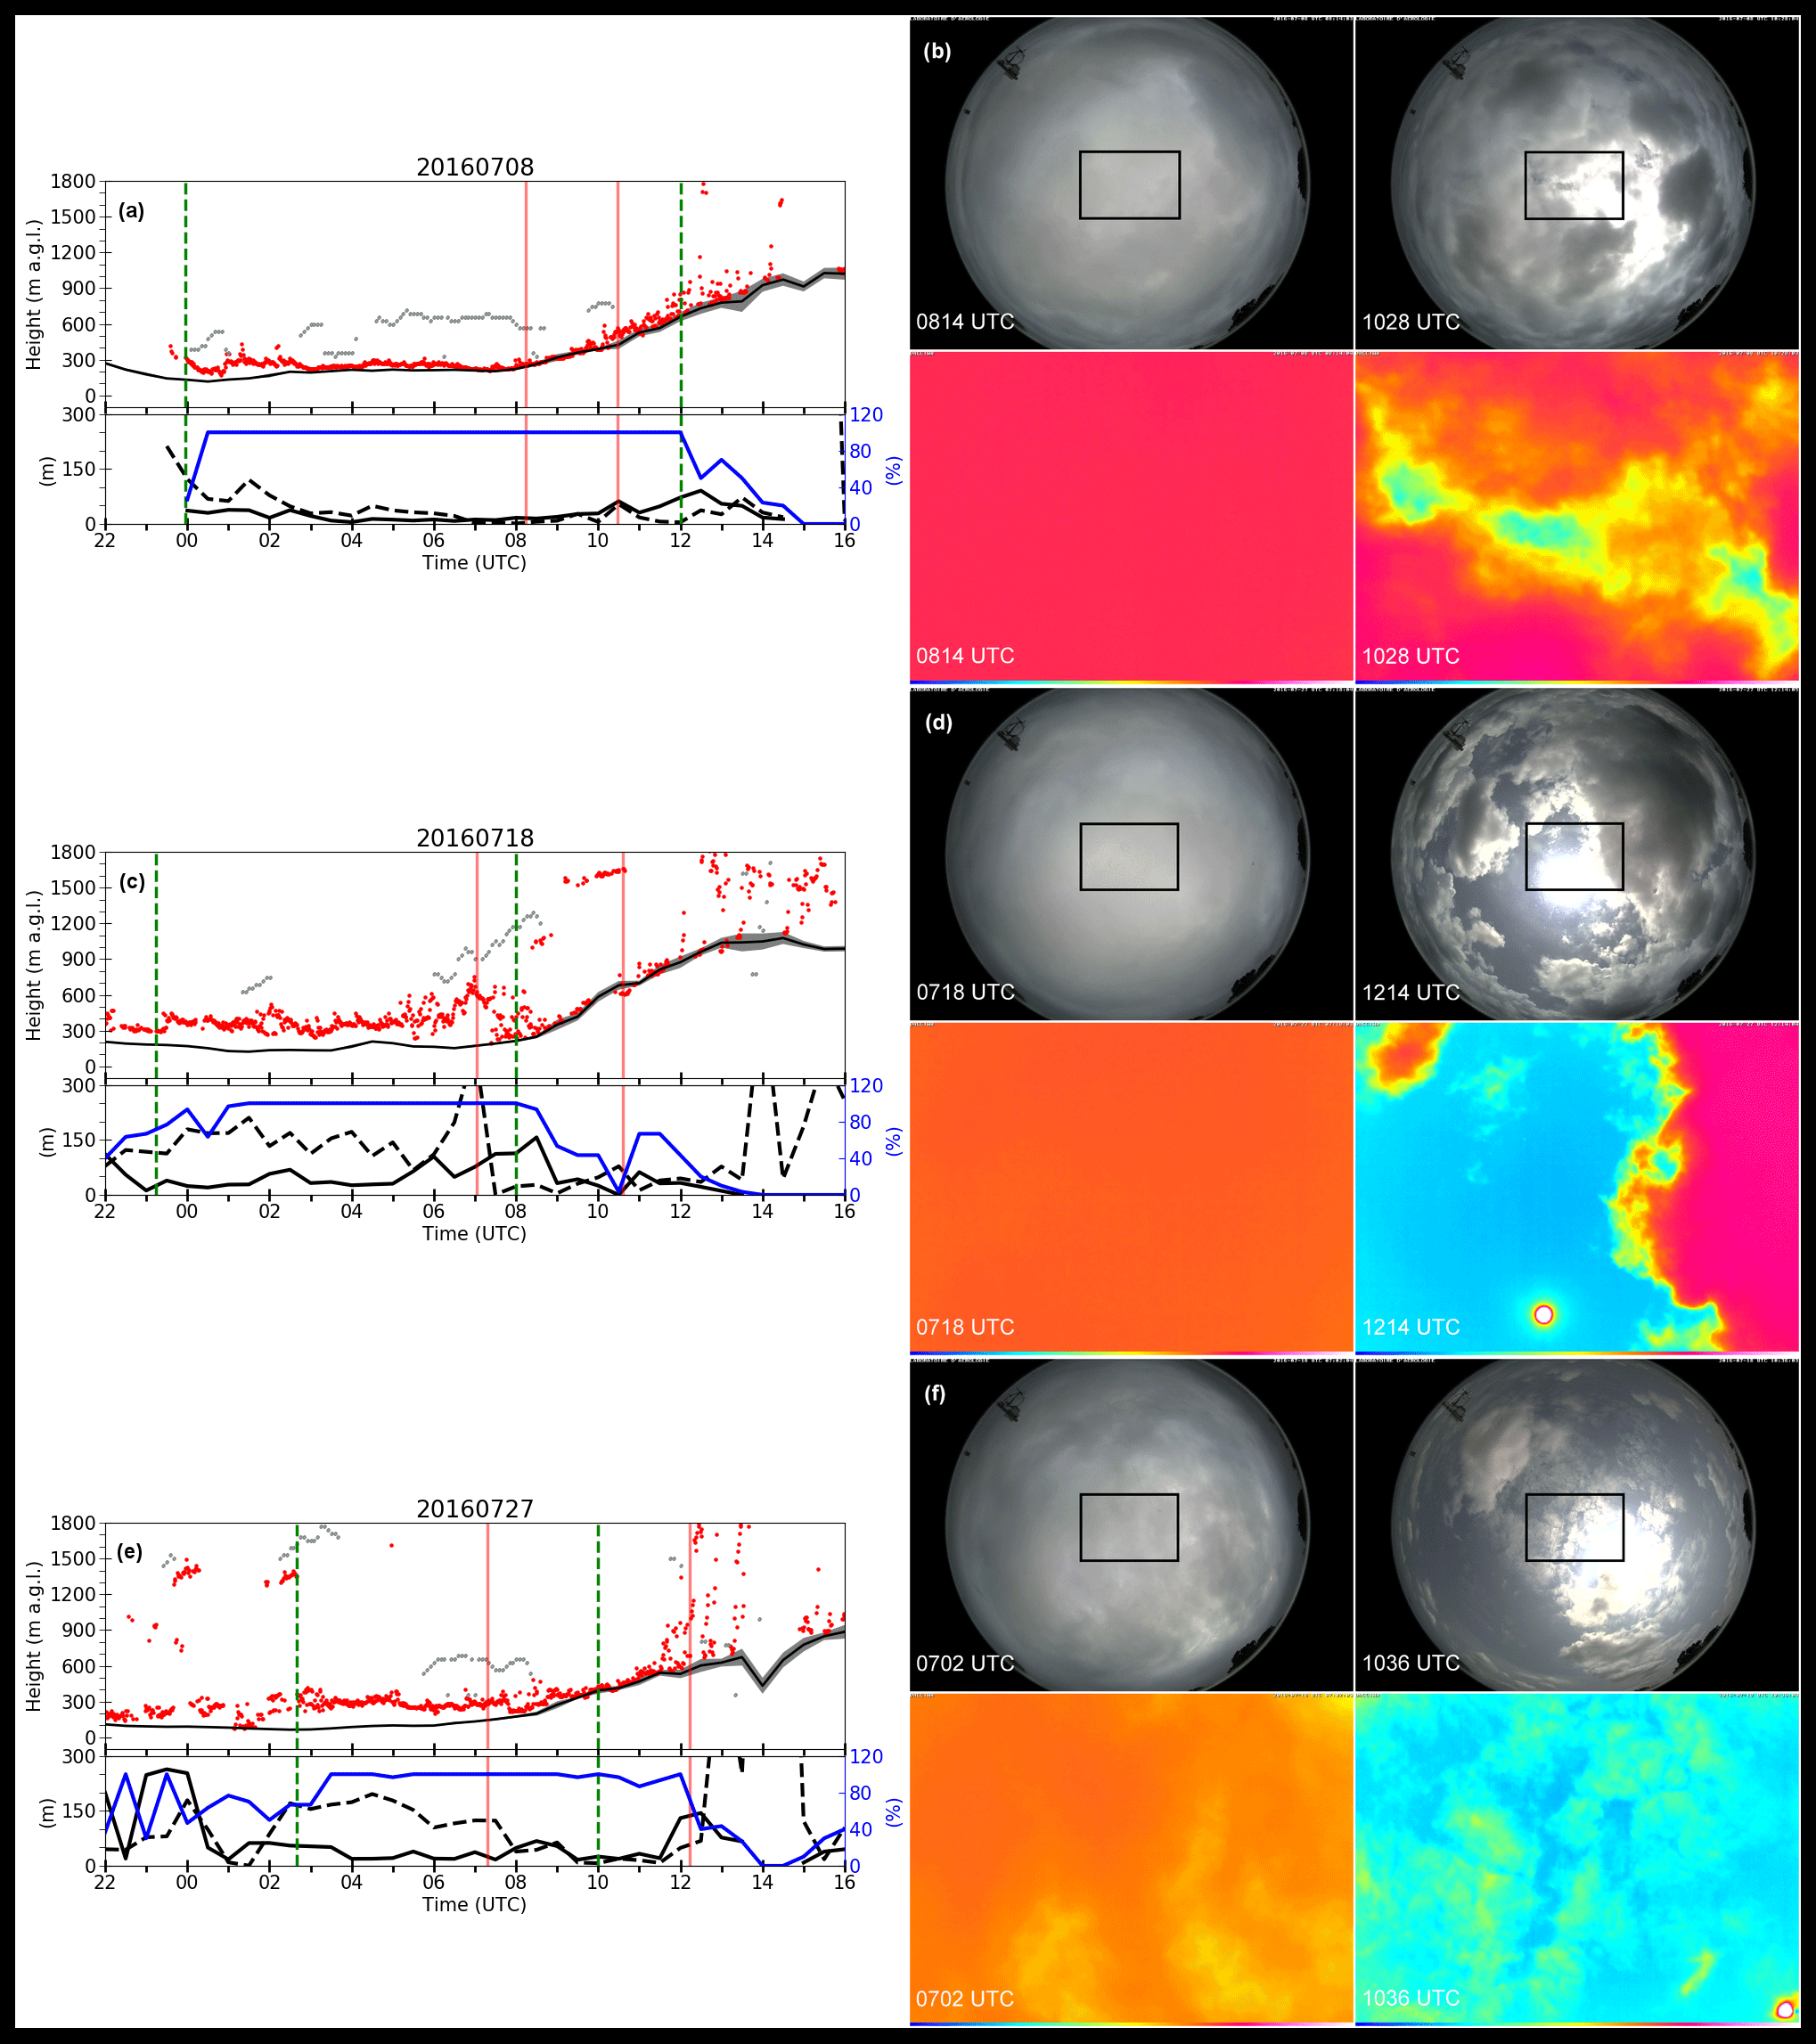
Figure 7(a) 8 July (IOP 8), (c) 27 July (IOP 14), and (e) 18 July (IOP 11) illustrate breakup scenarios 1, 2, and 3, respectively. The temporal evolution of the cloud base height (red dots), cloud top (grey dots), and LCL with its uncertainty (black line with grey shading) are presented in the top panels. The LCL uncertainty is based on the uncertainties of the temperature and humidity used for the LCL estimation. The temporal evolution of the cloud fraction (blue line), the standard deviation of the cloud base over 30 min (black line), and the difference between LCL and CBH (dashed black line) are presented in the bottom panels. The vertical dashed green lines indicate the LLSC onset and breakup times. The vertical red lines indicate the times of the visible and infrared camera pictures presented in (b), (d), and (f) for IOP 8, IOP 14 , and IOP 11, respectively. The times are 08:14 and 10:28 UTC on 8 July, 07:18 and 12:14 UTC on 27 July, and 07:02 and 10:36 UTC on 18 July. The colour scale for the infrared images (indicated at the bottom of the images) ranges from blue, for colder brightness temperatures, to white for the warmer brightness temperatures. The black rectangle on the visible images indicates the area corresponding to the infrared images. The white dot in the infrared images, at 12:14 UTC on 27 July and 10:36 UTC on 18 July, is due to the sun and is located at the centre of the solar disc.
The stratus clouds modify the surface energy balance (SEB), because they reduce the net short-wave radiation twice as much as they increase the net infrared radiation (Chen et al., 2000). In order to investigate the effect of the LLSC on the SEB during DACCIWA campaign, the temporally averaged flux from 06:00 to 16:00 UTC (indicated by 〈〉) of the net radiation (Rn), the latent heat flux (Le), and the sensible heat flux (H) are calculated for 21 d for Savè and Kumasi and 20 d for Ile-Ife.
Figure 8 shows a negative correlation between 〈Rn〉, 〈Le〉, and 〈H〉 and the LLSC breakup time, with correlation coefficients below −0.64 for Savè and Kumasi. The variability is certainly due to the day-to-day variation of soil moisture, which is more important at the beginning of the campaign than at the end, when frequent rain events maintained an almost constant soil moisture. 〈Rn〉 is reduced by 25 % and 50 % when LLSC breakup occurs after 13:00 UTC at Savè and at Kumasi, respectively. This difference may be due to LLSC macrophysical properties, like deeper clouds or larger liquid water path, but also to higher cloudy layers which also impact the net radiation. Unfortunately, the same plot cannot be provided for Ile-Ife, where the breakup time of the LLSC could not be determined. From these results, one can deduce for the first time the error related to the SEB if the LLSC breakup time is inaccurately simulated by numerical models.
The impact of the SEB on the CBL vertical development is shown in Fig. 9a. The CBL development is represented by the LCL at 16:00 UTC at the three sites and plotted versus 〈H〉. As expected, the lower 〈H〉, the lower LCL, which ranges from 300 to 1000 m a.g.l. over the three sites. Finally, the link between the CBL development and the LLSC breakup time is shown, for the Savè and Kumasi sites, in Fig. 9b. Later LLSC breakup implies lower net radiation at the surface (Fig. 8), and therefore weaker surface sensible heat flux (Fig. 9a), which leads to a lower vertical development of the CBL. The LCL is half, when LLSC breakup occurs after 11:00 UTC, compared to an LCL associated with early-morning LLSC breakup. The impacts of this on the moist convection during the afternoon need detailed investigations.
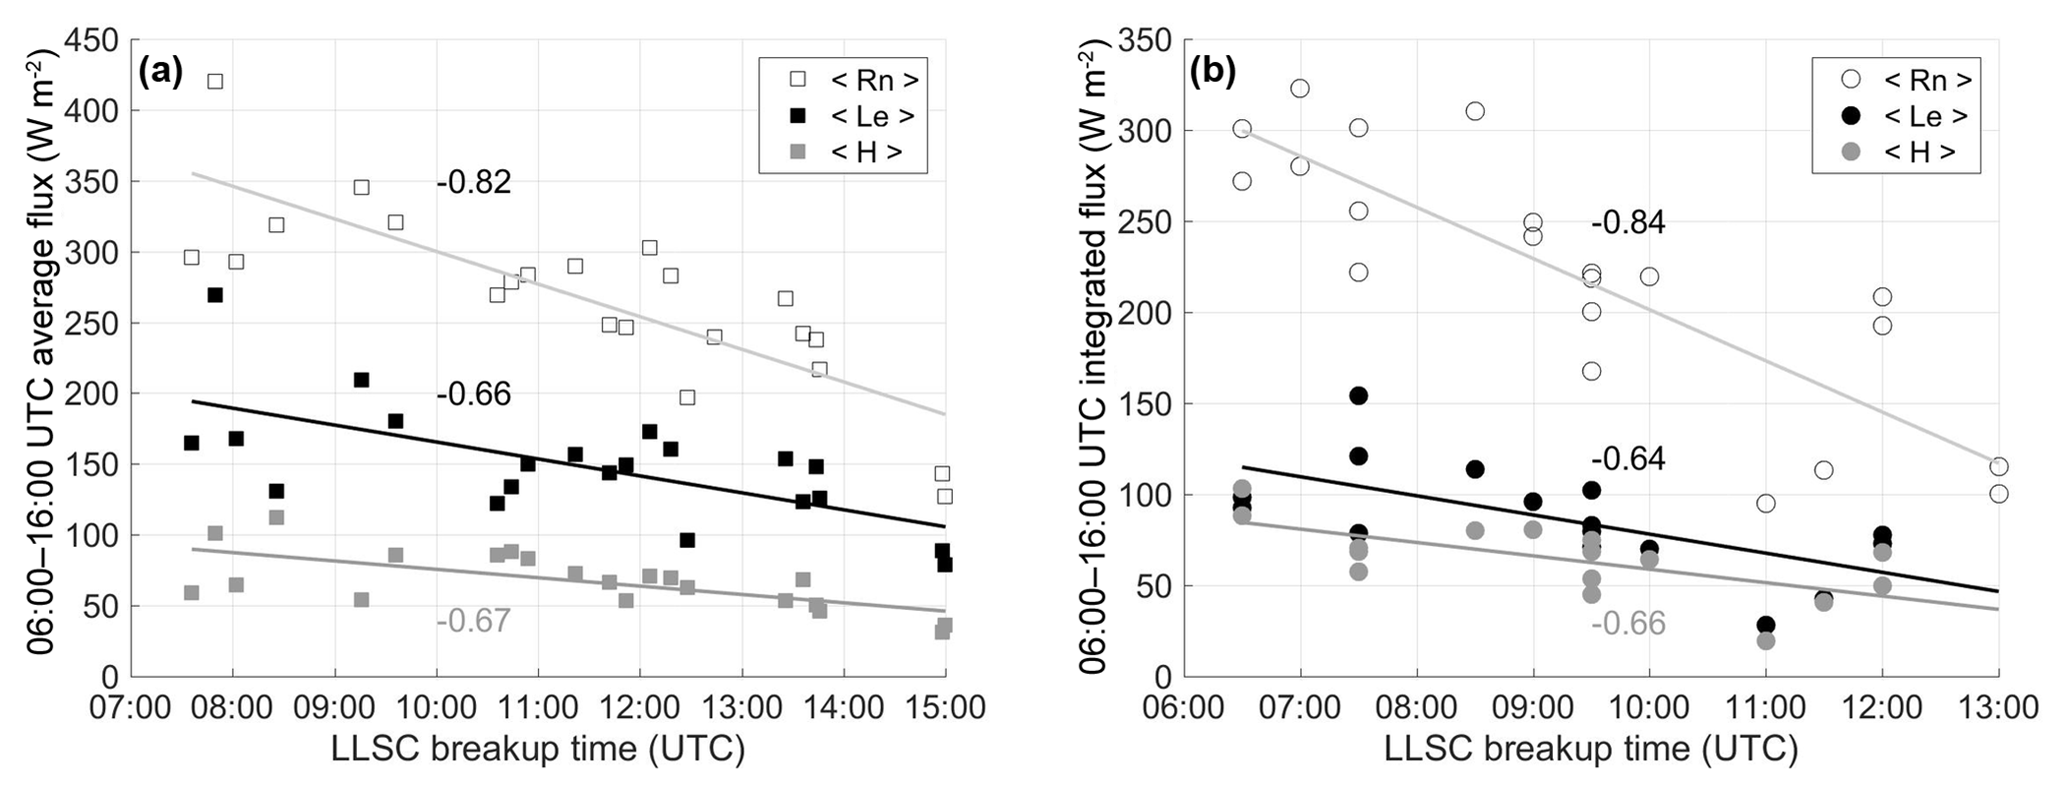
Figure 8Averaged net radiation (〈Rn〉), latent heat flux (〈Le〉), and sensible heat flux (〈H〉) at the surface from 06:00 to 16:00 UTC versus LLSC breakup time at (a) Savè and (b) Kumasi. Linear regressions are plotted and correlation coefficients are indicated.
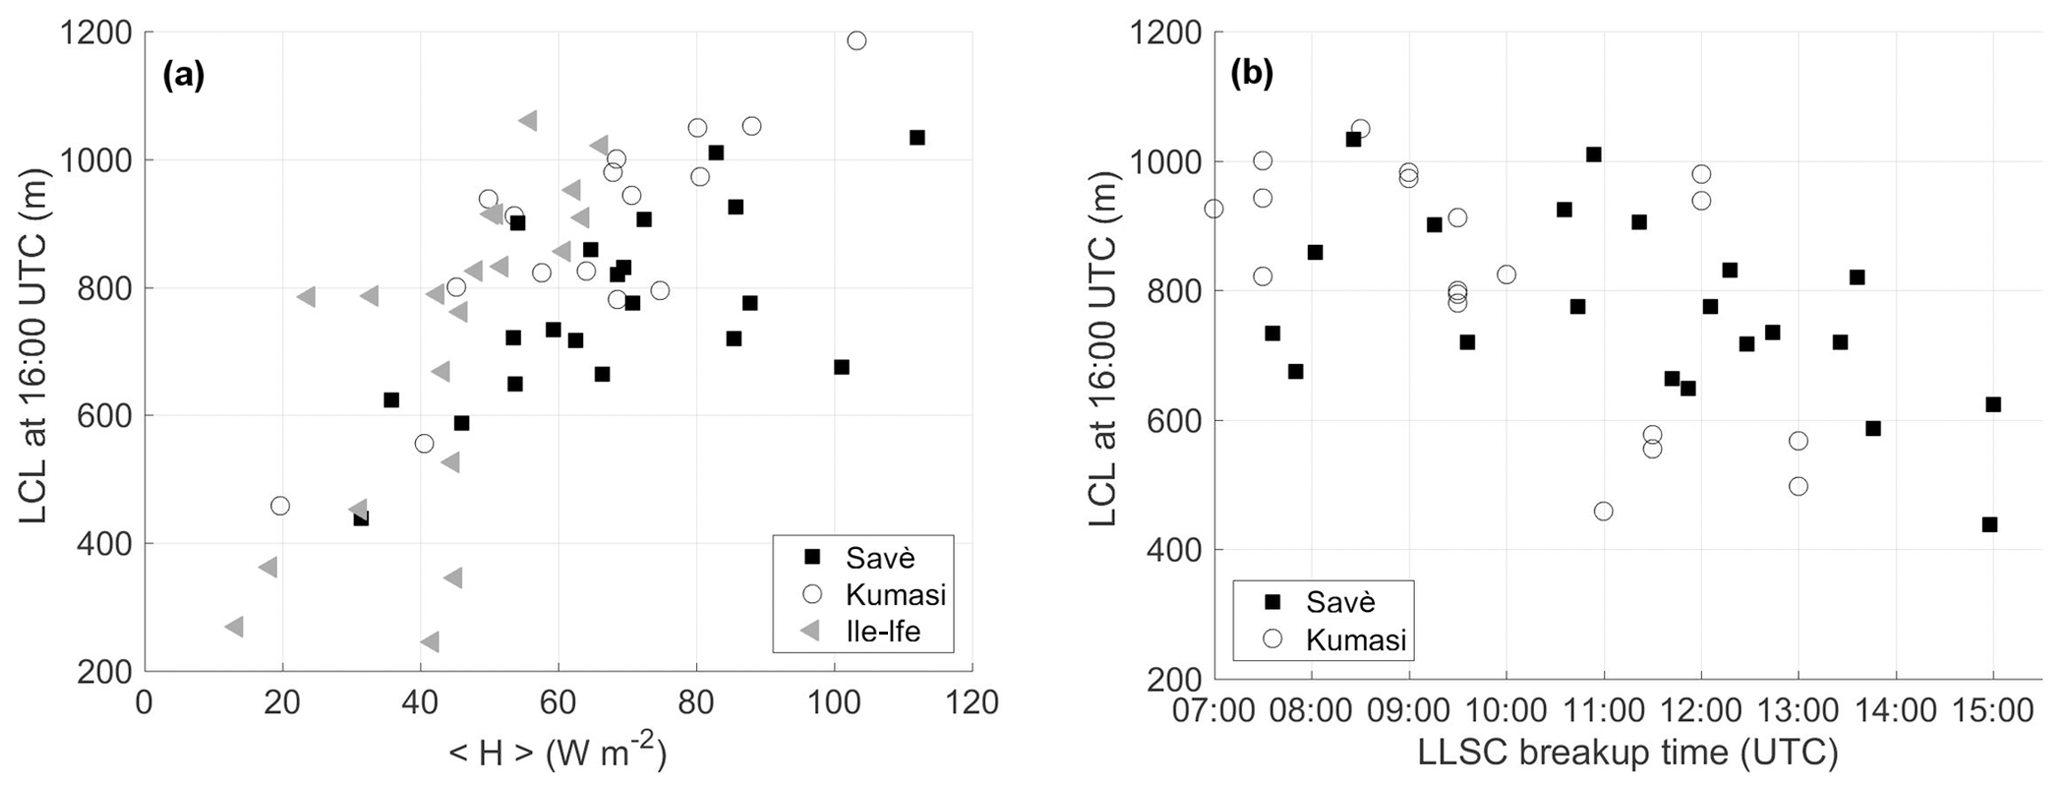
Figure 9(a) LCL at 1600 UTC versus 〈H〉 at the three sites. (b) LCL at 16:00 UTC versus LLSC breakup time at Savè and at Kumasi. The LLSC breakup time cannot be estimated at Ile-Ife.
The DACCIWA ground-based field campaign, conducted over southern West Africa during the 2016 monsoon season, provided a comprehensive dataset allowing for the analysis of the diurnal cycle of LLSC. The most important lessons drawn from the analyses of the Savè supersite dataset (Adler et al., 2019; Babić et al., 2019a; Dione et al., 2019), and additional results on LLSC breakup scenarios and their impact on the CBL vertical development on the following day, are used to build a conceptual model for LLSC diurnal cycle and are generalized, when possible, to the two other supersites of the DACCIWA ground-based field campaign located at Kumasi and Ile-Ife. The conceptual model proposed in this study divides the LLSC diurnal cycle into four main phases and characterizes, for each of them, the main atmospheric processes involved.
-
The stable and jet phases constitute the period during which the cooling of the air leads to saturation and LLSC formation. The cooling starts at the end of the afternoon, i.e. during the stable phase, and intensifies after the MI arrival and the NLLJ settlement, i.e. during the jet phase. Three processes are in play during these phases: horizontal advection, which contributes to 50 % of the air temperature decrease; net radiation divergence; and sensible heat flux divergence, both of which contribute 22 % each. In Kumasi and Savè, 94 % of the cooling prior to the LLSC formation is then explained by these three processes. Savè and Kumasi are both at the same distance from the coast, and the contributions of the three processes might change according to the position inland, or other processes may come into play. As an example, gravity waves and orographic effects, previously pointed out in modelling studies, are import factors for cloud formation; however, these processes could not actually be evaluated with DACCIWA ground-based field experiment measurements.
-
The stratus phase is characterized, on average, by a reduction in the NLLJ in the stratus layer and often a well-mixed sub-cloud layer. The shear-driven turbulence associated with the NLLJ in the sub-cloud layer and the turbulence induced by the radiative cooling at the cloud top are the relevant processes. Both processes influence the bulk Richardson number, which depends on shear-driven turbulence and the static stability, in the sub-cloud layer. Looking at day-to-day variability, large values of the bulk Richardson number correspond to CBHs higher than the LCL: the LLSCs are then said to be decoupled from the surface. Close-to-zero bulk Richardson numbers are associated with CBHs close to the LCL: the LLSCs are considered coupled to the surface. Interestingly, only coupled cases have been observed at Kumasi during the studied IOPs, with the bulk Richardson number in Kumasi being lower than in Savè. The coupling to the surface might play a role in LLSC characteristics, because coupled LLSCs have a steadier CBH during the night.
-
The convective phase starts with buoyancy-driven turbulence in the CBL on the following day. The breakup of the LLSC follows three scenarios. Scenario 1 has the LLSC coupled to the surface, whereas the two other scenarios have the LLSC decoupled from the surface. Further analyses of the processes in play in the LLSC breakup according to the scenario would be interesting. The breakup time of the LLSC impacts the averaged (from 06:00 to 16:00 UTC) net radiation at the surface during the following day, with a 25 % reduction at the Savè site and a 50 % reduction at Kumasi for late LLSC breakup times compared to early LLSC breakup times. The reasons for such a difference would be interesting to investigate. The vertical development of the sub-cloud layer is directly impacted by the reduction in the available energy at the surface, with a 50 % reduction in its height for a late LLSC breakup time compared to an early LLSC breakup time. The impacts of this on the moist convection during the afternoon need detailed investigations.
A factor to also consider in the study of LLSC diurnal cycle is the aerosol effect in the context of rapid and significant socioeconomic changes that are happening in southern West Africa (Knippertz et al., 2011). Deetz et al. (2018) performed highly resolved process-study simulations for 2–3 July 2016 with COSMO-ART to assess the aerosol direct and indirect effects on meteorological conditions over southern West Africa. They find that the MI and stratus-to-cumulus transition are highly susceptible to the aerosol direct effect, leading to a spatial shift in the MI front and a temporal shift in the stratus-to-cumulus transition with changes in the aerosol amount. Aircraft measurements of aerosols and clouds over southern West Africa during the 2016 summer monsoon show pollution and polluted clouds across the whole region (Taylor et al., 2019; Haslett et al., 2019). However, the aerosol effect on LLSC diurnal cycle could not be investigated with ground-based measurements performed during the DACCIWA campaign.
As shown in the present study, the formation and dissipation of the LLSCs results from a combination of several processes, and the intensity of each of them being important in the diurnal cycle of the LLSCs. Thus, an accurate representation of LLSCs in models requires a proper simulation of these atmospheric processes in the lower atmospheric layer. The results presented in this study help to highlight the weaknesses of the numerical models in the representation of the diurnal cycle of the LLSCs.
The data used in this study are available in the BAOBAB database (https://baobab.sedoo.fr/DACCIWA/, last access: 21 February 2020) (Derrien et al., 2016; Handwerker et al., 2016; Kohler et al., 2016; Wieser et al., 2016).
NK, FL, ML, and BA designed the DACCIWA ground-based field experiment. NK, FL, ML, BA, CD, and XP performed the measurements at the Savè site and processed and analysed the data. KB and MZ also processed and analysed the data. FL prepared the article with contributions from all co-authors.
The authors declare that they have no conflict of interest.
This article is part of the special issue “Results of the project “Dynamics-aerosol-chemistry-cloud interactions in West Africa” (DACCIWA) (ACP/AMT inter-journal SI)”. It is not associated with a conference.
The authors thank the Laboratoire d'Aérologie, Université de Toulouse, CNRS, UPS, France, KIT (Karlsruhe Institute of Technology), and UPS (Université Toulouse) for helping to install the equipment as well as the people from INRAB in Savè for allowing the equipment on their ground. We thank the AERIS data infrastructure for providing access to the data used in this study.
The DACCIWA project has received funding from the European Union Seventh Framework Programme (FP7/2007-2013) under grant agreement no. 603502.
This paper was edited by Susan van den Heever and reviewed by three anonymous referees.
Adler, B., Kalthoff, N., and Gantner, L.: Nocturnal low-level clouds over southern West Africa analysed using high-resolution simulations, Atmos. Chem. Phys., 17, 899–910, https://doi.org/10.5194/acp-17-899-2017, 2017. a, b, c
Adler, B., Babić, K., Kalthoff, N., Lohou, F., Lothon, M., Dione, C., Pedruzo-Bagazgoitia, X., and Andersen, H.: Nocturnal low-level clouds in the atmospheric boundary layer over southern West Africa: an observation-based analysis of conditions and processes, Atmos. Chem. Phys., 19, 663–681, https://doi.org/10.5194/acp-19-663-2019, 2019. a, b, c, d, e, f, g, h, i, j, k, l, m, n, o, p, q, r, s, t, u, v
Babić, K., Adler, B., Kalthoff, N., Andersen, H., Dione, C., Lohou, F., Lothon, M., and Pedruzo-Bagazgoitia, X.: The observed diurnal cycle of low-level stratus clouds over southern West Africa: a case study, Atmos. Chem. Phys., 19, 1281–1299, https://doi.org/10.5194/acp-19-1281-2019, 2019a. a, b, c, d, e, f, g, h, i, j, k, l, m, n
Babić, K., Kalthoff, N., Adler, B., Quinting, J. F., Lohou, F., Dione, C., and Lothon, M.: What controls the formation of nocturnal low-level stratus clouds over southern West Africa during the monsoon season?, Atmos. Chem. Phys., 19, 13489–13506, https://doi.org/10.5194/acp-19-13489-2019, 2019. a
Blackadar, A. K.: Boundary layer wind maxima and their significance for the growth of nocturnal inversions, B. Am. Meteorol. Soc., 38, 283–290, 1957. a
Chen, T., Rossow, W. B., and Yuanchong, Z.: Radiative Effects of Cloud-Type Variations, J. Climate, 13, 264–286, 2000. a
Deetz, K., Vogel, H., Knippertz, P., Adler, B., Taylor, J., Coe, H., Bower, K., Haslett, S., Flynn, M., Dorsey, J., Crawford, I., Kottmeier, C., and Vogel, B.: Numerical simulations of aerosol radiative effects and their impact on clouds and atmospheric dynamics over southern West Africa, Atmos. Chem. Phys., 18, 9767–9788, https://doi.org/10.5194/acp-18-9767-2018, 2018. a, b, c, d
Derrien, S., Bezombes, Y., Bret, G., Gabella, O., Jarnot, C., Medina, P., Piques, E., Delon, C., Dione, C., Campistron, B., Durand, P., Jambert, C., Lohou, F., Lothon, M., Pacifico, F., and Meyerfeld, Y.: DACCIWA fiel campaign, Savè supersite, UPS instrumentation, Tech. rep., https://doi.org/10.6096/dacciwa.1618, 2016. a
Dione, C., Lohou, F., Lothon, M., Adler, B., Babić, K., Kalthoff, N., Pedruzo-Bagazgoitia, X., Bezombes, Y., and Gabella, O.: Low-level stratiform clouds and dynamical features observed within the southern West African monsoon, Atmos. Chem. Phys., 19, 8979–8997, https://doi.org/10.5194/acp-19-8979-2019, 2019. a, b, c, d, e, f, g, h, i, j, k, l, m, n, o, p, q
Grams, C. M., Jones, S. C., Marsham, J. H., Parker, D. J., Haywood, J. M., and Heuveline, V.: The Atlantic inflow to the Saharan heat low: Observations and Modelling, Q. J. Roy. Meteor. Soc., 136, 125–140, https://doi.org/10.1002/qj.429, 2010. a
Handwerker, J., Scheer, S., and Gamer, T.: DACCIWA field campaign, Savè super-site, Cloud and precipitation, Tech. rep., 2016. a
Hannak, L., Knippertz, P., Fink, A. H., Kniffka, A., and Pante, G.: Why do global climate models struggle to represent low-level clouds in the west african summer monsoon?, J. Climate, 30, 1665–1687, https://doi.org/10.1175/JCLI-D-16-0451.1, 2017. a, b
Haslett, S. L., Taylor, J. W., Evans, M., Morris, E., Vogel, B., Dajuma, A., Brito, J., Batenburg, A. M., Borrmann, S., Schneider, J., Schulz, C., Denjean, C., Bourrianne, T., Knippertz, P., Dupuy, R., Schwarzenböck, A., Sauer, D., Flamant, C., Dorsey, J., Crawford, I., and Coe, H.: Remote biomass burning dominates southern West African air pollution during the monsoon, Atmos. Chem. Phys., 19, 15217–15234, https://doi.org/10.5194/acp-19-15217-2019, 2019. a
Kalthoff, N., Lohou, F., Brooks, B., Jegede, G., Adler, B., Babić, K., Dione, C., Ajao, A., Amekudzi, L. K., Aryee, J. N. A., Ayoola, M., Bessardon, G., Danuor, S. K., Handwerker, J., Kohler, M., Lothon, M., Pedruzo-Bagazgoitia, X., Smith, V., Sunmonu, L., Wieser, A., Fink, A. H., and Knippertz, P.: An overview of the diurnal cycle of the atmospheric boundary layer during the West African monsoon season: results from the 2016 observational campaign, Atmos. Chem. Phys., 18, 2913–2928, https://doi.org/10.5194/acp-18-2913-2018, 2018. a, b, c, d, e
Knippertz, P., Fink, A. H., Schuster, R., Trentmann, J., Schrage, J. M., and Yorke, C.: Ultra-low clouds over the southern West African monsoon region, Geophys. Res. Lett., 38, L21808, https://doi.org/10.1029/2011GL049278, 2011. a, b, c
Knippertz, P., Coe, H., Chiu, J. C., Evans, M. J., Fink, A. H., Kalthoff, N., Liousse, C., Mari, C., Allan, R. P., Brooks, B., Danour, S., Flamant, C., Jegede, O. O., Lohou, F., and Marsham, J. H.: The dacciwa project: Dynamics-aerosol-chemistry-cloud interactions in West Africa, B. Am. Meteorol. Soc., 96, 1451–1460, https://doi.org/10.1175/BAMS-D-14-00108.1, 2015. a
Knippertz, P., Fink, A. H., Deroubaix, A., Morris, E., Tocquer, F., Evans, M. J., Flamant, C., Gaetani, M., Lavaysse, C., Mari, C., Marsham, J. H., Meynadier, R., Affo-Dogo, A., Bahaga, T., Brosse, F., Deetz, K., Guebsi, R., Latifou, I., Maranan, M., Rosenberg, P. D., and Schlueter, A.: A meteorological and chemical overview of the DACCIWA field campaign in West Africa in June–July 2016, Atmos. Chem. Phys., 17, 10893–10918, https://doi.org/10.5194/acp-17-10893-2017, 2017. a
Kohler, M., Kalthoff, N., Seringer, J., and Kraut, S.: DACCIWA field campaign, Savè super-site, Surface measurements, Tech. rep., https://doi.org/10.6096/DACCIWA.1690, 2016 a
Linden, P. F. and Simpson, J. E.: Gravity driven flows in a turbulent fluid, J. Fluid Mech., 172, 481–497, 1986. a
Linden, R., Fink, A. H., and Redl, R.: Journal of geophysical research, Nature, 175, 238, https://doi.org/10.1038/175238c0, 1955. a
Lothon, M., Saïd, F., Lohou, F., and Campistron, B.: Observation of the Diurnal Cycle in the Low Troposphere of West Africa, Mon. Weather Rev., 136, 3477–3500, https://doi.org/10.1175/2008MWR2427.1, 2008. a, b
Parker, D. J., Burton, R. R., Diongue-Niang, A., Ellis, R. J., Felton, M., Taylor, C. M., Thorncroft, C. D., Bessemoulin, P., and Tompkins, A. M.: The diurnal cycle of the West African monsoon circulation, Q. J. Roy. Meteor. Soc., 131, 2839–2860, https://doi.org/10.1256/qj.04.52, 2005. a, b
Redelsperger, J.-L., Thorncroft, C. D., Diedhiou, A., Lebel, T., Parker, D. J., and Polcher, J.: African monsoon multidisciplinary analysis, B. Am. Meteorol. Soc., 87, 1739–1746, https://doi.org/10.1175/BAMS-87-12-1739, 2006. a
Ricchiazzi, P., Yang, S., Gautier, C., and Sowle, D.: SB DART : A Research and Teaching Software Tool for Plane-Parallel Radiative Transfer in the Earth's Atmosphere, B. Am. Meteorol. Soc., 79, 2101–2114, 1998. a
Romps, D. M.: Exact expression for the lifting condensation level, J. Atmos. Sci., 74, 3891–3900, https://doi.org/10.1175/JAS-D-17-0102.1, 2017. a
Schrage, J. M. and Fink, A. H.: Nocturnal Continental Low-Level Stratus over Tropical West Africa: Observations and Possible Mechanisms Controlling Its Onset, Mon. Weather Rev., 140, 1794–1809, https://doi.org/10.1175/MWR-D-11-00172.1, 2012. a, b, c
Schuster, R., Fink, A. H., and Knippertz, P.: Formation and Maintenance of Nocturnal Low-Level Stratus over the Southern West African Monsoon Region during AMMA 2006, J. Atmos. Sci., 70, 2337–2355, https://doi.org/10.1175/JAS-D-12-0241.1, 2013. a, b, c
Stull, R. B.: An introduction to boundary layer meteorology, Kluwer Academic Publishers, Dordrecht, The Netherlands, 1988. a
Taylor, J. W., Haslett, S. L., Bower, K., Flynn, M., Crawford, I., Dorsey, J., Choularton, T., Connolly, P. J., Hahn, V., Voigt, C., Sauer, D., Dupuy, R., Brito, J., Schwarzenboeck, A., Bourriane, T., Denjean, C., Rosenberg, P., Flamant, C., Lee, J. D., Vaughan, A. R., Hill, P. G., Brooks, B., Catoire, V., Knippertz, P., and Coe, H.: Aerosol influences on low-level clouds in the West African monsoon, Atmos. Chem. Phys., 19, 8503–8522, https://doi.org/10.5194/acp-19-8503-2019, 2019. a
Wieser, A., Adler, B., and Deny, B.: DACCIWA field campaign, Savè super-site, Thermodynamic data sets, Tech. rep., https://doi.org/10.6096/DACCIWA.1659, 2016. a