the Creative Commons Attribution 4.0 License.
the Creative Commons Attribution 4.0 License.
 | 26 Feb 2020
How emissions uncertainty influences the distribution and radiative impacts of smoke from fires in North America
Jose L. Jimenez
Pedro Campuzano-Jost
Yutaka Kondo
Nobuhiro Moteki
Joshua P. Schwarz
Christine Wiedinmyer
Anton S. Darmenov
Arlindo M. da Silva
Johannes W. Kaiser
Fires and the aerosols that they emit impact air quality, health, and climate, but the abundance and properties of carbonaceous aerosol (both black carbon and organic carbon) from biomass burning (BB) remain uncertain and poorly constrained. We aim to explore the uncertainties associated with fire emissions and their air quality and radiative impacts from underlying dry matter consumed and emissions factors. To investigate this, we compare model simulations from a global chemical transport model, GEOS-Chem, driven by a variety of fire emission inventories with surface and airborne observations of black carbon (BC) and organic aerosol (OA) concentrations and satellite-derived aerosol optical depth (AOD). We focus on two fire-detection-based and/or burned-area-based (FD-BA) inventories using burned area and active fire counts, respectively, i.e., the Global Fire Emissions Database version 4 (GFED4s) with small fires and the Fire INventory from NCAR version 1.5 (FINN1.5), and two fire radiative power (FRP)-based approaches, i.e., the Quick Fire Emission Dataset version 2.4 (QFED2.4) and the Global Fire Assimilation System version 1.2 (GFAS1.2). We show that, across the inventories, emissions of BB aerosol (BBA) differ by a factor of 4 to 7 over North America and that dry matter differences, not emissions factors, drive this spread. We find that simulations driven by QFED2.4 generally overestimate BC and, to a lesser extent, OA concentrations observations from two fire-influenced aircraft campaigns in North America (ARCTAS and DC3) and from the Interagency Monitoring of Protected Visual Environments (IMPROVE) network, while simulations driven by FINN1.5 substantially underestimate concentrations. The GFED4s and GFAS1.2-driven simulations provide the best agreement with OA and BC mass concentrations at the surface (IMPROVE), BC observed aloft (DC3 and ARCTAS), and AOD observed by MODIS over North America. We also show that a sensitivity simulation including an enhanced source of secondary organic aerosol (SOA) from fires, based on the NOAA Fire Lab 2016 experiments, produces substantial additional OA; however, the spread in the primary emissions estimates implies that this magnitude of SOA can be neither confirmed nor ruled out when comparing the simulations against the observations explored here. Given the substantial uncertainty in fire emissions, as represented by these four emission inventories, we find a sizeable range in 2012 annual BBA PM2.5 population-weighted exposure over Canada and the contiguous US (0.5 to 1.6 µg m−3). We also show that the range in the estimated global direct radiative effect of carbonaceous aerosol from fires (−0.11 to −0.048 W m−2) is large and comparable to the direct radiative forcing of OA (−0.09 W m−2) estimated in the Fifth Assessment Report (AR5) of the Intergovernmental Panel on Climate Change (IPCC). Our analysis suggests that fire emissions uncertainty challenges our ability to accurately characterize the impact of smoke on air quality and climate.
- Article
(12616 KB) -
Supplement
(9924 KB) - BibTeX
- EndNote


Biomass burning (BB), which includes wildfires in addition to agricultural and other prescribed burning, emits a variety of trace gases and aerosols, including carbon dioxide, oxides of nitrogen, volatile organic compounds (VOCs), and particulate matter (PM) (Akagi et al., 2011), with large associated air quality and climate impacts. Particulate matter from fires (or smoke) is dominated by carbonaceous aerosol (black carbon, BC, and organic aerosol, OA) (Akagi et al., 2011; Bond et al., 2013). As these emissions are transported through the atmosphere, they deteriorate air quality in a variety of ways. Because of their small size and associated ability to lodge deeply in lungs, aerosols can have significant health impacts (respiratory infections, asthma, and lung cancer) and increase cardiovascular disease (e.g., Pope III and Dockery, 2006; Brook et al., 2010), especially the high levels of PM from fire events (Liu et al., 2015; Reid et al., 2016; Williamson et al., 2016). Deep penetration of the lungs and most acute health impacts are generally associated with the fine PM (under 2.5 µm) fraction of PM. Biomass burning aerosol (BBA) can also impact the climate system via absorbing and scattering radiation (Bond et al., 2013). In an era of increasing wildfire activity in the western US (Westerling et al., 2006; Westerling, 2016), there is a pressing need to understand how smoke from fires impacts air quality and alters atmospheric radiation.
Globally, BB is responsible for roughly 30 % of BC and nearly 90 % of primary OA emissions (POA), contributing an estimated 34 Tg yr−1 of aerosol to the atmosphere annually (Bond et al., 2013). In addition, fires may be an important source of secondary organic aerosol (SOA), which form from the oxidative aging of gas-phase organics emitted during combustion. Our current understanding of SOA formation is incomplete. Recent studies demonstrate that there is no clear consensus on the magnitude of SOA from fires, with estimates that range from virtually none to 95 Tg yr−1 (Shrivastava et al., 2017; Vakkari et al., 2018). Much of this spread comes from diverging results from field versus laboratory studies: the majority of field studies have reported no secondary aerosol formation (above dilution-corrected POA concentrations; Hodshire et al., 2019) or even a decrease in OA (May et al., 2014, 2015; Liu et al., 2016; Akagi et al., 2012; Jolleys et al., 2012; Forrister et al., 2015; Collier et al., 2016; Garofalo et al., 2019), while a few field studies observed significant SOA formation from biomass burning emissions (Yokelson et al., 2009; Vakkari et al., 2014, 2018). Laboratory studies, on the contrary, almost always report substantial SOA formation from fires (Grieshop et al., 2009; Hennigan et al., 2011; Ortega et al., 2013; Tkacik et al., 2017; Lim et al., 2019). The reasons for the discrepancy across studies are not understood (Shrivastava et al., 2017; Hodshire et al., 2019) and should be the focus of further research.
Biomass burning aerosols (BC, POA, and SOA) can have major impacts on radiation. Black carbon has a strong warming or positive direct radiative effect (DRE) (instantaneous radiative impact), both globally and regionally, and some studies suggest its warming direct radiative forcing (DRF) (the change in DRE from the pre-industrial period to the present day, not including climate feedbacks) (Heald et al., 2014) is second only to CO2 (Bond et al., 2013). Black carbon from BB and gas flares also lowers the snow and ice albedo in the Arctic, leading to additional warming (Stohl et al., 2013). Organic aerosol, because it scatters radiation, has a negative or cooling DRE (Bond et al., 2013). It is therefore the sum of the warming from absorption and the cooling from scattering that dictates the climate effect of BBA, leading to uncertainty in even the sign of the net radiative effect of fires. Previous estimates of BBA DRE range from −0.01 to 0.13 W m−2 (Rap et al., 2013; Ward et al., 2012). Furthermore, when quantifying BBA impacts on radiation, differentiating anthropogenic and natural fires is central to quantifying the climate forcing or the DRF of fires, which reflects human influence (e.g., via ignition, suppression, or changes in fuel availability). The uncertainty in fire radiative impacts has not been assessed in detail.
North America, in particular the western US, is one of the few regions in the world where more intense and frequent wildfires have been directly tied to climate change impacts (e.g., hotter temperatures and less snowpack) (Wehner et al., 2017; Abatzogolou and Williams, 2016). In addition to climate change, historical fire suppression efforts in the US have led to increased fuel loads for fires (Marlon et al., 2012). Consequently, BBA emissions in this region are likely to increase in future decades (Yue et al., 2013). Boreal forest fires are already responsible for only 2.5 % of global burned area but 9 % of global BBA emissions (van der Werf et al., 2017). Biomass burning in Alaska has also accelerated in the last decade through increases in both burned area and fire frequency leading to increases in carbon loss associated with late-season burning (Turetsky et al., 2011). Both relative and total impacts of BB on air quality and climate forcing are expected to increase as controls continue to reduce fossil fuel emissions and a changing climate potentially leads to more fires (Fuzzi et al., 2015; Val Martin et al., 2015). It is therefore becoming increasingly important to have models and emission inventories that can accurately characterize the impact that current and future fires and their emitted aerosols have on the environment, climate, and human health. Several recent laboratory studies (e.g., Jolleys et al., 2014; Levin et al., 2010; McMeeking et al., 2009), including the recent NOAA Fire Lab 2016 experiments in Missoula, MT (e.g., Koss et al., 2018; Selimovic et al., 2018; Jen et al., 2019), have explored the BB of North American fuels, providing key constraints on smoke emissions, aging, and properties.
Because BBA emissions cannot routinely be measured directly, a variety of global fire emission inventories have been developed over the last decade(s) based on satellite observations. These inventories use different empirical approaches and underlying data to represent gas and aerosol emissions from fires – each with inherent uncertainties. Aerosol emissions from these inventories often vary by large factors depending on the region, do not agree spatially, and sometimes do not reflect observations of concentrations and aerosol optical depth (AOD) well either when integrated into a model (Reddington et al., 2016, 2019; Petrenko et al., 2012). In this analysis, we focus on four commonly used but theoretically distinct inventories: the Global Fire Emissions Database version 4 (GFED4s) (van der Werf et al., 2017) with small fires, the Fire INventory from NCAR version 1.5 (FINN1.5) (Wiedinmyer et al., 2011), the Quick Fire Emissions Database version 2.4 (QFED2.4) (Darmenov and da Silva, 2013), and the Global Fire Assimilation System version 1.2 (GFAS1.2) (Kaiser et al., 2012). The two main approaches are a fire detection and/or burned area (FD-BA) method that relies upon burned area, which GFED4s uses; active fire counts, which FINN1.5 uses; or the fire radiative power (FRP) approach, which relies upon fire radiative energy observations, an approach which both QFED2.4 and GFAS1.2 use. Comparisons among these different types of inventories suggest that there is significant variability in the amount of dry matter burned associated with an individual active fire detection, which is one explanation for why FD-BA and FRP inventories do not align (van der Werf et al., 2017, and references therein). Studies using AOD to interrogate BB emission inventories give varied results but suggest that FD-BA BBA estimates are roughly a factor of 3 too low in large BB regions (e.g., boreal North America, South America, southern Africa, and equatorial Asia) and globally (Johnston et al., 2012; Kaiser et al., 2012; Petrenko et al., 2012; Tosca et al., 2013). In this study we will refer to the spread across these inventories as the “uncertainty” in emissions; however, we note that additional factors, not represented by any of these inventories, may increase the true uncertainty in the estimated emissions.
Here we use the GEOS-Chem chemical transport model and a suite of fire emission inventories to investigate the emissions uncertainties associated with impacts of BBA on air quality and radiation. We explore the interannual and geographic variability of fire emissions and dry matter (DM) consumed from 2004 to 2016 across inventories and discuss how the uncertainty in emissions carries forward to concentrations, exposure, aerosol optical depth (AOD), and DRE with a focus on 2012–2014. We also explore the impact of a new model parameterization for SOA from fires.
2.1 The GEOS-Chem model
We use GEOS-Chem (http://acmg.seas.harvard.edu/geos/, last access: 22 June 2018), a global chemical transport model, coupled with the rapid radiative transfer model for global circulation models (RRTMG, Iacono et al., 2008), a configuration known as GC-RT (Heald et al., 2014), to explore the air quality and climate impacts of BBA. GEOS-Chem is driven by assimilated meteorology from the Modern-Era Retrospective analysis for Research and Applications, Version 2 (MERRA-2), at the NASA Global Modeling and Assimilation Office (GMAO). We run version 12.0.0 of GEOS-Chem (https://doi.org/10.5281/zenodo.1343547) with a horizontal resolution of 2∘×2.5∘ and 47 vertical levels with a chemical time step of 20 min and a transport time step of 10 min and with 6-month spin-up simulations prior to the time periods of interest, i.e., 2012–2014 and June–July 2008. We also perform nested simulations over North America at 0.5∘×0.625∘ (with boundary conditions from the global simulation) for comparison against observations (IMPROVE and aircraft campaigns; see Sect. 2.3) with transport and chemistry time steps of 5 and 10 min, respectively.
GEOS-Chem employs –– thermodynamics (Fountoukis and Nenes, 2007) coupled to an ozone–VOC–NOx–oxidant chemical mechanism (Mao et al., 2013; Travis et al., 2016; Miller et al., 2017) with integrated Cl-Br-I chemistry (Sherwen et al., 2016). The model includes schemes for fine and coarse sea salt aerosols (Jaeglé et al., 2011) and mineral dust in four size bins (Fairlie et al., 2007; Ridley et al., 2012). The standard simulation of BC in GEOS-Chem is described in Park et al. (2003). We update this simulation per Wang et al. (2014) as follows: we update the initial hydrophilic fraction from BB to 70 % based on field observations (Wang et al. (2014) and references therein). Fossil BC is aged from hydrophobic to hydrophilic using the Liu et al. (2011) BC aging scheme with dynamic [OH] and [SO2] per Wang et al. (2014), and biofuel and biomass BC is aged with an e-folding time of 4 h. For hydrophilic BC, we use an absorption enhancement from coating of BC of 1.1 for fossil BC and 1.5 for biofuel and biomass BC. We also update the BC properties for optical calculations per Wang et al. (2014).
The standard primary organic aerosol (POA) simulation emits 50 % of POA as hydrophilic and ages hydrophobic POA to hydrophilic POA with an atmospheric lifetime of 1.15 d (Chin et al., 2002; Cooke et al., 1999). We use an organic matter (OM) to OC ratio of 1.4 for hydrophobic OC and 2.1 for hydrophilic. The baseline model formation of SOA from BB follows the simple scheme implemented by Kim et al. (2015) based on field results from six large campaigns summarized by Cubison et al. (2011). This emits 0.013 g SOA precursor (SOAP) per g CO emitted, which then forms nonvolatile SOA on a fixed timescale of 1 d. SOAP is not lost by dry or wet deposition. Recent laboratory results from the NOAA Fire Lab 2016 campaign suggest much greater SOA formation from the burning of North American fuels (Lim et al., 2019); however, we note that, as previously discussed, uncertainties surrounding this source of SOA remain large. Based on this study, we perform a sensitivity analysis for a new parameterization for SOA production from fires, where SOAP is estimated as POA fire emissions scaled by a factor of 2.48. We note that this is 13 times larger than the field-based estimate of Cubison et al. (2011), which combines the effects of POA evaporation and SOA formation (see Sect. 5 for further details).
Anthropogenic emissions (including fossil and biofuel sources) of both BC and POA follow the CEDS global inventory (Hoesly et al., 2018) with regional inventories used when available, including NEI2011v1 over the US (Environmental Protection Agency National Emissions Inventory, 2015), APEI over Canada, and DICE-Africa over Africa (Marais and Wiedinmyer, 2016). Trash burning emissions are from Wiedinmyer et al. (2014). Aircraft emissions are from the AEIC inventory (Stettler et al., 2011; Simone et al., 2013). Global annual anthropogenic emissions are 4.5 Tg yr−1 of BC and 8.7 Tg yr−1 of POA in 2012. Biogenic emissions are calculated online from the MEGANv2.1 emissions framework (Guenther et al., 2012).
Fire emission inventories (GFED4s, FINN1.5, QFED2.4, and GFAS1.2) are specified on a daily timescale, the frequency at which all four inventories were available. The standard version of GEOS-Chem, which we use, emits all fire emissions from the surface into the boundary layer. Diurnal-scale factors from the Western Regional Air Partnership (WRAP, 2005) were applied to all inventories per Kim et al. (2015). Additional information on each fire inventory is provided in Sect. 2.2.
We quantify simulated AOD at 550 nm, assuming that aerosols are externally mixed with a fixed lognormal size distribution for each species and that AOD is a function of relative humidity to account for hygroscopic growth, which also varies by species (Martin et al., 2003). Aerosol optical properties are from the Global Aerosol Data Set (GADS) database (Koepke et al., 1997) with updates from Drury et al. (2010) and Wang et al. (2014). RRTMG calculates both longwave and shortwave atmospheric radiative fluxes. When coupled to GEOS-Chem, this calculation is performed every 3 h. Longwave and shortwave DRE at the top of the atmosphere are summed and reported as total DRE.
2.2 Description of fire emission inventories
Here we describe the differences and similarities of the four fire emission inventories investigated in this study: two FD-BA approaches (GFED4s and FINN1.5) and two FRP-based approaches (QFED2.4 and GFAS1.2). GFED4s is the most widely used of fire emission inventories (other inventories are sometimes scaled to it) and it employs a FD-BA approach based on the Moderate Resolution Imaging Spectroradiometer (MODIS)-observed burned area complemented by the Carnegie–Ames–Stanford Approach (CASA) biogeochemical model. CASA provides estimated biomass factors (i.e., combustion completeness and fuel load) in a variety of carbon pools (e.g., leaves, grasses, litter), depending on pool-specific and environmental conditions, which are combined with emission factors (EFs) and MODIS burned area to produce emissions (van der Werf et al., 2017). GFED4s therefore estimates emissions as follows:
where Ms is the mass of the species of interest (g), A is burned area (m2), γ is combustion completeness (%), ρ is fuel load (kg DM m−2), and EFs is the species-specific emission factor (g species per kg DM).
The fourth and most recent version of GFED (GFED4s) provides emissions at a 0.25∘ resolution from 1997 in near real time, and boosts emissions to include small fires (Randerson et al., 2012). Burned area estimates from 2000 onwards are from the MODIS MCD64A1 500m burned area maps, aggregated at 0.25∘ resolution and a monthly time step (Giglio et al., 2013). Because of measurement limitations, EFs, in general, are very uncertain (see Sect. 3), but GFED4s employs a recent compilation of EFs (Akagi et al., 2011) with some updates, such as for the temperate forest biome. GFED4s emissions are available monthly with scalars also available to distribute emissions over daily or 3 h intervals. These scalars are only available from 2003 onwards.
FINN1.5 follows the same FD-BA approach as GFED4s but with some differences, including burned area being estimated from active fire detection identified with the MODIS Thermal Anomalies Product (Giglio et al., 2006), EFs being based on the 2015 updates from Akagi et al. (2011) (http://bai.acom.ucar.edu/Data/fire/, last access: 1 February 2018), and different land cover maps being used. FINN1.5 emissions uncertainty comes from the use of fire hot spots, assumed area burned (each fire hot spot is equivalent to 1 km2 burned area, except grasslands, which are 0.75 km2), land cover maps, biomass consumption estimates, and EFs (Wiedinmyer et al., 2011). The original emission estimates are available at 1 km2 spatial resolution from 2002 to 2016 at both daily and monthly mean temporal resolution. Within the GEOS-Chem model, FINN1.5 input files are available at 0.25∘, CO2 emissions are produced with FINN1.5, and other emitted species are scaled based on emission factors and land cover type.
QFED2.4 and GFAS1.2 employ an FRP-based method, which estimates emissions using satellite observations of fire radiative power (FRP), relying upon the following theoretical approach:
where α is the emission coefficient (kg DM J−1), EFs is the species-specific emission factor (g species per kg DM), and thermal radiation (FRE; joules) is fire radiative energy or the integral of fire radiative power (FRP in J s−1) over time.
This FRP-based approach takes advantage of an empirically derived linear relationship between the energy released as thermal radiation (FRE) and the mass of fuel or DM consumed during combustion (Wooster, 2002; Wooster et al., 2005; Ichoku and Kaufman, 2005). This basic relationship is supported by the fact that the energy released by burning the same amount of a fuel is similar regardless of vegetation type (Wooster et al., 2005). The energy from combustion processes not transferred into the environment (through conductive, evaporative, and convective processes) is released as infrared radiation, which is then assumed to be proportional to the total energy produced during combustion. One can then relate the amount of fuel burned with the time-integrated FRE using an emission coefficient (α). In laboratory studies, the coefficient appears to be universal, i.e., independent of fuel type (Wooster et al., 2005). For satellite-observed FRE, however, different values are associated with different broad classes of fire types (Kaiser et al., 2012).
QFED2.4 uses the MODIS Active Fire Level 2 product (MOD14 and MYD14) and the MODIS Geolocation product (MOD03 and MYD03) for FRP and the location of fires. A linear regression between the QFED2.4 dataset, starting with an emission coefficient (α0) from Kaiser et al. (2009), and version 2 of GFED was used to calculate the α used in QFED2.4. The location of the fire in addition to a vegetation land type mask was used to assign the FRP to a QFED2.4 vegetation type, which was based on an aggregated version of the International Geosphere–Biosphere Programme (IGBP) vegetation mask using four basic classes: tropical forest, extratropical forest, savanna, and grassland. GFAS1.2 also uses the MOD14 fire product. GFAS1.2 utilizes land cover maps based on the dominant vegetation type from GFED3 and additional organic soil and peat maps (Kaiser et al., 2012). GFAS1.2 also derives conversion factors linking FRP and the GFEDv3.1 dry matter combustion rates based on linear regressions between the two.
QFED2.4 and GFAS1.2 utilize EFs from Andreae and Merlet (2001). An update to this EF compilation is now available (Andreae, 2019) but is not yet used in these inventories. QFED2.4 scales its aerosol emissions to better represent MODIS-observed AOD using biome-dependent strength factors. It should be noted that these enhancement factors were based on the GEOS model and depend on the underlying model configuration, i.e., most importantly, the single assumed OM : OC ratio of 1.4 but also the specific anthropogenic emissions and the radiative properties of aerosols in the model. Thus, these enhancement factors that scale to AOD could differ substantially in a model that treats these factors differently. To our knowledge, these differences have not been accounted for in previous model studies that have used QFED (e.g., Kim et al., 2015; Marais et al., 2016; Lu et al., 2015; Saide et al., 2015; Zhang et al., 2014). We make no effort to re-derive the biome-specific enhancement factors for GEOS-Chem. In an effort to ensure that global totals of emitted BC and OA are consistent with those reported by QFED2.4, we scale down emissions by a uniform factor of 0.69 (1.4 divided by the average OM : OC ratio in GEOS-Chem in 2012). QFEDv2.4 provides daily mean emissions and is available at 0.1∘ resolution from 2003 to 2016. GFAS1.2 provides daily mean emissions and is available from 2003 to 2019 at 0.1∘ resolution.
Some advantages of QFED2.4, GFAS1.2, and other FRP-based inventories are that the uncertain factors used in FD-BA inventories to convert burned area to DM consumed (fuel load and combustion completeness) can be bypassed, and that FRP observations are more sensitive to small fires than burned area observations (MODIS has detection limits of ∼5 MW and 50 m2, respectively). However, FRP-based approaches face significant challenges associated with the sparse temporal coverage of the underlying polar-orbiting MODIS observations of FRP. The daytime overpass of Terra and Aqua (10:30 and 13:30 LT, respectively), generally miss the period of peak fire activity in the western US and Canada. In addition, active fire observations (both active fire counts and FRP) can only detect fires during the burning phase, while the accumulated burned area can be detected for an extended period of time after the burning phase. FRP-based emission estimates therefore contain errors due to assumptions of undetectable fire activity under cloud cover and between satellite overpasses (for low Earth orbiting instruments like MODIS). Smouldering and peat fires are difficult to quantify with both methods: FRP-based approaches suffer from weak thermal signatures and uncertain emission coefficients (Darmenov and da Silva, 2013), and FD-BA-based approaches suffer from missing information on burn depth and thus combustion completeness.
2.3 In situ observations
The ARCTAS (Arctic Research of the Composition of the Troposphere from Aircraft and Satellites) summer airborne campaign surveyed large swaths of the Arctic with an emphasis on probing forest fire smoke plumes using the NASA DC-8 aircraft from 18 June to 13 July 2008 (Jacob et al., 2010) (see Fig. 1 for flight tracks). Black carbon mass concentrations were measured with a single-particle soot photometer (SP-2, Schwarz et al., 2008). For ARCTAS, the SP-2 detection range for particle diameter is 80–860 nm, and the uncertainty is estimated to be 10 % (Kondo et al., 2011). Organic aerosol was measured using a high-resolution time-of-flight aerosol mass spectrometer (CU-Boulder Aerodyne HR-ToF-AMS, DeCarlo et al., 2006; Canagaratna et al., 2007; Cubison et al., 2011) with a 2σ estimated uncertainty of 38 % for OA (Bahreini et al., 2009) and a size detection limit extending down to 35nm vacuum aerodynamic (about 25 nm geometric diameter for typical BBOA densities) (DeCarlo et al., 2006, 2008). Concentration detection limits for OA for 1 min data are ∼0.16 µg m−3 (DeCarlo et al., 2006; Dunlea et al., 2009), several orders of magnitude lower than typical field BBOA concentrations (>=10 µg m−3). The model structural and emission uncertainties for fire OA likely far outweigh measurement uncertainties and thus these measurement uncertainties are not germane to the analysis presented here. Acetonitrile, a useful tracer for BB, was measured using a proton transfer reaction mass spectrometer (PTR-MS, Hansel et al., 1995; Wisthaler et al., 2002) and used as a filter to help isolate BB influence.
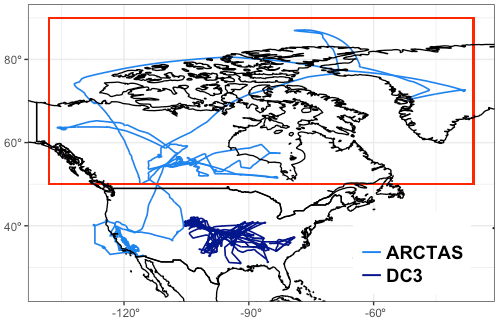
Figure 1Flight tracks of the ARCTAS and DC3 aircraft campaigns. The red box indicates the boreal region of the ARCTAS flights used here.
Observations from the Deep Convective Clouds and Chemistry (DC3) campaign are also included in our analyses. DC3 focused on thunderstorms and their impact on the chemical composition of the troposphere and also documented BB plumes and their interactions with deep convection in the southern Great Plains, the Colorado Front Range, and the southeastern US. Flights occurred from 18 May to 22 June 2012 (Barth et al., 2015) (Fig. 1). As in ARCTAS, BC was measured using the SP-2 and OA was measured using an HR-ToF-AMS. The detection range for BC mass from the SP-2 corresponds to 90–550 nm volume equivalent diameter, assuming 1.8 g cm−3 density, with ±30 % total uncertainty in the accumulation mode BC mass mixing ratio (Schwarz et al., 2013). Acetonitrile was again measured using a PTR-MS (Hansel et al., 1995; Wisthaler et al., 2002). For comparison with airborne measurements, the model was sampled to the nearest grid box both temporally and spatially to each flight track using 1 min aircraft data. We then average both the model and the observations to the model grid box.
As the spatial and temporal coverage of aircraft campaigns is limited, we also include surface observations from 168 sites in the contiguous United States (CONUS) that are part of the IMPROVE aerosol network (Interagency Monitoring of Protected Visual Environments, http://vista.cira.colostate.edu/improve/, last access: 19 June 2018) from 2012 and compare against 24 h averaged model results. Black carbon and OC are measured using a PM2.5 size-selective filter-based thermal method in this network (Chow et al., 2007). We use a conversion factor of 1.8 from OC to OA mass (Malm and Hand, 2007), which is the average of fresh and more aged OA in the model, to represent average surface conditions (note that the same OM : OC is applied to the model simulation when compared against IMPROVE).
2.4 MODIS AOD observations
Aerosol optical depth (AOD), the column total aerosol extinction, is directly proportional to the total mass concentration of aerosol in an atmospheric column (Levy et al., 2007, 2010) and is commonly measured by satellites. AOD measurements capture all aerosol contributions and therefore do not provide a unique quantitative constraint on BBA, but they can be a used to understand spatial and interannual BB patterns.
We use the MODIS collection 6 level 3 daily product of satellite AOD retrievals at 550 nm and 10 km resolution (Levy et al., 2013; Sayer et al., 2014) from the Aqua platform and re-grid MODIS AOD from 1∘×1∘ to the model grid of 2∘×2.5∘ for further comparison with GEOS-Chem AOD. AOD retrievals from Aqua are used because the crossover time of Aqua (early afternoon) typically coincides with peak burning activity and a well-mixed boundary layer. We use a merged AOD product (Dark Target–Deep Blue Combined Mean) from the collection 6 MODIS data that combines ocean and vegetated land surface retrievals (Dark Target) and bright land surface retrievals (Deep Blue) to maximize coverage. Retrieved AOD (τ) is estimated to be accurate to over the ocean (Remer et al., 2005), over dark land surfaces (Levy et al., 2010), and over bright surfaces (Hsu et al., 2006; Sayer et al., 2013). The model was sampled at the satellite overpass time (13:30 LT). In addition, we filter out AOD values from both MODIS and the model for which the cloud fraction from MODIS is greater than 80 % to eliminate potential cloud contamination.
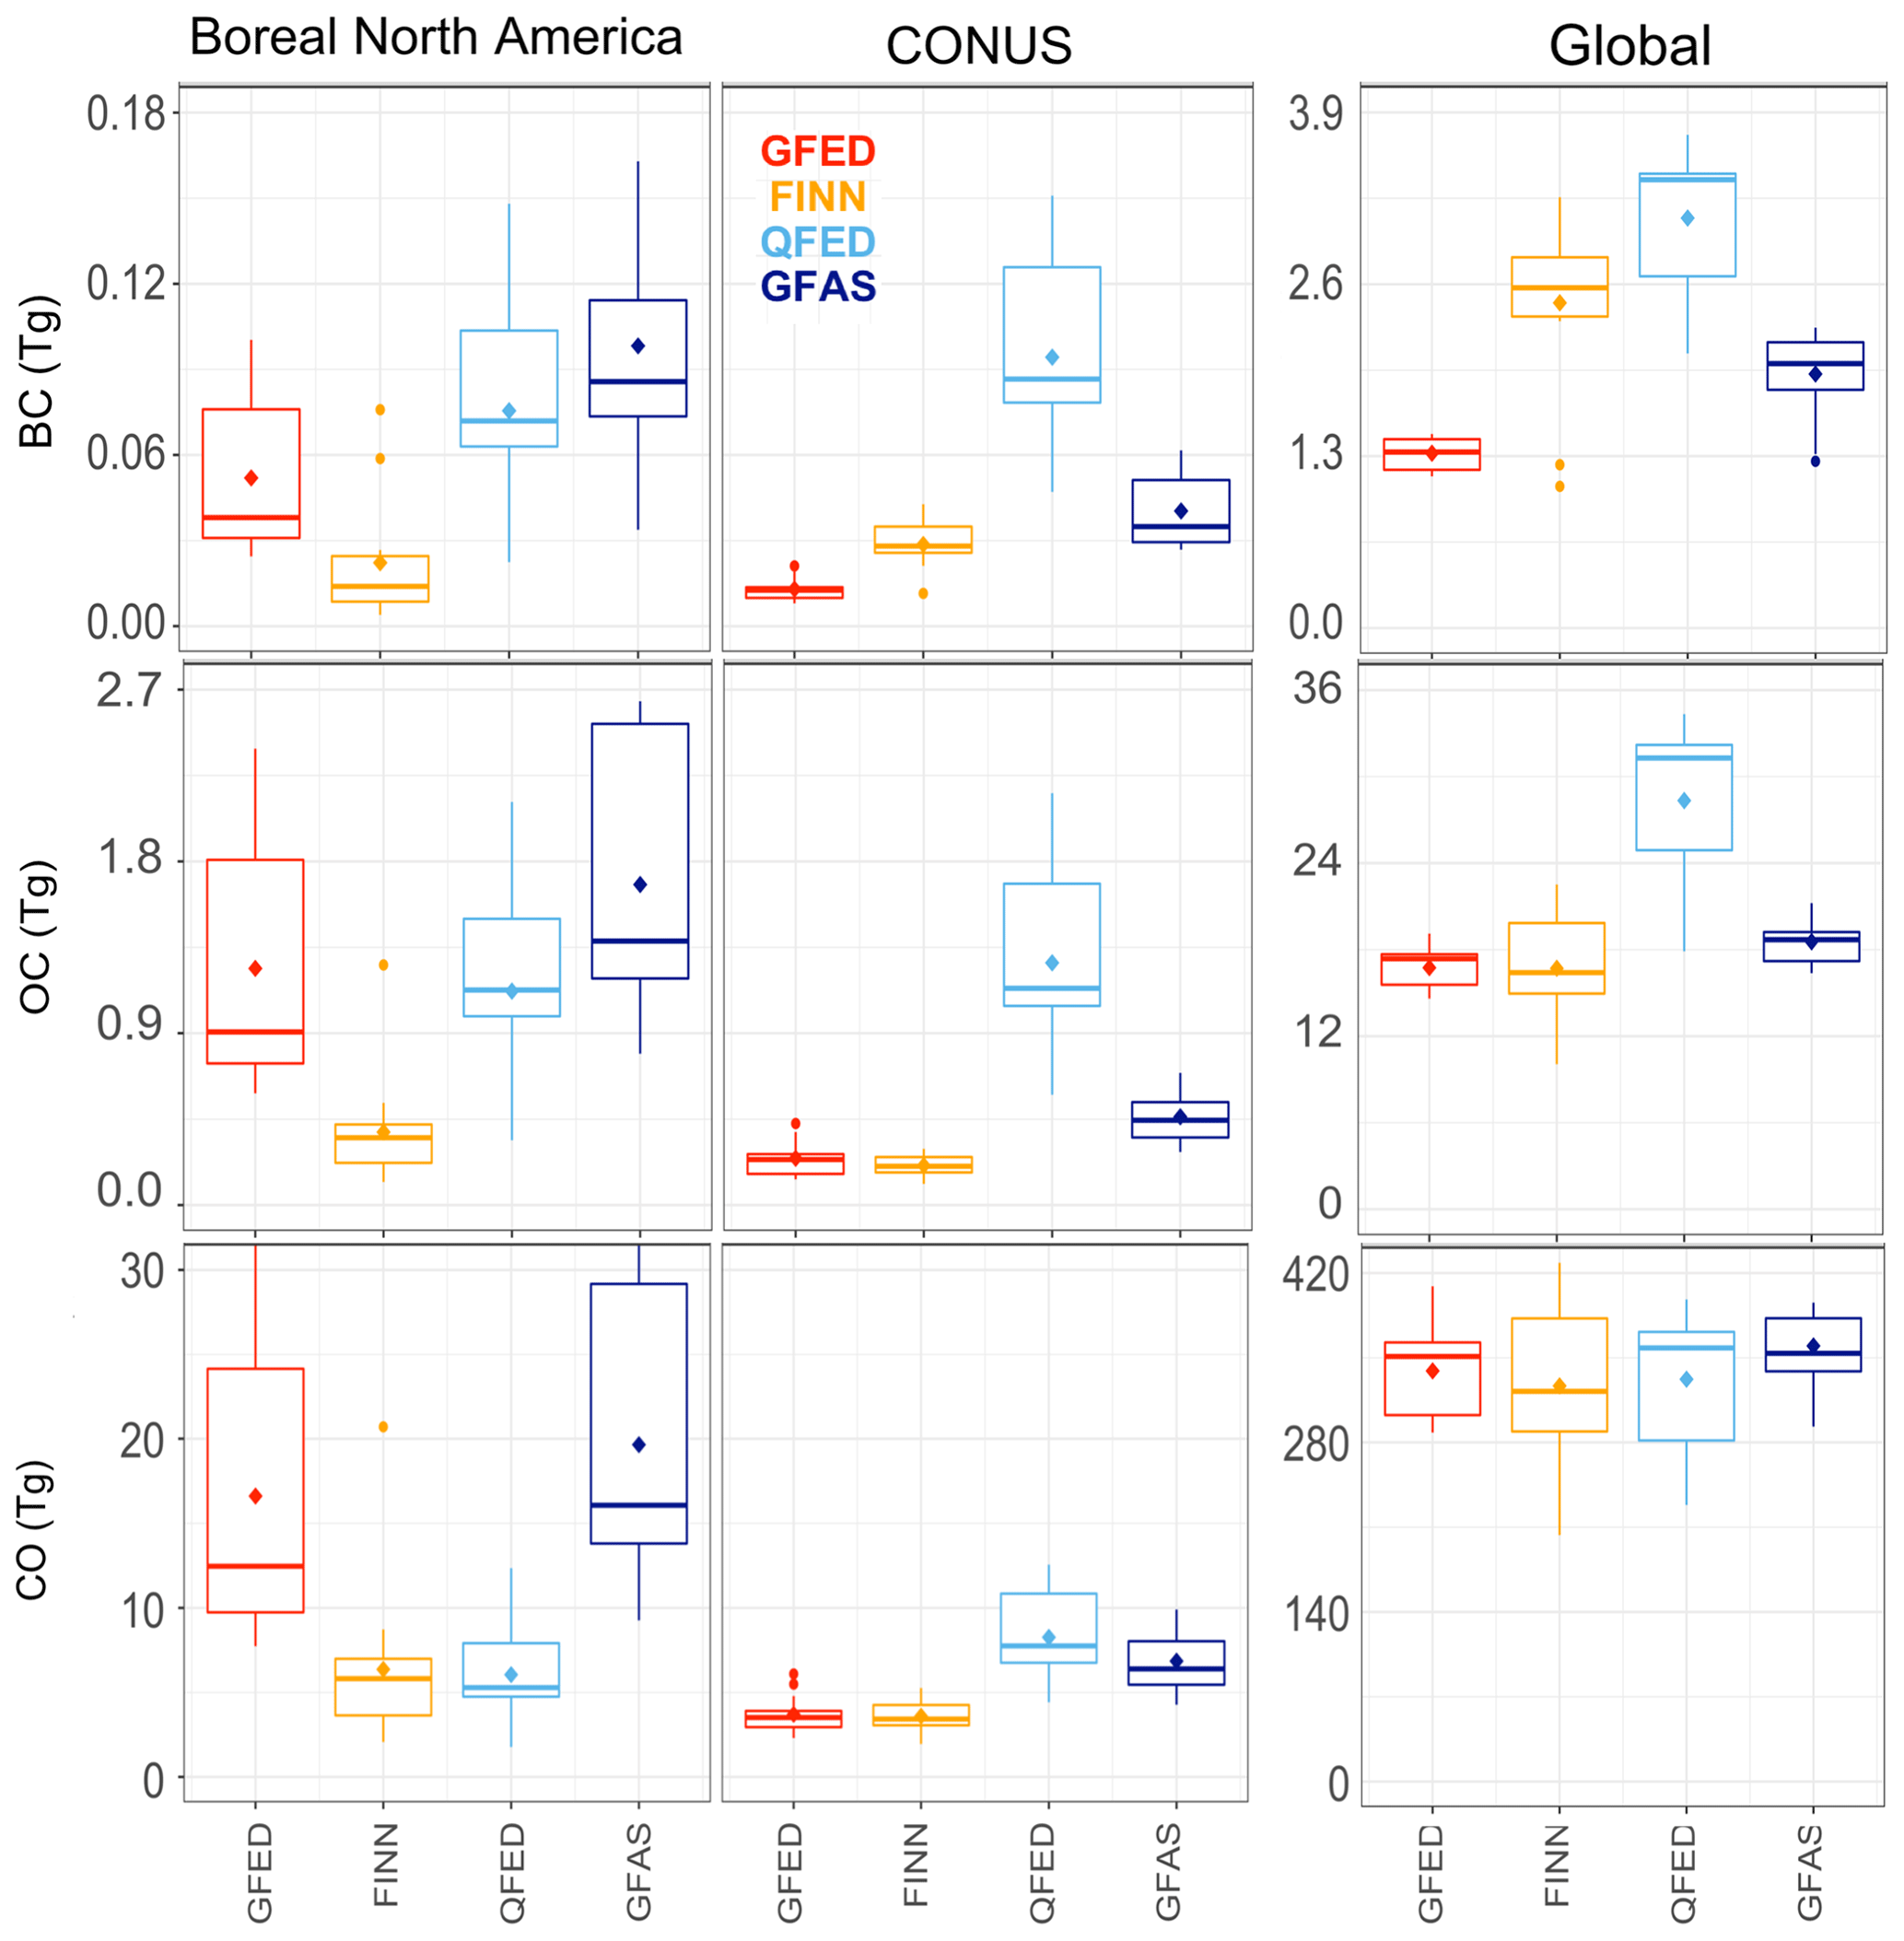
Figure 2Boxplot summaries of each inventory's total annual emissions of BC, OC, and CO globally and for boreal North America and CONUS from 2004 to 2016. Diamonds indicate means. The horizontal bar is the median. The box shows the 25th to the 75th percentile, and the whiskers show 1.5 times the interquartile range. Points outside 1.5 times the interquartile range are shown as dots. GFED4s emissions are in red, FINN1.5 emissions are in orange, QFED2.4 emissions are in light blue, and GFAS1.2 emissions are in dark blue.
Figure 2 demonstrates the large differences in total annual BBA emissions estimated by the four different fire emission inventories from 2004 to 2016 for boreal North America (BONA, i.e., Canada and Alaska), the contiguous US (CONUS), and the globe. Emission totals over other large BB regions that are not the focus of this study (Amazon, Africa, and Asia) are shown in Fig. S1 in the Supplement. We focus on BC and OC (note that inventories provide OC and not OA) emissions in our analysis but also provide a summary of CO for context, which generally follows the trends observed for OC (as does NOx, not shown). Globally, emissions of BC and OC are highest in QFED2.4 (3.1 and 28.3 Tg yr−1, respectively), but emissions are also most variable in this inventory (i.e., more variability from 2004 to 2016, as evidenced by the wider range between the 25th and 75th percentiles) (Fig. 2). Average global annual emissions are smallest in GFED4s for BC, and for OC and CO FINN1.5 emissions are smallest – though they are very similar to GFED4s for OC and similar to QFED for CO. Global mean total annual BC emissions differ by roughly a factor of 2.3 across the inventories, while mean total annual OC emissions differ by less (a factor of ∼1.7). The inventories show a smaller range in mean total annual CO emissions (a factor of ∼1.1) from GFAS1.2 (360 Tg yr−1) to FINN1.5 (327 Tg yr−1).

Figure 3Emissions factors in g species per kg DM (shown only for vegetated land) for each inventory over North America; BC is shown on the left, and OC is shown on the right.
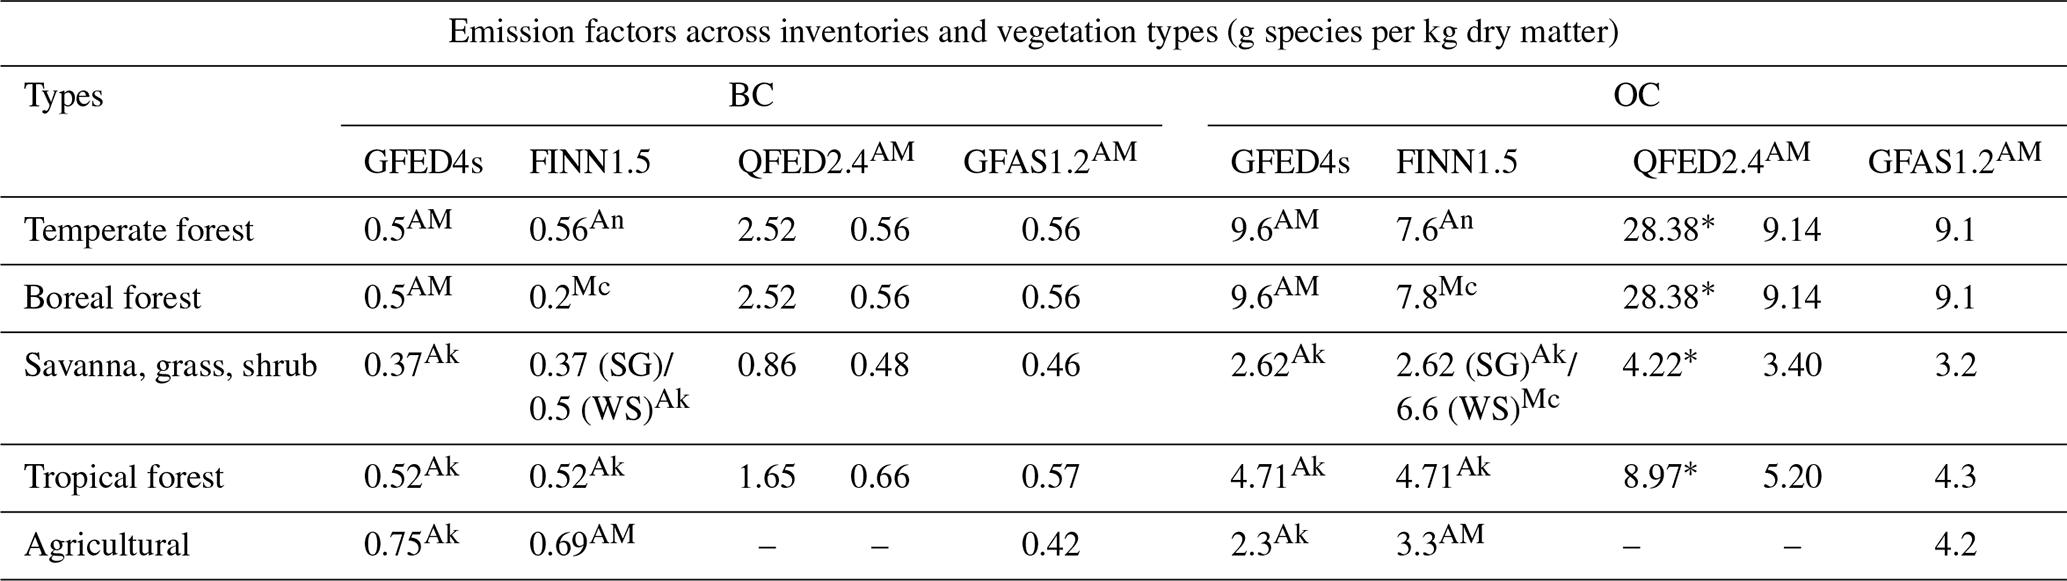
Table 1Emissions factors used in each inventory. Superscripted AM is from Andreae and Merlet (2001), Ak is from Akagi et al. (2011), An is Andreae and Rosenfeld (2008), and Mc is McMeeking et al. (2009). Note that QFED2.4 and GFAS1.2 EFs shown here for BC and OC are entirely from Andreae and Merlet (2001). * The first QFED2.4 column shows the underlying EFs (shown in the second QFED2.4 column) multiplied by their biome-specific enhancement factor. We also adjust this factor down by the ratio of 1.4 (the OM : OC ratio used in the GEOS model) to the average OM : OC ratio used in GEOS-Chem in 2012 (see Sect. 2.2 for details).
The spread in BBA emissions across North America is larger than that seen globally. In BONA, mean annual BC and OC emissions show a factor of roughly 5 and 4 ranging, respectively, from the smallest, FINN1.5 (0.02 and 0.4 Tg yr−1, respectively), to the largest, GFAS1.2 (0.1 and 1.7 Tg yr−1, respectively). The relative magnitudes of the four inventories are consistent across species for CONUS with QFED2.4 being the largest (0.09 and 1.3 Tg yr−1, for BC and OC, respectively), followed by GFAS1.2 (0.04 and 0.5 Tg yr−1, for BC and OC, respectively), and then FINN1.5 (0.03 and 0.2 Tg yr−1, for BC and OC, respectively) and GFED4s (0.01 and 0.3 Tg yr−1, for BC and OC, respectively) – where the exception is that the mean OC emissions from GFED4s are slightly larger than those of FINN1.5. The range of values is very similar for BC and OC in CONUS (a factor of ∼7 for BC and ∼6 for OC). For CONUS, GFED4s, GFAS1.2, and QFED2.4 show similar spatial patterns; FINN1.5 continues to show very little fire influence.
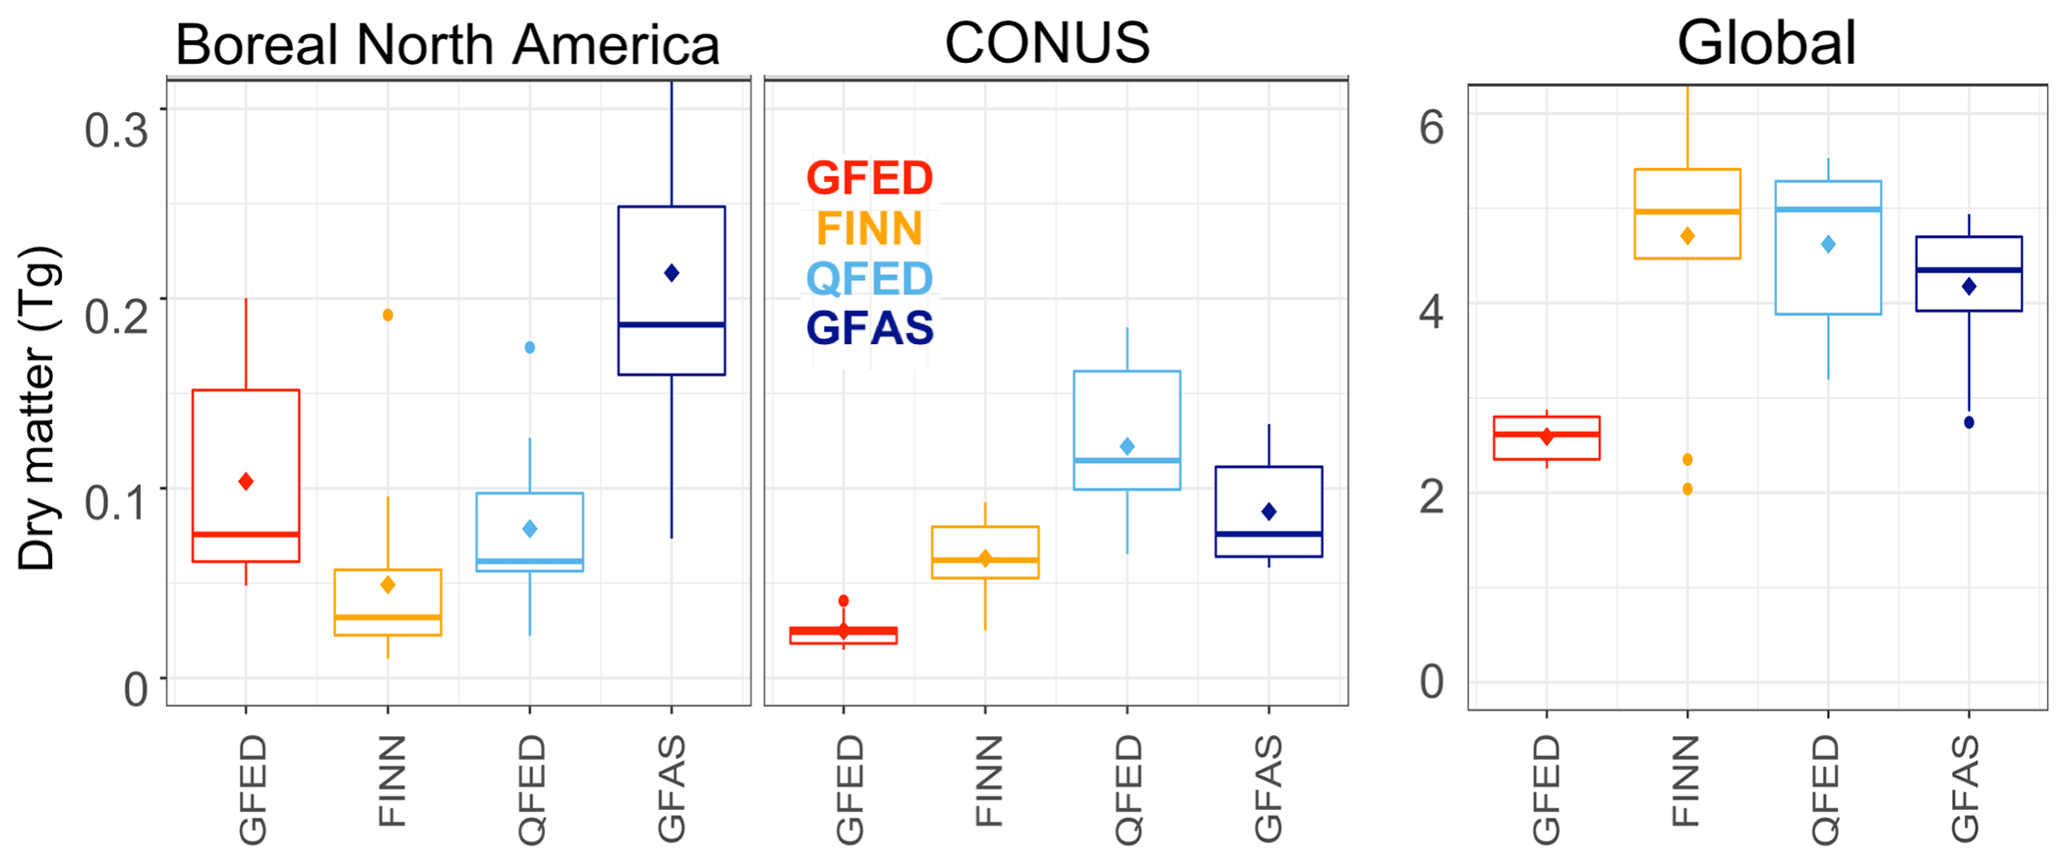
Figure 4Boxplot summary of each inventory's underlying total annual dry matter (DM) globally and for boreal North America and CONUS. The conventions of this boxplot are described in Fig. 2. GFED4s DM emissions are in red, FINN1.5 emissions in orange, QFED2.4 effective DM emissions in light blue, and GFAS1.2 effective DM emissions in dark blue.
Multiple studies (e.g., Akagi et al., 2011; Alvarado et al., 2010; Urbanski et al., 2011) have identified uncertainties in EFs as a large source of uncertainty in BB emissions. Table 1 confirms that there are large differences in the EFs used in the four inventories explored here in North America, particularly in boreal and agricultural regions. For example, OC boreal forest EFs range from 7.8 to 9.6 g per kg DM and BC ranges from 0.2 to 0.56 g per kg DM. The EFs used in each inventory are shown spatially over North America in Fig. 3. Updated EFs have also become recently available, from a large recent EF compilation (Andreae, 2019) and multiple studies focused on western fuels because of recent field intensives there. Some of this work has suggested that the PM EFs for western US fuels may be higher than those used in the inventories explored in this work (Liu et al., 2017). For example, the OA EFs measured by Liu et al. (2017) are roughly a factor of 1.5 to 4 larger than those used by the four inventories in this work. The uncertainty in EFs is associated with measurement technique, variation in the experimental conditions used to measure species' EFs in a laboratory, post-processing and aging that can change smoke composition rapidly but is likely not yet fully mechanistically understood, and poorly characterized combustion and fire types (Akagi et al., 2011). Measured EFs vary considerably from different fuels (Jolleys et al., 2014; McMeeking et al., 2009); however, only coarse vegetation types (e.g., boreal forests) are typically delineated in emission inventories, making it difficult to apply laboratory-measured EFs. Of relevance to this study, relatively few measurements of BB have been made in temperate regions, such as large portions of the US, where much of the BB is prescribed for land management but controlled to protect air quality (Akagi et al., 2011), conditions which may lead to substantially lower BBA emissions (Liu et al., 2017). Another potential source of uncertainty in EFs is that experimentally derived OC EFs may represent SOA as well as POA; EFs presented in compilations (Akagi et al., 2011; Andreae and Merlet, 2001) are generally calculated from fresh smoke where the quantity of SOA production is not well constrained.
We quantify how the range in EFs contributes to the overall spread in BBA emissions. First, we divide emissions by the applied EFs to estimate the underlying dry matter (DM) consumed across inventories in the same regions and years as our emissions analysis (Fig. 4) to isolate the importance of EFs. We note that the two FD-BA inventories (GFED4s and FINN1.5) quantify DM consumption in the construction of the inventory; however, for the FRP-based inventories (QFED2.4 and GFAS1.2) this division results in effective DM consumed (FRE multiplied by an emission coefficient). We show DM calculated from BC emissions except for QFED2.4, where we use the effective DM calculated from the CO emissions so as to avoid any confounding issues with the aerosol strength scaling factors discussed briefly in Sect. 2.2. Across all regions, the range in DM tracks very closely with the range observed across emissions, suggesting that the uncertainty in the underlying DM, not EFs, is the predominant factor in emissions uncertainty. We note that the large range in the DM consumed globally alongside the similar global CO emissions indicates that large differences in the EFs of CO and different vegetation classifications offset the DM differences for this species.
To further illustrate the role of EFs, Fig. 5 shows the time series of total annual emissions from 2004 to 2016 for GFED4s, alongside the estimated emissions obtained by applying the GFED4s EFs to the estimated DM for the other three original inventories (applied using each inventories' respective vegetation mask). We then compare total annual emissions from the original inventories (dashed lines) with their GFED4s EF counterparts (solid lines) and with the original GFED4s inventory from 2004 to 2016 (Fig. 5). While eliminating the variation in assumed EFs does constrict the range in emissions across the inventories across North America and globally, substantial differences there remain. This suggests that EFs are important but that underlying DM burned is the largest source of fire emissions uncertainty – consistent with previous work (van Leeuwen et al., 2014). One reason for this is that substantial uncertainties are associated with using biome-averaged values to represent DM consumed for whole biomes (Veraverbeke et al., 2015; van Leeuwen et al., 2014) and that satellite products and assumptions used to capture fuel burned vary significantly (van der Werf et al., 2017, and references therein).

Figure 5Annual emissions scaled to GFED4s emissions factors from 2004 to 2016. The original inventory emissions from FINN1.5 (orange), QFED2.4 (light blue), and GFAS1.2 (dark blue) are shown as dashed lines, while their annual values using GFED4s (red) emissions factors are shown as solid lines. The year 2012 is marked with a gray rectangle.
Furthermore, assuming that the EFs used in the four inventories are all equally reasonable values, we can estimate a much larger range in plausible fire emissions by multiplying the minimum and the maximum DM consumed across the inventories by the smallest and largest EFs (Table 1) using the GFED4s vegetation mask. Globally, this calculation suggests a plausible range that spans a factor of 24 for BC and 18 for OC compared to the inventory spread of 2.3 and 1.7, respectively. This suggests that using the range across these four inventories may be a modest estimate of the uncertainty in fire emissions.
Interannual differences, especially in North America, are fairly consistent across the inventories except for 2014 (Fig. 5), where QFED2.4 trends down while the other three increase. It should be noted that an updated version of QFED (v2.5r1) does not show this decreasing trend in 2014. Globally and in CONUS, GFED4s, GFAS1.2, and QFED2.4 show similar interannual differences, while FINN1.5 shows the greatest interannual variability and different maximum and minimum years. We note that 2012 is a fairly typical fire year (see Fig. 5) and much of the following analysis will focus on this year.
We also explore the seasonality of BC and OC emissions represented in the inventories for BONA, CONUS, and globally across the same 13 years (Fig. 6). The seasonality, including relative magnitude, is generally consistent across regions and species. Some seasonal features (e.g., the October–November enhancement in BONA and the springtime enhancement in CONUS) are only visible in the three inventories that rely on active fire counts or FRP – FINN1.5, QFED2.4, and GFAS1.2 – which is consistent with work suggesting that these methodologies pick up small fires better than GFED4s (Kaiser et al., 2012). The fall peak in the boreal region is driven by fires in eastern British Columbia. The seasonal CONUS springtime peak is primarily associated with small fires (as identified in GFED4s), likely linked to agricultural and prescribed burns in the southeastern US.
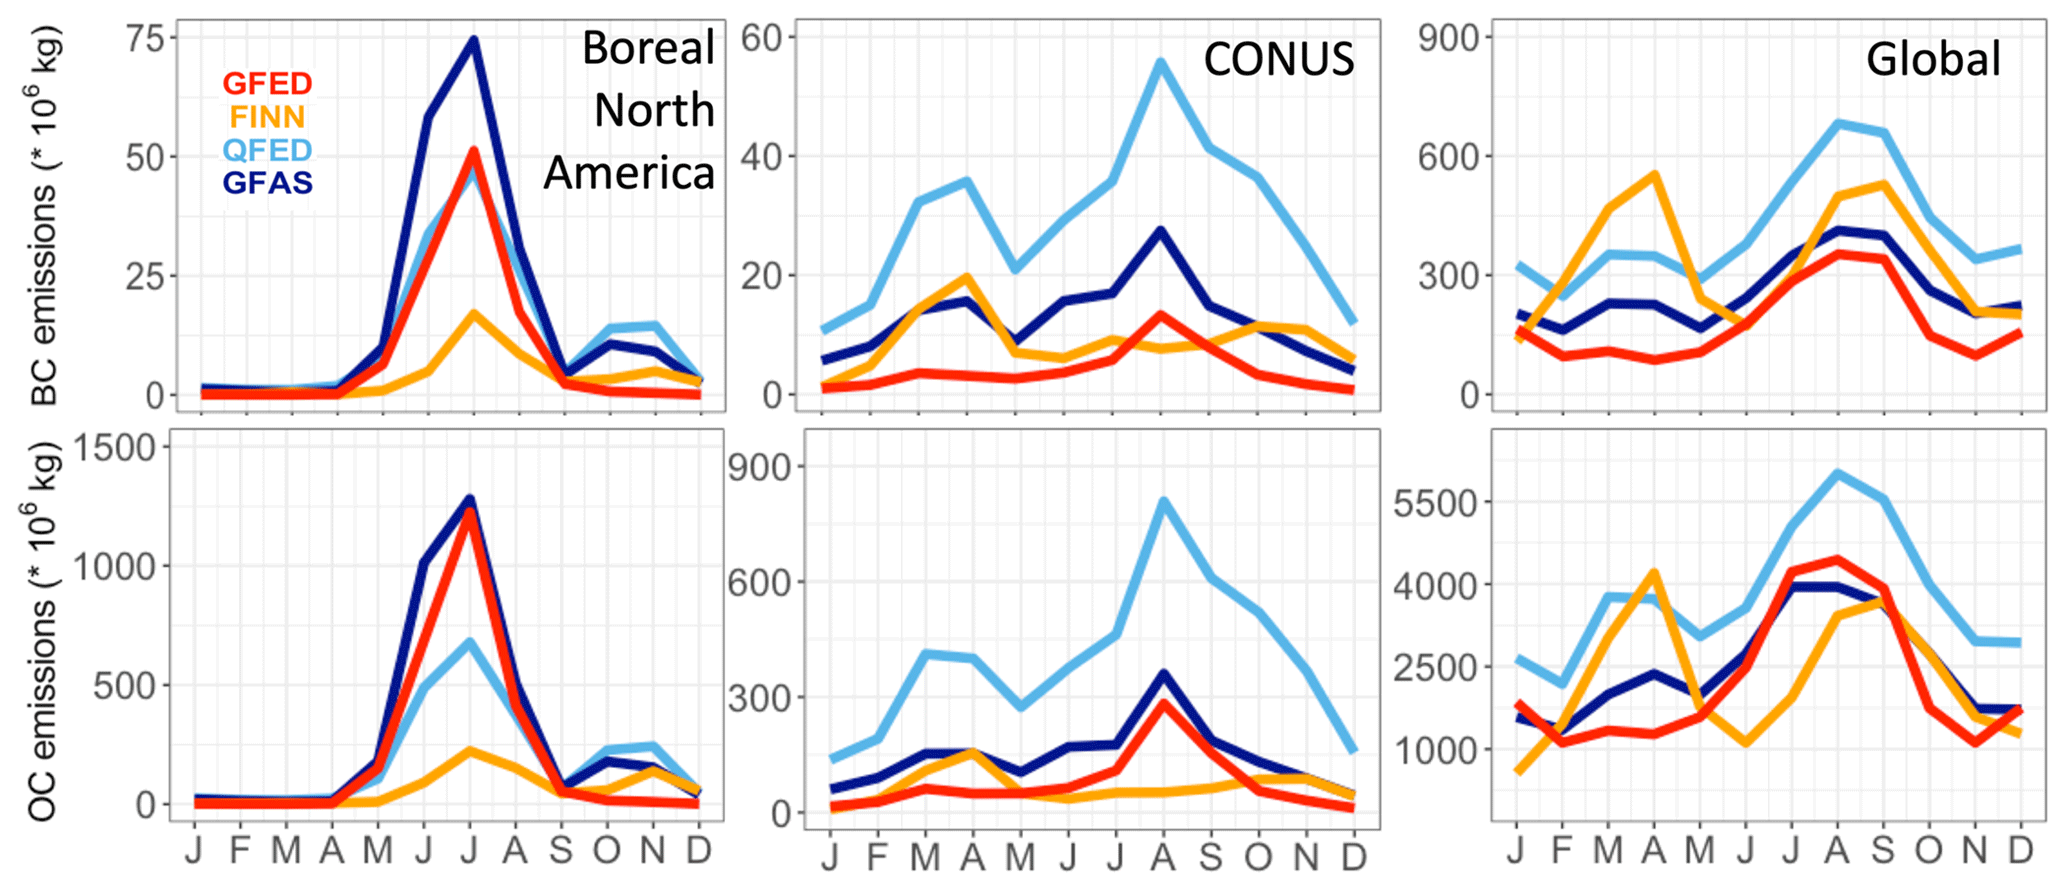
Figure 6Seasonal mean BC and OC emissions from 2004 to 2016 for boreal North America, CONUS, and the globe. GFED4s emissions are in red, FINN1.5 emissions are in orange, QFED2.4 emissions are in light blue, and GFAS1.2 emissions are in dark blue.
Given the large range in fire emissions, we use observations to try to assess which (if any) inventory is most realistic. We use IMPROVE surface observations and two airborne campaigns to compare with model simulations driven by each inventory. As another constraint on aerosol abundance, we also compare model AOD with MODIS-observed AOD in North America.

Figure 7The 2012 monthly comparison of simulated and observed median surface concentrations at IMPROVE sites in CONUS split between east and west at −104∘ W longitude. Observations in black are compared with concentrations simulated using GFED4s in red, FINN1.5 in orange, QFED2.4 in light blue, GFAS1.2 in dark blue, and a simulation with no biomass burning (noBB) in gray. Error bars show the 25th to 75th percentile range of observations. Note the different scales among panels.
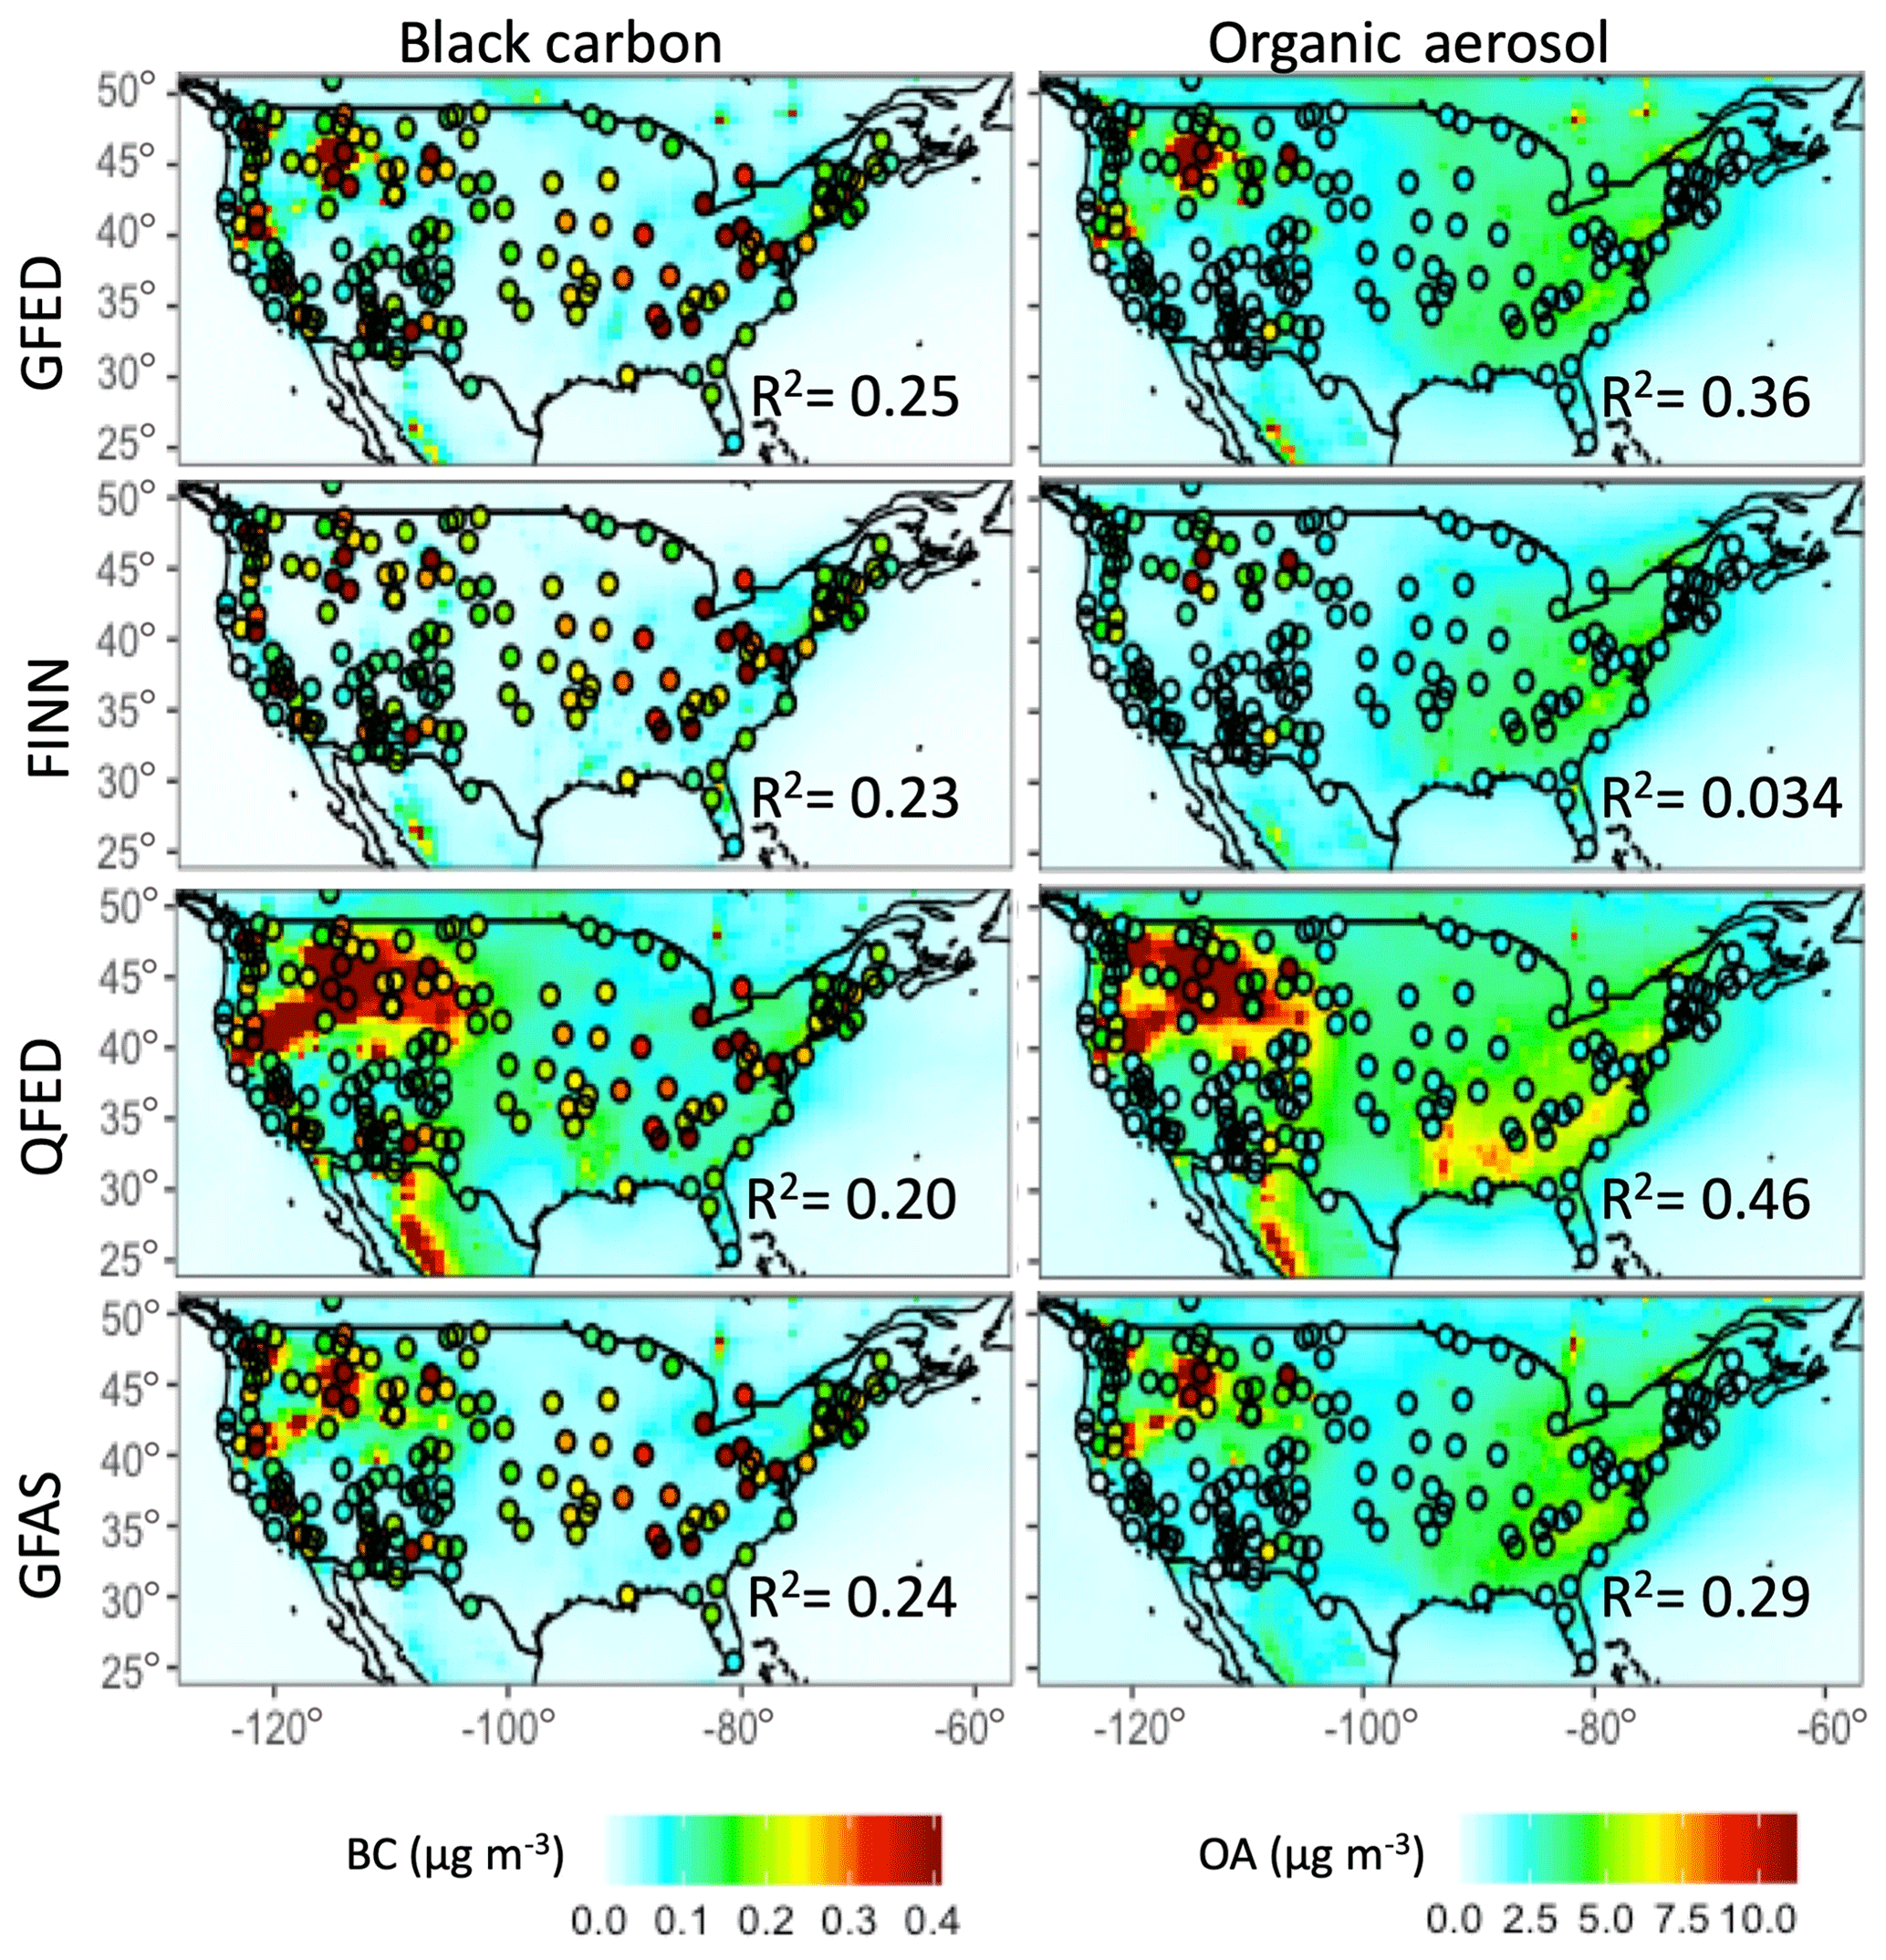
Figure 8Fire season (May–September) 2012 mean surface BC and OA concentrations in CONUS with the model driven by each inventory. The circles show the mean observed surface concentrations at IMPROVE sites.
We test the model against IMPROVE observations of surface concentrations across the US and find significant variation in model skill across the inventories with QFED2.4 generally biased high and FINN1.5 low (Figs. 7 and 8). Seasonal comparisons of IMPROVE surface concentrations with simulated concentrations driven by the four different inventories show similar patterns across aerosol species but significant differences between the western and eastern US (Fig. 7). This is likely related to how well the inventories capture the differences in burning regimes in the western (predominantly wildfires) and eastern (mostly prescribed and agricultural burns) US (Brey et al., 2018). The southeastern US in particular is of interest to the public health and policy communities because a prevalence of agricultural and prescribed burning there, which dominates burned surface area (Nowell et al., 2018), may have a stronger impact on low-altitude air quality in a relative sense than large wildfires that inject higher into the air. We also analyze the western and eastern US separately because in the east the magnitude of fire emissions is lower and BC is particularly dominated by anthropogenic sources. In the western US, GFED4s, and GFAS1.2-driven concentrations of both BC and OA match the seasonality and magnitude of IMPROVE observations well. QFED2.4 is biased high, particularly during the peak in the wildfire season (August–September). FINN1.5-based concentrations are biased low and are virtually indistinguishable from simulations with no BB. In the eastern US, because fire is a smaller relative source of carbonaceous aerosol, there is less of a spread between the simulations. All inventories other than QFED2.4 do a reasonable job capturing observations with a general tendency for simulated BC and OA to be a bit too high, suggesting an overestimate in anthropogenic emissions in the eastern US. However, the 25th to 75th percentile bars on the observations show that, across the US for BC and in the west for OA, virtually all the simulations fall within this range of the measurements. QFED2.4 overestimates OA well beyond the 25th to 75th percentile range in the eastern US, starting with the Northern Hemispheric wildfire season in May and continuing the overestimate through the end of the calendar year.
Figure 8 illustrates the ability of these simulations to capture the spatial distribution of observed surface concentrations during the fire season (May–September). Similar skill is seen across both aerosol species for GFED4s and GFAS1.2 (R2 for BC, 0.25 and 0.24, respectively, and for OA, 0.36 and 0.29, respectively), but FINN1.5 matches observed BC somewhat better than OA (R2 of 0.23 and 0.034, respectively) and QFED2.4 matches OA somewhat better than BC (R2 of 0.46 versus 0.20). Consistent with the seasonal IMPROVE analysis, simulations driven by GFED4s, QFED2.4, and GFAS1.2 have greater skill in the western US than the eastern US, while the FINN1.5-driven simulation performs better in the east. QFED2.4 is generally biased high, especially in the Pacific Northwest and, to some extent, in the southeastern US. However, QFED2.4 also has the highest skill in reproducing the spatial patterns of the highest concentrations when compared against the 95th percentile of observed concentrations (not shown).
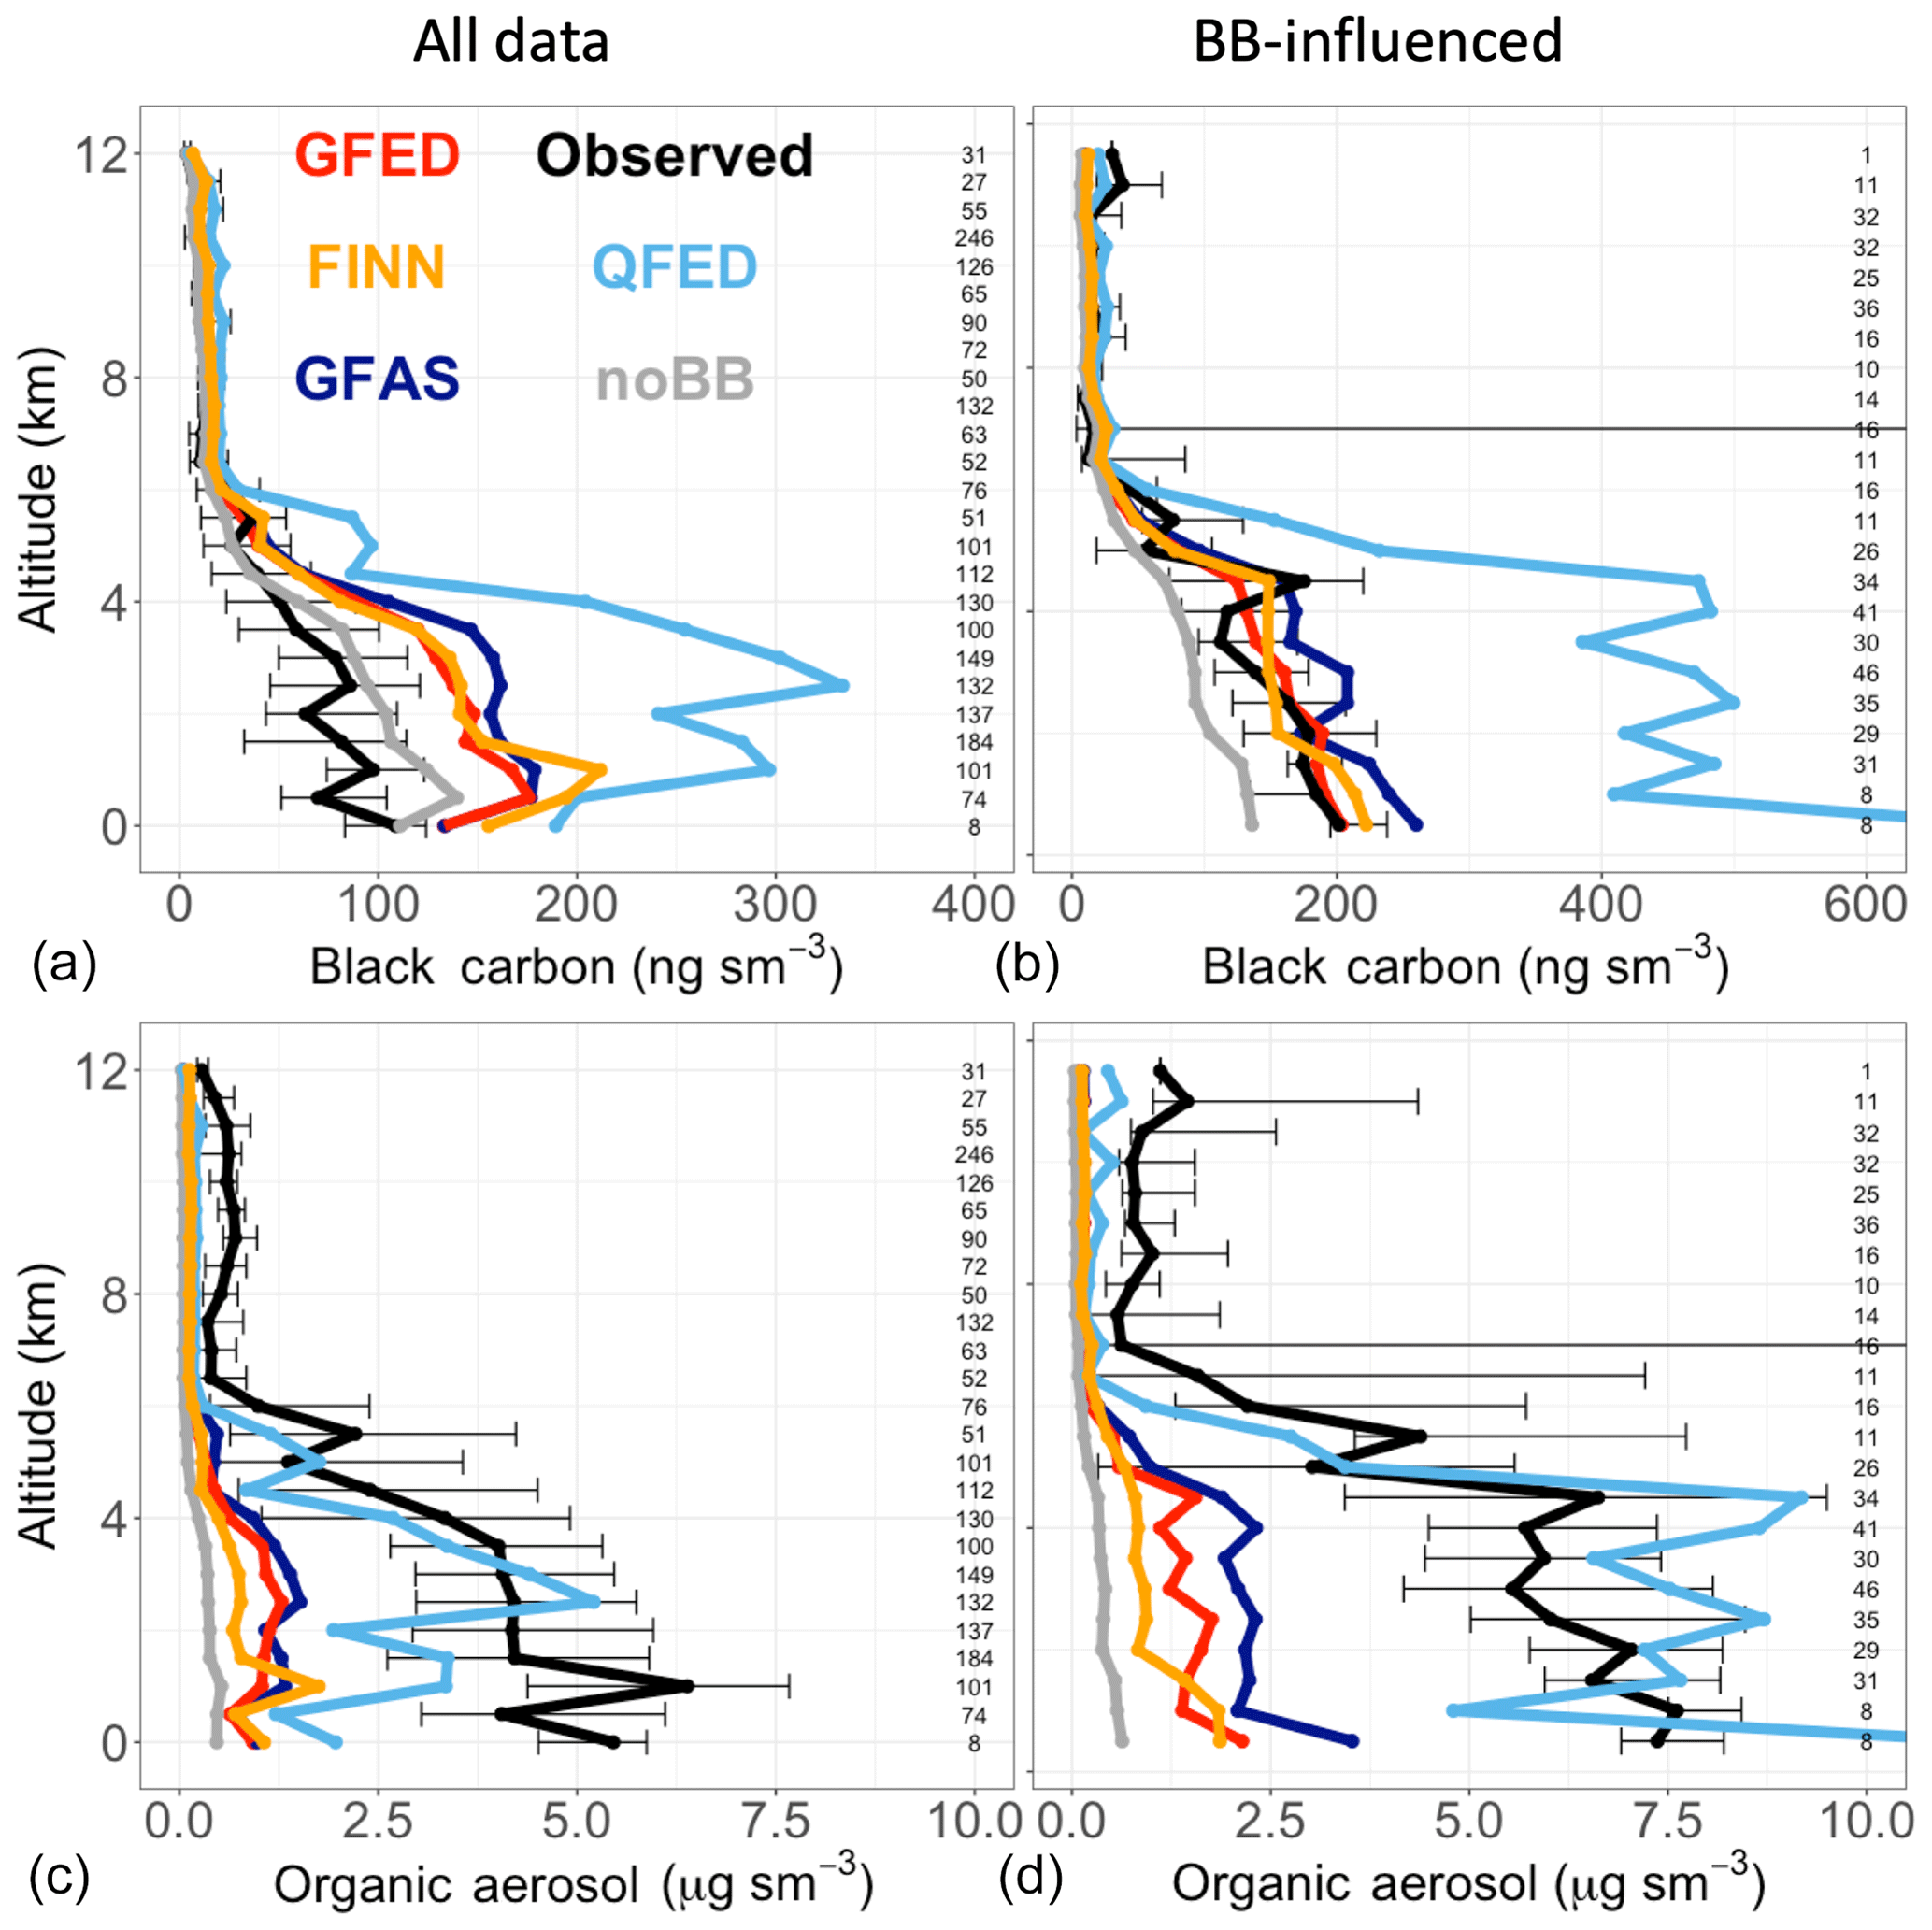
Figure 9The median vertical profiles of BC and OA mass concentrations (shown in 0.5 km bins) from the DC3 campaign. Observations (black) are compared with simulations using the four fire inventories – GFED4s (red), FINN1.5 (orange), QFED2.4 (light blue), and GFAS1.2 (dark blue) – and a simulation with no fire emissions (noBB) in gray. Error bars show the 25th–75th percentile range of measurements averaged in each vertical bin. The number of observations in each bin is given on the right side of each panel. Panels (a, c) show total results for the campaign. Panels (b, d) show results filtered for the top 25th percentile of observed acetonitrile. Note the different scale between BC panels.
The ability of models to accurately represent aerosol concentrations aloft is also important for both air quality and climate, and we use two fire-influenced aircraft campaigns, DC3 and ARCTAS, to explore the model skill in this dimension. These campaigns provide observations from two very different fire regimes across North America (see Sect. 2.3) – DC3 in the central and southeastern US and a subset of ARCTAS focusing on boreal Canada. In addition to median vertical profiles for both BC and OA for each campaign, we also show median vertical profiles filtered by the top 25th percentile of acetonitrile (equivalent to a concentration cutoff of 167 ppt for DC3 and 213 ppt for boreal ARCTAS), a useful BB tracer that allows us to investigate the most BB-influenced data.
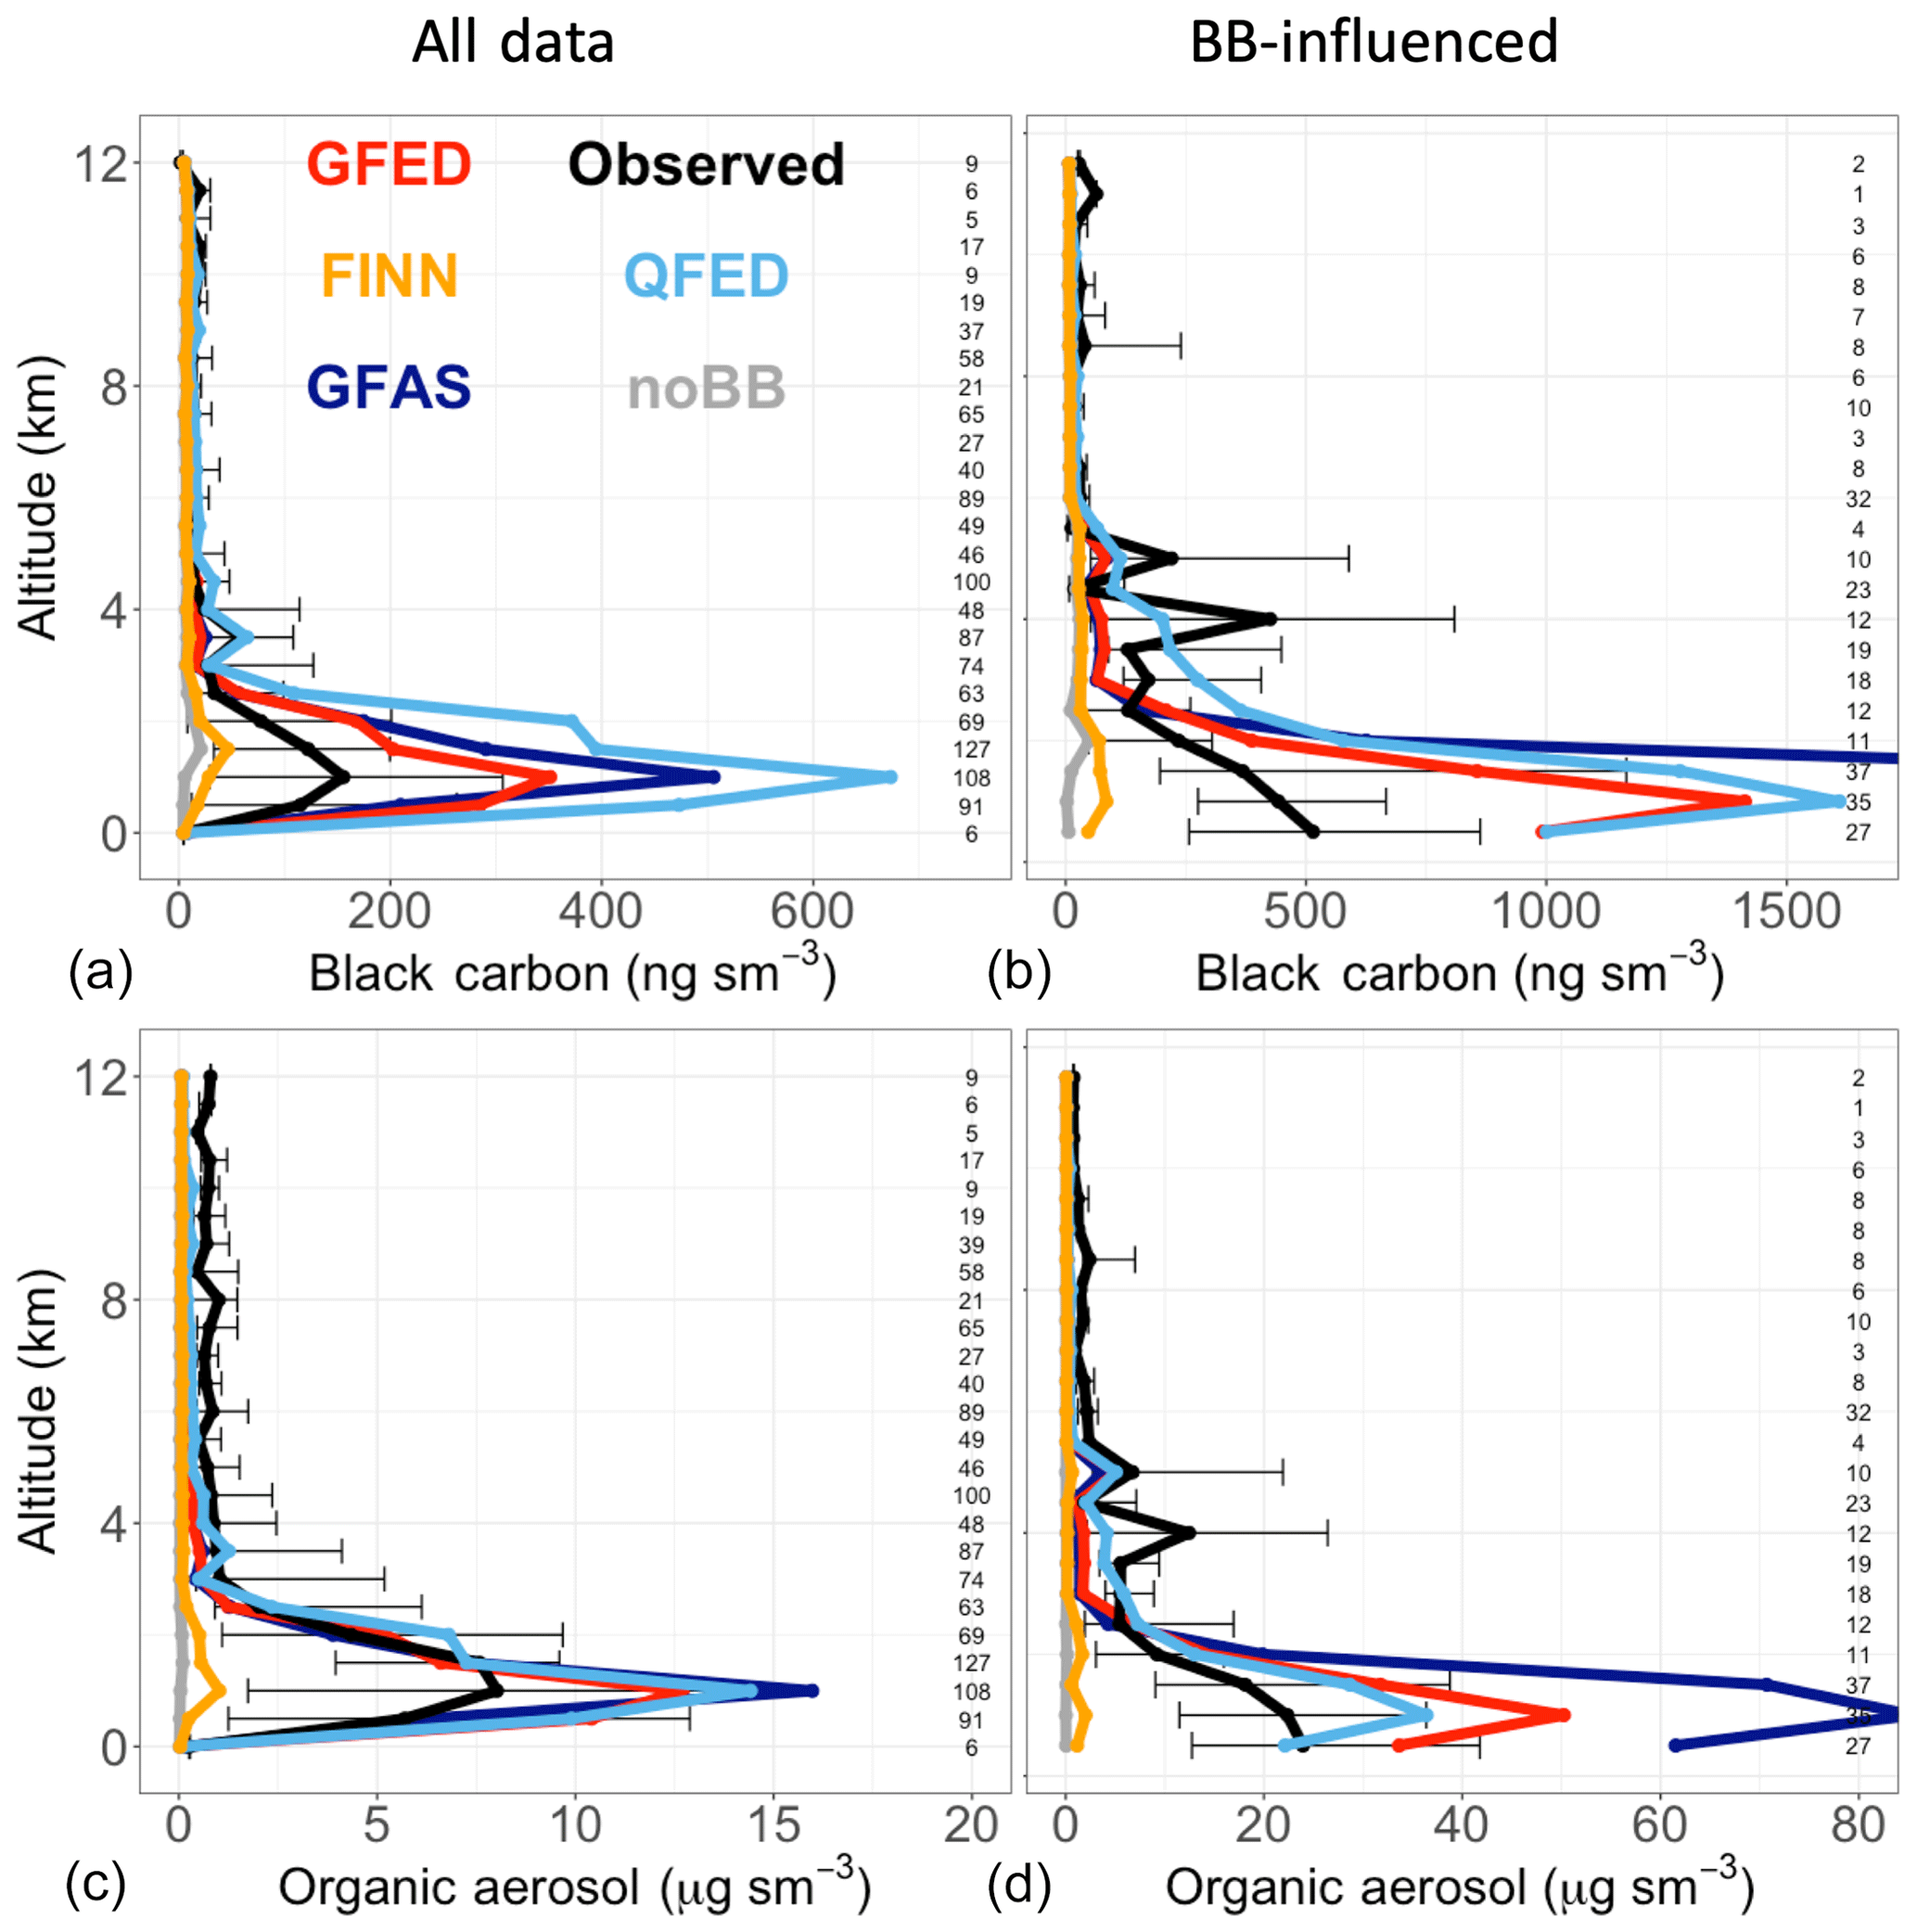
Figure 10The median vertical profiles of BC and OA mass concentrations (shown in 0.5 km bins) from the boreal part of the ARCTAS campaign. Observations (black) are compared with simulations using the four fire inventories – GFED4s (red), FINN1.5 (orange), QFED2.4 (light blue), and GFAS1.2 (dark blue) – and a simulation with no fire emissions (noBB) in gray. Error bars show the 25th–75th percentile range of measurements averaged in each vertical bin. The number of observations in each bin is given on the right side of each panel. Panels (a, c) show total results for the campaign. Panels (b, d) show results filtered for the top 25th percentile of observed acetonitrile. Note the different scale among panels.
We find that concentrations driven by the various inventories perform somewhat differently against each of the campaigns (Figs. 9 and 10). Across both campaigns, QFED2.4-driven modeled concentrations are generally biased high, particularly towards the surface, while FINN1.5 simulations are nearly always biased low (Figs. 9 and 10). QFED2.4 has been constrained to observed AOD, so one could assume that it would perform best. We find that after adjusting the QFED2.4 emissions downward to account for our different OM : OC ratio, QFED2.4 simulations of OA do match observed concentrations fairly well; however, BC concentrations remain much too high. This suggests that the QFED2.4 biome-specific adjustment factors should not be applied to BC and that the scaling factor applied in this inventory to match AOD constraints may be accounting for errors in other properties (i.e., optical properties or background aerosol) and not fire emissions. This is consistent with recent work showing that even when observed and modeled concentrations agree in the Amazon, observed and modeled AOD sometimes do not (Reddington et al., 2019). Over the continental US (Fig. 9), QFED2.4 emissions result in the highest concentrations of OA and BC; however, in the boreal region (Fig. 10), simulations driven by GFAS1.2 (as well as GFED4s to a lesser extent) produce more smoke than QFED2.4, consistent with the relative emissions magnitudes shown for these regions in Figs. 2 and 5. As a result, both GFAS1.2 and GFED4s significantly overestimate both BC and OA concentrations towards the surface in the boreal region.
In DC3, all four inventories (and even the noBB run) overestimate the BC median vertical profile, suggesting that anthropogenic emissions are overestimated in the southeastern US, consistent with the IMPROVE analysis. This is reinforced by the DC3 BC vertical profile filtered for fire influence where three of the inventories (GFED4s, FINN1.5, and GFAS1.2 to a lesser extent) match observations quite well. Similarly, in boreal ARCTAS, all the inventories, but FINN1.5 overestimate BC concentrations, especially towards the surface.
This analysis suggests that anthropogenic emissions of BC may be overestimated throughout the US, that the two FRP-based inventories and GFED4s (to some extent) may overestimate boreal emissions, and that FINN1.5 emissions are too low throughout but in boreal regions in particular. In concert with the analysis at IMPROVE sites, this indicates that GFED4s-driven simulations generally provide the best match to observations but with substantial underestimates and overestimates in some regions and species.
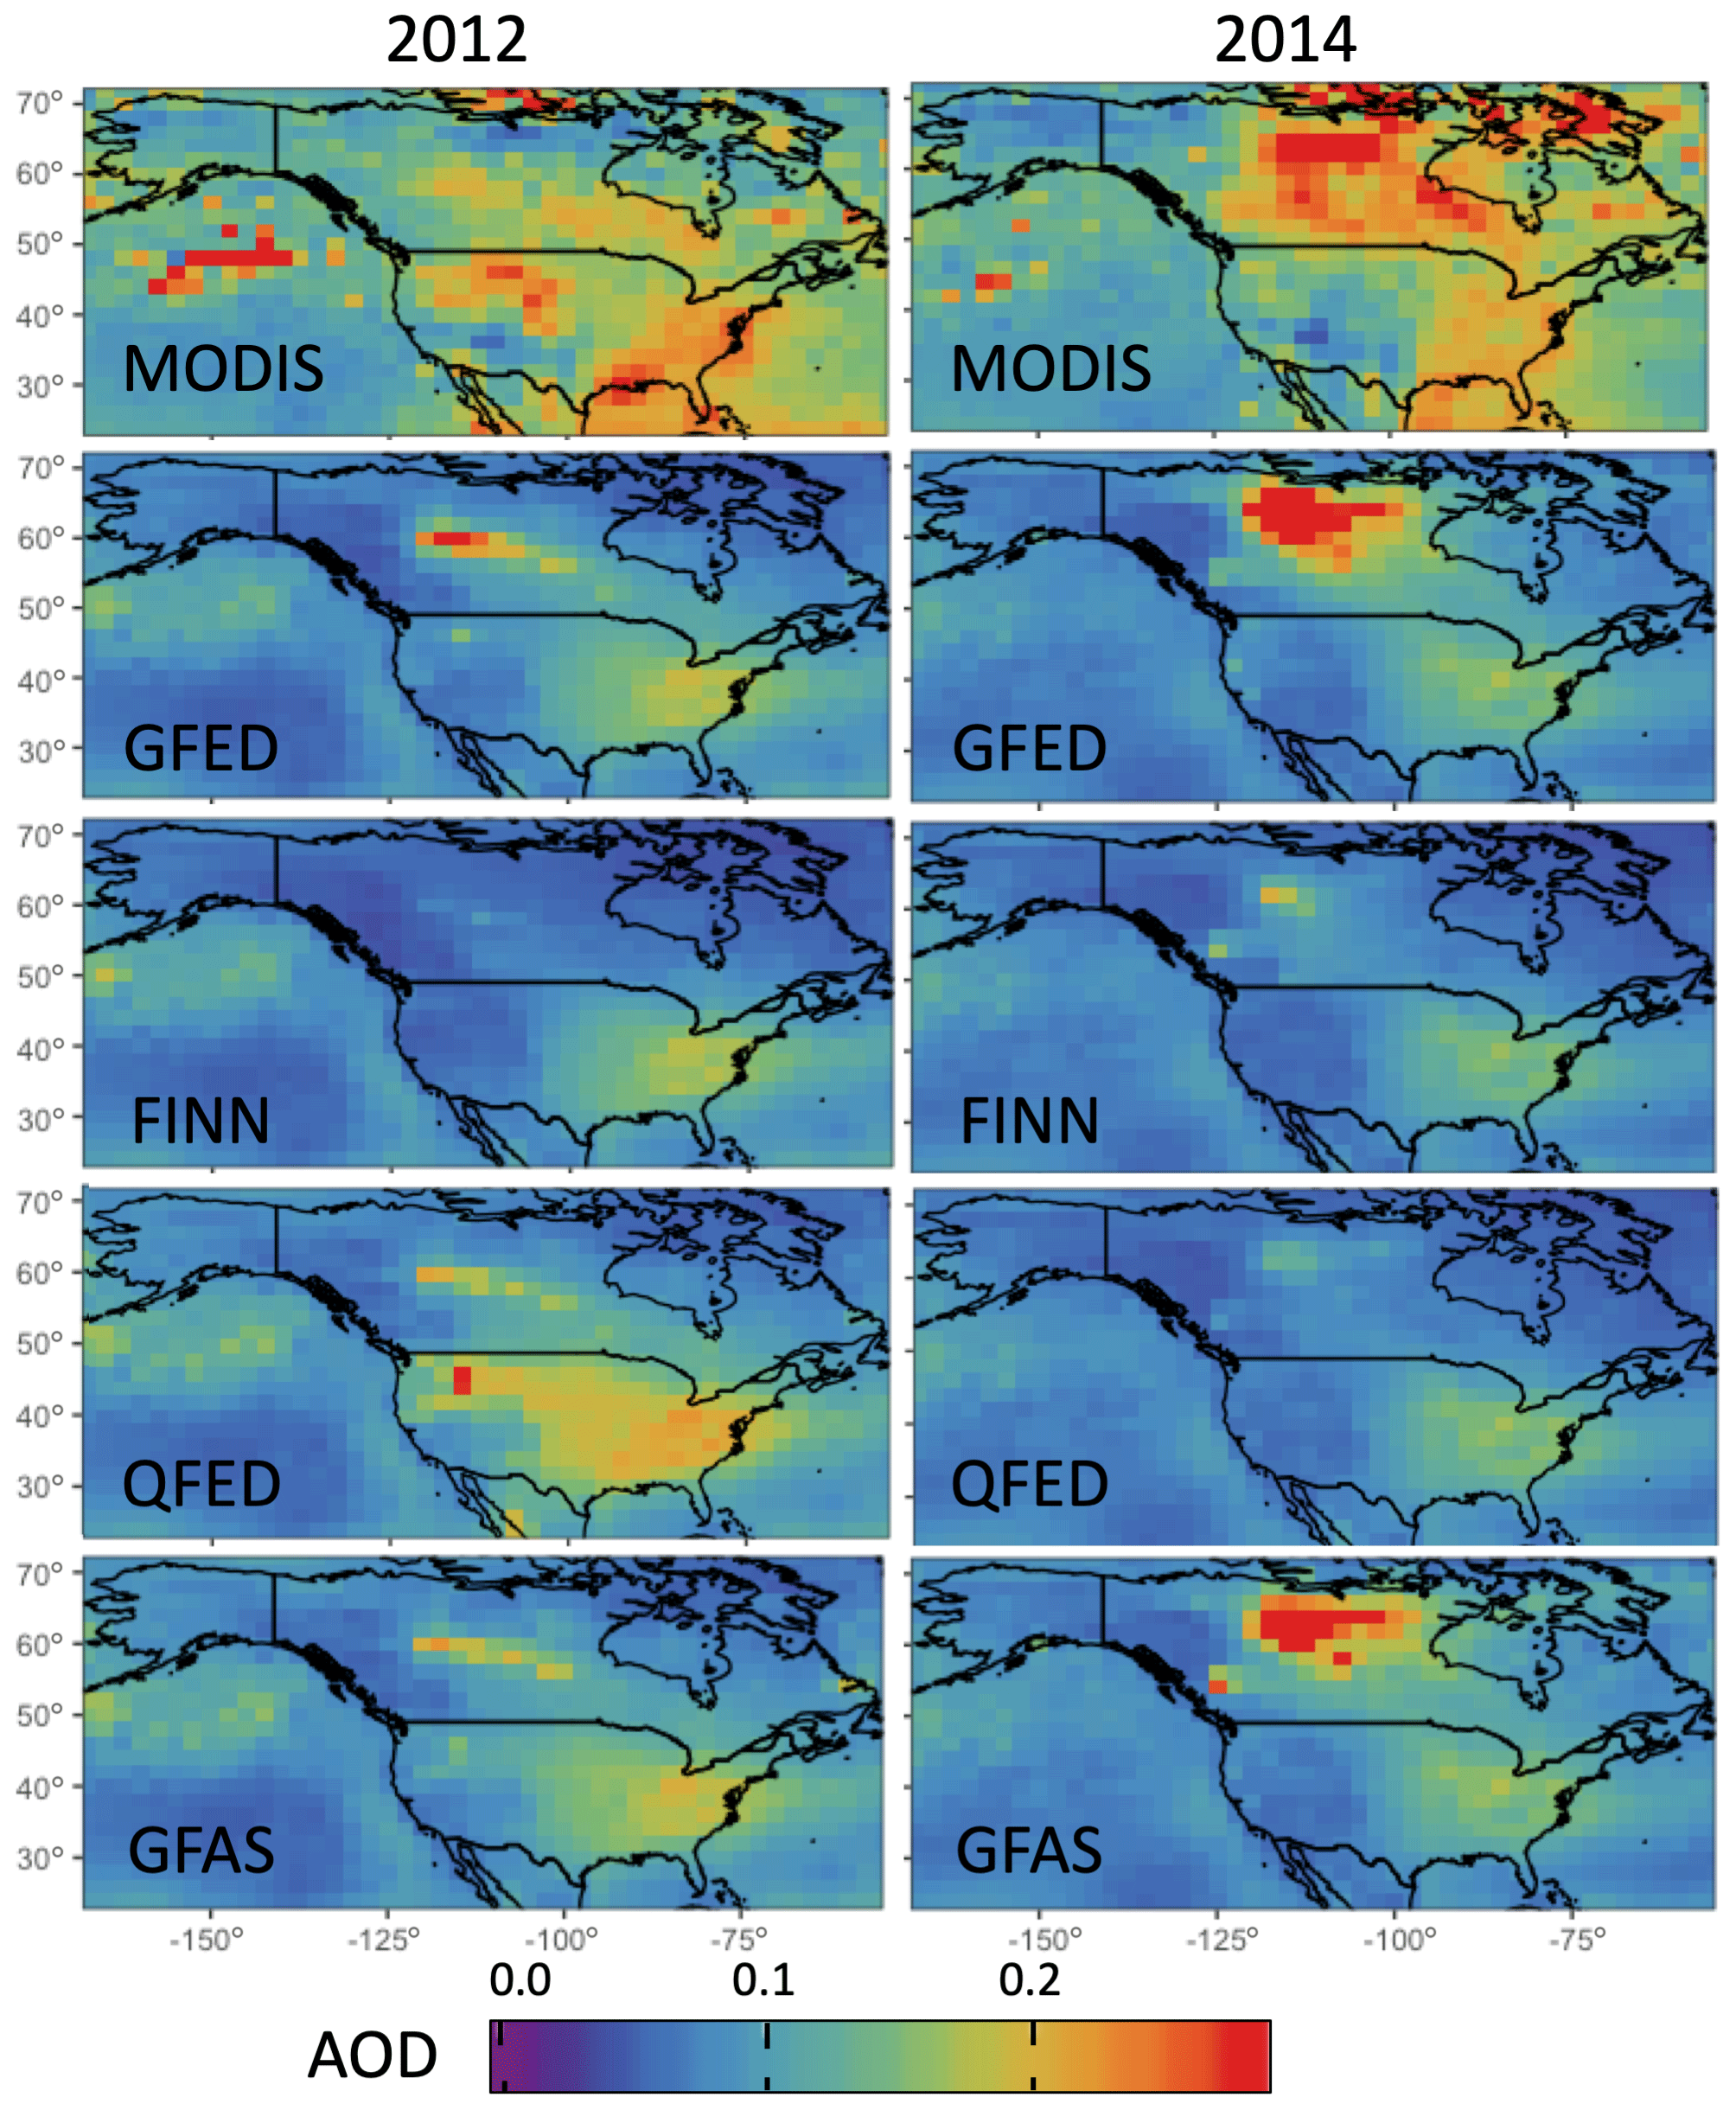
Figure 11The mean Northern Hemispheric fire season (May–September) simulated AOD at 550 nm sampled to and compared with daily MODIS-observed AOD from the Aqua satellite for 2012 and 2014.
Our comparisons with in situ mass concentrations, both at the surface and aloft, consistently suggest that the FINN1.5 inventory substantially underestimates fires over North America. Scaling relationships between fire activity and dry matter consumed should be revisited for this inventory for North American fuels. One likely cause of the underestimation of North American fires by FINN1.5 is that the MODIS Land Cover Type (LCT) data used to define burned ecosystems assigns shrubs where other classifications assign forest, leading to lower fuel-burned estimates. A second likely contributor to this underestimate is that the way in which burned area is calculated from active fire counts underestimates large wildfires, which is particularly relevant for the western US. This underestimation was also seen in earlier work by Pfister et al. (2011) using FINN1.5 to explore CO from fires in California.
Some of the disagreement aloft with the baseline model across inventories may be related to the model failure to capture injection heights for some fires that loft aerosols above the boundary layer. This is not represented in the simulations shown here, but typical approaches put too much aerosol at the top of boundary layer (∼2 km) (Zhu et al., 2018) (see Fig. S3 for an injection height sensitivity test). It is also worth noting that sampling in the DC3 campaign was biased towards convective outflow given campaign goals, and it is possible that the model may also have errors in convection and convective removal.
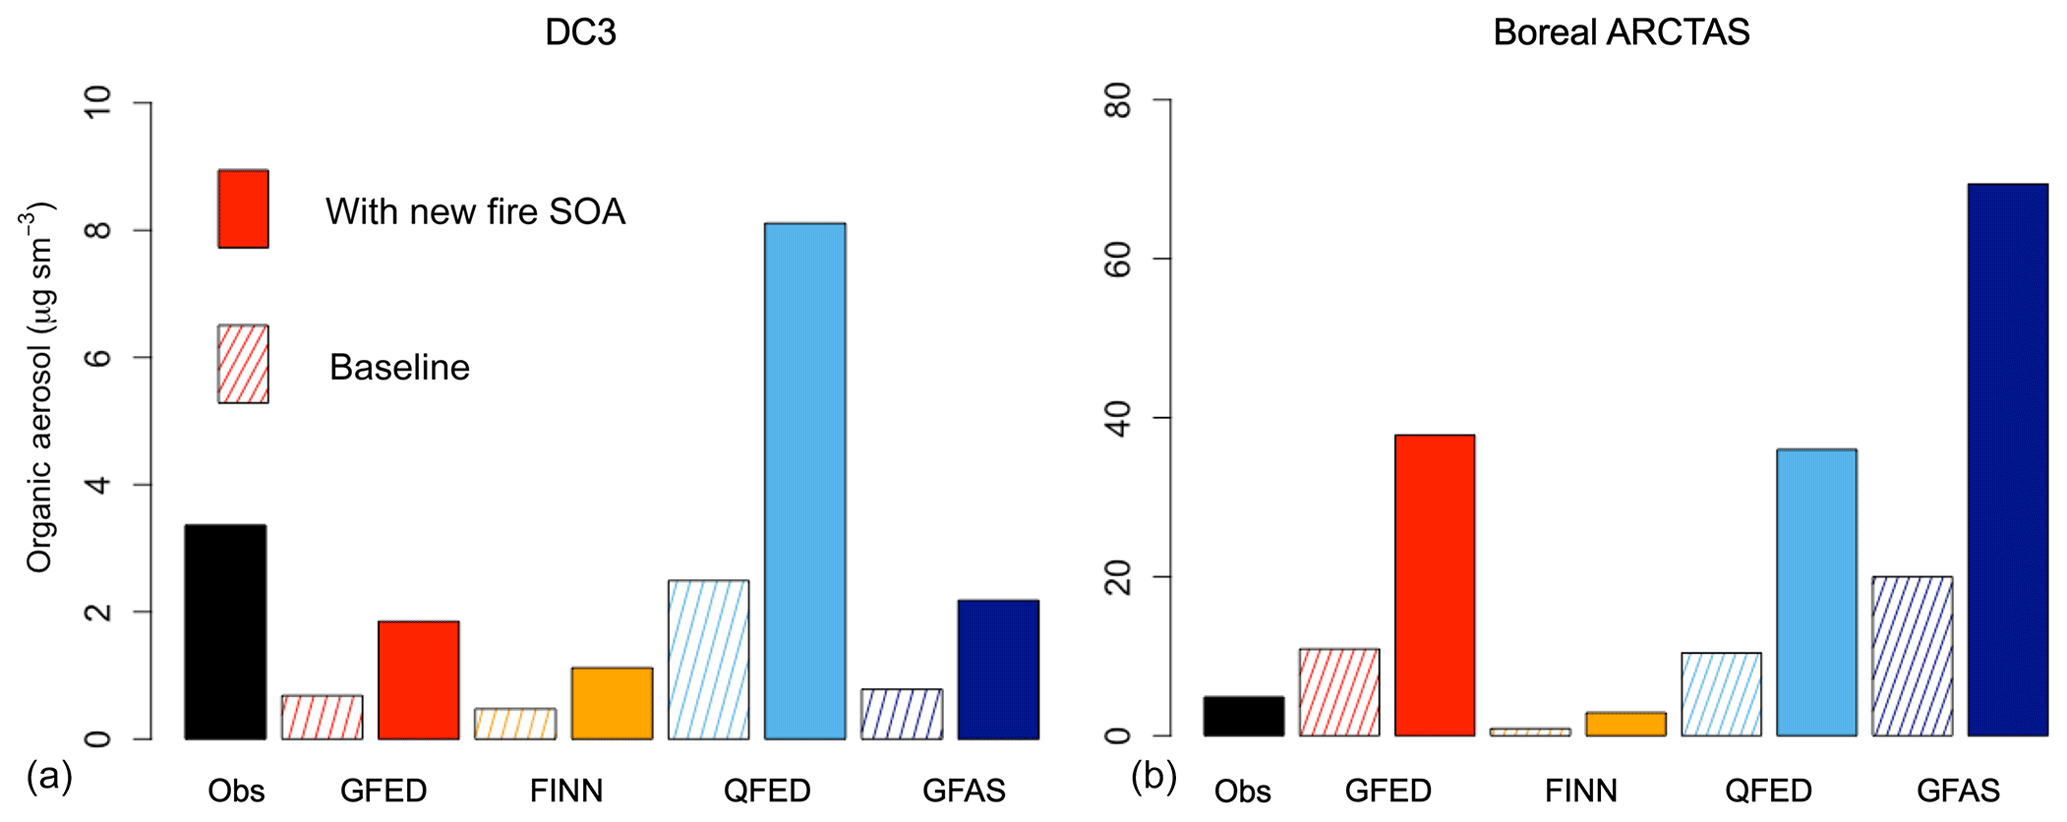
Figure 12Bar plots of mean OA mass concentrations from the DC3 (a) and boreal ARCTAS (b) campaigns. Observations (black) are compared with simulations using the four fire inventories: GFED4s (red), FINN1.5 (orange), QFED2.4 (light blue), and GFAS1.2 (dark blue). The hatched version of each inventory denotes OA mass concentrations using the baseline fire SOA scheme while the full color of each shows OA with the new SOA from fire parameterization.
Figure 11 shows the spatial distribution of average AOD over North America during the Northern Hemispheric fire season (May–September) in both 2012 and 2014 compared to MODIS-observed AOD. In general, the model simulation underestimates observed AOD, which may result from a combination of errors in model optics, background aerosol, or cloud contamination in the MODIS product. We note that Reddington et al. (2019) similarly show that their model underestimates AOD, even when it captures the observed mass concentrations of PM over the Amazon. Here we focus on the fire-driven AOD features. Across both years, FINN1.5 AOD is low compared to MODIS in CONUS and does not capture the fires in BONA. GFED4s and GFAS1.2-driven AOD look quite similar to each other across years and include the large fire signatures in BONA that MODIS observes. AOD driven by QFED2.4 identifies the boreal (and potentially Pacific Northwest) fire signatures in 2012 but misses the large boreal hot spot in 2014 that is evident in both MODIS-observed and GFED4s and GFAS1.2 AOD.
Previous simulations in Sect. 4 included the GEOS-Chem default minor source of SOA from fires. The recent NOAA Fire Lab 2016 experiment (Lim et al., 2019) reported large increases in OA mass when fire emissions were oxidatively aged, as have many other laboratory studies. However, this has not been observed in the majority of field campaigns (see Sect. 1). While uncertainties in this potential source of additional OA mass are large, we test the sensitivity of our results to this additional source. The default scheme – (0.013 times CO emissions) (Kim et al., 2015; Cubison et al., 2011) – results in a mean annual global source of BB SOA (∼5 Tg yr−1) from GFED4s, which is at the lower range of potential annual global fire SOA source amounts reported in Shrivastava et al. (2017). We implement a new parameterization from the NOAA Fire Lab 2016 lab studies for SOA production from BB based on Lim et al. (2019) (2.48 times POA emissions). This new scheme produces a mean annual global GFED4s source of BB SOA of ∼41 Tg yr−1, which is roughly in the middle of estimates reported in Shrivastava et al. (2017). In principle, such a large additional source of OA should be distinguishable from observations. However, our previous analysis using the default scheme demonstrates that the range in estimated POA is so large that it is challenging to say how much additional OA mass from SOA from BB would be consistent with the observations. In particular, even with negligible SOA, the model already matches observed OA with at least one inventory (QFED2.4). With this new parameterization, we show a roughly order of magnitude increase in the BB SOA burden (and thus more than a doubling of total OA) from GFED4s in 2012 with similar increases across the other inventories. Figure 12 shows how this new SOA impacts model–observation agreement with the DC3 and ARCTAS campaigns. The QFED2.4 simulations now overestimate OA across campaigns while FINN1.5 simulations improve against observations modestly, consistent with its smaller BB OA burdens to start with. It is possible that the AOD-based scaling of QFED2.4 emissions previously compensated for underestimated SOA. With the new SOA parametrization, GFED4s and GFAS1.2 simulations are better able to capture the magnitude of the mean concentrations observed during DC3. However, for boreal ARCTAS, GFED4s and GFAS1.2-driven simulations with the default scheme captured observed OA concentrations and were indeed overestimated (Fig. 10); thus, this new large source of fire SOA exacerbates this overestimate. Our analysis of observations over North America can neither preclude nor confirm the presence of a large source of SOA from fires, given the uncertainty in POA emissions over the region. This additional SOA source is not included in the assessment of air quality and radiative impacts of fires in Sects. 6 and 7.
We next explore how uncertainty in fire emissions affects estimates of air quality impacts. We show the differences in fire PM2.5 (calculated as the sum of the BB-only BC and OA mass fractions for aerosol under 2.5 µm) exposure spatially (Fig. S5) and quantify the range in population-weighted fire PM2.5 exposure in 2012 across North America (Canada and CONUS only) given by the four inventories. We calculate fire PM2.5 exposure by averaging surface concentrations of the sum of BC and OA from BB across North America in 2012. We then calculate population-weighted annual fire PM2.5 for each inventory by using population data from the Gridded Population of the World, Version 4 (GPWv4), created by the Center for International Earth Science Information Network (CIESIN, 2018) and available from the Socioeconomic Data and Applications Center (SEDAC) (https://sedac.ciesin.columbia.edu/data/collection/gpw-v4, last access: 6 February 2019). We linearly interpolate the gridded UN-adjusted population count dataset, which has a native resolution of 30 arcsec and provides population estimates for 2000, 2005, 2010, 2015, and 2020, to 2012 and grid the data to the GEOS-Chem nested grid (0.5∘×0.625∘). Figure 13 shows that the range in BBA emissions carries forward to uncertainty in 2012 North America fire annual mean PM2.5 exposure with a range of 0.5–1.6 µg m−3. The World Health Organization (WHO) air quality guidelines for annual mean PM2.5 are 10 µg m−3, and the US EPA annual standard for PM2.5 is 12 µg m−3. Thus, the range in fire PM2.5 exposure across the inventories in North America is equivalent to roughly 10 % of these air quality standards. The population-weighted mean PM2.5 exposure due to fires in North America varies by about a factor of two between different years, reflecting the location and intensity of different fire events (see Figs. S6 and S7 for an analysis of 2012–2014 at 2∘×2.5∘).

Figure 13Bar plots of the 2012 annual mean population-weighted fire PM2.5 exposure across the four inventories (GFED4s in red, FINN1.5 in orange, QFED2.4 in light blue, and GFAS1.2 in dark blue) across North America (Canada and CONUS only) at nested resolution. See Figure S6 for an analysis from 2012 to 2014 and for bar plots split out for Canada and the US at 2×2.5∘.
Because the 24 h average PM2.5 reflects acute exposure, we also looked at the differences in this metric when driven by each inventory. Over the US, the simulated daily PM2.5 from fires in 2012 ranges up to 1778 µg m−3 as simulated by QFED2.4 while FINN1.5-driven simulations show the smallest maximum BBA concentration at 55 µg m−3. A number of regions experience well over the PM2.5 daily standard (35 µg m−3) due to fires alone on more than 10 d a year, and in some locations this occurs for several weeks (see Fig. S8), highlighting smoke as a major cause for air quality degradation in the US. These regions and the magnitudes of daily fire influence are highly variable year to year.
Across North America and globally, we compare the mean annual top-of-atmosphere (TOA) all-sky DRE of BB-only BC and OA driven by each of the inventories with the OA DRF reported in the Fifth Assessment Report (AR5) of the Intergovernmental Panel on Climate Change (IPCC). We quantify the annual mean BBA DRE in 2012 (Fig. 14) and the Northern Hemispheric fire season (May–September) average DRE in each year from 2012 to 2014 (Fig. S9) to investigate interannual variability. The differences across inventories seen in the sections above translate to the large ranges in DRE estimated for BONA and CONUS with smaller but still significant ranges seen globally.
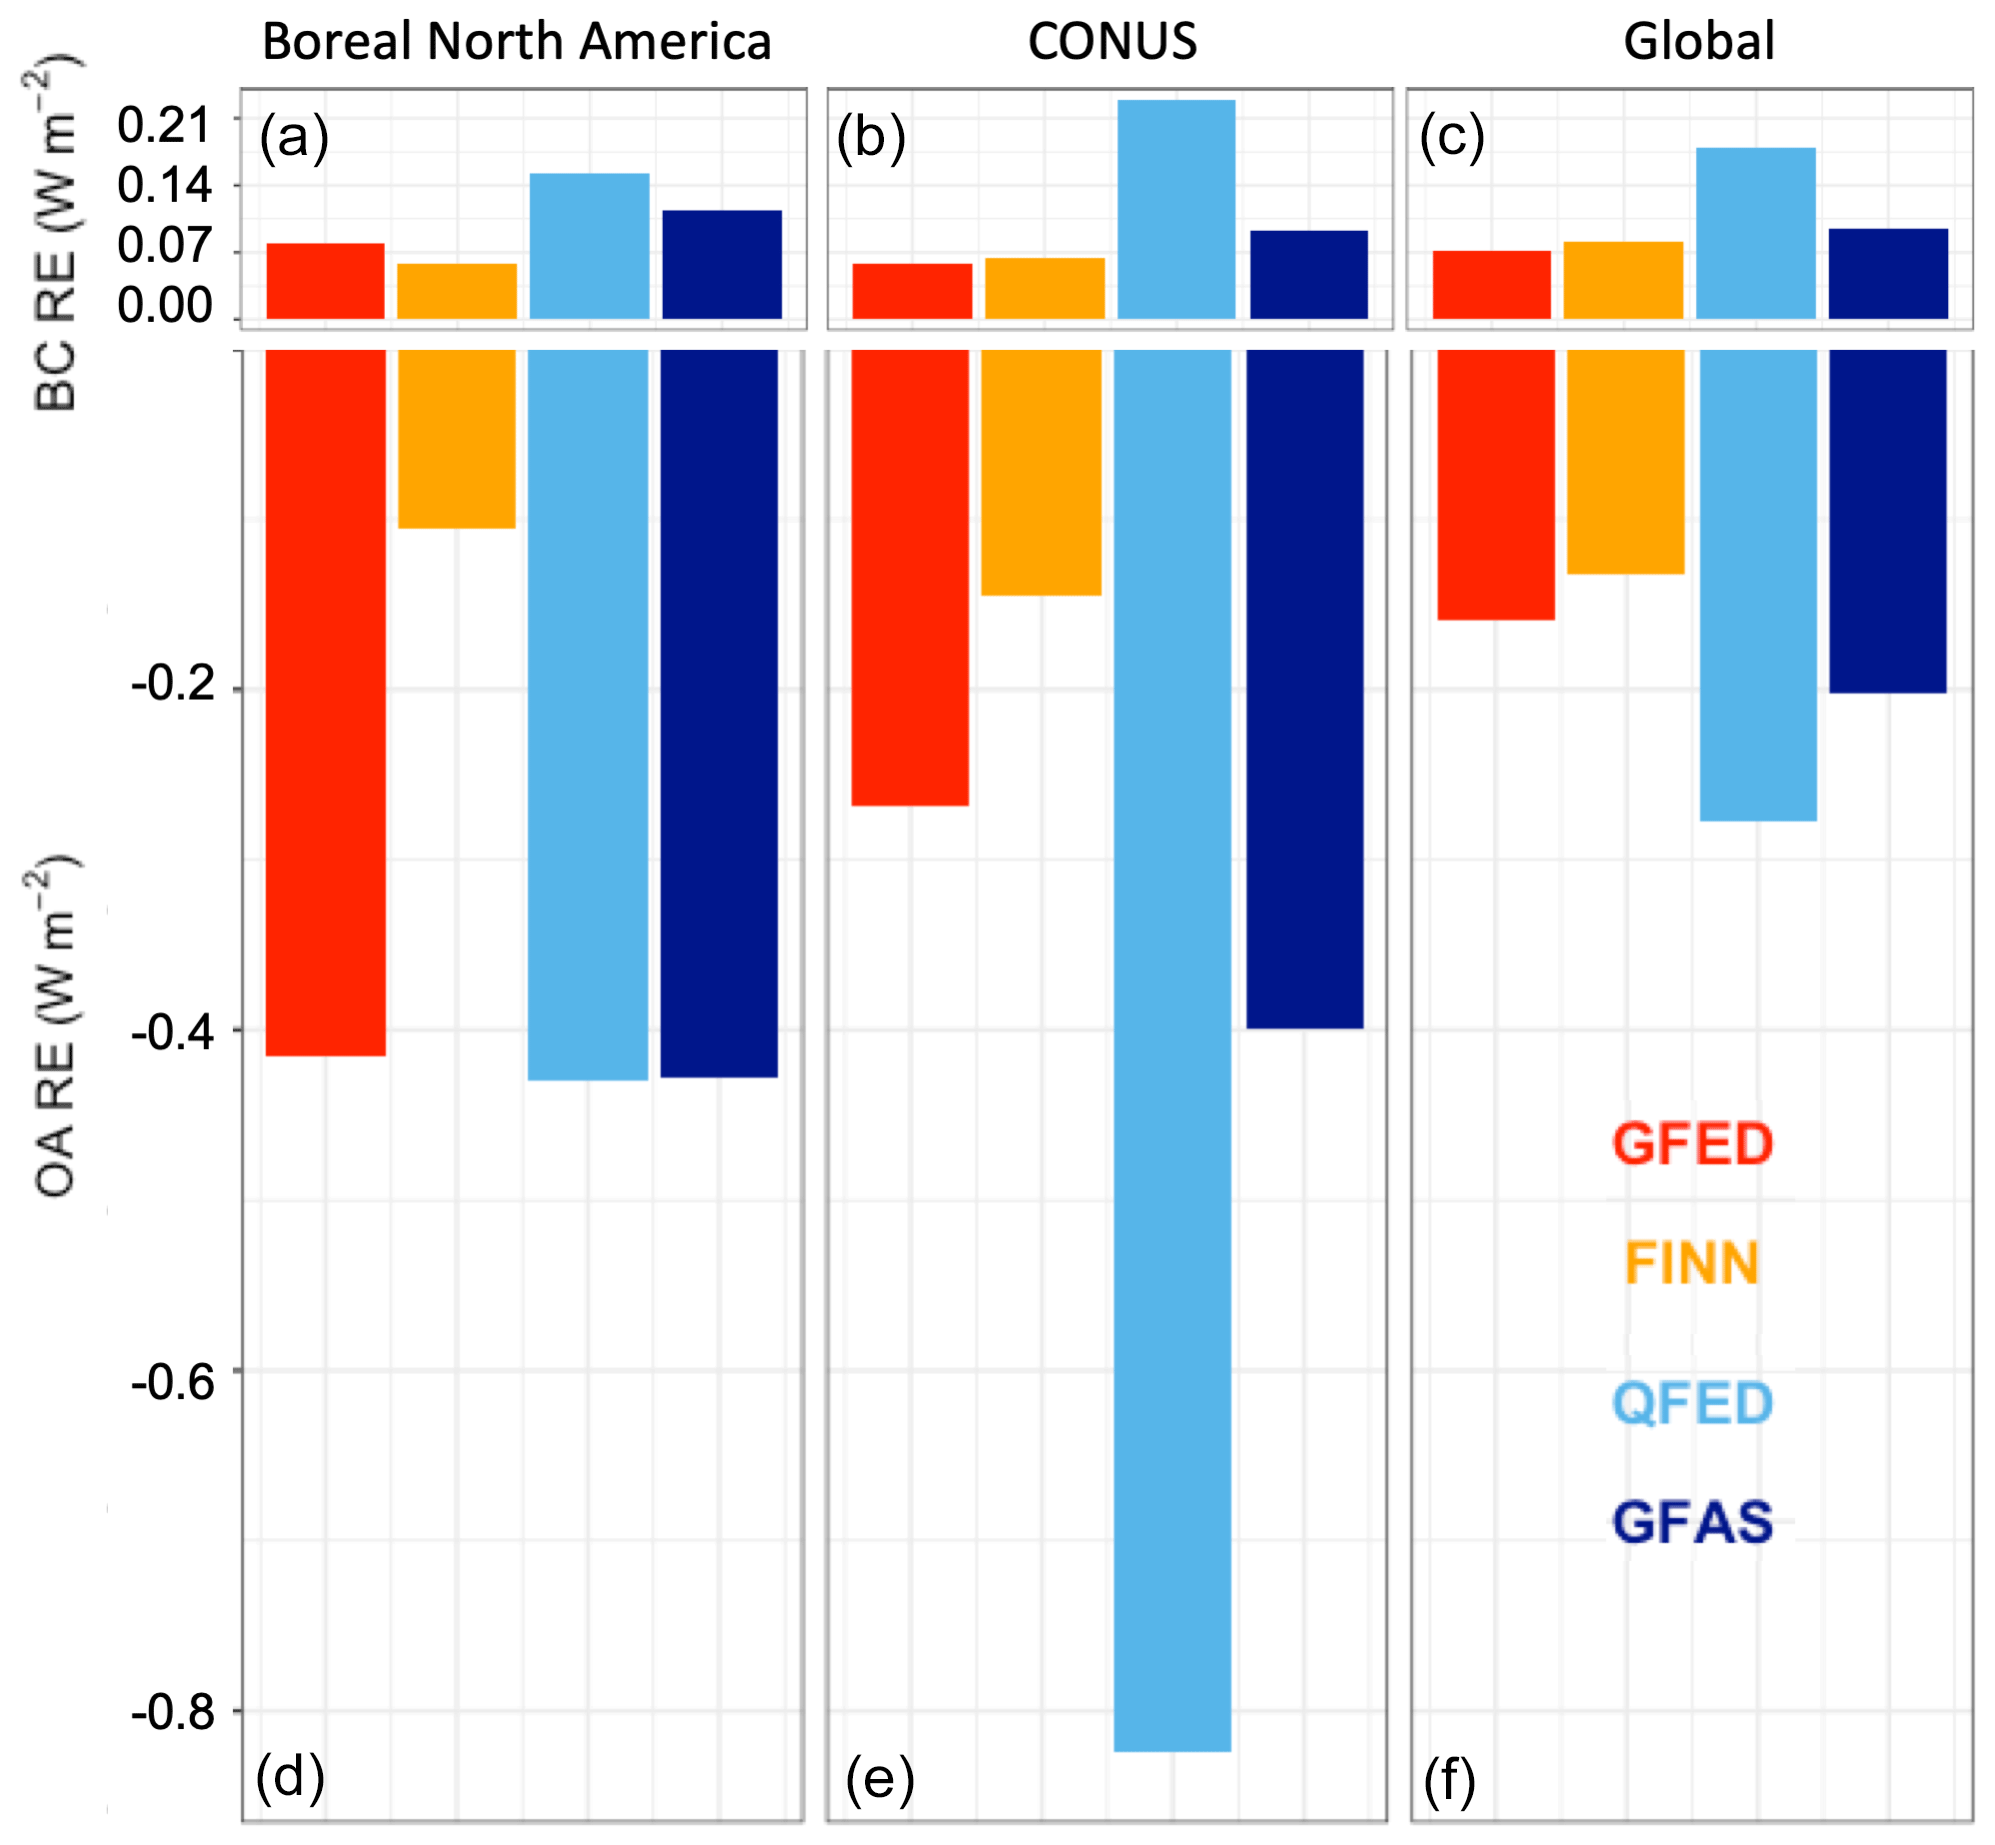
Figure 14Top-of-atmosphere all-sky direct radiative effect of BB-only BC (a–c) and OA (d–f) averaged over 2012 in BONA, CONUS, and globally. GFED4s is shown in red, FINN1.5 is orange, QFED2.4 is light blue, and GFAS1.2 is dark blue (the size of BC versus OA panels is not to scale).
For 2012, GFAS1.2-driven global DRE is largest in absolute magnitude for BBA (−0.11 W m−) with FINN1.5 being smallest (−0.048 W m−2) (see Table S1 in the Supplement for underlying values). These values are significantly more negative than previous estimates of BBA DRE, which ranged from −0.01 to 0.13 W m−2 (Rap et al., 2013; Ward et al., 2012). Previous work suggests that the whitening of fire-generated brown carbon (BrC) may limit the global absorption from BrC (Forrister et al., 2015; Wang et al., 2016). Wang et al. (2018) estimate a modest global mean DRE of BrC of +0.048 W m−2 when accounting for this whitening; however, uncertainties in the magnitude and the evolution of absorption of BrC remain large. We treat OA as scattering here, which may lead to a positive bias in the total DRE of carbonaceous aerosol from smoke, thus we focus on the range in values associated with the use of various fire inventories rather than the absolute magnitude of the DRE. The range across the 2012 annual global mean inventory-driven BBA DRE is −0.062 W m−2, which is comparable to the magnitude of the direct radiative forcing of OA (−0.09 W m−2) reported in the in AR5 (IPCC, 2013). Only some fires contribute to the DRF, but we have shown here that the uncertainty in BBA DRE as represented by the spread in values driven by different inventories is on a comparable scale to the anthropogenic influence on OA forcing. While we have not assessed the annual global mean BBA DRE across other years, we have quantified the Northern Hemispheric fire season BBA DRE from 2012 to 2014, which shows generally similar trends across years with some variability; larger boreal fire years generally affect the DRE driven by GFED4s and GFAS1.2 the most (see 2014 in Fig. S9). The year 2014 also appears to be an outlier year where GFED4s and GFAS1.2-driven OA DRE are larger than QFED2.4-driven DRE across BONA, CONUS, and globally, consistent with our emissions analysis (see Fig. 5).The IPCC estimate of aerosols' contributions to the DRF only includes one set of historical fire emissions and one for each RCP – this choice allows for better intermodal comparisons but masks underlying uncertainty from fire emissions, which we have shown here to be important.
Most models do not test basic uncertainty associated with fire emissions both in air quality and climate studies – our work suggests that this uncertainty is large and may substantially impact our understanding of fire impacts. We note that, while we refer to the spread across these inventories as the uncertainty in emissions, additional factors, not represented by any of these inventories, may increase the true uncertainty in the estimated emissions beyond what we have shown in this work. We provide an evaluation of this uncertainty by comparing multiple commonly used fire emission inventories (GFED4s, FINN1.5, QFED2.4, and GFAS1.2) that have become available in the last 5 to 10 years. We show that the four inventories perform differently depending on species, location, and season. We also calculate that average BC and OC emissions differ by roughly a factor of 5 and 4, respectively, across the inventories in BONA. The range in BC and OC emissions in CONUS is even larger (a factor of ∼7 and 6, respectively). Global ranges in BC emissions are smaller than those in North America (∼2.3) with a somewhat more modest spread (∼1.7) in OC emissions, possibly because of emission factor differences. We also show that dry matter (not emission factor) differences are the driving force for emissions variation across inventories.
With such large differences in emissions, we test which of these inventories drives model simulations closest to observations over North America. We show that modeled concentrations both at the surface and aloft show variable skill across inventories when compared to in situ observations (IMPROVE, DC3 and ARCTAS campaigns) with FINN1.5 biased low for BC and OA and QFED2.4 biased high against observed BC. GFED4s and GFAS1.2-driven AOD also do a better job matching MODIS-observed AOD over the regions, in general and with specific features, than FINN1.5 and QFED2.4. QFED2.4 emissions may be biased high because they were scaled up to ensure that the GEOS model AOD simulation matches satellite-observed AOD, potentially misattributing biases in aerosol extinction efficiency and SOA formation in the GEOS model to emission. MODIS AOD has also been shown to be high in some environments (Lapina et al., 2011). That these enhancement factors are too high is further reinforced by the fact that, after adjusting the QFED2.4 emissions downward to account for our different OM : OC ratio, QFED2.4 simulations of OA match observed concentrations fairly well across campaigns, while BC concentrations remain much too high. The assumptions that FINN1.5 uses to compute burned area from active fire counts likely contribute to its low bias and should be revisited, especially for regions with large wildfires (e.g., boreal Canada and the western US). We also show that a laboratory-based parameterization for fire SOA, scaled from fire POA emissions, does improve model agreement with observations in some regions. However, from our comparisons, the range in POA emissions makes it challenging to discern whether SOA from fires is significant.
This range in fire emissions also carries through to uncertainties in the air quality and radiation impacts of fires, which we have shown to be large and significant. Over North America, depending on the inventory used, large differences in both the spatial extent and magnitude of BBA-only annual and daily surface concentrations and also in population-weighted annual fire PM2.5 exposure (0.5–1.6 µg m−3 for 2012) arise. We have also shown that fire emissions uncertainty produces a considerable envelope in global BBA DRE (−0.062 W m−2), roughly comparable to the direct radiative forcing of OA (−0.09 W m−2) reported in AR5.
Additional evaluation of satellite-based fire emission inventories, particularly in other large BB source regions, would help to provide insight into fire emissions uncertainty. Observations at all scales (surface, aloft, and satellite) are needed to better constrain our understanding of fire emissions and processing. To bridge fire emissions and subsequent impacts, additional investigation of uncertainties in fire aerosol aging and processing (e.g., injection heights, mixing state, SOA formation) is needed. Our work suggests that emissions uncertainty is a major factor in our ability to model the air quality and climate impacts of fires and should be incorporated into modeling studies of both.
The GEOS-Chem model is publicly available at: https://doi.org/10.5281/zenodo.1343547 (GEOS-Chem, 2018). The IMPROVE data are also available publicly at: http://vista.cira.colostate.edu/Improve/data-page/ (last access: 19 June 2018) (IMPROVE, 2018). The DC3 campaign data are available at https://www.eol.ucar.edu/field_projects/dc3 (last access: 18 February 2018) (NCAR, 2017), and the ARCTAS campaign data are available at: https://www-air.larc.nasa.gov/cgi-bin/ArcView/arctas (last access: 18 February 2018) (NASA, 2011).
The supplement related to this article is available online at: https://doi.org/10.5194/acp-20-2073-2020-supplement.
CLH and TSC formulated the research question and wrote the paper. TSC performed modeling and analysis. CW, AD, AD, and JK developed the FINN1.5, QFED2.4, and GFAS1.2 emission inventories used here and provided input on the manuscript. JLJ, PCJ, YK, NM, and JS performed the measurements of carbonaceous aerosol mass concentrations during DC3 and ARCTAS used in this analysis and provided input on the manuscript.
The authors declare that they have no conflict of interest.
This study was supported by the NOAA Climate Program Office (grant NA16OAR4310112) and an Ida M. Green Fellowship (MIT) to Therese S. Carter. Pedro Campuzano-Jost and Jose L. Jimenez were supported by NASA 80NSSC18K0630.
The authors thank the primary developers of GFED4s: Guido van der Werf, James Randerson, and Louis Giglio. The authors also thank Mat Evans and Killian Murphy for early versions of processed GFAS1.2 files; Xuan Wang and Katherine Travis for useful discussions regarding the GEOS-Chem simulation; Jesse Kroll, Chris Cappa, and Chris Lim for early discussion of their SOA parameterization from the NOAA Fire Lab 2016 study; and Armin Wisthaler and Tomas Mikoviny for acetonitrile measurements from both ARCTAS and DC3.
We acknowledge data from the IMPROVE network. IMPROVE is a collaborative association of state, tribal, and federal agencies and international partners. The US Environmental Protection Agency is the primary funding source, with contracting and research support from the National Park Service. The Air Quality Group at the University of California, Davis, is the central analytical laboratory, with ion analysis provided by Research Triangle Institute and carbon analysis provided by Desert Research Institute.
This research has been supported by the NOAA Climate Program Office (grant no. NA16OAR4310112), NASA (grant no. 80NSSC18K0630), and the Ida M. Green Fellowship (MIT).
This paper was edited by Pedro Jimenez-Guerrero and reviewed by three anonymous referees.
Abatzoglou, J. T. and Williams, A. P.: Impact of anthropogenic climate change on wildfire across western US forests, P. Natl. Acad. Sci. USA, 113, 11770–11775, https://doi.org/10.1073/pnas.1607171113, 2016.
Akagi, S. K., Yokelson, R. J., Wiedinmyer, C., Alvarado, M. J., Reid, J. S., Karl, T., Crounse, J. D., and Wennberg, P. O.: Emission factors for open and domestic biomass burning for use in atmospheric models, Atmos. Chem. Phys., 11, 4039–4072, https://doi.org/10.5194/acp-11-4039-2011, 2011.
Akagi, S. K., Craven, J. S., Taylor, J. W., McMeeking, G. R., Yokelson, R. J., Burling, I. R., Urbanski, S. P., Wold, C. E., Seinfeld, J. H., Coe, H., and Alvarado, M. J.: Evolution of trace gases and particles emitted by a chaparral fire in California, Atmos. Chem. Phys., 12, 1397–1421, https://doi.org/10.5194/acp-12-1397-2012, 2012.
Alvarado, M. J., Logan, J. A., Mao, J., Apel, E., Riemer, D., Blake, D., Cohen, R. C., Min, K. E., Perring, A. E., Browne, E. C., and Wooldridge, P. J.: Nitrogen oxides and PAN in plumes from boreal fires during ARCTAS-B and their impact on ozone: an integrated analysis of aircraft and satellite observations, Atmos. Chem. Phys., 10, 9739–9760, https://doi.org/10.5194/acp-10-9739-2010, 2010.
Andreae, M. O.: Emission of trace gases and aerosols from biomass burning – an updated assessment, Atmos. Chem. Phys., 19, 8523–8546, https://doi.org/10.5194/acp-19-8523-2019, 2019.
Andreae, M. O. and Merlet, P.: Emission of trace gases and aerosols from biomass burning, Global Biogeochem. Cy., 15, 955–966, https://doi.org/10.1029/2000GB001382, 2001.
Andreae, M. O. and Rosenfeld, D.: Aerosol–cloud–precipitation interactions. Part 1. The nature and sources of cloud-active aerosols, Earth-Sci. Rev., 89, 13–41, https://doi.org/10.1016/j.earscirev.2008.03.001, 2008.
Bahreini, R., Ervens, B., Middlebrook, A. M., Warneke, C., De Gouw, J. A., DeCarlo, P. F., Jimenez, J. L., Brock, C. A., Neuman, J. A., Ryerson, T. B., and Stark, H.: Organic aerosol formation in urban and industrial plumes near Houston and Dallas, Texas, J. Geophys. Res., 114, D00F16, https://doi.org/10.1029/2008JD011493, 2009.
Barth, M. C., Cantrell, C. A., Brune, W. H., Rutledge, S. A., Craw-ford, J. H., Huntrieser, H., Carey, L. D., MacGorman, D., Weis-man, M., Pickering, K. E., Bruning, E., Anderson, B., Apel, E., Biggerstaff, M., Campos, T., Campuzano-Jost, P., Cohen, R.,Crounse, J., Day, D. A., Diskin, G., Flocke, F., Fried, A., Gar-land, C., Heikes, B., Honomichl, S., Hornbrook, R., Huey, L. G., Jimenez, J. L., Lang, T., Lichtenstern, M., Mikoviny, T., Nault, B., O'Sullivan, D., Pan, L. L., Peischl, J., Pollack, I., Richter, D., Riemer, D., Ryerson, T., Schlager, H., Clair, J. S., Walega, J., Weibring, P., Weinheimer, A., Wennberg, P., Wisthaler, A., Wooldridge, P. J., and Ziegler, C.: The Deep Convective Clouds and Chemistry (DC3) Field Campaign, B. Am. Meteorol. Soc., 96, 1281–1309, https://doi.org/10.1175/bams-d-13-00290.1, 2015.
Bond, T. C., Doherty, S. J., Fahey, D. W., Forster, P. M., Berntsen, T., DeAngelo, B. J., Flanner, M. G., Ghan, S., Kärcher, B., Koch, D., Kinne, S., Kondo, Y., Quinn, P. K., Sarofim, M.C., Schultz, M. G., Schulz, M., Venkataraman, C., Zhang, H., Zhang, S., Bellouin, N., Guttikunda, S. K., Hopke, P. K., Jacobson, M. Z., Kaiser, J. W., Klimont, Z., Lohmann, U., Schwarz,J. P., Shindell, D., Storelvmo, T., Warren, S. G., and Zender, C. S.: Bounding the role of black carbon in the climate system: A scientific assessment, J. Geophys. Res., 118, 5380–5552, https://doi.org/10.1002/jgrd.50171, 2013.
Brey, S. J., Ruminski, M., Atwood, S. A., and Fischer, E. V.: Connecting smoke plumes to sources using Hazard Mapping System (HMS) smoke and fire location data over North America, Atmos. Chem. Phys., 18, 1745–1761, https://doi.org/10.5194/acp-18-1745-2018, 2018.
Brook, R., Rajagopalan, S., Pope, C., Brook, J., Bhatnagar, A., Diez-Roux, A., Holguin, F., Hong, Y., Luepker, R., Mittleman, M., Peters, A., Siscovick, D., Smith, S., Whitsel, L., and Kaufman, J. D.: Particulate matter air pollution and cardiovascular disease an update to the scientific statement from the American Heart Association, Circulation, 121, 2331–2378, 2010.
Canagaratna, M. R., Jayne, J. T., Jimenez, J. L., Allan, J. D., Alfarra, M. R., Zhang, Q., Onasch, T. B., Drewnick, F., Coe, H., Middlebrook, A., Delia, A., Williams, L. R., Trimborn, A. M., Northway, M. J., DeCarlo, P. F., Kolb, C. E., Davidovits, P., and Worsnop, D. R.: Chemical and microphysical characterization of ambient aerosols with the Aerodyne aerosol mass spectrometer, Mass Spectrom. Rev., 26, 185–222, 2007.
Chin, M., Ginoux, P., Kinne, S., Torres, O., Holben, B. N., Duncan, B. N., Martin, R. V., Logan, J. A., Higurashi, A., and Nakajima, T.: Tropospheric aerosol optical thickness from the GOCART model and comparisons with satellite and Sun photometer measurements, J. Atmos. Sci., 59, 461–483, 2002.
Chow, J. C., Watson, J. G., Chen, L. W., Chang, M. C., Robinson, N. F., Trimble, D., and Kohl, S.: The IMPROVE_A temperature protocol for thermal/optical carbon analysis: Maintaining consistency with a long-term database, J. Air Waste Manage. Assoc., 42, 1014–1023, 2007.
CIESIN – Center for International Earth Science Information Network: Gridded Population of the World, Version 4 (GPWv4): Population Count Adjusted to Match 2015 Revision of UN WPP Country Totals, Revision 11, Columbia University, NASA Socioeconomic Data and Applications Center (SEDAC), Palisades, NY, https://doi.org/10.7927/H4PN93PB, 2018.
Collier, S., Zhou, S., Onasch, T. B., Jaffe, D. A., Kleinman, L., Sedlacek, A. J., Briggs, N. L., Hee, J., Fortner, E., Shilling, J. E., Worsnop, D., Yokelson, R. J., Parworth, C., Ge, X., Xu, J., Butterfield, Z., Chand, D., Dubey, M. K., Pekour, M. S., Springston, S., and Zhang, Q.: Regional Influence of Aerosol Emissions from Wildfires Driven by Combustion Efficiency: Insights from the BBOP Campaign, Environ. Sci. Technol., 50, 8613–8622, https://doi.org/10.1021/acs.est.6b01617, 2016.
Cooke, W. F., Liousse, C., Cachier, H., and Feichter, J.: Construction of a 1×1 fossil fuel emission data set for carbonaceous aerosol and implementation and radiative impact in theECHAM4 model, J. Geophys. Res., 104, 22137–22162, 1999.
Cubison, M. J., Ortega, A. M., Hayes, P. L., Farmer, D. K., Day, D., Lechner, M. J., Brune, W. H., Apel, E., Diskin, G. S., Fisher, J. A., Fuelberg, H. E., Hecobian, A., Knapp, D. J., Mikoviny, T., Riemer, D., Sachse, G. W., Sessions, W., Weber, R. J., Weinheimer, A. J., Wisthaler, A., and Jimenez, J. L.: Effects of aging on organic aerosol from open biomass burning smoke in aircraft and laboratory studies, Atmos. Chem. Phys., 11, 12049–12064, https://doi.org/10.5194/acp-11-12049-2011, 2011.
Darmenov, A. and da Silva, A. M.: The Quick Fire Emissions Dataset (QFED) – Documentation of versions 2.1, 2.2 and 2.4, in: NASA Technical Report Series on Global Modeling and Data Assimilation, NASA/TM-2015-104606, available at: http://gmao.gsfc.nasa.gov/pubs/tm/ (last access: 20 February 2020), 2013.
DeCarlo, P. F., Kimmel, J. R., Trimborn, A., Northway, M. J., Jayne, J. T., Aiken, A. C., Gonin, M., Fuhrer, K., Horvath, T., Docherty, K. S., Worsnop, D. R., and Jimenez, J. L.: Field-deployable, high-resolution, time-of-flight aerosol mass spectrometer, Anal. Chem., 78, 8281–8289, 2006.
DeCarlo, P. F., Dunlea, E. J., Kimmel, J. R., Aiken, A. C., Sueper, D., Crounse, J., Wennberg, P. O., Emmons, L., Shinozuka, Y., Clarke, A., Zhou, J., Tomlinson, J., Collins, D. R., Knapp, D., Weinheimer, A. J., Montzka, D. D., Campos, T., and Jimenez, J. L.: Fast airborne aerosol size and chemistry measurements above Mexico City and Central Mexico during the MILAGRO campaign, Atmos. Chem. Phys., 8, 4027–4048, https://doi.org/10.5194/acp-8-4027-2008, 2008.
Drury, E., Jacob, D. J., Spurr, R. J. D., Wang, J., Shinozuka, Y., Anderson, B. E., Clarke, A. D., Dibb, J., McNaughton, C., and Weber, R.: Synthesis of satellite (MODIS), aircraft (ICARTT), and surface (IMPROVE, EPA-AQS, AERONET) aerosol observations over eastern North America to improve MODIS aerosol retrievals and constrain surface aerosol concentrations and sources, J. Geophys. Res., 115, D14204, https://doi.org/10.1029/2009JD012629, 2010.
Dunlea, E. J., DeCarlo, P. F., Aiken, A. C., Kimmel, J. R., Peltier, R. E., Weber, R. J., Tomlinson, J., Collins, D. R., Shinozuka, Y., McNaughton, C. S., Howell, S. G., Clarke, A. D., Emmons, L. K., Apel, E. C., Pfister, G. G., van Donkelaar, A., Martin, R. V., Millet, D. B., Heald, C. L., and Jimenez, J. L.: Evolution of Asian aerosols during transpacific transport in INTEX-B, Atmos. Chem. Phys., 9, 7257–7287, https://doi.org/10.5194/acp-9-7257-2009, 2009.
Environmental Protection Agency National Emissions Inventory: National Emissions Inventory v1: Air Pollutant Emission Trends Data, available at: http://www.epa.gov/ttn/chief/trends/index.htm, last access: 23 June 2015.
Fairlie, T. D., Jacob, D. J., and Park, R. J.: The impact of transpacific transport of mineral dust in the United States, Atmos. Environ., 41, 1251–1266, 2007.
Forrister, H., Liu, J., Scheuer, E., Dibb, J., Ziemba, L., Thorn-hill, K. L., Anderson, B., Diskin, G., Perring, A. E., Schwarz, J. P., Campuzano-Jost, P., Day, D. A., Palm, B. B., Jimenez, J. L., Nenes, A., and Weber, R. J.: Evolution of Brown Carbon in Wildfire Plumes, Geophys. Res. Lett., 42, 4623–4630, https://doi.org/10.1002/2015GL063897, 2015.
Fountoukis, C. and Nenes, A.: ISORROPIA II: a computationally efficient thermodynamic equilibrium model for K+––––Na+–––Cl−–H2O aerosols, Atmos. Chem. Phys., 7, 4639–4659, https://doi.org/10.5194/acp-7-4639-2007, 2007.
Fuzzi, S., Baltensperger, U., Carslaw, K., Decesari, S., Denier vander Gon, H., Facchini, M. C., Fowler, D., Koren, I., Langford, B., Lohmann, U., Nemitz, E., Pandis, S., Riipinen, I., Rudich, Y., Schaap, M., Slowik, J. G., Spracklen, D. V., Vignati, E., Wild, M., Williams, M., and Gilardoni, S.: Particulate matter, air quality and climate: lessons learned and future needs, Atmos. Chem. Phys., 15, 8217–8299, https://doi.org/10.5194/acp-15-8217-2015, 2015.
Garofalo, L. A., Pothier, M. A., Levin, E. J. T., Campos, T., Kreidenweis, S. M., and Farmer, D. K.: Emission and Evolution of Submicron Organic Aerosol in Smoke from Wildfires in the Western United States, ACS Earth Space Chem., 3, 1237–1247, https://doi.org/10.1021/acsearthspacechem.9b00125, 2019.
GEOS-Chem: geoschem/geos-chem: GEOS-Chem 12.0.0 release, https://doi.org/10.5281/zenodo.1343547, 2018.
Giglio, L., van der Werf, G. R., Randerson, J. T., Collatz, G. J., and Kasibhatla, P. S.: Global estimation of burned area using MODIS active fire observations, Atmos. Chem. Phys., 6, 957–974, https://doi.org/10.5194/acp-6-957-2006, 2006.
Giglio, L., Randerson, J. T., and van der Werf, G. R.: Analysis of daily, monthly, and annual burned area using the fourth-generation global fire emissions database (GFED4), J. Geophys. Res.-Biogeo., 118, 317–328, https://doi.org/10.1002/jgrg.20042, 2013.
Grieshop, A. P., Logue, J. M., Donahue, N. M., and Robinson, A. L.: Laboratory investigation of photochemical oxidation of organic aerosol from wood fires 1: measurement and simulation of organic aerosol evolution, Atmos. Chem. Phys., 9, 1263–1277, https://doi.org/10.5194/acp-9-1263-2009, 2009.
Guenther, A. B., Jiang, X., Heald, C. L., Sakulyanontvittaya, T., Duhl, T., Emmons, L. K., and Wang, X.: The Model of Emissions of Gases and Aerosols from Nature version 2.1 (MEGAN2.1): an extended and updated framework for modeling biogenic emissions, Geosci. Model Dev., 5, 1471–1492, https://doi.org/10.5194/gmd-5-1471-2012, 2012.
Hansel, A., Jordan, A., Holzinger, R., Prazeller, P., Vogel, W., and Lindinger, W.: Proton-Transfer Reaction Mass-Spectrometry – Online Trace Gas-Analysis at the ppb Level, Int. J. Mass Spectrom., 149, 609–619, 1995.
Heald, C. L., Ridley, D. A., Kroll, J. H., Barrett, S. R. H., Cady-Pereira, K. E., Alvarado, M. J., and Holmes, C. D.: Contrasting the direct radiative effect and direct radiative forcing of aerosols, Atmos. Chem. Phys., 14, 5513–5527, https://doi.org/10.5194/acp-14-5513-2014, 2014.
Hennigan, C. J., Miracolo, M. A., Engelhart, G. J., May, A. A., Presto, A. A., Lee, T., Sullivan, A. P., McMeeking, G. R., Coe, H., Wold, C. E., Hao, W.-M., Gilman, J. B., Kuster, W. C., de Gouw, J., Schichtel, B. A., Collett Jr., J. L., Kreidenweis, S. M., and Robinson, A. L.: Chemical and physical transformations of organic aerosol from the photo-oxidation of open biomass burning emissions in an environmental chamber, Atmos. Chem. Phys., 11, 7669–7686, https://doi.org/10.5194/acp-11-7669-2011, 2011.
Hodshire, A., Akherati, A., Alvarado, M. J., Brown-Steiner, B., Jathar, S. H., Jimenez, J. L., Kreidenweis, S. M., Lonsdale, C. R., Onasch, T. B., Ortega, A. M., and Pierce, J. R.: Aging Effects on Biomass Burning Aerosol Mass and Composition: A Critical Review of Field and Laboratory Studies, Environ. Sci. Technol., 53, 10007–10022, https://doi.org/10.1021/acs.est.9b02588, 2019.
Hoesly, R. M., Smith, S. J., Feng, L., Klimont, Z., Janssens-Maenhout, G., Pitkanen, T., Seibert, J. J., Vu, L., Andres, R. J., Bolt, R. M., Bond, T. C., Dawidowski, L., Kholod, N., Kurokawa, J.-I., Li, M., Liu, L., Lu, Z., Moura, M. C. P., O'Rourke, P. R., and Zhang, Q.: Historical (1750–2014) anthropogenic emissions of reactive gases and aerosols from the Community Emissions Data System (CEDS), Geosci. Model Dev., 11, 369–408, https://doi.org/10.5194/gmd-11-369-2018, 2018.
Hsu, N., Tsay, S., King, M., and Herman, J.: Deep Blue retrievals ofAsian aerosol properties during ACE-Asia, IEEE T. Geosci. Remot, 44, 3180–3199, 2006.
Iacono, M. J., Delamere, J. S., Mlawer, E. J., Shephard, M. W., Clough, S. A., and Collins, W. D.: Radiative forcing by long-lived greenhouse gases: Calculations with the AER radiative transfer models, J. Geophys. Res., 113, D13103, https://doi.org/10.1029/2008JD009944, 2008.
Ichoku, C. and Kaufman, Y. J.: A method to derive smoke emission rates from MODIS fire radiative energy measurements, IEEE T. Geosci. Remote, 43, 2636–2649, 2005.
IMPROVE: http://vista.cira.colostate.edu/Improve/data-page/, last access: 19 June 2018.
IPCC: Climate Change 2013: The Physical Science Basis, Cambridge University Press, Cambridge, UK and New York, NY, USA, 2013.
Jacob, D. J., Crawford, J. H., Maring, H., Clarke, A. D., Dibb, J. E., Emmons, L. K., Ferrare, R. A., Hostetler, C. A., Russell, P. B., Singh, H. B., Thompson, A. M., Shaw, G. E., McCauley, E., Pederson, J. R., and Fisher, J. A.: The Arctic Research of the Composition of the Troposphere from Aircraft and Satellites (ARCTAS) mission: design, execution, and first results, Atmos. Chem. Phys., 10, 5191–5212, https://doi.org/10.5194/acp-10-5191-2010, 2010.
Jaeglé, L., Quinn, P. K., Bates, T. S., Alexander, B., and Lin, J. T.: Global distribution of sea salt aerosols: new constraints from in situ and remote sensing observations, Atmos. Chem. Phys., 11, 3137–3157, https://doi.org/10.5194/acp-11-3137-2011, 2011.
Jen, C. N., Hatch, L. E., Selimovic, V., Yokelson, R. J., Weber, R., Fernandez, A. E., Kreisberg, N. M., Barsanti, K. C., and Goldstein, A. H.: Speciated and total emission factors of particulate organics from burning western U.S. wildland fuels and their dependence on combustion efficiency, Atmos. Chem. Phys., 19, 1013–1026, https://doi.org/10.5194/acp-19-1013-2019, 2019.
Jolleys, M. D., Coe, H., McFiggans, G., Capes, G., Allan, J., Crosier, J., Williams, P., Allen, G., Bower, K., Jimenez, J., Russell, L., Grutter, M., and Baumgardner, D.: Characterizing the aging of biomass burning organic aerosol by use of mixing ratios: A meta-analysis of four regions, Environ. Sci. Technol., 46, 13093–13102, https://doi.org/10.1021/es302386v, 2012.
Jolleys, M. D., Coe, H., McFiggans, G., McMeeking, G. R., Lee, T., Kreidenweis, S. M., Collett, J. L., and Sullivan, A. P.: Organic aerosol emission ratios from the laboratory combustion of biomass fuels, J. Geophys. Res.-Atmos., 119, 12850–12871, https://doi.org/10.1002/2014JD021589, 2014.
Johnston, F. H., Henderson, S. B., Chen, Y., Randerson, J. T., Marlier, M., DeFries, R. S., Kinney, P., Bowman, D. M.J. S., and Brauer, M.: Estimated global mortality attributable to smoke from landscape fires, Environ. Health Perspect., 120, 695–701, https://doi.org/10.1289/ehp.1104422, 2012.
Kaiser, J. W., Flemming, J., Schultz, M. G., Suttie, M., and Wooster, M. J.: The MACC Global Fire Assimilation System: First Emission Products (GFASv0), ECMWF Technical Memorandum 596, ECMWF, 1–17, 2009.
Kaiser, J. W., Heil, A., Andreae, M. O., Benedetti, A., Chubarova, N., Jones, L., Morcrette, J.-J., Razinger, M., Schultz, M. G., Suttie, M., and van der Werf, G. R.: Biomass burning emissions estimated with a global fire assimilation system based on observed fire radiative power, Biogeosciences, 9, 527–554, https://doi.org/10.5194/bg-9-527-2012, 2012.
Kim, P. S., Jacob, D. J., Fisher, J. A., Travis, K., Yu, K., Zhu, L., Yantosca, R. M., Sulprizio, M. P., Jimenez, J. L., Campuzano-Jost, P., Froyd, K. D., Liao, J., Hair, J. W., Fenn, M. A., Butler, C. F., Wagner, N. L., Gordon, T. D., Welti, A., Wennberg, P. O., Crounse, J. D., St. Clair, J. M., Teng, A. P., Millet, D. B., Schwarz, J. P., Markovic, M. Z., and Perring, A. E.: Sources, seasonality, and trends of southeast US aerosol: an integrated analysis of surface, aircraft, and satellite observations with the GEOS-Chem chemical transport model, Atmos. Chem. Phys., 15, 10411–10433, https://doi.org/10.5194/acp-15-10411-2015, 2015.
Koepke, P., Hess, M., Schult, I., and Shettle, E. P.: Global Aerosol Data Set, Max Planck Inst. für Meteorol., Hamburg, Germany, 1997.
Kondo, Y., Matsui, H., Moteki, N., Sahu, L., Takegawa, N., Kajino, M., Zhao, Y., Cubison, M. J., Jimenez, J. L., Vay, S., Diskin, G. S., Anderson, B., Wisthaler, A., Mikoviny, T., Fuelberg, H. E., Blake, D. R., Huey, G., Weinheimer, A. J., Knapp, D. J., and Brune, W. H.: Emissions of black carbon, organic, and inorganic aerosols from biomass burning in North America and Asia in 2008, J. Geophys. Res., 116, D08204, https://doi.org/10.1029/2010JD015152, 2011.
Koss, A. R., Sekimoto, K., Gilman, J. B., Selimovic, V., Coggon, M. M., Zarzana, K. J., Yuan, B., Lerner, B. M., Brown, S. S., Jimenez, J. L., Krechmer, J., Roberts, J. M., Warneke, C., Yokelson, R. J., and de Gouw, J.: Non-methane organic gas emissions from biomass burning: identification, quantification, and emission factors from PTR-ToF during the FIREX 2016 laboratory experiment, Atmos. Chem. Phys., 18, 3299–3319, https://doi.org/10.5194/acp-18-3299-2018, 2018.
Lapina, K., Heald, C. L., Spracklen, D. V., Arnold, S. R., Allan, J. D., Coe, H., McFiggans, G., Zorn, S. R., Drewnick, F., Bates,T. S., Hawkins, L. N., Russell, L. M., Smirnov, A., O'Dowd, C. D., and Hind, A. J.: Investigating organic aerosol loading in the remote marine environment, Atmos. Chem. Phys., 11, 8847–8860, https://doi.org/10.5194/acp-11-8847-2011, 2011.
Levin, E. T., McMeeking, G. R., Carrico, C. M., Mack, L. E., Kreidenweis, S. M., Wold, C. E., Moosmüller, H., Arnott, W. P., Hao, W. M., Collett Jr., J. L., and Malm, W. C.: Biomass burning smoke aerosol properties measured during Fire Laboratory at Missoula Experiment (FLAME), J. Geophys. Res., 115, D18210, https://doi.org/10.1029/2009JD013601, 2010.
Levy, R. C., Remer, L., Mattoo, S., Vermote, E., and Kaufman, Y. J.: Second-generation operational algorithm: Retrieval ofaerosol properties over land from inversion of Moderate Resolution Imaging Spectroradiometer spectral reflectance, J. Geophys. Res., 112, D13211, https://doi.org/10.1029/2006JD007811, 2007.
Levy, R. C., Remer, L. A., Kleidman, R. G., Mattoo, S., Ichoku, C., Kahn, R., and Eck, T. F.: Global evaluation of the Collection 5 MODIS dark-target aerosol products over land, Atmos. Chem. Phys., 10, 10399–10420, https://doi.org/10.5194/acp-10-10399-2010, 2010.
Levy, R. C., Mattoo, S., Munchak, L. A., Remer, L. A., Sayer, A. M., Patadia, F., and Hsu, N. C.: The Collection 6 MODIS aerosol products over land and ocean, Atmos. Meas. Tech., 6, 2989–3034, https://doi.org/10.5194/amt-6-2989-2013, 2013.
Lim, C. Y., Hagan, D. H., Coggon M. M., Koss, A. R., Sekimoto, K., de Gouw, J., Warneke, C., Cappa, C. D., and Kroll, J. H.: Secondary organic aerosol formation from biomass burning emissions, Atmos. Chem. Phys., 19, 12797–12809, https://doi.org/10.5194/acp-19-12797-2019, 2019.
Liu, J., Fan, S., Horowitz, L. W., and Levy II, H.: Evaluation of factors controlling long-range transport of black carbon to the Arctic, J. Geophys. Res., 116, D04307, https://doi.org/10.1029/2010JD015145, 2011.
Liu, J. C., Pereira, G., Uhl, S. A., Bravo, M. A., and Bell, M. L.: A systematic review of the physical health impacts from non-occupational exposure to wildfire smoke, Environ. Res., 136, 120–132, https://doi.org/10.1016/j.envres.2014.10.015, 2015.
Liu, X., Zhang, Y., Huey, L. G., Yokelson, R. J., Wang, Y., Jimenez, J.-L., Campuzano-Jost, P., Beyersdorf, A., Blake, D., Choi, Y., St. Clair, J., Crounse, J., Day, D. A., Diskin, G., Fried, A., Hall, S., Hanisco, T., King, L., Meinardi, S., Mikoviny, T., Palm, B., Peischl, J., Perring, A., Pollack, I., Ryerson, T., Sachse, G., Schwarz, J., Simpson, I., Tanner, D., Thornhill, K., Ullmann, K., Weber, R., Wennberg, P., Wisthaler, A., Wolfe, G., and Ziemba, L.: Agricultural fires in the southeastern US during SEAC4RS: Emissions of trace gases and particles and evolution of ozone, reactive nitrogen, and organic aerosol, J. Geophys. Res., 121, 7383–7414, https://doi.org/10.1002/2016JD025040, 2016.
Liu, X., Huey, L. G., Yokelson, R. J., Selimovic, V., Simpson, I. J., Müller, M., Jimenez, J. L., Campuzano-Jost, P.,Beyersdorf, A. J., Blake, D. R., Butterfield, Z., Choi, Y.,Crounse, J. D., Day, D. A., Diskin, G. S., Dubey, M. K., Fortner, E., Hanisco, T. F., Hu, W., King, L. E., Kleinman, L., Meinardi, S., Mikoviny, T., Onasch, T. B., Palm, B. B., Peischl, J., Pollack, I. B., Ryerson, T. B., Sachse, G. W., Sedlacek, A. J., Shilling, J. E., Springston, S., St. Clair, J. M., Tanner, D. J., Teng, A. P., Wennberg, P. O., Wisthaler, A., and Wolfe, G. M.: Airborne measurements of western U.S. wildfire emissions: comparison with prescribed burning and air quality implications, J. Geophys. Res.-Atmos., 122, 6108–6129, https://doi.org/10.1002/2016JD026315, 2017.
Lu, Z., Streets, D. G., Winijkul, E., Yan, F., Chen, Y., Bond, T. C., Feng, Y., Dubey, M. K., Liu, S., Pinto, J. P., and Carmichael, G. R.: Light Absorption Properties and Radiative Effects of Primary Organic Aerosol Emissions, Environ. Sci. Technol., 49, 4868–4877, https://doi.org/10.1021/acs.est.5b00211, 2015.
Malm, W. C. and Hand, J. L.: An examination of the physical and optical properties of aerosols collected in the IMPROVE program, Atmos. Environ., 41, 3407–3427, 2007.
Mao, J., Paulot, F., Jacob, D. J., Cohen, R. C., Crounse, J. D., Wennberg, P. O., Keller, C. A., Hudman, R. C., Barkley, M. P., and Horowitz, L. W.: Ozone and organic nitrates over the eastern United States: Sensitivity to isoprene chemistry, J. Geophys. Res., 118, 11256–11268, https://doi.org/10.1002/jgrd.50817, 2013.
Marais, E. A. and Wiedinmyer, C.: Air Quality Impact of Diffuse and Inefficient Combustion Emissions in Africa (DICE-Africa), Environ. Sci. Technol., 50, 10739–10745, https://doi.org/10.1021/acs.est.6b02602, 2016.
Marais, E. A., Jacob, D. J., Jimenez, J. L., Campuzano-Jost, P., Day, D. A., Hu, W., Krechmer, J., Zhu, L., Kim, P. S., Miller, C. C., Fisher, J. A., Travis, K., Yu, K., Hanisco, T. F., Wolfe, G. M., Arkinson, H. L., Pye, H. O. T., Froyd, K. D., Liao, J., and McNeill, V. F.: Aqueous-phase mechanism for secondary organic aerosol formation from isoprene: application to the southeast United States and co-benefit of SO2 emission controls, Atmos. Chem. Phys., 16, 1603–1618, https://doi.org/10.5194/acp-16-1603-2016, 2016.
Marlon, J. R., Bartlein, P. J., Gavin, D. G., Long, C. J., Anderson, R. S., Briles, C.E., Brown, K. J., Colombaroli, D., Hallett, D. J., Power, M. J., Scharf, E. A., and Walsh, M. K.: Long-term perspective on wildfires in the western USA, P. Natl. Acad. Sci. USA, 109, E535–E543, https://doi.org/10.1073/PNAS.1112839109, 2012.
Martin, R. V., Jacob, D. J., and Yantosca, R. M.: Global and regional decreases in tropospheric oxidants from photochemical effects of aerosols, J. Geophy. Res., 108, 4097, https://doi.org/10.1029/2002JD002622, 2003.
May, A. A., McMeeking, G. R., Lee, T., Taylor, J. W., Craven, J. S., Burling, I., Sullivan, A. P., Akagi, S., Collett, J. L., Flynn, M., Coe, H., Urbanski, S. P., Seinfeld, J. H., Yokelson, R. J., and Kreidenweis, S. M.: Aerosol emissions from prescribed fires in the United States: A synthesis of laboratory and aircraft measurements, J. Geophys. Res., 119, 11826–11849, https://doi.org/10.1002/2014JD021848, 2014.
May, A. A., Lee, T., McMeeking, G. R., Akagi, S., Sullivan, A. P., Urbanski, S., Yokelson, R. J., and Kreidenweis, S. M.: Observations and analysis of organic aerosol evolution in some prescribed fire smoke plumes, Atmos. Chem. Phys., 15, 6323–6335, https://doi.org/10.5194/acp-15-6323-2015, 2015.
McMeeking, G. R., Kreidenweis, S. M., Baker, S., Carrico, C. M., Chow, J. C., Collet Jr., J. L., Hao, W. M., Holden, A. S., Kirchstetter, T. W., Malm, W. C., Moosmüller, H., Sullivan, A. P., and Wold, C. E.: Emissions of trace gases and aerosols during the open combustion of biomass in the laboratory, J. Geophys. Res., 114, D19210, https://doi.org/10.1029/2009JD011836, 2009.
Miller, C., Jacob, D. J., Marais, E. A., Yu, K., Travis, K. R., Kim, P. S., Fisher, J. A., Zhu, L., Wolfe, G. M., Hanisco, T. F., Keutsch, F. N., Kaiser, J., Min, K.-E., Brown, S. S., Washenfelder, R. A., González Abad, G., and Chance, K.: Glyoxal yield from isoprene oxidation and relation to formaldehyde: chemical mechanism, constraints from SENEX aircraft observations, and interpretation of OMI satellite data, Atmos. Chem. Phys., 17, 8725–8738, https://doi.org/10.5194/acp-17-8725-2017, 2017.
NASA: ARCTAS campaign dataset, available at: https://www-air.larc.nasa.gov/cgi-bin/ArcView/arctas (last access: 18 February 2018), 2011.
NCAR: DC3 campaign dataset, available at: https://www.eol.ucar.edu/field_projects/dc3 (last access: 18 February 2018), 2017.
Nowell, H. K., Holmes, C. D., Robertson, K., Teske, C., and Hiers, J. K.: A New Picture of Fire Extent, Variability, and Drought Interaction in Prescribed Fire Landscapes: Insights From Florida Government Records, Geophys. Res. Lett., 45, 7874–7884, https://doi.org/10.1029/2018GL078679, 2018.
Ortega, A. M., Day, D. A., Cubison, M. J., Brune, W. H., Bon, D., de Gouw, J. A., and Jimenez, J. L.: Secondary organic aerosol formation and primary organic aerosol oxidation from biomass-burning smoke in a flow reactor during FLAME-3, Atmos. Chem. Phys., 13, 11551–11571, https://doi.org/10.5194/acp-13-11551-2013, 2013.
Park, R. J., Jacob, D. J., Chin, M., and Martin, R. V.: Source of carbonaceous aerosols over the United States and implications for natural visibility, J. Geophys. Res., 108, 4355, https://doi.org/10.1029/2002JD003190, 2003.
Petrenko, M., Kahn, R., Chin, M., Soja, A., Kucsera, T., and Harshvardhan: The use of satellite-measured aerosol optical depth to constrain biomass burning emissions source strength in the global model GOCART, J. Geophys. Res., 117, D18212, https://doi.org/10.1029/2012jd017870, 2012.
Pfister, G. G., Avise, J., Wiedinmyer, C., Edwards, D. P., Emmons, L. K., Diskin, G. D., Podolske, J., and Wisthaler, A.: CO source contribution analysis for California during ARCTAS-CARB, Atmos. Chem. Phys., 11, 7515–7532, https://doi.org/10.5194/acp-11-7515-2011, 2011.
Pope III, C. A. and Dockery, D. W.: Health Effects of Fine Particulate Air Pollution: Lines that Connect, J. Air Waste Manage., 56, 709–742, 2006.
Randerson, J. T., Chen, Y., van der Werf, G. R., Rogers, B. M., and Morton, D. C.: Global burned area and biomass burning emissions from small fires, J. Geophys. Res., 117, G04012, https://doi.org/10.1029/2012JG002128, 2012.
Rap, A., Scott, C. E., Spracklen, D. V., Bellouin, N., Forster, P. M., Carslaw, K. S., Schmidt, A., and Mann, G.: Natural aerosol direct and indirect radiative effects, Geophys. Res. Lett., 40, 3297–3301, https://doi.org/10.1002/grl.50441, 2013.
Reddington, C. L., Spracklen, D. V., Artaxo, P., Ridley, D. A., Rizzo, L. V., and Arana, A.: Analysis of particulate emissions from tropical biomass burning using a global aerosol model and long-term surface observations, Atmos. Chem. Phys., 16, 11083–11106, https://doi.org/10.5194/acp-16-11083-2016, 2016.
Reddington, C. L., Morgan, W. T., Darbyshire, E., Brito, J., Coe, H., Artaxo, P., Scott, C. E., Marsham, J., and Spracklen, D. V.: Biomass burning aerosol over the Amazon: analysis of aircraft, surface and satellite observations using a global aerosol model, Atmos. Chem. Phys., 19, 9125–9152, https://doi.org/10.5194/acp-19-9125-2019, 2019.
Reid, C. E., Brauer, M., Johnston, F. H., Jerrett, M., Balmes, J. R., and Elliott, C.: Critical review of health impacts of wildfire smoke exposure, Environ. Health Perspect., 124, 1334–1343, https://doi.org/10.1289/ehp.1409277, 2016.
Remer, L. A., Kaufman, Y. J., Tanré, D., Mattoo, S., Chu, D. A., Martins, J. V., Li, R.-R., Ichoku, C., Levy, R. C., Kleidman, R. G., Eck, T. F., Vermote, E., and Holben, B. N.: The MODIS aerosol algorithm, products, and validation, J. Atmos. Sci., 62, 947–973, 2005.
Ridley, D. A., Heald, C. L., and Ford, B. J.: North African dust export and impacts: an integrated satellite and model perspective, J. Geophys. Res., 117, D02202, https://doi.org/10.1029/2011JD016794, 2012.
Saide, P. E., Spak, S. N., Pierce, R. B., Otkin, J. A., Schaack, T. K., Heidinger, A. K., da Silva, A. M., Kacenelenbogen, M., Redemann, J., and Carmichael, G. R.: Central American biomass burning smoke can increase tornado severity in the U.S., Geophys. Res. Lett., 2014, GL062826, https://doi.org/10.1002/2014gl062826, 2015.
Sayer, A. M., Hsu, N. C., Bettenhausen, C., and Jeong, M.-J.: Validation and uncertainty estimates for MODIS Collection 6 “Deep Blue” aerosol data, J. Geophys. Res., 118, 7864–7872, https://doi.org/10.1002/jgrd.50600, 2013.
Sayer, A. M., Munchak, L. A., Hsu, N. C., Levy, R. C., Bettenhausen, C., and Jeong, M.-J.: MODIS Collection 6 aerosol products: comparison between aqua's e-deep blue, dark target, and “merged” data sets, and usage recommendations, J. Geophys. Res., 119, 13965–13989, https://doi.org/10.1002/2014JD022453, 2014.
Schwarz, J. P., Spackman, J. R., Fahey, D. W., Gao, R. S., Lohmann, U., Stier, P., Watts, L. A., Thomson, D. S., Lack, D. A., Pfister, L., Mahoney, M. J., Baumgardner, D., Wilson, J. C., and Reeves, J. M.: Coatings and their enhancement of black carbon light absorption in the tropical atmosphere, J. Geophys. Res., 113, D03203, https://doi.org/10.1029/2007JD009042, 2008.
Schwarz, J. P., Samset, B. H., Perring, A. E., Spackman, J. R., Gao, R. S., Stier, P., Schulz, M., Moore, F. L., Ray, E. A., and Fahey, D. W.: Global-scale seasonally resolved black carbon vertical profiles over the Pacific, Geophys. Res. Lett., 40, 5542–5547, https://doi.org/10.1002/2013GL057775, 2013.
Selimovic, V., Yokelson, R. J., Warneke, C., Roberts, J. M., de Gouw, J., Reardon, J., and Griffith, D. W. T.: Aerosol optical properties and trace gas emissions by PAX and OP-FTIR for laboratory-simulated western US wildfires during FIREX, Atmos. Chem. Phys., 18, 2929–2948, https://doi.org/10.5194/acp-18-2929-2018, 2018.
Sherwen, T., Schmidt, J. A., Evans, M. J., Carpenter, L. J., Großmann, K., Eastham, S. D., Jacob, D. J., Dix, B., Koenig, T. K., Sinreich, R., Ortega, I., Volkamer, R., Saiz-Lopez, A., Prados-Roman, C., Mahajan, A. S., and Ordóñez, C.: Global impacts of tropospheric halogens (Cl, Br, I) on oxidants and composition in GEOS-Chem, Atmos. Chem. Phys., 16, 12239–12271, https://doi.org/10.5194/acp-16-12239-2016, 2016.
Shrivastava, M., Cappa, C., Fan, J., Goldstein, A., Guenther, A., Jimenez, J., Kuang, C., Laskin, A., Martin, S., Ng, N., Petaja, T., Pierce, J., Rasch, P., Roldin, P., Seinfeld, J., Shilling, J.,Smith, J., Thornton, J., Volkamer, R., Wang, J., Worsnop, D., Zaveri, R., Zelenyuk, A., and Zhang, Q.: Recent advances in understanding secondary organic aerosol: Implications for global climate forcing, Rev. Geophys., 55, 509–559, https://doi.org/10.1002/2016RG000540, 2017.
Simone, N. W., Stettler, M. E. J., and Barrett, S. R. H.: Rapid estimation of global civil aviation emissions with uncertainty quantification, Transport. Res. D-Tr. E., 25, 33–41, https://doi.org/10.1016/j.trd.2013.07.001, 2013.
Stettler, M., Eastham, S., and Barrett, S.: Air quality and public health impacts of UK airports. Part I: Emissions, Atmos. Environ., 45, 5415–5424, https://doi.org/10.1016/j.atmosenv.2011.07.012, 2011.
Stohl, A., Klimont, Z., Eckhardt, S., Kupiainen, K., Shevchenko, V. P., Kopeikin, V. M., and Novigatsky, A. N.: Black carbon in the Arctic: the underestimated role of gas flaring and residential combustion emissions, Atmos. Chem. Phys., 13, 8833–8855, https://doi.org/10.5194/acp-13-8833-2013, 2013.
Tkacik, D. S., Robinson, E. S., Ahern, A., Saleh, R., Stockwell, C., Veres, P., Simpson, I. J., Meinardi, S., Blake, D. R., Yokelson, R. J., Presto, A. A., Sullivan, R. C., Donahue, N. M., and Robinson, A. L.: A dual-chamber method for quantifying the effects of atmospheric perturbations on secondary organic aerosol formation from biomass burning emissions, J. Geophys. Res., 122, 6043–6058, https://doi.org/10.1002/2016JD025784, 2017.
Tosca, M. G., Randerson, J. T., and Zender, C. S.: Global impact of smoke aerosols from landscape fires on climate and the Hadley circulation, Atmos. Chem. Phys., 13, 5227–5241, https://doi.org/10.5194/acp-13-5227-2013, 2013.
Travis, K. R., Jacob, D. J., Fisher, J. A., Kim, P. S., Marais, E. A., Zhu, L., Yu, K., Miller, C. C., Yantosca, R. M., Sulprizio, M. P., Thompson, A. M., Wennberg, P. O., Crounse, J. D., St. Clair, J. M., Cohen, R. C., Laughner, J. L., Dibb, J. E., Hall, S. R., Ullmann, K., Wolfe, G. M., Pollack, I. B., Peischl, J., Neuman, J .A., and Zhou, X.: Why do models overestimate surface ozone in the Southeast United States?, Atmos. Chem. Phys., 16, 13561–13577, https://doi.org/10.5194/acp-16-13561-2016, 2016.
Turetsky, M. R., Kane, E. S., Harden, J. W., Ottmar, R. D., Manies, K. L., Hoy E., and Kasischke, E. S.: Recent acceleration of biomass burning and carbon losses in Alaskan forests and peat-lands, Nat. Geosci., 4, 27–31, https://doi.org/10.1038/ngeo1027, 2011.
Urbanski, S. P., Hao, W. M., and Nordgren, B.: The wildland fire emission inventory: western United States emission esti-mates and an evaluation of uncertainty, Atmos. Chem. Phys., 11, 12973–13000, https://doi.org/10.5194/acp-11-12973-2011, 2011.
Vakkari, V., Kerminen, V.-M., Beukes, J. P., Tiitta, P., van Zyl, P. G., Josipovic, M., Venter, A. D., Jaars, K., Worsnop, D. R., Kulmala, M., and Laakso, L.: Rapid changes in biomass burning aerosols by atmospheric oxidation, Geophys. Res. Lett., 41, 2644–2651, https://doi.org/10.1002/2014GL059396, 2014.
Vakkari, V., Beukes, J. P., Dal Maso, M., Aurela, M. J., and van Zyl, P. G.: Major secondary aerosol formation in southern African open biomass burning plumes, Nat. Geosci., 11, 580–583, https://doi.org/10.1038/s41561-018-0170-0, 2018.
Val Martin, M., Heald, C. L., Lamarque, J.-F., Tilmes, S., Emmons, L. K., and Schichtel, B. A.: How emissions, climate, and land use change will impact mid-century air quality over the United States: a focus on effects at national parks, Atmos. Chem. Phys.,15, 2805–2823, https://doi.org/10.5194/acp-15-2805-2015, 2015.
van der Werf, G. R., Randerson, J. T., Giglio, L., van Leeuwen, T. T., Chen, Y., Rogers, B. M., Mu, M., van Marle, M. J. E., Morton, D. C., Collatz, G. J., Yokelson, R. J., and Kasibhatla, P. S.: Global fire emissions estimates during 1997–2016, Earth Syst. Sci. Data, 9, 697–720, https://doi.org/10.5194/essd-9-697-2017, 2017.
van Leeuwen, T. T., van der Werf, G. R., Hoffmann, A. A., Detmers, R. G., Rücker, G., French, N. H. F., Archibald, S., Carvalho Jr., J. A., Cook, G. D., de Groot, W. J., Hély, C., Kasischke, E. S., Kloster, S., McCarty, J. L., Pettinari, M. L., Savadogo, P., Alvarado, E. C., Boschetti, L., Manuri, S., Meyer, C. P., Siegert, F., Trollope, L. A., and Trollope, W. S. W.: Biomass burning fuel consumption rates: a field measurement database, Biogeosciences, 11, 7305–7329, https://doi.org/10.5194/bg-11-7305-2014, 2014.
Veraverbeke, S., Rogers, B. M., and Randerson, J. T.: Daily burned area and carbon emissions from boreal fires in Alaska, Biogeosciences, 12, 3579–3601, https://doi.org/10.5194/bg-12-3579-2015, 2015.
Wang, X., Heald, C. L., Ridley, D. A., Schwarz, J. P., Spackman, J. R., Perring, A. E., Coe, H., Liu, D., and Clarke, A. D.: Exploit-ing simultaneous observational constraints on mass and absorption to estimate the global direct radiative forcing of black car-bon and brown carbon, Atmos. Chem. Phys., 14, 10989–11010, https://doi.org/10.5194/acp-14-10989-2014, 2014.
Wang, X., Heald, C. L., Sedlacek, A. J., de Sá, S. S., Martin, S. T., Alexander, M. L., Watson, T. B., Aiken, A. C., Springston, S. R., and Artaxo, P.: Deriving brown carbon from multiwavelength absorption measurements: method and application to AERONET and Aethalometer observations, Atmos. Chem. Phys., 16, 12733–12752, https://doi.org/10.5194/acp-16-12733-2016, 2016.
Wang, X., Heald, C. L., Liu, J., Weber, R. J., Campuzano-Jost, P., Jimenez, J. L., Schwarz, J. P., and Perring, A. E.: Exploring theobservational constraints on the simulation of brown carbon, Atmos. Chem. Phys., 18, 635–653, https://doi.org/10.5194/acp-18-635-2018, 2018.
Ward, D. S., Kloster, S., Mahowald, N. M., Rogers, B. M., Randerson, J. T., and Hess, P. G.: The changing radiative forcing of fires: global model estimates for past, present and future, Atmos. Chem. Phys., 12, 10857–10886, https://doi.org/10.5194/acp-12-10857-2012, 2012.
Wehner, M. F., Arnold, J. R., Knutson, T., Kunkel, K. E., and LeGrande, A. N.: Droughts, floods, and wildfires, in: Climate Science Special Report: Fourth National Climate Assessment, Volume I, edited by: Wuebbles, D. J., Fahey, D. W., Hibbard, K. A., Dokken, D. J., Stewart, B. C., and Maycock, T. K., U.S. Global Change Research Program, Washington, DC, USA, 231–256, https://doi.org/10.7930/J0CJ8BNN, 2017.
Westerling, A. L., Hidalgo, H. G., Cayan, D. R., and Swetnam, T. W.: Warming and earlier spring increase western US forest wildfire activity, Science, 313, 940–943, https://doi.org/10.1126/science.1128834, 2006.
Westerling, A. L.: Increasing western US forest wildfire activity: sensitivity to changes in the timing of spring, Philos. T. Roy. Soc. B, 371, 1696, https://doi.org/10.1098/rstb.2015.0178, 2016.
Wiedinmyer, C., Akagi, S. K., Yokelson, R. J., Emmons, L. K., AlSaadi, J. A., Orlando, J. J., and Soja, A. J.: The Fire Inventory from NCAR (FINN): a high resolution global model to estimate the emissions from open burning, Geosci. Model Dev., 4, 625–641, https://doi.org/10.5194/gmd-4-625-2011, 2011.
Wiedinmyer, C., Yokelson, R. J., and Gullett, B. K.: Global Emissions of Trace Gases, Particulate Matter, and Hazardous Air Pollutants from Open Burning of Domestic Waste, Environ. Sci. Technol., 48, 9523–9530, https://doi.org/10.1021/es502250z, 2014.
Williamson, G. J., Bowman, D. M. J. S., Price, O. F., Henderson, S. B., and Johnston, F. H.: A transdisciplinary approach to understanding the health effects of wildfire and prescribed fire smoke regimes, Environ. Res. Lett., 11, 125009, https://doi.org/10.1088/1748-9326/11/12/125009, 2016.
Wisthaler, A., Hansel, A., Dickerson, R. R., and Crutzen, P. J.: Organic trace gas measurements by PTR-MS during INDOEX 1999, J. Geophys. Res., 107, 8024, https://doi.org/10.1029/2001JD000576, 2002.
Wooster, M. J.: Small-scale experimental testing of fire radiative energy for quantifying mass combusted in natural vegetation fires, Geophys. Res. Lett., 29, 2027, https://doi.org/10.1029/2002GL015487, 2002.
Wooster, M. J., Roberts, G., Perry, G. L. W., and Kaufman, Y. J.: Retrieval of biomass combustion rates and totals from fire radiative power observations: FRP derivation and calibration relationships between biomass consumption and fire radiative energy release, J. Geophys. Res., 110, D24311, https://doi.org/10.1029/2005JD006318, 2005.
WRAP: Western Regional Air Partnership, Development of 2000–04 Baseline Period and 2018 Projection Year Emission Inventories, Project No. 178-8, Prepared by Air Sciences, Inc., 2005.
Yokelson, R. J., Crounse, J. D., DeCarlo, P. F., Karl, T., Urbanski, S., Atlas, E., Campos, T., Shinozuka, Y., Kapustin, V., Clarke, A. D., Weinheimer, A., Knapp, D. J., Montzka, D. D., Holloway, J., Weibring, P., Flocke, F., Zheng, W., Toohey, D., Wennberg, P. O., Wiedinmyer, C., Mauldin, L., Fried, A., Richter, D., Walega, J., Jimenez, J. L., Adachi, K., Buseck, P. R., Hall, S. R., and Shetter, R.: Emissions from biomass burning in the Yucatan, Atmos. Chem. Phys., 9, 5785–5812, https://doi.org/10.5194/acp-9-5785-2009, 2009.
Yue, X., Mickley, L. J., Logan, J. A., and Kaplan, J. O.: Ensemble projections of wildfire activity and carbonaceous aerosol concentrations over the western United States in the mid-21st century, Atmos. Environ., 77, 767–780, https://doi.org/10.1016/j.atmosenv.2013.06.003, 2013.
Zhang, F., Wang, J., Ichoku, C., Hyer, E. J., Yang, Z., Ge, C., Su, S., Zhang, X., Kondragunta, S., Kaiser, J. W., Wiedinmyer, C., and da Silva, A.: Sensitivity of mesoscale modeling of smoke direct radiative effect to the emission inventory: a case study in north-ern sub-Saharan African region, Environ. Res. Lett., 9, 075002, https://doi.org/10.1088/1748-9326/9/7/075002, 2014.
Zhu, L., Val Martin, M., Gatti, L. V., Kahn, R., Hecobian, A., and Fischer, E. V.: Development and implementation of a new biomass burning emissions injection height scheme (BBEIH v1.0) for the GEOS-Chem model (v9-01-01), Geosci. Model Dev., 11, 4103–4116, https://doi.org/10.5194/gmd-11-4103-2018, 2018.
- Abstract
- Introduction
- Model and observations descriptions
- Underlying emissions and dry matter uncertainty
- How emissions uncertainty impacts mass concentrations and AOD
- Secondary organic aerosol from biomass burning and its implications
- How emissions uncertainty translates to air quality and fire PM exposure
- Impacts on the direct radiative effect
- Conclusions
- Data availability
- Author contributions
- Competing interests
- Acknowledgements
- Financial support
- Review statement
- References
- Supplement