the Creative Commons Attribution 4.0 License.
the Creative Commons Attribution 4.0 License.
 | 06 Jan 2020
Local and synoptic meteorological influences on daily variability in summertime surface ozone in eastern China
Tijian Wang
Huiling Yuan
Ozone pollution in China is influenced by meteorological processes on multiple scales. Using regression analysis and weather classification, we statistically assess the impacts of local and synoptic meteorology on daily variability in surface ozone in eastern China in summer during 2013–2018. In this period, summertime surface ozone in eastern China (20–42∘ N, 110–130∘ E) is among the highest in the world, with regional means of 73.1 and 114.7 µg m−3, respectively, in daily mean and daily maximum 8 h average. Through developing a multiple linear regression (MLR) model driven by local and synoptic weather factors, we establish a quantitative linkage between the daily mean ozone concentrations and meteorology in the study region. The meteorology described by the MLR can explain ∼43 % of the daily variability in summertime surface ozone across eastern China. Among local meteorological factors, relative humidity is the most influential variable in the center and south of eastern China, including the Yangtze River Delta and the Pearl River Delta regions, while temperature is the most influential variable in the north, covering the Beijing–Tianjin–Hebei region. To further examine the synoptic influence of weather conditions explicitly, six predominant synoptic weather patterns (SWPs) over eastern China in summer are objectively identified using the self-organizing map clustering technique. The six SWPs are formed under the integral influence of the East Asian summer monsoon, the western Pacific subtropical high, the Meiyu front, and the typhoon activities. On average, regionally, two SWPs bring about positive ozone anomalies (1.1 µg m−3 or 1.7 % and 2.7 µg m−3 or 4.6 %), when eastern China is under a weak cyclone system or under the prevailing southerly wind. The impact of SWPs on the daily variability in surface ozone varies largely within eastern China. The maximum impact can reach ±8 µg m−3 or ±16 % of the daily mean in some areas. A combination of the regression and the clustering approaches suggests a strong performance of the MLR in predicting the sensitivity of surface ozone in eastern China to the variation of synoptic weather. Our assessment highlights the importance of meteorology in modulating ozone pollution over China.
- Article
(12207 KB) - Full-text XML
-
Supplement
(1699 KB) - BibTeX
- EndNote


Surface ozone is a major air pollutant detrimental to human health (Jerrett et al., 2009) and vegetation growth (Yue et al., 2017). Ozone exposure is estimated to be associated with over 0.2 million premature deaths globally in 1 year (Cohen et al., 2017; Liang et al., 2018). The dominant source of surface ozone is the photochemical oxidation of volatile organic compounds (VOCs) and carbon monoxide (CO) in the presence of nitrogen oxides (NOx; Monks et al., 2015). In recent decades, China has been suffering from severe ozone pollution, causing worldwide concern (Verstraeten et al., 2015). High ozone concentrations exceeding China's national air quality standard (200 and 160 µg m−3, respectively, for hourly and 8-hourly maximum values) occur frequently in major Chinese cities in the three most developed regions, the Beijing–Tianjin–Hebei (BTH) region (Wang et al., 2006a; Li et al., 2017), the Yangtze River Delta (YRD; Shu et al., 2016, 2019), and the Pearl River Delta (PRD; Y. Wang et al., 2017; Wang et al., 2018). An increase of 1 %–3 % per year in surface ozone since 2000 is observed at urban and regional background sites in these three city clusters (Wang et al., 2012; Zhang et al., 2014; Ma et al., 2016; Sun et al., 2016; Gao et al., 2017) and at a global baseline station in western China (Xu et al., 2016).
Surface ozone concentrations in China largely depend on emissions and meteorology (Han et al., 2018a, 2019; Lu et al., 2019a). Anthropogenic and natural emissions from both native and foreign sources provide precursors for the formation of high ozone levels in China (Ni et al., 2018; Han et al., 2019), while meteorology can influence the variability in surface ozone from the instantaneous to decadal scale through its modulation of chemical and physical processes involved (T. Wang et al., 2017). On a decadal scale, both observations (Zhou et al., 2013) and simulations (S. Li et al., 2018) show that surface ozone in southern China correlates positively to the strength of the East Asian summer monsoon (EASM).
The daily variation of surface ozone in China is sensitive to synoptic weather systems, as illustrated by studies for BTH (Zhang et al., 2012; Huang et al., 2015), the YRD (Shu et al., 2016, 2019), the PRD (Zhang et al., 2013; Jiang et al., 2015), and other regions of China (Tan et al., 2018). Frontal systems can drive the transboundary transport of ozone in northern China (Ding et al., 2015; Dufour et al., 2015). Downdrafts in the periphery circulation of a typhoon system can strongly enhance surface ozone before the typhoon landing in eastern or southern China (Jiang et al., 2015; Shu et al., 2016). Zhao and Wang (2017) suggested that a stronger western Pacific subtropical high (WPSH) can decrease and increase surface ozone concentrations, respectively, over southern China and northern China in summer. Moreover, surface ozone concentrations also vary with mesoscale weather systems in hours (Hu et al., 2018), such as the mountain–valley circulation (Wang et al., 2006b) and the land–sea breezes (Wang et al., 2018). Despite these discussed mechanisms on how weather systems influence ozone concentrations in China, there are a lack of quantitative assessments on the influences of these weather systems on ozone pollution.
Weather systems on different scales bring about different changes in local meteorological variables, which, in turn, impact chemical and physical processes that modulate surface ozone concentrations. However, the relative importance of local meteorological factors to surface ozone in China is still unclear. Previous studies suggested the importance of temperature, relative humidity, and winds to surface ozone in different regions of China (Lou et al., 2015; Pu et al., 2017; Zhan et al., 2018). The key influential meteorological factors vary from region to region (Gong et al., 2018; Chen et al., 2019). In general, high ozone episodes commonly appear under weak wind, high temperature, low humidity, and clear conditions (Bloomfield al., 1996; Zanis et al., 2000, 2011; Ordóñez et al., 2005). These weather conditions can enhance stagnation and production of ozone (Camalier et al., 2007; Shen and Mickley, 2017). Variations in these local meteorological variables depend on the dominant weather systems (Davis et al., 1998; Han et al., 2018b; Leung et al., 2018).
To have a comprehensive and quantitative understanding of how weather influences ozone pollution in China is the primary motivation of this study, in which we aim to quantify the impacts of meteorology, specifically the dominant synoptic weather systems and the key local meteorological variables, on daily variations in surface ozone in eastern China, including three representative megacity clusters, BTH, the YRD, and the PRD. Surface ozone in China was not regularly and systematically monitored until 2012, and since 2013, real-time hourly ozone data have been available online from the China Ministry of Ecology and Environment (MEE; http://www.mee.gov.cn/, last access: 10 December 2019; T. Wang et al., 2017).
In this study, the ground ozone observations from MEE covering the 2013–2018 period are used. First, we characterize the seasonal variations in surface ozone in eastern China and the interannual changes during 2013–2018 in summer (June–August), which is the season of interest in this study. Second, we search for a linkage between the daily variation of surface ozone and the local and synoptic meteorological factors and develop a multiple linear regression (MLR) model based on the linkage, using the data during 2013–2018. Third, we further examine the sensitivity of daily surface ozone to the variation in synoptic weather systems. Considering the complexity of the synoptic meteorology in eastern China (Ding et al., 2017; Han et al., 2018b), we employ an objective clustering technique, the self-organizing map (SOM), to identify the predominant synoptic weather patterns (SWPs). In the following sections, we introduce the data and methods in Sect. 2. The seasonal and interannual variations in surface ozone in eastern China are characterized in Sect. 3. Section 4 illustrates the linkage between ozone variability and meteorology on both local and synoptic scales, while Sect. 5 describes sensitivity of surface ozone to various typical SWPs over all of eastern China. Finally, we discuss our results and draw conclusions in Sect. 6.
2.1 Surface ozone observations and meteorological data
Hourly surface ozone measurements from the MEE observation network averaged over the stations in each city were used in the study. The measurements were downloaded from http://beijingair.sinaapp.com/ (last access: 10 December 2019), which were previously archived at http://pm25.in (last access: 10 December 2019), a mirror of data from the official MEE publishing platform (http://106.37.208.233:20035/, last access: 10 December 2019). The network covers 63 cities in eastern China (20–42∘ N, 110–130∘ E) in 2013, increasing to 118 in 2014 and 185 during 2015–2018. The locations of the 185 cities are shown in Fig. 1, including 13, 26, and 9 cities, respectively, in BTH, the YRD, and the PRD. The unit of ozone concentrations in the original records and in this study is “µg m−3”, with a conversion factor of 1 µg m ppbv at 273 K and 1013.25 hPa.
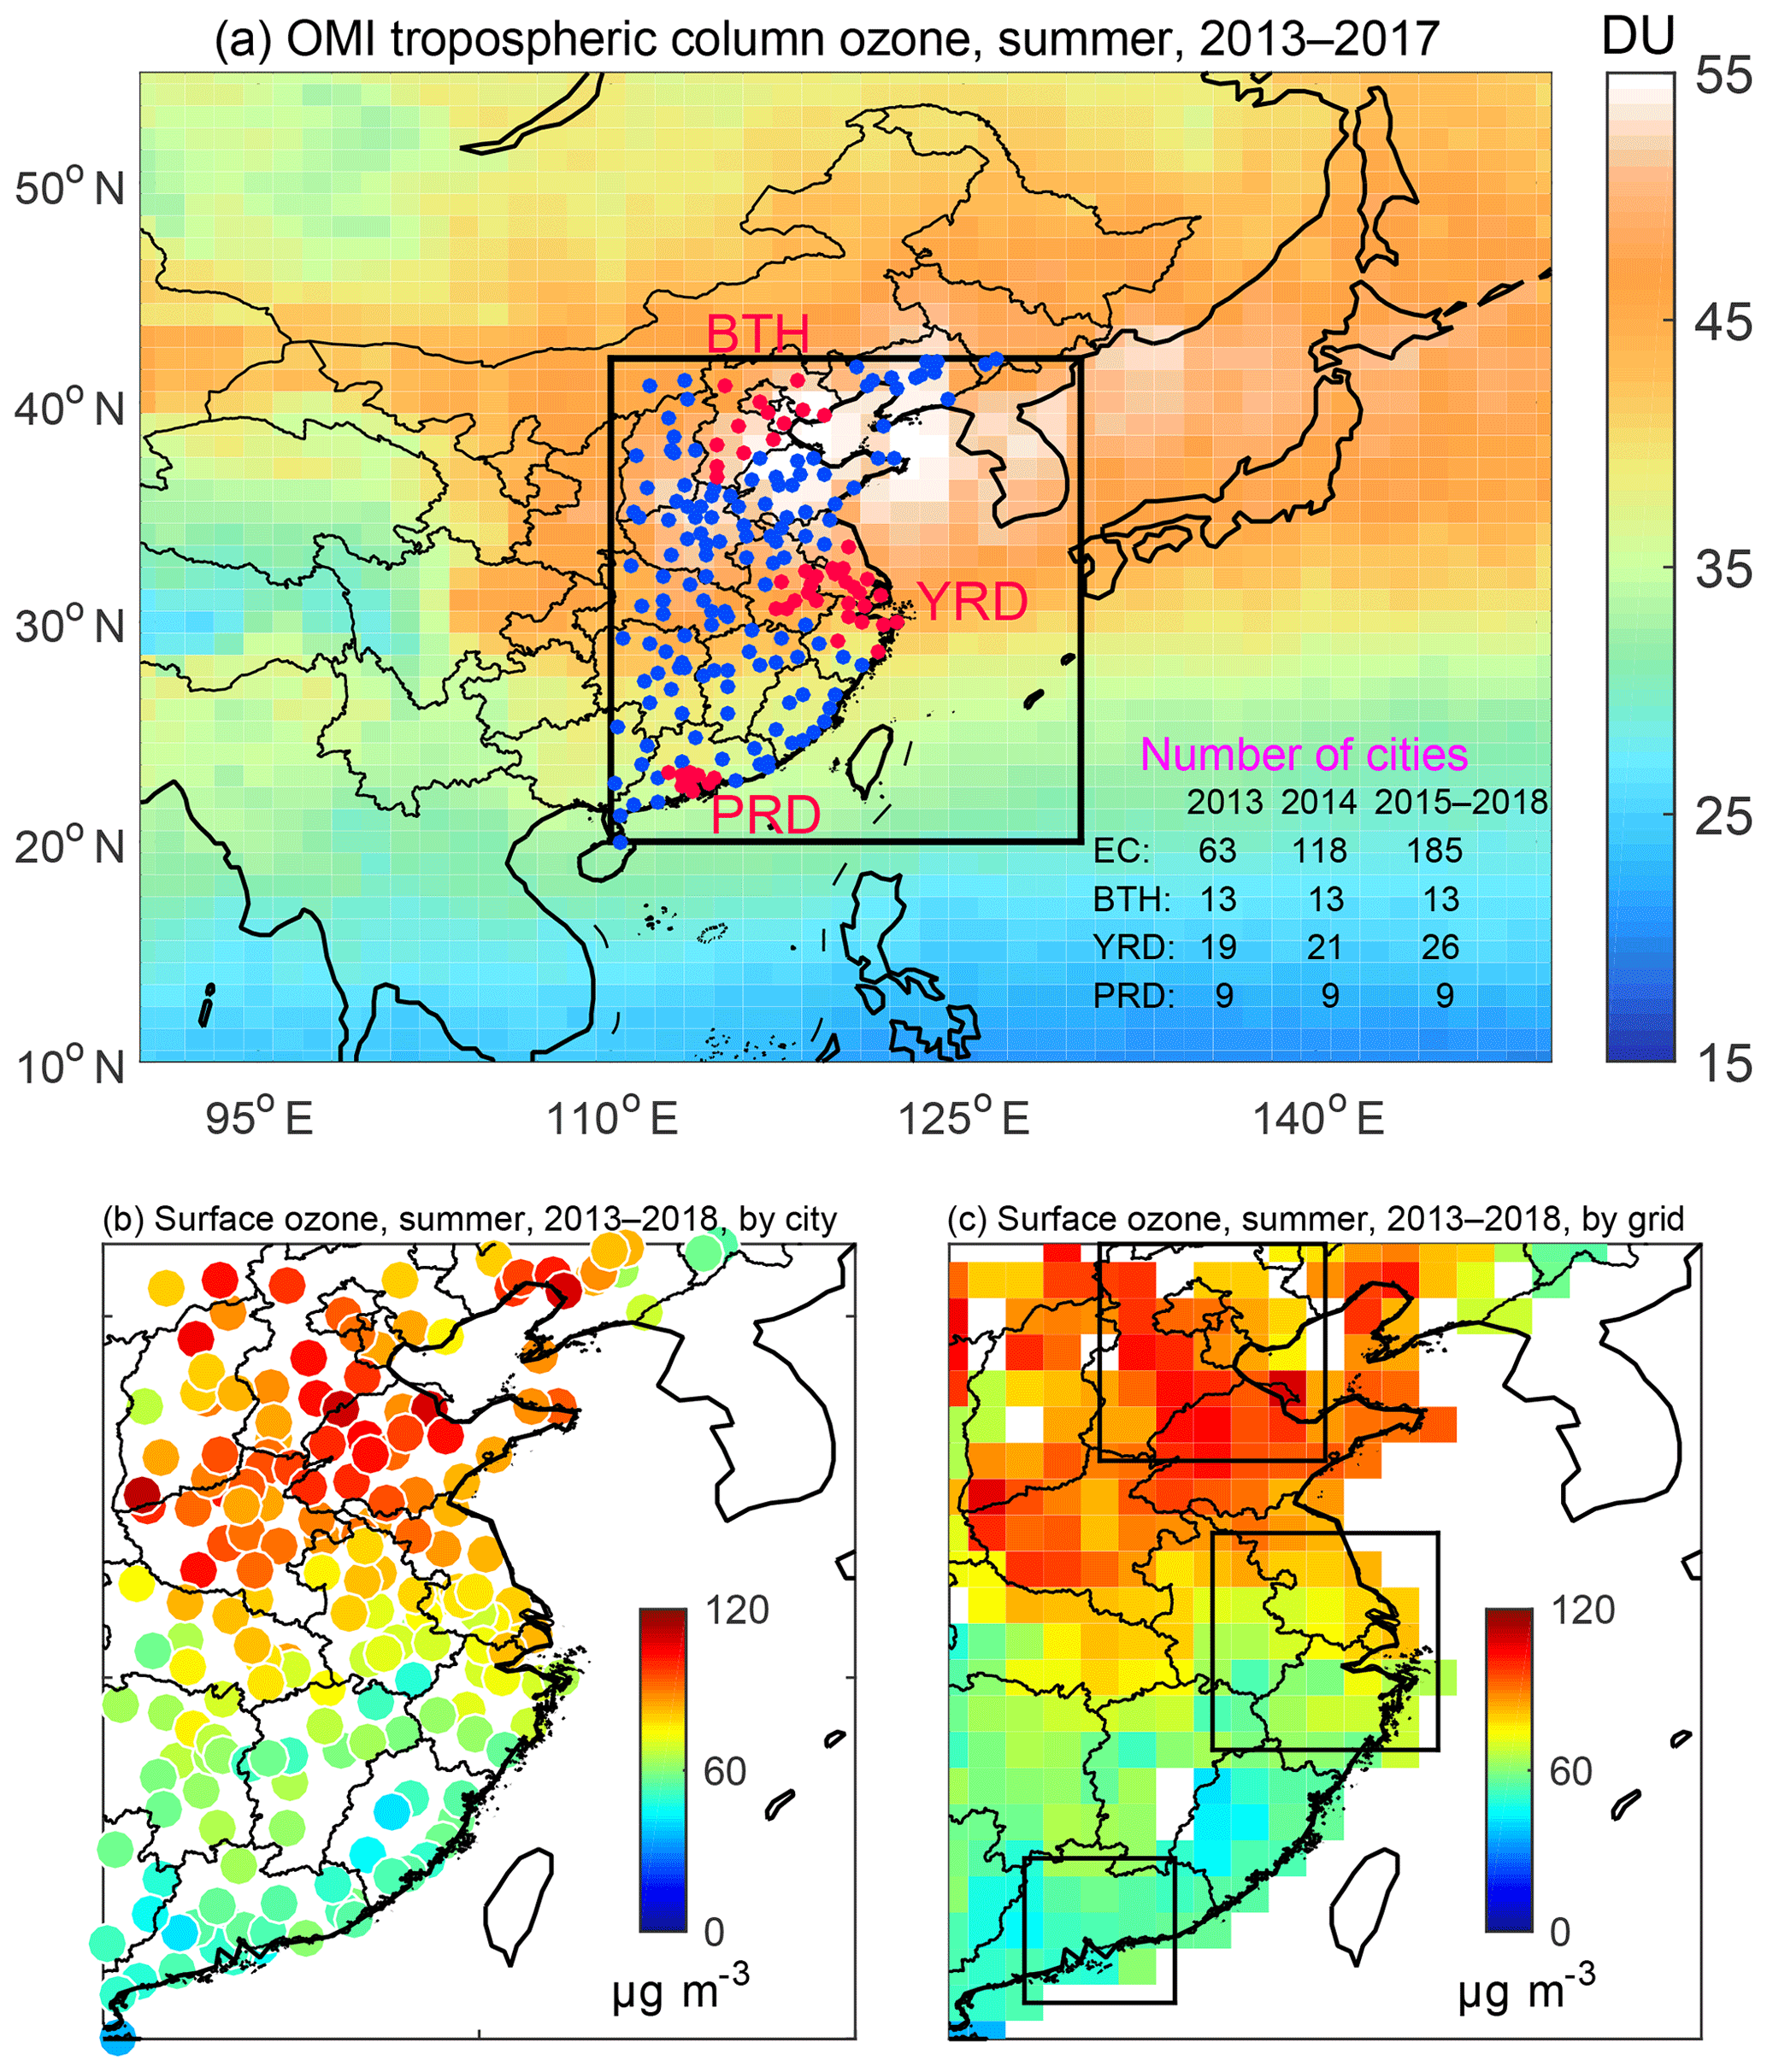
Figure 1(a) Distribution of the cities (dots) with air quality monitoring stations in eastern China (EC; 20–42∘ N, 110–130∘ E; the boxed area) and the summer mean tropospheric column ozone (color shades; in Dobson units – DU) from the OMI satellite measurements during 2013–2017. Summertime mean surface ozone (in µg m−3) over eastern China during 2013–2018, shown (b) by city and (c) by grid (see Sect. 2.1). The red dots in (a) indicate the cities in BTH, YRD, and PRD. The three boxed areas in (c) indicate BTH (36–42∘ N, 114–120∘ E), YRD (28–34∘ N, 117–123∘ E), and PRD (21–25∘ N, 112–116∘ E). The unfilled grids in (c) are due to the lack of monitoring stations nearby. The OMI tropospheric column ozone monthly data at 1∘ latitude by 1.25∘ longitude were obtained from NASA Goddard Space Flight Center (https://acd-ext.gsfc.nasa.gov/Data_services/cloud_slice/, last access: 10 December 2019).
The National Centers for Environmental Prediction (NCEP) Final (FNL) Operational Global Analysis data during the same period were acquired from https://rda.ucar.edu/datasets/ds083.2/ (last access: 10 December 2019). The data are available on 1∘ latitude × 1∘ longitude grids every 6 h at the surface and at 26 layers from 1000 to 10 hPa. We took daily averaged pollution and meteorological data in summer from 2013 to 2018. The ozone–weather relationship is examined using the daily mean data unless stated otherwise.
Using inverse-distance weighting (Tai et al., 2010), we interpolated the pollution measurements from the cities onto the FNL grid (1∘ × 1∘) to produce continuous gridded data. The ozone at each FNL grid was calculated with a weighted average of the concentration in the cities within a search distance (dmax) from that grid, following the equation
where zj is the calculated ozone concentrations at grid j, zi is the observed ozone concentration in city i, di,j is the distance between city i and the center of grid j, nj is the number of the cities within dmax from grid j (, and k is a parameter measuring the influence of distance on the target grid. We used 2 for k and a 1∘ distance in the latitude–longitude grid for dmax in the interpolation. The generated gridded ozone data cover most of the mainland in eastern China (Fig. 1c). The gridded data were used in this study unless stated otherwise.
2.2 Development of a prediction model of surface ozone
MLR is an effective and widely used way to describe the relationship between meteorology and air quality and thus to help prediction of air quality (Shen et al., 2015; Otero et al., 2016; Li et al., 2019). MLR establishes a linear function between a scalar response and the explanatory variables. In this study, we applied stepwise MLR to quantitatively correlate daily surface ozone and meteorology in summer. Considering the combined effect of meteorology at various scales, we used both local meteorological variables and synoptic circulation factors as predictors, following Shen et al. (2017), who showed that, compared with regression models only considering local meteorology, adding the synoptic factors in MLR can significantly improve the model performance. The MLR takes the following form:
where is the predicted value of surface ozone, b is the intercept term, Xi is the local meteorological variables with a total number of K1, Sj is the synoptic meteorological factors with a total number of K2, and αi and βj are the regression coefficients. We used 10 local meteorological variables (K1=10), including the relative humidity at 2 m (RH2m), cloud fraction (CF), temperature at 2 m (T2m), planetary boundary layer height (PBLH), zonal wind at 850 hPa (U850), meridional wind at 850 hPa (V850), vertical wind at 850 hPa (W850), wind speed at 850 hPa (WS850), geopotential height at 850 hPa (HGT850), and sea level pressure (SLP), all of which were identified as being significantly (p<0.05) correlated to the daily variations in surface ozone in part of eastern China, as shown in Fig. 2. Cloud fraction retrievals at 1∘ × 1∘ grids were from the spaceborne atmospheric infrared sounder (AIRS) instrument (AIRS3STD daily product; https://disc.gsfc.nasa.gov/, last access: 10 December 2019). The other nine local meteorological variables were from FNL data (Sect. 2.1). We computed the anomalies of meteorological variables and ozone on a given day by taking the difference between the value of a given meteorological variable (or ozone) on that day and the mean value of the meteorological variable (or ozone) in that month. Thus, all the data were detrended, and the influences of meteorology on the ozone variability on longer timescales (trends and annual and seasonal variations) were generally removed. Any anomaly of a variable (or ozone) divided by its corresponding monthly mean is referred to as the relative anomaly of that variable (or ozone), with a unit of percent.

Figure 2Correlation coefficients (r) between daily surface ozone and each of the 10 meteorological variables in summer during 2013–2018. The black dot in a grid indicates that the r in that grid is significant (p<0.05). The regional mean r is shown in the bottom right corner of each panel in purple if the r is significant (p<0.05) and in grey if the r is insignificant. The abbreviations are for relative humidity at 2 m (RH2m), cloud fraction (CF), temperature at 2 m (T2m), planetary boundary layer height (PBLH), zonal wind at 850 hPa (U850), meridional wind at 850 hPa (V850), vertical wind at 850 hPa (W850), wind speed at 850 hPa (WS850), geopotential height at 850 hPa (HGT850), and sea level pressure (SLP).
For Sj in Eq. (2), we also identified two synoptic factors through the singular value decomposition (SVD) of the spatial correlations between surface ozone and local meteorological variables in eastern China (Shen et al., 2017). The SVD approach effectively extracted representative signals from the spatial distribution of the correlation coefficients. The extracted information was then used to characterize the spatial patterns of the meteorological variables on a synoptic scale by making SVD inverse. For each of the FNL grids in eastern China, we constructed the synoptic circulation factors as follows. First, we calculated the correlation coefficients between daily mean surface ozone at a given grid and each of the 10 meteorological variables at all the grids in eastern China in summer during 2013–2018. For example, the correlations for the grid of Nanjing are shown in Fig. S1 in the Supplement, which indicates that surface ozone in Nanjing is correlated to the meteorology in the surrounding regions. We made a matrix A that consists of the correlation coefficients for that grid with elements of 21 (numbers of grids in longitude) ×23 (numbers of grids in latitude) ×10 (numbers of the local meteorological variables). Second, to fit the decomposition, we aligned the dimension of longitude–latitude into one column and reshaped matrix A into a 483 (longitude × latitude) ×10 two-dimensional matrix F. The SVD decomposed F used the equation
where U is 483×10 matrix, L is a 10×10 diagonal matrix with non-negative numbers on the diagonal, and V is also a 10×10 matrix. The columns of the three transformations together characterize SVD modes, with 10 modes in total. Each column of U represents the spatial weights of the SVD mode, and each column of V represents the variable weights in the SVD mode. The spatial and variable weights of the first two SVD modes for the Nanjing grid are shown in Fig. S2. The pattern of the spatial weight of the first SVD mode for the Nanjing grid (Fig. S2a) is similar to the pattern of the correlations between surface ozone and the relative humidity (Fig. S1a) and cloud fraction (Fig. S1b). The first SVD mode is more correlated to the relative humidity and cloud fraction than other variables (Fig. S2b). Therefore, the first SVD mode for the Nanjing grid is related to chemical processes of ozone. In contrast, the second SVD mode for the Nanjing grid is more related to transport than chemical processes (Fig. S2d). Third, we assigned the anomalies of the daily mean values of the 10 local meteorological variables in eastern China to a 552 (days in the summers of 2013–2018) ×21 (longitude) ×23 (latitude) ×10 (meteorology) four-dimensional matrix M. At each grid, we normalized the time series of each variable to the zero mean and unit standard deviation. Then, the magnitude of each SVD mode for every day t was calculated by inverse SVD:
where Uk and Vk are the kth columns of U and V, respectively. Sk,t is a scalar depicting the magnitude of the kth SVD mode. Sk,t refers to a newly produced meteorological field that represents the influence of synoptic meteorology on ozone variability. We implemented the procedure at every grid in eastern China. The first two SVD modes can generally explain 55 %–85 % of the total variance. They can, respectively, reflect the dynamical or thermal characteristics of synoptic meteorology (Shen et al., 2017). Therefore, we applied the primary two SVD modes in the MLR (K2=2).
We used the leave-one-out cross validation to avoid overfitting of the MLR for each grid. Data during the study period (summers of 2013–2018) included 552 d observations. Each time, one observation in the time series was reserved as the test set, and the remaining ones were used as the training set. The process was repeated until all observations had been predicted. Every observation was to be a test set once and a training set 551 times.
We measured the relative importance of each of the meteorological variables to ozone by its relative contribution to the total explained variance of the MLR. The weight of each predictor (wi) was calculated from the normalized MLR coefficient (zk):
where zk is
and the number of all the predictors is 12, including 10 local and 2 synoptic meteorological factors (Sect. 2.2). ck is the regression coefficient, referring to αi or βj in Eq. (2). sk is the standard deviation of a predictor, i.e. Xi or Sj in Eq. (2). sy is the standard deviation of the observed daily surface ozone.

Figure 3Seasonal variations in (a) daily mean surface ozone concentrations, (b) daily maximum 8 h average surface ozone concentrations, (c) the regional exceedance probability of ozone, and (d) the probability of ozone being the primary pollutant. The values are regional means over eastern China (EC) and the three subregions (BTH, YRD, and PRD) over 2014–2017. The values were calculated from the observations in the corresponding cities. The pink shaded area in each panel indicates the range of the ±50 % standard deviation of the corresponding variable for eastern China. The vertical shading over summer shows the season of interest in this study. The means of the corresponding variables for eastern China and the three subregions in summer are shown in the top left corner of each panel.
2.3 Classification of the synoptic weather patterns
Weather classification is a well-established tool for characterizing atmospheric processes on multiple scales and further for studying the air-pollution–weather relationship (Han et al., 2018b). The methods for weather classification can be generally categorized into three groups: subjective, mixed, and objective, depending on the automatic degree during the classification process (Huth et al., 2008). The methods can also be categorized in more detail according to the basic features of each classification algorithm (Philipp et al., 2014). Depending on the study domain and research objectives, different meteorological variables including geopotential height, mean sea level pressure, and zonal and meridional winds are used for the classification.
The SOM, an artificial neural network method with unsupervised learning (Kohonen, 1990; Michaelides et al., 2007), is widely used in cluster analysis in atmospheric sciences (Jiang et al., 2017; Liao et al., 2018; Stauffer et al., 2018) because of its superiority over other algorithms (Liu et al., 2006; Jensen et al., 2012). The SOM performs a nonlinear projection from the input data space to a two-dimensional array of nodes objectively. Each node is representative of the input data. The SOM allows missing values in the input data and can effectively visualize the relationships between different output nodes (Hewitson and Crane, 2002).
The FNL geopotential height fields (Sect. 2.1) at 850 hPa can capture the synoptic circulation variations over eastern China well (Han et al., 2018b). In this study, we used the geopotential height at 850 hPa in 2013–2018 as the input for the SOM. Each of the SOM output nodes corresponds to a cluster of SWPs. Finally, we identified six predominant SWPs over eastern China in summer. All days in the summers of 2013–2018 were included in the clustering results.
Figures 3 and 4, respectively, show the seasonal and interannual variations in the regional mean surface ozone concentrations in eastern China and the three subregions (BTH, the YRD, and the PRD) during 2013–2018. Among n cities with air quality monitoring in a given region, if ozone levels exceed the national air quality standard in m cities, we defined the ratio of m to n as the regional exceedance probability of ozone (Fig. 3c). Higher regional exceedance probability implies ozone pollution over a wider surface area in that region. The primary pollutant (Fig. 3d) is defined in the air quality index (AQI) system, in which the AQI for an individual air pollutant is calculated based on the concentrations of that pollutant. When the individual AQI of a pollutant on a day is both above 50 and the largest among all the pollutants, that pollutant is defined as the primary pollutant on that day.

Figure 4Interannual variations in regional daily mean (a–d), daytime mean (e–h), and nighttime mean (i–l) surface ozone concentrations over eastern China and the three subregions in summer from 2013 to 2018. The values were calculated from the observations in the corresponding cities. The error bar indicates values that are 2 times the standard deviation. The red numbers are the increasing rates of the regional mean ozone in summer (in µg m−3 per year and in % per year) as well as the corresponding significant level.
On average, regionally, the seasonality of daily mean ozone is similar to that of daily maximum 8 h average (MDA8) ozone in eastern China as well as in the three subregions (BTH, the YRD, and the PRD; Fig. 3a and b). In BTH, both the daily mean and MDA8 have a unimodal seasonal pattern and peak in June, being 99.5 and 158.4 µg m−3, respectively. The extremely high ozone in June leads to a simultaneous seasonal maximum in both the probability of the regional exceedance (46.9 % of the cities with ozone measurements in BTH) and primary pollutant (68.7 % of the days in June; Fig. 3c and d). The seasonal peak of surface ozone in BTH mainly results from enhanced photochemistry due to stronger solar radiation and lower humidity (Hou et al., 2014). Surface ozone over the YRD reaches a seasonal maximum in May (82.6 and 127.7 µg m−3, respectively, for daily mean and MDA8 ozone), earlier than that over BTH. In contrast, the seasonal peak over the PRD occurs at the latest in October (71.5 and 118.1 µg m−3, respectively, for daily mean and MDA8 ozone). Although temperature is higher in summer than in the other seasons, the EASM brings more cloudy weather, stronger convection, and clearer air from the oceans, weakening the production and accumulation of surface ozone levels over the YRD and PRD (Hou et al., 2015; S. Li et al., 2018). The pre-monsoon and post-monsoon peaks of surface ozone, respectively, in the YRD and PRD were also reported in previous studies (He et al., 2008; Wang et al., 2009).
On average, regionally and seasonally, daily mean and MDA8 ozone levels over eastern China in summer are 73.1 and 114.7 µg m−3, respectively. Among the three subregions, summertime surface ozone is highest in BTH (88.3 and 143.7 µg m−3, respectively, for daily mean and MDA8 ozone), second highest in the YRD (72.9 and 114.7 µg m−3), and lowest in the PRD (51.0 and 91.9 µg m−3; Fig. 3a and b). These regional differences among the three subregions appear similar to those in the ozone monitoring instrument (OMI) tropospheric column ozone (Fig. 1). The regional exceedance probability of ozone over eastern China reaches 17.7 % in the summer, accompanied by a high percentage (45.6 %) of ozone, which is the primary pollutant. Among the three subregions, BTH has the highest regional exceedance probability of ozone (35.1 %) and probability of ozone being the primary pollutant (55.8 %).
A rapid increase in summertime surface ozone over China after 2012 was observed in recent studies (Lu et al., 2018; Silver et al., 2018; Shen et al., 2019a; Li et al., 2019). We examine the regional changes over eastern China in daily, daytime (07:00–18:00 CST), and nighttime (19:00–06:00 CST) means (Fig. 4). The increases of ∼3–6 µg m−3 or 4 %–8 % per year are found significantly (p<0.05) over eastern China, BTH, and the YRD during 2013–2018, while the increase over the PRD during the same period is insignificant. Silver et al. (2018) found that the annual mean MDA8 ozone increased significantly (p<0.05) at ∼50 % of the over 1000 stations across China from 2015 to 2017, with a median rate of 4.6 µg m−3 yr−1. The increase in surface ozone over eastern China was also captured by the OMI satellite records, reported by Shen et al. (2019a). The absolute increasing rate (in µg m−3) in daytime is higher than that in nighttime, whereas the relative increasing rate (in %) in daytime is lower than that in nighttime (Fig. 4e–h vs. Fig. 4i–l). The increase in ozone over China may result from both meteorology and anthropogenic emissions. During 2013–2017, the anthropogenic emissions of NOx in China declined (Zheng et al., 2018), but the anthropogenic emissions of VOCs changed little (Zheng et al., 2018; Shen et al., 2019b). Li et al. (2019) suggested that the ∼40 % decrease in fine particulate matter (PM2.5) is the primary reason for the rising surface ozone in summer during 2013–2017, as the aerosol sink of hydroperoxy radicals was weakened and thus ozone production was enhanced. Figure 4b demonstrates a strong increase in summertime surface ozone over BTH from 2016 to 2017, which is probably related to the extremely high temperature in 2017 (Herring et al., 2019). The sudden decline in summertime surface ozone over the PRD from 2016 to 2017 (Fig. 4d) is likely associated with the extremely heavy precipitation in 2017 (Herring et al., 2019).
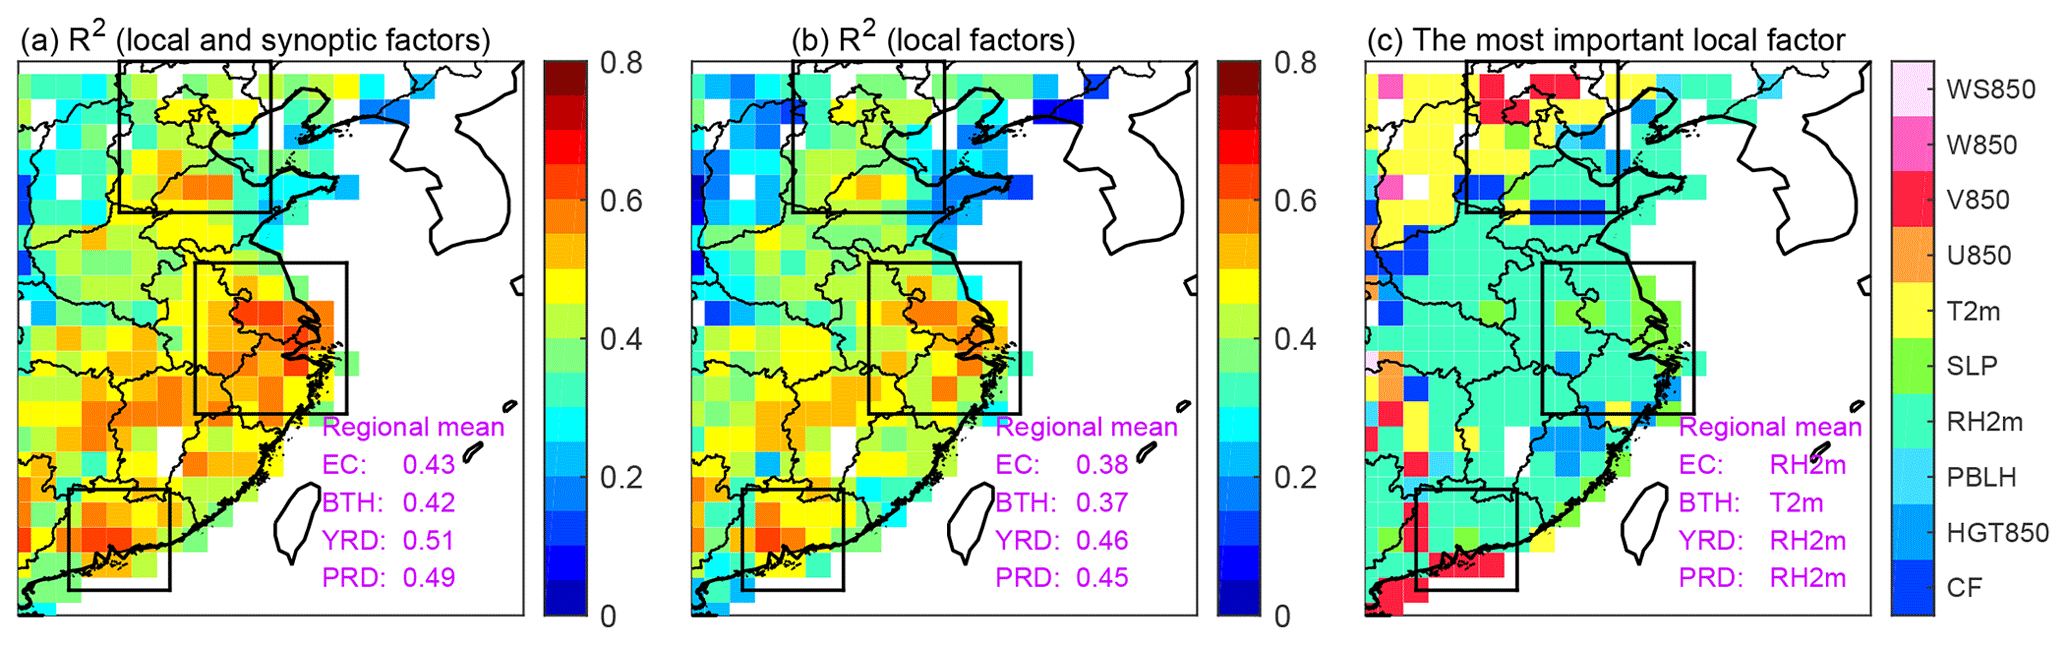
Figure 5Cross-validated coefficient of determination (R2) between the observed and predicted daily surface ozone in summer during 2013–2018 for the MLR (a) with both local and synoptic meteorological factors and (b) with only local meteorological factors. (c) The most important variable among the local meteorology for ozone in the MLR. The boxed areas indicate BTH, YRD, and PRD, respectively, in the north, center, and south of the study domain. The regional mean R2 in (a) and (b) and meteorological variable in (c) are shown in the bottom right corner of each panel. The abbreviations are for cloud fraction (CF), geopotential height at 850 hPa (HGT850), planetary boundary layer height (PBLH), relative humidity at 2 m (RH2m), sea level pressure (SLP), temperature at 2 m (T2m), zonal wind at 850 hPa (U850), meridional wind at 850 hPa (V850), vertical wind at 850 hPa (W850), and wind speed at 850 hPa (WS850).
Meteorological factors can individually or integrally modulate surface ozone concentration through their impacts on relevant chemical, dynamical, and thermal processes in the atmosphere. Figure 2 shows a simple way to examine the overall effect of each of the meteorological variables statistically by correlating surface ozone with a selected set of local meteorological variables during 2013–2018 summers. Among all the meteorological variables, relative humidity shows the highest correlation with surface ozone in eastern China on average regionally (). Relative humidity can influence ozone through various processes. Atmospheric water vapor can directly influence ozone concentrations by HOx (HOx = OH + H + peroxy radicals) chemistry in complicated ways (Zanis et al., 2002; Jacob and Winner, 2009; Lu et al., 2019b). Moreover, a higher relative humidity is usually associated with higher fractions of clouds, which can slow the photochemical production of surface ozone. Higher relative humidity may also somewhat be linked with larger atmospheric instability, favoring the dispersion of surface ozone (Camalier et al., 2007). The correlation map of the cloud fraction is similar to that of relative humidity (Fig. 2a and b). The correlation of temperature with ozone is higher in the north than in the south over eastern China (Fig. 2c), which is similar to the pattern found in the eastern United States (Camalier et al., 2007; Shen et al., 2016). Meridional wind at 850 hPa is correlated to surface ozone positively in the north but negatively in the most areas of the south (Fig. 2f). In summer, the south-westerly monsoon wind prevails over eastern China (Fig. S3). Higher meridional wind brings clean and humid marine air to the south, while it transports ozone and its precursors from the south to the north. All the meteorological variables are not independent of each other. Overall, the meteorological variables that are related to photochemistry processes (relative humidity, cloud fraction, and temperature) have a more significant correlation than transport-related variables (zonal, meridional, and vertical winds and wind speed; Fig. 2), implying greater effects of the chemical process than physical transport. S. Li et al. (2018) also suggested that the chemical process is the uppermost factor controlling surface ozone levels over eastern China in summer.
Combining the effects of different meteorological variables, we applied the MLR (Sect. 2.2) using predictors of both local and synoptic factors to simulate summertime daily surface ozone in eastern China. The MLR was evaluated using the leave-one-out cross validation to avoid overfitting. The MLR performs strongly, as it can explain 14 %–65 % of variations in the observed surface ozone concentrations, yielding a regional mean coefficient of determination (R2) of 43 % (Fig. 5a). The mean absolute error (MAE) and the root-mean-square error (RMSE) of regional mean ozone anomalies in eastern China between observations and predictions by the MLR are 12.0 and 7.1 µg m−3, respectively (Fig. 6a). Geographically, the model performs better in the south (R2=0.51 in the YRD and R2=0.49 in the PRD) than in the north (R2=0.42 in BTH; Fig. 5a). Compared with the simulation that only considers the local meteorological variables in the MLR, the model performance is improved overall in eastern China when both local and synoptic meteorological factors are considered (Fig. 5a vs. b). Shen et al. (2017) found that, compared with the MLR that describes monthly PM2.5 in the United States only using local meteorological factors, the inclusion of synoptic meteorological factors in the MLR increases R2 from 34 % to 43 %. We also conducted the stepwise MLR using local and synoptic meteorology without detrending the input data. The results show that meteorology can explain 18 % of the enhancement in the regional mean of summertime surface ozone over eastern China from 2013 to 2018, and the explained variance is 16 %, 41 %, and 44 % for BTH, the YRD, and the PRD, respectively (Fig. S4).
We applied the MLR to identify the dominant meteorological drivers for ozone variability (Sect. 2.2). Among the local meteorology, relative humidity is dominant over ∼51 % of the areas of eastern China, mainly in the central and the southern regions including the YRD and PRD (Fig. 5c), although on a city scale in the PRD, Zhao et al. (2016) suggested that sea level pressure is the most significant variable for MDA8 ozone in Hong Kong. Air temperature is the most important local meteorological variable in ∼17 % of the areas of eastern China, specifically in the north including BTH (Fig. 5c). The importance of temperature to surface ozone over BTH was also suggested by Chen et al. (2019). Previous studies found that temperature and relative humidity showed pronounced impact on ozone in the north and south of the eastern United States, respectively (Camalier et al., 2007; Porter et al., 2015). The difference of the most influential variables between the south and north in eastern China is similar to that in the eastern United States. In Europe, Otero et al. (2016) suggested that temperature is the most important local meteorological driver over a major part of Europe. On average, regionally, the second most important meteorological variable for the daily surface ozone variation in eastern China, BTH, the YRD, and the PRD is temperature, relative humidity, sea level pressure, and meridional wind at 850 hPa, respectively (Fig. 6).
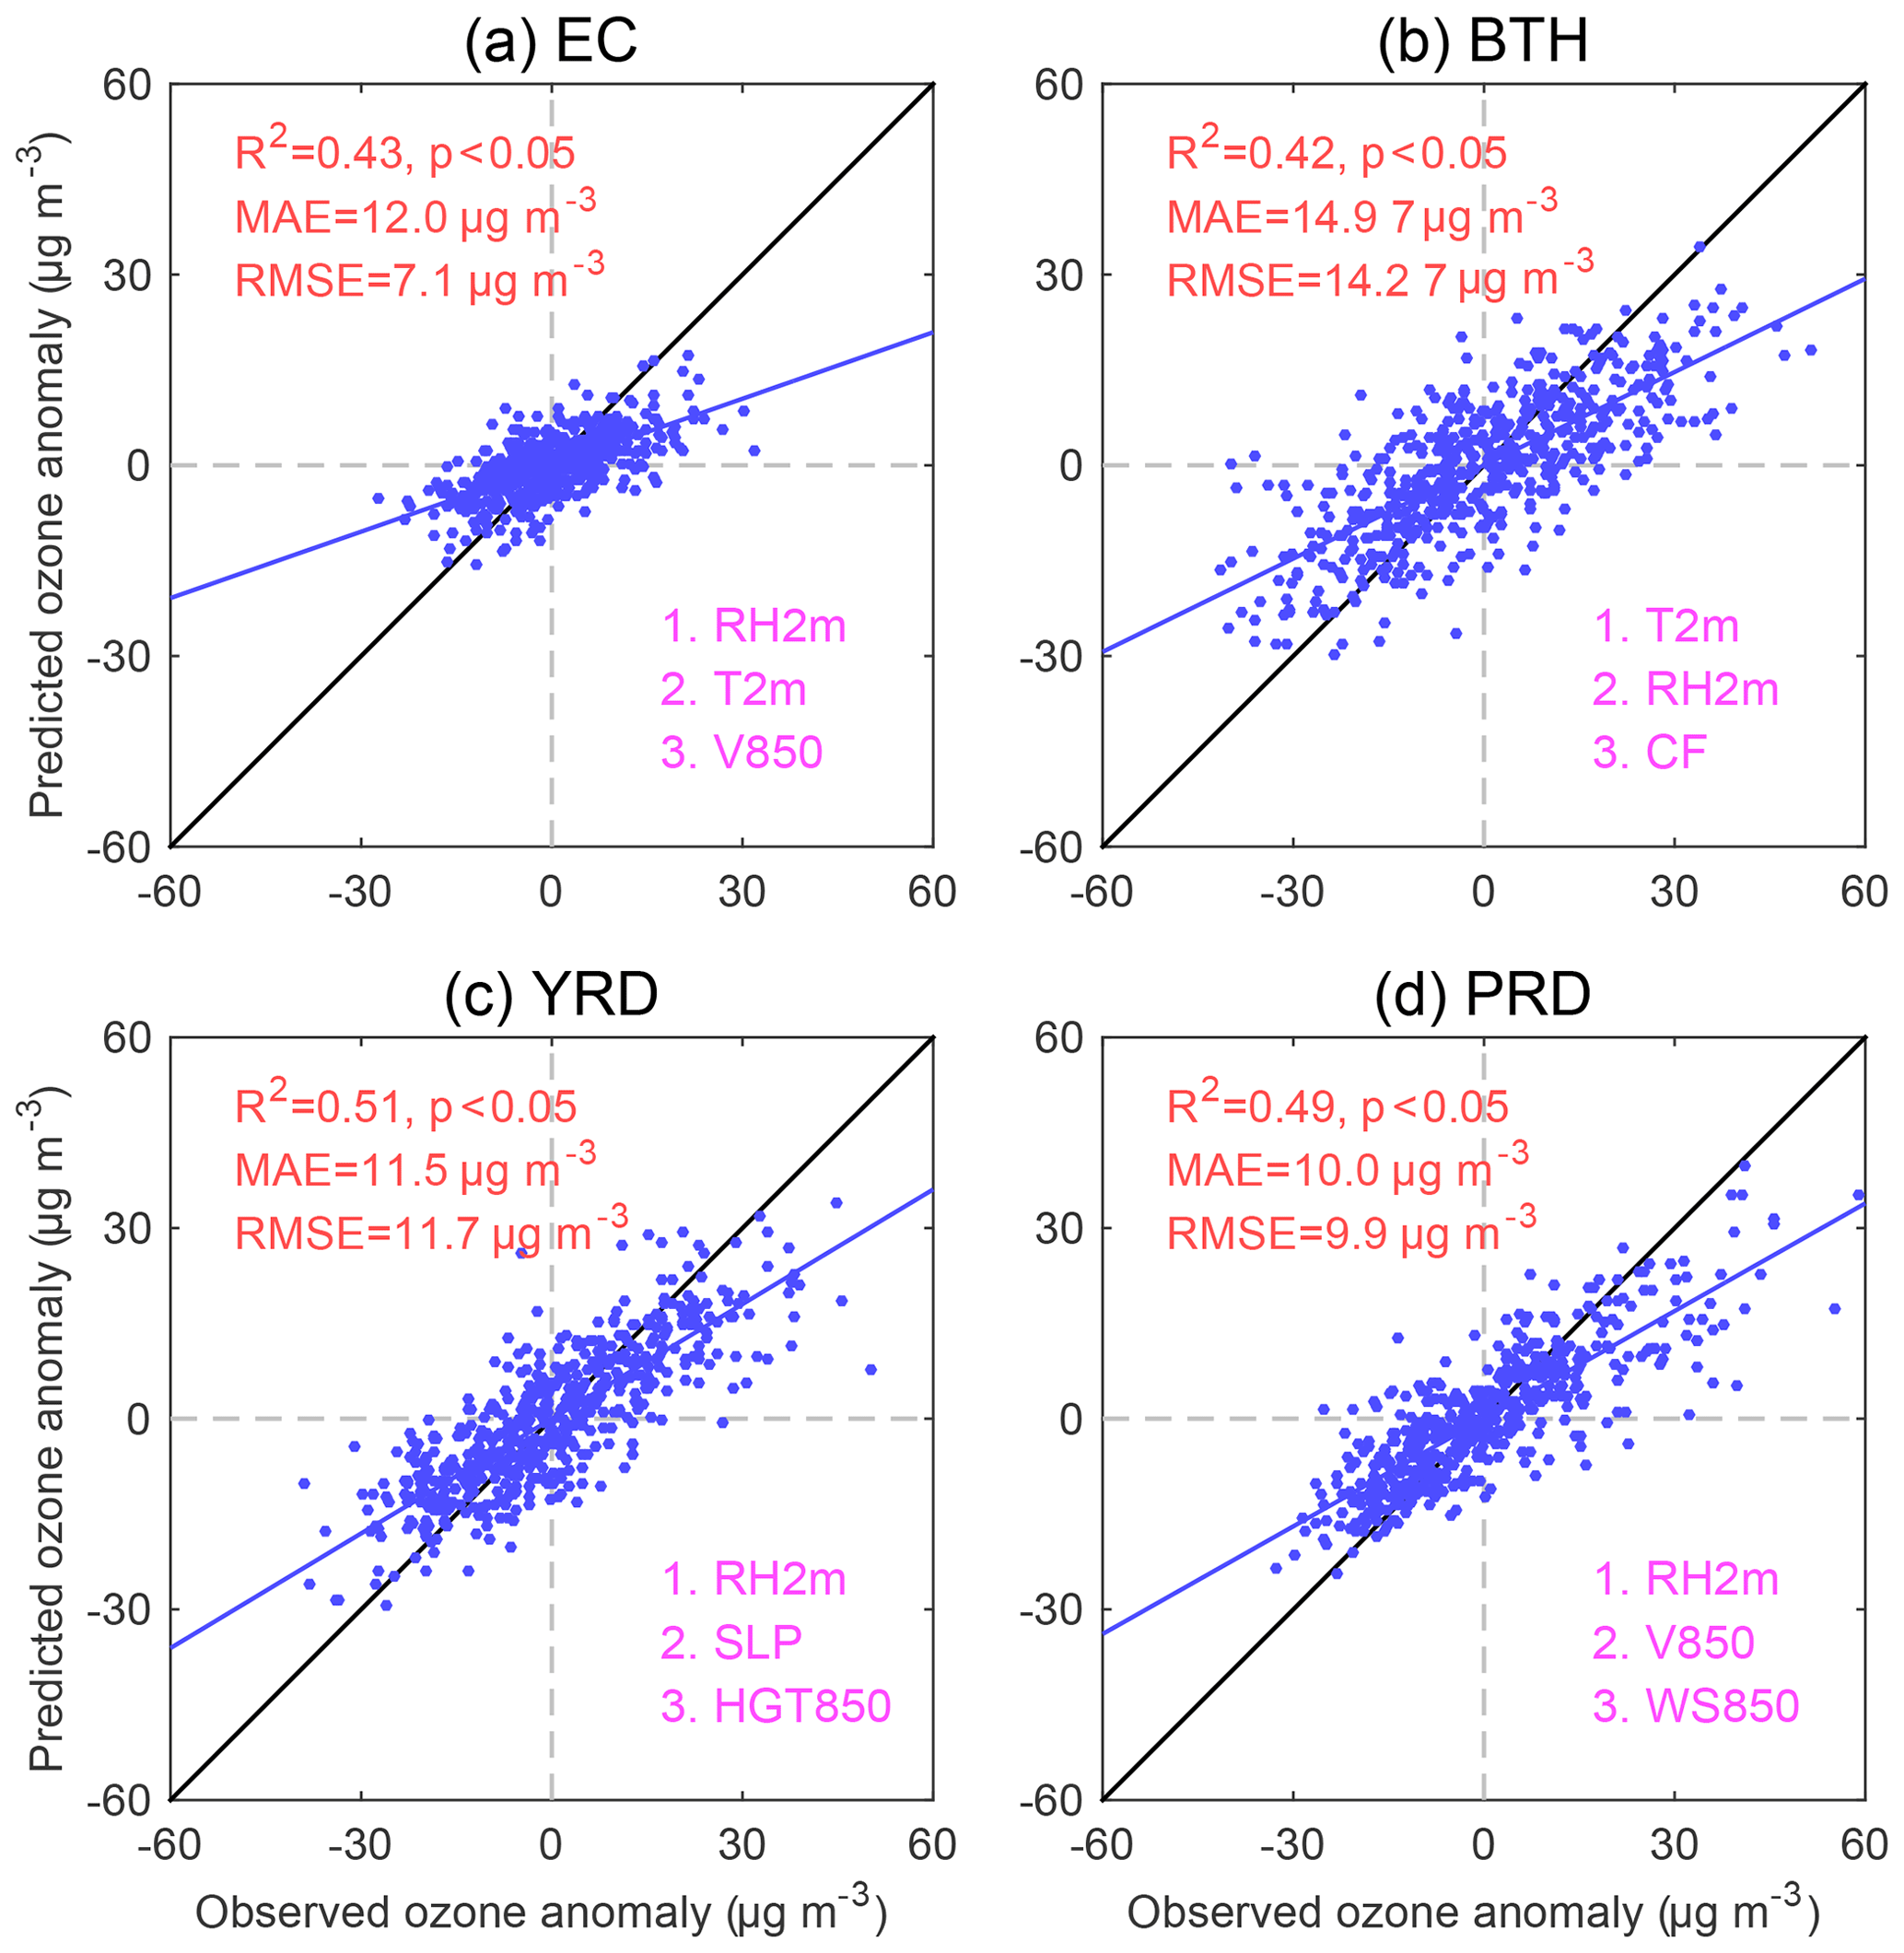
Figure 6Comparison of daily surface ozone anomalies in summer between the predictions using MLR and observations averaged over eastern China and the three subregions. The linearly fitted line in blue is shown in comparison with a 1:1 line in black. Cross-validated coefficient of determination (R2), mean absolute error (MAE), root-mean-square error (RMSE), and the three most dominant meteorological variables in the MLR for ozone in each region are shown in the inset. The abbreviations are for relative humidity at 2 m (RH2m), temperature at 2 m (T2m), meridional wind at 850 hPa (V850), cloud fraction (CF), sea level pressure (SLP), geopotential height at 850 hPa (HGT850), and wind speed at 850 hPa (WS850).
In the last section, we have shown that both local and synoptic meteorological factors are important to surface ozone variations in eastern China. The synoptic factors used there were extracted via an inverse SVD process and do not stand for specific weather systems. In this section, we further investigate how different synoptic weather systems influence surface ozone in eastern China by looking into the typical SWPs. Atmospheric circulations over eastern China in summer are largely regulated by the evolution of the components of EASM, for instance, the WPSH, the subtropical westerly jet, the Meiyu front, and the southwest vortex (Ding and Chan, 2005). Among these systems, the WPSH can largely modulate the seasonal migration of the rain belt over eastern China. Typhoons are also an influential weather system, especially on the southeastern coastal regions. The main features of the synoptic circulations over eastern China during 2013–2018 can be represented by six predominant SWPs (Figs. 7–12), which were identified by an objective approach, the SOM (Sect. 2.3). The occurrence frequency of these SWPs is shown in Figs. 7–12. We name the six SWPs by their dominant weather systems or prevailing wind: Pattern 1 featured southwesterly wind (P1 or PSW), Pattern 2 featured southerly wind (P2 or PS), Pattern 3 featured the northeast cold vortex (P3 or PNECV), Pattern 4 featured a weak cyclone (P4 or PWC), Pattern 5 featured strong WPSH (P5 or PSWPSH), and Pattern 6 featured typhoon systems (P6 or PTC; Table 1).
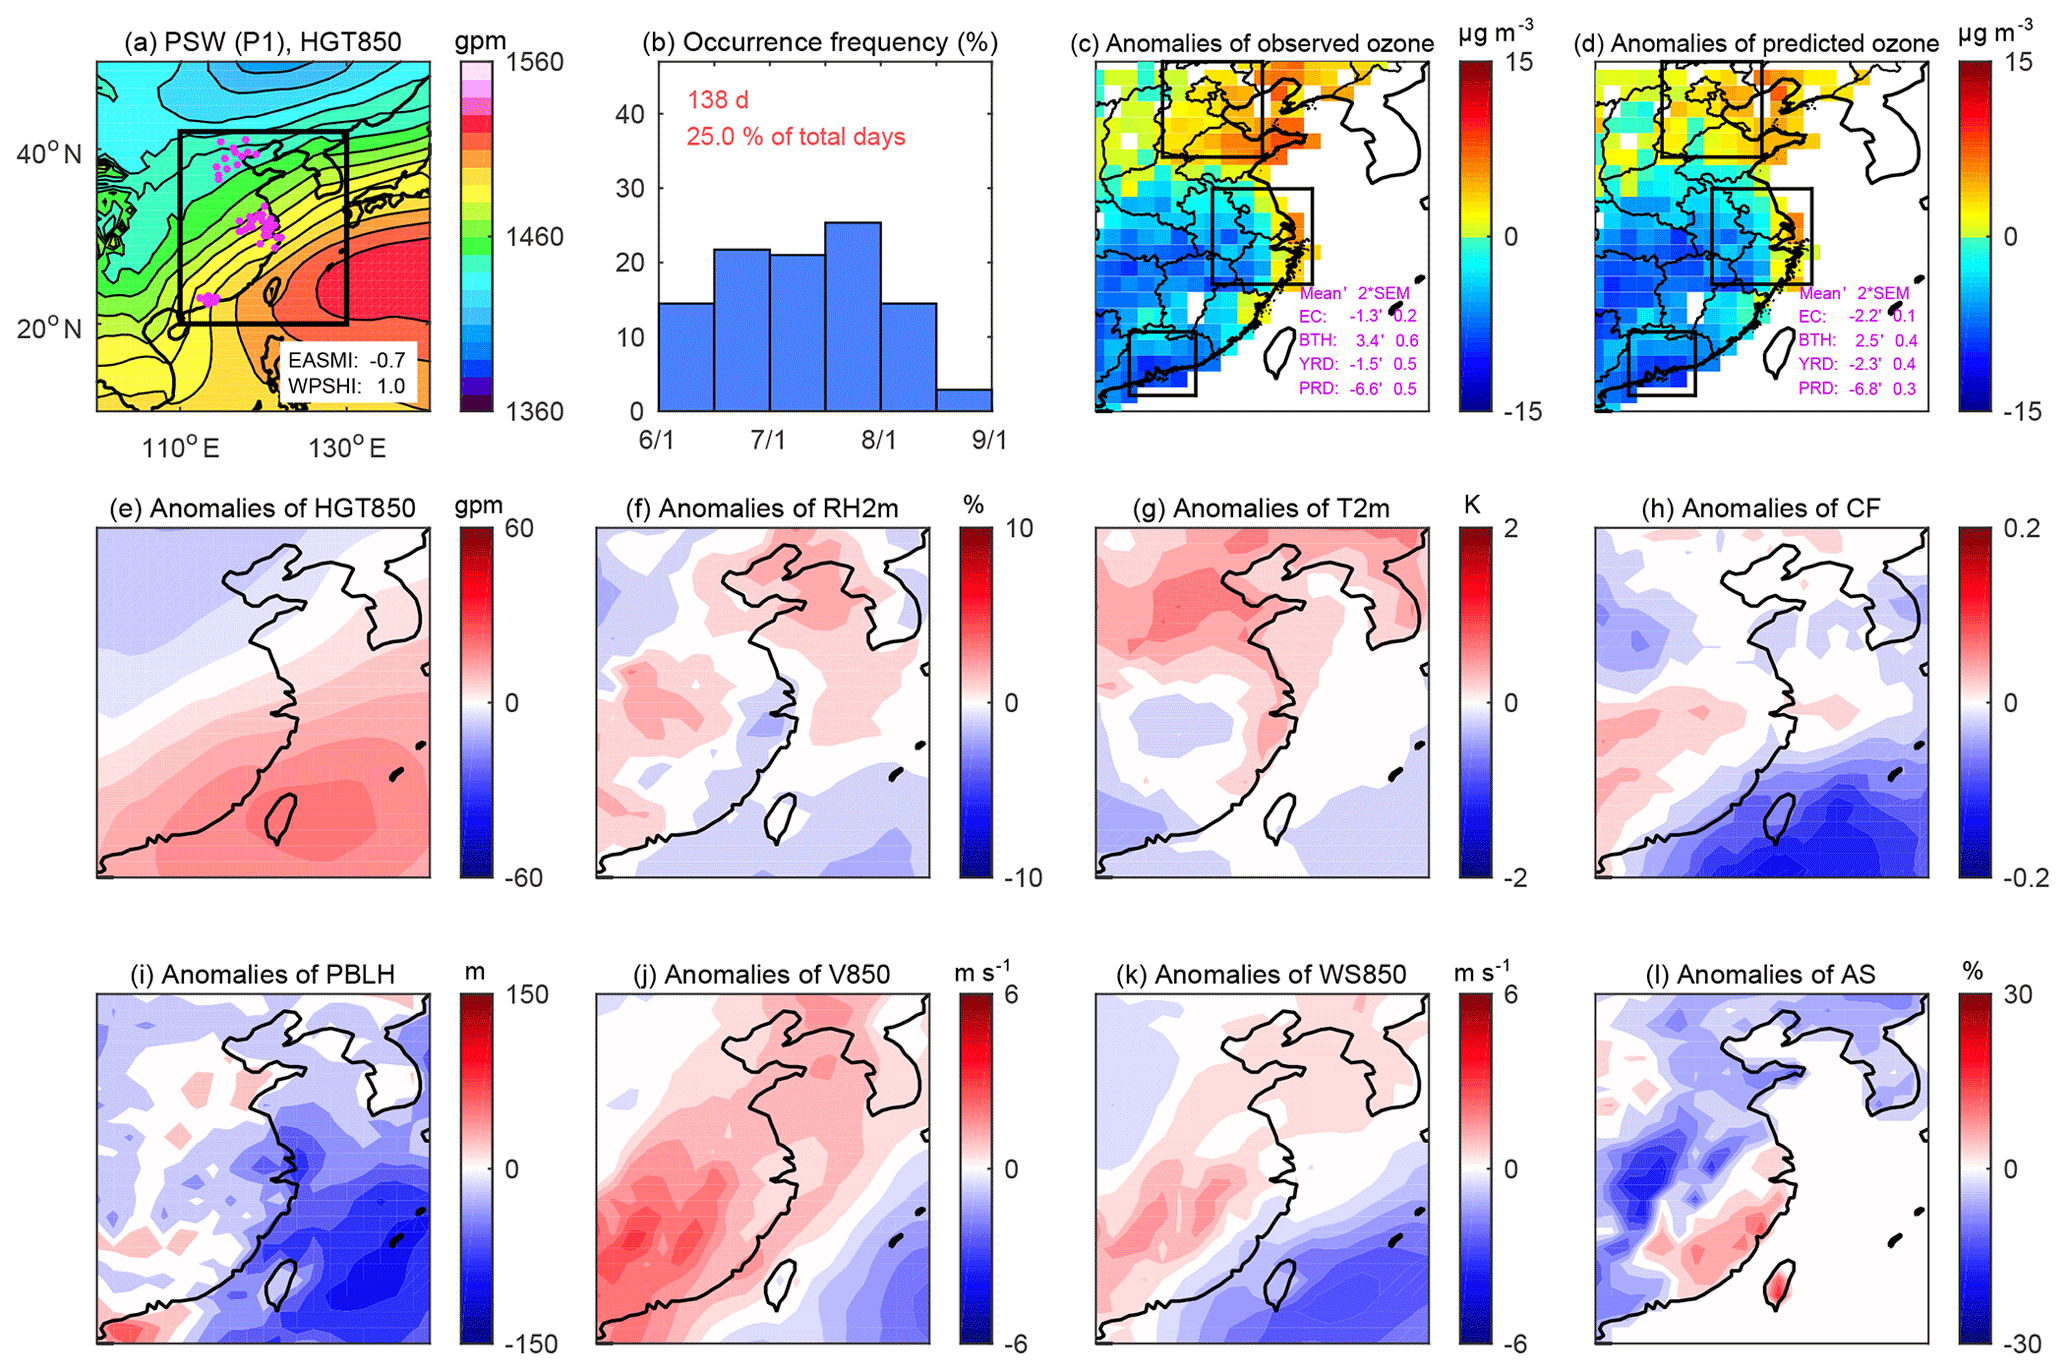
Figure 7PSW (P1). The mean (a) geopotential height at 850 hPa (HGT850), (b) occurrence frequency of this weather pattern, (c) observed daily surface ozone anomaly, and (d) predicted daily surface ozone anomaly using MLR. Anomalies of (e) HGT850, (f) relative humidity at 2 m (RH2m), (g) temperature at 2 m (T2m), (h) cloud fraction (CF), (i) planetary boundary layer height (PBLH), (j) meridional wind at 850 hPa (V850), (k) wind speed at 850 hPa (WS850), and (l) air stagnation (AS) under this SWP in summer during 2013–2018. Anomalies of normalized EASMI and WPSHI shown in (a) represent the strength of EASM and WPSH, respectively. The red numbers in (b) are the total occurrence (in the number of days and in %) of this SWP during the study period. The purple dots in the boxed area in (a) indicate the cities in BTH, YRD, and PRD, respectively, in the north, center, and south of the study domain: eastern China. The three boxed areas in (c) and (d) indicate BTH, YRD, and PRD accordingly. The regional mean anomalies of observed and predicted ozone (± 2 times the standard error of the mean) are shown in the bottom right corners of (c) and (d), respectively.
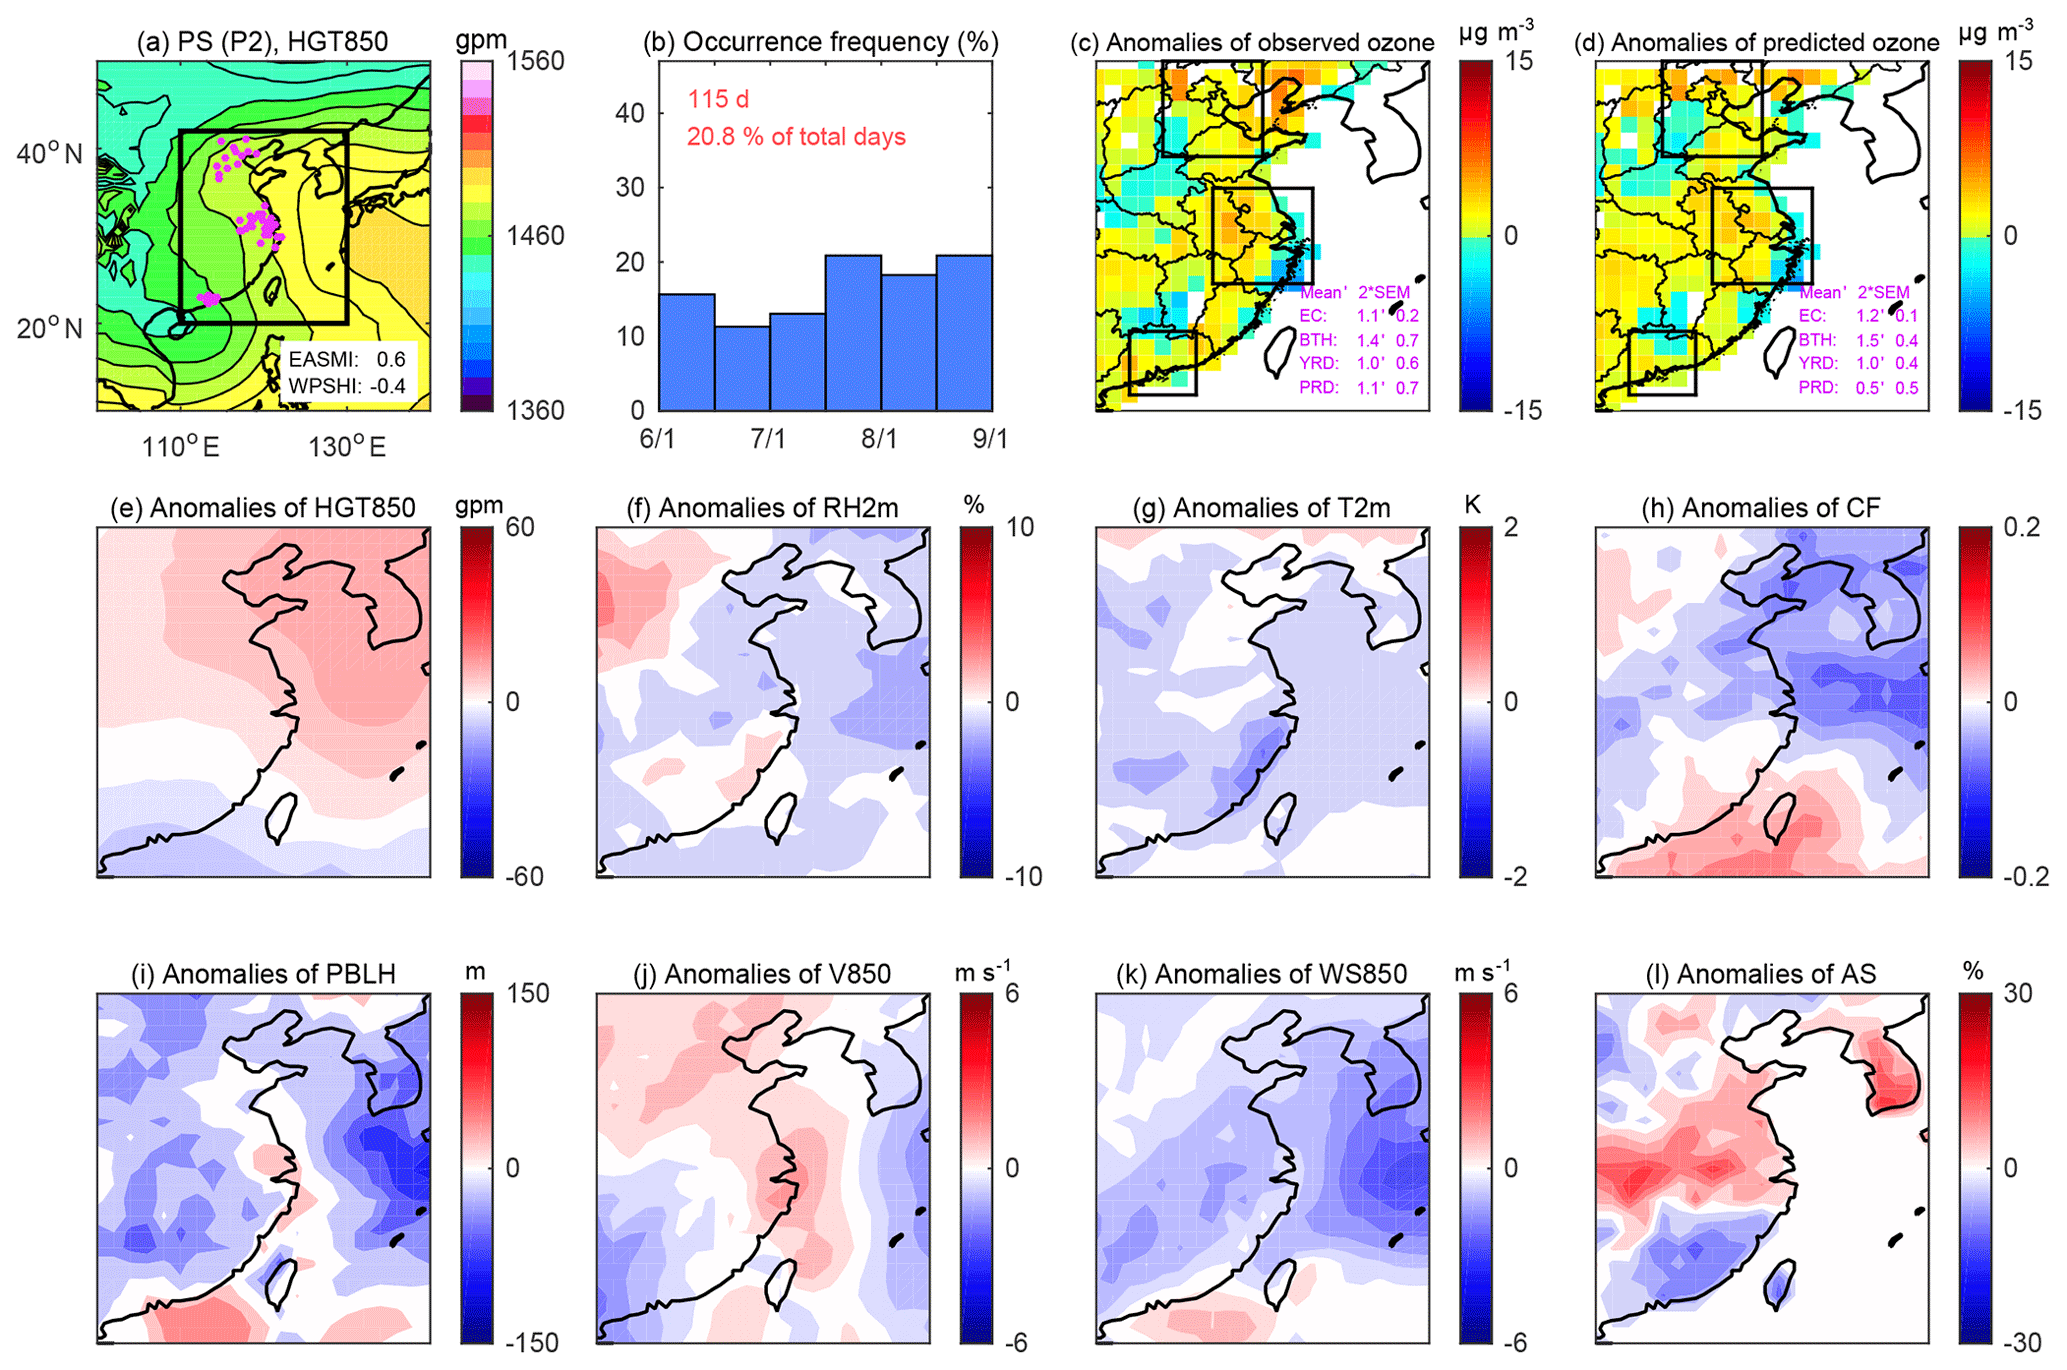
Figure 8The same as Fig. 7 but for PS (P2).
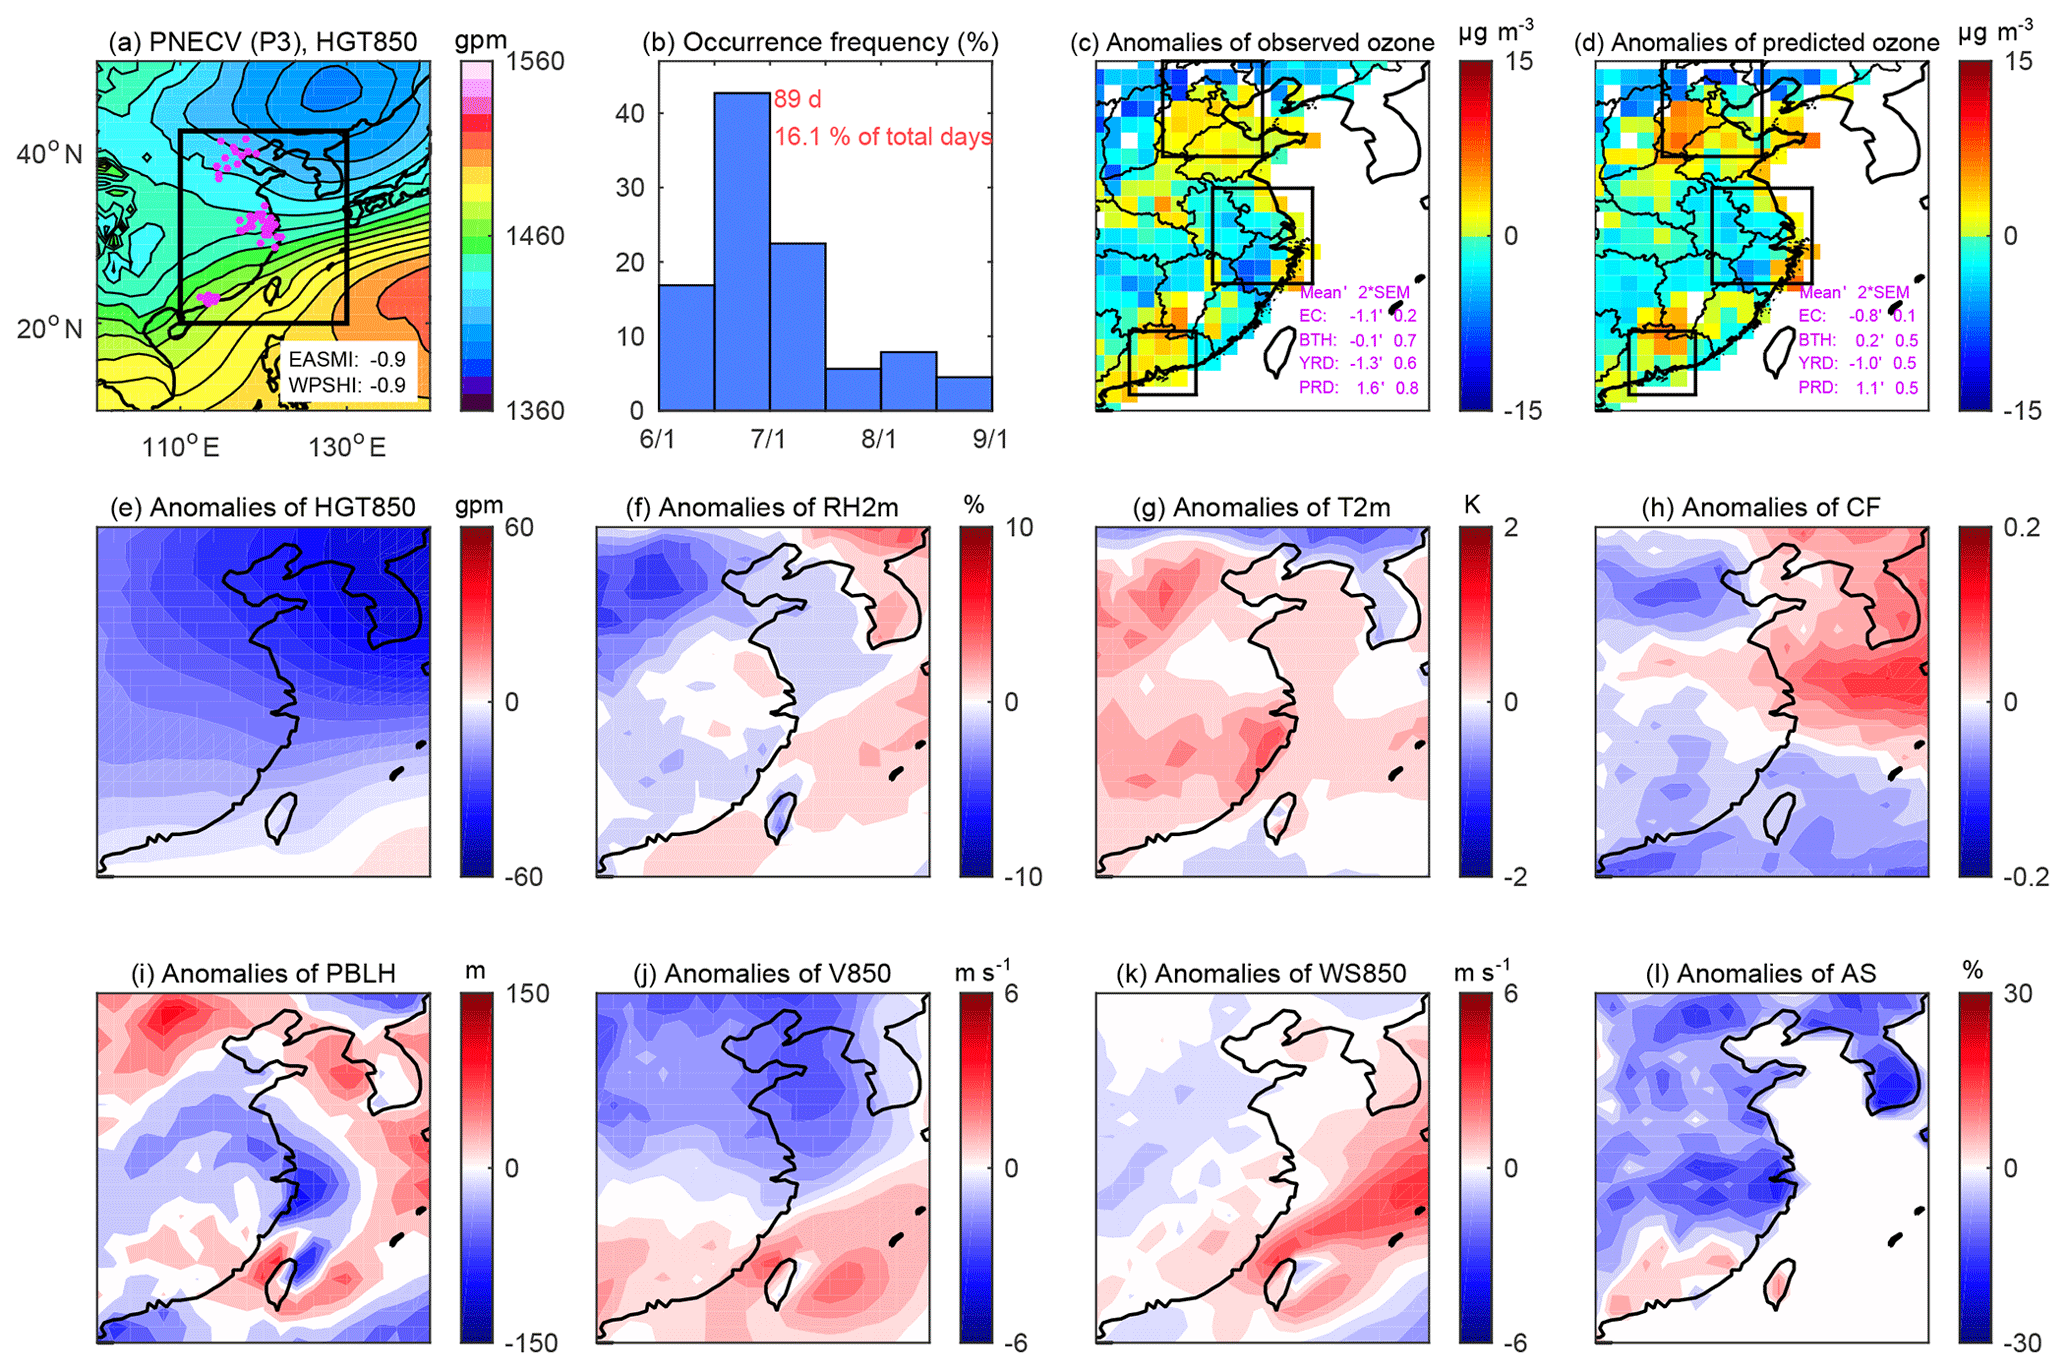
Figure 9The same as Fig. 7 but for PNECV (P3).
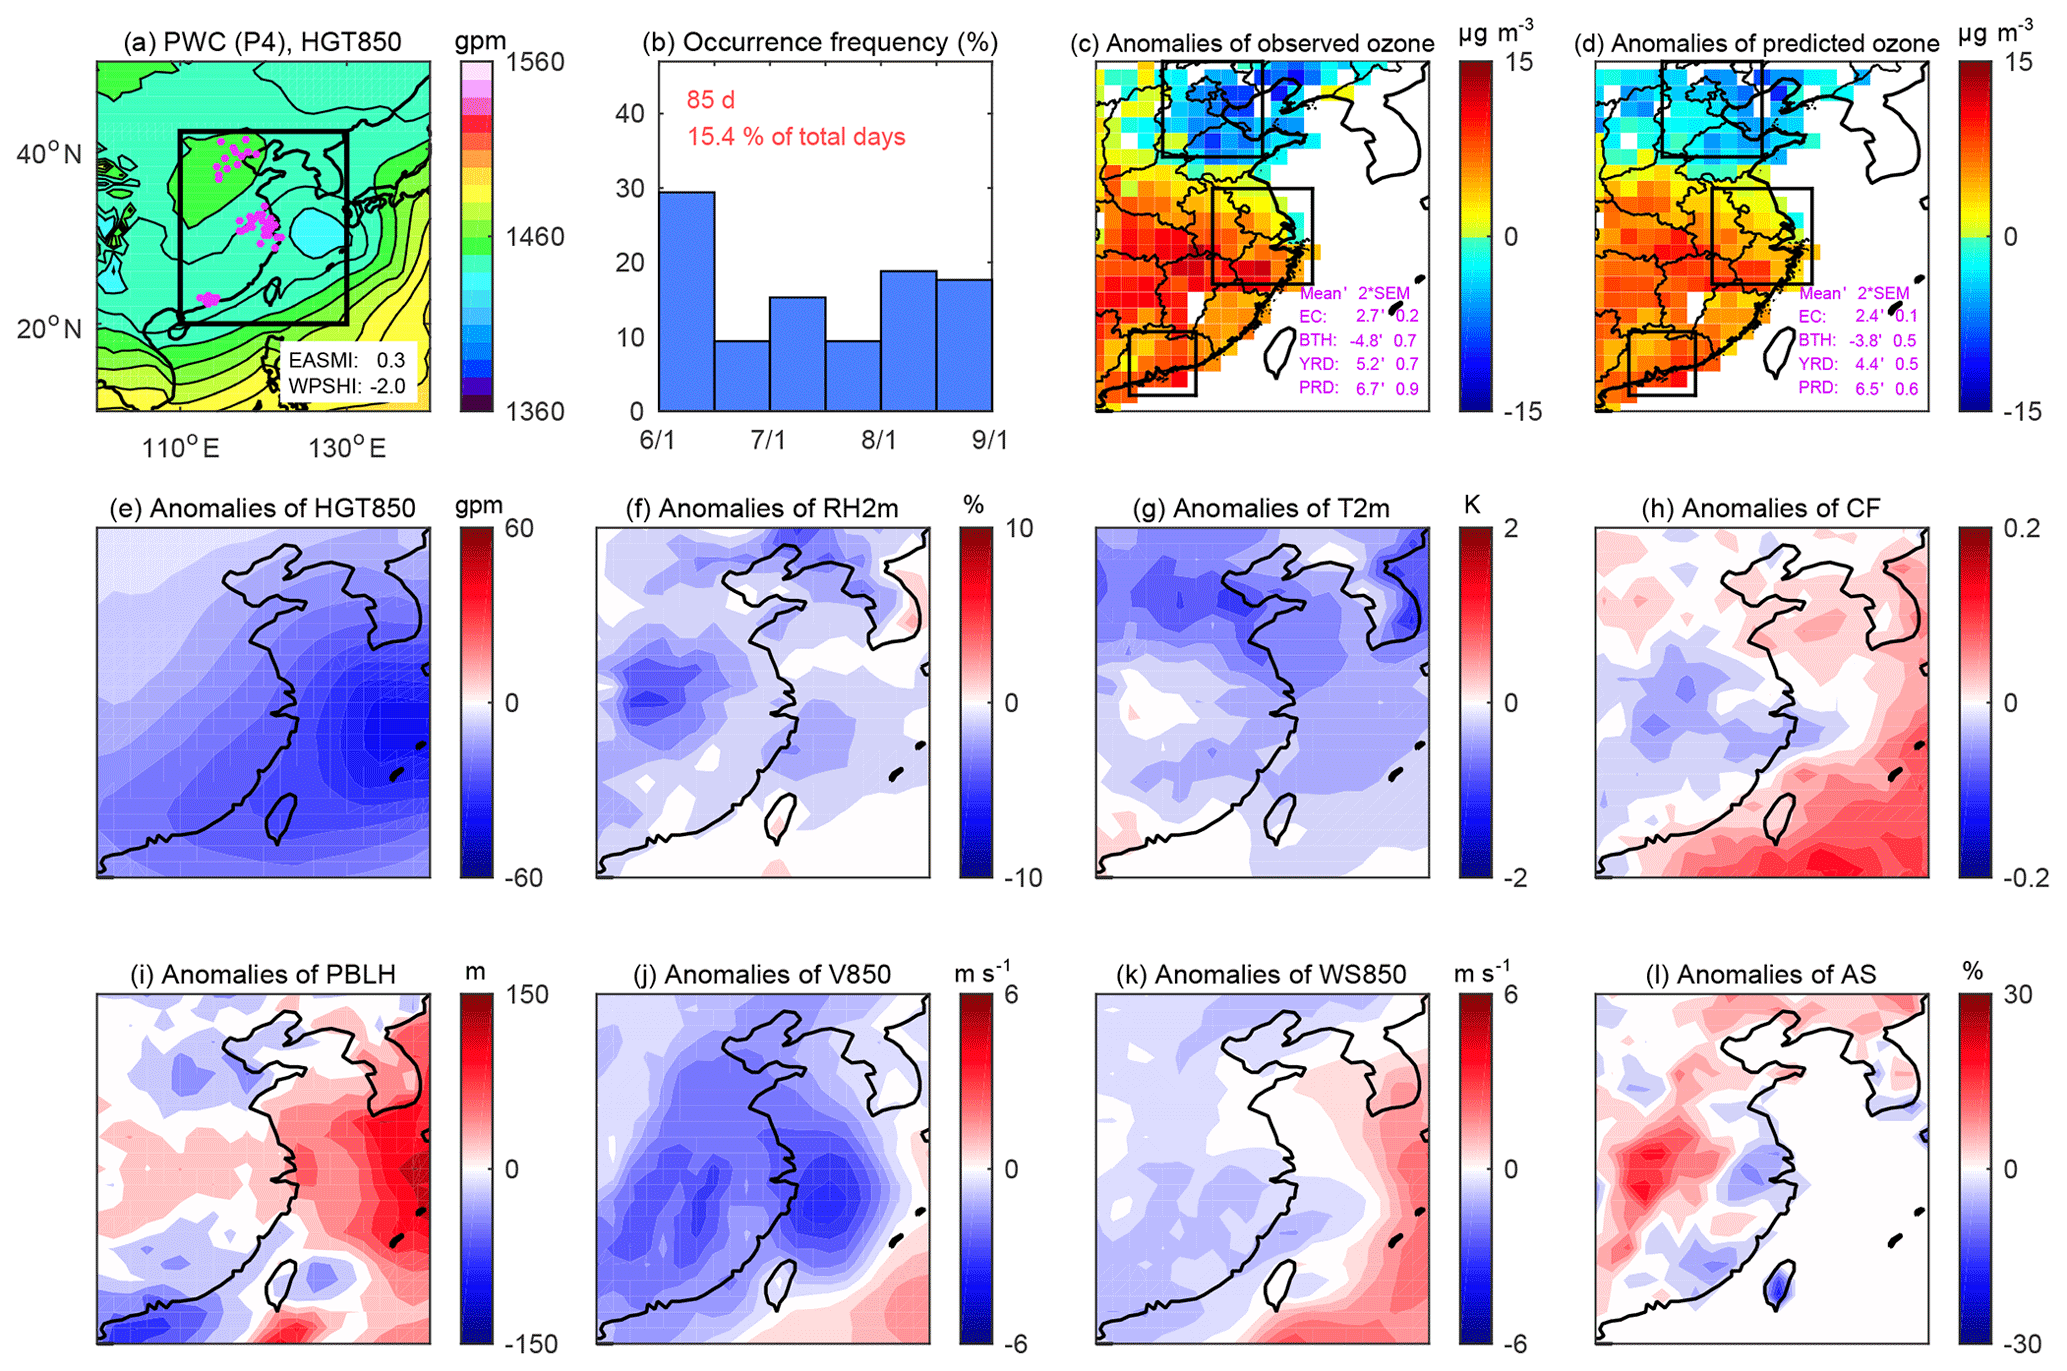
Figure 10The same as Fig. 7 but for PWC (P4).
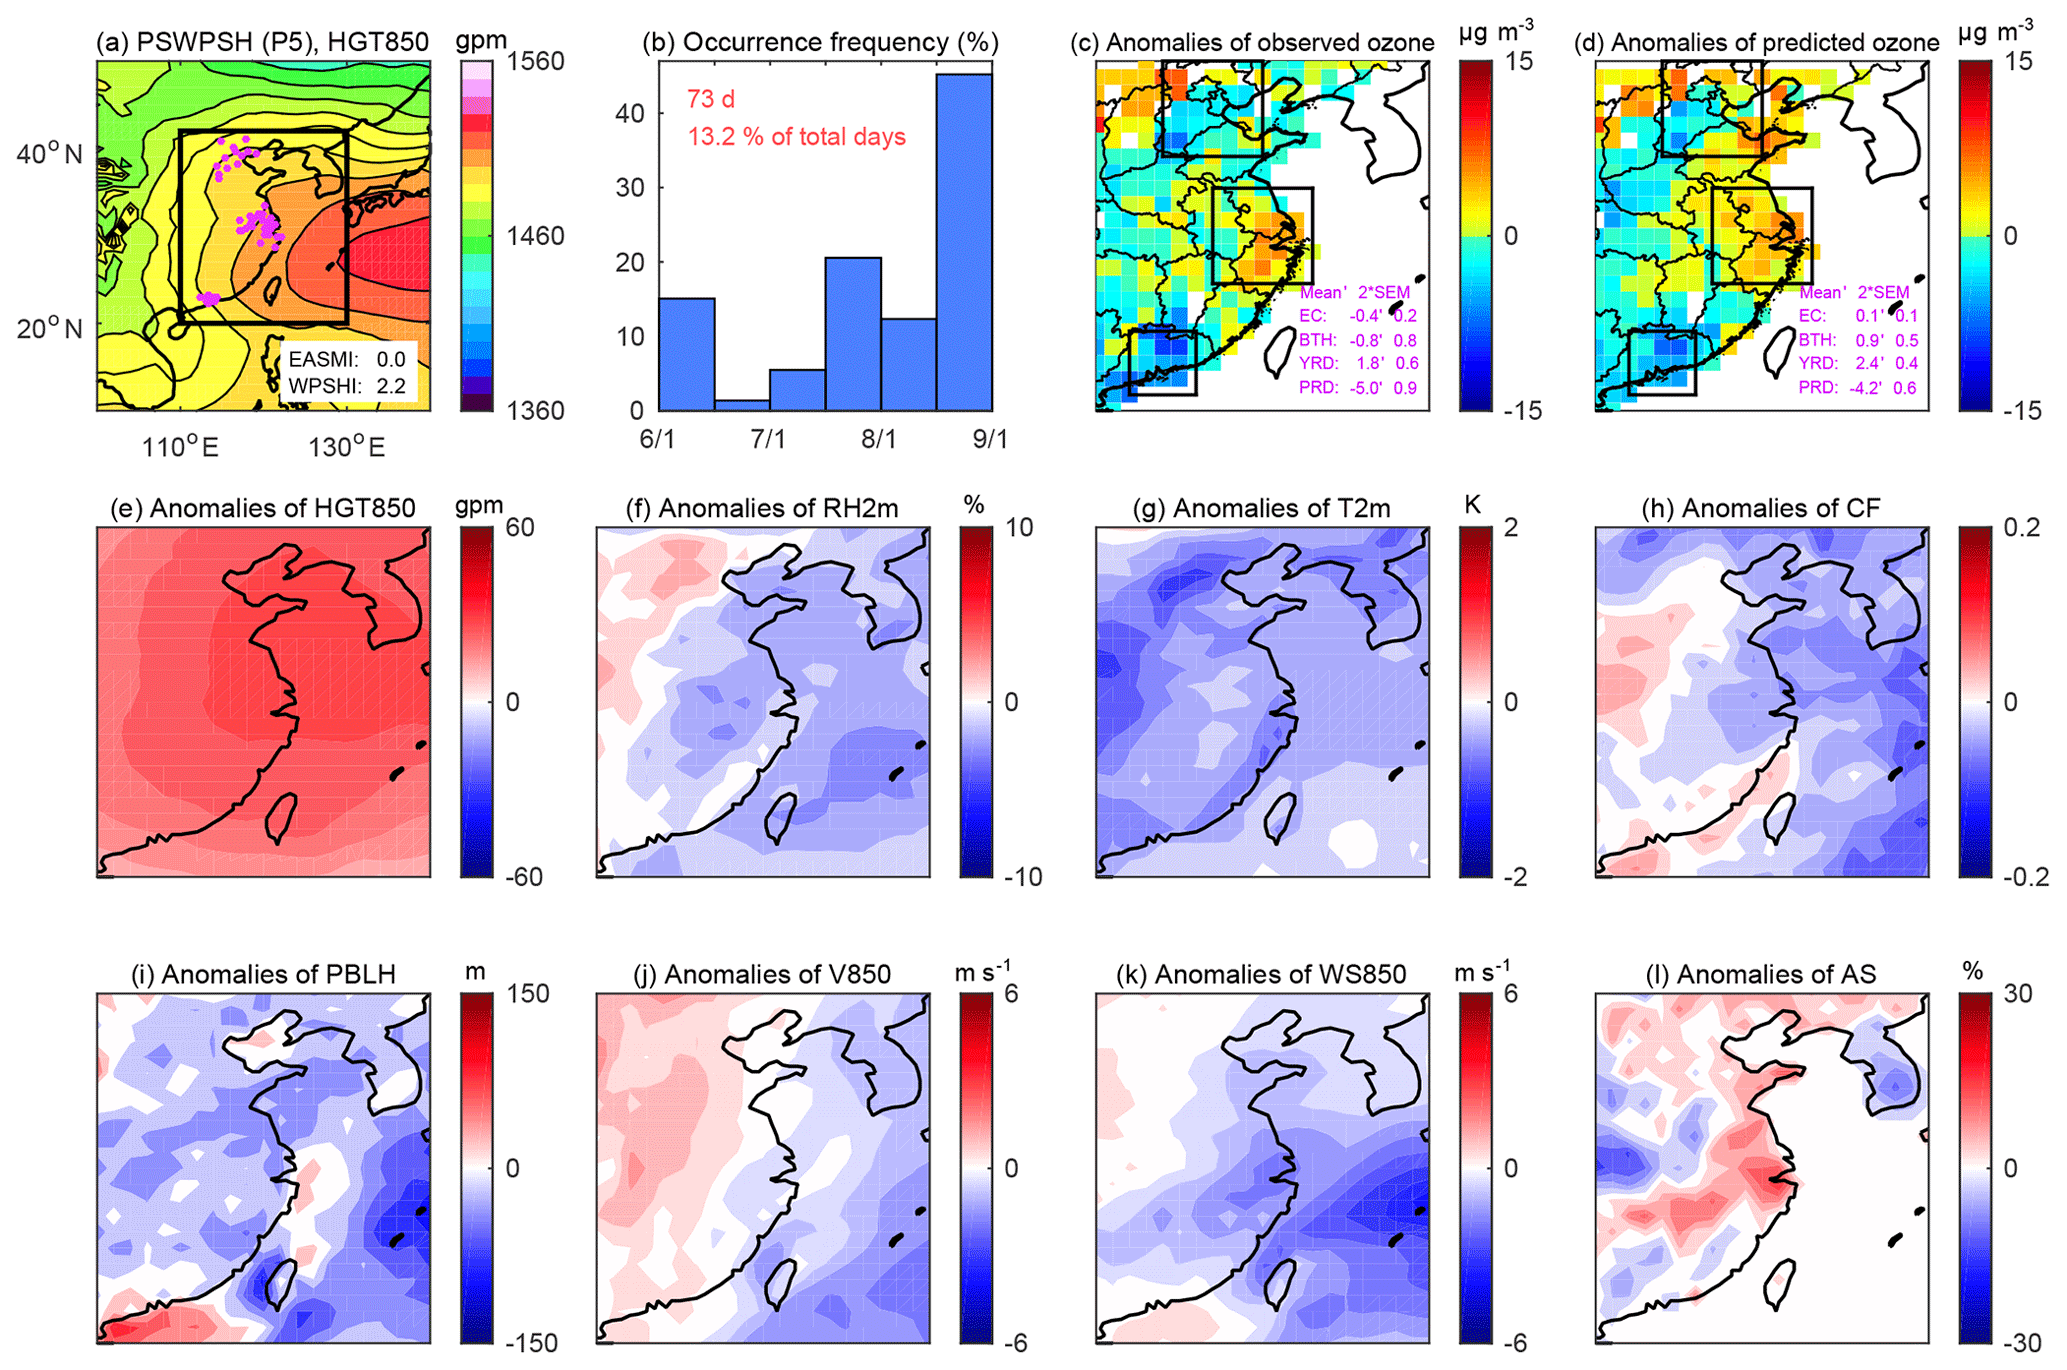
Figure 11The same as Fig. 7 but for PSWPSH (P5).

Figure 12The same as Fig. 7 but for PTC (P6).
To compare the differences of meteorological conditions among the six SWPs, we calculated the daily EASM index (EASMI) and WPSH index (WPSHI), representing the strength of EASM and WPSH, respectively. The two indices were normalized to the zero mean and unit standard deviation. The averaged anomalies of the normalized indices under each SWP are shown in Figs. 7–12 and Table 1. The EASMI is a shear vorticity index defined as the difference of the regional mean zonal wind at 850 hPa between 5 and 15∘ N, 22.5 and 32.5∘ N, 90 and 130∘ E, and 110 and 140∘ E in Wang and Fan (1999), recommended by Wang et al. (2008). The WPSHI is defined by the accumulative enhancement of geopotential height above the WPSH characteristic isoline (5880 gpm at 500 hPa) averaged over the area north to 10∘ N. The WPSHI is adopted by the National Climate Center in China (https://cmdp.ncc-cma.net, last access: 10 December 2019) in the monitoring and diagnosis of the atmospheric circulation. Using the WPSHI, Zhao and Wang (2017) found a significant correlation between the WPSH and the first empirical orthogonal function (EOF) pattern of summertime surface ozone in eastern China. Moreover, we used the averaged anomalies of the meteorological variables in a SWP to describe that SWP. We used the averaged ozone anomaly (in µg m−3) (Figs. 7–12) and the averaged relative ozone anomaly (the ozone anomaly divided by the monthly ozone mean; in %; Table 1 and Fig. S5) under a SWP to assess the influence of that SWP on ozone (Han et al., 2018b). Furthermore, a common index for air stagnation (Horton et al., 2012) is used to assess the impact of air stagnation on surface ozone. For each FNL grid, when the daily average wind speed at 10 m, daily average wind speed at 500 hPa, and the daily total precipitation on a day are, respectively, less than 3.2 m s−1, 13 m s−1, and 1 mm, the day is considered to be a stagnant day at that grid. The National Oceanic and Atmospheric Administration (NOAA) Climate Prediction Center (CPC) precipitation data (https://www.esrl.noaa.gov/psd/data/gridded/data.cpc.globalprecip.html, last access: 10 December 2019) were used in the calculation of the air stagnation index.
Table 1Characteristics of the six predominant SWPs. Ozone anomalies observed in each SWP are shown in regional mean ± 2 times the standard error of the mean. Anomalies of normalized EASMI and WPSHI in each SWP are shown to represent the strength of EASM and WPSH, respectively. A higher EASMI (WPSHI) indicates a stronger EASM (WPSH).
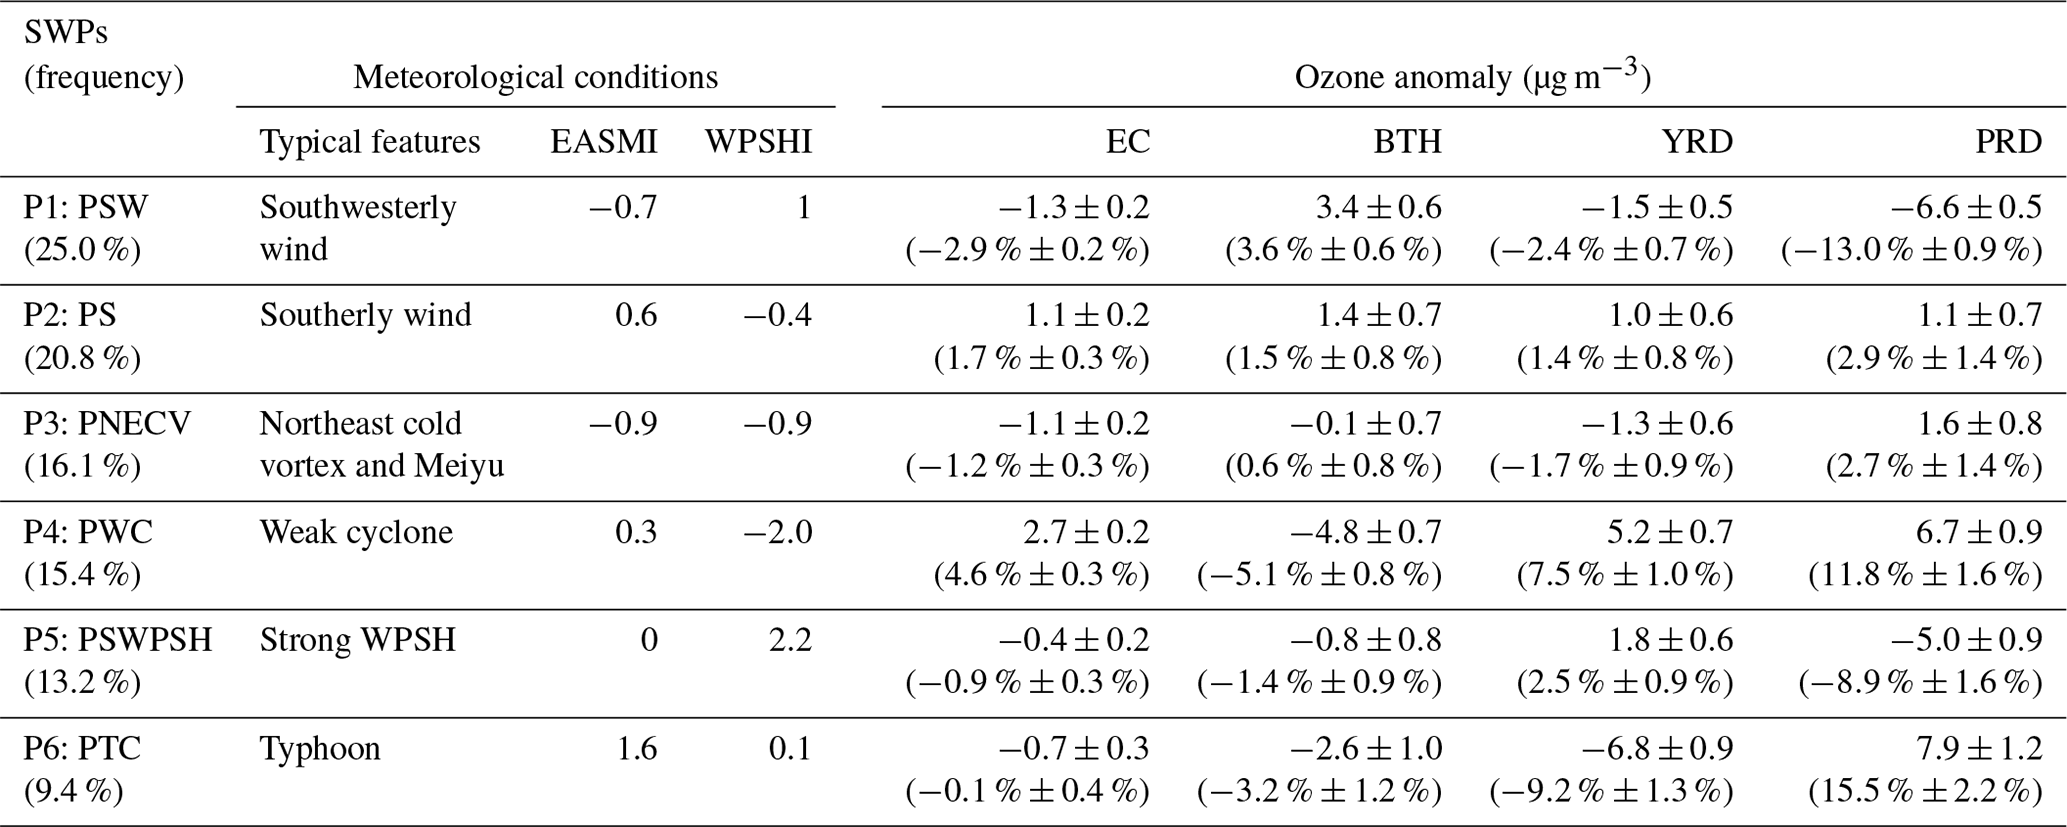
The characteristics of the six SWPs and their impacts on surface ozone are briefly summarized in Table 1. PSW (P1) is the most common circulation pattern occurring on 25 % of the days of summer during 2013–2018 (Fig. 7b). Characterized by weak EASM conditions, PSW is dominated by an anomalous anticyclone located in the southeast of eastern China (Fig. 7e). In PSW, the enhanced meridional wind brings clear marine air to the south of eastern China (Fig. 7j), where the meridional wind is significantly correlated to surface ozone (Fig. 2f). The enhanced zonal wind from the anomalous anticyclonic circulation (Fig. 7e) increases the ozone export from the south of eastern China (Yang et al., 2014). The negative anomalies of temperature (Fig. 7g), and positive anomalies of relative humidity (Fig. 7f) and cloud fraction (Fig. 7h) in the south, are all unfavorable for photochemical processes. In consequence, PSW reduces ozone levels in the south (Fig. 7c) by enhancing the dispersion and suppressing the production of ozone. Negative anomalies of −1.5 (−2.4 %) and −6.6 µg m−3 (−13 %) in the regional mean ozone are observed over the YRD and PRD, respectively (Fig. 7c and Table 1). In contrast, the lower cloud fraction (Fig. 7h) and higher temperature (Fig. 7g) in the north stimulate ozone production. Surface ozone over BTH increases by 3.4 µg m−3 (3.6 %) from the regional mean in PSW (Fig. 7c and Table 1).
PS (P2) is the second frequent SWP (Fig. 8b), characterized by a strong EASM and weak WPSH (Fig. 8a). Under PS, the FNL meteorological data show frequent stagnation events (Fig. 8l), low humidity (Fig. 8f), and a low cloud fraction (Fig. 8h) over most of eastern China. In contrast to PSW, the zonal wind has negative anomalies (Fig. 8e) in PS, reducing ozone export from the south of eastern China. Overall, an increase of 1.1 µg m−3 (1.7 %) in the regional mean ozone concentrations is seen in eastern China under PS (Fig. 8c and Table 1).
PNECV (P3) is a typical pattern for Meiyu, an important climate phenomenon over the middle and lower reaches of the Yangtze River from early June to mid-July (Fig. 9a). PNECV is characterized by persistent rainfall (Ding and Chan, 2005). Under a combined effect of the northeast cold vortex and the WPSH, the Meiyu front forms and stays over the YRD (He et al., 2007). Meiyu in PNECV increases relative humidity (Fig. 9f) and decreases air stagnation (Fig. 9l) over the YRD. Consequently, PNECV reduces surface ozone concentrations by 1.3 µg m−3 (1.7 %) over the YRD (Fig. 9c and Table 1). In the meantime, more sunny days with high temperature (Fig. 9g) and low moisture (Fig. 9f) occur in the north to the YRD, affected by the northwesterly and downward airflows from the northeast cold vortex (Fig. 9a). As a result, positive ozone anomalies are observed in the regions north of the YRD (Fig. 9c).
PWC (P4) features the weakest WPSH, when a weak extratropical cyclone is located over the east of the mainland China (Fig. 10a). The extratropical cyclone is probably formed by an eastward movement of the southwest vortex or a transition from a typhoon. Pushed by the cyclone, the WPSH retreats (Y. Li et al., 2018). The weak pressure gradient over the mainland of eastern China (Fig. 10a) in PWC results in more-stable weather conditions. The anomalies of the meteorological variables in PWC show opposite spatial patterns to those in PSW (Fig. 7 vs. Fig. 10). With the favorable meteorological conditions except temperature, PWC enhances ozone over the south. PWC statistically increased regional mean ozone by 5.2 µg m−3 (7.5 %) over the YRD and 6.7 µg m−3 (11.8 %) over the PRD (Fig. 10c and Table 1). Mean negative ozone anomalies of −4.8 µg m−3 (−5.1 %) are observed over BTH in PWC (Fig. 10c and Table 1).
PSWPSH (P5) occurs in late summer (Fig. 11b), when the Meiyu breaks in the Yangtze River and the rain belt shifts to northern China (Ding and Chan, 2005). In PSWPSH, the WPSH is the strongest and extends mostly westward (Fig. 11a). Thus, relative humidity is lower than the seasonal mean over the YRD and higher than the seasonal mean over BTH (Fig. 11f). In the meantime, stable weather conditions occur more frequently over the YRD (Fig. 11l). Therefore, ozone accumulates over the YRD in PSWPSH with a regional mean enhancement of 1.8 µg m−3 (2.5 %; Fig. 11c and Table 1). Surface ozone decreases by 0.8 (1.4 %) and 5.0 µg m−3 (8.9 %), respectively, over BTH and the PRD under this SWP (Fig. 11c and Table 1).
PTC (P6) is typical typhoon weather that is over the southeastern coast of the mainland China (Fig. 12a). Forced by a typhoon system, the WPSH in PTC migrates further north than under the other SWPs. The typhoon brings clear and moist marine air to coastal areas in eastern China, reducing surface ozone by 6.8 µg m−3 (9.2 %) over the YRD (Fig. 12c and Table 1). Shu et al. (2017) identified that SWPs, like PTC, can lead to clean PM2.5 episodes in the YRD. However, the cyclonic circulation enhances ozone transport from the central part of eastern China to the downwind regions in the south, including the PRD. Through the collective effect of higher temperature, lower humidity, and heavier downdrafts, PTC increases surface ozone in the PRD by 7.9 µg m−3 (15.5 %; Fig. 12c and Table 1). Lam et al. (2018) found that ozone increases by 16.8 µg m−3 at urban stations in Hong Kong of the PRD, when the synoptic circulation controlling the PRD is featured as a typhoon in the vicinity of Taiwan, similar to PTC. They also suggested that this SWP is associated with the interannual variations in ozone pollution in Hong Kong.

Figure 13The most important variable among the local meteorology for ozone in the MLR under each of the SWPs. The regional mean meteorological variables are shown in the bottom right corner of each panel. The boxed areas indicate BTH, YRD, and PRD, respectively, to the north, center, and south of the study domain. The abbreviations are for cloud fraction (CF), geopotential height at 850 hPa (HGT850), planetary boundary layer height (PBLH), relative humidity at 2 m (RH2m), sea level pressure (SLP), temperature at 2 m (T2m), zonal wind at 850 hPa (U850), meridional wind at 850 hPa (V850), vertical wind at 850 hPa (W850), and wind speed at 850 hPa (WS850).
We further compared the SWP analysis with that from the MLR discussed in Sect. 4. We evaluate the performance of the MLR under the six SWPs based on the predicted (Figs. 7d, 8d, 9d, 10d, 12d, and 13d) and observed (Figs. 7c, 8c, 9c, 10c, 11c, and 12c) ozone anomalies. The comparison shows that the ozone anomalies predicted by the MLR have spatial variations and magnitudes similar to those in the observations under each of the SWPs. The MAE of averaged ozone anomalies under each of the SWPs ranges from 1.0 to 2.2 µg m−3, and the RMSE ranges from 1.4 to 2.8 µg m−3 (Table S1). The MLR can capture the ozone anomalies under the six predominant SWPs well (Figs. 7–12). For example, the negative ozone anomaly over the PRD under PSW featured a weak EASM (Fig. 7c vs. d), the negative ozone anomaly over the YRD under PNECV featured Meiyu (Fig. 9c vs. d), and the positive ozone anomaly over the PRD under PTC featured a typhoon (Fig. 12c vs. d). Since the MLR only considers the meteorological influence on surface ozone, the consistency between the regression and the clustering results suggests that the mean observed ozone anomalies under a SWP can adequately reflect the response of daily ozone variation to meteorology. The noise of day-to-day variations in chemistry and emissions in the surface ozone data can be largely removed by the long-term average of ozone anomalies under a SWP from the big dataset of surface ozone (Han et al., 2018b).
In addition, we applied the MLR to reveal the most important local meteorological factor for daily ozone variability under each of the six SWPs (Fig. 13). The MLR was conducted under each of the SWPs with the same procedure in the full summer. The most important meteorological variable for ozone over some areas in eastern China may vary with the prevailing SWP (Fig. 13). The dominant driver in the PRD is meridional wind at 850 hPa under PSW, PS, and PSWPSH, demonstrating the significant influence of marine air inflow. Controlled by the typhoon system, the most important factor over some coastal areas is zonal wind at 850 hPa under PTC.
Meteorology can influence surface ozone variability on different timescales, from long-term trends to sub-daily variation. Based on surface ozone observations during 2013–2018, we characterized the seasonal and interannual variations in surface ozone in eastern China. The measurements show that surface ozone pollution in the study region is severest in summer, and the severity is rapidly exacerbated during 2013–2018. We focused on the meteorological influence on the daily variability in summertime surface ozone in eastern China. We took daily anomalies of meteorological and ozone values to remove the variability on scales longer than daily variations in these datasets. We estimated the local and synoptic meteorological impacts on daily variability in surface ozone using a MLR and a SOM clustering technique. The MLR is driven by local meteorological variables and synoptic weather factors identified by the SVD analysis.
The MLR suggests that on average, regionally, meteorology can explain 43 % of variations in the summertime daily surface ozone in eastern China, with an explained variance of up to 65 % at some locations (Fig. 5a). The regression model shows that meteorology contributes to 18 % of the increase in the regional mean of summertime surface ozone over eastern China from 2013 to 2018. Exploiting the MLR, we also identified the key meteorological variables that are mostly responsible for daily variations in summertime surface ozone in eastern China during 2013–2018. Among the local meteorological variables, relative humidity is the foremost factor over most areas in the center and south of eastern China including the YRD and PRD, while temperature is the foremost factor in the north including BTH (Fig. 5c).
We assessed the impacts of the dominant synoptic weather systems on surface ozone using cluster analysis. Employing the SOM, the summer synoptic circulations over eastern China during 2013–2018 were objectively classified into six predominant SWPs (Figs. 7–12). The six SWPs control the variations in the key meteorological variables and thus impact the transport and production of ozone regionally. Among the six SWPs, the SWP (PS), featuring southerly wind, strong EASM, and weak WPSH (Fig. 8), and the SWP (PWC), featuring a weak extratropical cyclone and the weakest WPSH (Fig. 10), tend to increase the regional mean surface ozone in eastern China. In contrast, the other four SWPs (namely, PSW, PNECV, PSWPSH, and PTC) tend to reduce regional mean surface ozone in eastern China (Figs. 7, 9, 11, and 12). As the predominant meteorological variables vary largely in space (Figs. 2 and 5), surface ozone concentrations under every SWP vary largely between the northern and southern parts of eastern China or between eastern and western parts of eastern China (Figs. 7–12). Influenced by the dominant SWP, daily mean surface ozone in some areas of eastern China can increase or decrease maximally by 8 µg m−3 or 16 % of the daily mean (Table 1).
This study provides some new insights on the relationship between meteorology and air pollution by untangling the complex response of surface ozone to different SWPs and local meteorological variables. The most significant meteorological variables for surface ozone in eastern China were identified regionally, which was rarely investigated by previous studies (Gong et al., 2018; Zhan et al., 2018; Chen et al., 2019). Extending from previous studies, we quantified ozone anomalies in eastern China resulting from the prominent synoptic weather systems such as the WPSH (Shu et al., 2016; Zhao and Wang, 2017), the extratropical cyclones (Zhang et al., 2013; Liao et al., 2017), the Meiyu front, and typhoons (Jiang et al., 2015; Lam et al., 2018). These systems are important drivers for variations in air pollutants over eastern China (Ding et al., 2017). The mean ozone anomalies under a SWP over 2013–2018 were used to describe ozone sensitivity to that SWP. This method can remove the seasonal differences in the pollutant concentrations and the frequency of SWPs (Han et al., 2018b). No consideration of seasonal differences in pollutant concentrations and meteorology can lead to biases in addressing daily variation of a pollutant (e.g. Zhang et al., 2013, 2016; Liao et al., 2017).
In this study, the developed MLR and cluster techniques can describe the meteorological impacts on the surface ozone variation in eastern China well. Both regression and clustering analyses show strong performance, so they can be effective tools for air quality forecast. Here, we emphasize the importance of synoptic meteorology to the daily variation of surface ozone. The constructed synoptic factors by the SVD analysis can be a useful predictor for forecasting such daily variation. As ozone responds nonlinearly to variation in meteorology, emissions, and chemistry (Wu et al., 2009), the developed MLR cannot fully predict daily ozone variation yet. Therefore, the nonlinearity issue needs to be addressed in the future. Future work can also be focused on the sensitivity of the diurnal ozone variation to meteorology and on the impact of climate change on future surface ozone levels regionally and globally (Shen et al., 2017).
Surface ozone measurements were obtained from the public website of MEE (http://beijingair.sinaapp.com/, last access: 10 December 2019). The FNL meteorological data were acquired from NCEP (https://doi.org/10.5065/D6M043C6). The OMI tropospheric column ozone monthly data were from the NASA Goddard Space Flight Center (https://acd-ext.gsfc.nasa.gov/Data_services/cloud_slice/, last access: 10 December 2019; Ziemke et al., 2006).
The supplement related to this article is available online at: https://doi.org/10.5194/acp-20-203-2020-supplement.
HH designed the study and performed the research. HH and LS analyzed the data and developed the model. HH and JL wrote the paper, with input from LS, TW, and HY.
The authors declare that they have no conflict of interest.
This article is part of the special issue “Regional transport and transformation of air pollution in eastern China”. It is not associated with a conference.
We are grateful to MEE for the available air pollution data, to NCEP for the FNL meteorological data, and to the NASA Goddard Space Flight Center for the OMI tropospheric column ozone data. We thank the constructive comments and suggestions from the anonymous reviewers.
This research is supported by the National Key Basic Research Development Program (grant no. 2016YFA0600204) and by the Natural Science Foundation of China (grant nos. 41621005, 91744209, 91544230, 41375140).
This paper was edited by Tong Zhu and reviewed by two anonymous referees.
Bloomfield, P., Royle, J. A., Steinberg, L. J., and Yang, Q.: Accounting for meteorological effects in measuring urban ozone levels and trends, Atmos. Environ., 30, 3067–3077, https://doi.org/10.1016/1352-2310(95)00347-9, 1996.
Camalier, L., Cox, W., and Dolwick, P.: The effects of meteorology on ozone in urban areas and their use in assessing ozone trends, Atmos. Environ., 41, 7127–7137, https://doi.org/10.1016/j.atmosenv.2007.04.061, 2007.
Chen, Z., Zhuang, Y., Xie, X., Chen, D., Cheng, N., Yang, L., and Li, R.: Understanding long-term variations of meteorological influences on ground ozone concentrations in Beijing During 2006–2016, Environ. Pollut., 245, 29–37, https://doi.org/10.1016/j.envpol.2018.10.117, 2019.
Cohen, A. J., Brauer, M., Burnett, R., Anderson, H. R., Frostad, J., Estep, K., Balakrishnan, K., Brunekreef, B., Dandona, L., Dandona, R., Feigin, V., Freedman, G., Hubbell, B., Jobling, A., Kan, H., Knibbs, L., Liu, Y., Martin, R., Morawska, L., Pope, C. A., Shin, H., Straif, K., Shaddick, G., Thomas, M., van Dingenen, R., van Donkelaar, A., Vos, T., Murray, C. J. L., and Forouzanfar, M. H.: Estimates and 25-year trends of the global burden of disease attributable to ambient air pollution: an analysis of data from the Global Burden of Diseases Study 2015, Lancet, 389, 1907–1918, https://doi.org/10.1016/S0140-6736(17)30505-6, 2017.
Davis, J. M., Eder, B. K., Nychka, D., and Yang, Q.: Modeling the effects of meteorology on ozone in Houston using cluster analysis and generalized additive models, Atmos. Environ., 32, 2505–2520, https://doi.org/10.1016/S1352-2310(98)00008-9, 1998.
Ding, A., Huang, X., and Fu, C.: Air pollution and weather interaction in East Asia, Oxford Reaserch Encyclopedias: Environmental Science, 1, 1–26, https://doi.org/10.1093/acrefore/9780199389414.013.536, 2017
Ding, K., Liu, J., Ding, A., Liu, Q., Zhao, T. L., Shi, J., Han, Y., Wang, H., and Jiang, F.: Uplifting of carbon monoxide from biomass burning and anthropogenic sources to the free troposphere in East Asia, Atmos. Chem. Phys., 15, 2843–2866, https://doi.org/10.5194/acp-15-2843-2015, 2015.
Ding, Y. and Chan, J. C. L.: The East Asian summer monsoon: an overview, Meteorol. Atmos. Phys., 89, 117–142, https://doi.org/10.1007/s00703-005-0125-z, 2005.
Dufour, G., Eremenko, M., Cuesta, J., Doche, C., Foret, G., Beekmann, M., Cheiney, A., Wang, Y., Cai, Z., Liu, Y., Takigawa, M., Kanaya, Y., and Flaud, J.-M.: Springtime daily variations in lower-tropospheric ozone over east Asia: the role of cyclonic activity and pollution as observed from space with IASI, Atmos. Chem. Phys., 15, 10839–10856, https://doi.org/10.5194/acp-15-10839-2015, 2015.
Gao, W., Tie, X., Xu, J., Huang, R., Mao, X., Zhou, G., and Chang, L.: Long-term trend of O3 in a mega City (Shanghai), China: Characteristics, causes, and interactions with precursors, Sci. Total Environ., 603–604, 425–433, https://doi.org/10.1016/j.scitotenv.2017.06.099, 2017.
Gong, X., Hong, S., and Jaffe, D. A.: Ozone in China: Spatial distribution and leading meteorological factors controlling O3 in 16 Chinese Cities, Aerosol Air Qual. Res., 18, 2287–2300, https://doi.org/10.4209/aaqr.2017.10.0368, 2018.
Han, H., Liu, J., Yuan, H., Zhuang, B., Zhu, Y., Wu, Y., Yan, Y., and Ding, A.: Characteristics of intercontinental transport of tropospheric ozone from Africa to Asia, Atmos. Chem. Phys., 18, 4251–4276, https://doi.org/10.5194/acp-18-4251-2018, 2018a.
Han, H., Liu, J., Yuan, H., Jiang, F., Zhu, Y., Wu, Y., Wang, T., and Zhuang, B.: Impacts of synoptic weather patterns and their persistency on free tropospheric carbon monoxide concentrations and outflow in eastern China, J. Geophys. Res.-Atmos., 123, 7024–7046, https://doi.org/10.1029/2017JD028172, 2018b.
Han, H., Liu, J., Yuan, H., Wang, T., Zhuang, B., and Zhang, X.: Foreign influences on tropospheric ozone over East Asia through global atmospheric transport, Atmos. Chem. Phys., 19, 12495–12514, https://doi.org/10.5194/acp-19-12495-2019, 2019.
He, J., Wu, Z., Jiang, Z., Miao, C., and Han, G.: “Climate effect” of the northeast cold vortex and its influences on Meiyu, Chin. Sci. Bull., 52, 671–679, https://doi.org/10.1007/s11434-007-0053-z, 2007.
He, Y. J., Uno, I., Wang, Z. F., Pochanart, P., Li, J., and Akimoto, H.: Significant impact of the East Asia monsoon on ozone seasonal behavior in the boundary layer of Eastern China and the west Pacific region, Atmos. Chem. Phys., 8, 7543–7555, https://doi.org/10.5194/acp-8-7543-2008, 2008.
Herring, S. C., Christidis, N., Hoell, A., Hoerling, M. P., and Stott, P. A.: Explaining extreme events of 2017 from a climate perspective, B. Am. Meteorol. Soc., 100, S1–S117, https://doi.org/10.1175/BAMS-ExplainingExtremeEvents2017.1, 2019.
Hewitson, B. C. and Crane, R. G.: Self-organizing maps: applications to synoptic climatology, Clim. Res., 22, 13–26, https://doi.org/10.3354/cr022013, 2002.
Horton, D. E., Harshvardhan and Diffenbaugh, N. S.: Response of air stagnation frequency to anthropogenically enhanced radiative forcing, Environ. Res. Lett., 7, 044034, https://doi.org/10.1088/1748-9326/7/4/044034, 2012.
Hou, X., Zhu, B., Fei, D., and Wang, D.: The impacts of summer monsoons on the ozone budget of the atmospheric boundary layer of the Asia-Pacific region, Sci. Total Environ., 502, 641–649, https://doi.org/10.1016/j.scitotenv.2014.09.075, 2015.
Hou, X., Zhu, B., Kang, H., and Gao, J.: Analysis of seasonal ozone budget and spring ozone latitudinal gradient variation in the boundary layer of the Asia-Pacific region, Atmos. Environ., 94, 734–741, https://doi.org/10.1016/j.atmosenv.2014.06.006, 2014.
Hu, J., Li, Y., Zhao, T., Liu, J., Hu, X.-M., Liu, D., Jiang, Y., Xu, J., and Chang, L.: An important mechanism of regional O3 transport for summer smog over the Yangtze River Delta in eastern China, Atmos. Chem. Phys., 18, 16239–16251, https://doi.org/10.5194/acp-18-16239-2018, 2018.
Huang, J., Liu, H., Crawford, J. H., Chan, C., Considine, D. B., Zhang, Y., Zheng, X., Zhao, C., Thouret, V., Oltmans, S. J., Liu, S. C., Jones, D. B. A., Steenrod, S. D., and Damon, M. R.: Origin of springtime ozone enhancements in the lower troposphere over Beijing: in situ measurements and model analysis, Atmos. Chem. Phys., 15, 5161–5179, https://doi.org/10.5194/acp-15-5161-2015, 2015.
Huth, R., Beck, C., Philipp, A., Demuzere, M., Ustrnul, Z., Cahynová, M., Kyselý, J., and Tveito, O. E.: Classifications of atmospheric circulation patterns, Ann. N. Y. Acad. Sci., 1146, 105–152, https://doi.org/10.1196/annals.1446.019, 2008.
Jacob, D. J. and Winner, D. A.: Effect of climate change on air quality, Atmos. Environ., 43, 51–63, https://doi.org/10.1016/j.atmosenv.2008.09.051, 2009.
Jensen, A. A., Thompson, A. M., and Schmidlin, F. J.: Classification of Ascension Island and Natal ozonesondes using self-organizing maps, J. Geophys. Res.-Atmos., 117, D04302, https://doi.org/10.1029/2011JD016573, 2012.
Jerrett, M., Burnett, R. T., Pope, C. A., Ito, K., Thurston, G., Krewski, D., Shi, Y., Calle, E., and Thun, M.: Long-term ozone exposure and mortality, N. Engl. J. Med., 360, 1085–1095, https://doi.org/10.1056/NEJMoa0803894, 2009.
Jiang, N., Scorgie, Y., Hart, M., Riley, M. L., Crawford, J., Beggs, P. J., Edwards, G. C., Chang, L., Salter, D., and Virgilio, G. D.: Visualising the relationships between synoptic circulation type and air quality in Sydney, a subtropical coastal-basin environment, Int. J. Climatol., 37, 1211–1228, https://doi.org/10.1002/joc.4770, 2017.
Jiang, Y. C., Zhao, T. L., Liu, J., Xu, X. D., Tan, C. H., Cheng, X. H., Bi, X. Y., Gan, J. B., You, J. F., and Zhao, S. Z.: Why does surface ozone peak before a typhoon landing in southeast China?, Atmos. Chem. Phys., 15, 13331–13338, https://doi.org/10.5194/acp-15-13331-2015, 2015.
Kohonen, T.: The self-organizing map, Proc. IEEE, 78, 1464–1480, https://doi.org/10.1109/5.58325, 1990.
Lam, Y. F., Cheung, H. M., and Ying, C. C.: Impact of tropical cyclone track change on regional air quality, Sci. Total Environ., 610–611, 1347–1355, https://doi.org/10.1016/j.scitotenv.2017.08.100, 2018.
Leung, D. M., Tai, A. P. K., Mickley, L. J., Moch, J. M., van Donkelaar, A., Shen, L., and Martin, R. V.: Synoptic meteorological modes of variability for fine particulate matter (PM2.5) air quality in major metropolitan regions of China, Atmos. Chem. Phys., 18, 6733–6748, https://doi.org/10.5194/acp-18-6733-2018, 2018.
Li, G., Bei, N., Cao, J., Wu, J., Long, X., Feng, T., Dai, W., Liu, S., Zhang, Q., and Tie, X.: Widespread and persistent ozone pollution in eastern China during the non-winter season of 2015: observations and source attributions, Atmos. Chem. Phys., 17, 2759–2774, https://doi.org/10.5194/acp-17-2759-2017, 2017.
Li, K., Jacob, D. J., Liao, H., Shen, L., Zhang, Q., and Bates, K. H.: Anthropogenic drivers of 2013–2017 trends in summer surface ozone in China, P. Natl. Acad. Sci. USA, 116, 422, https://doi.org/10.1073/pnas.1812168116, 2019.
Li, S., Wang, T., Huang, X., Pu, X., Li, M., Chen, P., Yang, X.-Q., and Wang, M.: Impact of East Asian summer monsoon on surface ozone pattern in China, J. Geophys. Res.-Atmos., 123, 1401–1411, https://doi.org/10.1002/2017JD027190, 2018.
Li, Y., Deng, Y., Yang, S., and Zhang, H.: Multi-scale temporospatial variability of the East Asian Meiyu-Baiu fronts: characterization with a suite of new objective indices, Clim. Dynam., 51, 1659–1670, https://doi.org/10.1007/s00382-017-3975-4, 2018.
Liang, C.-K., West, J. J., Silva, R. A., Bian, H., Chin, M., Davila, Y., Dentener, F. J., Emmons, L., Flemming, J., Folberth, G., Henze, D., Im, U., Jonson, J. E., Keating, T. J., Kucsera, T., Lenzen, A., Lin, M., Lund, M. T., Pan, X., Park, R. J., Pierce, R. B., Sekiya, T., Sudo, K., and Takemura, T.: HTAP2 multi-model estimates of premature human mortality due to intercontinental transport of air pollution and emission sectors, Atmos. Chem. Phys., 18, 10497–10520, https://doi.org/10.5194/acp-18-10497-2018, 2018.
Liao, Z., Gao, M., Sun, J., and Fan, S.: The impact of synoptic circulation on air quality and pollution-related human health in the Yangtze River Delta region, Sci. Total Environ., 607–608, 838–846, https://doi.org/10.1016/j.scitotenv.2017.07.031, 2017.
Liao, Z., Sun, J., Yao, J., Liu, L., Li, H., Liu, J., Xie, J., Wu, D., and Fan, S.: Self-organized classification of boundary layer meteorology and associated characteristics of air quality in Beijing, Atmos. Chem. Phys., 18, 6771–6783, https://doi.org/10.5194/acp-18-6771-2018, 2018.
Liu, Y., Weisberg, R. H., and Mooers, C. N. K.: Performance evaluation of the self-organizing map for feature extraction, J. Geophys. Res.-Oceans, 111, C05018, https://doi.org/10.1029/2005JC003117, 2006.
Lou, S., Liao, H., Yang, Y., and Mu, Q.: Simulation of the interannual variations of tropospheric ozone over China: Roles of variations in meteorological parameters and anthropogenic emissions, Atmos. Environ., 122, 839–851, https://doi.org/10.1016/j.atmosenv.2015.08.081, 2015.
Lu, X., Hong, J., Zhang, L., Cooper, O. R., Schultz, M. G., Xu, X., Wang, T., Gao, M., Zhao, Y., and Zhang, Y.: Severe surface ozone pollution in China: A global perspective, Environ. Sci. Technol. Lett., 5, 487–494, https://doi.org/10.1021/acs.estlett.8b00366, 2018.
Lu, X., Zhang, L., Chen, Y., Zhou, M., Zheng, B., Li, K., Liu, Y., Lin, J., Fu, T.-M., and Zhang, Q.: Exploring 2016–2017 surface ozone pollution over China: source contributions and meteorological influences, Atmos. Chem. Phys., 19, 8339–8361, https://doi.org/10.5194/acp-19-8339-2019, 2019a.
Lu, X., Zhang, L., and Shen, L.: Meteorology and climate influences on tropospheric ozone: a review of natural sources, chemistry, and transport patterns, Curr. Pollut. Rep., 5, 238–260, https://doi.org/10.1007/s40726-019-00118-3, 2019b.
Ma, Z., Xu, J., Quan, W., Zhang, Z., Lin, W., and Xu, X.: Significant increase of surface ozone at a rural site, north of eastern China, Atmos. Chem. Phys., 16, 3969–3977, https://doi.org/10.5194/acp-16-3969-2016, 2016.
Michaelides, S. C., Liassidou, F., and Schizas, C. N.: Synoptic classification and establishment of analogues with artificial neural networks, Pure Appl. Geophys., 164, 1347–1364, https://doi.org/10.1007/s00024-007-0222-7, 2007.
Monks, P. S., Archibald, A. T., Colette, A., Cooper, O., Coyle, M., Derwent, R., Fowler, D., Granier, C., Law, K. S., Mills, G. E., Stevenson, D. S., Tarasova, O., Thouret, V., von Schneidemesser, E., Sommariva, R., Wild, O., and Williams, M. L.: Tropospheric ozone and its precursors from the urban to the global scale from air quality to short-lived climate forcer, Atmos. Chem. Phys., 15, 8889–8973, https://doi.org/10.5194/acp-15-8889-2015, 2015.
Ni, R., Lin, J., Yan, Y., and Lin, W.: Foreign and domestic contributions to springtime ozone over China, Atmos. Chem. Phys., 18, 11447–11469, https://doi.org/10.5194/acp-18-11447-2018, 2018.
Ordóñez, C., Mathis, H., Furger, M., Henne, S., Hüglin, C., Staehelin, J., and Prévôt, A. S. H.: Changes of daily surface ozone maxima in Switzerland in all seasons from 1992 to 2002 and discussion of summer 2003, Atmos. Chem. Phys., 5, 1187–1203, https://doi.org/10.5194/acp-5-1187-2005, 2005.
Otero, N., Sillmann, J., Schnell, J. L., Rust, H. W., and Butler, T.: Synoptic and meteorological drivers of extreme ozone concentrations over Europe, Environ. Res. Lett., 11, 024005, https://doi.org/10.1088/1748-9326/11/2/024005, 2016.
Philipp, A., Beck, C., Huth, R., and Jacobeit, J.: Development and comparison of circulation type classifications using the COST 733 dataset and software, Int. J. Climatol., 36, 2673–2691, https://doi.org/10.1002/joc.3920, 2014.
Porter, W. C., Heald, C. L., Cooley, D., and Russell, B.: Investigating the observed sensitivities of air-quality extremes to meteorological drivers via quantile regression, Atmos. Chem. Phys., 15, 10349–10366, https://doi.org/10.5194/acp-15-10349-2015, 2015.
Pu, X., Wang, T. J., Huang, X., Melas, D., Zanis, P., Papanastasiou, D. K., and Poupkou, A.: Enhanced surface ozone during the heat wave of 2013 in Yangtze River Delta region, China, Sci. Total Environ., 603–604, 807–816, https://doi.org/10.1016/j.scitotenv.2017.03.056, 2017.
Shen, L. and Mickley, L. J.: Seasonal prediction of US summertime ozone using statistical analysis of large scale climate patterns, P. Natl. Acad. Sci. USA, 114, 2491, https://doi.org/10.1073/pnas.1610708114, 2017.
Shen, L., Mickley, L. J., and Tai, A. P. K.: Influence of synoptic patterns on surface ozone variability over the eastern United States from 1980 to 2012, Atmos. Chem. Phys., 15, 10925–10938, https://doi.org/10.5194/acp-15-10925-2015, 2015.
Shen, L., Mickley, L. J., and Gilleland, E.: Impact of increasing heat waves on U.S. ozone episodes in the 2050s: Results from a multimodel analysis using extreme value theory, Geophys. Res. Lett., 43, 4017–4025, https://doi.org/10.1002/2016GL068432, 2016.
Shen, L., Mickley, L. J., and Murray, L. T.: Influence of 2000–2050 climate change on particulate matter in the United States: results from a new statistical model, Atmos. Chem. Phys., 17, 4355–4367, https://doi.org/10.5194/acp-17-4355-2017, 2017.
Shen, L., Jacob, D. J., Liu, X., Huang, G., Li, K., Liao, H., and Wang, T.: An evaluation of the ability of the Ozone Monitoring Instrument (OMI) to observe boundary layer ozone pollution across China: application to 2005–2017 ozone trends, Atmos. Chem. Phys., 19, 6551–6560, https://doi.org/10.5194/acp-19-6551-2019, 2019a.
Shen, L., Jacob, D. J., Zhu, L., Zhang, Q., Zheng, B., Sulprizio, M. P., Li, K., De Smedt, I., González Abad, G., Cao, H., Fu, T.-M., and Liao, H.: The 2005–2016 trends of formaldehyde columns over China observed by satellites: increasing anthropogenic emissions of volatile organic compounds and decreasing agricultural fire emissions, Geophys. Res. Lett., 46, 4468–4475, https://doi.org/10.1029/2019GL082172, 2019b.
Shu, L., Xie, M., Wang, T., Gao, D., Chen, P., Han, Y., Li, S., Zhuang, B., and Li, M.: Integrated studies of a regional ozone pollution synthetically affected by subtropical high and typhoon system in the Yangtze River Delta region, China, Atmos. Chem. Phys., 16, 15801–15819, https://doi.org/10.5194/acp-16-15801-2016, 2016.
Shu, L., Xie, M., Gao, D., Wang, T., Fang, D., Liu, Q., Huang, A., and Peng, L.: Regional severe particle pollution and its association with synoptic weather patterns in the Yangtze River Delta region, China, Atmos. Chem. Phys., 17, 12871–12891, https://doi.org/10.5194/acp-17-12871-2017, 2017.
Shu, L., Wang, T., Xie, M., Li, M., Zhao, M., Zhang, M., and Zhao, X.: Episode study of fine particle and ozone during the CAPUM-YRD over Yangtze River Delta of China: Characteristics and source attribution, Atmos. Environ., 203, 87–101, https://doi.org/10.1016/j.atmosenv.2019.01.044, 2019.
Silver, B., Reddington, C. L., Arnold, S. R., and Spracklen, D. V.: Substantial changes in air pollution across China during 2015–2017, Environ. Res. Lett., 13, 114012, https://doi.org/10.1088/1748-9326/aae718, 2018.
Stauffer, R. M., Thompson, A. M., and Witte, J. C.: Characterizing global ozonesonde profile variability from surface to the UT/LS with a clustering technique and MERRA-2 reanalysis, J. Geophys. Res.-Atmos., 123, 6213–6229, https://doi.org/10.1029/2018JD028465, 2018.
Sun, L., Xue, L., Wang, T., Gao, J., Ding, A., Cooper, O. R., Lin, M., Xu, P., Wang, Z., Wang, X., Wen, L., Zhu, Y., Chen, T., Yang, L., Wang, Y., Chen, J., and Wang, W.: Significant increase of summertime ozone at Mount Tai in Central Eastern China, Atmos. Chem. Phys., 16, 10637–10650, https://doi.org/10.5194/acp-16-10637-2016, 2016.
Tai, A. P. K., Mickley, L. J., and Jacob, D. J.: Correlations between fine particulate matter (PM2.5) and meteorological variables in the United States: Implications for the sensitivity of PM2.5 to climate change, Atmos. Environ., 44, 3976–3984, https://doi.org/10.1016/j.atmosenv.2010.06.060, 2010.
Tan, Z., Lu, K., Jiang, M., Su, R., Dong, H., Zeng, L., Xie, S., Tan, Q., and Zhang, Y.: Exploring ozone pollution in Chengdu, southwestern China: A case study from radical chemistry to O3-VOC-NOx sensitivity, Sci. Total Environ., 636, 775–786, https://doi.org/10.1016/j.scitotenv.2018.04.286, 2018.
Verstraeten, W. W., Neu, J. L., Williams, J. E., Bowman, K. W., Worden, J. R., and Boersma, K. F.: Rapid increases in tropospheric ozone production and export from China, Nat. Geosci., 8, 690, https://doi.org/10.1038/ngeo2493, 2015.
Wang, B. and Fan, Z.: Choice of South Asian summer monsoon indices, B. Am. Meteorol. Soc., 80, 629–638, https://doi.org/10.1175/1520-0477(1999)080<0629:COSASM>2.0.CO;2, 1999.
Wang, B., Wu, Z., Li, J., Liu, J., Chang, C.-P., Ding, Y., and Wu, G.: How to measure the strength of the East Asian summer monsoon, J. Climate, 21, 4449–4463, https://doi.org/10.1175/2008JCLI2183.1, 2008.
Wang, H., Lyu, X., Guo, H., Wang, Y., Zou, S., Ling, Z., Wang, X., Jiang, F., Zeren, Y., Pan, W., Huang, X., and Shen, J.: Ozone pollution around a coastal region of South China Sea: interaction between marine and continental air, Atmos. Chem. Phys., 18, 4277–4295, https://doi.org/10.5194/acp-18-4277-2018, 2018.
Wang, T., Ding, A., Gao, J., and Wu, W. S.: Strong ozone production in urban plumes from Beijing, China, Geophys. Res. Lett., 33, L21806, https://doi.org/10.1029/2006GL027689, 2006a.
Wang, T., Wong, H. L. A., Tang, J., Ding, A., Wu, W. S., and Zhang, X. C.: On the origin of surface ozone and reactive nitrogen observed at a remote mountain site in the northeastern Qinghai-Tibetan Plateau, western China, J. Geophys. Res.-Atmos., 111, D08303, https://doi.org/10.1029/2005JD006527, 2006b.
Wang, T., Wei, X. L., Ding, A. J., Poon, C. N., Lam, K. S., Li, Y. S., Chan, L. Y., and Anson, M.: Increasing surface ozone concentrations in the background atmosphere of Southern China, 1994–2007, Atmos. Chem. Phys., 9, 6217–6227, https://doi.org/10.5194/acp-9-6217-2009, 2009.
Wang, T., Xue, L., Brimblecombe, P., Lam, Y. F., Li, L., and Zhang, L.: Ozone pollution in China: A review of concentrations, meteorological influences, chemical precursors, and effects, Sci. Total Environ., 575, 1582–1596, https://doi.org/10.1016/j.scitotenv.2016.10.081, 2017.
Wang, Y., Konopka, P., Liu, Y., Chen, H., Müller, R., Plöger, F., Riese, M., Cai, Z., and Lü, D.: Tropospheric ozone trend over Beijing from 2002–2010: ozonesonde measurements and modeling analysis, Atmos. Chem. Phys., 12, 8389–8399, https://doi.org/10.5194/acp-12-8389-2012, 2012.
Wang, Y., Wang, H., Guo, H., Lyu, X., Cheng, H., Ling, Z., Louie, P. K. K., Simpson, I. J., Meinardi, S., and Blake, D. R.: Long-term O3-precursor relationships in Hong Kong: field observation and model simulation, Atmos. Chem. Phys., 17, 10919–10935, https://doi.org/10.5194/acp-17-10919-2017, 2017.
Wu, S., Duncan, B. N., Jacob, D. J., Fiore, A. M., and Wild, O.: Chemical nonlinearities in relating intercontinental ozone pollution to anthropogenic emissions, Geophys. Res. Lett., 36, L05806, https://doi.org/10.1029/2008GL036607, 2009.
Xu, W., Lin, W., Xu, X., Tang, J., Huang, J., Wu, H., and Zhang, X.: Long-term trends of surface ozone and its influencing factors at the Mt Waliguan GAW station, China – Part 1: Overall trends and characteristics, Atmos. Chem. Phys., 16, 6191–6205, https://doi.org/10.5194/acp-16-6191-2016, 2016.
Yang, Y., Liao, H., and Li, J.: Impacts of the East Asian summer monsoon on interannual variations of summertime surface-layer ozone concentrations over China, Atmos. Chem. Phys., 14, 6867–6879, https://doi.org/10.5194/acp-14-6867-2014, 2014.
Yue, X., Unger, N., Harper, K., Xia, X., Liao, H., Zhu, T., Xiao, J., Feng, Z., and Li, J.: Ozone and haze pollution weakens net primary productivity in China, Atmos. Chem. Phys., 17, 6073–6089, https://doi.org/10.5194/acp-17-6073-2017, 2017.
Zanis, P., Monks, P. S., Schuepbach, E., Carpenter, L. J., Green, T. J., Mills, G. P., Bauguitte, S., and Penkett, S. A.: In situ ozone production under free tropospheric conditions during FREETEX '98 in the Swiss Alps, J. Geophys. Res.-Atmos., 105, 24223–24234, https://doi.org/10.1029/2000JD900229, 2000.
Zanis, P., Kourtidis, K., Rappenglueck, B., Zerefos, C., Melas, D., Balis, D., Schmitt, R., Rapsomanikis, S., and Fabian, P.: A case study on the possible link between surface ozone photochemistry and total ozone column during the PAUR II experiment at Crete: Comparison of observations with box model calculations, J. Geophys. Res.-Atmos., 107, 8136, https://doi.org/10.1029/2000JD000137, 2002.
Zanis, P., Katragkou, E., Tegoulias, I., Poupkou, A., Melas, D., Huszar, P., and Giorgi, F.: Evaluation of near surface ozone in air quality simulations forced by a regional climate model over Europe for the period 1991–2000, Atmos. Environ., 45, 6489–6500, https://doi.org/10.1016/j.atmosenv.2011.09.001, 2011.
Zhan, Y., Luo, Y., Deng, X., Grieneisen, M. L., Zhang, M., and Di, B.: Spatiotemporal prediction of daily ambient ozone levels across China using random forest for human exposure assessment, Environ. Pollut., 233, 464–473, https://doi.org/10.1016/j.envpol.2017.10.029, 2018.
Zhang, J. P., Zhu, T., Zhang, Q. H., Li, C. C., Shu, H. L., Ying, Y., Dai, Z. P., Wang, X., Liu, X. Y., Liang, A. M., Shen, H. X., and Yi, B. Q.: The impact of circulation patterns on regional transport pathways and air quality over Beijing and its surroundings, Atmos. Chem. Phys., 12, 5031–5053, https://doi.org/10.5194/acp-12-5031-2012, 2012.
Zhang, Q., Yuan, B., Shao, M., Wang, X., Lu, S., Lu, K., Wang, M., Chen, L., Chang, C.-C., and Liu, S. C.: Variations of ground-level O3 and its precursors in Beijing in summertime between 2005 and 2011, Atmos. Chem. Phys., 14, 6089–6101, https://doi.org/10.5194/acp-14-6089-2014, 2014.
Zhang, Y., Mao, H., Ding, A., Zhou, D., and Fu, C.: Impact of synoptic weather patterns on spatio-temporal variation in surface O3 levels in Hong Kong during 1999–2011, Atmos. Environ., 73, 41–50, https://doi.org/10.1016/j.atmosenv.2013.02.047, 2013.
Zhang, Y., Ding, A., Mao, H., Nie, W., Zhou, D., Liu, L., Huang, X., and Fu, C.: Impact of synoptic weather patterns and inter-decadal climate variability on air quality in the North China Plain during 1980–2013, Atmos. Environ., 124, 119–128, https://doi.org/10.1016/j.atmosenv.2015.05.063, 2016.
Zhao, W., Fan, S., Guo, H., Gao, B., Sun, J., and Chen, L.: Assessing the impact of local meteorological variables on surface ozone in Hong Kong during 2000–2015 using quantile and multiple line regression models, Atmos. Environ., 144, 182–193, https://doi.org/10.1016/j.atmosenv.2016.08.077, 2016.
Zhao, Z. and Wang, Y.: Influence of the West Pacific subtropical high on surface ozone daily variability in summertime over eastern China, Atmos. Environ., 170, 197–204, https://doi.org/10.1016/j.atmosenv.2017.09.024, 2017.
Zheng, B., Tong, D., Li, M., Liu, F., Hong, C., Geng, G., Li, H., Li, X., Peng, L., Qi, J., Yan, L., Zhang, Y., Zhao, H., Zheng, Y., He, K., and Zhang, Q.: Trends in China's anthropogenic emissions since 2010 as the consequence of clean air actions, Atmos. Chem. Phys., 18, 14095–14111, https://doi.org/10.5194/acp-18-14095-2018, 2018.
Zhou, D., Ding, A., Mao, H., Fu, C., Wang, T., Chan, L. Y., Ding, K., Zhang, Y., Liu, J., Lu, A., and Hao, N.: Impacts of the East Asian monsoon on lower tropospheric ozone over coastal South China, Environ. Res. Lett., 8, 044011, https://doi.org/10.1088/1748-9326/8/4/044011, 2013.
Ziemke, J. R., Chandra, S., Duncan, B. N., Froidevaux, L., Bhartia, P. K., Levelt, P. F., and Waters, J. W.: Tropospheric ozone determined from Aura OMI and MLS: Evaluation of measurements and comparison with the Global Modeling Initiative's Chemical Transport Model, J. Geophys. Res., 111, D19303, https://doi.org/10.1029/2006JD007089, 2006.
- Abstract
- Introduction
- Data and methods
- Seasonal and interannual variations in surface ozone in eastern China
- Meteorological drivers for summertime surface ozone in eastern China
- Synoptic impacts on summertime surface ozone in eastern China
- Summary
- Data availability
- Author contributions
- Competing interests
- Special issue statement
- Acknowledgements
- Financial support
- Review statement
- References
- Supplement