the Creative Commons Attribution 4.0 License.
the Creative Commons Attribution 4.0 License.
 | 28 Jan 2020
No anomalous supersaturation in ultracold cirrus laboratory experiments
Benjamin W. Clouser
Kara D. Lamb
Laszlo C. Sarkozy
Jan Habig
Volker Ebert
Harald Saathoff
Ottmar Möhler
Elisabeth J. Moyer
High-altitude cirrus clouds are climatically important: their formation freeze-dries air ascending to the stratosphere to its final value, and their radiative impact is disproportionately large. However, their formation and growth are not fully understood, and multiple in situ aircraft campaigns have observed frequent and persistent apparent water vapor supersaturations of 5 %–25 % in ultracold cirrus (T<205 K), even in the presence of ice particles. A variety of explanations for these observations have been put forth, including that ultracold cirrus are dominated by metastable ice whose vapor pressure exceeds that of hexagonal ice. The 2013 IsoCloud campaign at the Aerosol Interaction and Dynamics in the Atmosphere (AIDA) cloud and aerosol chamber allowed explicit testing of cirrus formation dynamics at these low temperatures. A series of 28 experiments allows robust estimation of the saturation vapor pressure over ice for temperatures between 189 and 235 K, with a variety of ice nucleating particles. Experiments are rapid enough (∼10 min) to allow detection of any metastable ice that may form, as the timescale for annealing to hexagonal ice is hours or longer over the whole experimental temperature range. We show that in all experiments, saturation vapor pressures are fully consistent with expected values for hexagonal ice and inconsistent with the highest values postulated for metastable ice, with no temperature-dependent deviations from expected saturation vapor pressure. If metastable ice forms in ultracold cirrus clouds, it appears to have a vapor pressure indistinguishable from that of hexagonal ice to within about 4.5 %.
- Article
(1813 KB) - Full-text XML
-
Supplement
(454 KB) - BibTeX
- EndNote


As air rises into the stratosphere, it is freeze-dried by condensation as it passes through the coldest regions of the upper troposphere and lower stratosphere (UT/LS). The temperature-dependent saturation vapor pressure over ice therefore plays a strong role in setting the water vapor concentration of the stratosphere as a whole (e.g., Brewer, 1949), and in determining the abundance and characteristics of radiatively important tropical cold cirrus. Inadequate understanding of saturation vapor pressure, or incomplete relaxation of air to saturation, would result in excess stratospheric water and errors in both chemistry models and radiative forcing calculations. For example, an apparent supersaturation of 20 % at 190 K over expected values (from the Murphy–Koop parametrization, henceforth MK; Murphy and Koop, 2005) corresponds to a difference of about 0.7 ppmv H2O. If uniformly distributed, this additional stratospheric water would increase global surface radiative forcing by about 0.2 W m−2 (Forster and Shine, 1999). Incomplete dehydration would also change the radiative effect of the cirrus produced by freeze-drying ascending air, but the magnitude and even sign of this effect are not well known. Reduced cirrus ice content would reduce longwave and shortwave cloud forcing, with opposing cooling and warming effects. Modeling studies show effects that are of comparable magnitude to the direct effect of water but disagree on the sign (Gettelman and Kinnison, 2007; Tan et al., 2016). Furthermore, some explanations for observed supersaturations invoke novel forms of ice that may have intrinsically different radiative properties than those of hexagonal ice (Murray et al., 2015). It is therefore important to understand the physics of ice nucleation and growth at the cold temperatures found in this region.
High apparent supersaturations within ice clouds have been measured in several in situ campaigns in the UT/LS, most frequently in the coldest ice clouds, with temperatures at or below 205 K (Krämer et al., 2009). From observations in the 2002 CRYSTAL-FACE campaign, Gao et al. (2004) reported supersaturations of 13 % above 202 K and 35 % below 202 K in cold cirrus and persistent contrails. Using water and particle measurements from the 2006 CR-AVE campaign, Lawson et al. (2008) found supersaturations in excess of 50 % in cirrus clouds. Inai et al. (2012) found frequent supersaturations above 25 % in cirrus clouds near the cold point using CALIOP data (Winker et al., 2007) and balloon-borne chilled-mirror hygrometer measurements taken during the 2007 and 2008 SOWER campaign (Fujiwara et al., 2010). Some degree of supersaturation has also been observed in cirrus at warmer temperatures. Petzold et al. (2017) show that hygrometer data (Neis et al., 2015) from IAGOS-CORE, a campaign using instrumented commercial aircraft reaching minimum temperatures of 205 K, exhibit most probable values of supersaturation over ice within cirrus of 5 %–10 %. A laboratory experiment in the AIDA (Aerosol Interaction and Dynamics in the Atmosphere) cloud chamber spanning a wide temperature range (243–185 K) showed values close to saturation, but with a systematic increase of ∼6 % with decreasing temperatures (Fahey et al., 2014).
Numerous explanations have been proposed for these observations. Many studies interpret them as true “anomalous supersaturation”, i.e., resulting from errors in our understanding of saturation vapor pressure and impossible to explain with standard microphysics. Explanations involving anomalous supersaturation include organic coatings on ice crystals (Cziczo et al., 2004a, b), glassy states (Zobrist et al., 2008; Kärcher and Haag, 2004; Murray, 2008a), surface uptake interference due to ice binding with HNO3 (Gao et al., 2004, 2016), temperature- and supersaturation-dependent accommodation coefficients (Zhang and Harrington, 2015), multi-component aerosols (Bogdan and Molina, 2010), and metastable forms of ice (Peter et al., 2006). Other studies suggest that no anomaly is necessary, and that measured supersaturations result only from dynamics, i.e., they occur when uptake rates on ice crystals are slow enough that the timescales of relaxation to saturation are long. Long timescales to achieve saturation may result from low particle numbers and small particle sizes found at low temperatures (Krämer et al., 2009; Murray et al., 2010; Rollins et al., 2016), or strong updrafts that lead to relaxation only to a dynamical equilibrium value (Petzold et al., 2017). The ATTREX campaigns of 2013–2014 provided examples of apparent supersaturations due to low particle numbers: supersaturations of up to 70 % were observed in low-concentration cirrus (<100 L−1), but not in those with high concentrations (up to 10 000 L−1), even at cold temperatures (190 K; Jensen et al., 2013). These measurements demonstrate that saturations consistent with MK are at least possible in cold cirrus. Finally, instrumental error could explain all or part of the observed anomalies (Fahey et al., 2014).
Metastable ices with non-hexagonal crystal structure and elevated saturation vapor pressures could provide an explanation that encompasses the diverse body of field measurements. Laboratory measurements have identified metastable ices with saturation vapor pressures of as much as 10.5 % higher than hexagonal ice (Ih) at temperatures below 200 K (Shilling et al., 2006). The properties of metastable ice are, however, determined by its crystal structure, which can take different forms that may have different vapor pressures. In the conditions found in Earth's atmosphere, ice forms layers of puckered hexagonal rings referred to as Ice I (Hobbs, 1974), which can be stacked in different ways: as mirror images of each other (hexagonal ice; ice Ih), shifted by half the ring width (cubic ice; ice Ic), or in a combination of both stacking sequences (stacking-disordered ice; ice Isd; Malkin et al., 2012). Note that much of the literature on cubic ice is now thought to have been measuring ice Isd (Malkin et al., 2015). The vapor pressure over metastable ice is poorly understood, and some modeling studies suggest that it depends less on the crystal's cubicity (fraction of cubic stacking sequences) than on the number and type of imperfections within the crystal (Hudait et al., 2016; Lupi et al., 2017).
Laboratory measurements and computer simulations suggest that stacking disordered ice could form in the UT/LS, which experiences the coldest temperatures found in Earth's atmosphere. Measurements by multiple groups have shown ice Isd forming in supercooled droplets, by both homogeneous and heterogeneous nucleation. Homogeneous nucleation of ice Isd was seen by Murray et al. (2005), Murray and Bertram (2006), Murray (2008b), and Malkin et al. (2012) in micrometer-sized water and solution droplets suspended in oil at temperatures of 170–240 K, and by Amaya et al. (2017) in nanodrops frozen during expansion of N2 carrier gas. Malkin et al. (2015) observed heterogeneous nucleation of ice Isd in water containing solid inclusions, and Kuhs et al. (2012) reported that pure hexagonal ice formation was never observed below 190 K. The cubicity in laboratory-generated ice Isd samples is variable and depends on factors such as the freezing temperature, droplet size, and aerosol type and content, but can be as high as 75 % in atmospherically relevant temperature ranges. Simulations agree that ice frozen at 180 K should form ice Isd, with Moore and Molinero (2011) producing two cubic ice layers for each hexagonal ice layer, i.e., a cubicity of 67 %.
No experimental studies to date have measured the resulting influence of ice Isd on the saturation vapor pressure expected in cirrus clouds. Many of the ice Isd nucleation experiments provide no means of measuring the vapor pressure over ice (i.e., those experiments involving droplets suspended in oil). Nachbar et al. (2018) show that ice formed by crystallization from amorphous solid water shows a significantly higher vapor pressure than MK at temperatures below 190 K, but it is unclear if this is ice Isd. Studies that report the free energy difference between metastable and hexagonal ices vary widely in their estimates, likely because the types of imperfections and defects that affect vapor pressure are strongly influenced by experimental conditions. No experiments have addressed the ice that is subsequently grown through vapor deposition onto ice Isd crystals. Observations of cirrus clouds are inevitably made after at least some growth has occurred, and no ongoing experiments address how these crystals behave as new ice layers are added. Recent modeling work on depositional ice growth at UT/LS temperatures suggests that ice should grow exclusively in hexagonal layers, regardless of nucleation method, as long as supersaturation levels are moderate and temperatures are above 200 K (Hudait and Molinero, 2016), while below 200 K some stacking disorder can occur. The properties of metastable ices nucleated and grown in real atmospheric conditions remain only poorly understood.
Any metastable ice formed in the cold UT/LS region should persist long enough to be relevant for cirrus microphysics. Observed transformation times for metastable ice into ice Ih depend strongly on the surface area of the samples (Murray et al., 2005), but for low-surface-area samples such as frozen droplets, the time can be quite long. Mayer and Hallbrucker (1987), Murray and Bertram (2006), Kuhs et al. (2012), and Murphy (2003) report annealing times of tens of minutes to hours over the UT/LS temperature range, and observe that by the termination of their experiments the transformation to ice Ih is often still not complete, especially at lower temperatures. Observations of secondary indicators like crystal habit suggest that metastable forms of ice may nucleate and persist for some time in the coldest parts of Earth's atmosphere. Hallett et al. (2002) observed that cubic sequences in an otherwise hexagonal structure would yield crystals with threefold rotational symmetry, and work by Hansen et al. (2008) and Murray et al. (2015) suggest that ice Isd should form crystals with trigonal structure. Field observations suggest that trigonal crystals may be quite common. In measurements by Heymsfield (1986) in the equatorial Pacific at about 16.5 km, about 50 % of the crystals between 5 and 50 µm exhibit threefold symmetry. Murray et al. (2015) review collected images of atmospheric ice crystals with threefold symmetry (including those from Heymsfield, 1986) and show that all are consistent with trigonal crystal structure.
The IsoCloud experimental campaign allows us to characterize saturation vapor pressure during post-nucleation growth of ice crystals in conditions characteristic of the UT/LS. The campaign consists of a series of cooling experiments with sample temperatures from 185 to 235 K, homogeneous nucleation of sulfuric acid (SA) and secondary organic (SOA) aerosols, and heterogenous nucleation on Arizona test dust (ATD), with number densities high enough to ensure that vapor can reach an equilibrium over the duration of each experiment. To reconstruct the saturation vapor pressure over ice, we use a box model and the observed properties of the ice cloud and chamber gas as cirrus grow and dissipate.
The 2012–2013 IsoCloud campaigns at the AIDA (Aerosol Interaction and Dynamics in the Atmosphere) cloud chamber involve a series of cirrus formation experiments designed to probe anomalous supersaturation. The chamber's pressure and temperature can be varied to replicate conditions throughout the UT/LS, and rapid pumping on the chamber simulates updrafts and can initiate nucleation. The chamber can be seeded with a variety of liquid aerosols and ice nucleating particles, and houses a variety of instruments that make useful measurements supporting the study of gas-phase water vapor, such as ice particle number and total water concentration. An in-depth discussion of the experiments, methods, and instruments used at AIDA and in the campaign can be found in Fahey et al. (2014) and Lamb et al. (2017). In the IsoCloud campaigns, 28 pseudo-adiabatic expansion experiments at temperatures between 185 and 235 K and pressures between 300 and 170 hPa were suitable for analysis. In these experiments, the chamber was seeded with Arizona test dust (ATD), sulfuric acid (SA), and secondary organic aerosols (SOA) which allowed the study of both heterogeneous and homogeneous nucleation. We use measurements of water vapor and total water (vapor + ice) and an ice growth model to estimate the saturation vapor pressure over ice (ei) for clouds from 185 to 235 K, with vapor pressure measurements in the coldest temperature regime (<205 K) provided by the new Chicago Water Isotope Spectrometer (ChiWIS). The remainder of this section is divided into subsections discussing the characteristics of the instruments used in the analysis, the experiments included, the criteria for their inclusion, and the model used to retrieve the saturation vapor pressure.
2.1 Instruments
Determining the saturation vapor pressure over ice requires measurements from three water instruments, an optical particle counter, and temperature and pressure sensors (Fig. 1). Each of these measurements is described in the following sections, along with the instruments taking them, typical accuracies and precisions, and limitations. Instrumental uncertainties are used to generate bounds on the retrieved saturation vapor pressures.
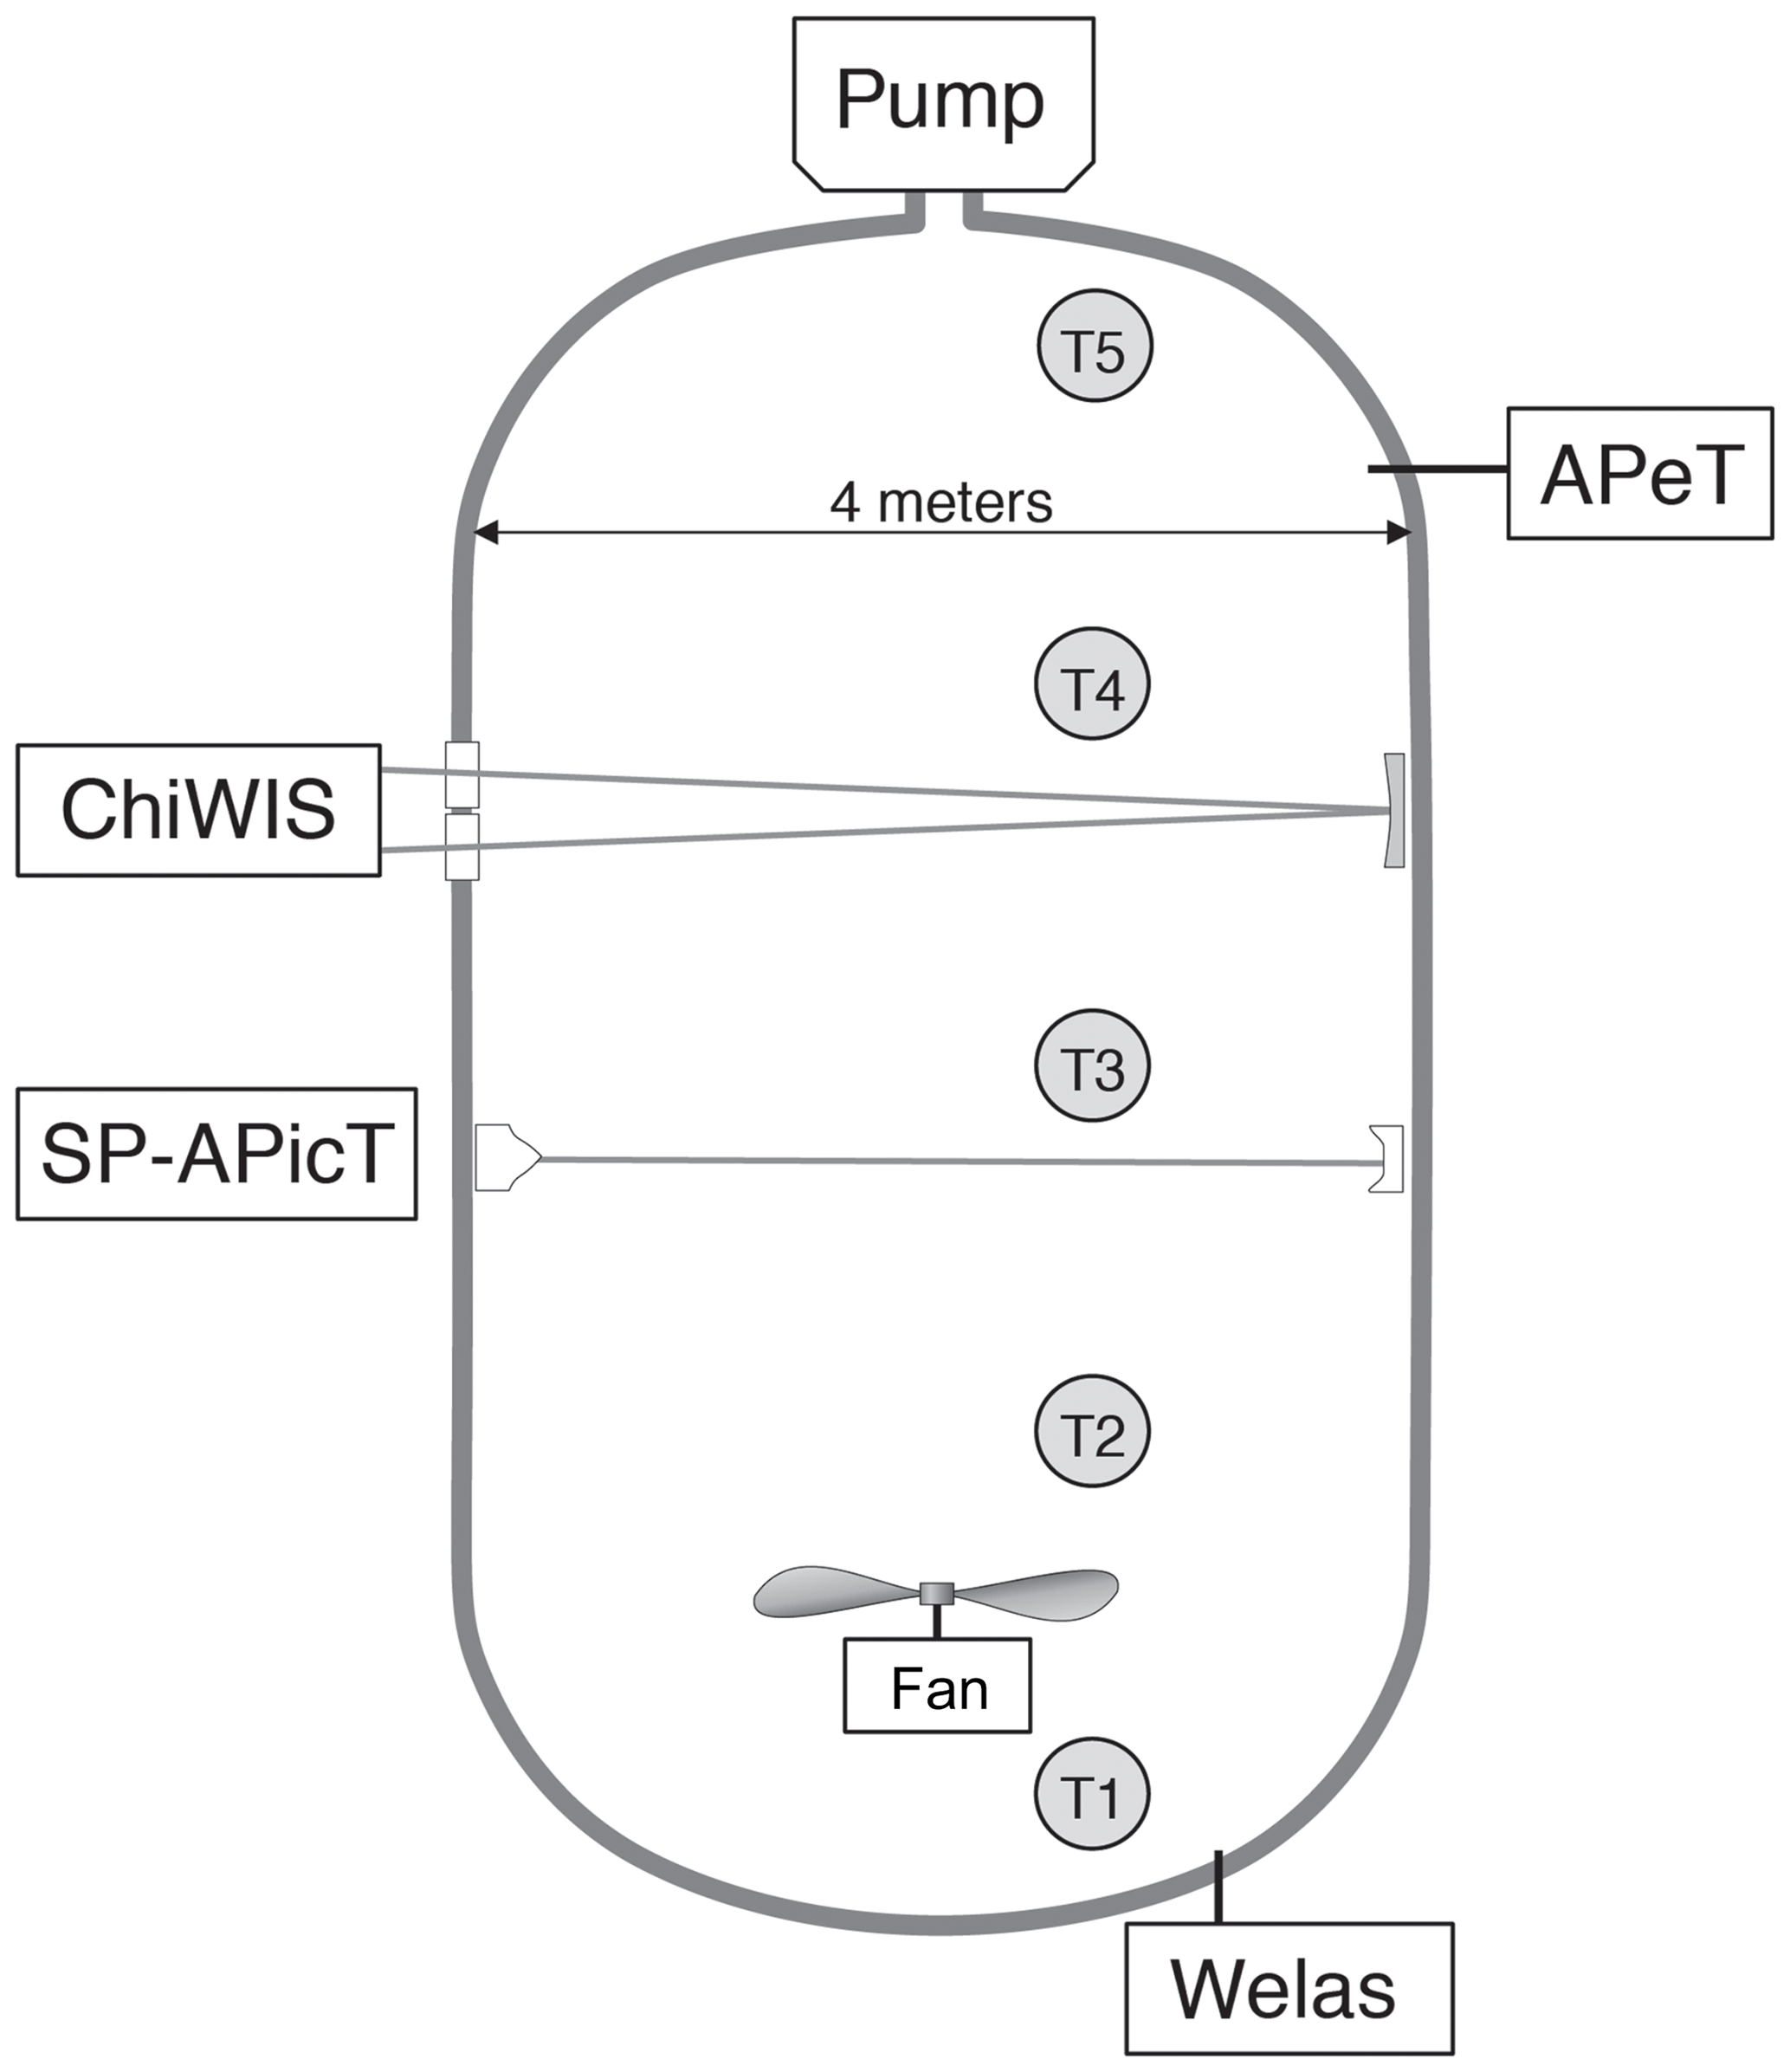
Figure 1Layout of the instruments used in this analysis during the IsoCloud campaigns at the AIDA chamber. ChiWIS and SP-APicT, both open-path tunable diode laser absorption spectroscopy (TDLAS) instruments, provided water vapor measurements. APeT, an extractive TDLAS instrument with a heated inlet, provided total water (ice + vapor) measurements, and Welas provided ice particle concentrations. The difference between total water and water vapor measurements was used to calculate ice mass in the chamber. Gas temperature is taken as the average of thermocouples 1 through 4. Thermocouple 5 is excluded from the analysis due to the presence of a region of warm air at the top of the chamber. The whole chamber is within a thermally controlled housing that sets the base temperature of an experiment. The pumps draw gas out of the chamber in a pseudo-adiabatic expansion.
Our primary source of information is ChiWIS, a mid-infrared tunable diode laser instrument operated in open-path mode using one of AIDA's White cell mirror systems. See Lamb et al. (2017) and Sarkozy et al. (2020) for instrument details. The instrument has a typical precision of 22 ppbv in H2O in analyzed IsoCloud experiments for 1 Hz measurements at 299.2 hPa and 204.2 K, corresponding to relative precisions of 5 % and 0.02 % at 0.45 and 100 ppmv, respectively. Measured quantities are retrieved by fitting spectra calculated from line parameters in the HITRAN database (Gordon et al., 2017) to raw spectra, rather than by empirical calibration. Fitting is done using ICOSfit, a non-linear, least-squares fitting algorithm. Uncertainties in the spectroscopic parameters for the (413–524) line at 3789.63481 cm−1 in the ν1 band from which H2O measurements are derived contribute an additional ±2.5 %–3 % systematic uncertainty. The uncertainty due to pressure broadening values varies slightly with temperature across the experimental range, but for simplicity we apply the maximal value of ± 3 % to all experiments. Errors in the linearization of the wavelength scale contribute another 0.2 % of systematic uncertainty to all experiments. Day- and experiment-specific systematic uncertainties due to the fit routine and in the path length contribute another ±1.1 %. See Sect. 3.5 for a complete discussion of uncertainty.
The SP-APicT (single-pass AIDA PCI in cloud TDL; Skrotzki, 2012) water vapor instrument is used to provide water vapor measurements in the case of thick ice clouds, which form in some IsoCloud experiments above 210 K (13 of 28 experiments). During warmer experiments that form very dense ice clouds, ChiWIS simultaneously experiences signal attenuation of up to 95 % and backscattering of light off the cloud into the detector, producing artifacts that affect retrieved concentrations. During these intervals, we rely on the SP-APicT instrument to provide water vapor measurements because that instrument's single-pass optical arrangement is much less sensitive to backscatter. At temperatures above 205 K, SP-APicT reports mixing ratios during ice-free periods about 1.5 % lower than ChiWIS. For consistency across all experiments, we arbitrarily scale up the substituted SP-APicT measurements by that factor (details can be found in Lamb et al., 2017). The resulting composite water vapor record uses ChiWIS measurements for 15 of 28 experiments, and scaled SP-APicT measurements for the remaining 13 experiments.
Total water measurements are provided by APeT (AIDA PCI extractive TDL), an extractive, tunable diode laser instrument (Ebert et al., 2008). In previous comparisons of AIDA instruments (Skrotzki, 2012), APeT measurements were found to be delayed by 17 s with respect to open-path in situ TDLAS ones. As is standard practice, we take the chamber ice content to be the difference between total water and vapor-phase measurements. To take advantage of the high precision ChiWIS affords at temperatures below 205 K, we use the composite water vapor record described above to calculate ice mass. However, APeT total water measurements also require harmonization with ChiWIS. APeT and SP-APicT derive their measured concentrations from the same H2O spectral feature, and both instruments report values 1.5% below ChiWIS during ice free periods. We therefore scale up the APeT measurements by 1.5 % as well. After applying this time-invariant scaling factor, if there is still an offset between the water vapor record and APeT total water prior to the expansion (when there should be no ice cloud in the chamber), that offset is subtracted from the whole experiment. These offsets are most significant below 200 K where they are typically between +0.05 and +0.25 ppmv. Potential causes could include parasitic water absorption inside the instrument or outgassing from ice in the inlet of APeT (e.g., Buchholz and Ebert, 2014). See Supplement for details of instrument comparisons, and Table S3 for instrument offsets prior to pumping.
Ice particle concentrations are measured by the Welas 1 instrument. Ice particle number concentration is used to estimate the average radius of particles in the chamber and the average, per-particle growth rate. One component of this instrument's uncertainty comes from counting errors, which follow Poisson statistics and are proportional to . However, experiments included in this analysis have high ice particle densities and small counting errors. We therefore neglect the counting errors in this analysis. The conversion of this instrument's count rate into a number concentration has a 10 % uncertainty. In experiments where particles are very small, the Welas 1 instrument likely undercounts them since its efficiency drops sharply for particles below 0.7 µm in diameter (Wagner and Möhler, 2013). We address the steps taken to characterize this undercounting in the following sections.
We assume a single chamber temperature at each point in time, and construct a value from the average of four thermocouples suspended at different heights in the chamber. The fifth thermocouple is not included in the analysis to avoid the introduction of bias from a known warm region at the top of the chamber. These measurements have an apparent precision of 0.3 K during pumpdowns and 0.15 K during static conditions between pumpdowns (Möhler et al., 2003). A mixing fan at the bottom of the chamber is always operational and enhances the uniformity of the chamber, with a mixing time constant of about 1 min. Figure 1 shows the positions of the instruments used during IsoCloud in the AIDA chamber, as well as the locations of the thermocouples.
2.2 Experiments
IsoCloud expansion experiments were designed to nucleate, grow, and maintain cold cirrus clouds with the goal of testing for the presence of anomalous supersaturation under conditions similar to the coldest parts of the atmosphere. To be a suitable test for anomalous supersaturation, an expansion experiment must satisfy two basic criteria. First, its duration must be significantly longer than the vapor relaxation times associated with cirrus growth. Relaxation times depend on experimental conditions, and are longer in the cases where particle number densities are small and diffusion limitation is strong. Second, cirrus cloud growth must continue for long enough to allow for the retrieval of the saturation vapor pressure over ice. In practice, this means that the chamber's ice-covered walls must serve as a source of vapor from which the cirrus cloud can continue to grow throughout the experiment. The remainder of this section describes a typical expansion experiment, addresses the consequences of running experiments in the presence of wall ice, and discusses the criteria for exclusion from analysis.
In a typical IsoCloud experiment, ice clouds are formed by pumping on a chamber filled with water vapor near saturation. Adiabatic expansion causes rapid cooling, which in turn leads to nucleation of ice. Air is kept close to saturation before pumping by preparing the walls with a thin coating of ice. In practice, chamber water vapor pressures are 80 %–90 % of MK saturation before the expansions, which suggests that the wall ice is 0.5–2 K colder than the chamber air. Pumping and adiabatic expansion cool the chamber air below the wall temperature, and given the presence of ice nucleating particles, the now-supersaturated chamber air will nucleate an ice cloud. Ice growth then draws the chamber vapor pressure below the saturation vapor pressure at wall temperature, and the walls become an additional source of water for the growing cirrus cloud. The transfer of mass from the walls is often large enough that chamber total water is greater at the end of pumping than at the beginning, despite loss to the pumps. Once the pumps cease, the chamber warms and the cirrus cloud dissipates and part of its mass is transferred through the vapor back to the walls. The total amount of cooling in an experiment varies from 5 to 9 K, depending on pump speed, and occurs primarily during the first ∼100 s of pumping when the chamber air behaves nearly adiabatically. Subsequently, heat flux from the walls becomes large enough to balance the adiabatic cooling. Cooling rates during the early stages of pumpdowns are equivalent to effective atmospheric updraft speeds of several meters per second, much faster than those typically associated with cold cirrus in the natural atmosphere.
Of the 48 IsoCloud experiments in March of 2013, six were reference expansions, and four others lacked measurements of one of the physical quantities required for analysis. Of the remaining 38 experiments, this analysis uses 28 and excludes 10. We include all experiments conducted with standard protocol in which the ice cloud can be reasonably expected to approach saturation. Five experiments are excluded for overly long relaxation times, and five for non-standard protocol. See Tables S3 and S4 for characteristics of included and excluded experiments, respectively. We estimate vapor relaxation times for each point in each experiment using the expression of Korolev and Mazin (2003), which takes into account cooling rate (effective updraft speed), ice particle number, and particle size to estimate the timescale for achieving a dynamical equilibrium value (see Sect. S2.3 for expression). For each experiment, we determine τmin, the minimum relaxation time at any point during the experiment, and texp, the time interval over which the calculated relaxation time is within a factor of two of τmin. We consider that an experiment should reasonably approach dynamical equilibrium if .
The five non-standard experiments excluded are Experiment 1, which had an abnormally short pumping time, and Experiments 40–43, where the chamber was prepared with dry walls. Pumping in Experiment 1 lasted only 250 s, vs. 400–750 s in all other experiments; we would expect more inhomogeneities in the resulting ice cloud. Experiments with dry walls pose a problem for our analysis because the lack of an ice source means that these experiments do not involve extended periods of ice growth near saturation.

Figure 2Examples of experiments in which vapor is controlled by cirrus uptake (a–c) and wall flux (d–f). Experiment 16 (a-c) is a heterogeneous nucleation experiment onto ATD, and Experiment 30 (d–f) is a homogeneous nucleation experiment with SA aerosol. The top panels of each plot show the pressure (green) and temperature (red) evolution. The action of the chamber pumps results in a pseudo-adiabatic expansion that cools the chamber gas rapidly at first, then more slowly until the cooling is balanced by heat flux from the chamber walls. The chamber gas warms as soon as the pumps have stopped. The middle panels show Murphy–Koop (MK) saturation (red dashed line), measured saturation (black), ice particle number (light blue), and the cloud's ice water content (dark blue). Ice nucleation starts at the peak in saturation, and is followed by a sharp increase in particle number and rapid cloud growth. Saturation relaxes back to a constant value, where it stays until the pumps turn off. In the cirrus-dominated experiment, that value is the saturation vapor pressure over ice. In the wall flux-dominated experiment, that value of about 6 % supersaturation is what is required to drive enough ice growth to balance the wall outgassing. When the pumps stop, the vapor pressure returns to the wall-controlled value in the cirrus-controlled experiment, but in the wall flux-controlled experiment the decay rate is limited by wall uptake. The bottom panels show total water (green) and water vapor (black). The small data gap in Experiment 30 at around 1100 s is due to realignment of the chamber's White cell mirrors.
The 28 experiments used in this analysis still show a range of characteristics, and can be grouped into two broad categories. In “cirrus-dominated” experiments (see Fig. 2, left, for example), the wall flux is comparable to ice uptake driven simply by the change in saturation vapor pressure on cooling. In these experiments water vapor concentrations draw down quickly to saturation. In the colder experiments, however, wall flux is generally far more substantial. In these “wall-dominated” experiments (Fig. 2, right), peak total water rises to many times greater than initial water vapor, water vapor remains supersaturated during the growth phase of the experiment, and then becomes subsaturated during evaporation. This deviation complicates analysis and requires a growth model to determine saturation vapor pressure. For consistency, we treat all experiments the same, and extract saturation vapor pressure using the same method.
The two examples shown in Fig. 2 illustrate the key features of each type of experiment. In the cirrus-dominated experiment (Fig. 2, left), the onset of nucleation produces rapid ice growth and a corresponding drawdown of vapor pressure to a value close to saturation. The ice cloud then grows slowly for the remainder of the expansion experiment, with water provided by the ice-covered chamber walls. In this particular case, a heterogeneous nucleation experiment with abundant ice nucleating particles, ice nucleation occurs at a relatively low supersaturation, and the ice particle number reaches ∼400 cm−3 before decreasing nearly in proportion to the action of the pump. After the pumping stops, the ice cloud decays over a roughly 200 s period, and the chamber vapor pressure returns to the wall-controlled value.
In the wall-dominated experiment (Fig. 2, right), significant supersaturation with respect to MK persists throughout the experiment. In this particular case, initial supersaturation is quite high since the chamber was prepared with only sulfuric acid droplets to study homogeneous nucleation. The onset of nucleation again produces a drawdown of supersaturation, but only to a value of about 6 %, which remains fairly constant for the duration of pumping. This is the value required to drive the strong continuing ice growth that balances the wall flux. Once the expansion stops, the chamber air warms, the walls become a water sink rather than a source, and chamber vapor pressure drops to RHice∼95 %, the value required to drive enough evaporation to balance wall uptake. After the ice cloud has nearly dissipated, the chamber vapor pressure again returns to the wall-controlled value.
These chamber dynamics mean that saturation vapor pressure in IsoCloud experiments cannot be determined simply by measuring the water vapor content in the chamber after an ice cloud has developed. The colder the experiment, the more wall dominated it typically becomes, so that experiments show steadily increasing long-term supersaturations with respect to Murphy–Koop saturation (MK) as temperature decreases, rising by approximately 5 % over the temperature range 225–185 K (Fig. 3). This rise should not be interpreted as the result of a temperature-dependent saturation vapor pressure, but instead as a temperature-dependent balance between wall flux and diffusional ice growth. The wall flux contribution is relatively larger for colder experiments because saturation vapor pressure falls sharply with reduced temperature and the diffusional ice growth rate drops with vapor concentration. The result is that the colder the temperature, the larger the supersaturation over ice required to produce steady-state relative humidity. For this reason we use an ice growth model to retrieve saturation vapor pressure by modeling vapor pressure evolution during each experiment. The model, fitting procedure, and uncertainty analysis are described in Sect. 3.
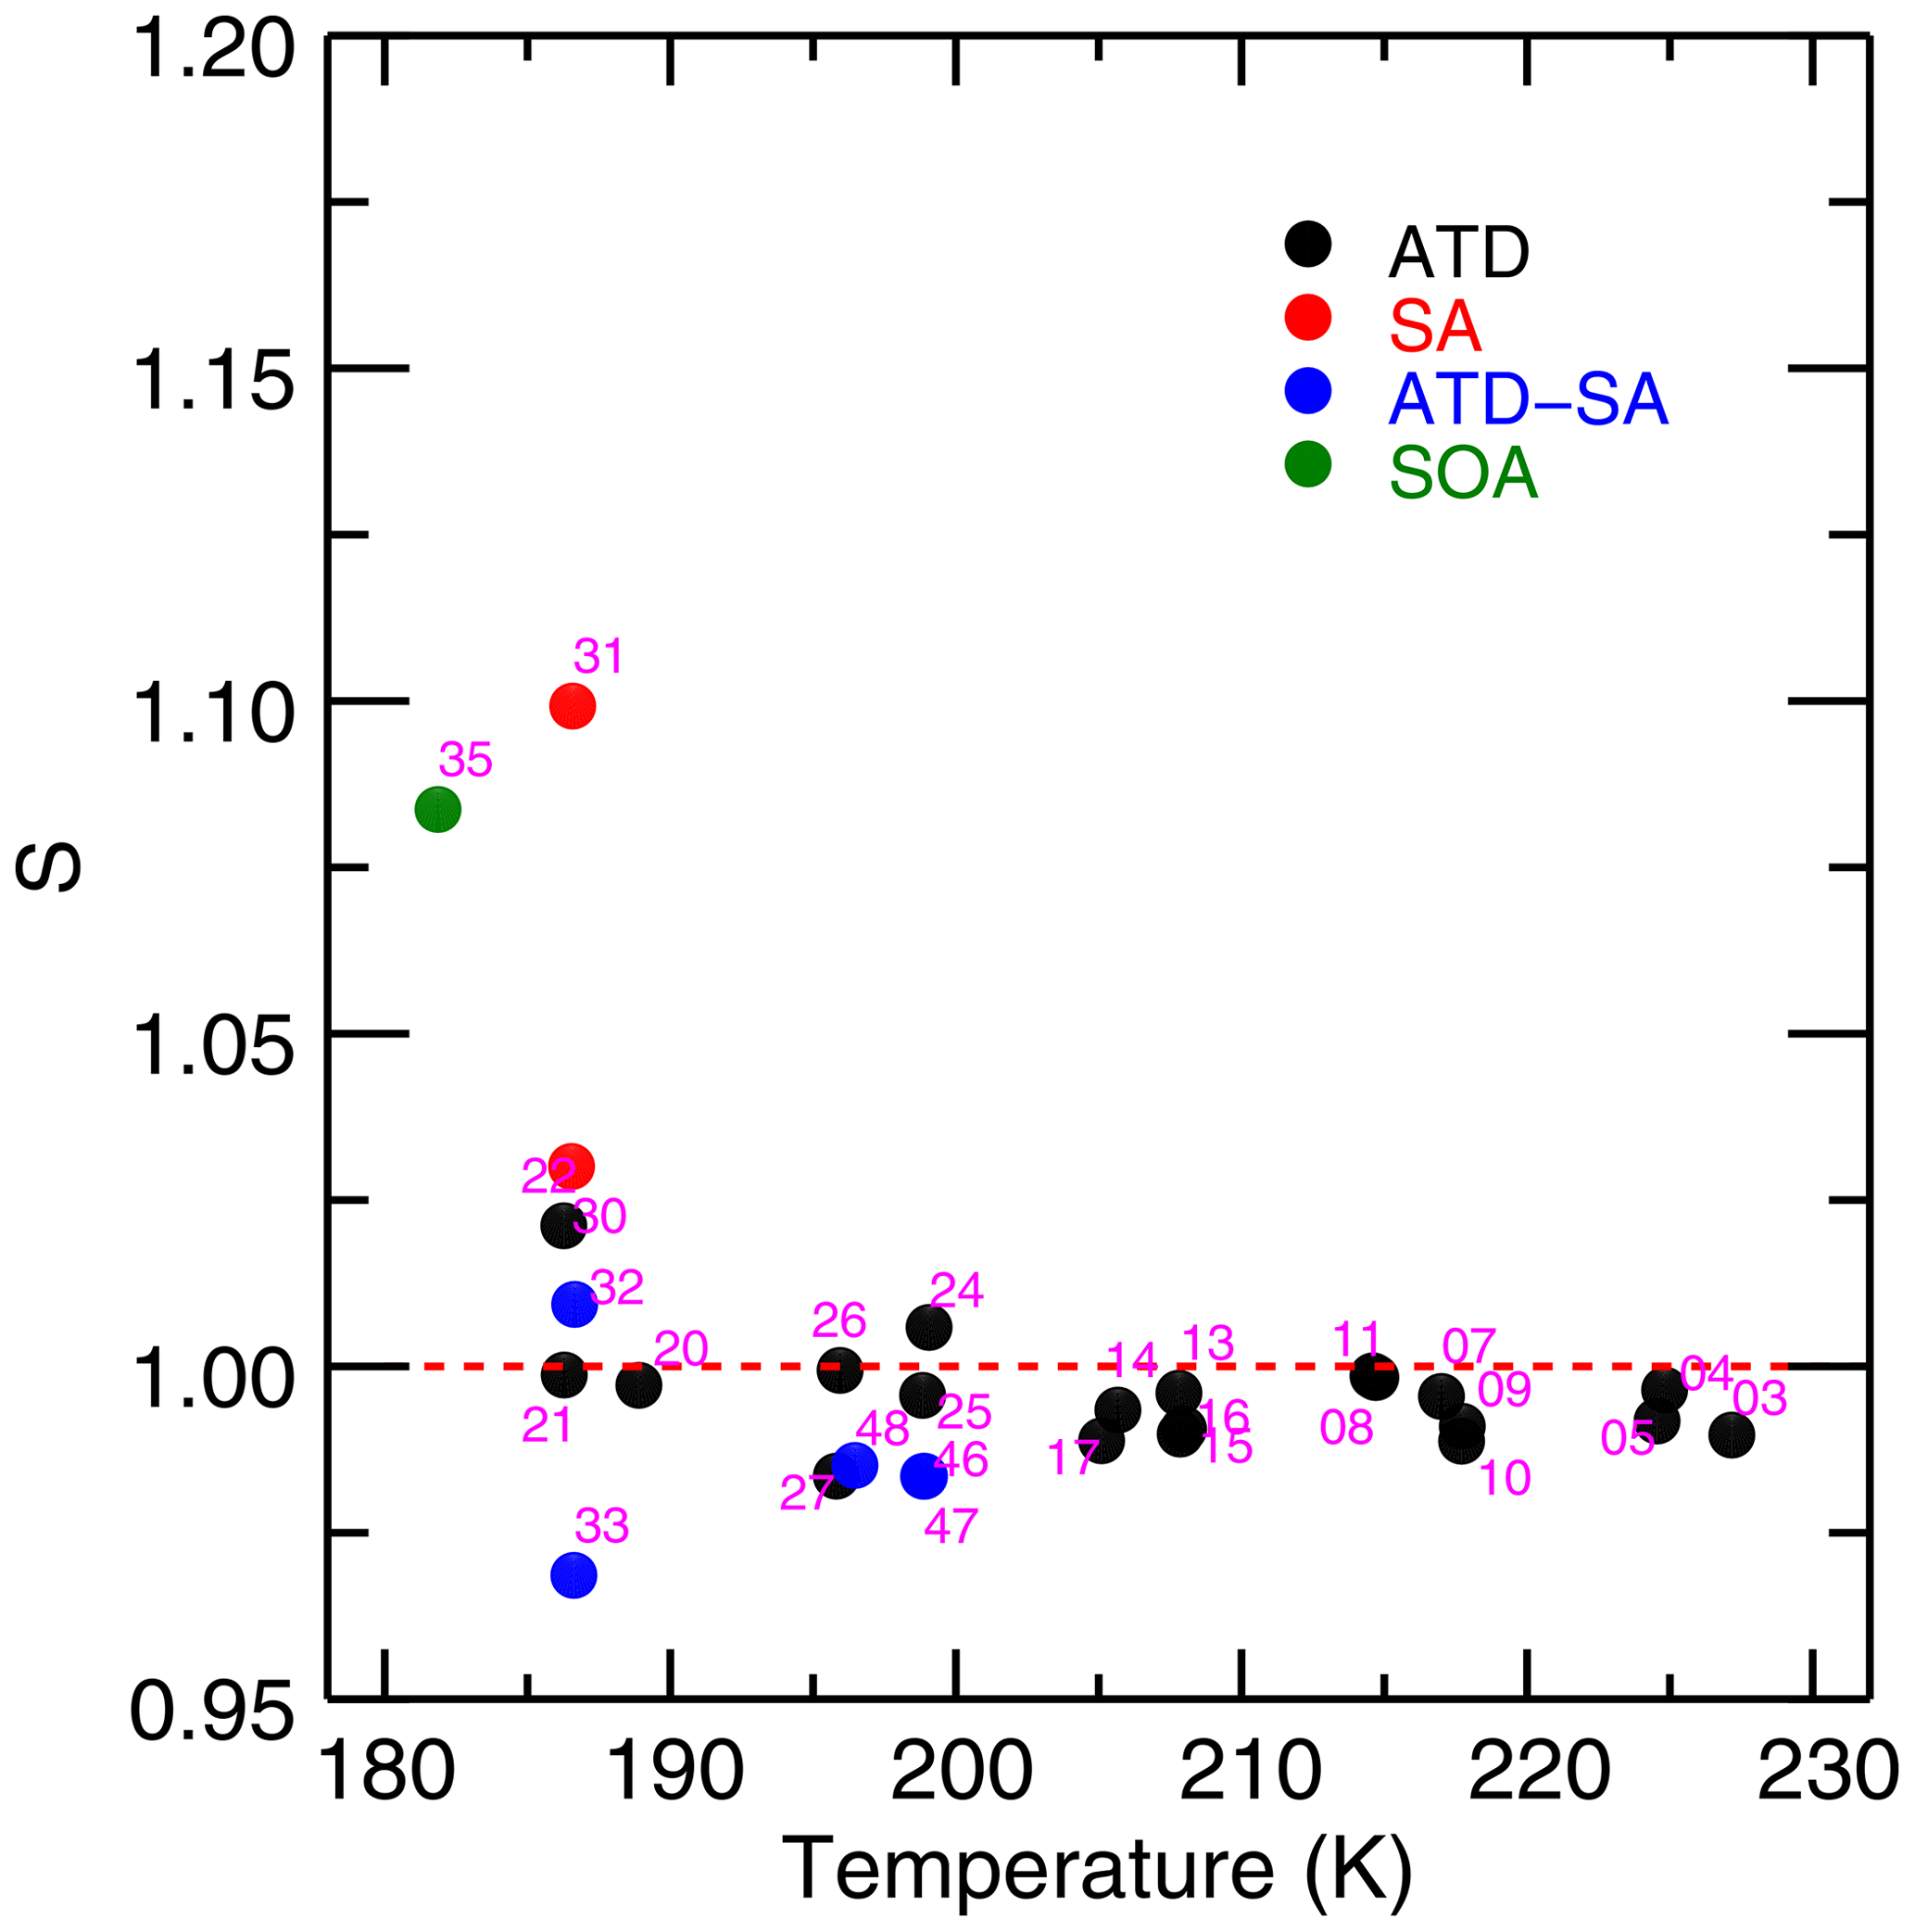
Figure 3Average measured saturation of the 28 IsoCloud experiments after relaxation back to a near-constant value. Supersaturations plotted are the average value of the final 200 s of pumping. Experiments are colored by aerosol/IN type: Arizona test dust (ATD, black), liquid sulfuric acid droplets (SA, red), secondary organic aerosol (SOA, green), and experiments containing both ATD and SA (blue). Warm, cirrus-dominated experiments (T≥195 K) typically show vapor pressures close to MK, with saturations from 0.98 to 1.00. Cold, wall-dominated experiments (below ∼195 K) show saturations that rise with decreasing temperature. Higher supersaturation is necessary for the cirrus growth rate to match the mass flux off the chamber walls. This effect means that an ice growth model is necessary to extract the saturation vapor pressure. Water vapor retrievals during the pumping interval in Experiment 33 are quite subsaturated with respect to MK.
We model the vapor pressure evolution during each experiment assuming diffusional growth to a sphere (Eq. 1). Model inputs are all measured or derived from measured quantities – ice mass, particle number, growth rate, pressure, and temperature – with saturation vapor pressure as the single free parameter. That is, we assume saturation vapor pressure over ice is esat=xei, where ei is the Murphy–Koop saturation vapor pressure (Murphy and Koop, 2005) and x is a constant scale factor separately fit for each experiment. The model predicts the evolving chamber vapor pressure, and we fit that prediction to the observed H2O vapor pressure, minimizing the difference between observed and calculated values.
3.1 Ice growth model
The model is obtained by rearranging an expression for the diffusional growth rate over ice (Pruppacher and Klett, 1997) to calculate the far-field water vapor pressure:
Measured and derived quantities here are , the per-particle growth rate (change in total ice mass/time/particle number); , the average particle radius; T∞, the gas temperature in the chamber; and we identify the far-field vapor pressure e as the measured vapor pressure. Parameters are Mw, the molar mass of water; Li, the latent heat of sublimation; , the diffusivity of water in air with kinetic corrections; α, the accommodation coefficient; and , the thermal accommodation coefficient, which is taken here to be unity (Fung and Tang, 1988). The average radius of the ice particles, , is calculated from the total ice water mass and particle number counts described previously, and a temperature-dependent ice density. The bulk density of ice varies by about 1 % between −10 and −100 ∘C; the values used in this work are from a quadratic fit to data from Eisenberg et al. (2005), which are based on the X-ray diffraction measurements of La Placa and Post (1960). We assume the particles are spherical, which is a reasonable approximation for small, micrometer-sized particles. The diffusivity of water vapor in air, , is also temperature dependent, and is evaluated using the functional form of Pruppacher and Klett (1997), which includes kinetic corrections (Okuyama and Zung, 1967; Fitzgerald, 1972). Note that one limitation of this method is that it can yield only a bulk value, and is not sensitive to situations in which a small subset of ice crystals are metastable.
3.2 Confounding issues and corrections
We apply sensitivity tests or corrections to three issues that might confound analysis: loss of ice crystals by pumping, uncertainty in the accommodation coefficient, and undercounting of particles. The issues are sufficiently unproblematic that they are not included in the formal uncertainty analysis of Sect. 3.5.
The pseudo-adiabatic expansion procedure during experiments results in a loss of ice mass as air is removed from the chamber. This loss must be accounted for in order to accurately estimate ice mass change by sublimation/deposition to/from the vapor. The pumps remove a constant volume of gas from the chamber in each time interval, and we assume that they act in the same manner upon the small ice particles found in our experiments. With this assumption, we correct the ice growth rate by subtracting the assumed pumping losses from the derivative of the cirrus ice mass.
The accommodation coefficient α in Eq. (1) is not well constrained, with significant variation in the literature. α can be thought of as the probability that a molecule of water vapor that strikes the surface of an ice particle is incorporated into the ice matrix, and can be sensitive to experimental conditions. For similar chamber experiments, studies have shown that the accommodation coefficient can be treated as a constant during an experiment (Lamb et al., 2020) with values close to 1 (Skrotzki et al., 2013; Lamb et al., 2020). We test the sensitivity of our vapor pressure model to uncertainty in the accommodation coefficient by running the model with different values of α, and find that the derived results for saturation vapor pressure are quite insensitive to the exact values of α in the range of 0.2 to 1 (Fig. S8 in the Supplement). We therefore use a value of 1 throughout this work, but note that if the true α value is below 0.2, then this assumption will result in an overestimate of the saturation vapor pressure.
Undercounting of particles may occur because the Welas 1 optical particle counter has a size cutoff for small particles of 0.7 µm in diameter. In these experiments, we never see evidence of very large particles, but very small particles are common at the beginnings and ends of experiments, immediately after nucleation or towards the end of sublimation, respectively. For some experiments at the coldest temperatures, where initial water vapor and final ice mass are small, we also expect undercounts throughout the experiment. Mean particle size in these experiments is strongly temperature dependent, ranging from ∼1 µm at 189 K to ∼5 µm at 235 K. Failure to account for undercounting would lead to an overly large average radius, and could produce a low bias in retrieved saturation vapor pressures.
We deal with the undercounts in two ways: we exclude all time periods in which the calculated average radius is less than 0.85 µm, and we conduct sensitivity tests on the resulting analyses. In several of the colder experiments, however, the mean calculated radius remains below 1 µm throughout the experiments. In these marginal cases assuming a log-normal distribution produces estimated undercounts of up to 50 % throughout the experiment (see Supplement for details of this calculation). We therefore conduct sensitivity analyses on all experiments of uncertainty due to potential undercounting by increasing ice particle counts by factors of 1.5, 2, and 5 (Fig. S9). Undercounting can result in underestimation of saturation vapor pressure, but most IsoCloud experiments show a sensitivity of less than ±0.5 % in retrieved saturation vapor pressure, even in the unrealistic case of undercounting by a factor of 5. Maximum sensitivity to undercounting occurs in the three homogeneous nucleation experiments, where particle sizes are smallest, but still remains under +2.5 % even in the most extreme case tested.
3.3 Ability to diagnose saturation vapor pressure
Before fitting our experimental data, we conduct a preliminary proof-of-concept exercise to evaluate whether the vapor pressure model is indeed sensitive to assumptions about saturation vapor pressure. We calculate evolution of the chamber vapor pressure during selected representative experiments under three different assumptions of saturation vapor pressure values: MK saturation, and MK multiplied by factors of 1.1 and 0.9. Comparing these calculations to the observed values, we see that even small changes in the assumed saturation vapor pressure result in significant deviations from the measured chamber water vapor in both cirrus-dominated and wall-dominated experiments (Fig. 4). Results suggest that experiments are sufficiently sensitive to resolve differences in saturation vapor pressure of a few percent. This test establishes that observations of chamber vapor pressure during ice growth can in fact constrain the saturation vapor pressure in all the IsoCloud experiments.
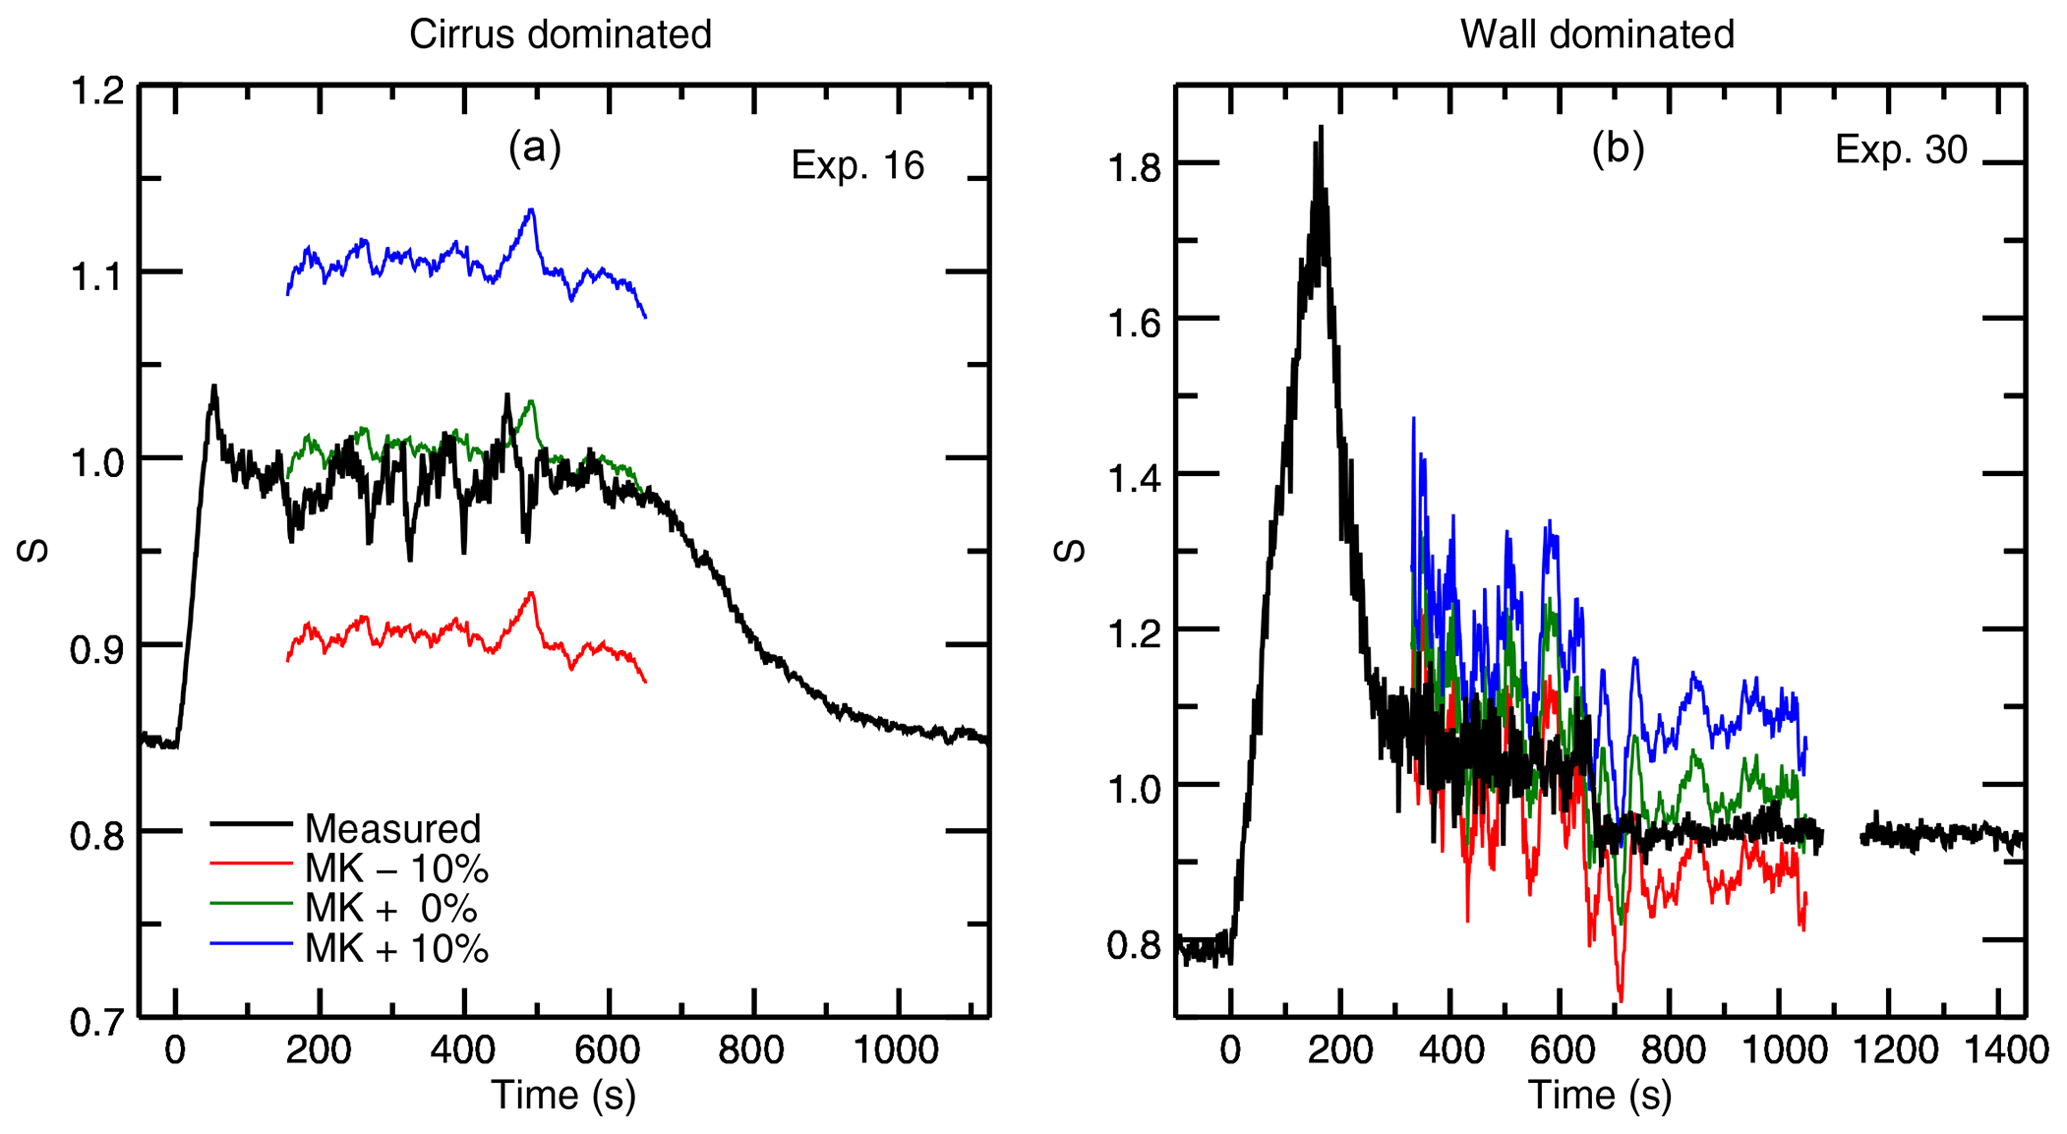
Figure 4Model output for experiments used in the previous example: the cirrus-dominated Experiment 16 (a) and wall-dominated Experiment 30 (b). Each output is calculated using observed quantities under three different assumptions about the “true” saturation vapor pressure of cirrus. The red line assumes the true value is 10 % lower than the MK saturation vapor pressure, the blue line assumes it is 10 % higher, and the green line assumes MK is the true saturation vapor pressure. Calculated saturations are smoothed by 30 points (∼30 s). Measured saturations are unsmoothed. Experiments are very sensitive to the assumed vapor pressure, although wall-controlled experiments are noisier overall since they are typically at lower temperatures. Experiment 16 shows spikes in measured water which are due to real sampling of different air masses during the turbulent period when the pumps are on and the cirrus cloud is growing. Experiment 30 shows oscillations in the model output due to in-mixing of warmer air from the top of the chamber. This type of temperature fluctuation is not captured by the model.
3.4 Fitting procedure and region choice
The model is fit to the observed chamber vapor pressure using least-squares optimization. We use MPFIT (Markwardt, 2009), a Levenberg–Marquardt least-squares minimization routine written in IDL, based on the MINPACK algorithm (Moré, 1978). This routine attempts to minimize the difference between the model and observation by varying the scaling factor x in Eq. (1), which multiplies the Murphy–Koop parametrization of the saturation vapor pressure over ice. The fit routine yields a single value of x for each experiment, which is multiplied by MK saturation to best fit the observations.
The fit region for each experiment is selected using three criteria. (1) The fit region must start after the maximum ice particle number count has been attained. In most experiments, the maximum particle count is achieved within about 50 s of the peak in saturation associated with the onset of nucleation. During the preceding brief period of rapid ice growth, significant particle undercounts are likely. (2) We exclude all time periods when the Welas 1 instrument reports fewer than 12 ice particles per cm3. This criterion typically excludes the late portions of experiments when the ice cloud has almost completely decayed. (3) We exclude all the time periods in which the average particle radius is less than 0.85 µm, as described in Sect. 3.2, again because particle undercounts are likely. This criterion becomes relevant for cold experiments, in which vapor pressures are low and particles grow slowly and remain small (in IsoCloud experiments at temperatures below 195 K, average particle radius remains under 1.5 µm at all times). These criteria result in an average fit region length of ∼700 s. The shortest fit region is 259 s (Experiment 9) and the longest fit region is 1647 s (Experiment 21). Colder experiments tend to have longer fit regions, since in these experiments the ice cloud can linger for tens of minutes after pumping has ceased.
3.5 Uncertainty analysis
We calculate error bars for each experiment that reflect uncertainties from several sources: intrinsic measurement precision for water vapor and other key observables, uncertainty due to experimental artifacts (e.g., chamber inhomogeneities that affect model fits), and systematic offsets (e.g., line strength errors that produce multiplicative errors in derived vapor pressures). We group the first two categories, measurement precision and chamber artifacts, under the term “instrumental uncertainty”.
Instrumental uncertainty for each experiment is calculated using the Monte Carlo method: for each experiment, we generate 2000 parameter sets in which each physical parameter used in the calculation is randomly drawn from its estimated distribution, and then we run the fit routine on each set. See Table S1 for the list of parameters varied and their assumed distributions. AIDA chamber temperature uncertainty of 0.3 K is included in this table as a random variable, although the temporal correlation of temperature errors is not well known. Resulting error bars may therefore be slightly underestimated. The resulting distribution of saturation vapor pressure values is nearly normal in each experiment, and we take its standard deviation to be the component of the error bar associated with instrumental uncertainty. Sarkozy et al. (2020) estimate that mechanical vibrations and chamber inhomogeneities result in optical path length fluctuations of about 0.1 %. Due to the rapid timescales of these fluctuations, their associated uncertainty is added directly into the instrumental uncertainty budget.
The primary source of systematic offsets is uncertainty in the spectroscopic parameters used to retrieve water vapor concentrations from the observed spectral features. All spectroscopic parameters are taken from the HITRAN 2016 database (Gordon et al., 2017), which provides uncertainty estimates for several parameters used in this analysis, namely line strength (S), air-broadened half-width (γair), and the temperature-dependence coefficient (nair) of γair. Line strength errors arise in two ways: through raw uncertainty of the measured line strength at the reference temperature of 296 K, and through uncertainty in the measured experimental gas temperature that propagates to uncertainty in the calculated temperature-dependent line strength. The ChiWIS instrument uses the H2O line at 3789.63481 cm−1, which has a stated 1σ uncertainties in S, γair, and nair of ±1 %, ±1 %, and ±10 %, respectively, in HITRAN 2016. Uncertainty in S propagates directly into a ±1% systematic uncertainty in retrieved concentrations. The uncertainties in γair and nair correspond to uncertainties in concentration retrieval of 0.5 % and 1.5 %, respectively, in the typical temperature and pressure range of the IsoCloud experiments. AIDA chamber temperature uncertainty is assumed to be randomly distributed, and contributes an additional line strength uncertainty of 0.1 % (note that typical temperature declines of 5–9 K during expansion experiments are automatically incorporated in the retrievals). Systematic errors due to uncertainty in spectroscopic parameters are added directly to the calculated error bars, and in all but the coldest experiments are the dominant source of uncertainty. A final contribution to systematic uncertainty comes from uncertainty in the length of the ChiWIS free space etalon, which propagates directly into the wavelength scale and contributes an estimated 0.2 % to all experiments.
Several other factors produce uncertainties on timescales of days or shorter and are treated here as contributing to the instrumental uncertainty budget. Uncertainty in White cell optical path length due to mechanical vibrations and chamber inhomogeneities occurs at rapid timescales and is estimated at 0.1 % (Sarkozy et al., 2020). Thermal expansion and contraction of the whole chamber over the experimental temperature range produces uncertainty of 0.1 % in the White cell path length and is day specific, since the chamber is run at a constant base temperature on each experimental day. Finally, the fit routine itself involves intrinsic uncertainty that is also likely day specific, since fits for each experimental day are typically done as a group and share typical temperature and water vapor concentrations. Sensitivity tests suggest that the choice of fit parameters (baseline, fit region, etc.) over a reasonable set of values may alter retrieved concentrations by about 1 %.
Because the final output of the analysis is the relationship of saturation vapor pressure to temperature x(T), we must consider a final source of uncertainty, that each experiment produces a single value for x but spans several degrees of cooling. We therefore construct horizontal error bars to acknowledge the spread in T, assigning them the standard deviation of chamber temperatures during the experimental fit period. These error bars are typically smaller in warmer experiments, since fit regions in that regime lie almost completely within the time interval when the wall heat flux balances the adiabatic cooling. Horizontal error bars are larger in colder experiments since the ice cloud often persists for some time after the pumps turn off and the chamber begins to warm back to its base temperature.
Results of fitting the IsoCloud experiments show a saturation vapor pressure consistent with MK, with no increase in retrieved saturation vapor pressures at low temperatures (Fig. 5). Murphy and Koop (2005) estimate the vapor pressure of cubic ice to be 3 %–11 % above that of hexagonal ice, and our measurements are consistent with the lowest postulated values for its vapor pressure. All experiments are inconsistent with the range of vapor pressures given for metastable ice by Shilling et al. (2006). Following the work of Tanaka (1998), which suggests that the entropies of cubic and hexagonal ices are nearly identical, we assume the same is true of ice Isd and extrapolate the measured values of Shilling et al. (2006) to temperatures higher than their measurement range of 181–191 K (Fig. 5, blue dashed curve). The properties of metastable ice I are likely dependent on its method of preparation, and it is thus possible that ice grown through deposition from the vapor may have a different vapor pressure than ice prepared by annealing amorphous ice, as is done by Shilling et al. (2006).
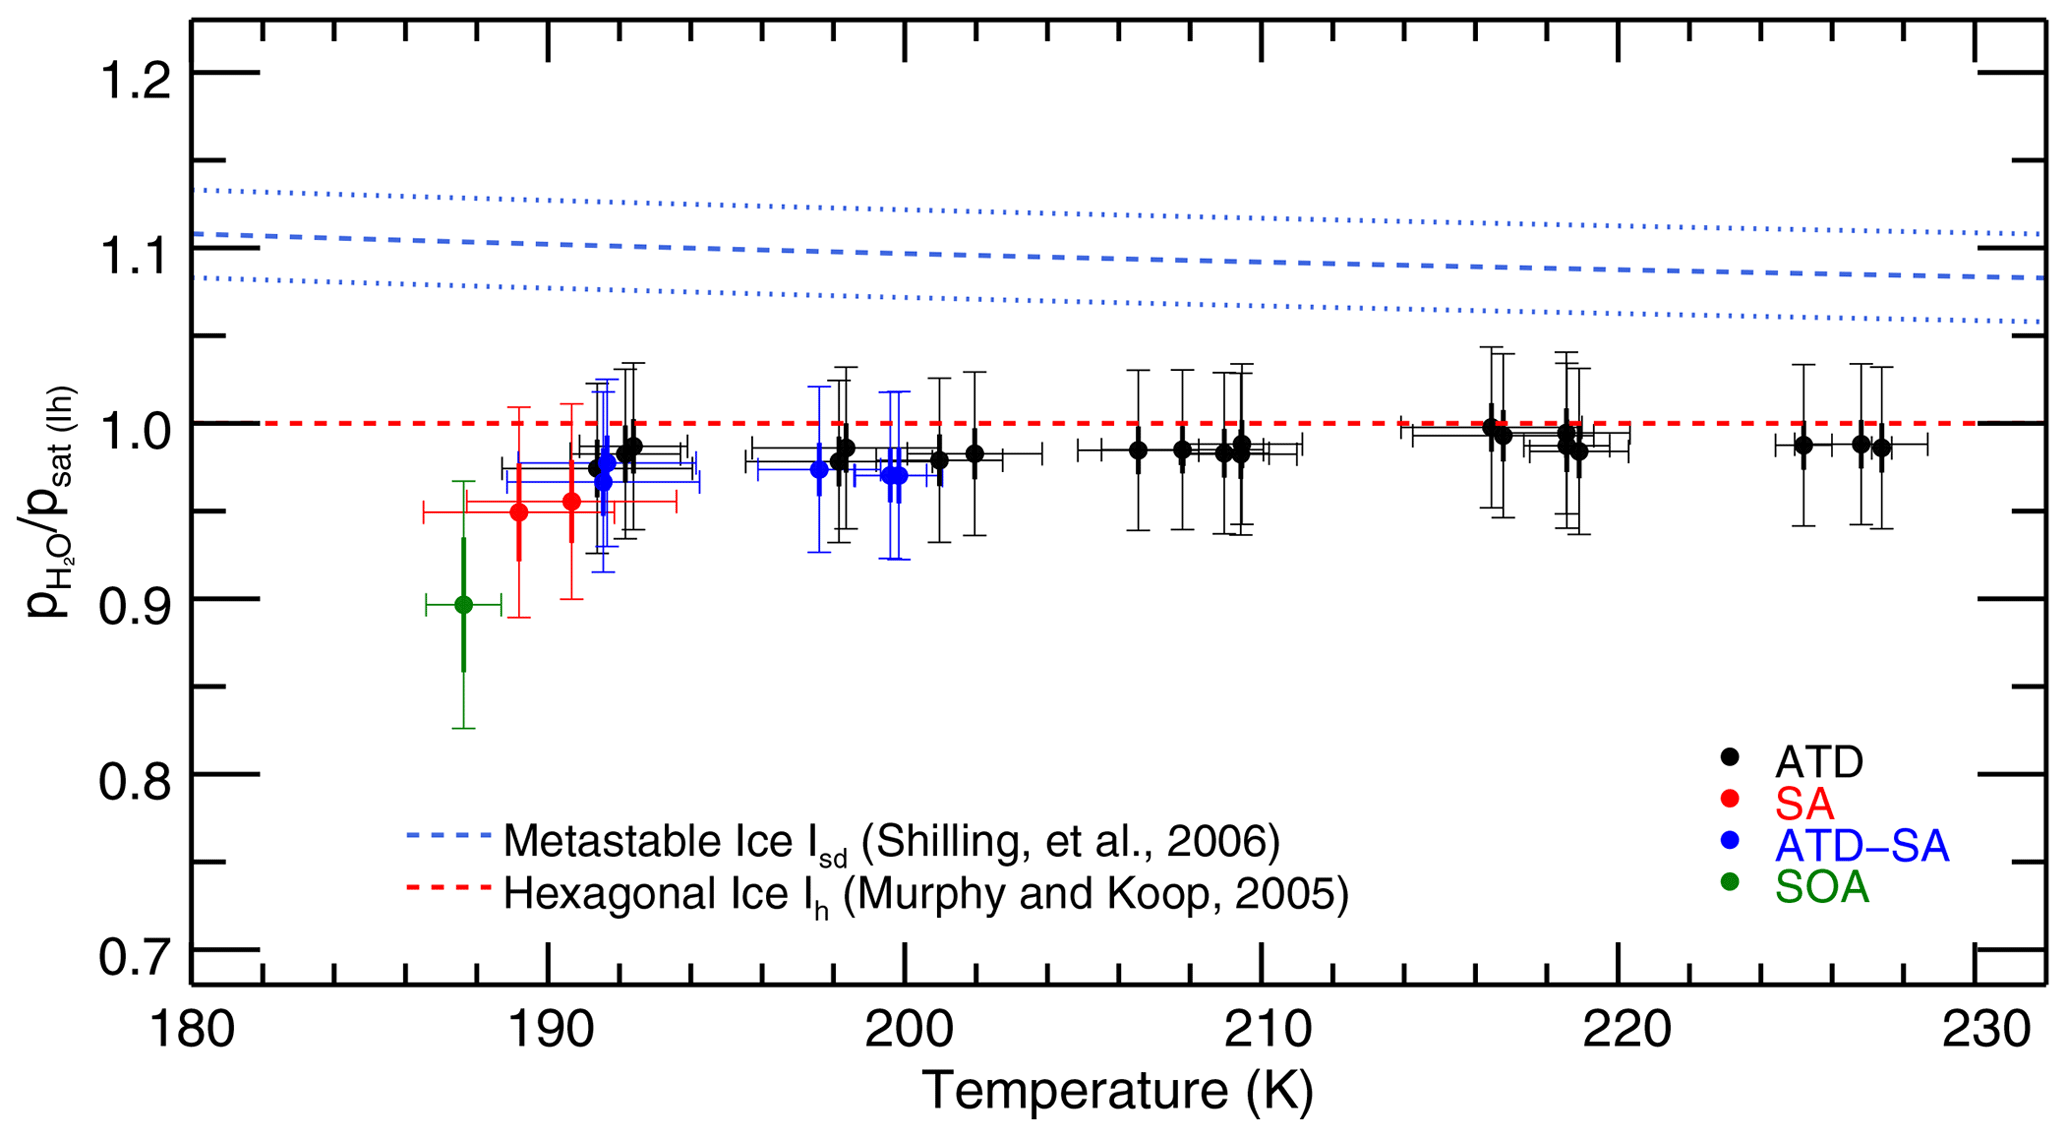
Figure 5Retrieved saturation vapor pressures for the 28 IsoCloud experiments fitted, expressed as a fraction of MK saturation, and plotted against mean experiment temperature. The red dashed line represents MK saturation. The blue dashed line represents the Shilling et al. (2006) value for the vapor pressure of metastable ice, and the blue dotted lines show the errors of that measurement. Experiments are colored by aerosol/IN type: Arizona test dust (ATD, black), liquid sulfuric acid droplets (SA, red), secondary organic aerosol (SOA, green), and experiments containing both ATD and SA (blue). All experiments that include solid dust (black, blue) undergo heterogeneous nucleation; those with SA or SOA only (red, green) undergo homogeneous nucleation. Horizontal error bars are the standard deviation of the temperatures over the fit region. Vertical error bars show both the 1σ instrumental uncertainty (thick width), which is greater at colder temperatures, and the larger systematic linestrength uncertainty (thin width), which is identical for all experiments. Derived saturation vapor pressures in general are consistent with MK (to within systematic uncertainty), and exhibit no trend with temperature for each aerosol type (to within instrumental uncertainty). Note that the fitting procedure means that Experiment 33, the outlier in Fig. 3, yields a saturation vapor pressure consistent with other experiments. Experiments do show lower values in the cases where liquid aerosols are present. Compare to Fig. A2 in Fahey et al. (2014).
Some differences are apparent between experiments with different ice nucleating particles, so we focus first on those with only solid particles (Arizona test dust, black points in Fig. 5). These experiments cover a temperature range from 235 to 193 K and have low 1σ instrumental uncertainty of less than +0.5 % (see Fig. S6, which shows model results labeled by experiment number and plotted with only instrumental uncertainties). They show no temperature-dependent effects that could explain anomalous supersaturations observed in field experiments. Derived saturation mixing ratios throughout the experimental temperature range are all consistent to within 2σ instrumental uncertainty (i.e., 1 % of MK).
To test more carefully for any trend in saturation vapor pressure with temperature, we also perform a total least-squares two-parameter fit on the ATD model results. Since we intend here to examine differences between different types of experiments, we only consider instrumental, day-, and experiment-specific uncertainties, and leave out the systematic uncertainties which are uniform across all experiments. This line-fitting method takes into account uncertainty in both variables (in our case, experimental temperatures and instrumental uncertainties) rather than ascribing uncertainty only to a dependent variable. The fit yields an intercept of 98.6 % ± 0.3 % of MK at the mean temperature of 209.3 K, and a slope of −0.027 % K % K−1. The experiments are consistent with MK to well within their % systematic uncertainty. The fitted trend with temperature is not significant, equivalent to a change over the 40∘ K IsoCloud range of 1.1 % ± 1.2 % of MK saturation.
The experiments performed at the highest temperatures in IsoCloud also demonstrate that the ice growth model used in this work does not introduce artifacts into the retrieved saturation vapor pressures. In these experiments (numbers 3–17, at T=205–235 K), ice particle number is high and ice cloud growth dominates, so the chamber vapor pressure should draw down quickly to saturation. The values to which these experiments relax (shown in Fig. 3) are effectively identical to those derived in our more complex analysis procedure: 98.0 %–100.0 % in the simple calculation of Fig. 3, and 97.5 %–99.5 % in the fits of Fig. 5. This similarity confirms that the use of an ice growth model does not bias the derived saturation vapor pressure values.
Experiments in which liquid aerosols are present result in derived saturation vapor pressures on average lower than those with only ATD, although only a single experiment is inconsistent given the instrumental uncertainty (Fig. 6, which shows experiments below 205 K and instrumental-only error bars). All experiments with sulfuric acid aerosols present show slightly lower vapor pressures than experiments with only solid ice nucleating particles (black). Heterogeneous nucleation experiments show a slight effect (blue) and homogeneous nucleation experiments with only liquid aerosols show a stronger one (red, green). ATD experiments are on average 1.4 % below MK; ATD-SA points are on average 2.7 % below; and the three homogeneous nucleation experiments are 4 %–10 % below MK (note that these experiments have large instrumental uncertainty, as they are cold and dry). Total least-squares fits to the ATD and ATD-SA experiments show that they are not significantly different from each other. The intercept at the ATD-SA mean temperature of 196.0 K is 97.3 % ± 0.8 %, which is lower than but overlaps with the expected ATD value at that temperature of 98.2 % ± 0.5 %. ATD-SA experiments show no significant temperature dependence in deviation from MK saturation vapor pressure (fitted slope = −0.03 % K % K−1).
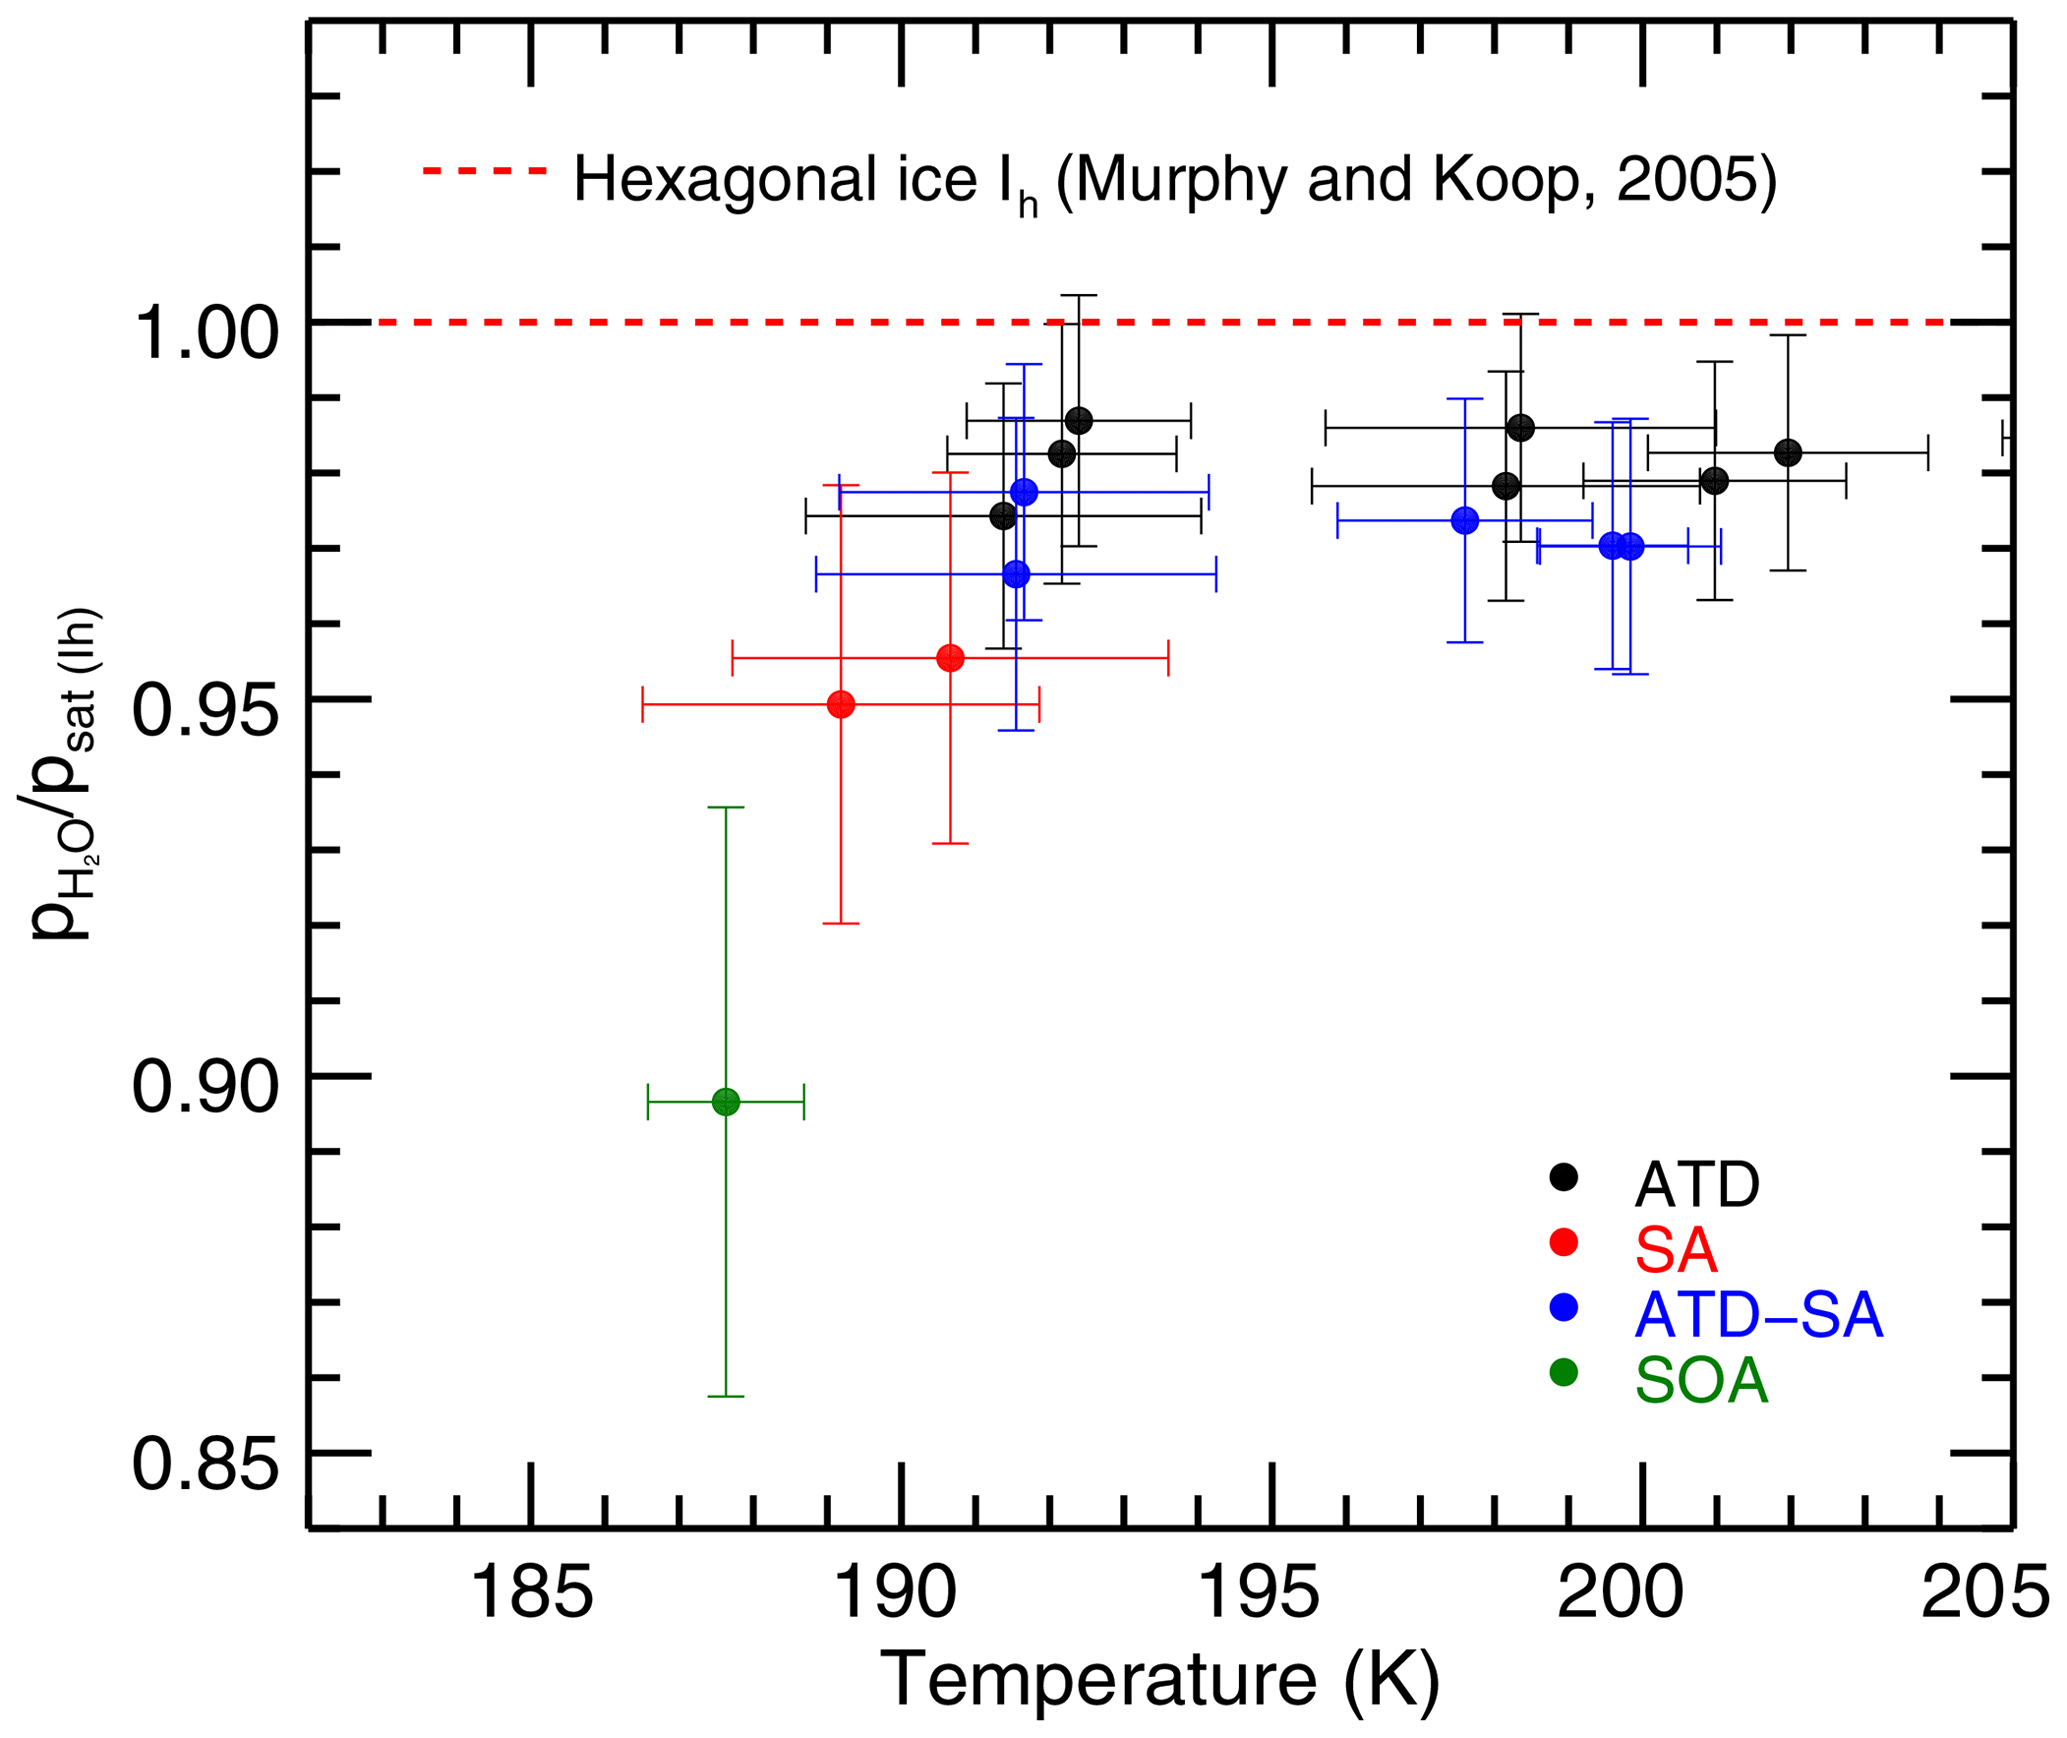
Figure 6Zoomed in view of the experiments below 205 K. Linestrength errors result in the same shift for all experiments, so they are not included in the error bars here. Experiments containing sulfuric acid are ∼2.6 % lower on average than those containing pure ATD experiments. Experiments are colored by aerosol/IN type and MK saturation line is included for reference.
One possible explanation is that liquid aerosols may introduce some additional factor that depresses the implied saturation vapor pressure in our analyses. These experiments take place at cold temperatures and are probably subject to undercounting, but the tests of sensitivity to ice particle number described in Sect. 3.2 suggest that undercounting cannot completely account for the observed differences. A more plausible mechanism may be water uptake by hygroscopic SA and SOA aerosols that remain unfrozen during the experiments. Such a population of aerosols would have a vapor pressure lower than that of ice. This effect would not be captured by the ice growth model, and would systematically lower retrieved saturation vapor pressures.
We see no evidence of anomalous supersaturation greater than ∼4.5 % in ultracold cirrus formation, which cannot account for the largest field observations. Our results show no temperature-dependent changes in retrieved saturation vapor pressure that could explain field observations. Those colder experiments that show anomalies show low rather than high saturation vapor pressures, which are likely artifacts resulting from the presence of liquid aerosols. For experiments with only solid ice nucleating particles, retrieved saturation vapor pressures are essentially identical throughout the 185–235 K experimental temperature range. Results are consistent with the MK parametrization throughout, with a mean value of MK −1.4 %, well within the ∼4.5 % systematic uncertainty. Scatter in experiments is small, and all experiments are inconsistent with the parametrization given by Shilling.
These results suggest that field measurements of anomalous supersaturation at low temperatures are most likely either the consequence of dynamical effects or of experimental error, or some combination of both. In heterogeneously nucleated cirrus with sparse nuclei, ice growth times may be so slow as to leave persistent observable supersaturation on the timescales of natural temperature fluctuations. For example, Jensen et al. (2013) report in situ observations during the ATTREX campaign of thin cirrus with low particle number densities (∼0.01 cm−3), supersaturations up to 70 %, and estimated relaxation timescales of hours or longer. Krämer et al. (2009) summarize 20 high-altitude aircraft flights and report frequent supersaturation in cirrus, but also low number densities (∼0.01 cm−3) and estimated relaxation timescales of hours to days1. The possibility that experimental error contributes to some observations of anomalous supersaturation cannot be entirely eliminated. Measurements of water vapor in the UT/LS are notoriously difficult due to the cold temperatures found there, and just 1 ppmv of contaminating H2O in an instrument (due to inlet icing or outgassing) could lead to an anomalous supersaturation signal of ∼25 % in a 190 K cold cirrus cloud at ∼17 km in the Tropical Tropopause Layer (TTL).
The IsoCloud experiments suggest that metastable forms of ice need not be considered in cloud models since they either do not form or do form but do not exhibit a vapor pressure significantly different from ice Ih. Many studies have suggested that metastable ice should nucleate and persist in cirrus at these temperatures. While Hudait and Molinero (2016) suggest from modeling studies that vapor-deposited ice should be hexagonal above 200 K, their work leaves open the possibility that metastable ice could form at colder temperatures. The experiments discussed here imply that if metastable ice does form, it must be free of the defects and imperfections that are assumed to result in higher vapor pressures than hexagonal ice Ih (Hudait et al., 2016; Lupi et al., 2017). The experiments shown here place strong constraints on ice formation in the atmosphere, because the rapid cooling times in IsoCloud should be maximally favorable to creating these defects, and the short experimental timescales mean that we should detect its effects before any annealing to hexagonal ice. These results suggest that even if metastable ice does form in the UT/LS region, its effect on vapor pressure and on transfer of water to the stratosphere would be small, less than ∼4.5 %.
Although these results suggest that ice Isd cannot induce anomalous supersaturation in the UT/LS, ice Isd may nevertheless be of climatic importance if its radiative properties differ from those of hexagonal ice. Preliminary findings by Murray et al. (2015) suggest that trigonal crystals, which are associated with ice Isd, have a lower absorption efficiency than hexagonal ones, and that for column crystals in particular over a broad range of sizes, trigonal column crystals have a significantly larger single-scattering albedo than do scalene column crystals or hexagonal column crystals. Since saturation vapor pressure seems not to provide an indication of the presence of ice Isd, further experiments would be needed to determine the conditions under which ice Isd may nucleate and grow under deposition in the ultracold regions of the UT/LS. High time-resolution diffraction measurements paired with observations of atmospherically relevant observables like water vapor pressure and crystal habit offer one possible method of probing the presence of ice Isd. Moreover, the type of ice that first nucleates may influence crystal habit even if subsequent deposition is of purely hexagonal ice (Furukawa, 1982). Exploring the conditions in which ice Isd and metastable ices can form in real atmospheric conditions may then also be important for understanding their radiative importance and possible future changes.
The IsoCloud data sets can be found at https://doi.org/10.6082/uchicago.2132 (Clouser, 2020).
The supplement related to this article is available online at: https://doi.org/10.5194/acp-20-1089-2020-supplement.
BWC and EJM led the data analysis; EJM directed the construction and operation of ChiWIS; LCS led the design of ChiWIS; KDL, BWC, and LCS built and operated ChiWIS; KDL, BWC, LCS, and AN analyzed raw ChiWIS data to produce water vapor measurements; HS provided and operated multipass optics; HS and OM operated AIDA during the IsoCloud campaign; HS and OM provided and interpreted AIDA instrument data; VE provided SP-APicT and APeT data; and BWC and EJM wrote the paper.
The authors declare that they have no conflict of interest.
The authors acknowledge the many individuals who contributed to the IsoCloud project, including Stephanie Aho, Naruki Hiranuma, Erik Kerstel, Benjamin Kühnreich, Janek Landsberg, Eric Stutz, and Steven Wagner, as well as the AIDA technical staff and support team who made this work possible. Eric Jensen, Martina Krämer, and Andrew Gettelman provided helpful discussions and comments. The authors thank the two anonymous referees for their useful comments. Kara D. Lamb acknowledges support from a National Defense Science and Engineering Graduate Fellowship and an NSF Graduate Research Fellowship and Laszlo C. Sarkozy acknowledges support from a Camille and Henry Dreyfus Postdoctoral Fellowship in Environmental Chemistry.
This research has been supported by the National Science Foundation (grant no. CHEM1026830) and the Deutsche Forschungsgemeinschaft (grant nos. MO 668/3-1 and EB 235/4-1). This work was supported by the National Science Foundation (NSF) and the Deutsche Forschungsgemeinschaft (DFG) through the International Collaboration in Chemistry program (NSF grant #CHEM1026830 and DFG grants MO 668/3-1 and EB 235/4-1) and by the NSF through the Partnerships in International Research and Education program (grant #OISE-1743753).
This paper was edited by Hang Su and reviewed by two anonymous referees.
Amaya, A. J., Pathak, H., Modak, V. P., Laksmono, H., Loh, N. D., Sellberg, J. A., Sierra, R. G., McQueen, T. A., Hayes, M. J., Williams, G. J., Messerschmidt, M., Boutet, S., Bogan, M. J., Nilsson, A., Stan, C. A., and Wyslouzil, B. E.: How Cubic Can Ice Be?, J. Phys. Chem. Lett., 8, 3216–3222, https://doi.org/10.1021/acs.jpclett.7b01142, 2017. a
Bogdan, A. and Molina, M. J.: Aqueous Aerosol May Build Up an Elevated Upper Tropospheric Ice Supersaturation and Form Mixed-Phase Particles after Freezing, J. Phys. Chem. A, 114, 2821–2829, https://doi.org/10.1021/jp9086656, 2010. a
Brewer, A. W.: Evidence for a world circulation provided by the measurements of helium and water vapour distribution in the stratosphere, Q. J. Roy. Meteorol. Soc., 75, 351–363, https://doi.org/10.1002/qj.49707532603, 1949. a
Buchholz, B. and Ebert, V.: Offsets in fiber-coupled diode laser hygrometers caused by parasitic absorption effects and their prevention, Meas. Sci. Technol., 25, 075501, https://doi.org/10.1088/0957-0233/25/7/075501, 2014. a
Clouser, B.: ChiWIS H2O data from the IsoCloud4 Campaign, https://doi.org/10.6082/uchicago.2132, 2020. a
Cziczo, D. J., DeMott, P. J., Brooks, S. D., Prenni, A. J., Thomson, D. S., Baumgardner, D., Wilson, J. C., Kreidenweis, S. M., and Murphy, D. M.: Observations of organic species and atmospheric ice formation, Geophys. Res. Lett., 31, L12116, https://doi.org/10.1029/2004GL019822, 2004a. a
Cziczo, D. J., Murphy, D. M., Hudson, P. K., and Thomson, D. S.: Single particle measurements of the chemical composition of cirrus ice residue during CRYSTAL-FACE, J. Geophys. Res.-Atmos., 109, D04201, https://doi.org/10.1029/2003JD004032, 2004b. a
Ebert, V., Lauer, C., Saathoff, H., Hunsmann, S., and Wagner, S.: Simultaneous, absolute gas-phase and total water detection during cloud formation studies in the AIDA chamber using a dual 1.37 µm TDL-Spectrometer, Geophys. Res. Abstr., 10, 1–2, 2008. a
Eisenberg, D., Kauzmann, W., and Kauzmann, W.: The structure and properties of water, Oxford University Press on Demand, Oxford, 2005. a
Fahey, D. W., Gao, R.-S., Möhler, O., Saathoff, H., Schiller, C., Ebert, V., Krämer, M., Peter, T., Amarouche, N., Avallone, L. M., Bauer, R., Bozóki, Z., Christensen, L. E., Davis, S. M., Durry, G., Dyroff, C., Herman, R. L., Hunsmann, S., Khaykin, S., Mackrodt, P., Meyer, J., Smith, J. B., Spelten, N., Troy, R. F., Vömel, H., Wagner, S., and Wienhold, F. G.: The AquaVIT-1 intercomparison of atmospheric water vapor measurement techniques, Atmos. Meas. Tech., 7, 3177–3213, https://doi.org/10.5194/amt-7-3177-2014, 2014. a, b, c, d
Fitzgerald, J. W.: On the computation of steady-state supersaturations in thermal diffusion chambers, J. Atmos. Sci., 29, 779–781, 1972. a
Forster, P. M. D. F. and Shine, K. P.: Stratospheric water vapour changes as a possible contributor to observed stratospheric cooling, Geophys. Res. Lett., 26, 3309–3312, https://doi.org/10.1029/1999GL010487, 1999. a
Fujiwara, M., Vömel, H., Hasebe, F., Shiotani, M., Ogino, S.-Y., Iwasaki, S., Nishi, N., Shibata, T., Shimizu, K., Nishimoto, E., Valverde Canossa, J. M., Selkirk, H. B., and Oltmans, S. J.: Seasonal to decadal variations of water vapor in the tropical lower stratosphere observed with balloon-borne cryogenic frost point hygrometers, J. Geophys. Res.-Atmos., 115, D18304.1–D18304.15, https://doi.org/10.1029/2010JD014179, 2010. a
Fung, K. H. and Tang, I. N.: Thermal-accommodation measurement of helium on a suspended water droplet, Phys. Rev. A, 37, 2557–2561, https://doi.org/10.1103/PhysRevA.37.2557, 1988. a
Furukawa, Y.: Structures and formation mechanisms of snow polycrystals, J. Meteorol. Soc. Jpn. Ser. II, 60, 535–547, https://doi.org/10.2151/jmsj1965.60.1_535, 1982. a
Gao, R. S., Popp, P. J., Fahey, D. W., Marcy, T. P., Herman, R. L., Weinstock, E. M., Baumgardner, D. G., Garrett, T. J., Rosenlof, K. H., Thompson, T. L., Bui, P. T., Ridley, B. A., Wofsy, S. C., Toon, O. B., Tolbert, M. A., Kärcher, B., Peter, T., Hudson, P. K., Weinheimer, A. J., and Heymsfield, A. J.: Evidence That Nitric Acid Increases Relative Humidity in Low-Temperature Cirrus Clouds, Science, 303, 516–520, https://doi.org/10.1126/science.1091255, 2004. a, b
Gao, R.-S., Gierczak, T., Thornberry, T. D., Rollins, A. W., Burkholder, J. B., Telg, H., Voigt, C., Peter, T., and Fahey, D. W.: Persistent Water–Nitric Acid Condensate with Saturation Water Vapor Pressure Greater than That of Hexagonal Ice, J. Phys. Chem. A, 120, 1431–1440, https://doi.org/10.1021/acs.jpca.5b06357, 2016. a
Gettelman, A. and Kinnison, D. E.: The global impact of supersaturation in a coupled chemistry-climate model, Atmos. Chem. Phys., 7, 1629–1643, https://doi.org/10.5194/acp-7-1629-2007, 2007. a
Gordon, I. E., Rothman, L. S., Hill, C., Kochanov, R. V., Tan, Y., Bernath, P. F., Birk, M., Boudon, V., Campargue, A., Chance, K. V., Drouin, B. J., Flaud, J.-M., Gamache, R. R., Hodges, J. T., Jacquemart, D., Perevalov, V. I., Perrin, A., Shine, K. P., Smith, M.-A. H., Tennyson, J., Toon, G. C., Tran, H., Tyuterev, V. G., Barbe, A., Császár, A. G., Devi, V. M., Furtenbacher, T., Harrison, J. J., Hartmann, J.-M., Jolly, A., Johnson, T. J., Karman, T., Kleiner, I., Kyuberis, A. A., Loos, J., Lyulin, O. M., Massie, S. T., Mikhailenko, S. N., Moazzen-Ahmadi, N., Müller, H. S. P., Naumenko, O. V., Nikitin, A. V., Polyansky, O. L., Rey, M., Rotger, M., Sharpe, S. W., Sung, K., Starikova, E., Tashkun, S. A., Vander Auwera, J., Wagner, G., Wilzewski, J., Wcisło, P., Yu, S., and Zak, E. J.: The HITRAN2016 Molecular Spectroscopic Database, J. Quant. Spectrosc. Ra., 203, 3–69, https://doi.org/10.1016/J.JQSRT.2017.06.038, 2017. a, b
Hallett, J., Arnott, W. P., Bailey, M. P., and Hallett, J. T.: Ice Crystals in Cirrus, in: Cirrus, chap. 3, edited by: Lynch, K. D., Sassen, K., Starr, D. O. C., and Stephens, G., Oxford University Press, Inc., New York, 41–77, 2002. a
Hansen, T. C., Koza, M. M., and Kuhs, W. F.: Formation and annealing of cubic ice: I. Modelling of stacking faults, J. Phys.: Condens. Matt., 20, 285104, https://doi.org/10.1088/0953-8984/20/28/285104, 2008. a
Heymsfield, A. J.: Ice Particles Observed in a Cirriform Cloud at −83 ∘C and Implications for Polar Stratospheric Clouds, J. Atmos. Sci., 43, 851–855, https://doi.org/10.1175/1520-0469(1986)043<0851:IPOIAC>2.0.CO;2, 1986. a, b
Hobbs, P.: Ice Physics, Clarendon Press, Oxford, 1974. a
Hudait, A. and Molinero, V.: What Determines the Ice Polymorph in Clouds?, J. Am. Chem. Soc., 138, 8958–8967, https://doi.org/10.1021/jacs.6b05227, 2016. a, b
Hudait, A., Qiu, S., Lupi, L., and Molinero, V.: Free energy contributions and structural characterization of stacking disordered ices, Phys. Chem. Chem. Phys., 18, 9544–9553, https://doi.org/10.1039/C6CP00915H, 2016. a, b
Inai, Y., Shibata, T., Fujiwara, M., Hasebe, F., and Vömel, H.: High supersaturation inside cirrus in well-developed tropical tropopause layer over Indonesia, Geophys. Res. Lett., 39, L20811, https://doi.org/10.1029/2012GL053638, 2012. a
Jensen, E. J., Diskin, G., Lawson, R. P., Lance, S., Bui, T. P., Hlavka, D., McGill, M., Pfister, L., Toon, O. B., and Gao, R.: Ice nucleation and dehydration in the Tropical Tropopause Layer, P. Natl. Acad. Sci. USA, 110, 2041–2046, https://doi.org/10.1073/pnas.1217104110, 2013. a, b
Kärcher, B. and Haag, W.: Factors controlling upper tropospheric relative humidity, Ann. Geophys., 22, 705–715, https://doi.org/10.5194/angeo-22-705-2004, 2004. a
Korolev, A. V. and Mazin, I. P.: Supersaturation of Water Vapor in Clouds, J. Atmos. Sci., 60, 2957–2974, https://doi.org/10.1175/1520-0469(2003)060<2957:SOWVIC>2.0.CO;2, 2003. a
Krämer, M., Schiller, C., Afchine, A., Bauer, R., Gensch, I., Mangold, A., Schlicht, S., Spelten, N., Sitnikov, N., Borrmann, S., de Reus, M., and Spichtinger, P.: Ice supersaturations and cirrus cloud crystal numbers, Atmos. Chem. Phys., 9, 3505–3522, https://doi.org/10.5194/acp-9-3505-2009, 2009. a, b, c
Kuhs, W. F., Sippel, C., Falenty, A., and Hansen, T. C.: Extent and relevance of stacking disorder in “ice Ic”, P. Natl. Acad. Sci. USA, 109, 21259–21264, 2012. a, b
Lamb, K. D., Clouser, B. W., Bolot, M., Sarkozy, L., Ebert, V., Saathoff, H., Möhler, O., and Moyer, E. J.: Laboratory measurements of HDO∕H2O isotopic fractionation during ice deposition in simulated cirrus clouds, P. Natl. Acad. Sci. USA, 114, 5612–5617, 2017. a, b, c
Lamb, K. D., Harrington, J. Y., Clouser, B. W., Sarkozy, L. C., Ebert, V., Möhler, O., Saathoff, H., and Moyer, E. J.: Do surface kinetics play a role in depositional ice growth rates in cold cirrus clouds?, in preparation, 2020. a, b
La Placa, S. J. and Post, B.: Thermal expansion of ice, Acta Crystallogr., 13, 503–505, https://doi.org/10.1107/S0365110X60001205, 1960. a
Lawson, R. P., Pilson, B., Baker, B., Mo, Q., Jensen, E., Pfister, L., and Bui, P.: Aircraft measurements of microphysical properties of subvisible cirrus in the tropical tropopause layer, Atmos. Chem. Phys., 8, 1609–1620, https://doi.org/10.5194/acp-8-1609-2008, 2008. a
Lupi, L., Hudait, A., Peters, B., Grünwald, M., Mullen, R. G., Nguyen, A. H., and Molinero, V.: Role of stacking disorder in ice nucleation, Nature, 551, 218–222, 2017. a, b
Malkin, T. L., Murray, B. J., Brukhno, A. V., Anwar, J., and Salzmann, C. G.: Structure of ice crystallized from supercooled water, P. Natl. Acad. Sci. USA, 109, 1041–1045, 2012. a, b
Malkin, T. L., Murray, B. J., Salzmann, C. G., Molinero, V., Pickering, S. J., and Whale, T. F.: Stacking disorder in ice I, Phys. Chem. Chem. Phys., 17, 60–76, https://doi.org/10.1039/C4CP02893G, 2015. a, b
Markwardt, C. B.: Non-linear Least-squares Fitting in IDL with MPFIT, in: Astronomical Data Analysis Software and Systems XVIII ASP Conference Series, Vol. 411, proceedings of the conference held 2–5 November 2008 at Hotel Loews Le Concorde, Québec City, QC, Canada, edited by: Bohlender, D. A., Durand, D., and Dowler, P., Astronomical Society of the Pacific, San Francisco, p. 251, 2009. a
Mayer, E. and Hallbrucker, A.: Cubic ice from liquid water, Nature, 325, 601–602, 1987. a
Möhler, O., Stetzer, O., Schaefers, S., Linke, C., Schnaiter, M., Tiede, R., Saathoff, H., Krämer, M., Mangold, A., Budz, P., Zink, P., Schreiner, J., Mauersberger, K., Haag, W., Kärcher, B., and Schurath, U.: Experimental investigation of homogeneous freezing of sulphuric acid particles in the aerosol chamber AIDA, Atmos. Chem. Phys., 3, 211–223, https://doi.org/10.5194/acp-3-211-2003, 2003. a
Moore, E. B. and Molinero, V.: Is it cubic? Ice crystallization from deeply supercooled water, Phys. Chem. Chem. Phys., 13, 20008–20016, 2011. a
Moré, J. J.: The Levenberg–Marquardt algorithm: Implementation and theory, in: Numerical Analysis, edited by: Watson, G. A., Springer, Berlin, Heidelberg, 105–116, 1978. a
Murphy, D. M.: Dehydration in cold clouds is enhanced by a transition from cubic to hexagonal ice, Geophys. Res. Lett., 30, 2230, https://doi.org/10.1029/2003GL018566, 2003. a
Murphy, D. M. and Koop, T.: Review of the vapour pressures of ice and supercooled water for atmospheric applications, Q. J. Roy. Meteorol. Soc., 131, 1539–1565, https://doi.org/10.1256/qj.04.94, 2005. a, b, c
Murray, B. J.: Inhibition of ice crystallisation in highly viscous aqueous organic acid droplets, Atmos. Chem. Phys., 8, 5423–5433, https://doi.org/10.5194/acp-8-5423-2008, 2008a. a
Murray, B. J.: Enhanced formation of cubic ice in aqueous organic acid droplets, Environ. Res. Lett., 3, 025008, https://doi.org/10.1088/1748-9326/3/2/025008, 2008b. a
Murray, B. J. and Bertram, A. K.: Formation and stability of cubic ice in water droplets, Phys. Chem. Chem. Phys., 8, 186–192, 2006. a, b
Murray, B. J., Knopt, D. A., and Bertram, A. K.: The formation of cubic ice under conditions relevant to Earth's atmosphere, Nature, 434, 202–205, 2005. a, b
Murray, B. J., Wilson, T. W., Dobbie, S., Cui, Z., Al-Jumur, S. M., Möhler, O., Schnaiter, M., Wagner, R., Benz, S., Niemand, M., Saathoff, H., Ebert, V., Wagner, S., and Kärcher, B.: Heterogeneous nucleation of ice particles on glassy aerosols under cirrus conditions, Nat. Geosci., 3, 233–237, 2010. a
Murray, B. J., Salzmann, C. G., Heymsfield, A. J., Dobbie, S., Neely, R. R., and Cox, C. J.: Trigonal Ice Crystals in Earth's Atmosphere, B. Am. Meteorol. Soc., 96, 1519–1531, https://doi.org/10.1175/BAMS-D-13-00128.1, 2015. a, b, c, d
Nachbar, M., Duft, D., and Leisner, T.: The vapor pressure over nano-crystalline ice, Atmos. Chem. Phys., 18, 3419–3431, https://doi.org/10.5194/acp-18-3419-2018, 2018. a
Neis, P., Smit, H. G. J., Rohs, S., Bundke, U., Krämer, M., Spelten, N., Ebert, V., Buchholz, B., Thomas, K., and Petzold, A.: Quality assessment of MOZAIC and IAGOS capacitive hygrometers: insights from airborne field studies, Tellus B, 67, 28320, https://doi.org/10.3402/tellusb.v67.28320, 2015. a
Okuyama, M. and Zung, J. T.: Evaporation–Condensation Coefficient for Small Droplets, J. Chem. Phys., 46, 1580–1585, https://doi.org/10.1063/1.1840906, 1967. a
Peter, T., Marcolli, C., Spichtinger, P., Corti, T., Baker, M. B., and Koop, T.: When Dry Air Is Too Humid, Science, 314, 1399–1402, 2006. a
Petzold, A., Krämer, M., Neis, P., Rolf, C., Rohs, S., Berkes, F., Smit, H. G. J., Gallagher, M., Beswick, K., Lloyd, G., Baumgardner, D., Spichtinger, P., Nédélec, P., Ebert, V., Buchholz, B., Riese, M., and Wahner, A.: Upper tropospheric water vapour and its interaction with cirrus clouds as seen from IAGOS long-term routine in situ observations, Faraday Discuss., 200, 229–249, https://doi.org/10.1039/C7FD00006E, 2017. a, b
Pruppacher, H. R. and Klett, James. D.: Microphysics of clouds and precipitation, in: With an introduction to cloud chemistry and cloud electricity, 2nd rev. and enl. ed. Edn., Kluwer Academic Publishers, Dordrecht, Boston, 1997. a, b
Rollins, A. W., Thornberry, T. D., Gao, R. S., Woods, S., Lawson, R. P., Bui, T. P., Jensen, E. J., and Fahey, D. W.: Observational constraints on the efficiency of dehydration mechanisms in the tropical tropopause layer, Geophys. Res. Lett., 43, 2912–2918, https://doi.org/10.1002/2016GL067972, 2016. a
Sarkozy, L. C., Clouser, B. W., Lamb, K. D., Stutz, E. J., Saathoff, H., Ebert, V., Wagner, S., Kühnreich, B., and Moyer, E. J.: The Chicago Water Isotope Spectrometer (ChiWIS-lab): a tunable diode laser spectrometer for chamber-based measurements of water vapor isotopic evolution during cirrus formation, in review, 2020. a, b, c
Shilling, J. E., Tolbert, M. A., Toon, O. B., Jensen, E. J., Murray, B. J., and Bertram, A. K.: Measurements of the vapor pressure of cubic ice and their implications for atmospheric ice clouds, Geophys. Res. Lett., 33, L17801, https://doi.org/10.1029/2006GL026671, 2006. a, b, c, d, e
Skrotzki, J.: High-accuracy multiphase humidity measurements using TDLAS: application to the investigation of ice growth in simulated cirrus clouds, PhD thesis, https://doi.org/10.11588/heidok.00013141, 2012. a, b
Skrotzki, J., Connolly, P., Schnaiter, M., Saathoff, H., Möhler, O., Wagner, R., Niemand, M., Ebert, V., and Leisner, T.: The accommodation coefficient of water molecules on ice – cirrus cloud studies at the AIDA simulation chamber, Atmos. Chem. Phys., 13, 4451–4466, https://doi.org/10.5194/acp-13-4451-2013, 2013. a
Tan, X., Huang, Y., Diao, M., Bansemer, A., Zondlo, M. A., DiGangi, J. P., Volkamer, R., and Hu, Y.: An assessment of the radiative effects of ice supersaturation based on in situ observations, Geophys. Res. Lett., 43, 11039–11047, https://doi.org/10.1002/2016GL071144, 2016. a
Tanaka, H.: Thermodynamic stability and negative thermal expansion of hexagonal and cubic ices, J. Chem. Phys., 108, 4887–4893, https://doi.org/10.1063/1.475897, 1998. a
Wagner, R. and Möhler, O.: Heterogeneous ice nucleation ability of crystalline sodium chloride dihydrate particles, J. Geophys. Res.-Atmos., 118, 4610–4622, https://doi.org/10.1002/jgrd.50325, 2013. a
Winker, D. M., Hunt, W. H., and McGill, M. J.: Initial performance assessment of CALIOP, Geophys. Res. Lett., 34, L19803, https://doi.org/10.1029/2007GL030135, 2007. a
Zhang, C. and Harrington, J. Y.: The Effects of Surface Kinetics on Crystal Growth and Homogeneous Freezing in Parcel Simulations of Cirrus, J. Atmos. Sci., 72, 2929–2946, https://doi.org/10.1175/JAS-D-14-0285.1, 2015. a
Zobrist, B., Marcolli, C., Pedernera, D. A., and Koop, T.: Do atmospheric aerosols form glasses?, Atmos. Chem. Phys., 8, 5221–5244, https://doi.org/10.5194/acp-8-5221-2008, 2008. a
Note that in this work, where we use particle number densities on the order of 50 cm−3, our need for an ice growth model stems not from long relaxation times, but from the additional wall ice source not present in atmospheric cirrus.
anomalous supersaturationin conditions similar to the real atmosphere.