the Creative Commons Attribution 4.0 License.
the Creative Commons Attribution 4.0 License.
 | 27 Jan 2020
Cloud history can change water–ice–surface interactions of oxide mineral aerosols: a case study on silica
Ahmed Abdelmonem
Sanduni Ratnayake
Jonathan D. Toner
Johannes Lützenkirchen
Mineral aerosol particles nucleate ice, and many insights have been obtained on water freezing as a function of mineral surface properties such as charge or morphology. Previous studies have mainly focused on pristine samples despite the fact that aerosol particles age under natural atmospheric conditions. For example, an aerosol-containing cloud droplet can go through freeze–melt or evaporation–condensation cycles that change the surface structure, the ionic strength, and pH. Variations in the surface properties of ice-nucleating particles in the atmosphere have been largely overlooked. Here, we use an environmental cell in conjunction with nonlinear spectroscopy (second-harmonic generation) to study the effect of freeze–melt processes on the aqueous chemistry at silica surfaces at low pH. We found that successive freeze–melt cycles disrupt the dissolution equilibrium, substantially changing the surface properties and giving rise to marked variations in the interfacial water structure and the ice nucleation ability of the surface. The degree of order of water molecules, next to the surface, at any temperature during cooling decreases and then increases again with sample aging. Along the aging process, the water ordering–cooling dependence and ice nucleation ability improve continuously.
- Article
(2988 KB) -
Supplement
(292 KB) - BibTeX
- EndNote


Water–ice–mineral interactions play vital roles in the atmosphere as well as in food, pharmaceutical, construction, chemical, and other industries. The chemical and morphological properties of aerosol surfaces play direct and indirect roles in the climate system. For atmospheric questions, in which aerosols are often in metastable, non-equilibrium states, understanding how surface properties change at different atmospheric conditions remains challenging. For example, the ice nucleation ability of an ice-nucleating particle may be influenced by the change in surface properties due to aging (Coluzza et al., 2017) or other secondary ice processes (Zipori et al., 2018). Solutes are able to affect freezing (Zobrist et al., 2008), even at low concentrations (Whale et al., 2018). Depending on the atmospheric conditions, water molecules may heterogeneously crystallize next to an ice-nucleating particle surface, forming various ice polymorphs with different physical and/or surface properties (Parambil et al., 2014). This in turn affects their interaction with radiation in the atmosphere, which impacts the energy budget of the planet (Steiner et al., 2013). In mixed-phase clouds, for example, different ice polymorphs scatter light at different angles, which affects the radiation balance. Clouds and cloud formation are significant perturbations in climate models; hence it is important to understand the elemental processes of ice nucleation and the role of surface properties in counteracting climate change, for example by controlling the ice nucleation processes in the atmosphere.
Ice nucleation and crystallization processes are highly dependent on the initial stages where a few molecules or ions start to form a tiny crystalline nucleus in the liquid (Sosso et al., 2016; Cox et al., 2007, 2013). It is not possible to predict the time and place this nucleus will form in a real system. This complicates interpretations of experimental nucleation studies. Additionally, pre-adsorption of small impurities on the aerosol surface can dramatically affect the ice nucleation process. On the other hand, theoretical and simulation studies are complex not only because of the additional complication of describing the surface and the surface–solute interactions but also because of potential surface modifications under atmospheric conditions. Nucleation and crystallization are very active areas of current research.
Most ice nucleation processes occurring in the atmosphere are, in fact, heterogeneous due to the omnipresence of ice-nucleating particles. Hoose and Möhler (2012) have shown that ice nucleation is highly variable for aerosol particles collected from different sources and examined in different laboratories (Hoose and Möhler, 2012). There have been previous efforts to understand the influence of surface properties on water freezing, such as the effects of charge, e.g., on ice formation by aluminum oxide (Anim-Danso et al., 2016; Abdelmonem et al., 2017), or morphology, e.g., for feldspar and α-quartz (Kiselev et al., 2017; Holden et al., 2019; Harrison et al., 2016) and kaolinite (Wang et al., 2016). Although predicting and controlling crystal formation is a complex problem, it is believed that ice nucleation on α-quartz only occurs at a few locations, which are associated with micron-sized surface pits (Holden et al., 2019). One common effect that appears to have received relatively little attention (Coluzza et al., 2017) is the potential variation in surface properties of a given ice-nucleating particle over its residence time in the atmosphere. An aerosol particle in a cloud droplet is very similar to a particle in a solution. The ionic strength and pH of this solution may change due to different reasons. For example, an insoluble aerosol particle like silica may adsorb soluble salts like NaCl or acids like HCl or H2SO4 from the atmosphere or even at the surface of the earth before being aerosolized. Under suitable supersaturation conditions, water molecules in the atmosphere condense on the surface of that aerosol particle, forming a cloud droplet (we prefer the term solution droplet). The ionic strength and pH of droplets are determined by the concentrations of all involved salts, acids, and bases. These may affect the interfacial chemistry at the solid surface, e.g., through dissolution (Lis et al., 2014).
Silica dissolution may change the ionic strength of interfacial water, which changes the surface charge and also screens this charge by nearby ions (Seidel et al., 1997; Schaefer et al., 2017). Silica dissolution under non-equilibrium conditions, namely flow, has been recently discussed in some detail (Schaefer et al., 2018). They demonstrated that silica equilibrates at the interface with pure water at around 1 mM ionic strength; however, in the atmosphere, surface properties change at variable rates, depending on how the droplet size changes upon further condensation or partial evaporation. Partial evaporation may drive the system to rather extreme salinity and pH. A typical 50 µm mixed-phase droplet of pH 8 (assuming 1 µM NaOH solution) may evolve to pH 10 when the size is reduced by half (i.e., 25 µm) during evaporation. At this pH, silica rapidly dissolves (Hiemstra and van Riemsdijk, 1990). Near-complete evaporation will drive pH and ionic strength to extreme values. Besides dissolution this can cause changes in morphology, both of which are known to affect the ordering of water molecules and ice nucleation ability. In this paper, we intend to demonstrate such effects on the structure of water that arise from aging of the surface and the variation in the solution composition due to freezing–melting. We investigate the possible variation in the water–ice–aerosol surface interactions with only one parameter in its environment, which is the pH of the cloud droplet. We use fused silica surface as a model of mineral oxide aerosols.
Silicon is the most common element on earth after oxygen. In principle it may be present in the form of crystalline or amorphous SiO2- or Si-containing minerals. Both crystalline and amorphous forms of SiO2 have been widely studied (Iler, 1979; Bergna and Roberts, 2005) and have also been studied with interfacial behavior including the silica–water interface under static conditions using nonlinear spectroscopy techniques (Ong et al., 1992; Ostroverkhov et al., 2004, 2005; Jena and Hore, 2009; Jena et al., 2011; Azam et al., 2012, 2013; Ohno et al., 2016; Dalstein et al., 2017; Darlington et al., 2017; DeWalt-Kerian et al., 2017; Schaefer et al., 2017, 2018; Boamah et al., 2018), potentiometric titration (Karlsson et al., 2001; Dove and Craven, 2005), atomic force microscopy (Morag et al., 2013), or X-ray photoelectron spectroscopy (Brown et al., 2016). However, studies under non-equilibrium conditions are rare (Gibbs-Davis et al., 2008; Lis et al., 2014; Schaefer et al., 2018). Here, we are interested in fused silica, an amorphous form of SiO2, under non-equilibrium conditions. From the point of view of surface chemistry, silica is unusual because its surface charge characteristics differ from many other mineral oxides. This is because classical silica charging curves involve a plateau at zero charge below about pH 5.5. Silica also exhibits unusual aggregation behavior, remaining stable under conditions that cause other mineral oxides to aggregate. A hair-like structure at the surface of colloidal silica has been advocated to explain this (steric stabilization). In the context of surface charging, silica has been often associated with a gel-like layer at its surface. The latter two aspects have been recently addressed in some detail using surface force measurements (Schrader et al., 2018), but the proposed hair and gel layers were not observed. Instead, the unusual behavior was explained by the heterogeneity of the surface caused by silanol (hydrophilic) and siloxane (hydrophobic) surface groups. The extent to which these issues vary with chemical conditions (i.e., long-term exposure of a given surface to solutions) is poorly studied, particularly for temperatures between −40 and 20 ∘C. In this context freeze–melt processes involving a dilute solution at room temperature will result in solutions with a very high concentration of salt, acid, or base in contact with the surface (see Supplement and Fig. S1).
Quartz dissolution rates at 70 ∘C and pH 0 are as fast as at pH 8 to 10 (depending on the salt level), according to a comprehensive model by Hiemstra and van Riemsdijk (1990). The trend toward increasing rates at very low pH (the rate minimum is at pH 3) is partially visible in some of the experimental data, and extrapolation suggests very fast dissolution at pH −1. The rates are also affected by the temperature so that here we only use the available data and analogies to illustrate that dissolution is fast at very low pH values. This causes changes to the surface and should find repercussions in the surface properties. Surfaces of particles in the atmosphere undergo these kinds of freeze–melt cycles as well, and therefore aged surfaces are probably much more relevant to ice nucleation than the freshly prepared samples of the same particles that are typically used in laboratory work.
In this work, second-harmonic generation (SHG) was used to probe molecular-level changes in the degree of ordering of interfacial water next to silica surfaces being aged over multiple freeze–melt cycles. We found that the surface water structure changes with both temperature and freeze–melt aging of the surface. The degrees of liquid water molecules ordering next to the surface at room temperature and shortly before freezing decrease and then increase again with sample aging. However, the water ordering–cooling dependence improves continuously with aging. This is accompanied with a continuous improvement in the ice nucleation ability of the surface. We interpret the observed changes in the surface properties in terms of dissolution and re-adsorption of the dissolution products at the sample surface.
Milli-Q (MQ) water (18.2 MΩ cm) of total organic content below 4 ppb was used in all experiments. The pH solutions were freshly prepared before the experiments. The high- and low-pH solutions were prepared from NaOH and HCl (Sigma-Aldrich), respectively. The bulk pH was measured at room temperature using a pH meter (Orion 720A+, Thermo Electronic Corporation) and a pH electrode (ORION 8102 BN, Thermo Fisher Scientific). The pH measurement setup was calibrated using buffers with known pH values. The pH value is temperature dependent, since the dissociation constant of water changes with temperature (Bandura and Lvov, 2006; Zumdahl, 1993). The measuring cell was sealed from the lab environment to avoid dissolved gases in the liquid solutions. The concentration of dissolved Si ions in the solution after the experiment was measured using inductively coupled plasma mass spectrometry (ICP-MS, X-Series II, Thermo Fisher Scientific). For consistency, the data reported in this work were all collected on the same silica prism sample (from Thorlabs GmbH; optically polished UV-fused silica, surface quality is 40-20 scratch–dig, and surface flatness at 633 nm is λ / 10). The fresh sample was cleaned first by being soaked in chloroform, acetone, and then ethanol (∼2 h each without sonication or 30 min with sonication, both giving the same result). Finally, the sample was flushed with Milli-Q water. After each experiment series, the sample was cleaned with the same procedure, but excluding the chloroform step. Before starting experimental freeze–melt cycles, the sample was soaked in pH 12 (NaOH) for 5 h to generate a fresh surface, followed by MQ water for another few hours, and finally the sample was washed with MQ water to remove excess sodium.
The SHG experiments were conducted using a 1 kHz femtosecond (fs) laser system (Solstice, Spectra-Physics, 800 nm, 3.5 mJ, ∼80 fs) with a beam diameter of ∼2 mm at the interface. More details on the optical setup and the measuring cell can be found elsewhere (Abdelmonem et al., 2015, 2017; Abdelmonem, 2017). The fundamental beam was incident on the interface (Fig. 1), and the SHG signal was measured in co-propagating total internal reflection (TIR) geometry. A half-wave plate followed by a cube polarizer was used to adjust the polarization of the incident beam. The generated signal was filtered, using a 400 nm band-pass filter, before being measured using a photomultiplier tube (PMT). The measured signal amplitude at a given polarization depends on the amount and structure of the interfacial molecules (Zhuang et al., 1999; Rao et al., 2003; Jang et al., 2013). It originates from the non-resonant electric dipolar contribution (Goh et al., 1988; Luca et al., 1995; Fordyce et al., 2001) and is proportional to the incident field and the second-order nonlinear susceptibility χ(2) of the interface. It has been proven, for the water–silica system, that SHG is more sensitive to the number density of aligned water molecules, particularly at low pH and ionic strength (Rehl et al., 2019). For a charged interface, a third-order nonlinear polarization is induced by the static electric field due to the third-order nonlinear susceptibility {χ(3) of the solution (Ong et al., 1992; Zhao et al., 1993).
A silica prism was used as a sample where the hypotenuse was exposed to the solution. The incident angle of the fundamental beam was adjusted to 1∘ above the critical angle of TIR for silica–water interface to guarantee a TIR condition in the studied temperature range. In this work, the term Fresnel factors refers to nonlinear Fresnel factors affecting the SHG signal due to the optical constants of the media at the interface (Zhuang et al., 1999). The advantage of working close to the critical angle is that both PM (P-polarized SHG and 45∘ polarized incident) and SM (S-polarized SHG and 45∘ polarized incident) polarization combinations depend on only one non-vanishing nonlinear susceptibility tensor element, χzzz and χyyz, respectively (Shen, 1989; Zhuang et al., 1999). PM, however, gives a stronger signal and higher signal-to-noise ratio, and for this reason we only considered PM polarization. Nevertheless, we performed some runs with MP and MS polarization combinations to assure that both give the same information (Fig. S2). The laser power coupled to the sample was 50 mW. The SHG signal is mainly produced by polarizable entities at the interface where the inversion symmetry is broken. Under TIR geometry, the contribution of polarizable molecules next to the solid surface is limited by the penetration depth inside the contact medium (gas, liquid, or ice). The calculated penetration depths for air, liquid water, and ice in the geometry described above are about 143, 720, and 414 nm, respectively. The time resolution of the SHG measurements is 2.5 s. The standard deviation of the measurements is less than 10 %.

A cold stage (Linkam model HFS-X350) was used in a homemade temperature-controlled environmental chamber to apply a preset temperature profile (TP), and the SHG signal and substrate temperature were measured accordingly. In this work, we are not seeking the exact onset freezing temperature but rather the qualitative change of the freezing efficiency and the structural behavior of interfacial water molecules before, during, and after freezing. The silica prism was attached to the cold stage, and the surface of interest was exposed to the sample solution filled in a Teflon cell during the experiments. More details and drawings of the environmental chamber can be found elsewhere (Abdelmonem, 2017).
To allow qualitative comparisons, all results presented here were obtained using a standard TP unless otherwise noted. For a standard run, the cell was filled with 1 mL volume of the solution of interest. In each run, the silica sample was (1) kept in contact with the sample solution at 20 ∘C for 10 min, (2) cooled down to −40 ∘C at a rate of 5 ∘C min−1, (3) held at −40 ∘C for 5 min, (4) heated up to 0 ∘C at a cooling rate of 20 ∘C min−1, (5) held at 0 ∘C for 15 min to allow melting and departing of the ice from the surface region, and (6) finally heated up to 20 ∘C at a rate of 20 ∘C min−1. This cooling profile was repeated to observe the changes in the freezing efficiency and water structure as a function of the cooling cycle. The last two cycles were delayed for some hours to assess possible aging of the sample in contact with the solution in the absence of freezing–melting effects. The duration of a complete standard TP is 45 min. In the following, the signal before freezing is labeled a “liquid signal”, the peak at the freezing event is termed a “transient freezing peak”, the signal after the freezing and transient freezing peak is labeled a “ice signal”, the peak at the melting event is defined as a “transient melting peak”, and the signal directly after the transient melting peak is termed a “confined liquid signal”.
Figure 2 shows the SHG signal observed for the pH 3 solution in contact with the silica surface as a function of time during 25 TP cycles. We chose pH 3 because it is close to the point of zero charge of the used sample, which eliminates the contribution from {χ(3). Also, at this pH the dissolution rate is minimized. Starting from 20 ∘C and cooling down, the liquid signal in cycle 1 gradually decreases with temperature until the freezing point. At the freezing point, we observe a transient signal upon freezing (a fast increase and subsequent decrease in the signal). After freezing and at constant temperature, the ice signal is flat. After melting, we observe a high signal (confined liquid signal) for ∼4 min. This period depends on the water volume and the holding time of ice at −40 ∘C. Finally, after heating back to 20 ∘C, we observe a liquid signal which is lower than the initial 20 ∘C liquid signal. When repeating the TP 25 times, we observe clear changes in the SHG-temperature dependence. The gradual decrease in the liquid signal with cooling before the freezing event gradually transforms into an increase. The liquid signal versus cooling decreases for the early TP cycles, remains constant during the intermediate TP cycles, and then increases for the later TP cycles, as indicated by the green arrows in Fig. 3. A transient melting peak becomes visible at TP cycle 5. Finally, after melting started and after the associated transient melting peak, we observe a signal from liquid confined between the surface and the remaining ice (confined liquid signal), the height of which decreases with the repeating TP cycles.
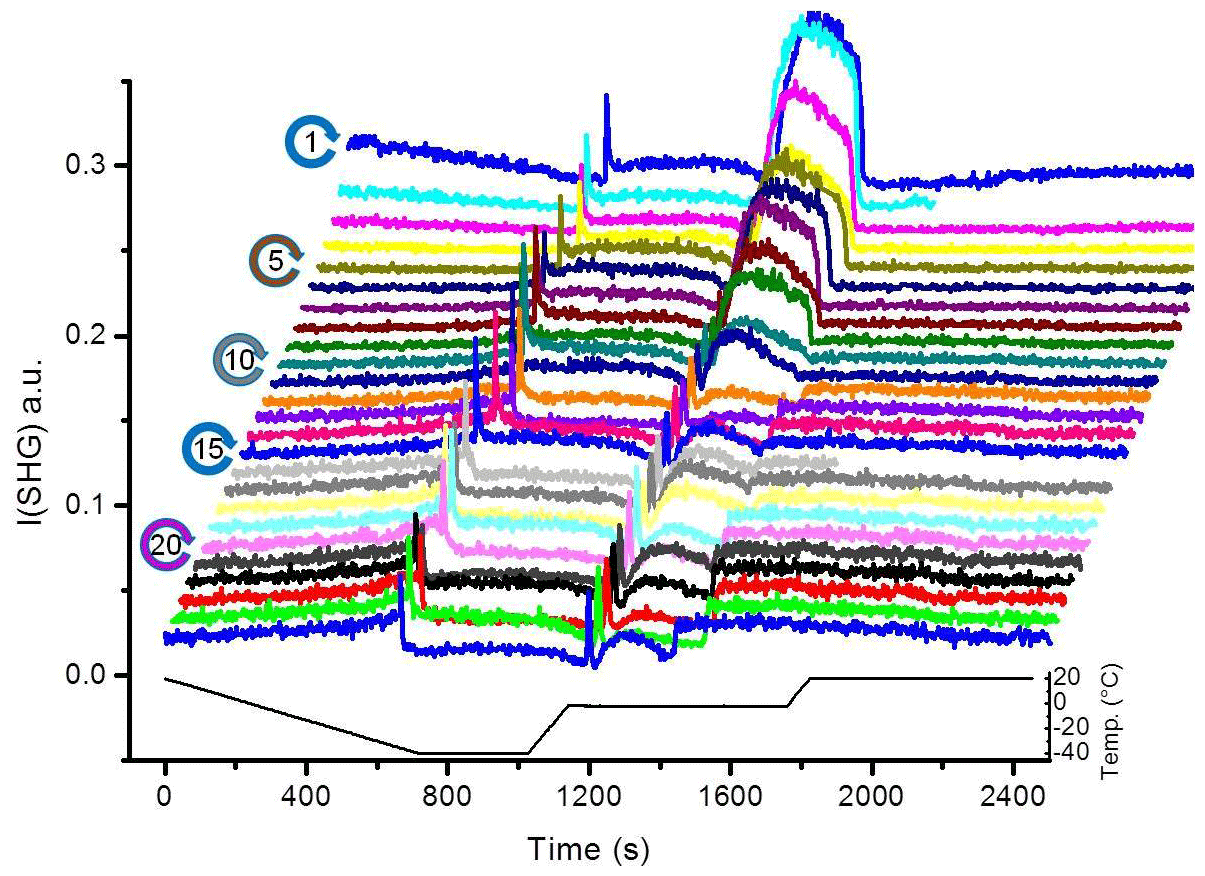
Figure 2SHG signal at pH 3 solution–silica interface (I(SHG); a.u. stands for arbitrary units) as a function of time for 25 successive TP cycles. Due to technical problem, some data could be lost during the experiment (e.g., the uncompleted scans of cycle 2 and 16 in the presented set).
3.1 Liquid signal
The SHG signal from time zero to the transient freezing peaks shows the liquid signal as a function of time vs. temperature during cooling from 20 ∘C to the freezing event (Figs. 2 and 3). This part of the TP indicates a restructuring of interfacial water as a function of temperature before freezing. In cycle 1, the liquid signal is relatively high at 20 ∘C (comparatively strongly ordered water molecules) and decreases with cooling, indicating a decreasing order in the water structure with decreasing temperature. This signal–temperature dependency weakens after repeating the TP. In cycle 5, the liquid signal remains almost constant during cooling. In cycle 10, the liquid signal starts to slightly increase with cooling, particularly before the freezing event. Finally, cycle 25 shows a significant increase in the water signal with cooling, indicating that the surface induces a higher degree of water molecules ordering upon cooling.
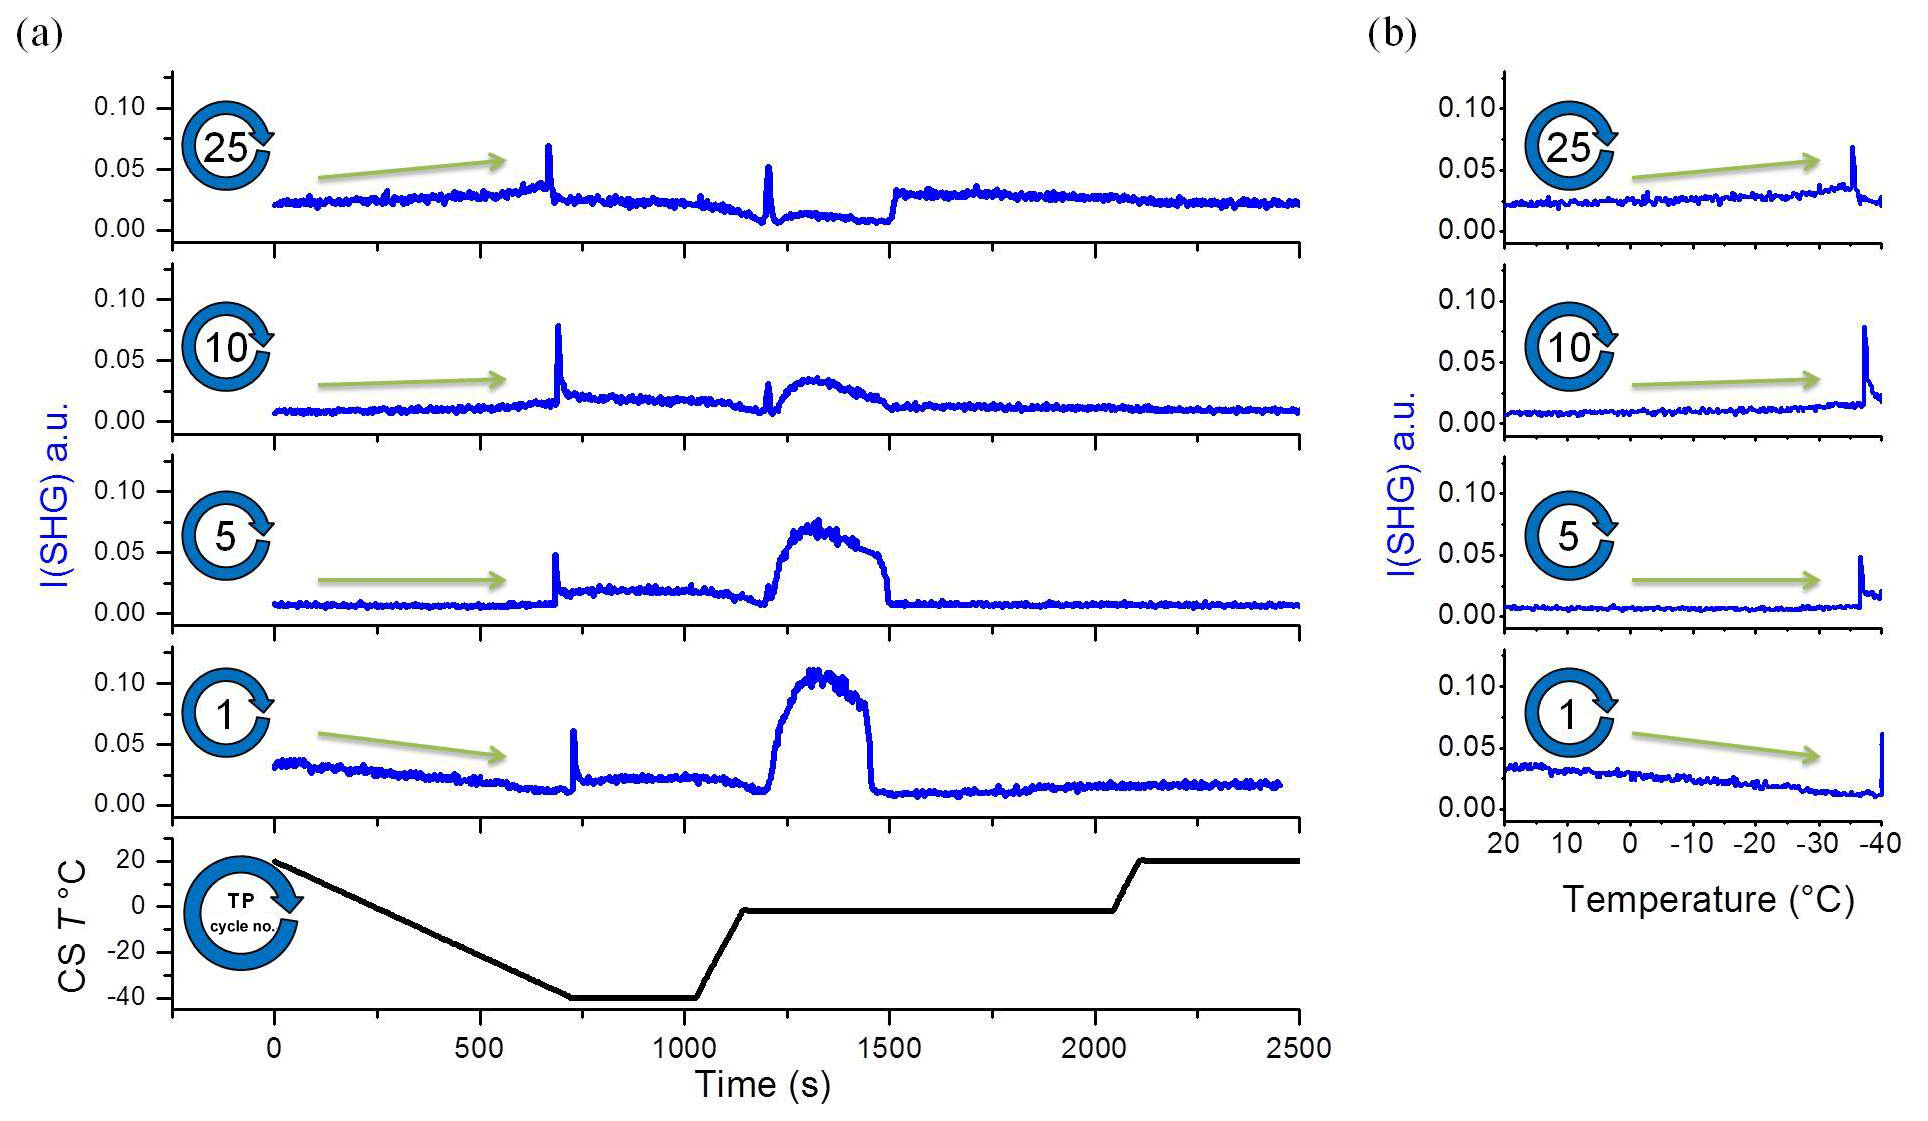
Figure 3A selection from the set of plots shown in Fig. 2. (a) Temperature and SHG signal as a function of time. (b) SHG liquid signal as a function of temperature during cooling. This set of subplots shows clear change in the I(SHG) temperature dependence during the TP iteration. CS T is cold-stage temperature.
To gain more insight into the change in the water restructuring with temperature upon repeated TP cycles, we plot the SHG intensity as a function of cooling cycle at different temperatures. Figure 4a, b, and c show the liquid signal as a function of the TP cycle number at the beginning of each cycle (at 20 ∘C), shortly before the freezing event (at −31 ∘C), and immediately before the freezing event, respectively. The temperature of the last case slightly differs for each cycle. Additional plots at other temperatures can be found in Sect. S3 in the Supplement. Figure 4a shows a relatively high liquid signal at 20 ∘C in the first cycle. The 20 ∘C signal decreases and then increases again, showing a minimum located at approximately the seventh TP cycle, indicating a minimum degree of water molecules ordering at the interface in this cycle.
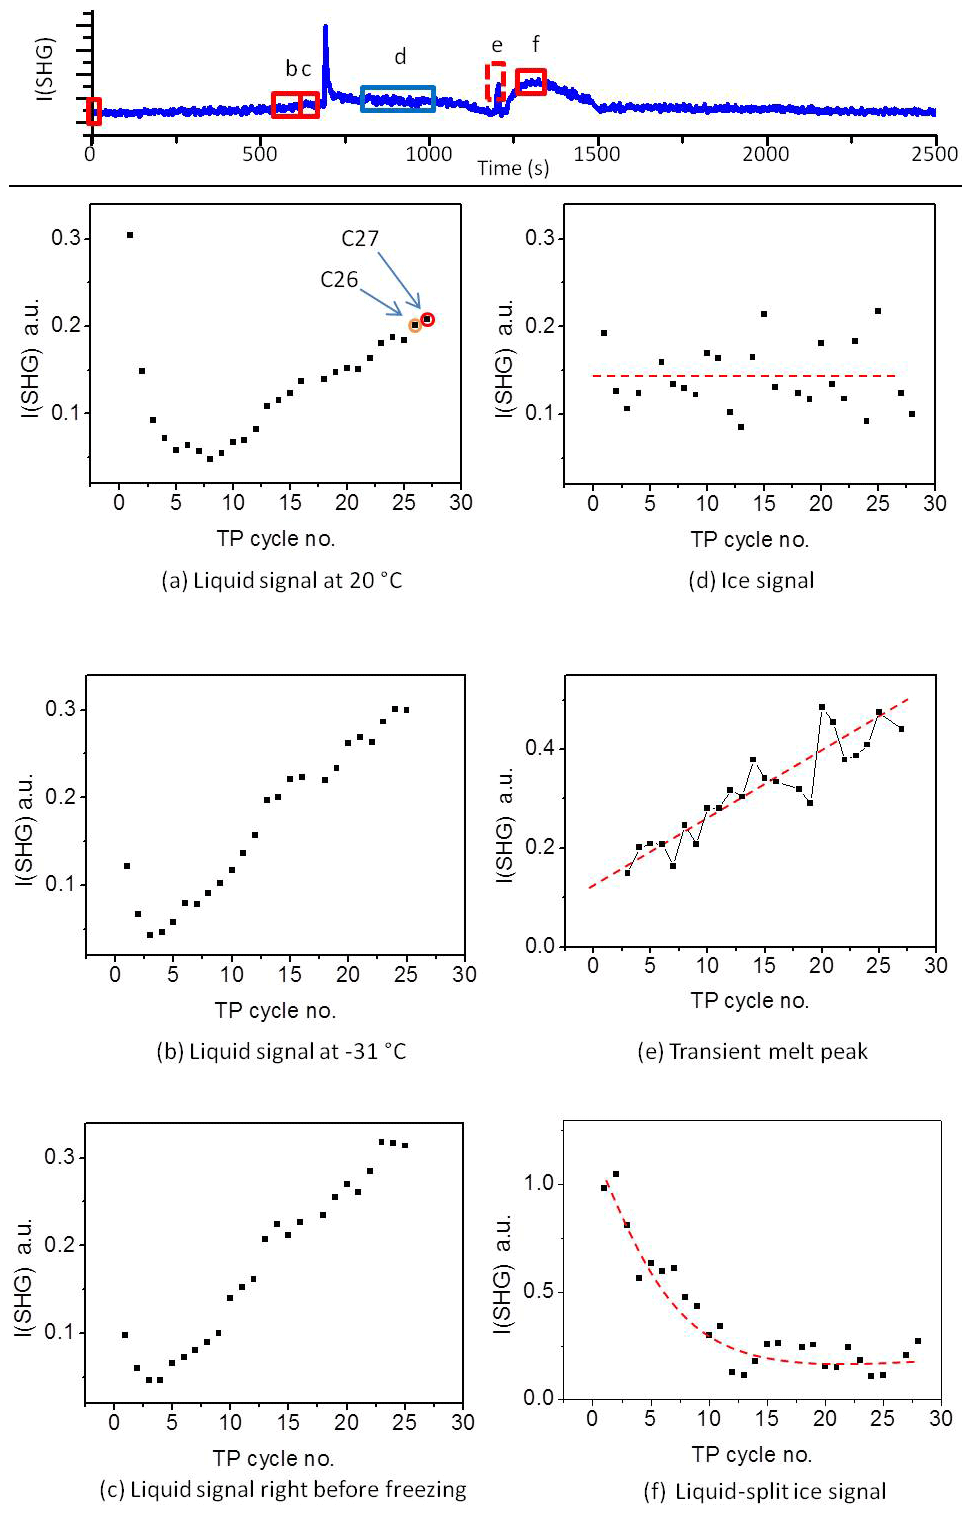
Figure 4Upper panel: A sample plot of SHG vs. time during the standard TP. (a–f) The averaged SHG signal as a function of TP cycle number at the different time slots marked with red and blue rectangles in the upper panel. The red rectangle corresponds to liquid phase, while the blue rectangle corresponds to ice phase. The dashed red lines on the plots are guiding lines through the data points.
The cycles from 1 to 25 have been carried out with equal time intervals. However, to assure that the changes we observe here are mainly due to the freezing–melting effect and not simply time-dependent surface aging in contact with the pH 3 solution, we carried out two additional cycles after deliberately waiting for 5 h while the sample was in contact with pH 3 at room temperature. This time is equivalent to the time needed to perform about six TP cycles. The 20 ∘C liquid signals of these two additional cycles are marked as orange (cycle 26) and red (cycle 27) circles in Fig. 4a. Cycle 26 has the same standard TP of the preceding 25 cycles, while the red cycle 27 has a different TP for a reason to be discussed later. By comparing the plot of the SHG signal vs. cooling cycle number (Fig. 4a) and that vs. time (Fig. S4), we find that the two data points of the two additional cycles (cycle 26 and cycle 27) fit well with the extrapolation of the changes in the SHG signals with the TP cycle number. However, these two points are offset in terms of time when extrapolating the SHG signal with time. We conclude that the changes in the surface–solution system are accelerated by the freezing and melting processes. It is well established that silica surfaces dissolve in aquatic environments (Hiemstra and van Riemsdijk, 1990). As mentioned in the Introduction, dissolution is accelerated by very low and high pH values. The amount of aqueous silica depends on the pH and the time of exposure. However, the observed changes in the 20 ∘C SHG signal as a function of the TP cycle number (Fig. 4a) within the relatively short time intervals, about 45 min per cycle, can only be attributed to an accelerated dissolution upon freezing–melting followed by re-adsorption of dissolution products, hence changing the surface properties, which in turn influences the interfacial water structure.
The decrease and subsequent increase in the liquid signal at 20 ∘C with the progress of the TP cycles (Fig. 4a) can be explained as follows. At the beginning, before the minimum point, adsorbed dissolution products interrupt the water structure, which is expected to be slightly ordered due to the H bonding or the weak surface charge at pH 3. As mentioned above, pH 3 is close to the point of zero charge of silica, and therefore the signal is low compared to neutral or high pH (Fig. S5). Each freezing–melting cycle increases the concentration of the dissolution products in the bulk solution sufficiently to change the ionic strength of the interfacial water, and this in turns affects the interfacial water structure. At the minimum point, adsorbate concentration at the surface causes the highest disorder of the water molecules. Beyond the minimum point, the adsorbate concentration is sufficiently high to induce a certain degree of arrangement of water molecules. This results in an increase in the liquid signal at 20 ∘C beyond the minimum point. The alteration of the signal trend originates from an interplay between screening and interference effects (Schaefer et al., 2017). In the following, the interaction before the minimum point will be termed a “screening phase” and that after the minimum an “interference phase”.
Shortly before the freezing event the liquid signal as a function of the TP cycle number also shows a minimum, as can be seen in Fig. 4b and c. Figure 4b shows the SHG liquid signal at −31 ∘C, while Fig. 4c shows the signal immediately before the freezing point, for all TP cycles. Figure 4b and c show similar behavior. In both cases the minimum point occurs between cycles 3 and 4, i.e., not at the same position as the minimum point of the 20 ∘C liquid signal (around cycle 7). This suggests that temperature affects the adsorption-desorption balance. The effect of re-adsorption, on water structure before the minimum point, at lower temperature precedes that at higher temperature (Figs. 4a–c and S3a–e). This means that cooling favors the uptake of dissolved silica (i.e., adsorption) and hence increases the interfacial ion concentration. Considering the thermodynamic behavior of silica in such systems (see Sect. S1; Fig. S1) the solubility of amorphous silica strongly decreases with decreasing temperature. Adsorption of inorganic solutes to mineral oxide surfaces is typically strongly related to the solubility behavior (Lützenkirchen and Behra, 1995) so that the thermodynamic calculations in the Supplement support the idea of enhanced re-adsorption of dissolved silica to the fused silica surface under cooling. This justifies the hypotheses that the change in the liquid signal with an increasing number of TP cycles is due to the uptake of dissolved silica ions. The decrease in liquid signal with the temperature decrease within the screening phase is consistent with the conclusion that in this phase re-adsorption causes disorder of water molecules and that cooling accelerates the completion of this phase.
Beyond the minimum, the older the surface, i.e., the more frequently exposed the surface is to freezing–melting cycles, the higher the degree of ordering induced by the surface on the interfacial water particularly at a supercooled condition. In addition, the liquid signal–temperature dependence per TP cycle converts from being inversely to directly proportional with cooling (green arrows in Fig. 3). It has been shown in different studies on the water–mineral oxide interface that a higher degree of ordering of liquid water molecules next to the surface is an indication of higher heterogeneous freezing efficiency (Abdelmonem, 2017; Abdelmonem et al., 2017, 2015; Anim-Danso et al., 2013, 2016; Yang et al., 2011). In the present work, it was our intention to impose a constant cooling rate to qualitatively follow the freezing efficiency and interfacial water structural changes under identical conditions. Figure 5 shows the freezing temperatures obtained under the standard TP and experimental conditions described above. The overall trend shows that the older the surface, the higher the temperature of freezing, i.e., the earlier the freezing event, under the same conditions. This means that indeed the aged sample exhibits better ice nucleation efficiency, which is induced by the pre-structuring of water molecules by the modified surface.
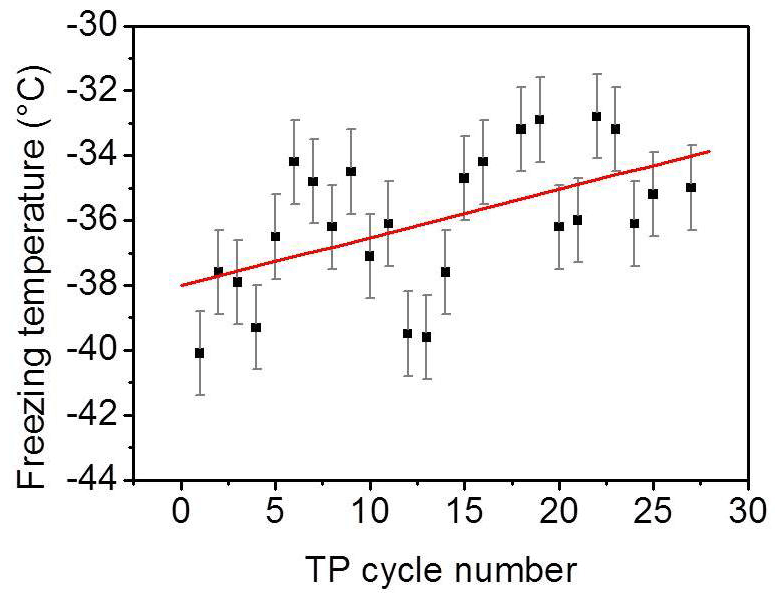
Figure 5Freezing temperature of pH 3 solution as a function of the TP cycle number under the experimental conditions mentioned in the text. Black squares represent experimental data. Red line is a linear fit to follow the trend of the data points. The error bars have been evaluated from the standard deviation of different experiments.
For quantification we need to find the range of bulk concentrations at which we may observe alteration in the signal behavior. As a control experiment, we prepared dissolved silica solutions with different concentrations of silicic acid at pH 3 and measured the SHG signal at the interface for each solution at room temperature. Figure 6 shows the SHG intensity as a function of silica concentration. Indeed, we observe oscillations in the signal as the silica concentration increases. Without invoking any model, this directly supports the conclusion that the change in the SHG signal in our freezing–melting experiments was due to the change in the dissolution products' concentration with the progress of the TP cycles. The minimum we see in Fig. 4a should correspond to one of the minima in the silica ions concentration experiment (Fig. 6). By analyzing the pH 3 solution in contact with the silica surface after the complete set of TP cycles, we found that the aqueous concentration of Si was 41.0±1.5 µM. This means that by repeating the freezing–melting TP cycle the dissolution products generated a substantial interfacial ionic strength equivalent to that at the low concentration range of Fig. 6 (shaded area). The dissolution of silica changed the z-dependent electrostatic potential of the bare silica–water interface in a very similar manner to the addition of approximately 41 µM silicic acid at pH 3 at room temperature, implying an interfacial concentration of dissolution-released entities of the same order. This control experiment corroborates the scenario of multiple adsorption phases of dissolution products at the surface and the concomitant effect it has on the water structure.
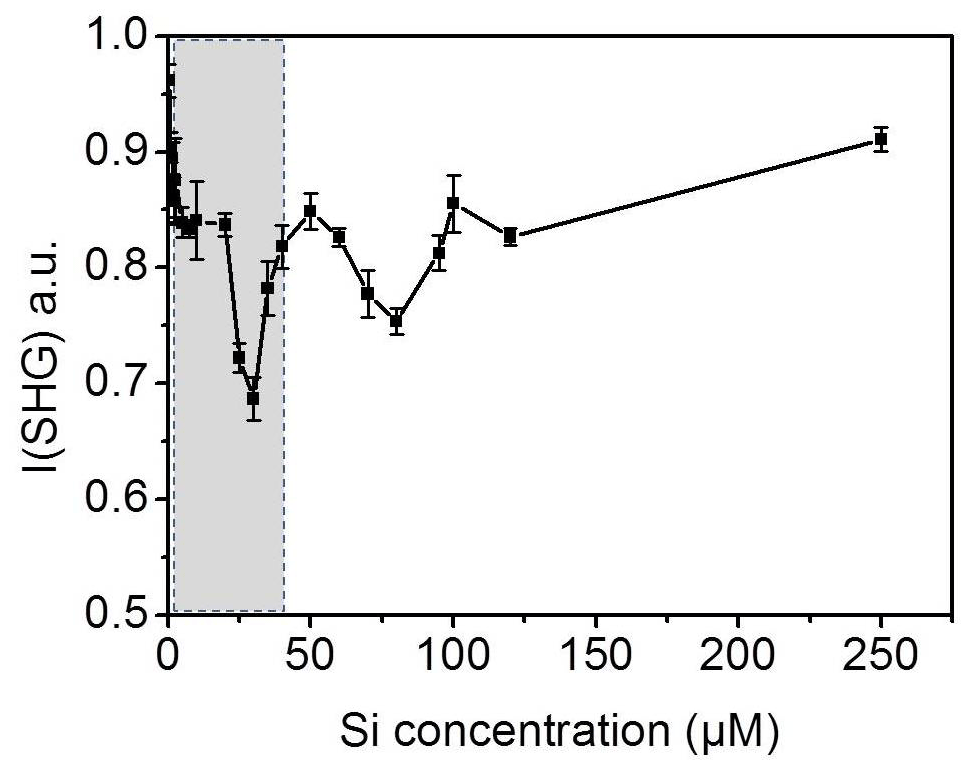
Figure 6SHG intensity as a function of silica ion concentration at pH 3 at 20 ∘C. The error bars represent the standard deviation from the corresponding average value.
3.2 Transient freezing and melting peaks
Although this study was not aimed at discussing the transient freezing peak, the obtained data force us to reconsider this recently observed ambiguous phenomenon. The transient peak upon freezing was reported at pH 9.8 for the aqueous-solution–mica interface using SFG (sum-frequency generation) spectroscopy (Anim-Danso et al., 2016), for a neutral water–silica interface using SFG spectroscopy (Lovering et al., 2017), for a neutral water–mica and water–sapphire interface using SHG spectroscopy (Abdelmonem, 2017), and for a pH 9 aqueous-solution–sapphire interface using SFG spectroscopy (Abdelmonem et al., 2018). Anim-Danso et al. (2016) supposed that the transient signal is due to progressive events occurring near the surface during the phase transition, without specifying a potential process. Lovering et al. (2017) suggested the presence of a transient stacking-disordered ice at the interfaces during freezing. Abdelmonem et al. (2018) have reported that the observed transient signals arise from a smooth transition between water and ice and do not necessarily indicate transient species. It was demonstrated that the transient change in the signal intensity results from an interference between different SFG peak parameters changing at different rates. All SFG and SHG studies mentioned above showed a transient increase in the signal, although with different temporal characteristics (a few tens of seconds to several minutes).
In the present study, we provide evidence that the transient freezing peak arises from a multi-interface problem, and the reported observations may indeed be explicable without the need to invoke any transient species. We also address the parameters affecting the transient time. In our experiments we observed the transient signal at freezing and melting as well. To interpret the transient signal we corrected our data for the Fresnel factors. Figure 7 shows the corrected and non-corrected SHG signal around the transient freezing and transient melting peaks of TP cycle number 25. The liquid data before the transient freezing peak and after the transient melting peak are corrected to the water Fresnel factors (red lines), and the ice data between the transient freezing peak and the transient melting peak are corrected to the ice Fresnel factors (blue lines). All corrected data sets were then normalized to the measured ice signal for the sake of clearness. For this reason, the Fresnel corrected ice data (blue lines) coincide with the non-Fresnel corrected signal (black solid circles). The lower panels of Fig. 7 show a schematic representation of the development of the ice forming and melting at the interface around the freezing and melting events, respectively, involving six steps. (1) Before the freezing event, the SHG signal arises from the liquid–solid interface and is affected by the Fresnel factors of bulk liquid and bulk solid (silica). (2) Once freezing occurs, a thin film of ice is formed at the surface. This film is sufficiently thin for the ice–solid interface SHG signal to still be affected by the Fresnel factors of bulk liquid and bulk solid. (3) After the freezing event, the ice film grows, and the SHG signal is generated from the ice–solid interface and affected by the Fresnel factors of bulk ice and bulk solid. (4) Before the melting event, the SHG signal has similar conditions to the previous step. (5) Once the melting occurs, a thin film of liquid is formed at the surface. This film is sufficiently thin so that the SHG signal at liquid–solid interface is still affected by the Fresnel factors of bulk ice and bulk solid. (6) Later, after the melting event, the ice melts further and the SHG signal is generated from the liquid–solid interface and affected by the Fresnel factors of bulk liquid and bulk solid.

Figure 7Upper panels: a comparison between SHG signal, corrected (continuous and dashed lines) and non-corrected (black solid circles) to the Fresnel factors, around the transient freezing peak (left panel) and around the transient melting peak (right panel) for TP cycle number 25. Red lines correspond to liquid phase, blue lines correspond to ice phase, and dashed lines correspond to transient signal. Lower panels: a schematic representation of the development of the ice forming and melting at the interface around freezing and melting events, respectively. FC refers to Fresnel corrected data.
The transient signals persist until the respective ice or liquid film thickness exceeds the evanescent field (represented by the red bows at the interfaces in the lower panel of Fig. 7). Considering the transient freezing, if we assume that the bulk liquid optical constants are the origin of the transient ice signal, and correct for the transient ice signal to liquid–solid Fresnel factors, the maximum signal should be less than the ice signal. But this is not the case. Correcting the transient ice signal to the liquid–solid Fresnel factors gives the dashed red line in Fig. 7, which has a maximum significantly higher than the ice signal. Similar justification applies to the transient melting if we correct the transient liquid signal to the ice–solid Fresnel factors (dashed blue line in Fig. 7). Thus, the Fresnel factor corrections cannot exclusively explain the transient freezing behavior.
We conclude here that the effect of the Fresnel factors, or in other words the optical constants of the bulk isotropic media around the interface, is not sufficient to generate the observed transient peak. However, another multi-interface problem is accompanying the formation and growth of ice and liquid films after the freezing and melting events. In the case of freezing, once ice nucleation starts and until the thickness of the ice film exceeds the depth of the evanescent field, two interfaces are involved and can contribute directly to the signal: the ice–solid interface and the liquid–ice interface (see drawing 2 in the lower panel in Fig. 7). The SHG signal of the first interface (ice–solid) should be comparable to that of the ice signal (blue line, upper left panel in Fig. 7). However, the SHG signal of the second interface (liquid–ice) is an additional contribution to the detected signal, which emerges for a very short time (i.e., the time of vertical growth of the ice film within the evanescent field). In the case of melting, before the thickness of the liquid film exceeds the depth of the evanescent field (drawing 5, lower panel in Fig. 7), an additional temporary signal from the ice–liquid interface contributes to the liquid–solid interface. Again, the ice–liquid signal should be sufficiently higher than that of the liquid–solid interface at pH 3 and will last for a short time until the liquid layer thickness exceeds the evanescent field. The signal generated at the secondary interface has not been considered in the SFG and SHG studies discussed above.
We also believe that this transient signal occurs in all similar systems, while its detection depends on data acquisition speed and the geometry of the measuring cell. The data represented here were collected at time resolution of 2.5 s. If the time resolution is above 9 s, which is the average duration of the transient freezing peaks under our standard TP, a transient freezing signal would not be observable for this system. The transient time depends on the experimental conditions of the system, e.g., the cooling rate, the sample volume, and the thermal conductivities of the two isotropic media. At the melting event, a thin water film is formed between solid and ice which starts to grow vertically at the expense of the ice melting (drawing 5, lower panel in Fig. 7). A quasi-liquid layer has been reported on the ice surface in both atmospheric ice and multiphase chemistry as well as in commercial contexts. The growth of such a film is, however, slower than the growth of the ice film after freezing because the energy transfer between solid surface and ice is slower than that between the solid surface and water. The vertical growth of the thin water film formed upon melting is then expected to last for a relatively longer time than that of the ice sheet after the freezing event. Indeed, the average transient melting time was about 16 s in our standard TP (cycles from 1 to 25). We tested the heat transfer effect in one very slow cooling profile (TP of cycle 27), which is shown in Fig. S6. The very slow cooling involved enough time for the bulk liquid to cool down, thus enhancing the vertical ice growth rate compared to the standard TP used for runs 1 to 25. Once the freezing occurred in cycle 27, the propagation of the ice in the z direction was so fast that the 2.5 s resolution of the detection system was not able to detect the transient freezing signal. Although no transient freezing temperature was observed in cycle 27, the transient melting peak was detected for this TP cycle and was even longer (∼48 s) than for the first 25 cycles of the standard TP. This is because the longer cooling time developed a larger ice bulk in the measuring cell, i.e., a bigger heat absorber than the bulk ice in the standard TP cycles. This generates more resistance to the growth of the thin water film.
In summary, we conclude that the transient SHG and SFG signals observed in the above-mentioned studies were a result of the multi-interface problem. However, using such a signal under controlled conditions can allow for measuring crystal growth, which has so far been a challenging task due to the incomplete understanding of the physical mechanisms underlying ice crystallization. It is worth noting here that the height of the transient melting peak is proportional to the sample aging caused by successive TP cycles and, in our system, starts after cycle 3 (Fig. 4e). This corroborates the role of the interference phase after the minimum point, as discussed in the liquid signal section. We have not attempted to plot the transient freezing peak height in Fig. 4. Due to the limited detection time resolution and the fast change in the transient freezing signal, the peak region involved only one data point from which the actual peak height cannot be determined. With this we presented a reasonable interpretation of the transient signal which has been under debate in the recent years.
3.3 Confined liquid and ice signal
The ice signal did not show any clear trend with repeating the TP (Fig. 4d), but we noticed a strong fluctuation in the level of the averaged ice signal after the freezing. This ice signal fluctuation merits further investigations, particularly those using SFG, which provide details on the individual contributions of different interfacial species from their resonant vibrations.
The confined liquid signal (Fig. 4f) is generated at the interface between the silica surface and bulk liquid confined between the silica surface and ice after melting a relatively thick interfacial layer (drawing 6, lower panel in Fig. 7). This confined bulk liquid is sufficiently thick for the evanescent field not to reach the bulk ice. It is hence a signal only generated at the liquid–solid interface. This signal is strongly influenced by the geometry of our experiment and can change from one cell design to another (see Fig. S7). In our cell design, the ice piece which separates from the sample surface after melting stays close to the surface and requires some time to be detached from the interfacial region and move towards the unfrozen water during the experiment (see Fig. S7). Although this piece of ice does not contribute directly to the signal, it indirectly influences the SHG signal as a result of two simultaneous effects. (1) Depending on the distance between this ice piece and the surface, the orientation of the interfacial water may be influenced by the ice surface. (2) The melting of this ice piece slowly dilutes the solution back to pH 3. The combination of these two simultaneous processes results in the hump we see in the SHG curves in the region after the transient melting peak (Figs. 2 and 3). A supplementary video shows the development of this hump, with the melting and motion of the ice piece during melting being available (Abdelmonem et al., 2019). The height of the confined liquid signal decreases upon repeating the TP (Fig. 4f). This provides additional evidence that the surface–solution system significantly changes with the iteration of the TP. Regardless of the vague behavior of the confined liquid signal, optimizing this setup may ultimately allow us to extend our studies to investigate interfacial water melted between ice and solid surface or the so-called quasi-liquid layer (Nagata et al., 2019; Li and Somorjai, 2007; Rosenberg, 2005; Döppenschmidt et al., 1998), which also has industrial applications (e.g., ski sports or frozen-food packaging).
We studied the effect of surface aging under acidic conditions on the rearrangement of interfacial water molecules next to an amorphous silica surface at the molecular level using SHG spectroscopy under temperature-controlled conditions. The aging was accelerated by successive freeze–melt cycles of a pH 3 solution in contact with the surface. Similar aging is highly probable for mineral oxide aerosols in the atmosphere. The aging altered the temperature dependence of the water structure and ice nucleation ability of the surface. We interpreted the alteration in the water–silica interaction in terms of the disruption of the equilibrium at the surface due to dissolution and re-adsorption of dissolution products. The re-adsorption of dissolved silica generates a network on the surface. The SHG intensity versus freeze–melt cycle number at constant temperature indicated alteration in the generated network. A control experiment showed an oscillation in the degree of order of water molecules with Si ion concentration. The first minimum in this oscillation quantified the dissolution-released entities in the aging experiments. Aside from the main findings, we provided a reasonable explanation of the transient freezing and melting signals, which were recently observed by SFG and SHG studies on similar systems and were questioned in terms of reality and origin. Our results provide new insights into the understanding of the consequences of surface aging in aqueous solutions under atmospheric conditions. This study is expected to benefit future atmospheric research, particularly cloud formation and aerosol aging in the atmosphere, with potential implications for pharmaceutical and food industries.
The data used in this study are available from the corresponding author upon request (ahmed.abdelmonem@kit.edu).
A supplementary video (Melting_Peak-Hump.avi) that shows the development of the SHG signal hump in the region after the transient melting peak (Figs. 2 and 3) is available online at https://doi.org/10.6084/m9.figshare.9878369.v1 (Abdelmonem et al., 2019).
The Supplement comprises thermodynamic considerations and associated data and plots. The supplement related to this article is available online at: https://doi.org/10.5194/acp-20-1075-2020-supplement.
AA designed the experiments and, together with SR, carried them out. JL and SR prepared the solutions. AA performed the spectroscopic data analysis. AA, JL, and SR discussed the experimental results. JL and JT performed the surface chemistry calculations. AA prepared the paper, with contributions from all co-authors.
The authors declare that they have no conflict of interest.
Ahmed Abdelmonem is grateful to the German Research Foundation (DFG; AB 604/1-1,2). Sanduni Ratnayake thanks the DAAD (2017/18, 57299294). The authors are grateful to Mischa Bonn for useful discussions and acknowledge Horst Geckeis, Thomas Leisner, Frank Heberling, Dieter Schield, and Teba Gil-Diaz for their support.
This research has been supported by the Deutsche Forschungsgemeinschaft (grant no. AB 604/1-2).
The article processing charges for this open-access
publication were covered by a Research
Centre of the Helmholtz Association.
This paper was edited by Daniel Knopf and reviewed by two anonymous referees.
Abdelmonem, A.: Direct molecular-level characterization of different heterogeneous freezing modes on mica – Part 1, Atmos. Chem. Phys., 17, 10733–10741, https://doi.org/10.5194/acp-17-10733-2017, 2017.
Abdelmonem, A., Lützenkirchen, J., and Leisner, T.: Probing ice-nucleation processes on the molecular level using second harmonic generation spectroscopy, Atmos. Meas. Tech., 8, 3519–3526, https://doi.org/10.5194/amt-8-3519-2015, 2015.
Abdelmonem, A., Backus, E. H. G., Hoffmann, N., Sánchez, M. A., Cyran, J. D., Kiselev, A., and Bonn, M.: Surface-charge-induced orientation of interfacial water suppresses heterogeneous ice nucleation on α-alumina (0001), Atmos. Chem. Phys., 17, 7827–7837, https://doi.org/10.5194/acp-17-7827-2017, 2017.
Abdelmonem, A., Backus, E. H. G., and Bonn, M.: Ice Nucleation at the Water–Sapphire Interface: Transient Sum-Frequency Response without Evidence for Transient Ice Phase, J. Phys. Chem. C, 122, 24760–24764, https://doi.org/10.1021/acs.jpcc.8b07480, 2018.
Abdelmonem, A., Ratnayake, S., and Lützenkirchen, J.: Melting_Peak-Hump.avi, Figshare, https://doi.org/10.6084/m9.figshare.9878369.v1, 2019.
Anim-Danso, E., Zhang, Y., Alizadeh, A., and Dhinojwala, A.: Freezing of Water Next to Solid Surfaces Probed by Infrared-Visible Sum Frequency Generation Spectroscopy, J. Am. Chem. Soc., 135, 2734–2740, https://doi.org/10.1021/ja311648q, 2013.
Anim-Danso, E., Zhang, Y., and Dhinojwala, A.: Surface Charge Affects the Structure of Interfacial Ice, J. Phys. Chem. C, 120, 3741–3748, https://doi.org/10.1021/acs.jpcc.5b08371, 2016.
Azam, M. S., Weeraman, C. N., and Gibbs-Davis, J. M.: Specific Cation Effects on the Bimodal Acid–Base Behavior of the Silica/Water Interface, J. Phys. Chem. Lett., 3, 1269–1274, https://doi.org/10.1021/jz300255x, 2012.
Azam, M. S., Weeraman, C. N., and Gibbs-Davis, J. M.: Halide-Induced Cooperative Acid–Base Behavior at a Negatively Charged Interface, J. Phys. Chem. C, 117, 8840–8850, https://doi.org/10.1021/jp401164r, 2013.
Bandura, A. V. and Lvov, S. N.: The Ionization Constant of Water over Wide Ranges of Temperature and Density, J. Phys. Chem. Ref. Data, 35, 15–30, https://doi.org/10.1063/1.1928231, 2006.
Bergna, H. E. and Roberts, W. O.: Colloidal Silica: Fundamentals and Applications, Surfactant Science, CRC Press, Boca Raton, 2005.
Boamah, M. D., Ohno, P. E., Geiger, F. M., and Eisenthal, K. B.: Relative permittivity in the electrical double layer from nonlinear optics, J. Chem. Phys., 148, 222808, https://doi.org/10.1063/1.5011977, 2018.
Brown, M. A., Goel, A., and Abbas, Z.: Effect of Electrolyte Concentration on the Stern Layer Thickness at a Charged Interface, Angew. Chem. Int. Edit., 55, 3790–3794, https://doi.org/10.1002/anie.201512025, 2016.
Coluzza, I., Creamean, J., Rossi, M. J., Wex, H., Alpert, P. A., Bianco, V., Boose, Y., Dellago, C., Felgitsch, L., Frohlich-Nowoisky, J., Herrmann, H., Jungblut, S., Kanji, Z. A., Menzl, G., Moffett, B., Moritz, C., Mutzel, A., Poschl, U., Schauperl, M., Scheel, J., Stopelli, E., Stratmann, F., Grothe, H., and Schmale, D. G.: Perspectives on the Future of Ice Nucleation Research: Research Needs and Unanswered Questions Identified from Two International Workshops, Atmosphere, 8, 138, https://doi.org/10.3390/atmos8080138, 2017.
Cox, J. R., Ferris, L. A., and Thalladi, V. R.: Selective Growth of a Stable Drug Polymorph by Suppressing the Nucleation of Corresponding Metastable Polymorphs, Angew. Chem. Int. Edit., 46, 4333–4336, https://doi.org/10.1002/anie.200605257, 2007.
Cox, S. J., Raza, Z., Kathmann, S. M., Slater, B., and Michaelides, A.: The microscopic features of heterogeneous ice nucleation may affect the macroscopic morphology of atmospheric ice crystals, Faraday Discuss., 167, 389–403, https://doi.org/10.1039/c3fd00059a, 2013.
Dalstein, L., Potapova, E., and Tyrode, E.: The elusive silica/water interface: isolated silanols under water as revealed by vibrational sum frequency spectroscopy, Phys. Chem. Chem. Phys., 19, 10343–10349, https://doi.org/10.1039/c7cp01507k, 2017.
Darlington, A. M., Jarisz, T. A., DeWalt-Kerian, E. L., Roy, S., Kim, S., Azam, M. S., Hore, D. K., and Gibbs, J. M.: Separating the pH-Dependent Behavior of Water in the Stern and Diffuse Layers with Varying Salt Concentration, J. Phys. Chem. C, 121, 20229–20241, https://doi.org/10.1021/acs.jpcc.7b03522, 2017.
DeWalt-Kerian, E. L., Kim, S., Azam, M. S., Zeng, H., Liu, Q., and Gibbs, J. M.: pH-Dependent Inversion of Hofmeister Trends in the Water Structure of the Electrical Double Layer, J. Phys. Chem. Lett., 8, 2855–2861, https://doi.org/10.1021/acs.jpclett.7b01005, 2017.
Döppenschmidt, A., Kappl, M., and Butt, H.-J.: Surface Properties of Ice Studied by Atomic Force Microscopy, J. Phys. Chem. B, 102, 7813–7819, https://doi.org/10.1021/jp981396s, 1998.
Dove, P. M. and Craven, C. M.: Surface charge density on silica in alkali and alkaline earth chloride electrolyte solutions, Geochim. Cosmochim. Ac., 69, 4963–4970, https://doi.org/10.1016/j.gca.2005.05.006, 2005.
Fordyce, A. J., Bullock, W. J., Timson, A. J., Haslam, S., Spencer-Smith, R. D., Alexander, A., and Frey, J. G.: The temperature dependence of surface second-harmonic generation from the air-water interface, Mol. Phys., 99, 677–687, https://doi.org/10.1080/00268970010030022, 2001.
Gibbs-Davis, J. M., Kruk, J. J., Konek, C. T., Scheidt, K. A., and Geiger, F. M.: Jammed Acid-Base Reactions at Interfaces, J. Am. Chem. Soc., 130, 15444–15447, https://doi.org/10.1021/ja804302s, 2008.
Goh, M. C., Hicks, J. M., Kemnitz, K., Pinto, G. R., Heinz, T. F., Eisenthal, K. B., and Bhattacharyya, K.: Absolute orientation of water molecules at the neat water surface, J. Phys. Chem., 92, 5074–5075, https://doi.org/10.1021/j100329a003, 1988.
Harrison, A. D., Whale, T. F., Carpenter, M. A., Holden, M. A., Neve, L., O'Sullivan, D., Vergara Temprado, J., and Murray, B. J.: Not all feldspars are equal: a survey of ice nucleating properties across the feldspar group of minerals, Atmos. Chem. Phys., 16, 10927–10940, https://doi.org/10.5194/acp-16-10927-2016, 2016.
Hiemstra, T. and van Riemsdijk, W. H.: Multiple activated complex dissolution of metal (hydr) oxides: A thermodynamic approach applied to quartz, J. Colloid Interf. Sci., 136, 132–150, https://doi.org/10.1016/0021-9797(90)90084-2, 1990.
Holden, M. A., Whale, T. F., Tarn, M. D., O'Sullivan, D., Walshaw, R. D., Murray, B. J., Meldrum, F. C., and Christenson, H. K.: High-speed imaging of ice nucleation in water proves the existence of active sites, Sci. Adv., 5, eaav4316, https://doi.org/10.1126/sciadv.aav4316, 2019.
Hoose, C. and Möhler, O.: Heterogeneous ice nucleation on atmospheric aerosols: a review of results from laboratory experiments, Atmos. Chem. Phys., 12, 9817–9854, https://doi.org/10.5194/acp-12-9817-2012, 2012.
Iler, R. K.: The Chemistry of Silica: Solubility, Polymerization, Colloid and Surface Properties and Biochemistry of Silica, John Wiley & Sons Inc., New York, 1979.
Jang, J. H., Lydiatt, F., Lindsay, R., and Baldelli, S.: Quantitative Orientation Analysis by Sum Frequency Generation in the Presence of Near-Resonant Background Signal: Acetonitrile on Rutile TiO2 (110), J. Phys. Chem. A, 117, 6288–6302, https://doi.org/10.1021/jp401019p, 2013.
Jena, K. C. and Hore, D. K.: Variation of Ionic Strength Reveals the Interfacial Water Structure at a Charged Mineral Surface, J. Phys. Chem. C, 113, 15364–15372, https://doi.org/10.1021/jp905475m, 2009.
Jena, K. C., Covert, P. A., and Hore, D. K.: The Effect of Salt on the Water Structure at a Charged Solid Surface: Differentiating Second- and Third-order Nonlinear Contributions, J. Phys. Chem. Lett., 2, 1056–1061, https://doi.org/10.1021/jz200251h, 2011.
Karlsson, M., Craven, C., Dove, P. M., and Casey, W. H.: Surface Charge Concentrations on Silica in Different 1.0 M Metal-Chloride Background Electrolytes and Implications for Dissolution Rates, Aquat. Geochem., 7, 13–32, https://doi.org/10.1023/a:1011377400253, 2001.
Kiselev, A., Bachmann, F., Pedevilla, P., Cox, S. J., Michaelides, A., Gerthsen, D., and Leisner, T.: Active sites in heterogeneous ice nucleation – the example of K-rich feldspars, Science, 355, 367–371, https://doi.org/10.1126/science.aai8034, 2017.
Li, Y. and Somorjai, G. A.: Surface Premelting of Ice, J. Phys. Chem. C, 111, 9631–9637, https://doi.org/10.1021/jp071102f, 2007.
Lis, D., Backus, E. H. G., Hunger, J., Parekh, S. H., and Bonn, M.: Liquid flow along a solid surface reversibly alters interfacial chemistry, Science, 344, 1138–1142, https://doi.org/10.1126/science.1253793, 2014.
Lovering, K. A., Bertram, A. K., and Chou, K. C.: Transient Phase of Ice Observed by Sum Frequency Generation at the Water/Mineral Interface During Freezing, J. Phys. Chem. Lett., 8, 871–875, https://doi.org/10.1021/acs.jpclett.6b02920, 2017.
Luca, A. A. T., Hebert, P., Brevet, P. F., and Girault, H. H.: Surface second-harmonic generation at air/solvent and solvent/solvent interfaces, J. Chem. Soc. Faraday T., 91, 1763–1768, https://doi.org/10.1039/ft9959101763, 1995.
Lützenkirchen, J. and Behra, P.: On the surface precipitation model for cation sorption at the (hydr)oxide water interface, Aquat. Geochem., 1, 375–397, https://doi.org/10.1007/bf00702740, 1995.
Morag, J., Dishon, M., and Sivan, U.: The Governing Role of Surface Hydration in Ion Specific Adsorption to Silica: An AFM-Based Account of the Hofmeister Universality and Its Reversal, Langmuir, 29, 6317–6322, https://doi.org/10.1021/la400507n, 2013.
Nagata, Y., Hama, T., Backus, E. H. G., Mezger, M., Bonn, D., Bonn, M., and Sazaki, G.: The Surface of Ice under Equilibrium and Nonequilibrium Conditions, Accounts Chem. Res., 52, 1006–1015, https://doi.org/10.1021/acs.accounts.8b00615, 2019.
Ohno, P. E., Saslow, S. A., Wang, H.-F., Geiger, F. M., and Eisenthal, K. B.: Phase-referenced nonlinear spectroscopy of the α-quartz/water interface, Nat. Commun., 7, 13587, https://doi.org/10.1038/ncomms13587, 2016.
Ong, S., Zhao, X., and Eisenthal, K. B.: Polarization of water molecules at a charged interface: second harmonic studies of the silica/water interface, Chem. Phys. Lett., 191, 327–335, https://doi.org/10.1016/0009-2614(92)85309-X, 1992.
Ostroverkhov, V., Waychunas, G. A., and Shen, Y. R.: Vibrational spectra of water at water/α-quartz (0 0 0 1) interface, Chem. Phys. Lett., 386, 144–148, https://doi.org/10.1016/j.cplett.2004.01.047, 2004.
Ostroverkhov, V., Waychunas, G. A., and Shen, Y. R.: New Information on Water Interfacial Structure Revealed by Phase-Sensitive Surface Spectroscopy, Phys. Rev. Lett., 94, 046102, https://doi.org/10.1103/PhysRevLett.94.046102, 2005.
Parambil, J. V., Poornachary, S. K., Tan, R. B. H., and Heng, J. Y. Y.: Template-induced polymorphic selectivity: the effects of surface chemistry and solute concentration on carbamazepine crystallisation, Cryst. Eng. Comm., 16, 4927–4930, https://doi.org/10.1039/c3ce42622j, 2014.
Rao, Y., Tao, Y.-S., and Wang, H.-F.: Quantitative analysis of orientational order in the molecular monolayer by surface second harmonic generation, J. Chem. Phys., 119, 5226–5236, https://doi.org/10.1063/1.1597195, 2003.
Rehl, B., Rashwan, M., DeWalt-Kerian, E. L., Jarisz, T. A., Darlington, A. M., Hore, D. K., and Gibbs, J. M.: New Insights into χ(3) Measurements: Comparing Nonresonant Second Harmonic Generation and Resonant Sum Frequency Generation at the Silica/Aqueous Electrolyte Interface, J. Phys. Chem. C, 123, 10991–11000, https://doi.org/10.1021/acs.jpcc.9b01300, 2019.
Rosenberg, R.: Why Is Ice Slippery?, Phys. Today, 5, 50–55, https://doi.org/10.1063/1.2169444, 2005.
Schaefer, J., Gonella, G., Bonn, M., and Backus, E. H. G.: Surface-specific vibrational spectroscopy of the water/silica interface: screening and interference, Phys. Chem. Chem. Phys., 19, 16875–16880, https://doi.org/10.1039/c7cp02251d, 2017.
Schaefer, J., Backus, E. H. G., and Bonn, M.: Evidence for auto-catalytic mineral dissolution from surface-specific vibrational spectroscopy, Nat. Commun., 9, 3316, https://doi.org/10.1038/s41467-018-05762-9, 2018.
Schrader, A. M., Monroe, J. I., Sheil, R., Dobbs, H. A., Keller, T. J., Li, Y., Jain, S., Shell, M. S., Israelachvili, J. N., and Han, S.: Surface chemical heterogeneity modulates silica surface hydration, P. Natl. Acad. Sci. USA, 115, 2890–2895, https://doi.org/10.1073/pnas.1722263115, 2018.
Seidel, A., Löbbus, M., Vogelsberger, W., and Sonnefeld, J.: The kinetics of dissolution of silica “Monospher” into water at different concentrations of background electrolyte, Solid State Ionics, 101–103, 713–719, https://doi.org/10.1016/S0167-2738(97)00289-0, 1997.
Shen, Y. R.: Optical Second Harmonic Generation at Interfaces, Annu. Rev. Phys. Chem., 40, 327–350, https://doi.org/10.1146/annurev.pc.40.100189.001551, 1989.
Sosso, G. C., Chen, J., Cox, S. J., Fitzner, M., Pedevilla, P., Zen, A., and Michaelides, A.: Crystal Nucleation in Liquids: Open Questions and Future Challenges in Molecular Dynamics Simulations, Chem. Rev., 116, 7078–7116, https://doi.org/10.1021/acs.chemrev.5b00744, 2016.
Steiner, A. L., Mermelstein, D., Cheng, S. J., Twine, T. E., and Oliphant, A.: Observed Impact of Atmospheric Aerosols on the Surface Energy Budget, Earth Interact., 17, 1–22, https://doi.org/10.1175/2013ei000523.1, 2013.
Wang, B., Knopf, D. A., China, S., Arey, B. W., Harder, T. H., Gilles, M. K., and Laskin, A.: Direct observation of ice nucleation events on individual atmospheric particles, Phys. Chem. Chem. Phys., 18, 29721–29731, https://doi.org/10.1039/c6cp05253c, 2016.
Whale, T. F., Holden, M. A., Wilson, T. W., O'Sullivan, D., and Murray, B. J.: The enhancement and suppression of immersion mode heterogeneous ice-nucleation by solutes, Chem. Sci., 9, 4142–4151, https://doi.org/10.1039/c7sc05421a, 2018.
Yang, Z., Bertram, A. K., and Chou, K. C.: Why Do Sulfuric Acid Coatings Influence the Ice Nucleation Properties of Mineral Dust Particles in the Atmosphere?, J. Phys. Chem. Lett., 2, 1232–1236, https://doi.org/10.1021/jz2003342, 2011.
Zhao, X., Ong, S., and Eisenthal, K. B.: Polarization of water molecules at a charged interface. Second harmonic studies of charged monolayers at the air/water interface, Chem. Phys. Lett., 202, 513–520, https://doi.org/10.1016/0009-2614(93)90041-X, 1993.
Zhuang, X., Miranda, P. B., Kim, D., and Shen, Y. R.: Mapping Molecular Orientation and Conformation at Interfaces by Surface Nonlinear Optics, Phys. Rev. B, 59, 12632–12640, https://doi.org/10.1103/PhysRevB.59.12632, 1999.
Zipori, A., Reicher, N., Erel, Y., Rosenfeld, D., Sandler, A., Knopf, D. A., and Rudich, Y.: The Role of Secondary Ice Processes in Midlatitude Continental Clouds, J. Geophys. Res.-Atmos., 123, 12762–12777, https://doi.org/10.1029/2018jd029146, 2018.
Zobrist, B., Marcolli, C., Peter, T., and Koop, T.: Heterogeneous Ice Nucleation in Aqueous Solutions:? the Role of Water Activity, J. Phys. Chem. A, 112, 3965–3975, https://doi.org/10.1021/jp7112208, 2008.
Zumdahl, S. S.: Chemistry, 3rd Edn., DC Heath Canada, Lexington, MA, USA, 1123 pp., 1993.