the Creative Commons Attribution 4.0 License.
the Creative Commons Attribution 4.0 License.
 | 08 Aug 2019
The remote sensing of radiative forcing by light-absorbing particles (LAPs) in seasonal snow over northeastern China
Wei Pu
Jiecan Cui
Tenglong Shi
Xuelei Zhang
Cenlin He
Light-absorbing particles (LAPs) deposited on snow can decrease snow albedo and affect climate through snow-albedo radiative forcing. In this study, we use MODIS observations combined with a snow-albedo model (SNICAR – Snow, Ice, and Aerosol Radiative) and a radiative transfer model (SBDART – Santa Barbara DISORT Atmospheric Radiative Transfer) to retrieve the instantaneous spectrally integrated radiative forcing at the surface by LAPs in snow () under clear-sky conditions at the time of MODIS Aqua overpass across northeastern China (NEC) in January–February from 2003 to 2017. presents distinct spatial variability, with the minimum (22.3 W m−2) in western NEC and the maximum (64.6 W m−2) near industrial areas in central NEC. The regional mean is W m−2 in NEC. The positive (negative) uncertainties of retrieved due to atmospheric correction range from 14 % to 57 % (−14 % to −47 %), and the uncertainty value basically decreases with the increased . We attribute the variations of radiative forcing based on remote sensing and find that the spatial variance of in NEC is 74.6 % due to LAPs and 21.2 % and 4.2 % due to snow grain size and solar zenith angle. Furthermore, based on multiple linear regression, the BC dry and wet deposition and snowfall could explain 84 % of the spatial variance of LAP contents, which confirms the reasonability of the spatial patterns of retrieved in NEC. We validate using in situ radiative forcing estimates. We find that the biases in are negatively correlated with LAP concentrations and range from ∼5 % to ∼350 % in NEC.
- Article
(11436 KB) -
Supplement
(777 KB) - BibTeX
- EndNote


Pure snow is the most strongly reflective natural substance at the surface of the Earth, and seasonal snow covers more than 30 % of the Earth's land area (Painter et al., 1998). Therefore, snow cover has an important impact on the radiation balance of the Earth (Cohen and Rind, 1991). Light-absorbing particles (LAPs), such as black carbon (BC), organic carbon (OC), and mineral dust, deposited on snow can effectively reduce snow albedo (Hadley and Kirchstetter, 2012; He et al., 2017, 2018; Li et al., 2016; Warren, 1982, 1984; Warren and Wiscombe, 1980) and enhance the absorption of solar radiation (Dang et al., 2017; Kaspari et al., 2014; Liou et al., 2011, 2014; Painter et al., 2012b). Warren and Wiscombe (1980) determined that 10 ng g−1 of BC in old snow could reduce the snow albedo by nearly 1 % at 400 nm with a snow grain size of 1000 µm. Jacobson (2004) pointed out that the snow-albedo reduction caused by BC in snow and ice is 0.4 % on a global scale and 1 % in the Northern Hemisphere based on model simulations. LAPs in snow further contribute to alterations in snow morphology, accelerations in snowmelt, and reductions in snow cover (Flanner et al., 2007, 2009; Painter et al., 2013a; Xu et al., 2009). For example, Qian et al. (2009) found that simulated BC-induced snow-albedo perturbations lead to a significant decrease in snow water equivalent by 2–50 mm over the mountains during late winter to early spring in the western United States. Ming at al. (2015) pointed out that widespread albedo decrease and the induced melting of Himalayan snow and ice in the early 21st century are partly caused by LAP deposition, resulting in approximately 10.4 Gt yr−1 of mass loss equivalent of the Hindu Kush, Karakoram, and Himalaya (HKH) glaciers.
Several studies pointed out that the radiative forcing effects of LAPs in snow on local hydrological cycles (Painter et al., 2010; Qian et al., 2009; Yasunari et al., 2010) and regional and global climate (Bond et al., 2013; Hansen and Nazarenko, 2004; He et al., 2014; Jacobson, 2002, 2004; McConnell et al., 2007; Ramanathan and Carmichael, 2008; Yasunari et al., 2015) are non-negligible based on model simulations. In the Northern Hemisphere, Hansen and Nazarenko (2004) illustrated that the radiative forcing of BC on snow and ice albedo is +0.3 W m−2. In addition, the IPCC AR5 (2013) indicated that the impact of BC in snow and ice accounted for a global mean climate forcing of +0.04 W m−2, but the confidence level is low. Bond et al. (2013) estimated climate forcing consisting of radiative forcing, rapid adjustments, and strong snow-albedo feedback due to BC-in-snow forcing and pointed out that the best valuation of climate forcing by BC in snow and sea ice is +0.13 W m−2, with the 90 % uncertainty bounds ranging from +0.04 to +0.33 W m−2. Nevertheless, recent studies reported that ample factors confuse model simulations of BC-in-snow-induced climate forcing, and the model-based estimate of the regional and global radiative forcing caused by BC in snow and ice is still a challenge (Hansen and Nazarenko, 2004; Bond et al., 2013; Pu et al., 2017).
Much of northeastern China (NEC) is covered by contiguous seasonal snow in the winter and early spring. Local pollutant emissions in these regions are some of the most intense in the world (Bond et al., 2004), leading to considerable amounts of LAPs deposited into snow via wet and dry deposition (Bond et al., 2013). Therefore, several field campaigns have been conducted to investigate the LAP concentrations in snow across NEC (Huang et al., 2011; X. Wang et al., 2014, 2015). Wang et al. (2013) conducted a large field campaign to measure LAPs in seasonal snow across northern China from January to February 2010. They found that BC is the dominant absorber compared with OC and dust in NEC, and BC concentrations in seasonal snow range from 40 to 4000 ng g−1, which are much higher than those measured in the Arctic, North America, and Europe (Doherty et al., 2010, 2014; Peltoniemi et al., 2015). Recently, Wang et al. (2017) showed that LAPs can reduce the visible spectral albedo by ∼0.35 in NEC based on in situ measurements and model simulations, which indicated a significant impact of LAPs on snow-albedo reduction. Zhao et al. (2014) simulated radiative forcing by LAPs in snow over northern China using a coupled model, and they noted that the uncertainties of their results are non-negligible due to limited observations.
Remote sensing is considered to be a powerful tool for estimating snow physical properties (e.g., Nolin and Dozier, 1993, 2000). Snow spectral albedo is highly dependent on wavelength λ. The albedo of pure snow is extremely high at visible (VIS) wavelengths (∼0.99 at λ=500 nm) but drops to a very low level in the near infrared (NIR; λ>1000 nm), where the imaginary part of the complex refractive index for ice is orders of magnitude greater than that in the VIS wavelengths (Wiscombe and Warren, 1980). The NIR albedo is sensitive to snow grain size; as grain size increases, the photon paths through ice get longer so there is a greater absorption probability. The NIR albedo is also sensitive to solar zenith angle: at low sun a photon's first scattering event occurs closer to the surface so it is more likely to escape (Wiscombe and Warren, 1980; Warren, 2013). Previous studies have successfully retrieved snow grain size using satellite NIR albedo data and radiative transfer models (e.g., Nolin and Dozier, 2000). On the other hand, the VIS albedo of snow is insensitive to grain size and solar zenith angle, which means that natural aging-induced changes in snow grains have little effect on VIS snow albedo. However, the VIS snow albedo is instead sensitive to LAPs in a semi-infinite snowpack. When LAPs such as BC or dust are present, snow albedo decreases primarily in the VIS wavelengths (Ming et al., 2012; Wang et al., 2017). This albedo reduction results from the greater imaginary part of the complex refractive index for LAPs compared with that of the highly transparent ice, which leads to more light absorption (Warren and Wiscombe, 1980). Therefore, the snow spectral albedo derived from satellite remote sensing in the VIS wavelengths can be used to estimate the impact of LAPs on snow albedo, which furthermore provides valuable information for modeling simulations to reduce relative uncertainties. To estimate the influence of mineral dust on snow albedo in the European Alps, Di Mauro et al. (2015) defined a new spectral index, the snow darkening index, based on in situ measured snow spectral reflectance and Landsat 8 Operational Land Imager (OLI) data; they found that the snow darkening index could effectively track the content of mineral dust in snow. In addition, Di Mauro et al. (2017) characterized the impact of LAPs on ice and snow albedo of the Morteratsch Glacier, a large-valley glacier in the Swiss Alps, using satellite (EO-1 Hyperion) hyperspectral data. The results showed that the spatial distribution of both narrowband and broadband indices retrieved from Hyperion was highly correlated with ice and snow impurities. In the Arctic, Dumont et al. (2014) developed an impurity index based on satellite observations (MODIS C5 surface reflectance) to analyze the snow darkening caused by the increased contents of LAPs in snow in Greenland. Nevertheless, Polashenski et al. (2015) pointed out that the apparent snow albedo declines in Greenland observed from MODIS C5 surface reflectance (Dumont et al., 2014) have a significant contribution from uncorrected Terra sensor degradation. In this study, in order to prevent interference from sensor degradation, we used the latest version (version 6, C6) of MODIS data from the Aqua sensor, which does not suffer from the influence of sensor degradation (Polashenski et al., 2015). Even though these studies have confirmed the ability of remote sensing to assess the role of LAPs in snow-albedo reduction, they did not quantitatively estimate the radiative forcing due to LAPs in snow, which is extremely important for inferring the impact of LAPs on regional and global climate. Recently, Ming et al. (2012) estimated the radiative forcing in Himalayan glaciers based on the differences between the simulated pristine albedo and the satellite observation albedo, which could be partly attributed to BC and dust. The results illustrated that the current surface radiation absorption could lead to significant melting in Himalayan glaciers, which could cause most of them to be in danger of rapid mass loss. Furthermore, Painter et al. (2012a) successfully used the MODIS Dust Radiative Forcing in Snow (MODDRFS) model to retrieve surface radiative forcing by LAPs in snow cover from Moderate Resolution Imaging Spectroradiometer (MODIS) surface reflectance data. They found that instantaneous at-surface radiative forcing can be beyond 250 W m−2 in the Hindu Kush–Himalaya area and falls in a range of 30–250 W m−2 in the upper Colorado River Basin. Painter et al. (2013b) also provided and validated an algorithm suite to quantitatively retrieve radiative forcing by LAPs in snow from Airborne Visible/Infrared Imaging Spectrometer (AVIRIS) data in the Senator Beck Basin Study Area (SBBSA), SW Colorado, USA. The lowest radiative forcing was found on the high north-facing slopes, while the highest was on southeast-facing slopes at the lowest elevations. Seidel et al. (2016) analyzed the spatial and temporal distribution of radiative forcing by LAPs in snow in the Sierra Nevada and Rocky Mountains from imaging spectroscopy. Their results presented an increased radiative forcing from 20 up to 200 W m−2 in the melting period. Warren (2013) also indicated that attempts to use satellite remote sensing to estimate the radiative forcing by LAPs in polluted regions are likely feasible. However, to date, no studies have quantitatively investigated the contributions of each factor to the variations of radiative forcing by LAPs in snow based on remote sensing. Moreover, the radiative forcing by LAPs in snow across NEC is far less studied by using satellite remote sensing, even though the LAP contents in these regions are much higher compared with those in the Arctic, Europe, and the USA (Dang et al., 2017).
Estimating the radiative forcing by LAPs in snow by using surface measurements is more precise than using remote sensing or model simulation. However, surface measurements of snow albedo and LAP content in snow are very limited on regional or global scales. Until now, the observational sample sites (<50) have been sparse and only for two individual measurements in 2010 and 2014 over a wide NEC area of ∼1.5 million km2 (X. Wang et al., 2013, 2017; Z. W. Wang et al., 2014; Ren et al., 2017). The very limited number of measurement sites led to poor spatial–temporal distribution of the estimated radiative forcing in NEC (Dang et al., 2017). On the other hand, remote sensing technology has the advantage of high spatial–temporal resolution and has been successfully used to retrieve the radiative forcing by in-snow light-absorbing particles in high-snow-cover areas (Painter et al., 2012a). In addition, a previous study indicated that the uncertainty in estimating radiative forcing using model simulations is very high due to limited measurement data (Zhao et al., 2014); however, this could possibly be improved by combining remote-sensing-retrieved results. Hence, estimating the radiative forcing by LAPs in snow by using satellite remote sensing seems to be necessary.
In this study, we attempt to retrieve the radiative forcing by LAPs in snow across NEC using MODIS datasets combined with the Snow, Ice, and Aerosol Radiation (SNICAR) model (Flanner et al., 2007, 2009) and the Santa Barbara DISORT Atmospheric Radiative Transfer (SBDART) model (Ricchiazzi et al., 1998); we estimate the uncertainties of radiative forcing from atmospheric correction and qualify the fractional contribution of each factor to the spatial variance of . Then, we investigate the reasonability of the spatial patterns of retrieved radiative forcing in NEC based on BC deposition and snowfall data. Finally, we quantitatively estimate the biases of MODIS-retrieved radiative forcing using in situ radiative forcing estimates, which are based on snowfield measurements.
2.1 Remote sensing datasets
The latest version (Collection 6) of MODIS surface reflectance data (MYD09GA), MODIS snow cover data (MYD10A1), and MODIS aerosol optical depth (AOD) data (MYD04) is used in this study from 2003 to 2017, which covers the months of January through February (https://modis.gsfc.nasa.gov/, last access: 20 March 2018). The MOD09 product is divided into seven bands (band 1, 620–670 nm; band 2, 841–876 nm; band 3, 459–479 nm; band 4, 545–565 nm; band 5, 1230–1250 nm; band 6, 1628–1652 nm; and band 7, 2105–2155 nm) and has a spatial resolution of 500 m (Vermote, 2015). The MOD09 surface reflectance is an estimate of the surface spectral reflectance for each band, which corrects for the effects of atmospheric gases and aerosols. The performance of the atmospheric correction algorithm suffers from the influence of view and solar zenith angles and aerosol optical thickness; the accuracy of the algorithm is also affected by the wavelengths of different bands. More details about the data products and a band quality description of MOD09GA can be found in the MODIS Surface Reflectance User Guide (https://modis.gsfc.nasa.gov/data/dataprod/mod09.php, last access: 20 March 2018). MODIS satellite data have been widely accepted in retrievals of snow cover and its physical properties (e.g., Scambos et al., 2007; Rittger et al., 2013). In addition, MODIS has three visible bands (VIS) and the radiometric range in the VIS over snow surface has no saturation phenomenon, which provides the ability to detect changes in reflectance in the VIS caused by LAPs in snow (Painter et al., 2012a).
2.2 Surface measurement datasets
Wang et al. (2017) conducted a snow survey across NEC in January 2014. They measured AOD using a Microtops II sun photometer. The Microtops II sun photometer is a portable instrument and measures solar radiance in five spectral wave bands (340, 440, 675, 870, and 936 nm) from which it automatically derives aerosol optical depth (AOD). When the Microtops II sun photometer is well cleaned and well calibrated, its AOD retrievals can be comparable with those of CIMEL sun photometers used in the AERONET network, with uncertainties ranging from 0.01 to 0.02 (Ichoku et al., 2002). The snow albedo and surface solar irradiance were measured using an Analytical Spectral Devices (ASD) spectroradiometer. The ASD spectroradiometer has 3 nm spectral resolution on the visible–near-infrared detector (350–1050 nm, silicon photodiode array) and 10–12 nm resolution on the shortwave infrared detectors (900–2500 nm, InGaAs). Measurements are made by standing “down-sun” of the receptor, taking consecutive scans of downwelling and upwelling radiation. Wuttke et al. (2006) indicated that the ASD spectroradiometer is considered to be the most mobile, capable, and rapid for measuring spectral albedo during short time periods, especially in very cold regions. The cosine error is less than 5 % for solar zenith angles below 85∘ at a wavelength of 320 nm. We use these datasets to validate the snow grain size retrievals and the simulated surface solar irradiance values.
Snow samples were collected at 46 sites in January and February 2010 across northern China (Wang et al., 2013) and at 13 sites in January 2014 across northeastern China (Wang et al., 2017). A detailed description of the procedures of snow collection and filtration has been presented by previous studies (Doherty et al., 2010, 2014; Wang et al., 2013). Briefly, in order to ensure that the collected snow samples are regionally representative and minimize the influence of local emission sources, sample locations are usually chosen at least 1 km upwind of the approach roads and railways and more than 50 km from cities and towns. In addition, efforts are made to collect samples in open areas in order to prevent the contaminations from the detritus of bushes and trees. Generally, snow samples are collected within a vertical resolution varied from ∼2 to 10 cm and usually at typically vertical intervals of 5 cm from the top to the bottom throughout the snowpack depth at each site. In the case of a visibly distinct layering, such as newly fallen snow at the surface layer or a melt layer, the snow at that layer is gathered individually. Right and left snow samples of two side-by-side vertical profiles are collected within each layer to make a comparison and average the snow sample pairs. All snow samples are maintained frozen to prevent the melting snow from influencing the LAP content. Usually every 3 to 4 d, snow samples are filtered at temporary laboratories set up in hotels. Simply, snow samples are melted and filtered through Nuclepore filters of 0.4 µm pore size. The samples “before” and “after” filtration are gathered and refrozen for the following chemical analysis, and the filters are used for optical analysis.
An integrating sphere–integrating sandwich spectrophotometer (ISSW) is applied to analyze the filters and quantify the spectral light absorption by LAPs in snow. ISSW was first described by Grenfell et al. (2011), modified by Wang et al. (2013) and Doherty et al. (2014), and has been used by some previous studies (Dang and Hegg, 2014; Pu et al., 2017; Zhou et al., 2017). Schwarz et al. (2012) have confirmed the performance of ISSW in quantifying LAP concentrations in snow by comparing with a single-particle soot photometer (SP2), although both SP2 and ISSW may suffer from non-negligible uncertainties. Briefly, ISSW produces a diffuse radiation field when white light illumination is transmitted into an integrating sphere; then the diffuse radiation passes through the filter from below and is measured by a spectrometer. By measuring a sample filter and a blank filter, ISSW acquires the light attenuation spectrum due to the loadings on the sample filter (Grenfell et al., 2011). Because the design is such that the measured filter is sandwiched between two integrating spheres, the light attenuation is nominally due to the absorption of LAPs on the filter, and the influence of light scattering is negligible (Doherty et al., 2014). ISSW measures light attenuation from 400 to 700 nm by benefitting from an optimal signal-to-noise ratio and then extends the full spectrum to a range of 350 to 750 nm by extrapolation (Pu et al., 2017). Calibration is done by measuring a set of fullerene (synthetic BC; Alfa Aesar, Inc., Ward Hill, MA, USA) filters with a range of known loadings. Then, the light attenuation spectrum of the sample filter is transformed into an equivalent BC mass loading by comparing against the standard filters. With the loaded area on the filter and the volume of filtered snow water, equivalent BC mass is converted to equivalent BC concentration (BCequiv). In this study, we will use BCequiv for all LAPs to calculate the in situ radiative forcing.
2.3 BC deposition and emission data
BC deposition has important effects on the radiative forcing by LAPs in snow (Seidel et al., 2016). Higher BC deposition indicates that greater amounts of BC are deposited on snow, reducing the snow albedo. To our knowledge, there are no measurement data for the spatial distribution of BC deposition in NEC. Therefore, we collected reanalysis data on BC deposition from the Modern-Era Retrospective Analysis for Research and Applications version 2 (MERRA-2) in January–February from 2003 to 2017 and modeling data on BC deposition from the Coupled Model Intercomparison Project Phase 6 (CMIP6, the latest CMIP phase), including CESM2, CESM2-WACCM, and CNRM-ESM2-1 historical experiments in January–February from 2003 to 2014 (Eyring et al., 2016). So far, only the above three models in CMIP6 have provided BC deposition data. In our study, we prefer to use MERRA-2 data because these data are the latest atmospheric reanalysis data of the modern satellite era produced by NASA's Global Modeling and Assimilation Office (GMAO). They assimilate aerosol observations and other observation types to provide a viable ongoing climate analysis. The provided observable parameters and aerosol diagnostics have wide potential applications ranging from air quality forecasting to aerosol–climate interactions (Bocquet et al., 2015; Randles et al., 2016, 2017). In addition, the period range of MERRA-2 BC deposition data satisfies our study period of 2003–2017, but the CMIP6 data are only updated to 2014. We note that the results and conclusions based on different BC deposition data are similar (see Sect. 4.3).
Local BC emission density can also indicate the LAP contents in snow. Among all available BC emission density data, we use the data from the research group at Peking University (http://inventory.pku.edu.cn/home.html, last access: 15 June 2018; R. Wang et al., 2014) after taking spatial and temporal resolution, data period, data quality, and other factors into account. The BC emission density data we used are for January–February from 2003 to 2014 because they are only updated to 2014.
2.4 Snowfall and snow parameter data
Seidel et al. (2016) pointed out that snowfall can affect the radiative forcing by LAPs in snow. A higher frequency of snowfall implies that greater amounts of fresh snow, which has smaller snow grains than aged snow, are present at the surface, increasing the snow albedo (Z. W. Wang et al., 2014). In this study, we collected four types of snowfall data in January–February from 2003 to 2017, including surface observational data from the China Meteorological Administration (126 observation stations), the ERA-Interim reanalysis (http://apps.ecmwf.int/datasets/data/interim-full-daily/levtype=sfc/, last access: 25 April 2018), the Modern-Era Retrospective Analysis for Research and Applications version 2 (MERRA-2), and the National Centers for Environmental Prediction (NCEP) Climate Prediction Center (CPC) (https://www.esrl.noaa.gov/psd/data/gridded/data.cpc.globalprecip.html, last access: 12 April 2019). Figure S1 in the Supplement shows the spatial distribution of the observational stations over northeastern China. We note that the observation stations are limited in our study areas. Compared with the observed snowfall data, we also assessed snowfall data from the ERA-Interim reanalysis, the MERRA-2 reanalysis, and CPC in NEC. We found that the ERA-Interim reanalysis data are more consistent with surface observations (Fig. S2). Therefore, we prefer to use ERA-Interim for snowfall data in this study. But as with BC deposition data, the results and conclusions based on different snowfall data are similar (see Sect. 4.3).
To briefly describe the snow cover condition in NEC in January–February, we collect multiple types of snow parameter data including snow cover data (MYD10CM and MYD10C2) from MODIS products (https://modis.gsfc.nasa.gov/data/dataprod/mod10.php, last access: 9 April 2019), snow depth data from the Canadian Meteorological Centre (CMC) (https://nsidc.org/data/NSIDC-0447/versions/1, last access: 9 April 2019), and snow water equivalent data (GlobSnow-2) from European Space Agency (ESA) Global Snow Monitoring for Climate Research (http://www.globsnow.info/, last access: 9 April 2019).
3.1 Models
3.1.1 SNICAR model
Flanner et al. (2007) have presented a comprehensive description for the Snow, Ice, and Aerosol Radiative (SNICAR) model, which is the most widely used multilayer snow-albedo model in the field of atmospheric sciences. Here, we just briefly give a summary of SNICAR. SNICAR simulates radiative transfer in the snowpack based on the theory of Wiscombe and Warren (1980) and the two-stream multilayer radiative approximation of Toon et al. (1989). The input optical parameters (mass extinction coefficient, single-scattering albedo, and asymmetry factors) of snow grains and LAPs are offline calculated using Mie theory. In addition, the types of surface spectral distribution (clear or cloudy sky) and incident radiation (direct or diffuse) can be chosen by users, and users must specify the solar zenith angle if the incident flux is direct. In general, users should input the parameters involving the type of surface spectral distribution and incident radiation, number of snow layers, snow thickness, density, snow grain radius, and the type and concentration of LAPs in each snow layer, as well as the albedo of the underlying ground. Following a previous study (Painter et al., 2012a), we assume one-layer semi-infinite snow to drive the SNICAR model in this study.
3.1.2 SBDART model
In this study, we use the Santa Barbara DISORT Atmospheric Radiative Transfer (SBDART) model (Ricchiazzi et al., 1998) to simulate the surface solar irradiance. SBDART is one of the most widely used models to calculate the radiative transfer at the Earth's surface and within the atmosphere in both clear and cloudy sky. SBDART is a combination of the DISORT (Discrete Ordinate Radiative Transfer) radiative transfer module (Stamnes et al., 1988), low-resolution atmospheric transmission models, and Mie theory. The radiative transfer equations for a plane-parallel, vertically inhomogeneous, non-isothermal atmosphere numerically integrated in SBDART are based on DISORT, and light scattering by water droplets and ice crystals is from Mie theory. SBDART already considers all important processes that affect the ultraviolet, visible, and infrared radiation fields. The key components of SBDART include standard atmospheric models, cloud models, extraterrestrial source spectra, gas absorption models, standard aerosol models, and surface models. SBDART is well suited for widespread use in atmospheric radiation and remote sensing studies. More details about the SBDART model can be found in the paper of Ricchiazzi et al. (1998).
3.2 Retrieval methods
In this study we use BC as a representative to describe the effect of LAPs on snow albedo. Figure 1a shows the spectral snow albedo from 300 to 1400 nm. Gray areas show the typical spectral solar irradiance at the time of MODIS Aqua overpass (local time of 13:30) in January–February in NEC; the yellow column bars represent MODIS band passes. We can see that when LAPs such as BC are deposited on snow, they can effectively reduce snow albedo in the visible bands, which contain about half of the total solar radiation. For a snowpack with a snow grain radius of 100–300 µm, 100 ng g−1 of BC in snow (a typical BC concentration in snow of the remote clean areas in NEC) can reduce snow albedo by ∼0.05–0.08 at 500 nm; 1000 ng g−1 of BC in snow (a typical BC concentration in snow of the polluted industrial areas in NEC) can reduce snow albedo by ∼0.12–0.2. On the other hand, the effects of BC decrease at longer wavelengths in the near infrared (NIR). Moreover, when wavelengths exceed 1150 nm, snow albedo is dominated by the snow optical effective radius (Reff) and is independent of LAPs. As shown in Fig. 1b, snow-albedo reduction is not only dependent on LAPs in snow, but also on snow grain size and solar zenith angle (θ). Generally, the reduction in snow albedo caused by BC increases with BC concentration and Reff, whereas it decreases with the solar zenith angle (θ). Based on these characteristics, we retrieve Reff, the reduction in snow albedo, and the radiative forcing by LAPs in this section.
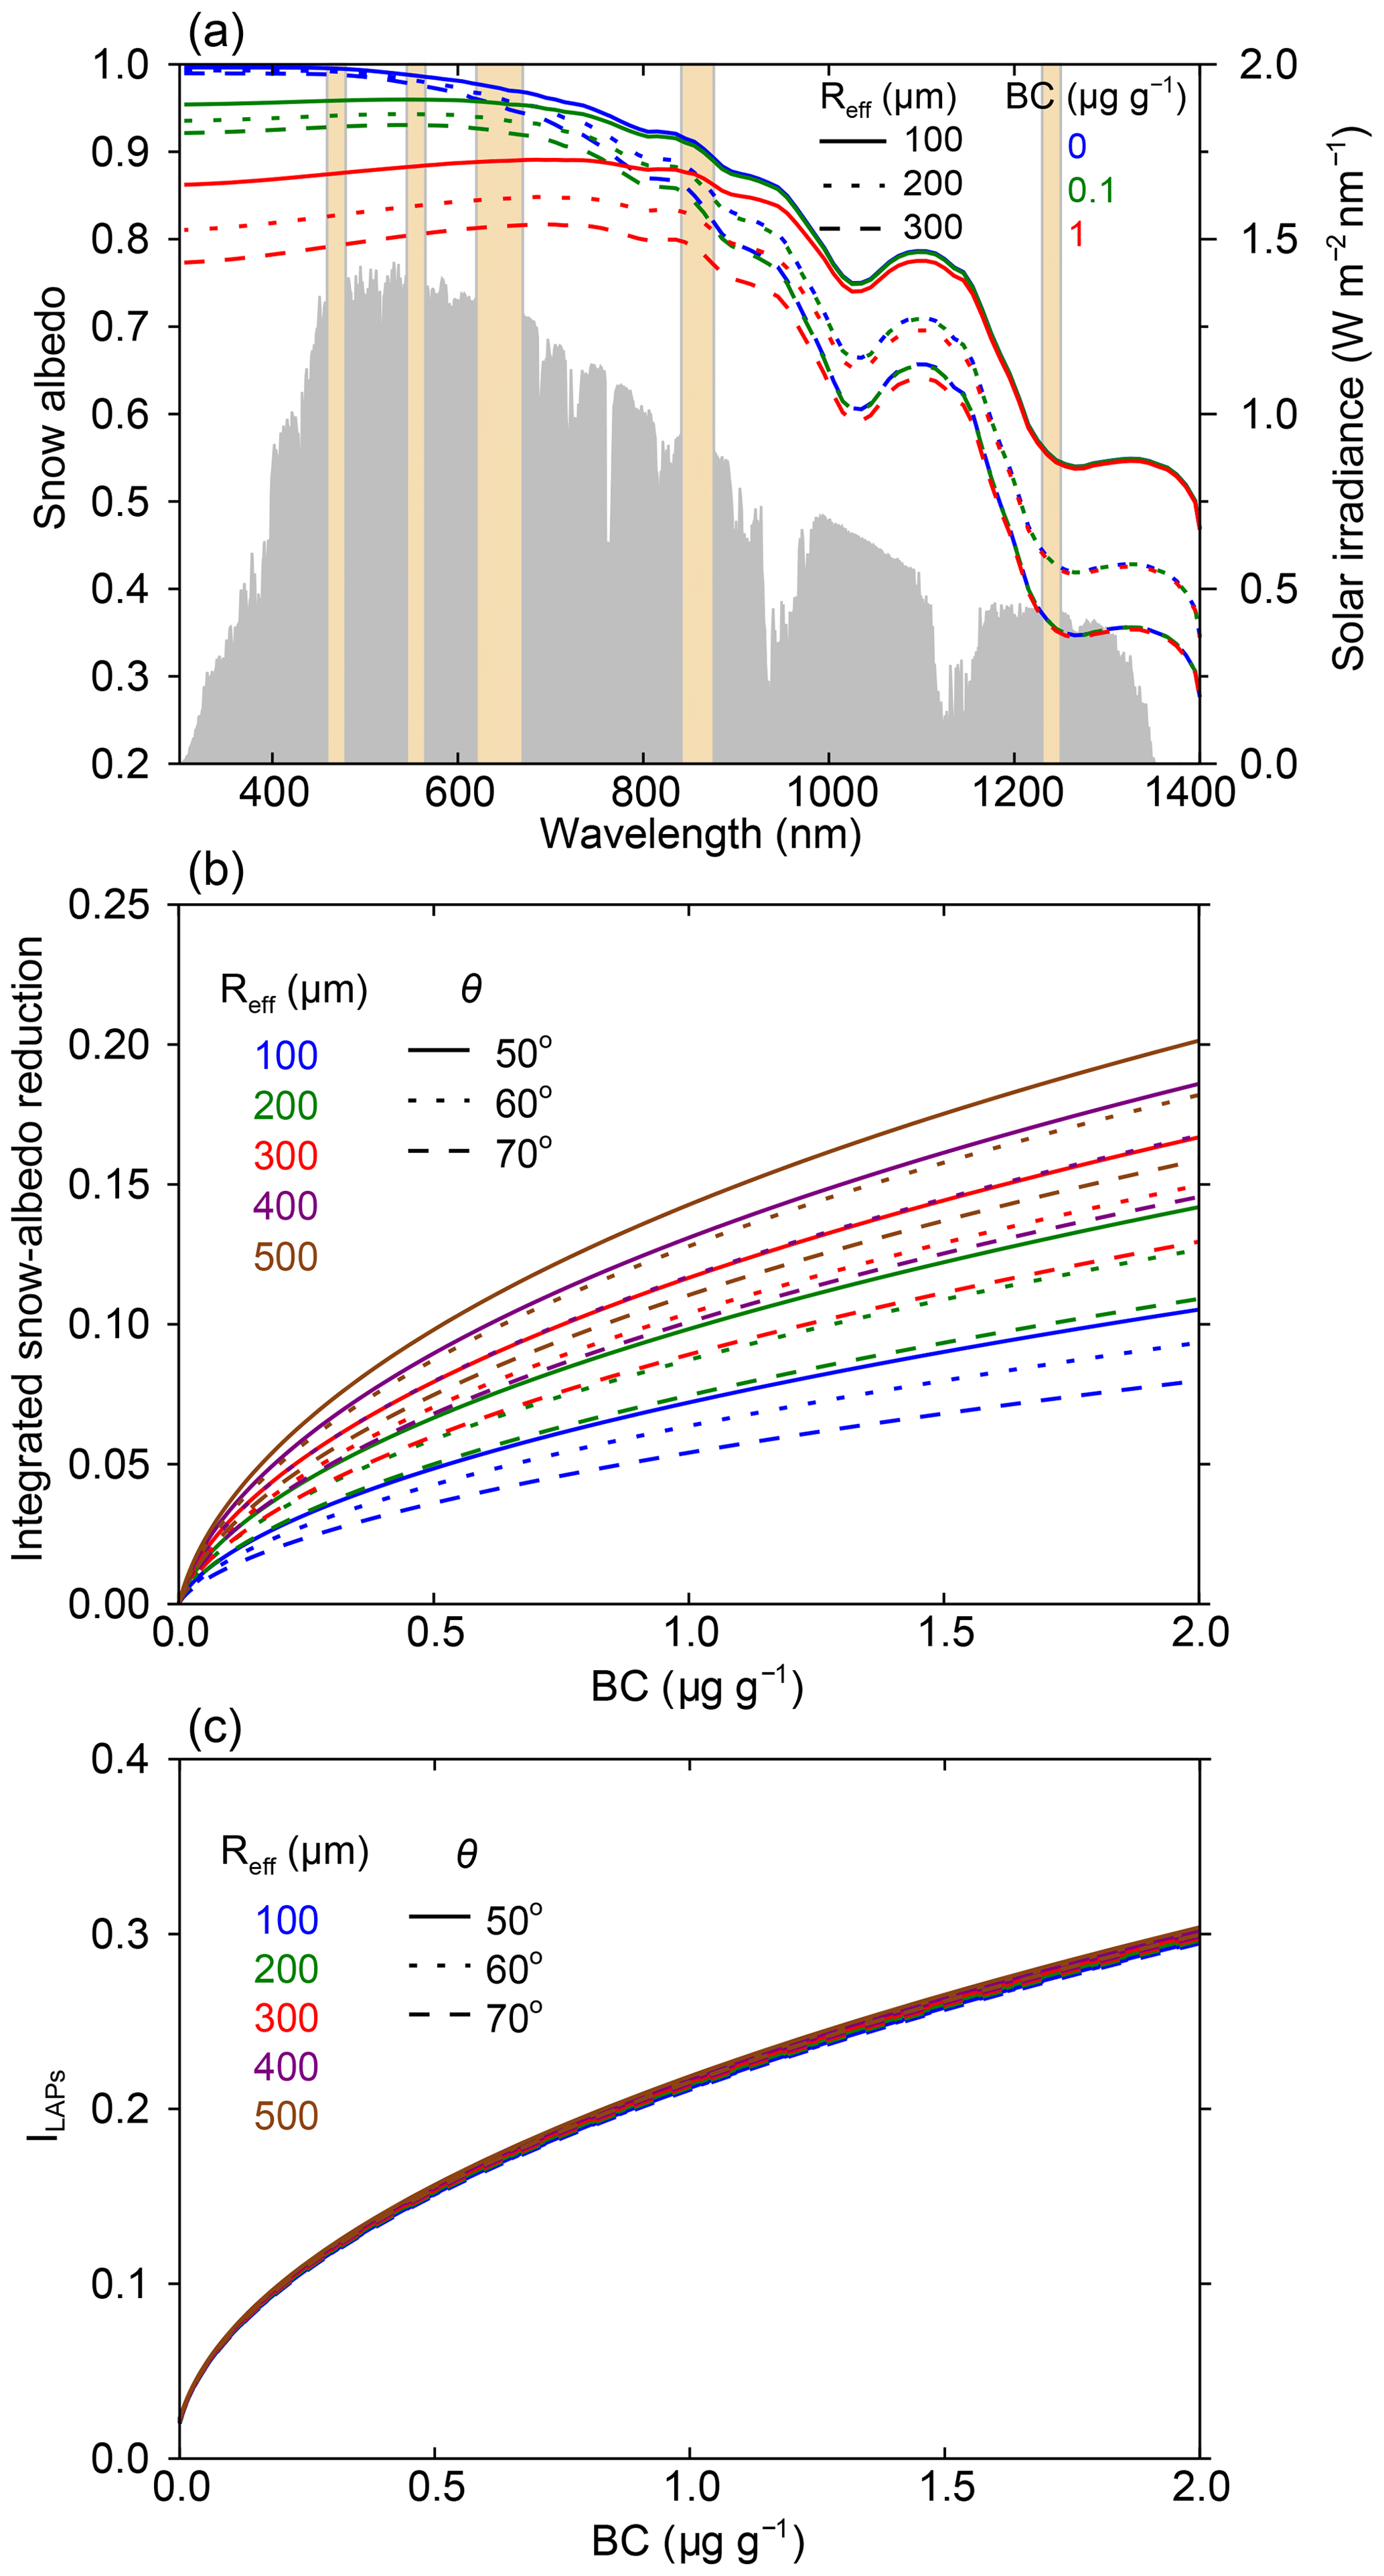
Figure 1(a) The spectral albedo of snow with different Reff values and BC contents simulated using SNICAR. The column bars represent MODIS bands, and the gray areas represent the typical solar irradiance in winter in NEC. (b) The reduction in the 300–1240 nm spectral-weighted integrated snow albedo as a function of BC for different Reff values and solar zenith angles (θ) is simulated using SNICAR. (c) The variations in the impurity index (ILAPs) with BC content are simulated using SNICAR.
3.2.1 Snow cover
Three methods have been widely used in mapping snow-covered area using MODIS data. In the first method, “binary” maps, pixels are classified as either “snow free” or “snow covered” (Hall et al., 1995). However, significant errors exist in such maps, as pixels with a resolution of 500 m are not always completely covered by snow. The second method, the MODSCAG retrieval algorithm, is a fractional snow algorithm that is based on spectral mixture analysis (Painter et al., 2009). However, it cannot be applied in NEC due to limited information on the spectral reflectances of the vegetation, soils, and rock in this region. Therefore, we use the third method, which is based on the reflectances in the visible and NIR bands and the normalized difference snow index (NDSI):
where Rband4 and Rband6 are the surface reflectances in bands 4 and 6. Following Negi and Kokhanovsky (2011), an area is determined to be snow covered if the NDSI and the reflectance in band 4 both exceed 0.6. We note that the following analyses are only done over the defined snow-covered areas and periods.
3.2.2 Retrieval of snow grain size
Many methods have been used to retrieve snow grain size (e.g., Lyapustin et al., 2009; Nolin and Dozier, 1993). However, in NEC, the efficacy of most of these methods is limited, as the reflectances in bands 1–4 are seriously affected by LAPs in polluted snow (Fig. 1a), and the reflectances in bands 6–7 are not sensitive to Reff. Hence, Reff is retrieved at a wavelength of 1240 nm (the central wavelength of band 5) using SNICAR (Wang et al., 2017).
We validate the retrieved Reff values using in situ measurements. The mean absolute error (MAE) is 71 µm, which is slightly higher than that reported by Painter et al. (2009). Nevertheless, the results are still credible because this study investigates a larger spatial scale than the previous study.
3.2.3 Impurity index
To assess LAP contents in snow, we use the surface reflectances in bands 4–5 to derive an impurity index (ILAPs):
This quantity increases with the LAP content but is almost independent of Reff and θ (Fig. 1c). Di Mauro et al. (2017) have successfully used ILAPs to assess the variations of LAP contents in the snow of the Morteratsch Glacier in the Swiss Alps. In this study, we did not retrieve the concentrations of LAPs because such a retrieval is constrained by many unknown factors, such as size distribution, optical properties, and the mixing state of LAPs (He et al., 2017, 2018; Painter et al., 2013a; Pu et al., 2017). Therefore, the conversion from satellite spectra to ground concentrations of LAPs will cause significant errors.
3.2.4 Retrieval of radiative forcing by LAPs in snow
Instantaneous surface solar irradiance at the time of MODIS overpass in January–February is simulated using the SBDART model (Ricchiazzi et al., 1998) with MODIS AOD data as inputs. Wang et al. (2017) have validated the MODIS AOD data using in situ measurements in NEC. For the other inputs, the typical values for midlatitude winter provided by SBDART are used. As a result, the normalized mean bias (NMB) is less than 2 % (Fig. S3).
We estimate the instantaneous spectrally integrated radiative forcing at the surface by LAPs in snow ( under clear-sky conditions at the time of MODIS Aqua overpass, which is a function of solar irradiance and the difference between the MODIS spectral reflectance and a simulated clean-snow ( reflectance (Miller et al., 2016). is simulated using the SNICAR model based on the retrieved Reff and MODIS-derived solar zenith angle (θ). On the other hand, for MODIS spectral reflectance, because MODIS provides only discrete reflectances, we simulate a continuous spectral reflectance by fitting SNICAR to the MODIS data and derive the fitting parameters by minimizing the RMSE (Painter et al., 2009):
where RMSE is the root mean square error, and and represent the simulated and MODIS-derived reflectances at a wavelength λ. Thus, is expressed as follows:
where Eλ is the solar irradiance at a wavelength λ simulated by the SBDART model; Dλ is the difference between the clean-snow ( and simulated reflectances ( at a wavelength λ, and Δλ is 10 nm.
3.2.5 Uncertainties
The uncertainties in radiative forcing retrievals are primarily due to terrain, liquid snow water, snow patchiness, protrusion of vegetation, and atmospheric correction. The study areas are located on smooth plains, and the content of liquid snow water is limited in the study regions in January and February (Wang et al., 2013). Moreover, both experimental and theoretical evidence shows that the effect of liquid water in snow on snow reflectance is small in the shortwave part of the spectrum but obvious at wavelengths of 0.95 and 1.15 µm (O'Brien and Munis, 1975; O'Brien and Koh, 1981; Wiscombe and Warren, 1980), which are not included in the MODIS bands used in our study. As a result, the effect of liquid water in snow on the calculations of snow grain size, ILAPs, and radiative forcing is limited. Therefore, the effects of terrain and liquid snow water on MODIS retrievals could be negligible.
In our study, snow-covered area is determined if the NDSI and the reflectance in band 4 both exceed 0.6, which means that fractional snow cover (FSC) is larger than 0.86 according to the FSC equation () from the MODIS Snow Products Collection 6 User Guide (http://nsidc.org/data/MYD10A1, last access: 20 March 2018). In January and February, snow depth is high and reaches its maximum depth in NEC; snow patchiness in high-snow-cover areas is mostly due to the protrusion of vegetation according to the observations of field campaigns (X. Wang et al., 2013, 2014). Thus, the MODIS-derived surface reflectance () in a pixel of our study areas is not snow reflectance but a mixture of snow and vegetation reflectance. Therefore, we need to correct the errors of snow reflectance caused by the protrusion of vegetation. According to Painter et al. (2009), could be expressed as
where is MODIS-derived surface reflectance at a wavelength λ, and Eλ is solar irradiance at a wavelength λ. FSC is the fractional snow cover, which could be derived according to the FSC equation. and represent snow and vegetation reflectance, respectively, at a wavelength λ. is from the study of Siegmund and Menz (2005). Then could be expressed as
Finally, the accuracy of MODIS surface reflectance (MYD09GA) due to atmospheric correction is typically calculated based on the MODIS Surface Reflectance User Guide (Collection 6; https://modis.gsfc.nasa.gov/data/dataprod/mod09.php, last access: 20 March 2018) as follows:
which is suitable under conditions that AOD is less than 5.0 and θ is less than 75∘. Therefore, we also estimate the uncertainty of MODIS retrievals from atmospheric correction. Briefly, the MODIS-derived snow reflectance (), which takes into account the accuracy of the atmospheric correction, is expressed as
and the fractional uncertainty of MODIS-retrieved snow grain size () could be expressed as
where Reff, uncertainty is the SNICAR-simulated snow grain size using the snow reflectance of . Similar to snow grain size, the fractional uncertainty of ILAPs () and (FURF) is
We note that the positive and negative uncertainty is asymmetric due to the nonlinearity of the SNICAR model.
3.2.6 Attribution of the spatial variance of radiative forcing by LAPs in snow
As discussed above, is dependent on ILAPs (the indicator of LAPs), Reff, and θ and could be expressed as
As a result, the spatial patterns of ILAPs, Reff, and θ determine the spatial pattern of . First, we keep Reff and θ spatially constant with values of the spatial averages ( and . The radiative forcing is only dependent on the distribution of ILAPs:
Similarly, we could obtain two additional equations:
Then is fitted with , , and using multiple linear regression, and the fitted radiative forcing () is expressed as
where a, b, c, and d are regression coefficients. In our study, we find that could explained 99.9 % of the variance of (Fig. S4). Therefore, we can attribute the variance of instead of to estimate the fractional contribution of ILAPs, Reff, and θ to radiative forcing. Equation (15) can be written as
where is the radiative forcing anomaly (). Then, Eq. (16) can be written as
According to Huang et al. (2016) and Huang and Yi (1991), the fractional contribution of ILAPs to the variance of radiative forcing () can be expressed as
where m is the length of the data series. Similarly, we can obtain and FCθ.
3.2.7 Calculation of in situ radiative forcing by LAPs in snow
should be validated with measurements. However, due to the lack of radiative forcing measurements in NEC, we estimate the in situ radiative forcing ( from measured BCequiv values. Briefly, we use SNICAR to calculate the in situ reduction in snow albedo from BCequiv and MODIS-retrieved Reff. Then, the SBDART model is used to estimate .
In January–February, seasonal snow widely covers northeastern China. For example, the area with a snow cover fraction of >50 % and snow duration period of >30 d is ∼75 % and ∼85 %, respectively (Fig. S5a and b), which is consistent with previous studies based on meteorological station data (Zhong et al., 2010) and satellite remote sensing data (Che et al., 2008). In addition, the area with a snow depth of >5 cm and snow water equivalent of >20 mm is ∼70 % and ∼70 %, respectively (Fig. S5c and d).
4.1 The spatial distribution of AOD and BC emissions
Northeastern China usually suffers from heavy local pollutant emissions, with high aerosol mass concentrations in winter (Wiedensohler et al., 2009). Figure 2a shows the spatial distribution of AOD at 550 nm derived from MODIS in NEC. We can find that AOD in the study areas ranges from 0.08 to 0.65 and shows strong spatial inhomogeneity. The largest AOD values are found in industrial areas in south-central NEC, where the largest urban areas in NEC are located with the major cities of Harbin, Changchun, and Shenyang. These areas are associated with the largest pollution emissions and anthropogenic activities in NEC (Wang et al., 2017). By comparison, the MODIS Aqua results show that the AOD in the west of NEC along the border of China is the smallest. Similar patterns of AOD were also found by Zhang et al. (2013) and Zhao et al. (2014). Previous studies indicated that BC represents the primary light-absorbing particles in the atmosphere (Cao et al., 2006) and seasonal snow (Wang et al., 2013). Figure 2b shows the spatial distribution of BC emission density during 2003–2014 in NEC. The pattern of BC emission density is very comparable to AOD, with the highest values of g km−2 month−1 in south-central NEC and the lowest values of g km−2 month−1 in the remote areas of northwestern China. Both the results of AOD and BC emission density imply that the seasonal snow in south-central NEC suffers from abundant BC deposition, and the radiative forcing by LAPs in snow is likely to be highest in NEC.
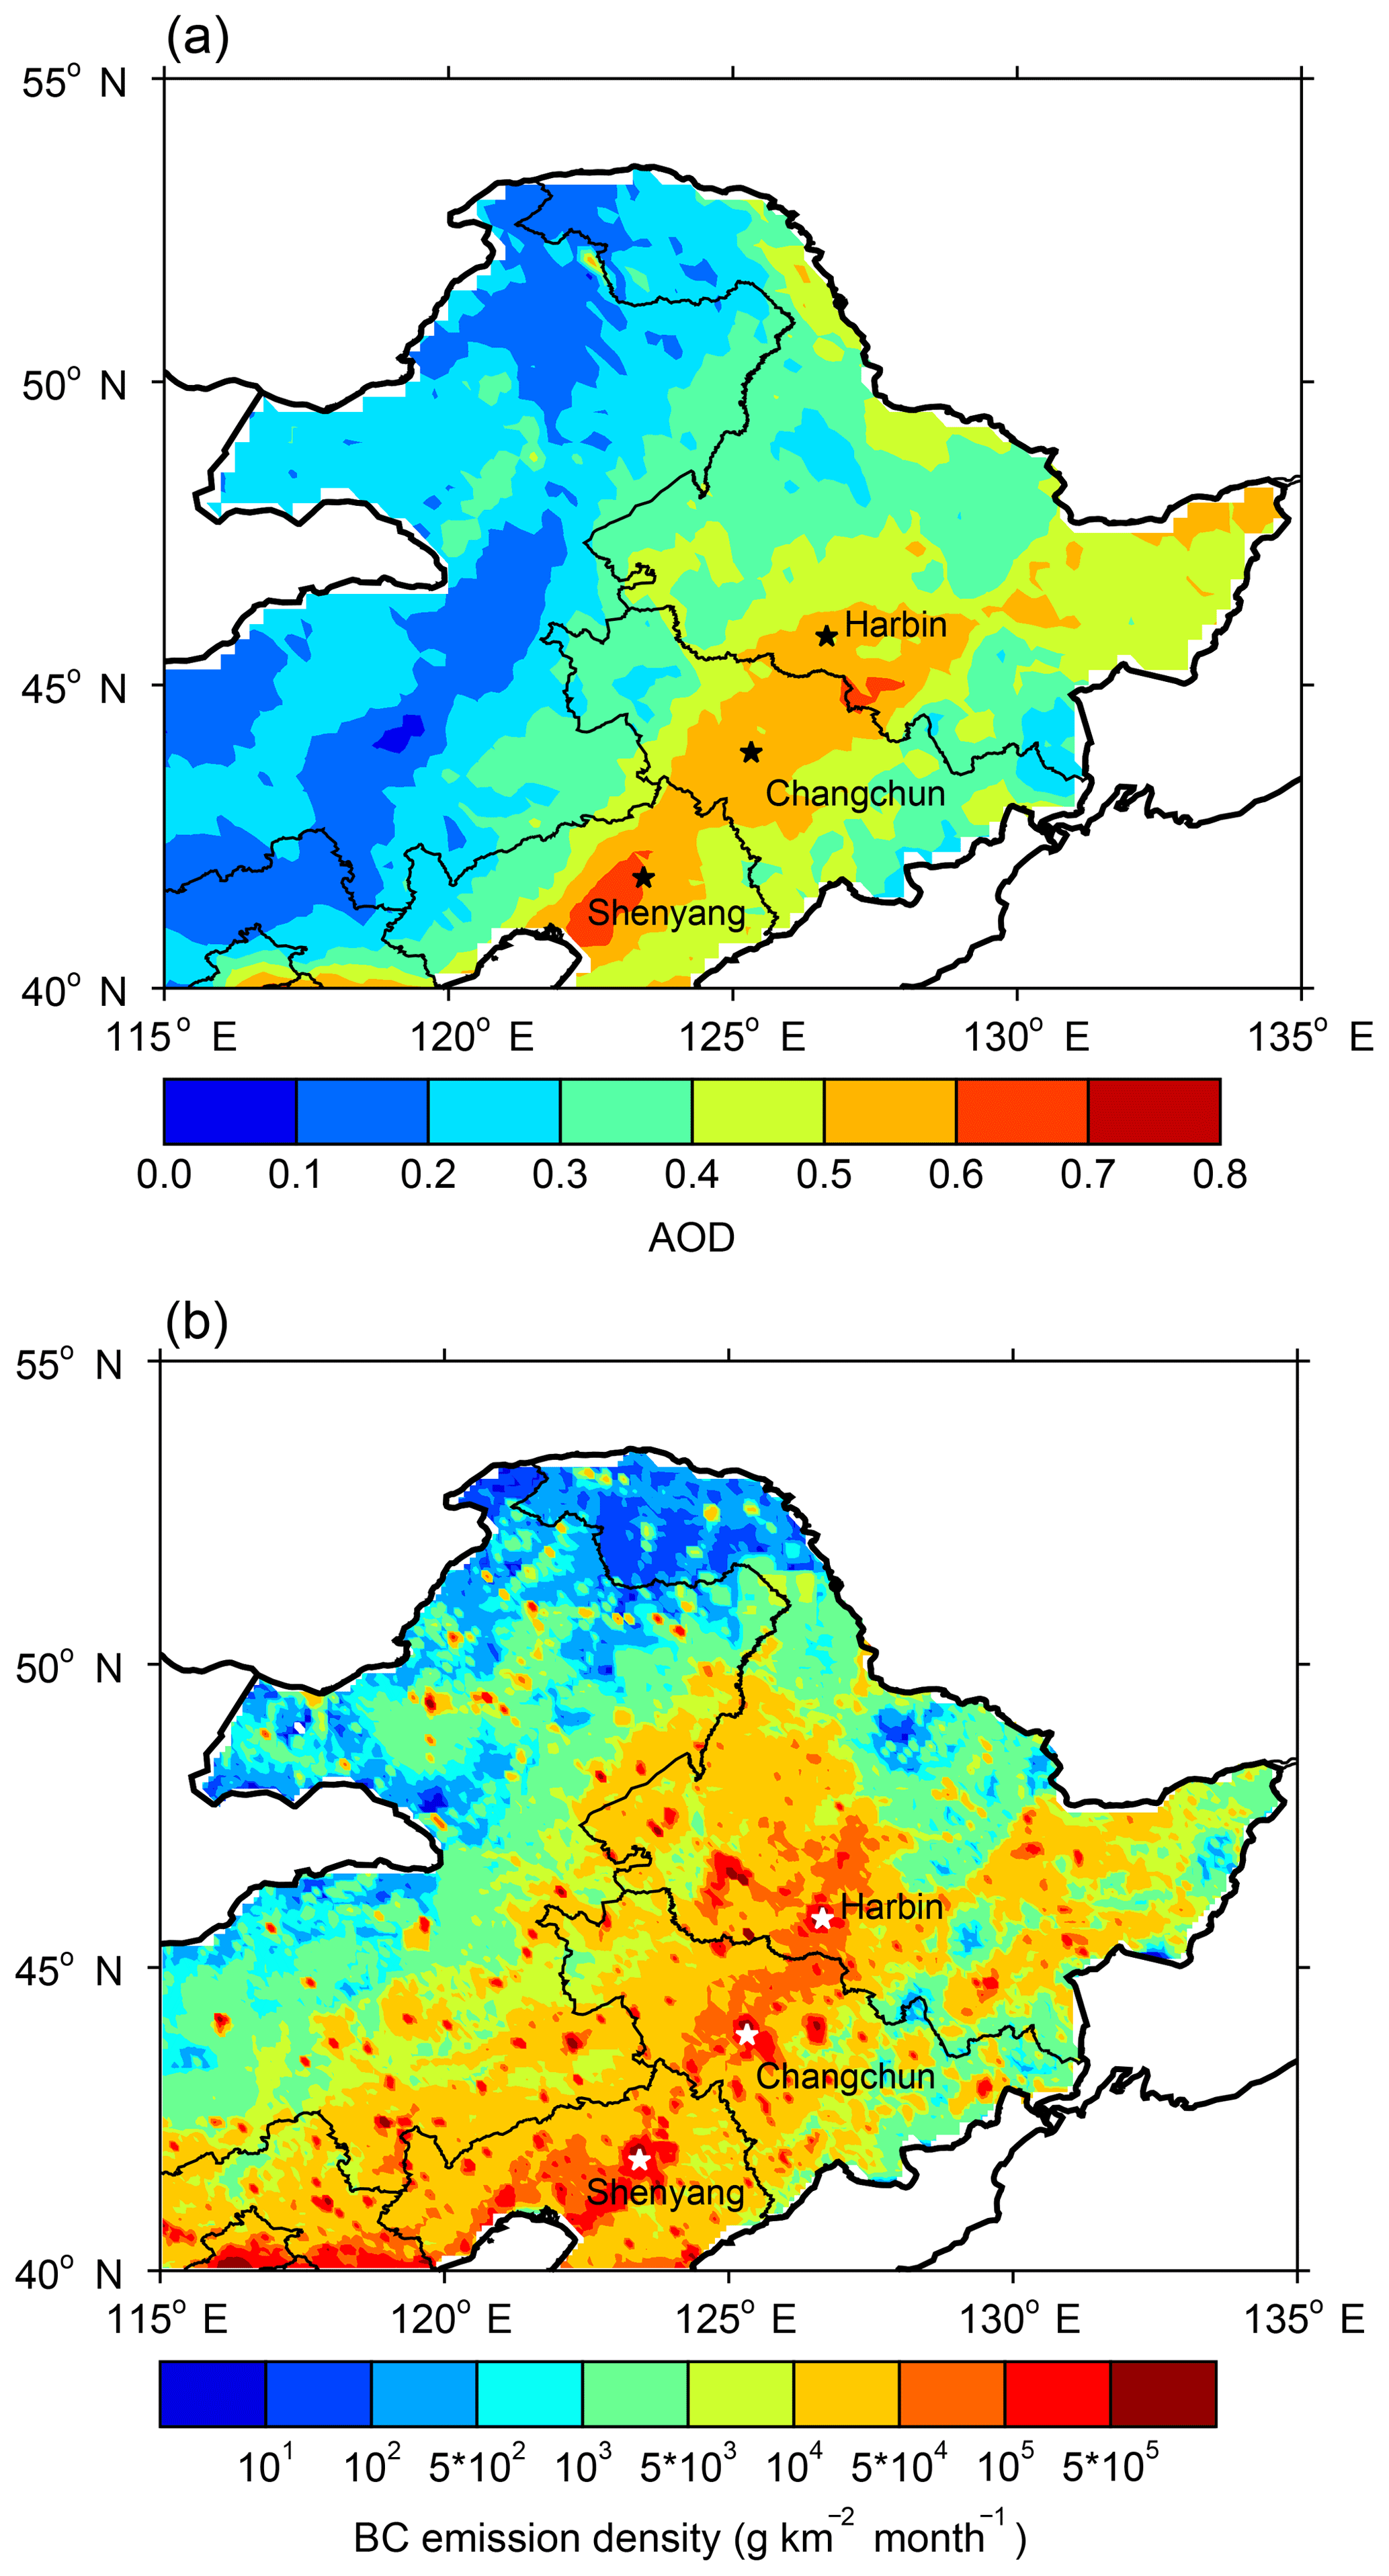
Figure 2Spatial distribution of (a) MODIS AOD at 550 nm and (b) BC emission density in January–February in NEC. AOD data are from 2003 to 2017, and BC emission density data are from the research group at Peking University (http://inventory.pku.edu.cn/home.html, last access: 15 June 2018) from 2003 to 2014. The major cities in NEC are also shown in this figure.
4.2 The spatial distribution of snowfall frequency and land cover types
Snowfall is spatially varied in NEC and has a dominant effect on local fractional snow cover in the defined snow-covered areas, where we retrieved the radiative forcing by LAPs in snow in our study. Figure 3a shows the normalized snowfall frequency in January–February from 2003 to 2017. We can find that the highest snowfall frequency occurred in northwestern and southeastern NEC, where there are forest-covered areas (Fig. 3b). In contrast, the areas from central to southwestern NEC present the lowest snowfall frequency, which means that the fractional snow cover in these areas is likely to be lower than other areas and unable to reach the critical value that we used to define the snow-covered areas. On the other hand, land cover types will also affect the local fractional snow cover. From Fig. 3b, we can find that NEC presents spatially different land cover types; the mainland cover types are grasslands, croplands, and evergreen needleleaf (forests). Grasslands and croplands are mainly located in southwestern NEC and central NEC, respectively, while forests are distributed in northern and southeastern NEC. In our study periods, grasslands and croplands have limited influence on snow cover. However, in forest areas, even those completely covered by deep snow, forest will affect the derived surface reflectance from the MODIS Aqua satellite for the determination of snow-covered areas (further discussion in Sect. 5).

Figure 3Spatial distribution of (a) the normalized snowfall frequency in January–February from 2003 to 2017 and (b) the different land cover types based on MODIS data in NEC. Snowfall data are from the ERA-Interim reanalysis. The major cities in NEC are also shown in this figure.
4.3 Radiative forcing by LAPs in snow
Figure 4 shows the identified snow-covered areas, which are primarily concentrated between 40 and 50∘ N. Consistent with our analysis above, the low-snow-frequency areas of south-central and southwestern NEC and forest-covered areas of northern and southeastern NEC are not identified as snow-covered areas. According to the geographical distribution (Fig. 4a), we separated the studied area into three regions: western NEC (WNEC), central NEC (CNEC), and eastern NEC (ENEC).
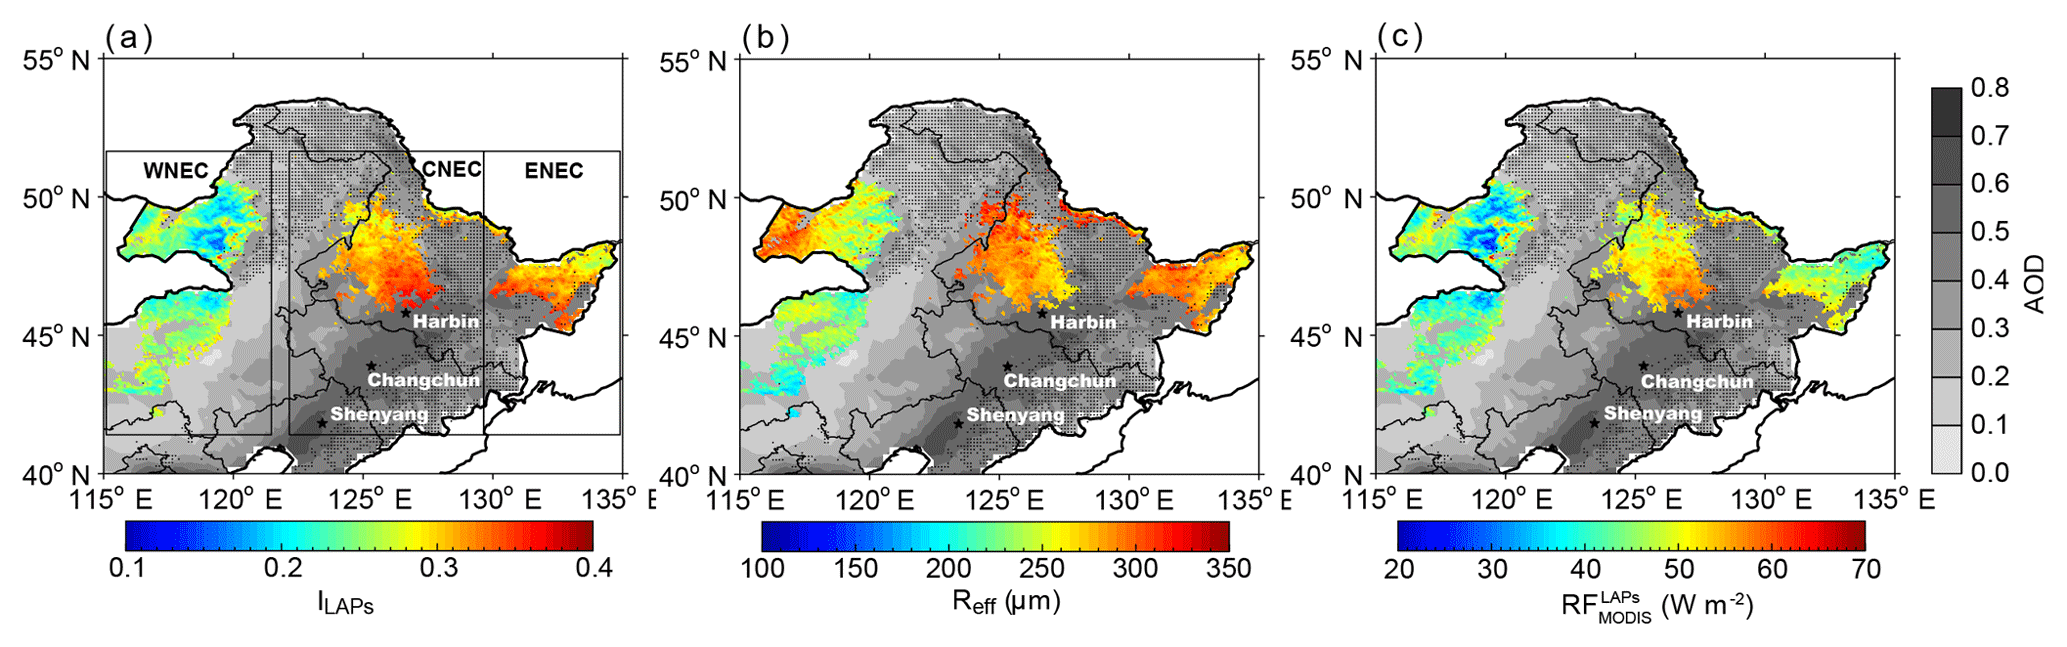
Figure 4The spatial distributions of average (a) ILAPs, (b) Reff, and (c) in NEC in January–February for 2003–2017. The background shows the spatial distribution of MODIS AOD values. The dotted areas are covered by forests. The major cities in NEC are also shown in this figure. According to the geographical distribution, we separate the study area into three regions: western NEC (WNEC), central NEC (CNEC), and eastern NEC (ENEC).
The spatial distributions of ILAPs, Reff, and are displayed in Fig. 4, and their statistics are presented in Fig. 5. On average, ILAPs is , Reff is µm, and is W m−2 in NEC. Regionally, is the largest and shows an average of W m−2 in CNEC, where industrial areas are located close to the largest urban areas in NEC; it therefore suffers from the most serious pollutant emissions among these three regions. ENEC displays the second largest radiative forcing with an average of W m−2. The lowest value of W m−2 occurs in WNEC, where both AOD and BC emission densities are the lowest compared with the other two regions, which is not only due to the low local pollutant emissions, but also because the regional transport into this region in our study period is mostly from the clean northwest and suffers from little influence of human activities (Wang et al., 2015). For the individual regions, presents an increase from north to south in CNEC that ranges from 40.4 to 64.6 W m−2. In ENEC an east–west gradient of is noted that ranges from 35.0 to 62.0 W m−2. The most distinct intra-regional difference is in WNEC, where ranges from 22.3 to 55.5 W m−2. Generally, the patterns are consistent with those of AOD and BC emission density in NEC. Moreover, the spatial pattern of radiative forcing by LAPs in snow in this study is comparable with the results by Zhao et al. (2014), who first estimated the radiative forcing of LAPs in snow through the Weather Research and Forecasting (WRF) model and found that the radiative forcing in industrial source regions such as southern CNEC is obviously much higher than in border regions such as WNEC, which primarily resulted from the spatial differences of LAP dry and wet deposition. Compared with the results from other studies, Seidel et al. (2016) reported a radiative forcing of ∼20 W m−2 in the Sierra Nevada in late February, which is lower than the result in NEC, even though the surface solar irradiance in the Sierra Nevada is higher. Painter et al. (2013b) reported an average radiative forcing of 215±63 W m−2 in the Senator Beck Basin Study Area (SBBSA), SW Colorado, USA, which is approximately 4 times our retrieved radiative forcing near industrial areas in NEC. However, the snow grain size and the surface solar irradiance in their study period are larger than in our study by a factor of >2.5 and >4, respectively. These results indicate an abundant LAP content in the snow of CNEC. The regional and intra-regional patterns of variability in ILAPs are quite similar to those of , which indicates the significant role of LAP content in determining the spatial distribution of radiative forcing; the average values of ILAPs are in CNEC, in ENEC, and in WNEC. In contrast to ILAPs and , Reff displays a smaller spatial variance and presents average values of , , and µm in CNEC, ENCE, and WNEC, respectively. Reff in WNEC is a little smaller compared with those in the other two regions, which is probably due to the higher snowfall frequency because a higher snowfall frequency indicates a longer duration of fresh finer snow at the surface (Wang et al., 2013; Seidel et al., 2016).

Figure 5Statistics of average , ILAPs, and Reff in NEC in January–February from 2003 to 2017.
Figure 6 shows the average uncertainties of ILAPs, Reff, and due to atmospheric correction in NEC in January–February from 2003 to 2017. The positive (negative) uncertainties of retrieved ILAPs and from atmospheric correction are comparable and range from 9 % to 43 % (−10 % to −47 %) and 14 % to 57 % (−14 % to −47 %), respectively. Both ILAPs and show larger uncertainties, as their values are smaller; the positive (negative) uncertainties of ILAPs and are largest in WNEC and show averages of 21 % (−24 %) and 30 % (−28 %), while the lowest uncertainties of 13 % (−15 %) and 20 % (−20 %) for ILAPs and are found in CNEC. It is because the uncertainty of snow albedo from atmospheric correction is almost similar in our study areas to that across the whole NEC region, as discussed in Sect. 3.6; however, the snow-albedo reduction is smaller in clean snow and larger in polluted snow, which results in a larger relative uncertainty of snow-albedo reduction in clean snow and a smaller relative uncertainty in polluted snow according to Eqs. (7) and (8). The positive (negative) uncertainties of Reff are smaller compared with ILAPs and , and they range from 14 % to 18 % (−12 % to −16 %), which is comparable with the errors between MODIS-retrieved and in situ measured snow grain size discussed in Sect. 3.2.2. Moreover, the uncertainties are spatially quite consistent for Reff, which is different from ILAPs and . We note that the positive and negative uncertainties of all ILAPs, Reff, and are asymmetric, which is primarily due to the nonlinear characteristics of radiative transfer in the SNICAR model (Painter et al., 2007).

Figure 6(a) Negative and (b) positive uncertainty of average ILAPs in NEC in January–February from 2003 to 2017. Panels (c) and (d) are similar to (a) and (b), but for Reff. Panels (e) and (f) are similar to (a) and (b), but for . The background shows the spatial distribution of MODIS AOD values. The dotted areas are covered by forests. The major cities in NEC are also shown in this figure.
As discussed in Sect. 3, the spatial distribution of depends on LAPs, Reff, and θ. Previous studies have attempted to retrieve the radiative forcing by LAPs in snow by using remote sensing (e.g., Painter et al., 2012a, 2013b); however, attributions of the spatial variations of radiative forcing by LAPs in snow are sparse and need to be further investigated. Therefore, we would like to qualify the contribution of each factor to the spatial variance of . Combing sensitivity tests and the method of Huang and Yi (1991) as discussed in Sect. 3.2.6, we estimate the fractional contribution of ILAPs (the indicator of LAPs), Reff, and θ to the spatial variance of in our study areas across NEC (Fig. 7). We can find that the contribution from LAPs is largest with a value of 74.6 %, while Reff and θ make contributions of 21.2 % and 4.2 %, respectively, in NEC. The result indicates that the LAP content in snow plays a dominant role in determining the spatial distribution of . Regionally, the contribution of LAPs in WNEC (62.1 %) is smaller than those of 73.9 % and 83.4 % in CNEC and ENEC, while Reff shows a higher contribution of 28.1 % in WNEC than those of 19.6 % and 13.9 % in CNEC and ENEC. The results point out a less important effect of LAPs but a more important effect of Reff on the spatial distribution of in WNEC compared with those in CNEC and ENEC. In addition, the contribution of θ is smaller in ENCE (2.7 %) than those of 9.8 % and 6.5 % in WNEC and CNEC, which is primarily due to the smallest altitude range of ENEC among those three regions.
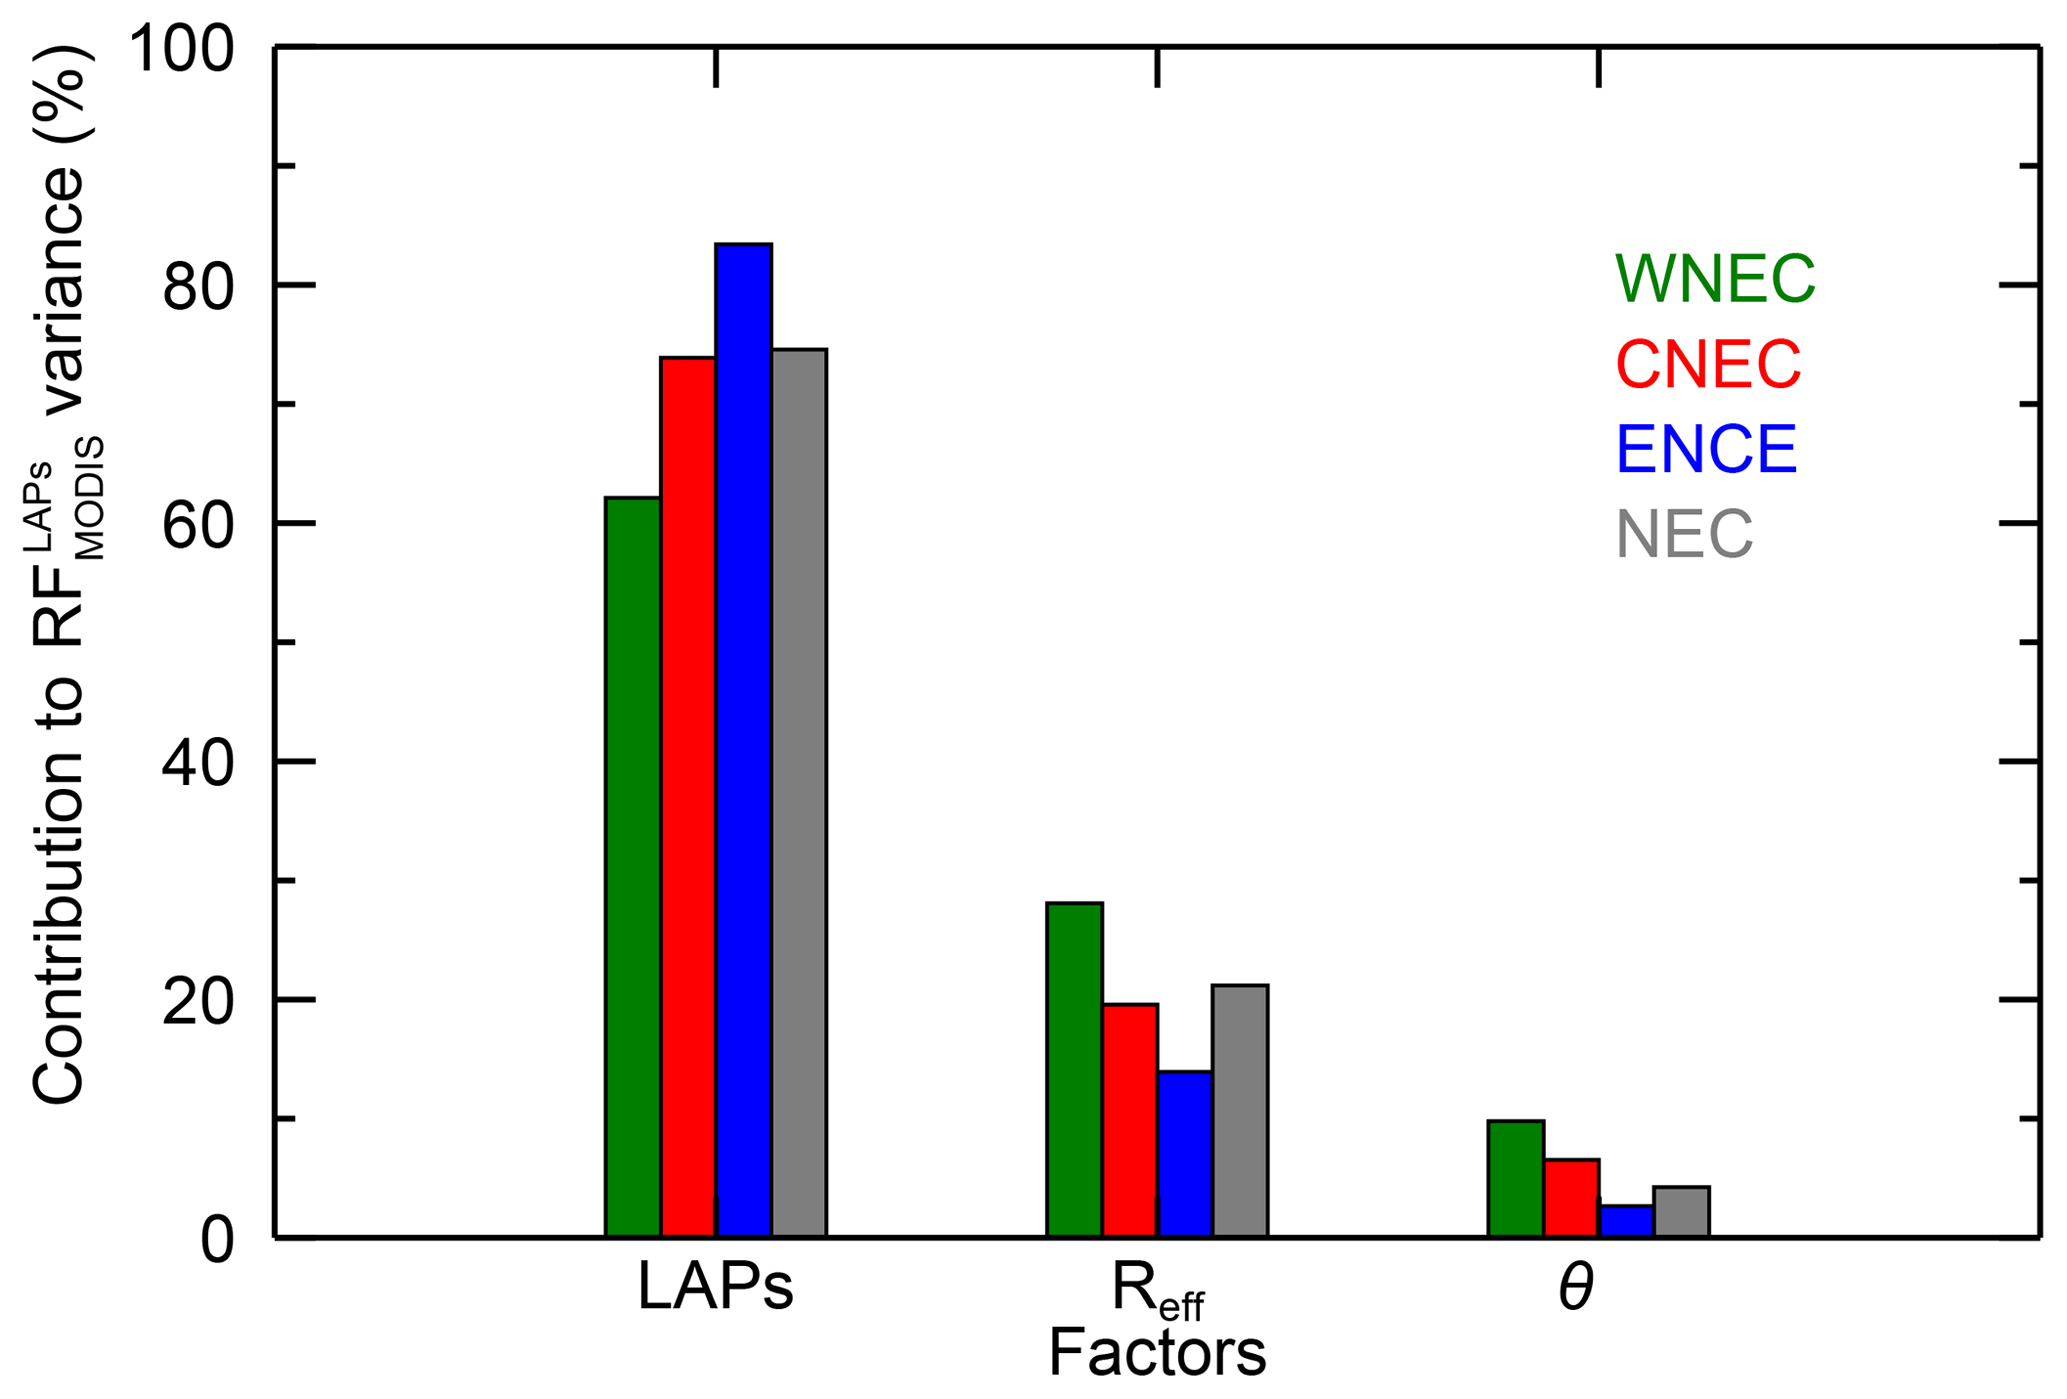
Figure 7Fractional contribution of average ILAPs (the indicator of LAPs), Reff, and solar zenith angle (θ) to the spatial variance of in January–February for 2003–2017.
Seidel et al. (2016) reported that the variations in LAP contents in snow are dominated by LAP deposition and snowfall. Previous studies have also reported that BC is the dominant LAP type in NEC (Wang et al., 2013). Zhao et al. (2014) simulated LAP contents and their radiative forcing in seasonal snow using WRF-Chem coupled with the SNICAR model and indicated that the radiative forcing by LAPs in snow in NEC is primarily due to BC. Therefore, to examine the spatial distributions of retrieved ILAPs and , we display the distribution of snowfall (Fig. 3a) and BC dry and wet deposition (Fig. 8). BC dry deposition is highest in the largest urban areas of NEC with the major cities of Harbin, Changchun, and Shenyang, then decreases sharply outwards from the central urban areas to remote areas (Fig. 8a). Different from BC dry deposition, which is dominated by BC concentrations in the atmosphere, BC wet deposition is affected by both BC concentrations and precipitation and shows an increase from northwest to southeast. Generally, the spatial patterns of BC dry and wet deposition are similar to ILAPs and . For example, areas with higher BC dry and wet deposition, such as industrial polluted NEC, show higher ILAPs and . Moreover, from Fig. 9a–c, we can find that the correlations of ILAPs with BC dry and wet deposition and snowfall (R2=0.81, 0.73, and 0.14) are all significant at the 99 % confidence level. The correlations of ILAPs with BC dry and wet deposition in WNEC are relatively lower than those in CNCE and ENEC, which is partly due to the effect of dust in this region (Wang et al., 2013; Zhao et al., 2014). Furthermore, using the method of multiple linear regression, we fitted ILAPs using BC dry and wet deposition and snowfall data. Figure 9d shows the scatterplots of ILAPs and fitted ILAPs_fit. We can find that ILAPs_fit is highly correlated with ILAPs, and BC dry and wet deposition and snowfall could explain 84 % of the spatial variance of ILAPs. The result confirms the reasonability of the spatial patterns of retrieved ILAPs and thus in NEC. In addition to MERRA-2 BC deposition data and ERA-Interim snowfall data used in Fig. 9, we also used other types of BC deposition and snowfall data to fit ILAPs. Table S1 in the Supplement shows the R2 between MODIS-retrieved ILAPs and fitted ILAPs_fit based on different datasets as discussed in Sect. 2.3 and 2.4. The values of R2 are very similar in a range of 0.81–0.84, which further indicates that the spatial pattern of retrieved ILAPs is reasonable and independent of the data types used for validation.
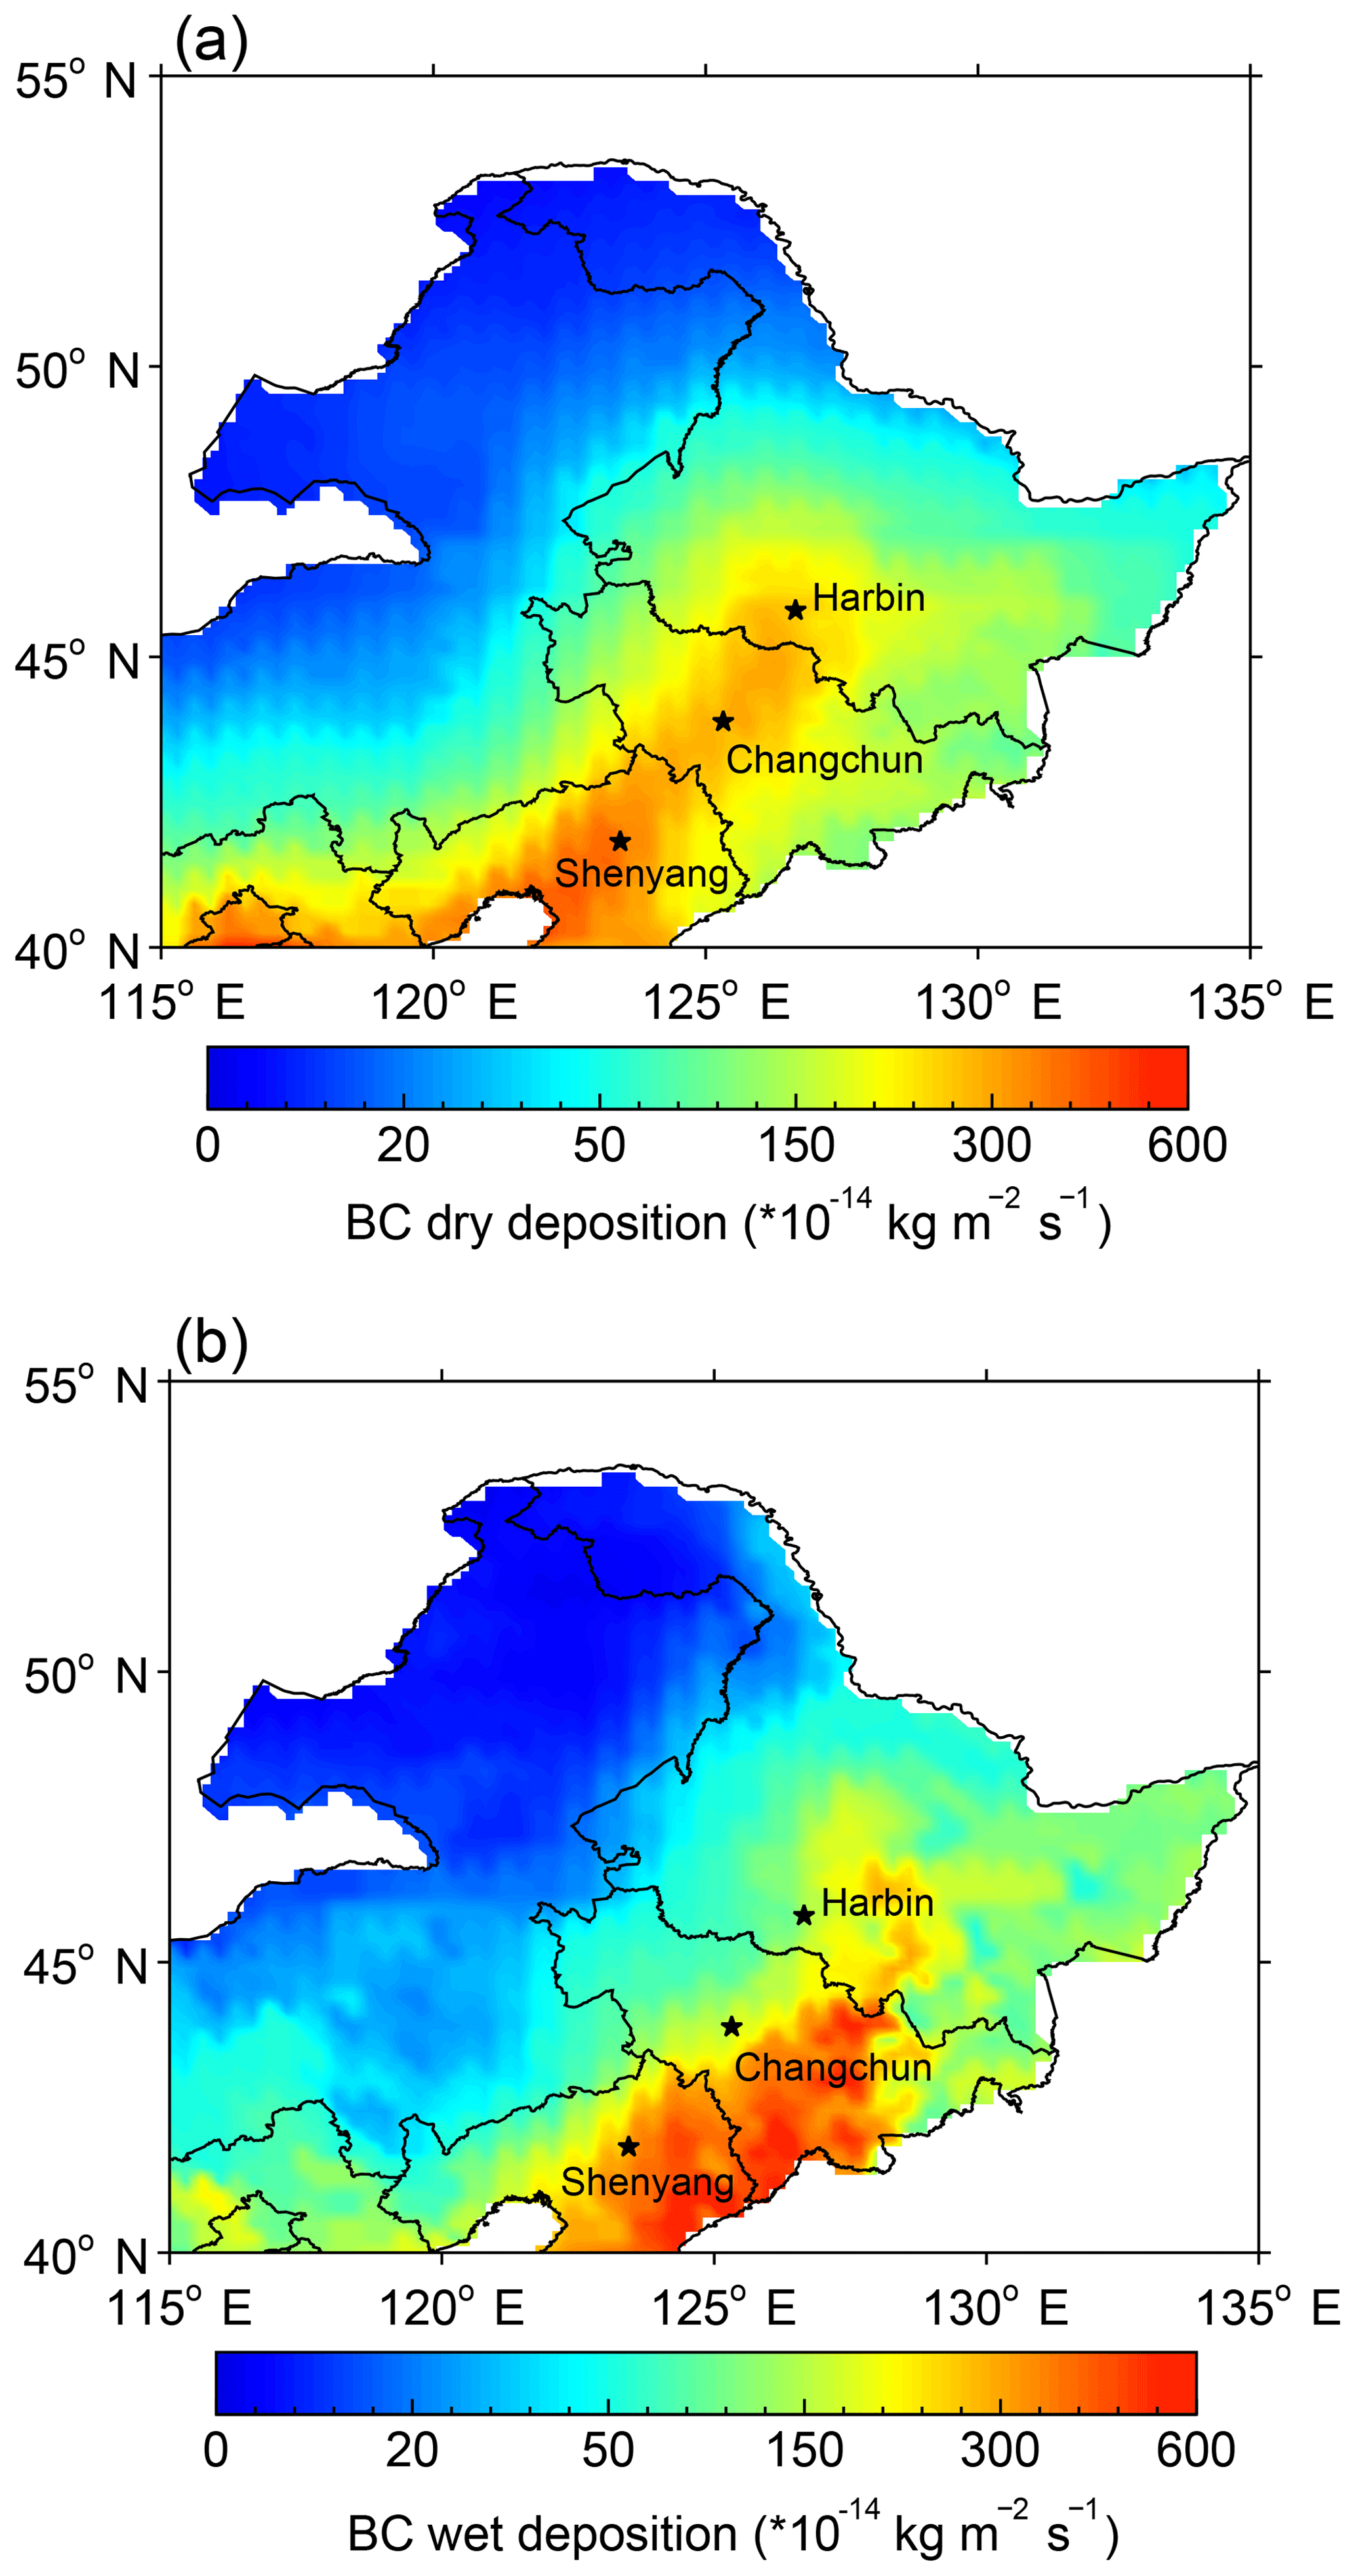
Figure 8Spatial distribution of average (a) dry and (b) wet deposition of BC in NEC in January–February from 2003 to 2017. BC deposition data are from the MERRA-2 reanalysis.
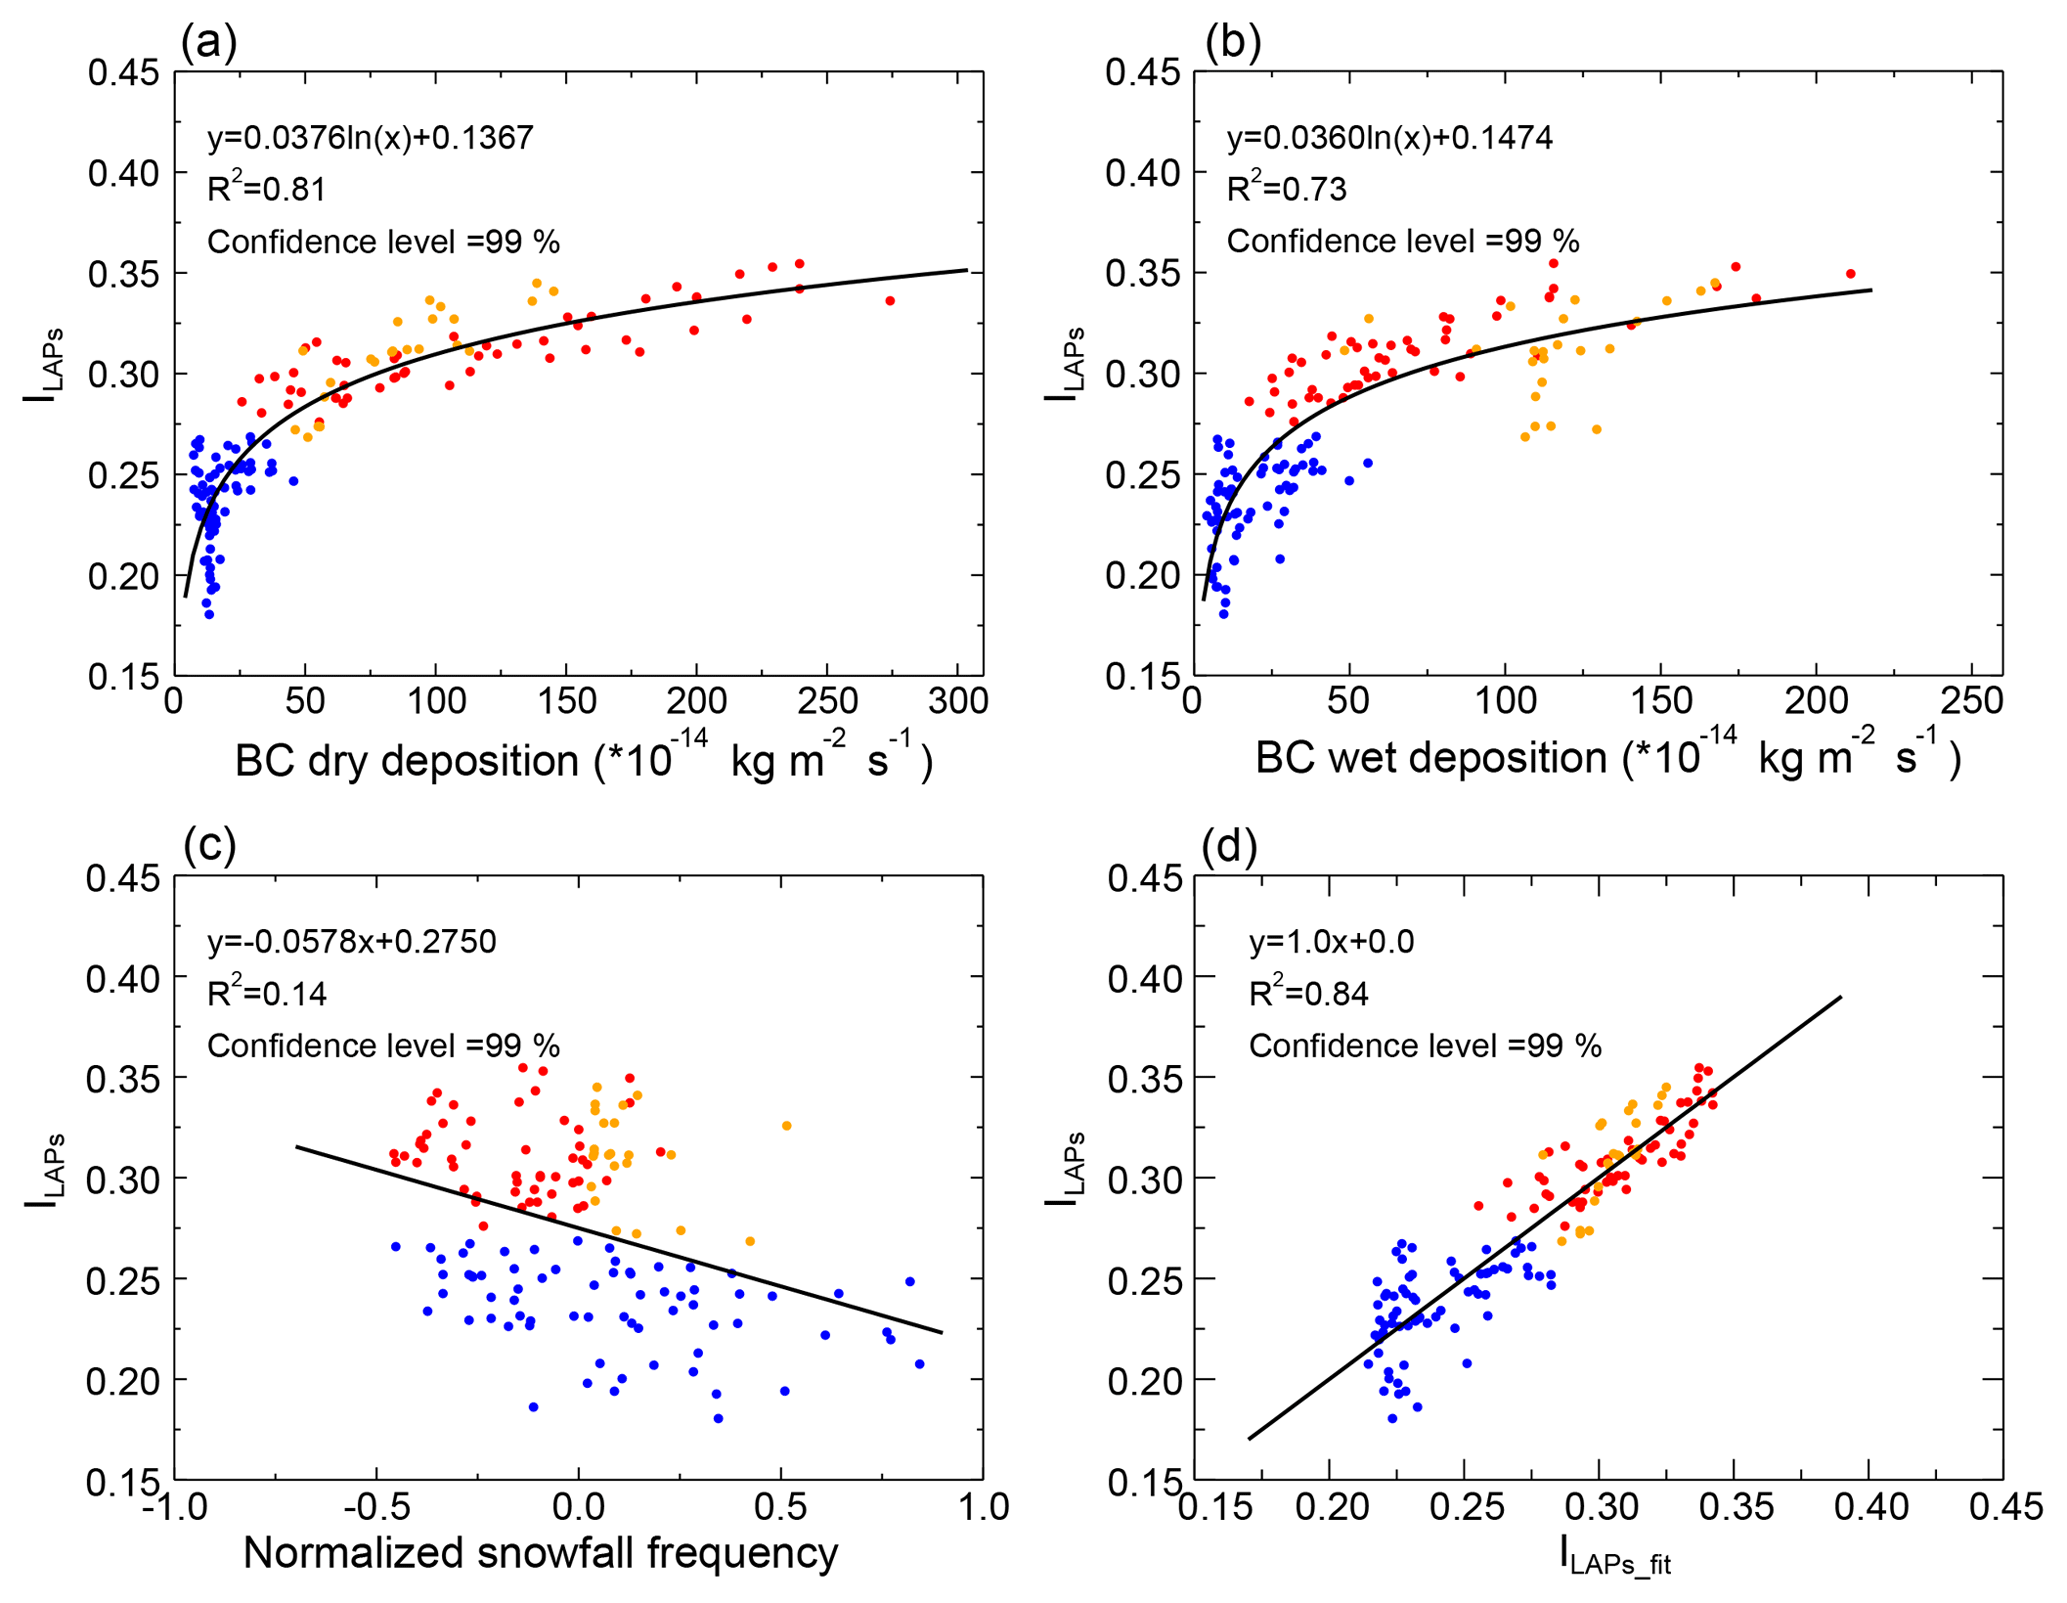
Figure 9Scatterplots of ILAPs versus (a) BC dry deposition, (b) BC wet deposition, (c) normalized snowfall frequency, and (d) fitted ILAPs (ILAPs_fit), which is fitted with BC dry and wet deposition and snowfall frequency using multiple linear regression. BC deposition data are from the MERRA-2 reanalysis, and snowfall data are from the ERA-Interim reanalysis in January–February from 2003 to 2017.
4.4 Comparisons of MODIS-retrieved and in situ estimated radiative forcing by LAPs in snow
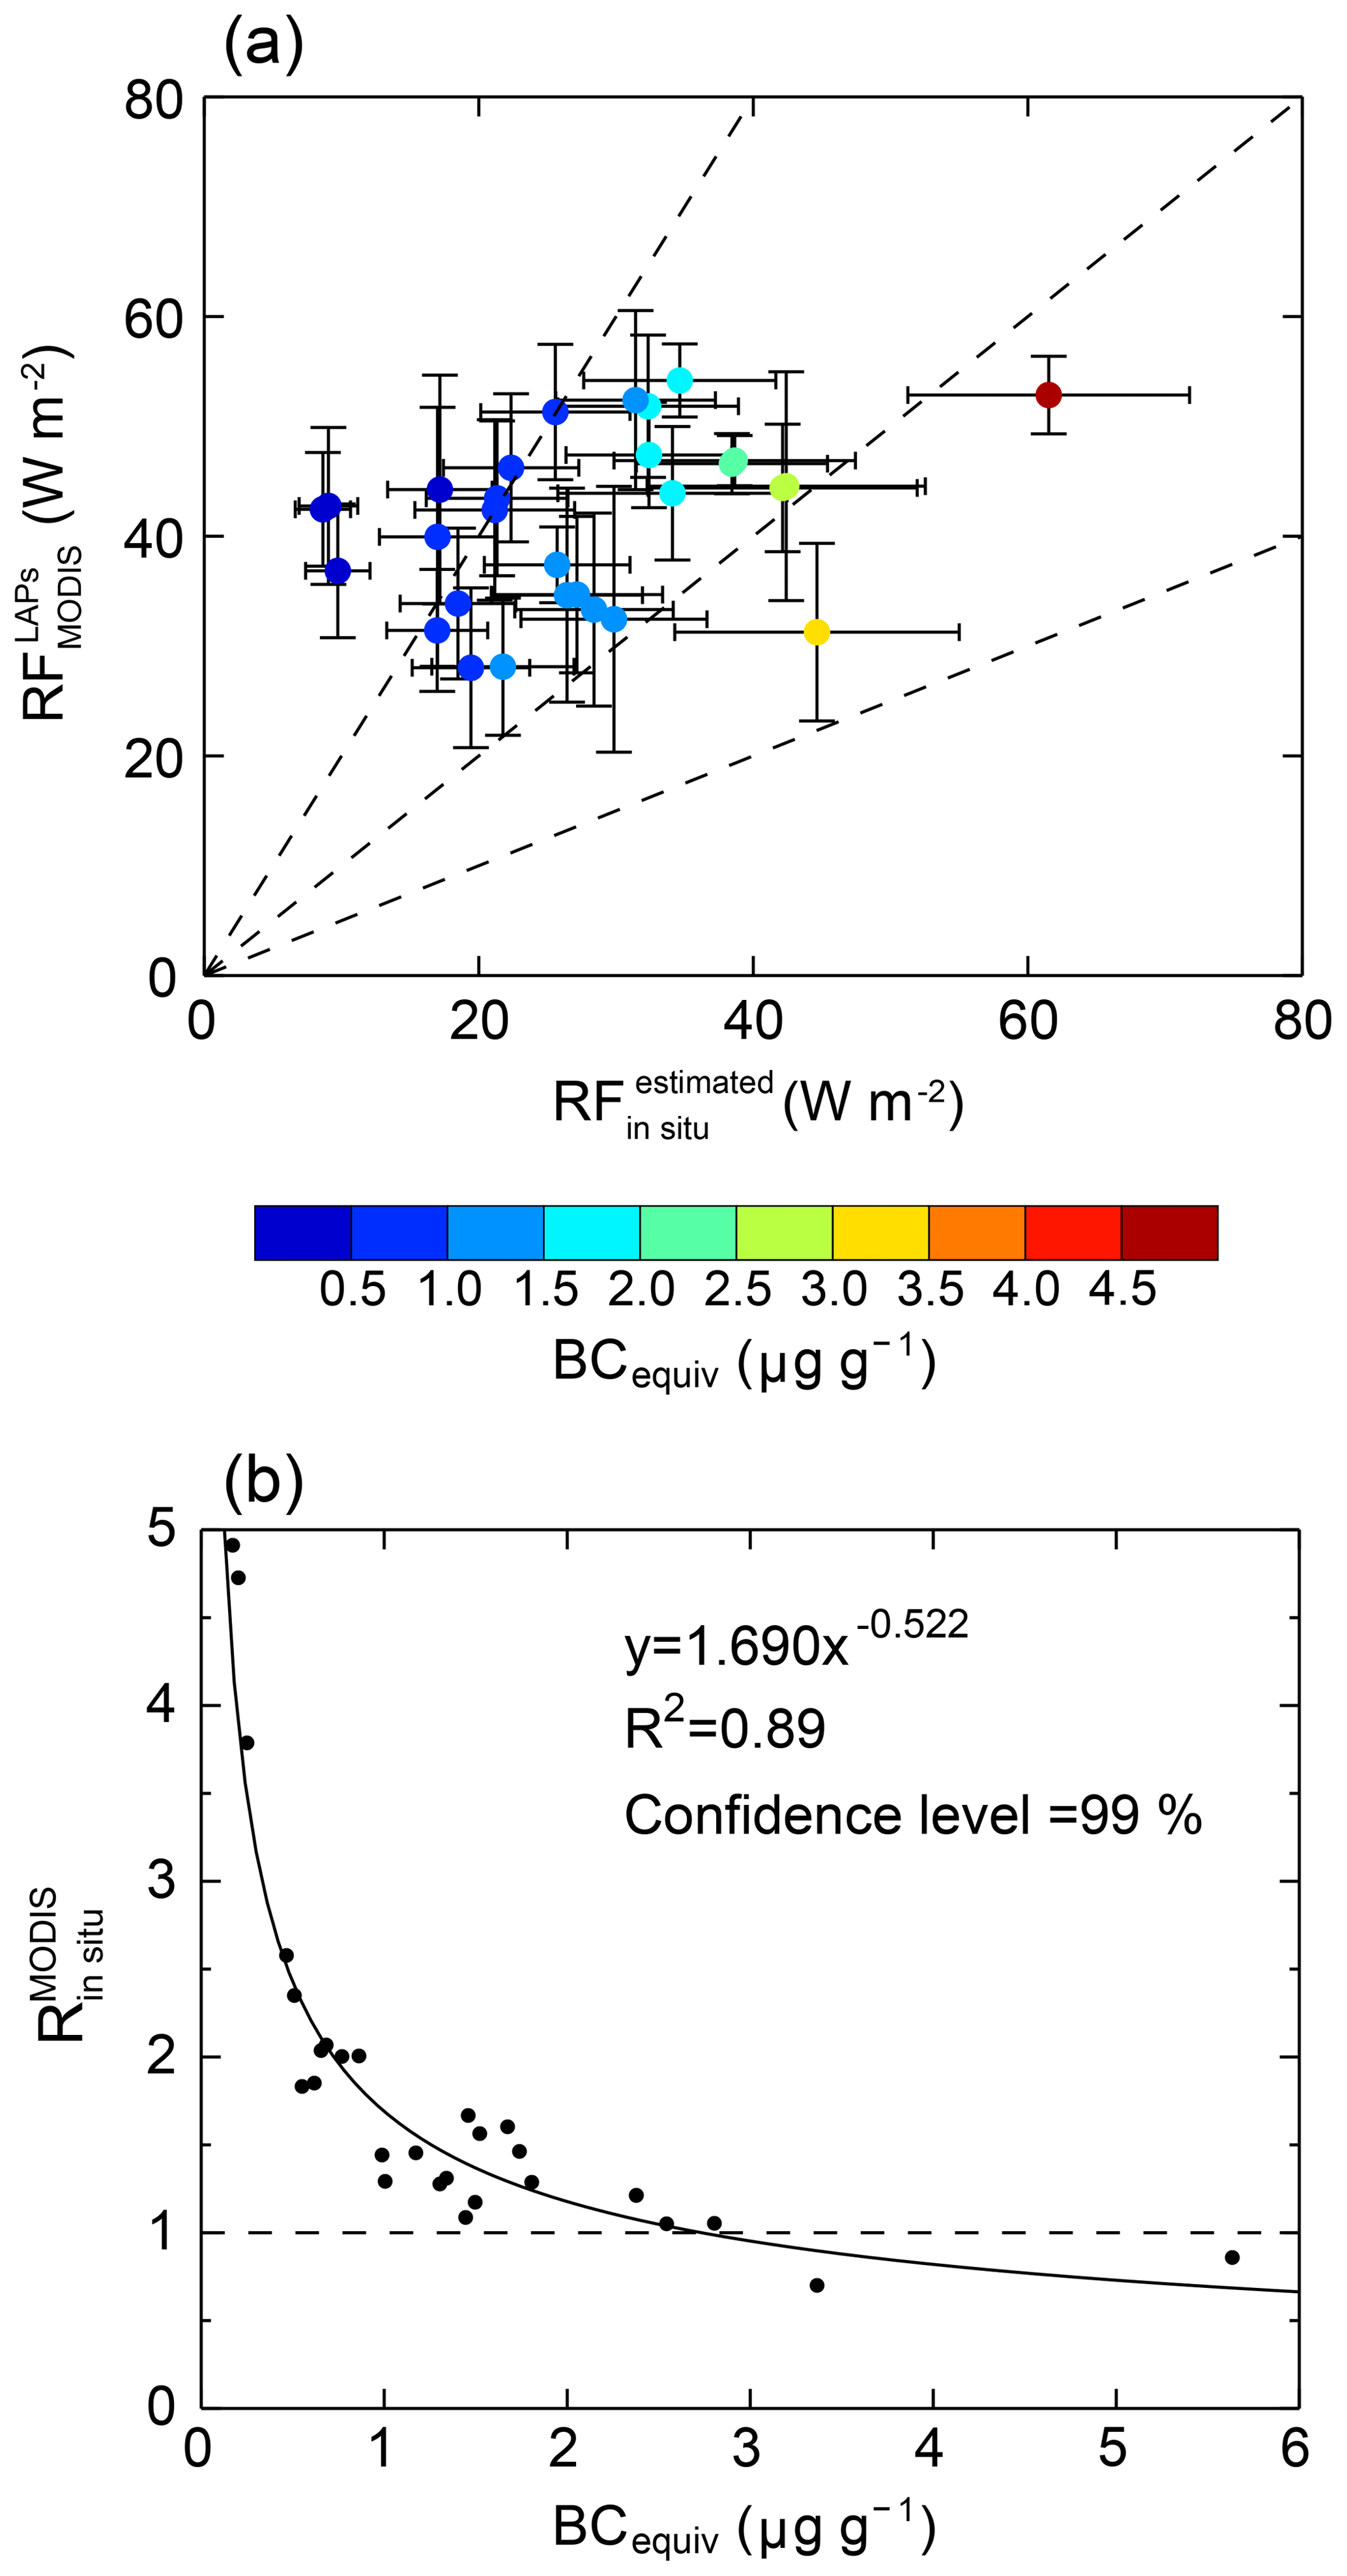
Figure 10 shows the distribution of the sample sites and the measured BCequiv concentration in surface snow at each site. Circles and squares represent the snow samples collected in 2010 (Wang et al., 2013) and 2014 (Wang et al., 2017), respectively. Generally, BCequiv concentration ranges mostly from ∼0.1 to ∼3.0 µg g−1 and shows an increase from northwest to southeast. The highest BCequiv concentration is found in CNEC, while the lowest is in WNEC. Figure 11a displays a comparison of MODIS-retrieved radiative forcing () and in situ radiative forcing ( estimated based on measured BCequiv concentration. In general, the mean absolute error (MAE) for against is 15.3 W m−2. The ratios of to () fall mainly in the range of 1–2. The errors indicate larger positive biases at lower values, whereas smaller biases are noted at higher values. The results of this bias analysis are comparable with those reported by Painter et al. (2012a). Figure 11b shows a scatterplot of versus BCequiv. We can find that and BCequiv display a good correlation; the best-fitting equation is , and the R2 is 0.89 (99 % confidence level). This result indicates that the biases in the retrievals are negatively correlated with the LAP concentrations in NEC. Considering that the typical concentration of BCequiv in clean snow in NEC is 0.15 µg g−1, the bias in can be as high as 350 % in some areas, such as WNEC. In other areas with very polluted snow, such as southern CNEC (where the BCequiv values are typically 2.5 µg g−1), the bias is ∼5 %. Thus, considering the values reported by Wang et al. (2013, 2017), the biases in largely fall in the range of ∼5 % to ∼350 % in NEC. Comparing Fig. 11 with Fig. 6, we find that the biases in in polluted snow are comparable with the uncertainties of due to atmospheric corrections. However, in clean snow, the uncertainties from atmospheric corrections could not sufficiently explain the biases in retrieved . There are three probable reasons. (a) For clean snow, retrieved radiative forcing is very sensitive to MODIS-derived surface snow reflectance (Eq. 4); although we have corrected the errors of snow reflectance from the protrusion of vegetation in our study areas of high snow cover fractions, the uncertainties from fractional snow cover (FSC) calculation and the vegetation reflectance will effectively influence the corrections of snow reflectance (Eq. 5). (b) Painter et al. (2012b) validated the retrieved radiative forcing by LAPs in snow in the upper Colorado River Basin using in situ estimates based on radiation towers, and they also found that the biases in the case of low radiative forcing could be up to severalfold. They pointed out that MODIS cannot proceed with a continuous spectral measurement of a continuous variable forcing like what LAPs afford to snow albedo due to the variably spaced and discrete bands of MODIS, which prevents a more quantitative retrieval and thus results in a non-negligible uncertainty in radiative forcing retrieval. (c) We use the average of MODIS-retrieved radiative forcing in a pixel size of 0.05∘ × 0.05∘ to compare with the in situ radiative forcing calculated using the observed BCequiv concentration with the sample site located in the center of the pixel. Such a comparison may not be true at some sites due to the inhomogeneous spatial distribution of snow and LAP contents, which will influence radiative forcing estimates, especially in clean snow (Zhao et al., 2014). Therefore, we note that the number of sample sites is still limited and more field campaigns are needed to validate the accuracy of MODIS retrievals and then correct the retrieved radiative forcing.
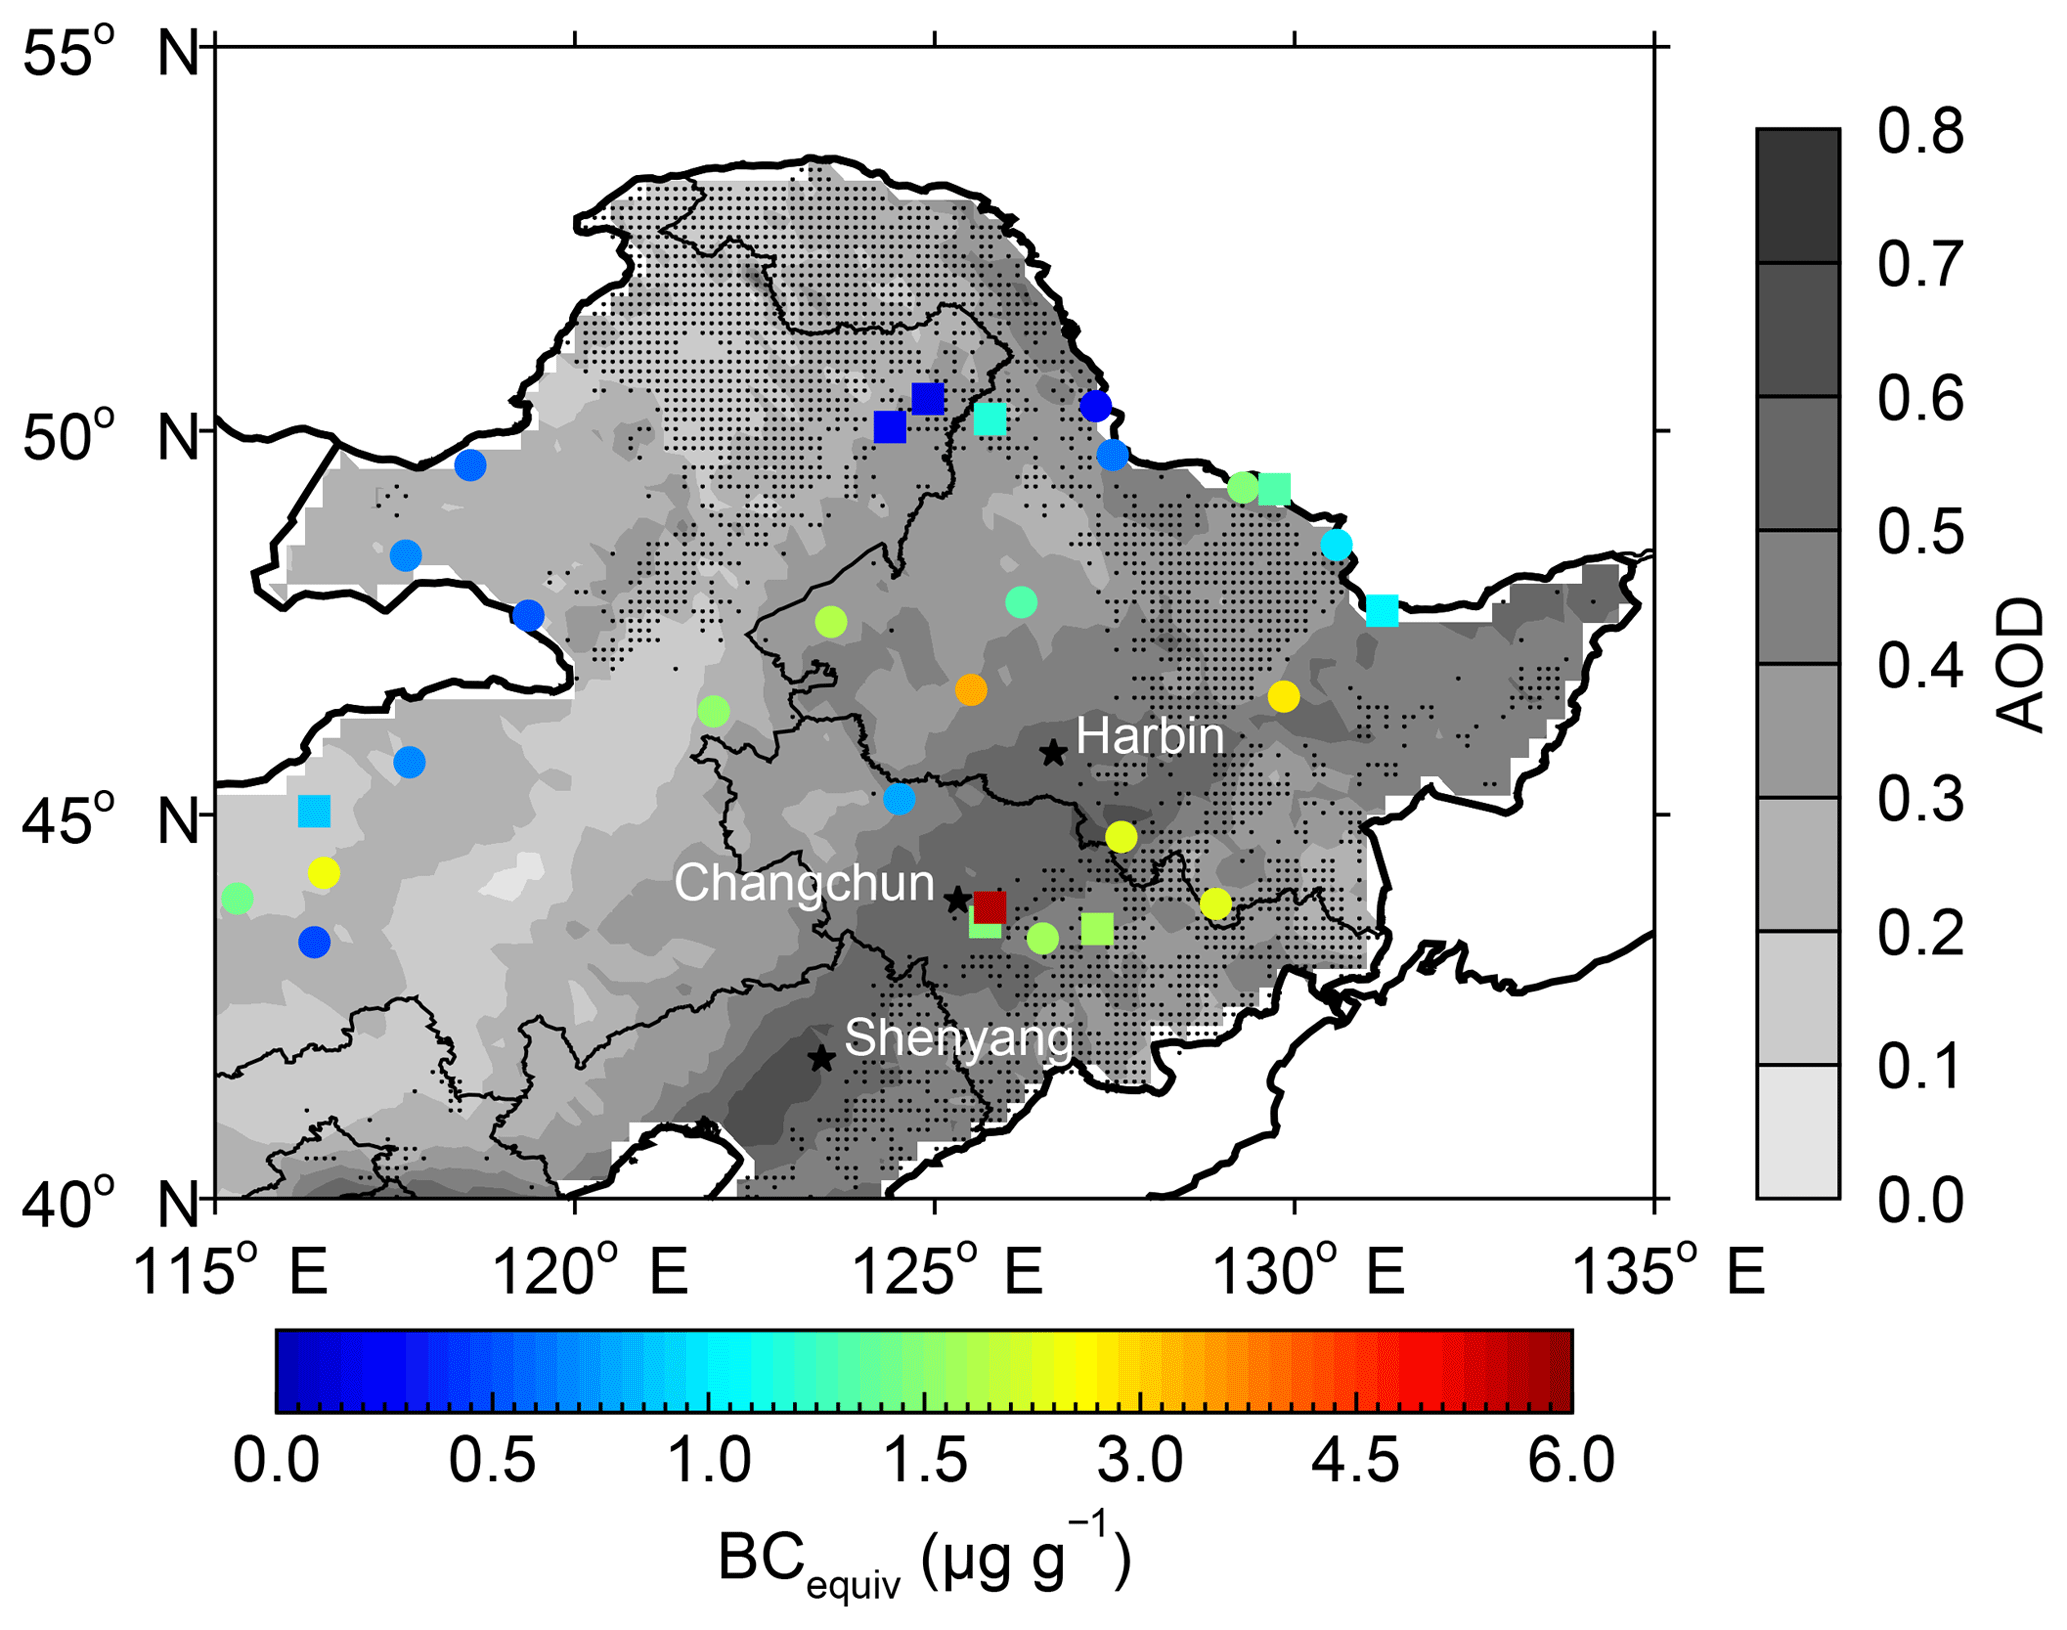
Figure 10Spatial distribution of the measured BCequiv concentration in surface snow in NEC. Circles and squares represent the snow samples collected in 2010 (Wang et al., 2013) and 2014 (Wang et al., 2017), respectively.
4.5 Limitations
The determination of snow-covered areas represents a limitation of the method used in this study, which restricts our study to areas with high snow cover fractions; thus, we cannot estimate across NEC as a whole. In the future, we will attempt to apply other satellite data with higher spatial resolution and use the spectral differences between different land cover types to distinguish the spectral reflectance of snow in mixed pixels. These improvements will permit us to expand our work to areas with limited snow cover. Another limitation is that we retrieve only the instantaneous radiative forcing at the surface under clear-sky conditions at the time of MODIS overpass, and these measurements do not represent a time-integrated average over the studied period. However, the estimation of temporally resolved radiative forcing is much more difficult given the significant effects of clouds, atmospheric components, θ, and the time-varying snow reflectance.
In our study, we did not retrieve the radiative forcing in the northern and southeastern parts of NEC. In those regions, snowfall is frequent, the percent of snow cover is very high, and snow is also very deep. For example, in northern NEC, the averaged snow depth is ∼20 cm, and in the areas near the Changbai Mountains of southeastern NEC, snow depth could be up to ∼40 cm (Wang et al., 2013). However, due to the presence of forest cover, the reflected radiation received by sensors aboard satellites in those areas is mostly due to trees. For example, Fig. 12 shows the true color map of MODIS in NEC on 23 January 2010, and we can see that in the northern and southeastern parts of NEC, the observed objects from MODIS are almost all trees, not the snowpack under trees, although snow is almost completely covering the area (Wang et al., 2013). Therefore, in those forest areas, discussing the radiative forcing by LAPs in snow is extremely difficult due to the influence of trees. Bond et al. (2006) also indicated that LAPs in snow masked by forests contribute little to radiative forcing. They further pointed out that model representation of and forcing sensitivity to cover ranges of forests have not been verified, and this is a boundless uncertainty in modeling radiative forcing by LAPs in snow at present. However, most modeling studies that have simulated the radiative forcing by LAPs in snow did not take trees into consideration and estimated the radiative forcing over entire boreal forest areas in the Northern Hemisphere. For example, Flanner et al. (2007) applied the SNICAR model coupled a general circulation model to estimate the radiative forcing and response from BC in snow-covered areas over the whole Northern Hemisphere. Nevertheless, due to the presence of trees in the extensive boreal forest areas, the simulated radiative forcing is unreal as the incident radiation is reflected by trees but not by the snowpack. Zhao et al. (2014) simulated BC and dust and their radiative forcing in seasonal snow in northern China. They found that the radiative forcing by BC and dust is very high in southeastern NEC, where there are forest areas. But, in fact, in those areas the simulated radiative forcing by LAPs is also unreal. Therefore, we note that estimating the radiative forcing by LAPs in forest areas should consider the influence of trees.
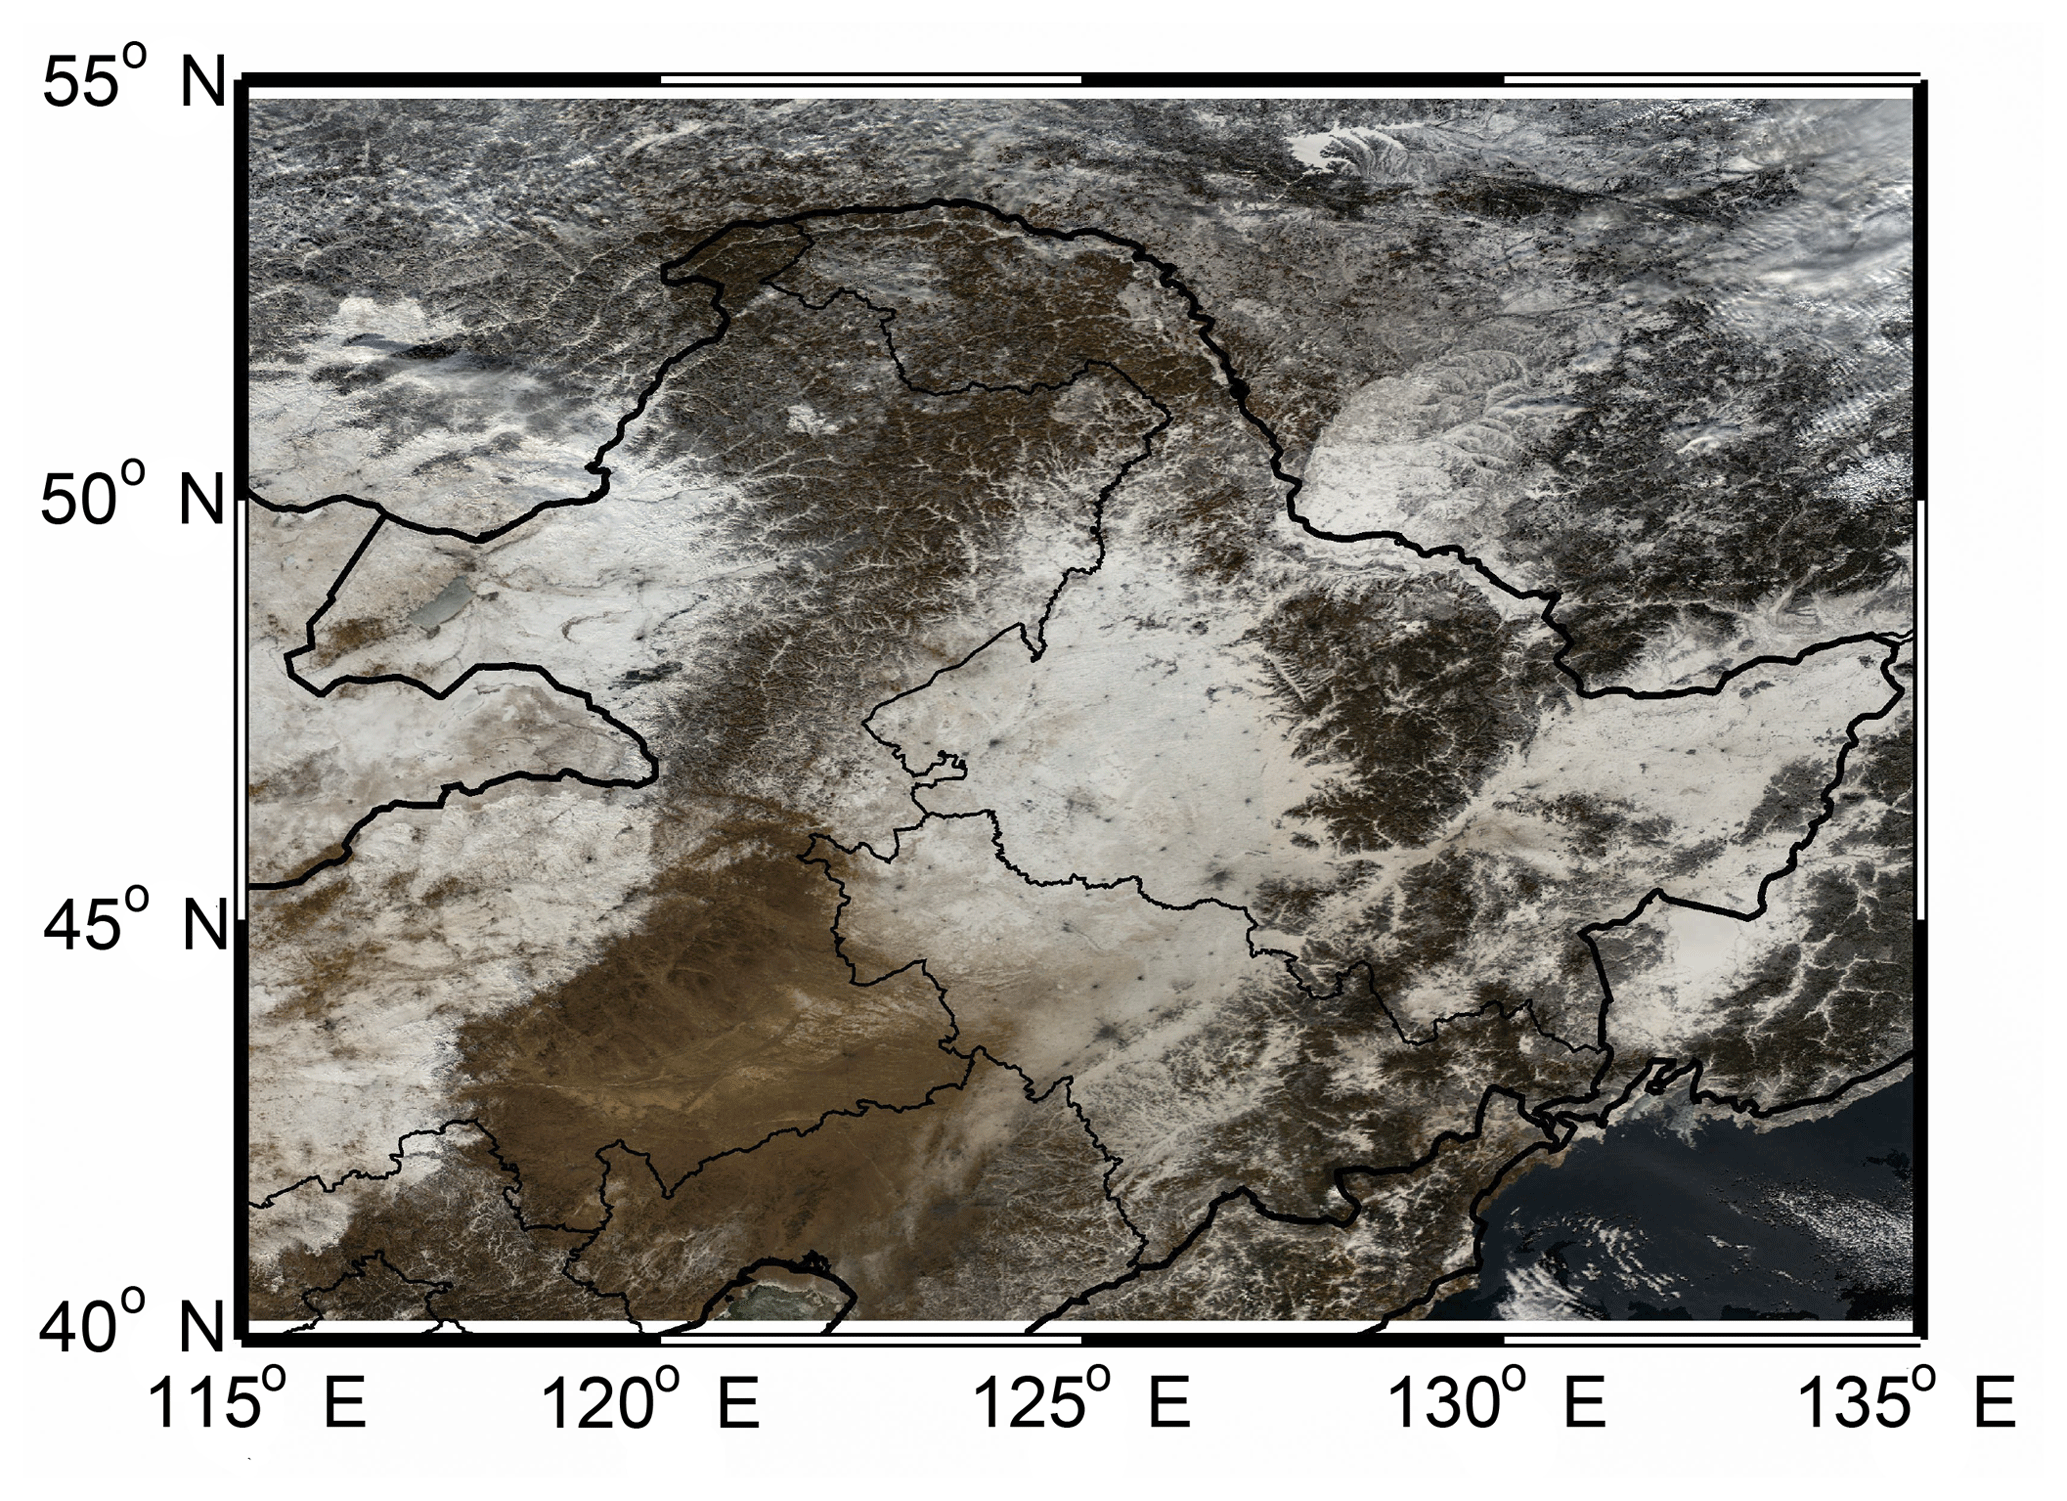
Figure 12A true color map of MODIS in NEC on 23 January 2010.
In this study, we retrieve ILAPs, Reff, and across NEC in January–February from 2003 to 2017 using MODIS data, together with a snow-albedo model (SNICAR) and a radiative transfer model (SBDART). On average, ILAPs is , Reff is µm, and is W m−2 in NEC. The distribution of presents distinct spatial differences; the lowest value is 22.3 W m−2, which occurs in remote western NEC, and the highest value is 64.6 W m−2, which occurs near the industrial areas in central NEC. Both ILAPs and show larger uncertainties from atmospheric correction, as their values are smaller. We make a first attempt to attribute the variations of radiative forcing based on remote sensing. The results point out that ILAPs, Reff, and θ make fractional contributions of 74.6 %, 21.2 %, and 4.2 % to the spatial variance of in our study areas across NEC. The result confirms that the LAP content in snow plays a dominant role in determining the spatial distribution of . We also analyze the distribution of BC dry and wet deposition and snowfall, and we find that they could explain 84 % of the spatial variance of ILAPs, which indicates the reasonability of the spatial patterns of ILAPs and thus in NEC. Finally, we validate the retrieved values using in situ estimated radiative forcing (). The mean absolute error (MAE) of against is 15.3 W m−2. The biases in the retrievals display a negative correlation with the LAP concentrations in NEC. Considering typical concentrations of BCequiv, which range from ∼0.15 to ∼2.5 µg g−1, the biases in fall primarily within the range of ∼5 % to ∼350 % in NEC.
MODIS data can be found at https://modis.gsfc.nasa.gov/ (last access: 20 March 2018). Snowfall data can be found from the China Meteorological Administration at http://apps.ecmwf.int/datasets/data/interim-full-daily/levtype=sfc/ (last access: 12 April 2019), https://gmao.gsfc.nasa.gov/reanalysis/MERRA-2/ (last access: 12 April 2019), and https://www.esrl.noaa.gov/psd/data/gridded/data.cpc.globalprecip.html (last access: 12 April 2019). BC deposition data can be found at https://gmao.gsfc.nasa.gov/reanalysis/MERRA-2/ (last access: 9 April 2019) and https://pcmdi.llnl.gov/CMIP6/ (last access: 5 April 2019). Surface measurement datasets are from Wang et al. (2013, 2017).
The supplement related to this article is available online at: https://doi.org/10.5194/acp-19-9949-2019-supplement.
WP and XW designed the study and wrote the first draft with contributions from all coauthors. WP and JC performed the calculations and conducted the statistical analysis. TS prepared and preprocessed the data. CH and XZ provided the models used for the calculations, assisted in model simulations, and assisted in postprocessing the model output. All authors contributed to the improvement of results and revised the final paper.
The authors declare that they have no conflict of interest.
We thank Mark Flanner for providing an executable version of the SNICAR model and modifying it to accommodate our analysis. We thank Cheng Dang for her suggestions and comments on this study.
This research has been supported by the National Key Research and Development Program on Monitoring, Early Warning and Prevention of Major Natural Disasters (2018YFC1506005), the National Natural Science Foundation of China (41775144, 41675065, and 41875091), and the Fundamental Research Funds for the Central Universities (lzujbky-2018-k02). The National Center for Atmospheric Research is sponsored by the National Science Foundation (USA).
This paper was edited by Qiang Zhang and reviewed by Jing Ming and one anonymous referee.
Bocquet, M., Elbern, H., Eskes, H., Hirtl, M., Žabkar, R., Carmichael, G. R., Flemming, J., Inness, A., Pagowski, M., Pérez Camaño, J. L., Saide, P. E., San Jose, R., Sofiev, M., Vira, J., Baklanov, A., Carnevale, C., Grell, G., and Seigneur, C.: Data assimilation in atmospheric chemistry models: current status and future prospects for coupled chemistry meteorology models, Atmos. Chem. Phys., 15, 5325–5358, https://doi.org/10.5194/acp-15-5325-2015, 2015.
Bond, T. C., Streets, D. G., Yarber, K. F., Nelson, S. M., Woo, J. H., and Klimont, Z.: A technology-based global inventory of black and organic carbon emissions from combustion, J. Geophys. Res.-Atmos., 109, D14203, https://doi.org/10.1029/2003jd003697, 2004.
Bond, T. C., Habib, G., and Bergstrom, R. W.: Limitations in the enhancement of visible light absorption due to mixing state, J. Geophys. Res.-Atmos., 111, D20211, https://doi.org/10.1029/2006jd007315, 2006.
Bond, T. C., Doherty, S. J., Fahey, D. W., Forster, P. M., Berntsen, T., DeAngelo, B. J., Flanner, M. G., Ghan, S., Karcher, B., Koch, D., Kinne, S., Kondo, Y., Quinn, P. K., Sarofim, M. C., Schultz, M. G., Schulz, M., Venkataraman, C., Zhang, H., Zhang, S., Bellouin, N., Guttikunda, S. K., Hopke, P. K., Jacobson, M. Z., Kaiser, J. W., Klimont, Z., Lohmann, U., Schwarz, J. P., Shindell, D., Storelvmo, T., Warren, S. G., and Zender, C. S.: Bounding the role of black carbon in the climate system: A scientific assessment, J. Geophys. Res.-Atmos., 118, 5380–5552, https://doi.org/10.1002/jgrd.50171, 2013.
Cao, G. L., Zhang, X. Y., and Zheng, F. C.: Inventory of black carbon and organic carbon emissions from China, Atmos. Environ., 40, 6516–6527, https://doi.org/10.1016/j.atmosenv.2006.05.070, 2006.
Che, T., Li, X., Jin, R., Armstrong, R., and Zhang, T. J.: Snow depth derived from passive microwave remote-sensing data in China, Ann. Glaciol., 49, 145–154, https://doi.org/10.3189/172756408787814690, 2008.
Cohen, J. and Rind, D.: The Effect of Snow Cover on the Climate, J. Climate, 4, 689–706, https://doi.org/10.1175/1520-0442(1991)004<0689:Teosco>2.0.Co;2, 1991.
Dang, C. and Hegg, D. A.: Quantifying light absorption by organic carbon in Western North American snow by serial chemical extractions, J. Geophys. Res.-Atmos., 119, 10247–10261, https://doi.org/10.1002/2014jd022156, 2014.
Dang, C., Warren, S. G., Fu, Q., Doherty, S. J., Sturm, M., and Su, J.: Measurements of light-absorbing particles in snow across the Arctic, North America, and China: Effects on surface albedo, J. Geophys. Res.-Atmos., 122, 10149–10168, https://doi.org/10.1002/2017jd027070, 2017.
Di Mauro, B., Fava, F., Ferrero, L., Garzonio, R., Baccolo, G., Delmonte, B., and Colombo, R.: Mineral dust impact on snow radiative properties in the European Alps combining ground, UAV, and satellite observations, J. Geophys. Res.-Atmos., 120, 6080–6097, https://doi.org/10.1002/2015jd023287, 2015.
Di Mauro, B., Baccolo, G., Garzonio, R., Giardino, C., Massabò, D., Piazzalunga, A., Rossini, M., and Colombo, R.: Impact of impurities and cryoconite on the optical properties of the Morteratsch Glacier (Swiss Alps), The Cryosphere, 11, 2393–2409, https://doi.org/10.5194/tc-11-2393-2017, 2017.
Doherty, S. J., Warren, S. G., Grenfell, T. C., Clarke, A. D., and Brandt, R. E.: Light-absorbing impurities in Arctic snow, Atmos. Chem. Phys., 10, 11647–11680, https://doi.org/10.5194/acp-10-11647-2010, 2010.
Doherty, S. J., Dang, C., Hegg, D. A., Zhang, R. D., and Warren, S. G.: Black carbon and other light-absorbing particles in snow of central North America, J. Geophys. Res.-Atmos., 119, 12807–12831, https://doi.org/10.1002/2014jd022350, 2014.
Dumont, M., Brun, E., Picard, G., Michou, M., Libois, Q., Petit, J. R., Geyer, M., Morin, S., and Josse, B.: Contribution of light-absorbing impurities in snow to Greenland's darkening since 2009, Nat. Geosci., 7, 509–512, https://doi.org/10.1038/Ngeo2180, 2014.
Eyring, V., Bony, S., Meehl, G. A., Senior, C. A., Stevens, B., Stouffer, R. J., and Taylor, K. E.: Overview of the Coupled Model Intercomparison Project Phase 6 (CMIP6) experimental design and organization, Geosci. Model Dev., 9, 1937–1958, https://doi.org/10.5194/gmd-9-1937-2016, 2016.
Flanner, M. G., Zender, C. S., Randerson, J. T., and Rasch, P. J.: Present-day climate forcing and response from black carbon in snow, J. Geophys. Res.-Atmos., 112, D11202, https://doi.org/10.1029/2006jd008003, 2007.
Flanner, M. G., Zender, C. S., Hess, P. G., Mahowald, N. M., Painter, T. H., Ramanathan, V., and Rasch, P. J.: Springtime warming and reduced snow cover from carbonaceous particles, Atmos. Chem. Phys., 9, 2481–2497, https://doi.org/10.5194/acp-9-2481-2009, 2009.
Grenfell, T. C., Doherty, S. J., Clarke, A. D., and Warren, S. G.: Light absorption from particulate impurities in snow and ice determined by spectrophotometric analysis of filters, Appl. Optics, 50, 2037–2048, https://doi.org/10.1364/Ao.50.002037, 2011.
Hadley, O. L. and Kirchstetter, T. W.: Black-carbon reduction of snow albedo, Nat. Clim. Change, 2, 437–440, https://doi.org/10.1038/nclimate1433, 2012.
Hall, D. K., Riggs, G. A., and Salomonson, V. V.: Development of Methods for Mapping Global Snow Cover Using Moderate Resolution Imaging Spectroradiometer Data, Remote Sens. Environ., 54, 127–140, https://doi.org/10.1016/0034-4257(95)00137-P, 1995.
Hansen, J. and Nazarenko, L.: Soot climate forcing via snow and ice albedos, P. Natl. Acad. Sci. USA, 101, 423–428, https://doi.org/10.1073/pnas.2237157100, 2004.
He, C. L., Li, Q. B., Liou, K. N., Takano, Y., Gu, Y., Qi, L., Mao, Y. H., and Leung, L. R.: Black carbon radiative forcing over the Tibetan Plateau, Geophys. Res. Lett., 41, 7806–7813, https://doi.org/10.1002/2014gl062191, 2014.
He, C. L., Takano, Y., Liou, K. N., Yang, P., Li, Q. B., and Chen, F.: Impact of Snow Grain Shape and Black Carbon-Snow Internal Mixing on Snow Optical Properties: Parameterizations for Climate Models, J. Climate, 30, 10019–10036, https://doi.org/10.1175/Jcli-D-17-0300.1, 2017.
He, C. L., Liou, K. N., Takano, Y., Yang, P., Qi, L., and Chen, F.: Impact of Grain Shape and Multiple Black Carbon Internal Mixing on Snow Albedo: Parameterization and Radiative Effect Analysis, J. Geophys. Res.-Atmos., 123, 1253–1268, https://doi.org/10.1002/2017jd027752, 2018.
Huang, J. P. and Yi, Y. H.: Inversion of a nonlinear dynamic-model from the observation, Sci. China Chem., 34, 1246–1246, 1991.
Huang, J. P., Fu, Q., Zhang, W., Wang, X., Zhang, R. D., Ye, H., and Warren, S. G.: Dust and Black Carbon in Seasonal Snow across Northern China, B. Am. Meteorol. Soc., 92, 175–181, https://doi.org/10.1175/2010bams3064.1, 2011.
Huang, J. P., Xie, Y. K., Guan, X. D., Li, D. D., and Ji, F.: The dynamics of the warming hiatus over the Northern Hemisphere, Clim. Dynam., 48, 429–446, https://doi.org/10.1007/s00382-016-3085-8, 2016.
Ichoku, C., Levy, R., Kaufman, Y. J., Remer, L. A., Li, R. R., Martins, V. J., Holben, B. N., Abuhassan, N., Slutsker, I., Eck, T. F., and Pietras, C.: Analysis of the performance characteristics of the five-channel Microtops II Sun photometer for measuring aerosol optical thickness and precipitable water vapor, J. Geophys. Res.-Atmos., 107, AAC 5-1–AAC 5-17, https://doi.org/10.1029/2001jd001302, 2002.
IPCC: Climate Change 2013: The Physical Science Basis. Contribution of Working Group I to the Fifth Assessment Report of the Intergovernmental Panel on Climate Change, edited by: Stocker, T. F., Qin, D., Plattner, G.-K., Tignor, M., Allen, S. K., Boschung, J., Nauels, A., Xia, Y., Bex, V., and Midgley, P. M., Cambridge Univ. Press, Cambridge, UK and New York, NY, USA, 2013.
Jacobson, M. Z.: Control of fossil-fuel particulate black carbon and organic matter, possibly the most effective method of slowing global warming, J. Geophys. Res.-Atmos., 107, 4410, https://doi.org/10.1029/2001jd001376, 2002.
Jacobson, M. Z.: Climate response of fossil fuel and biofuel soot, accounting for soot's feedback to snow and sea ice albedo and emissivity, J. Geophys. Res.-Atmos., 109, D21201, https://doi.org/10.1029/2004jd004945, 2004.
Kaspari, S., Painter, T. H., Gysel, M., Skiles, S. M., and Schwikowski, M.: Seasonal and elevational variations of black carbon and dust in snow and ice in the Solu-Khumbu, Nepal and estimated radiative forcings, Atmos. Chem. Phys., 14, 8089–8103, https://doi.org/10.5194/acp-14-8089-2014, 2014.
Li, C. L., Bosch, C., Kang, S. C., Andersson, A., Chen, P. F., Zhang, Q. G., Cong, Z. Y., Chen, B., Qin, D. H., and Gustafsson, O.: Sources of black carbon to the Himalayan-Tibetan Plateau glaciers, Nat. Commun., 7, 12574, https://doi.org/10.1038/ncomms12574, 2016.
Liou, K. N., Takano, Y., and Yang, P.: Light absorption and scattering by aggregates: Application to black carbon and snow grains, J. Quant. Spectrosc. Ra., 112, 1581–1594, https://doi.org/10.1016/j.jqsrt.2011.03.007, 2011.
Liou, K. N., Takano, Y., He, C., Yang, P., Leung, L. R., Gu, Y., and Lee, W. L.: Stochastic parameterization for light absorption by internally mixed BC/dust in snow grains for application to climate models, J. Geophys. Res.-Atmos., 119, 7616–7632, https://doi.org/10.1002/2014jd021665, 2014.
Lyapustin, A., Tedesco, M., Wang, Y. J., Aoki, T., Hori, M., and Kokhanovsky, A.: Retrieval of snow grain size over Greenland from MODIS, Remote Sens. Environ., 113, 1976–1987, https://doi.org/10.1016/j.rse.2009.05.008, 2009.
McConnell, J. R., Edwards, R., Kok, G. L., Flanner, M. G., Zender, C. S., Saltzman, E. S., Banta, J. R., Pasteris, D. R., Carter, M. M., and Kahl, J. D. W.: 20th-century industrial black carbon emissions altered arctic climate forcing, Science, 317, 1381–1384, https://doi.org/10.1126/science.1144856, 2007.
Miller, S. D., Wang, F., Burgess, A. B., Skiles, S. M., Rogers, M., and Painter, T. H.: Satellite-Based Estimation of Temporally Resolved Dust Radiative Forcing in Snow Cover, J. Hydrometeorol., 17, 1999–2011, https://doi.org/10.1175/Jhm-D-15-0150.1, 2016.
Ming, J., Du, Z. C., Xiao, C. D., Xu, X. B., and Zhang, D. Q.: Darkening of the mid-Himalaya glaciers since 2000 and the potential causes, Environ. Res. Lett., 7, 014021, https://doi.org/10.1088/1748-9326/7/1/014021, 2012.
Ming, J., Wang, Y. Q., Du, Z. C., Zhang, T., Guo, W. Q., Xiao, C. D., Xu, X. B., Ding, M. H., Zhang, D. Q., and Yang, W.: Widespread Albedo Decreasing and Induced Melting of Himalayan Snow and Ice in the Early 21st Century, Plos One, 10, https://doi.org/10.1371/journal.pone.0126235, 2015.
Negi, H. S. and Kokhanovsky, A.: Retrieval of snow grain size and albedo of western Himalayan snow cover using satellite data, The Cryosphere, 5, 831–847, https://doi.org/10.5194/tc-5-831-2011, 2011.
Nolin, A. W. and Dozier, J.: Estimating Snow Grain-Size Using Aviris Data, Remote Sens. Environ., 44, 231–238, https://doi.org/10.1016/0034-4257(93)90018-S, 1993.
Nolin, A. W. and Dozier, J.: A hyperspectral method for remotely sensing the grain size of snow, Remote Sens. Environ., 74, 207–216, https://doi.org/10.1016/S0034-4257(00)00111-5, 2000.
O'Brien, H. W. and Koh, G.: Near-infrared reflectance of snow-covered substrates, Cold Regions Res. and Eng. Lab., Hanover, N. H. CRREL Report 81-21, 1981.
O'Brien, H. W. and Munis, R. H.: Red and Near-Infrared Spectral Reflectance of Snow, Cold Regions Res. Eng. Lab., Hanover, N.H., CRREL Res. Rep., 332, 1975.
Painter, T. H., Roberts, D. A., Green, R. O., and Dozier, J.: The effect of grain size on spectral mixture analysis of snow-covered area from AVIRIS data, Remote Sens. Environ., 65, 320–332, https://doi.org/10.1016/S0034-4257(98)00041-8, 1998.
Painter, T. H., Barrett, A. P., Landry, C. C., Neff, J. C., Cassidy, M. P., Lawrence, C. R., McBride, K. E., and Farmer, G. L.: Impact of disturbed desert soils on duration of mountain snow cover, Geophys. Res. Lett., 34, https://doi.org/10.1029/2007gl030284, 2007.
Painter, T. H., Rittger, K., McKenzie, C., Slaughter, P., Davis, R. E., and Dozier, J.: Retrieval of subpixel snow covered area, grain size, and albedo from MODIS, Remote Sens. Environ., 113, 868–879, https://doi.org/10.1016/j.rse.2009.01.001, 2009.
Painter, T. H., Deems, J. S., Belnap, J., Hamlet, A. F., Landry, C. C., and Udall, B.: Response of Colorado River runoff to dust radiative forcing in snow, P. Natl. Acad. Sci. USA, 107, 17125–17130, https://doi.org/10.1073/pnas.0913139107, 2010.
Painter, T. H., Bryant, A. C., and Skiles, S. M.: Radiative forcing by light absorbing impurities in snow from MODIS surface reflectance data, Geophys. Res. Lett., 39, L17502, https://doi.org/10.1029/2012gl052457, 2012a.
Painter, T. H., Skiles, S. M., Deems, J. S., Bryant, A. C., and Landry, C. C.: Dust radiative forcing in snow of the Upper Colorado River Basin: 1. A 6 year record of energy balance, radiation, and dust concentrations, Water Resour. Res., 48, W07521, https://doi.org/10.1029/2012wr011985, 2012b.
Painter, T. H., Flanner, M. G., Kaser, G., Marzeion, B., VanCuren, R. A., and Abdalati, W.: End of the Little Ice Age in the Alps forced by industrial black carbon, P. Natl. Acad. Sci. USA, 110, 15216–15221, https://doi.org/10.1073/pnas.1302570110, 2013a.
Painter, T. H., Seidel, F. C., Bryant, A. C., Skiles, S. M., and Rittger, K.: Imaging spectroscopy of albedo and radiative forcing by light-absorbing impurities in mountain snow, J. Geophys. Res.-Atmos., 118, 9511–9523, https://doi.org/10.1002/jgrd.50520, 2013b.
Peltoniemi, J. I., Gritsevich, M., Hakala, T., Dagsson-Waldhauserová, P., Arnalds, Ó., Anttila, K., Hannula, H.-R., Kivekäs, N., Lihavainen, H., Meinander, O., Svensson, J., Virkkula, A., and de Leeuw, G.: Soot on Snow experiment: bidirectional reflectance factor measurements of contaminated snow, The Cryosphere, 9, 2323–2337, https://doi.org/10.5194/tc-9-2323-2015, 2015.
Polashenski, C. M., Dibb, J. E., Flanner, M. G., Chen, J. Y., Courville, Z. R., Lai, A. M., Schauer, J. J., Shafer, M. M., and Bergin, M.: Neither dust nor black carbon causing apparent albedo decline in Greenland's dry snow zone: Implications for MODIS C5 surface reflectance, Geophys. Res. Lett., 42, 9319–9327, https://doi.org/10.1002/2015gl065912, 2015.
Pu, W., Wang, X., Wei, H., Zhou, Y., Shi, J., Hu, Z., Jin, H., and Chen, Q.: Properties of black carbon and other insoluble light-absorbing particles in seasonal snow of northwestern China, The Cryosphere, 11, 1213–1233, https://doi.org/10.5194/tc-11-1213-2017, 2017.
Qian, Y., Gustafson, W. I., Leung, L. R., and Ghan, S. J.: Effects of soot-induced snow albedo change on snowpack and hydrological cycle in western United States based on Weather Research and Forecasting chemistry and regional climate simulations, J. Geophys. Res.-Atmos., 114, D03108, https://doi.org/10.1029/2008jd011039, 2009.
Ramanathan, V. and Carmichael, G.: Global and regional climate changes due to black carbon, Nat. Geosci., 1, 221–227, https://doi.org/10.1038/ngeo156, 2008.
Randles, C. A., Da Silva, A. M., Buchard, V., Darmenov, A., Colarco, P. R., Aquila, V., Bian, H., Nowottnick, E. P., Pan, X., Smirnov, A., Yu, H., and Govindaraju, R.: Technical Report Series on Global Modeling and Data Assimilation, NASA TM-2016-104606 45, NASA Global Modeling and Assimilation Office, The MERRA-2 Aerosol Assimilation, available at: https://gmao.gsfc.nasa.gov/reanalysis/MERRA-2/docs/ (last access: 12 April 2019), 2016.
Randles, C. A., Da Silva, A. M., Buchard, V., Colarco, P. R., Darmenov, A., Govindaraju, R., Smirnov, A., Holben, B., Ferrare, R., Hair, J., Shinozuka, Y., and Flynn, C. J.: The MERRA-2 Aerosol Reanalysis, 1980 Onward. Part I: System Description and Data Assimilation Evaluation, J. Climate, 30, 6823–6850, https://doi.org/10.1175/Jcli-D-16-0609.1, 2017.
Ren, Y., Zhang, X. F., Wei, H. L., Xu, L., Zhang, J., Sun, J. X., Wang, X., and Li, W. J.: Comparisons of methods to obtain insoluble particles in snow for transmission electron microscopy, Atmos. Environ., 153, 61–69, https://doi.org/10.1016/j.atmosenv.2017.01.021, 2017.
Ricchiazzi, P., Yang, S. R., Gautier, C., and Sowle, D.: SBDART: A research and teaching software tool for plane-parallell radiative transfer in the Earth's atmosphere, B. Am. Meteorol. Soc., 79, 2101–2114, https://doi.org/10.1175/1520-0477(1998)079<2101:Sarats>2.0.Co;2, 1998.
Rittger, K., Painter, T. H., and Dozier, J.: Assessment of methods for mapping snow cover from MODIS, Adv. Water Resour., 51, 367–380, https://doi.org/10.1016/j.advwatres.2012.03.002, 2013.
Scambos, T. A., Haran, T. M., Fahnestock, M. A., Painter, T. H., and Bohlander, J.: MODIS-based Mosaic of Antarctica (MOA) data sets: Continent-wide surface morphology and snow grain size, Remote Sens. Environ., 111, 242–257, https://doi.org/10.1016/j.rse.2006.12.020, 2007.
Schwarz, J. P., Doherty, S. J., Li, F., Ruggiero, S. T., Tanner, C. E., Perring, A. E., Gao, R. S., and Fahey, D. W.: Assessing Single Particle Soot Photometer and Integrating Sphere/Integrating Sandwich Spectrophotometer measurement techniques for quantifying black carbon concentration in snow, Atmos. Meas. Tech., 5, 2581–2592, https://doi.org/10.5194/amt-5-2581-2012, 2012.
Seidel, F. C., Rittger, K., Skiles, S. M., Molotch, N. P., and Painter, T. H.: Case study of spatial and temporal variability of snow cover, grain size, albedo and radiative forcing in the Sierra Nevada and Rocky Mountain snowpack derived from imaging spectroscopy, The Cryosphere, 10, 1229–1244, https://doi.org/10.5194/tc-10-1229-2016, 2016.
Siegmund, A. and Menz, G.: Fernes nah gebracht–Satelliten-und Luftbildeinsatz zur Analyse von Umweltveränderungen im Geographieunterricht, Geographie und Schule, 154, 2–10, 2005.
Stamnes, K., Tsay, S. C., Wiscombe, W., and Jayaweera, K.: Numerically Stable Algorithm for Discrete-Ordinate-Method Radiative-Transfer in Multiple-Scattering and Emitting Layered Media, Appl. Optics, 27, 2502–2509, https://doi.org/10.1364/Ao.27.002502, 1988.
Toon, O. B., Mckay, C. P., Ackerman, T. P., and Santhanam, K.: Rapid Calculation of Radiative Heating Rates and Photodissociation Rates in Inhomogeneous Multiple-Scattering Atmospheres, J. Geophys. Res.-Atmos., 94, 16287–16301, https://doi.org/10.1029/JD094iD13p16287, 1989.
Vermote, E.: MOD09A1MODIS/Terra Surface Reflectance 8-Day L3 Global 500 m SIN Grid V006, NASA EOSDIS Land Processes DAAC, 2015.
Wang, R., Tao, S., Balkanski, Y., Ciais, P., Boucher, O., Liu, J. F., Piao, S. L., Shen, H. Z., Vuolo, M. R., Valari, M., Chen, H., Chen, Y. C., Cozic, A., Huang, Y., Li, B. G., Li, W., Shen, G. F., Wang, B., and Zhang, Y. Y.: Exposure to ambient black carbon derived from a unique inventory and high-resolution model, P. Natl. Acad. Sci., 111, 2459–2463, https://doi.org/10.1073/pnas.1318763111, 2014.
Wang, X., Doherty, S. J., and Huang, J. P.: Black carbon and other light-absorbing impurities in snow across Northern China, J. Geophys. Res.-Atmos., 118, 1471–1492, https://doi.org/10.1029/2012jd018291, 2013.
Wang, X., Xu, B. Q., and Ming, J.: An Overview of the Studies on Black Carbon and Mineral Dust Deposition in Snow and Ice Cores in East Asia, J. Meteorol. Res.-PRC, 28, 354–370, https://doi.org/10.1007/s13351-014-4005-7, 2014.
Wang, X., Pu, W., Zhang, X. Y., Ren, Y., and Huang, J. P.: Water-soluble ions and trace elements in surface snow and their potential source regions across northeastern China, Atmos. Environ., 114, 57–65, https://doi.org/10.1016/j.atmosenv.2015.05.012, 2015.
Wang, X., Pu, W., Ren, Y., Zhang, X., Zhang, X., Shi, J., Jin, H., Dai, M., and Chen, Q.: Observations and model simulations of snow albedo reduction in seasonal snow due to insoluble light-absorbing particles during 2014 Chinese survey, Atmos. Chem. Phys., 17, 2279–2296, https://doi.org/10.5194/acp-17-2279-2017, 2017.
Wang, Z. W., Gallet, J. C., Pedersen, C. A., Zhang, X. S., Ström, J., and Ci, Z. J.: Elemental carbon in snow at Changbai Mountain, northeastern China: concentrations, scavenging ratios, and dry deposition velocities, Atmos. Chem. Phys., 14, 629-640, https://doi.org/10.5194/acp-14-629-2014, 2014.
Warren, S. G.: Optical-Properties of Snow, Rev. Geophys., 20, 67–89, https://doi.org/10.1029/RG020i001p00067, 1982.
Warren, S. G.: Impurities in Snow – Effects on Albedo and Snowmelt Review, Ann. Glaciol., 5, 177–179, https://doi.org/10.3189/1984AoG5-1-177-179, 1984.
Warren, S. G.: Can black carbon in snow be detected by remote sensing?, J. Geophys. Res.-Atmos., 118, 779–786, https://doi.org/10.1029/2012jd018476, 2013.
Warren, S. G. and Wiscombe, W. J.: A Model for the Spectral Albedo of Snow .2. Snow Containing Atmospheric Aerosols, J. Atmos. Sci., 37, 2734–2745, https://doi.org/10.1175/1520-0469(1980)037<2734:Amftsa>2.0.Co;2, 1980.
Wiedensohler, A., Cheng, Y. F., Nowak, A., Wehner, B., Achtert, P., Berghof, M., Birmili, W., Wu, Z. J., Hu, M., Zhu, T., Takegawa, N., Kita, K., Kondo, Y., Lou, S. R., Hofzumahaus, A., Holland, F., Wahner, A., Gunthe, S. S., Rose, D., Su, H., and Pöschl, U.: Rapid aerosol particle growth and increase of cloud condensation nucleus activity by secondary aerosol formation and condensation: A case study for regional air pollution in northeastern China, J. Geophys. Res.-Atmos., 114, D00G08, https://doi.org/10.1029/2008jd010884, 2009.
Wiscombe, W. J. and Warren, S. G.: A Model for the Spectral Albedo of Snow .1. Pure Snow, J. Atmos. Sci., 37, 2712–2733, https://doi.org/10.1175/1520-0469(1980)037<2712:Amftsa>2.0.Co;2, 1980.
Wuttke, S., Seckmeyer, G., and König-Langlo, G.: Measurements of spectral snow albedo at Neumayer, Antarctica, Ann. Geophys., 24, 7–21, https://doi.org/10.5194/angeo-24-7-2006, 2006.
Xu, B. Q., Cao, J. J., Hansen, J., Yao, T. D., Joswia, D. R., Wang, N. L., Wu, G. J., Wang, M., Zhao, H. B., Yang, W., Liu, X. Q., and He, J. Q.: Black soot and the survival of Tibetan glaciers, P. Natl. Acad. Sci. USA, 106, 22114–22118, https://doi.org/10.1073/pnas.0910444106, 2009.
Yasunari, T. J., Bonasoni, P., Laj, P., Fujita, K., Vuillermoz, E., Marinoni, A., Cristofanelli, P., Duchi, R., Tartari, G., and Lau, K.-M.: Estimated impact of black carbon deposition during pre-monsoon season from Nepal Climate Observatory – Pyramid data and snow albedo changes over Himalayan glaciers, Atmos. Chem. Phys., 10, 6603–6615, https://doi.org/10.5194/acp-10-6603-2010, 2010.
Yasunari, T. J., Koster, R. D., Lau, W. K. M., and Kim, K. M.: Impact of snow darkening via dust, black carbon, and organic carbon on boreal spring climate in the Earth system, J. Geophys. Res.-Atmos., 120, 5485–5503, https://doi.org/10.1002/2014jd022977, 2015.
Zhang, R., Hegg, D. A., Huang, J., and Fu, Q.: Source attribution of insoluble light-absorbing particles in seasonal snow across northern China, Atmos. Chem. Phys., 13, 6091–6099, https://doi.org/10.5194/acp-13-6091-2013, 2013.
Zhao, C., Hu, Z., Qian, Y., Ruby Leung, L., Huang, J., Huang, M., Jin, J., Flanner, M. G., Zhang, R., Wang, H., Yan, H., Lu, Z., and Streets, D. G.: Simulating black carbon and dust and their radiative forcing in seasonal snow: a case study over North China with field campaign measurements, Atmos. Chem. Phys., 14, 11475–11491, https://doi.org/10.5194/acp-14-11475-2014, 2014.
Zhong, G., Song, K., Wang, Z., Du, J., Lei, X., Liu, D., and Zhang, B.: Verification and Comparison of the MODIS and AMSR-E Snow Cover Products in Northeast China, Journal of Glaciology and Geocryology, 32, 1262–1269, 2010.
Zhou, Y., Wang, X., Wu, X. Q., Cong, Z. Y., Wu, G. M., and Ji, M. X.: Quantifying Light Absorption of Iron Oxides and Carbonaceous Aerosol in Seasonal Snow across Northern China, Atmosphere-Basel, 8, 63, https://doi.org/10.3390/atmos8040063, 2017.