the Creative Commons Attribution 4.0 License.
the Creative Commons Attribution 4.0 License.
 | 07 Aug 2019
Quantifying the contribution of anthropogenic influence to the East Asian winter monsoon in 1960–2012
Xin Hao
Shengping He
Huijun Wang
Tingting Han
The East Asian winter monsoon (EAWM) is greatly influenced by many factors that can be classified as anthropogenic forcing and natural forcing. Here we explore the contribution of anthropogenic influence to the change in the EAWM over the past decades. Under all forcings observed during 1960–2013 (All-Hist run), the atmospheric general circulation model is able to reproduce the climatology and variability of the EAWM-related surface air temperature and 500 hPa geopotential height and shows a statistically significant decreasing EAWM intensity with a trend coefficient of yr−1, which is close to the observed trend. By contrast, the simulation, which is driven by the same forcing as the All-Hist run but with the anthropogenic contribution to them removed, shows no decreasing trend in the EAWM intensity. By comparing the simulations under two different forcing scenarios, we further reveal that the responses of the EAWM to the anthropogenic forcing include a rise of 0.6∘ in surface air temperature over East Asia as well as weakening of the East Asian trough, which may result from the poleward expansion and intensification of the East Asian jet forced by the change in temperature gradient in the troposphere. Additionally, compared with the simulation without anthropogenic forcing, the frequency of strong (weak) EAWM occurrence is reduced (increased) by 45 % (from 0 to 10/7). These results indicate that the weakening of the EAWM during 1960–2013 may be mainly attributed to the anthropogenic influence.
- Article
(2954 KB) -
Supplement
(525 KB) - BibTeX
- EndNote


The East Asian winter monsoon (EAWM) is one of the most dominant climate systems in East Asia. It greatly affects the disastrous winter weather such as cold waves, snowstorms, air pollution, and spring dust storms (Li et al., 2016; Li and Wang, 2013; Wang et al., 2009; Zhou et al., 2009; Chang et al., 2006). Prominent circulation components from the surface to the upper troposphere associated with temperature conditions during the boreal winter are dynamically linked to the EAWM. At the surface, the EAWM contains the cold Siberian high dominating over the East Asian continent and the warm Aleutian low located in the high-latitude North Pacific, which is accompanied by prevailing northwesterly winds in the low-level troposphere (He and Wang, 2013; Wang and Jiang, 2004; Gong et al., 2001; Guo, 1994; Lau and Li, 1984). At 500 hPa is the East Asian trough which determines the outbreak and intensity of the EAWM (He et al., 2013; Cui and Sun, 1999; Sun and Li, 1997). In the upper troposphere, a key component of the EAWM is the East Asian jet, with its maximum core being located to the southeast of Japan (Jhun and Lee, 2004; Boyle and Chen, 1987). Concurrent with the change in these atmospheric circulations, the change in winter surface air temperature (SAT) over East Asia is closely related to the variation in the EAWM (Hao and He, 2017; Lee et al., 2013; Wang et al., 2010).
The EAWM experienced remarkable transitions, with clear weakening from the mid-1980s and re-amplification after the mid-2000s (e.g., Yun et al., 2018; Wang and Chen, 2014). The decadal oscillations in sea surface temperature (SST) are generally considered to be the major source of the decadal variability of the EAWM, such as the Pacific Decadal Oscillation and the Atlantic Multidecadal Oscillation (Hao and He, 2017; Ding et al., 2014; Li and Bates, 2007). Jhun and Lee (2004) suggested that the Arctic Oscillation may also contribute to the decadal variability in the EAWM. Additionally, the above primary components of the EAWM system are subject to obvious changes under the influence of global warming (e.g., Li et al., 2018, 2015; IPCC, 2013; Hori and Ueda, 2006; Kimoto, 2005; Zhang et al., 1997). Under different global warming scenarios, thermodynamic contrast between the East Asian continent and the Pacific Ocean is reduced uniformly, characterized by a weakening of the East Asian trough (EAT) as well as the East Asian jet, indicating a weakening of the EAWM (e.g., Xu et al., 2016; Kimoto, 2005). Previous studies based on coupled models generally agree on the effect of global warming on the EAWM (Gong et al., 2018; Miao et al., 2018; Hong et al., 2017; Xu et al., 2016; Kimoto, 2005; Hu et al., 2000). Using phase 5 of the Coupled Model Intercomparison Project output, Miao et al. (2018) deduced that both increased greenhouse gas concentrations and natural forcings (volcanic aerosols and solar variability) play key roles in the interdecadal weakening of the EAWM in the mid-1980s. However, previous studies mainly conduct qualitative research on the potential influence of global warming, and it is still unclear to what extent the anthropogenic activities can impact the EAWM. This study aims to quantitatively estimate the contribution of increasing anthropogenic emissions over the past decades to the change in the EAWM, which is essential for the projection of the EAWM in the future.
A monthly mean dataset including SAT, 500 hPa geopotential height, and 250 hPa zonal wind is obtained from the National Center for Environmental Prediction/National Center for Atmospheric Research (NCEP/NCAR) Reanalysis 1 dataset at a horizontal resolution of 2.5∘ × 2.5∘ (Kalnay et al., 1996). Hereafter it is referred to as “observations”. To explore the contribution of the anthropogenic emissions to climate change, two different simulations from the C20C+ Detection and Attribution Project (http://portal.nersc.gov/c20c/data.html, last access: 5 August 2019) are compared in the context of two different forcing scenarios. One is the All-Hist which was forced with time-varying boundary conditions (e.g., greenhouse gas concentrations, anthropogenic and natural aerosols, ozone, solar luminosity, land cover, SSTs, and sea ice) observed during the past few decades. The other is the Nat-Hist which was forced with observed SST and sea ice concentrations from which the anthropogenic contribution has been removed (please refer to http://portal.nersc.gov/c20c/data.html, last access: 5 August 2019, for more details). Meanwhile, the natural external forcings such as greenhouse gas concentrations and aerosols were set to preindustrial levels. We analyzed the simulations with the HadGEM3-A-N216 atmospheric general circulation model (Christidis et al., 2013; approximately 0.56∘ × 0.83∘ horizontally) available from the C20C+ Detection and Attribution Project, which has been used to conduct the above two sets of experiments from 1960 to 2013. Both the All-Hist and Nat-Hist runs include 15 ensemble members. Each realization in the two scenarios differs from the other only in its initial state. The ensemble mean of run numbers 1, 2, 5, 13, 14, and 15 (which show a better performance in simulating interannual, decadal, and linear trend changes in the EAWM) under the All-Hist scenarios agrees best with the reanalysis dataset (such as climatology, interannual, and decadal changes in the EAWM; evaluation of the other runs of the model shown in the Supplement). Therefore, the simulations of these 6-member ensembles are used in this study.
In this study, we focus on the winter mean, which is the average of December, January, and February (e.g., winter 2008 refers to the boreal winter of 2008/2009). Two intensity indices are used to describe the variability of the EAWM: one is defined as the area-averaged height geopotential at 500 hPa at 35–45∘ N, 125–145∘ E (EAWMI_HGT; Sun and Li, 1997); the other is defined as the area-averaged SAT at 25–45∘ N, 105–145∘ E (EAWMI_SAT; Lee et al., 2013). Both area-averaged values are multiplied by −1 so that positive values correspond to a strong EAWM; a 9-year running mean of the index represents the interdecadal variability of the EAWM.
3.1 Assessment of the atmospheric circulation pattern simulated by the model in All-Hist runs
The EAWM is characterized by northerly winds over East Asia, the Siberian high, the Aleutian low, the deep East Asian trough, the upper tropospheric East Asian jet stream, as well as the cold and dry conditions over East Asia (e.g., Hao et al., 2016; Lee et al., 2013; He and Wang, 2013; Wang and Jiang, 2004; Sun and Li, 1997). In this study, the performance of the HadGEM3-A-N216 model in simulating the above characteristics of the EAWM is firstly evaluated by comparing the corresponding results in the All-Hist runs with the reanalysis dataset in the period of 1960–2012.
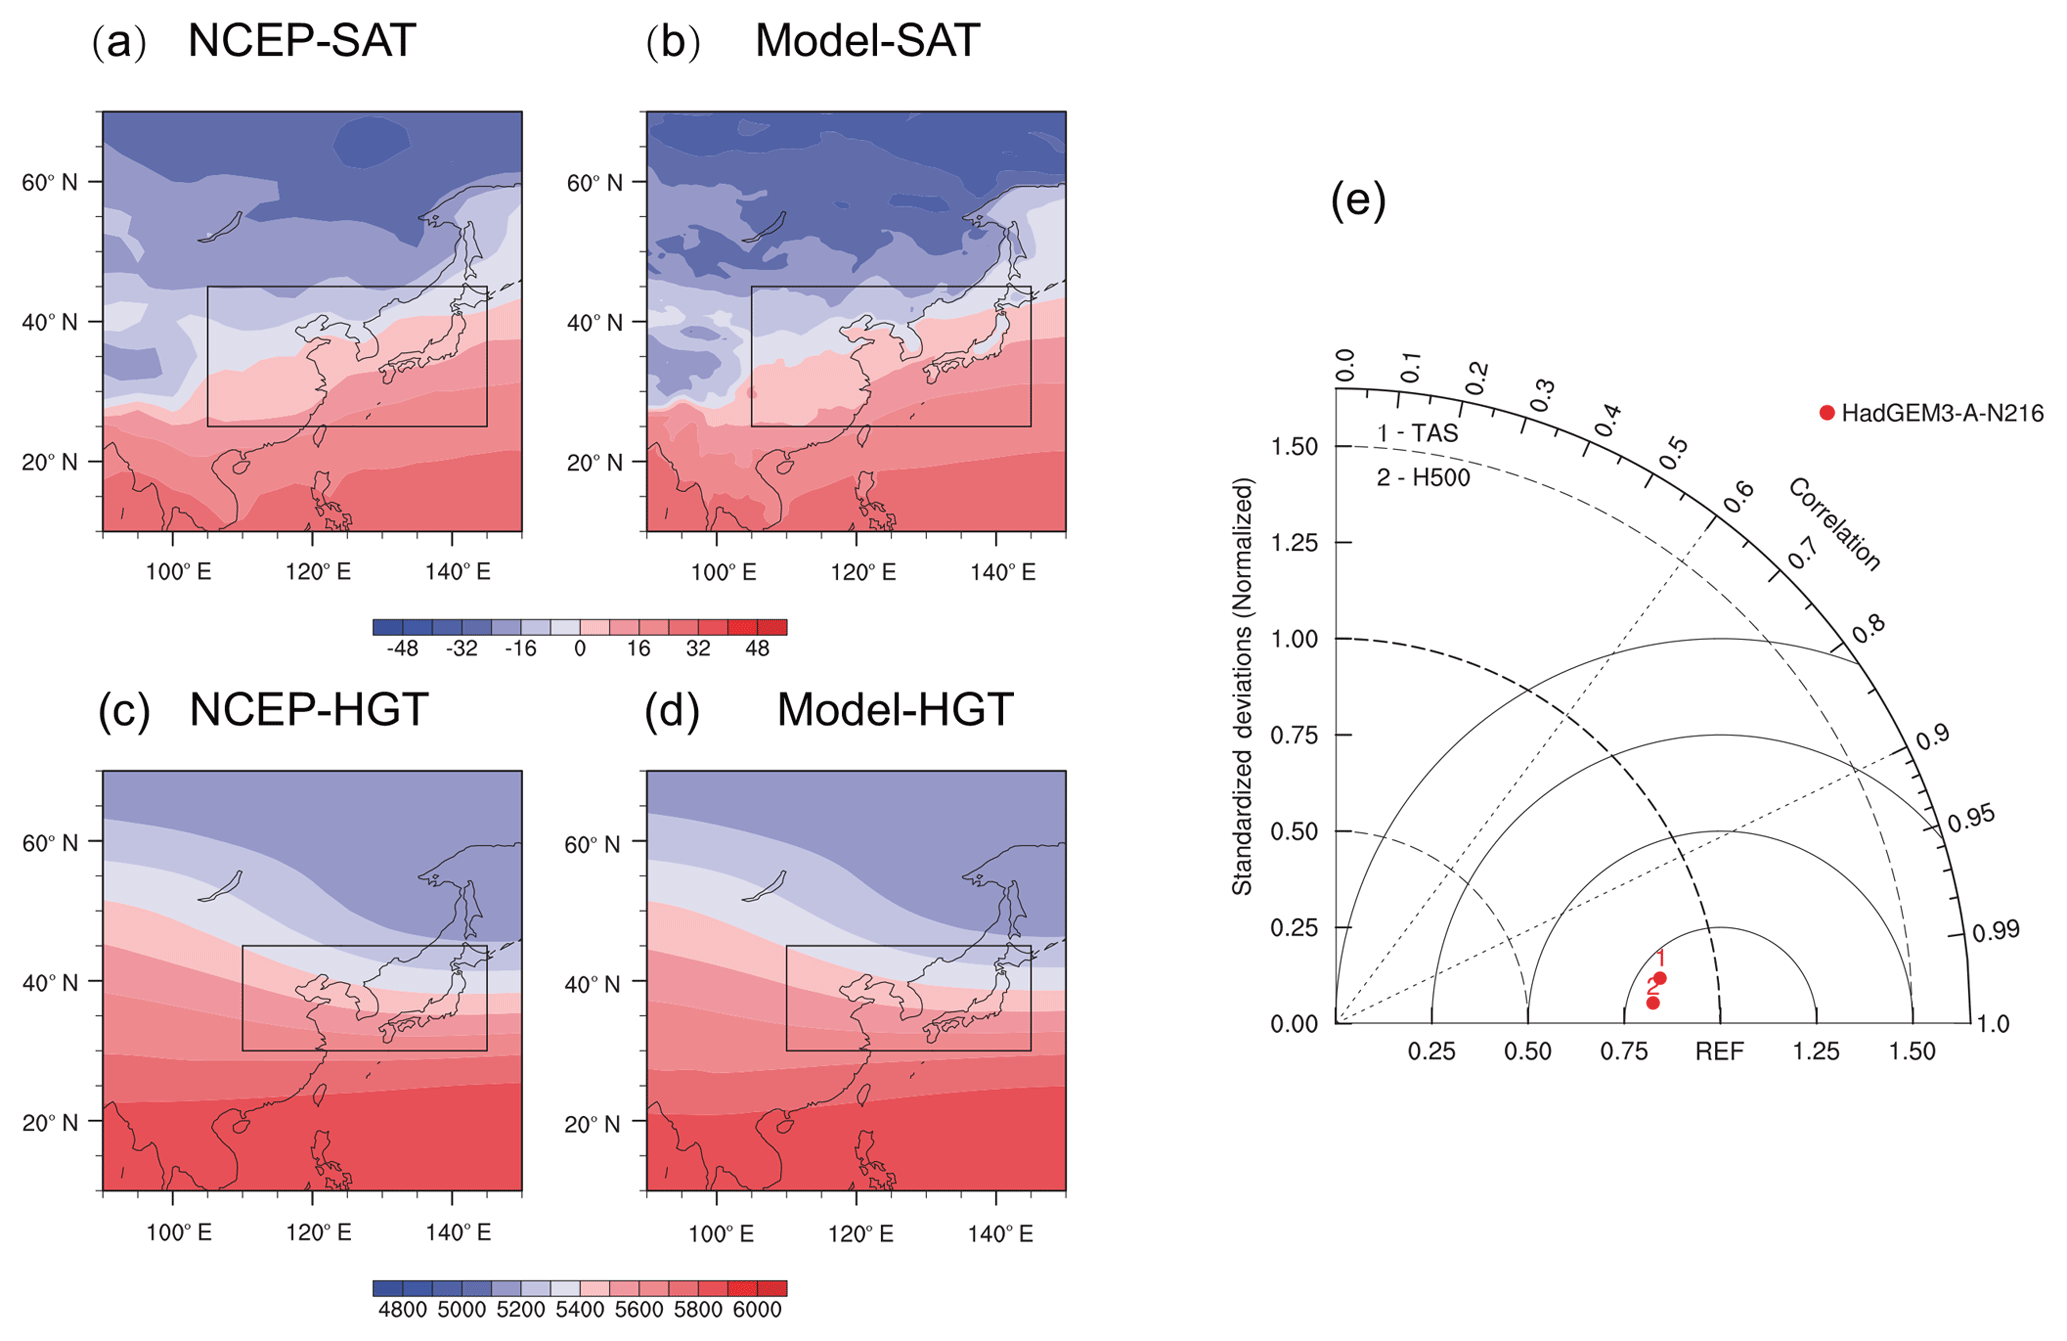
Figure 1Climatology of winter-mean (DJF) (a) surface air temperature (shading, ∘) and (c) 500 hPa geopotential height (shading, meters) during 1960–2012, based on NCEP reanalysis data. (b, d) As in (a) and (b) but for the model's All-Hist runs. (e) Taylor diagram of winter-mean climatology for surface air temperature (TAS; 25–45∘ N, 105–145∘ E) and 500 hPa geopotential height (H500; 25–45∘ N, 105–145∘ E). The rectangle marks the areas used to calculate the climatology in the Taylor diagram.
Figure 1a–d show the climatology of the SAT and 500 hPa geopotential height in winter from the observations and simulations in the All-Hist run. The winter SAT climatology over East Asia in simulations (Fig. 1a) is generally consistent with the observed counterpart (Fig. 1b). The model has successfully reproduced the dominant features of East Asian winter SAT such as the northwest-to-southeast temperature gradient, the 0∘ isotherm of SAT stretching from western China (around 27.5∘ N) northeastward to northern Japan (around 42.5∘ N), and the cold center located over the Tibetan Plateau (Fig. 1a and b). Compared with the observations, the simulated SAT shows an apparent cold bias north of 40∘ N but less bias south of 40∘ N. In the middle troposphere, the main features (position of axis and intensity) of the EAT are also generally reproduced by the model. The simulated SAT in 25–45∘ N, 105–145∘ E (Lee et al., 2013) and 500 hPa geopotential height in 35–45∘ N, 125–145∘ E (Sun and Li, 1997) used for the EAWM indices show high spatial correlations with the observations (Fig. 1e), which exceed 0.99. Additionally, high spatial correlations of the simulated SAT and 500 hPa geopotential height with the observation are accompanied by small root mean square errors (Fig. 1e). This means that the All-Hist runs have simulated the EAWM climatology well.
The variability of the EAWM is also compared between the simulations and the observations. It is found that the correlations between the simulated EAWM indices and the observed EAWM indices are 0.3 for EAWMI_SAT and 0.31 for EAWMI_HGT, respectively (Fig. 2), which are statistically significant. Additionally, the interdecadal variability of the EAWM indices is closely correlated between the simulations and the observation, with correlation coefficients of 0.7 for EAWMI_SAT and 0.76 for EAWMI_HGT (Fig. 2). The result suggests that the All-Hist runs have simulated the interannual and interdecadal variability of the EAWM well and can be further used to investigate the anthropogenic impact on the EAWM.
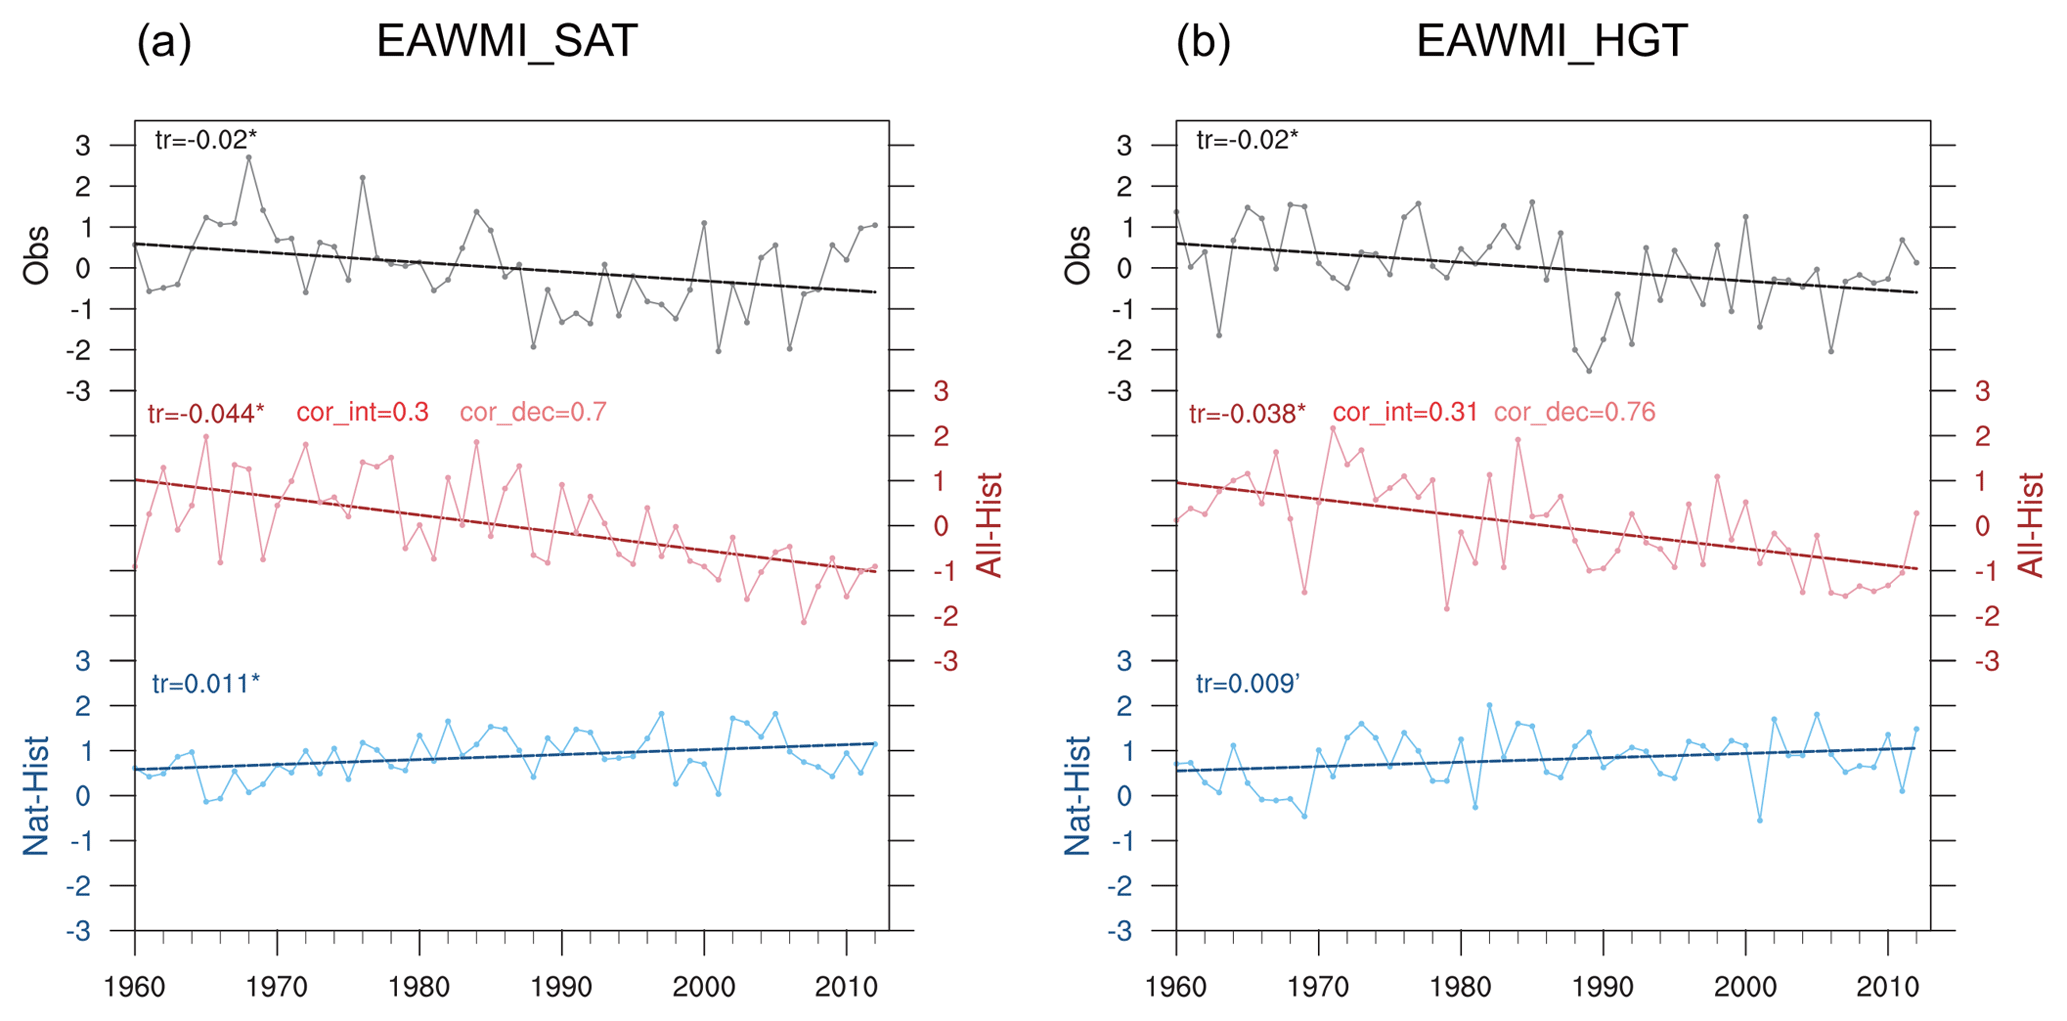
Figure 2(a) The time series of the normalized EAWMI_SAT (curve) and their linear trend (line) during 1960–2012, based on the NCEP reanalysis dataset (top), outputs of the models in the All-Hist run (middle), and outputs of the models in the Nat-Hist run (bottom). (b) As in (a) but for the EAWMI_HGT. “tr” is an abbreviation for “linear trend coefficient”. “*” means the tr is significant at the 95 % confidence level based on the Mann–Kendall test, and “”' means the tr is significant at the 90 % confidence level. “cor” is an abbreviation for “correlation coefficient between the simulated EAWM index under the All-Hist scenario and the observed EAWM index”. “cor_dec” is an abbreviation for “correlation coefficient on a decadal timescale”. Note that the time series of the EAWM indices based on outputs of models in the Nat-Hist runs are standardized by the climatology simulated by the All-Hist runs.
3.2 Contribution of anthropogenic influence to the East Asian winter monsoon
To investigate the anthropogenic contribution to the change in the EAWM, we compare the EAWM in the All-Hist runs with those in the Nat-Hist runs. Both of the EAWM indices in the All-Hist runs show statistically significant decreases over the past decades, with trend coefficients of −0.044 (yr−1) and −0.038 (yr−1), respectively, which are similar to the observed trends (−0.023 and −0.02, respectively; Fig. 2). By contrast, the EAWM indices in the Nat-Hist runs show an increasing trend instead (Fig. 2). As shown in Fig. 2, there is an obvious increase in EAWMI during 1960–1980 in the Nat-Hist runs. The negative phase of the Pacific Decadal Oscillation and the Atlantic Multidecadal Oscillation may be responsible for the enhancing of the EAWM in the Nat-Hist runs during 1960–1980 (Hao and He, 2017; Zhu et al., 2015; Ding et al., 2014). This suggests that the increasing anthropogenic emissions in the past decades may contribute to the weakening of the EAWM.
Figure 3 displays the composited differences of the simulated winter SAT and 500 hPa geopotential height between the All-Hist runs and in the Nat-Hist runs, which approximately reflect the response of the EAWM to anthropogenic forcing. The composited differences show clearly that winters with anthropogenic forcing see apparent warmer anomalies over most parts of East Asia except for southeastern China as well as warmer conditions over the western North Pacific (Fig. 3a). Such a response is similar to the one revealed by previous CMIP5 studies (Hong et al., 2017; Xu et al., 2016). Xu et al. (2016) suggested that the large positive anomalies over the high-latitude western North Pacific are due to a northward shift of the significantly intensified Aleutian low induced by the melting sea ice in the Bering Sea and Okhotsk Sea (Gan et al., 2017). Quantitatively, compared with the situation without anthropogenic influence, the wintertime SAT averaged over 20–60∘ N, 100–140∘ E increases by 0.6∘ over the last half-century due to anthropogenic influence (Fig. 3a). In the middle troposphere, responses of the 500 hPa geopotential height to anthropogenic forcing show obviously positive anomalies over East Asia with a value of 15.7 m, implying a shallower EAT which results in less powerful cold air to East Asia (Fig. 3b). The model simulations indicate clearly that the anthropogenic influence may induce a weaker EAWM.
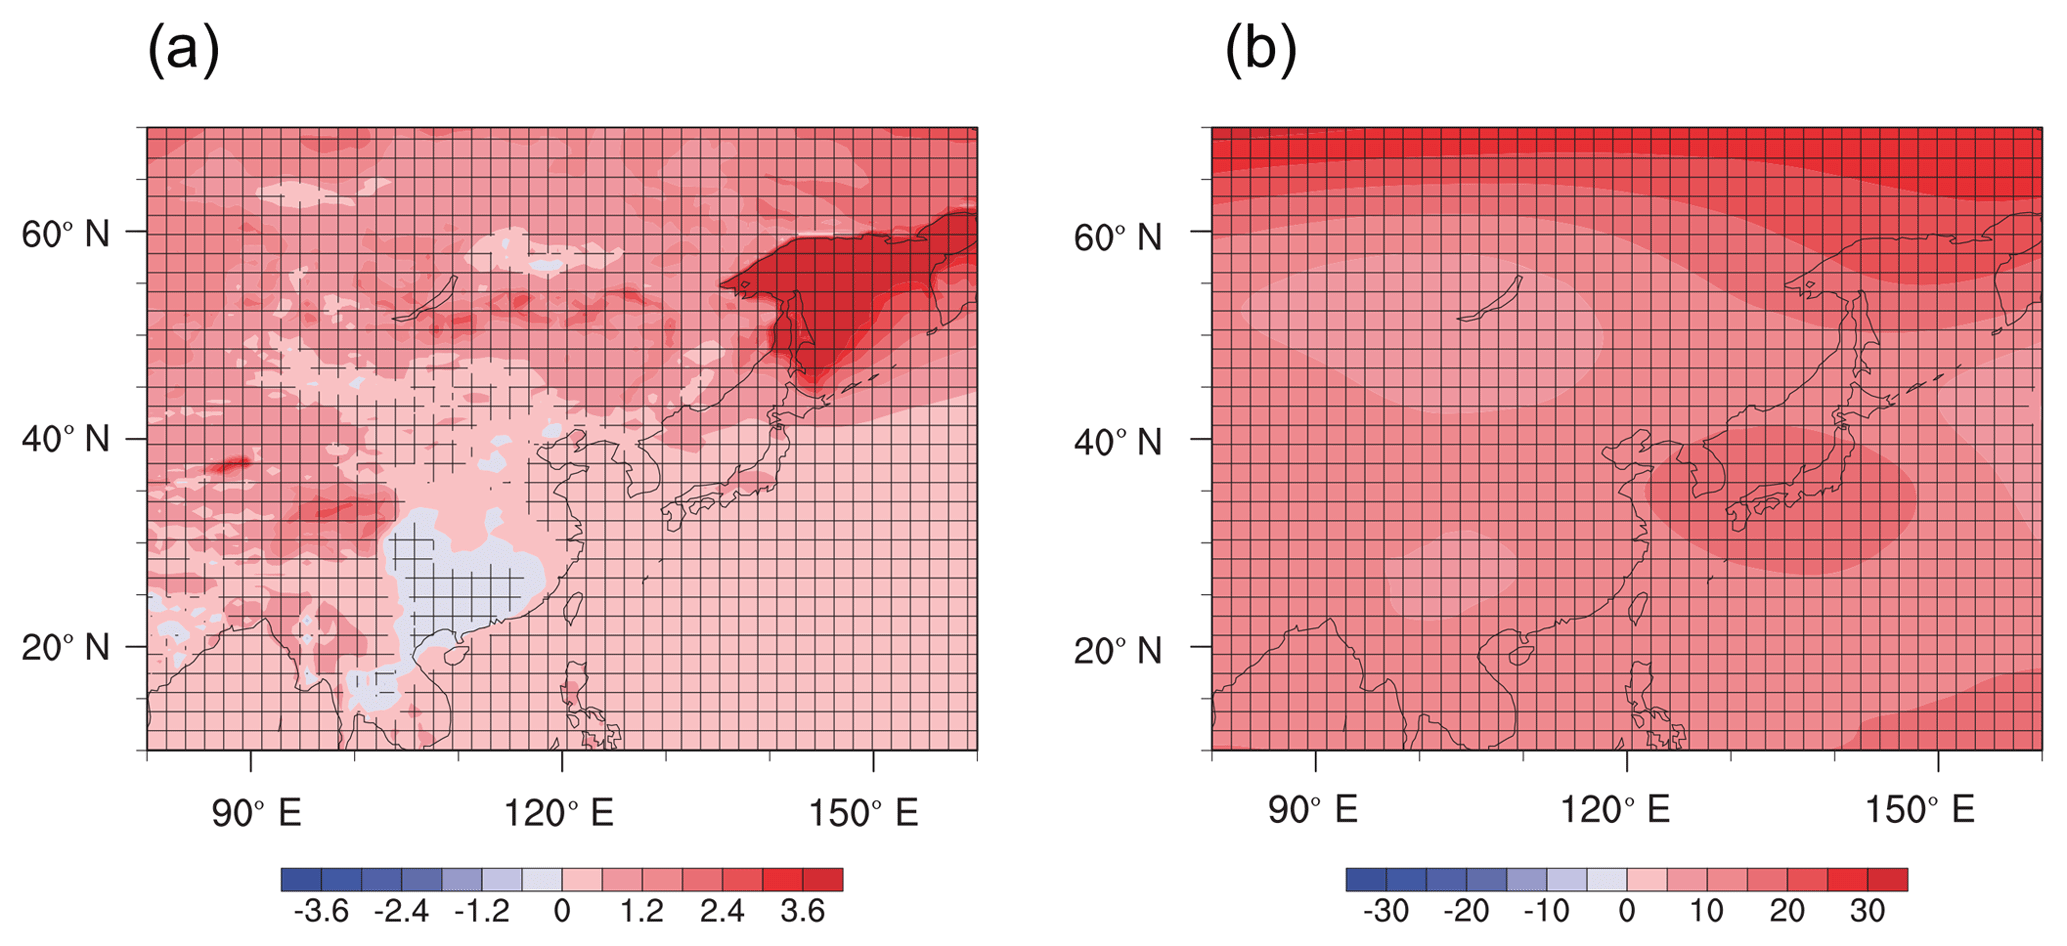
Figure 3Composite differences of winter-mean (a) surface air temperature (shading, ∘) and (b) 500 hPa geopotential height (shading, meters) between the All-Hist runs and Nat-Hist runs, during 1960–2012. The plus signs denote where the composite differences are significant at the 95 % confidence level based on a two-sided Student's t test.

Figure 4Composite differences of winter-mean (a) air temperature (shading, ∘) over 90–150∘ E, (b) 250 hPa zonal wind (shading, m s−1), and (c) sea level pressure (shading, hPa) and 850 hPa wind (vector, m s−1) between the All-Hist runs and Nat-Hist runs, during 1960–2012. Red contours denote the climatology of the All-Hist runs. The plus signs denote where the composite differences are significant at the 95 % confidence level based on a two-sided Student's t test.
It should be noted that, in the low-level troposphere, the high-latitude warming induced by the anthropogenic forcing is apparently stronger than the warming at lower latitudes (Fig. 4a), which is the so-called “polar amplification” (Meehl et al., 2007; Collins et al., 2013). Meanwhile, in the high-level troposphere, obviously warming occurs over the tropical regions and the Arctic, but cooling occurs over middle latitudes (around 50∘ N) under the anthropogenic influence (Fig. 4a). As a result, a broadening and intensifying Hadley circulation appears, which is consistent with the observed phenomena revealed by previous studies of a poleward expansion and intensification of the winter Hadley circulation in the past few decades (Hu and Fu, 2007; Mitas and Clement, 2005; Hu et al., 2005). Such a change in the Hadley circulation implies a poleward shift of the East Asian jet (Fig. 4b), together with a reinforcement and an expansion of a western Pacific subtropical high and a decrease in SLP in northwestern China, the Sea of Okhotsk, the Bering Sea, and the Gulf of Alaska (Fig. 4c). The change in SLP also indicates a weak decrease in the Siberian high and an intensified Aleutian low. Thus, under the anthropogenic influence, significant easterly anomalies occur at the middle and high latitudes of East Asia and significant southerly anomalies occur at the low latitude of East Asia (Fig. 4c), leading to a subdued EAWM. We further explore the contribution of anthropogenic influence to the occurrence of a strong/weak EAWM. The case with the normalized index larger than 1.0 (smaller than −1.0) is defined as a strong (weak) EAWM event. The number of strong/weak EAWM events is shown in Fig. 5. The two observed EAWM indices display 10 (8) and 9 (9) strong (weak) EAWM events during 1960–2012, respectively. Two simulated EAWM indices in the All-Hist run display 11 (10) and 11 (7) strong (weak) EAWM events, respectively. The number of strong or weak EAWM events forced by the observed time-varying boundary conditions during the past few decades (All-Hist run) is very close to the number in observations. However, during 1960–2012, the two simulated EAWM indices in the Nat-Hist runs display 21 (0) and 19 (0) strong (weak) EAWM events, which is remarkably different from the number in the All-Hist runs as well as the observations. It implies that, in the past decades, the frequency of occurrence of strong EAWM events may have decreased by 45 % due to the anthropogenic forcing, and the anthropogenic forcing is a dominant contributor to the occurrence of weak EAWM events.
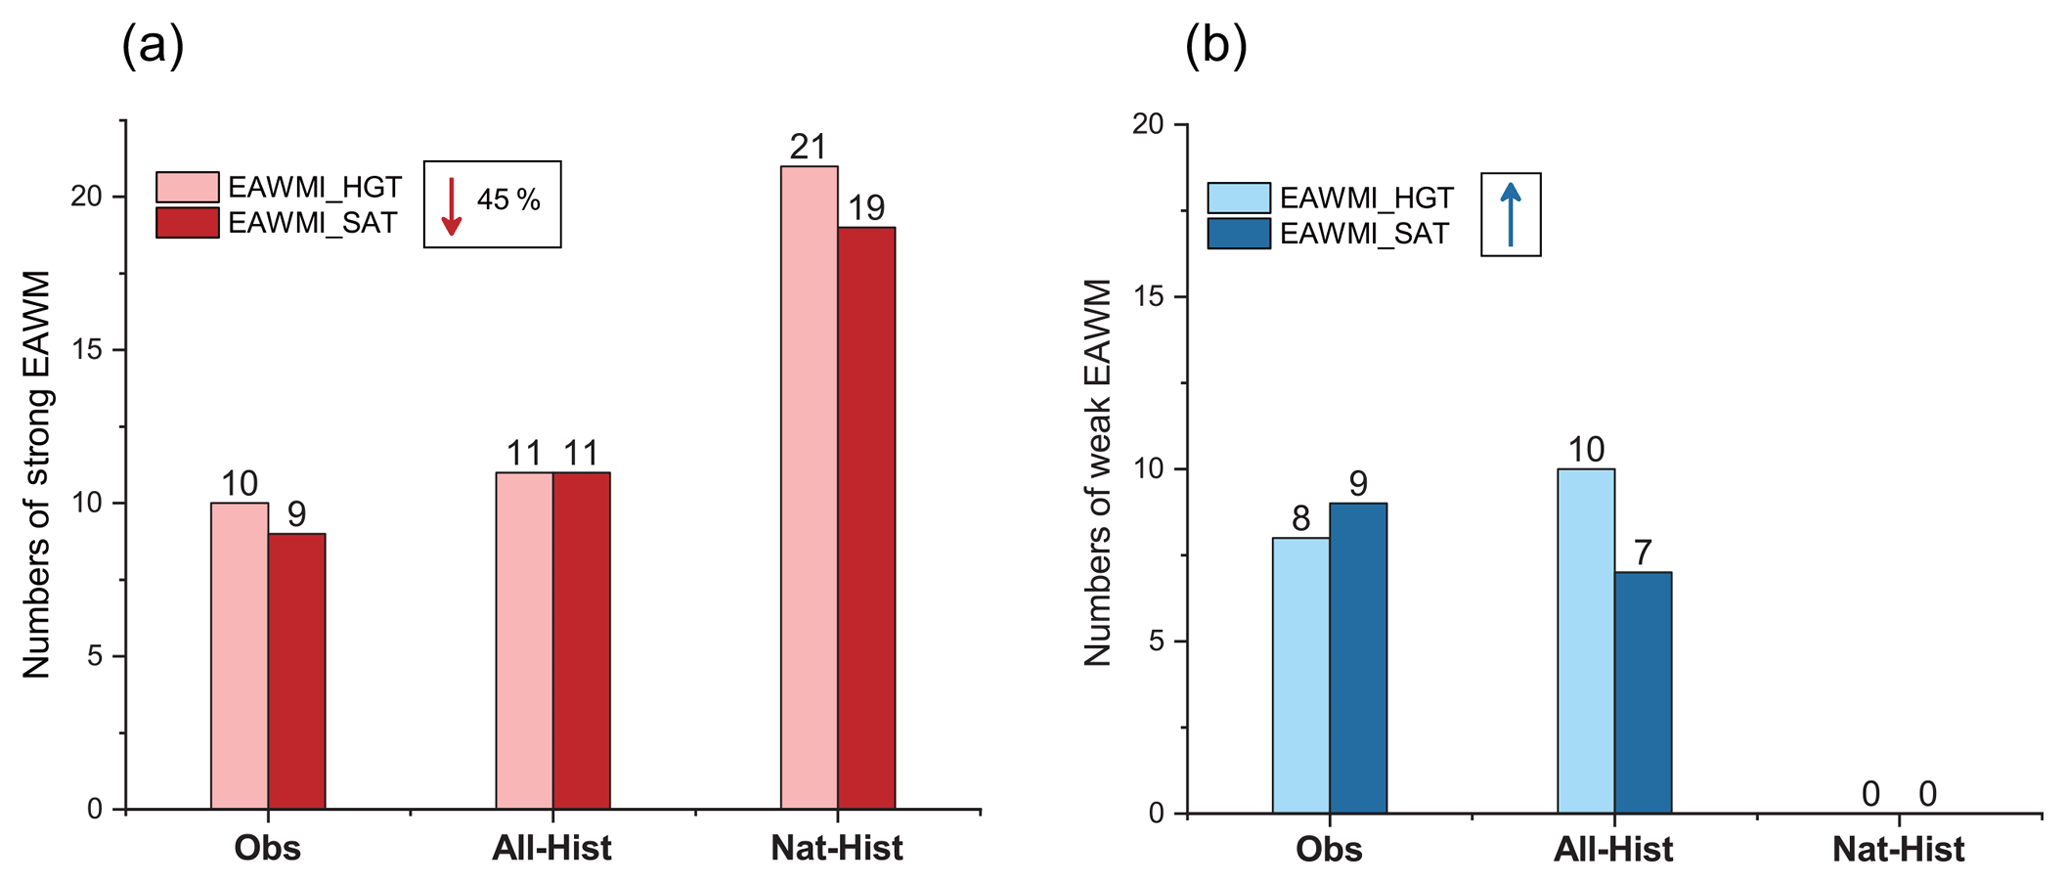
Figure 5(a) The number of strong EAWM events during 1960–2012, based on the NCEP reanalysis dataset (left), outputs of models in the All-Hist runs (middle), and outputs of models in the Nat-Hist runs (right). (b) As in (a) but for weak EAWM events.
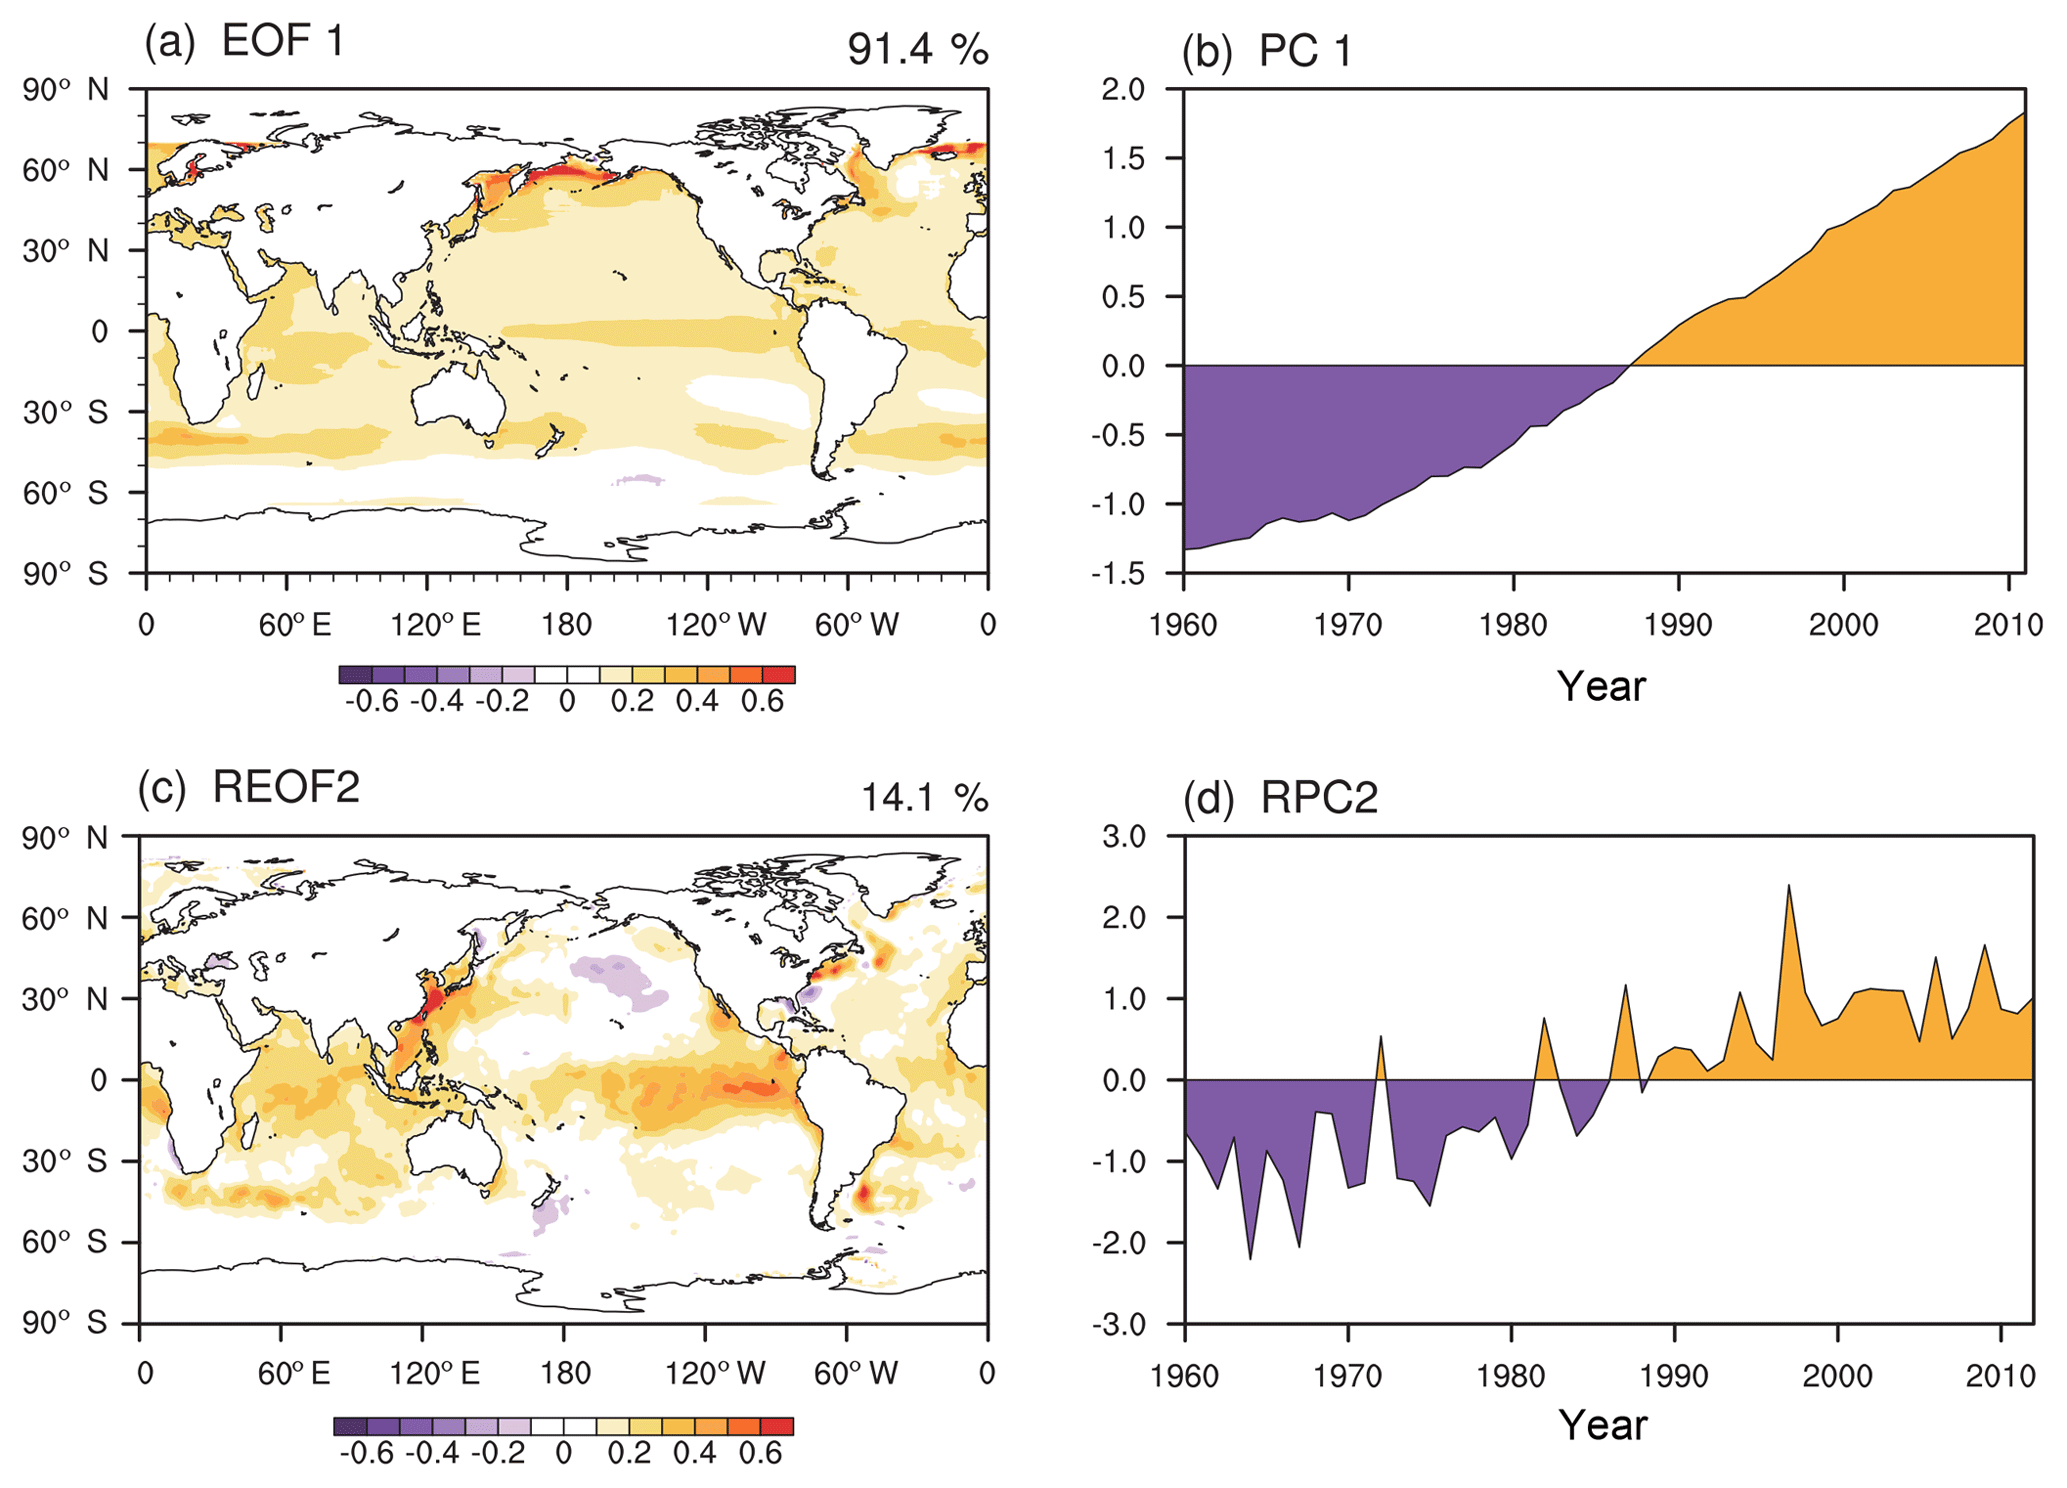
Figure 6The first leading mode (EOF1; a) and associated principal component (PC1; b) of the difference of the winter-mean sea surface temperature forcing between the All-Hist runs and Nat-Hist runs by empirical orthogonal function analysis based on the period of 1960–2013. The second leading mode (REOF2; c) and associated principal component (RCP2; d) of the winter-mean sea surface temperature from the HadISST data by rotated empirical orthogonal function analysis based on the period of 1960–2013.
Note that there is uncertainty in the EAWM simulated by the Nat-Hist runs. A long-term warming occurred in global SST under the influence of global warming over the past decades (Fig. 6c), causing a weakened EAWM (Hao et al., 2018). We processed the difference of SST forcing between the All-Hist runs and Nat-Hist runs by empirical orthogonal function analysis as EOF1 (Fig. 6a) and associated principal component 1 (Fig. 6b). The first leading mode shows a long-term oceanic warming with an explained variance of 91.4 %, characterized by negative anomalies in high-latitude oceans of the Southern Hemisphere, positive anomalies in tropical oceans and mid-latitude oceans of the Southern Hemisphere, and intense positive anomalies in the high-latitude oceans around 60∘ N. It shows similar intensity and characteristics to the observed warming over global oceans. However, a cooling occurred in the northern Pacific, and an obvious warming over the Kuroshio region, which was not captured by the models, may weaken the EAWM (Sun et al., 2016). This difference may induce an underestimation of the EAWM in Nat-Hist runs.
The contribution of the anthropogenic influence to the climatology, trends, and frequency of occurrence of a strong/weak EAWM is explored in this study based on numerical simulations. Firstly, we evaluate the performance of the climate model (HadGEM3-A-N216) in simulating the climatology of wintertime circulation over East Asia and variation of EAWM indices during 1960–2012. The winter-mean states of SAT and 500 hPa geopotential height related to the EAWM in the All-Hist runs resemble closely those in observation with spatial correlation coefficients of greater than 0.99. Also, the interannual and interdecadal variations of the EAWMI_HGT and EAWMI_SAT can be reproduced well by the model under the All-Hist scenario. Because of the good performance of the All-His runs in simulating the EAWM indices and winter-mean atmospheric circulation over East Asia, the exploration of changes in the EAWM induced by anthropogenic influence is considered reliable.
Under the All-Hist scenario, the EAWM indices have significantly declining trends over the past decades, which are consistent with those in observations, indicating that the weakening of the EAWM could be simulated by the climate model with all forcings. However, the EAWM indices do not have such trends in the Nat-Hist runs. Comparing the area-averaged SAT and 500 hPa geopotential height related to the EAWM for the period of 1960–2012 between two families of experiments, we found that anthropogenic emissions induce obviously positive SAT anomalies in the majority of East Asia and a weakened EAT, as shown in previous results (Hu et al., 2000; Hori and Ueda, 2006; Xu et al., 2016; Hong et al., 2017). Additionally, 11 (11) strong EAWM events and 10 (7) weak EAWM events are forced by the All-Hist scenario during 1960–2012, which is close to the frequency of occurrence of strong and weak EAWM events in observations, while 21 (19) strong EAWM events and 0 (0) weak EAWM events are forced by the Nat-Hist scenario. Overall, under anthropogenic influence, during 1960–2012, the EAWM continued to be weakened, and the frequency of occurrence of a strong (weak) EAWM had decreased (increased) by 45 % (from 0 to 10/7). The poleward expansion and intensification of the East Asian jet induced by anthropogenic influence may be the reason for the weakening of the EAWM. A decreasing trend is found in both the observation and in the All-Hist runs, and therefore more attention should be given to the EAWM variability under anthropogenic influence.
The model data used in this study are archived with the C20C+ Detection and Attribution Project and are freely available from https://portal.nersc.gov/c20c/data.html (last access: 5 August 2019).
The supplement related to this article is available online at: https://doi.org/10.5194/acp-19-9903-2019-supplement.
XH conceived the idea for the study and wrote the paper. All the authors contributed to the development of the method and to the data analysis.
The authors declare that they have no conflict of interest.
This work was supported by the National Science Foundation of China (grant nos. 41421004, 41875118, 41605059, and 41505073). All the datasets can be accessed publicly. The NCEP analysis dataset can be downloaded from https://www.esrl.noaa.gov/psd/data (last access: 5 August 2019), and the simulations can be downloaded from http://portal.nersc.gov/c20c/data.html (last access: 5 August 2019).
This research has been supported by the National Science Foundation of China (grant nos. 41421004, 41875118, 41605059, and 41505073).
This paper was edited by Jianping Huang and reviewed by Haipeng Yu and two anonymous referees.
Boyle, J. S. and Chen, T. J.: Synoptic aspects of the wintertime East Asian monsoon, in: Monsoon Meteorology, edited by: Chang, C. P. and Krishnamurti, T. N., Oxford University Press, 125–160, 1987.
Chang, C. P., Wang, Z., and Hendong, H.: The Asian winter monsoon, in: The Asian Monsoon, edited by: Wang, B., Springer Press, Berlin, Heidelberg, 89–127, 2006.
Christidis, N., Stott, P. A., Scaife, A. A., Arribas, A., Jones, G. S., Copsey, D., Knight, J. R., and Tennant, W. J.: A new HadGEM3-A-based system for attribution of weather- and climate-related extreme events, J. Climate, 26, 2756–2783, https://doi.org/10.1175/JCLI-D-12-00169.1, 2013.
Collins, M., Knutti, R., Arblaster, J., Dufresne, J. L., Fichefet, T., Friedlingstein, P., Gao, X., Gutowski, W. J., Johns, T., Krinner, G., Shongwe, M., Tebaldi, C., Weaver, A. J., and Wehner, M.: Long-term climate change: projections, commitments and irreversibility, in: Climate Change 2013: The Physical Science Basis, Contribution of Working Group I to the Fifth Assessment Report of the Intergovernmental Panel on Climate Change, edited by: Stocker, T. F., Qin, D., Plattner, G. K., Tignor, M., Allen, S. K., Boschung, J., Nauels, A., Xia, Y., Bex, V., and Midgley, P. M., Cambridge University Press, Cambridge, UK and New York, NY, 2013.
Cui, X. P. and Sun, Z. B.: East Asian winter monsoon index and its variation analysis, J. Nanjing Inst. Meteo., 22, 321–325, 1999 (in Chinese).
Ding, Y. H., Liu, Y., Liang S., Ma, X., Zhang, Y., Si, D., Liang, P., Song, Y., and Zhang, J.: Interdecadal variability of the East Asian winter monsoon and its possible links to global climate change, J. Meteorol. Res., 28, 693–713, 2014.
Gan, B. L., Wu, L. X., Jia, F., Li, S. J., Cai, W. J., Nakamura, H., Alexander, M. A., and Milley, A. J.: On the response of the Aleutian Low to Greenhouse Warming, J. Climate, 30, 3907–3925, 2017.
Gong, D. Y., Wang, S. W., and Zhu, J. H.: East Asian winter monsoon and Arctic Oscillation, Geophys. Res. Lett., 28, 2073–2076, 2001.
Gong, H. N., Wang, L., Zhou, W., Chen, W., Wu, R. G., Liu, L., Nath, D., and Leung, M. Y. T.: Revisiting the northern mode of East Asian winter monsoon variation and its response to global warming, J. Climate, 31, 9001–9014, 2018.
Guo, Q. Y.: Relationship between the variations of East Asian winter monsoon and temperature anomalies in China, Q. J. Appl. Meteorol., 5, 218–225, 1994 (in Chinese).
Hao, X. and He, S. P.: Combined effect of ENSO-like and Atlantic Multidecadal Oscillation on the interannual variability of the East Asian winter monsoon, J. Climate, 30, 2697–2716, 2017.
Hao, X., Li, F., Sun, J. Q., Wang, H. J., and He, S. P.: Assessment of the response of the East Asian winter monsoon to ENSO-like SSTAs in three U.S. CLIVAR Project models, Int. J. Climatol., 36, 847–866, 2016.
Hao, X., He, S. P., Han, T. T., and Wang, H. J.: Impact of global oceanic warming on winter Eurasian climate, Adv. Atmos. Sci., 35, 1254–1264, 2018.
He, S. P. and Wang, H. J.: Oscillating relationship between the East Asian winter monsoon and ENSO, J. Climate, 26, 9819–9838, 2013.
He, S. P., Wang, H. J., and Liu, J.: Changes in the relationship between ENSO and Asia-Pacific midlatitude winter atmospheric circulation, J. Climate, 26, 3377–3393, 2013.
Hong, J. Y., Ahn, J. B., and Jhun, J. G.: Winter climate changes over East Asian region under RCP scenarios using East Asian winter monsoon indices, Clim. Dynam., 48, 577–595, https://doi.org/10.1007/s00382-016-3096-5, 2017.
Hori, M. E. and Ueda, H.: Impact of global warming on the East Asian winter monsoon as revealed by nine coupled atmosphere ocean GCMs, Geophys. Res. Lett., 33, L03713, https://doi.org/10.1029/2005GL024961, 2006.
Hu, Y. and Fu, Q.: Observed poleward expansion of the Hadley circulation since 1979, Atmos. Chem. Phys., 7, 5229–5236, https://doi.org/10.5194/acp-7-5229-2007, 2007.
Hu, Y., Tung, K. K., and Liu, J.: A closer comparison of early and late winter atmospheric trends in the Northern-Hemisphere, J. Climate, 18, 2924–2936, 2005.
Hu, Z. Z., Bengtsson, L., and Arpe, K.: Impact of global warming on the Asian winter monsoon in a coupled GCM, J. Geophy. Res., 105, 4607–4624, https://doi.org/10.1029/1999JD901031, 2000.
IPCC (Intergovernmental Panel on Climate Change): Climate Change 2013: The Physical Science Basis, Contribution of Working Group I to the Fifth Assessment Report of the Intergovernmental Panel on Climate Change, edited by: Stocker, T. F., Qin, D., Plattner, G. K., Tignor, M., Allen, S. K., Boschung, J., Nauels, A., Xia, Y., Bex, V., and Midgley, P. M., Cambridge University Press, Cambridge, UK, 2013.
Jhun, J. G. and Lee, E. J.: A new East Asian winter monsoon index and associated characteristics of the winter monsoon, J. Climate, 17, 711–726, 2004.
Kalnay, E., Kanamitsu, M., Kistler, R., Collins, W., Deaven, D., Gandin, L., Iredell, M., Saha, S., White, G., Woollen, J., Zhu, Y., Chelliah, M., Ebisuzaki, W., Higgins, W., Janowiak, J., Mo, K. C., Ropelewski, C., Wang, J., Leetmaa, A., Reynolds, R., Jenne, R., and Josephy, D.: The NCEP/NCAR 40-year reanalysis project, B. Am. Meteorol. Soc., 77, 437–470, 1996.
Kimoto, M.: Simulated change of the east Asian circulation under global warming scenario, Geophys. Res. Lett., 32, L16701, https://doi.org/10.1029/2005GL023383, 2005.
Lau, K. M. and Li, M. T.: The monsoon of East Asia and its global associations-A survey, B. Am. Meteorol. Soc., 65, 114–125, 1984.
Lee, S. S., Kim, S. H., Jhun, J. G., Ha, K. J., and Seo, Y. W.: Robust warming over East Asia during the boreal winter monsoon and its possible causes, Environ. Res. Lett., 8, 034001, https://doi.org/10.1088/1748-9326/8/3/034001, 2013.
Li, F. and Wang, H. J.: Relationship between Bering sea ice cover and East Asian winter monsoon year-to-year variations, Adv. Atmos. Sci., 30, 48–56, 2013.
Li, F., Wang, H. J., and Gao, Y. Q.: Change in sea ice cover is responsible for non-uniform variation in winter temperature over East Asia, Atmos. Ocean. Sci. Lett., 8, 376–382, 2015.
Li, Q., Zhang, R. H., and Wang, Y.: Interannual variation of the wintertime fog-haze days across central and eastern China and its relation with East Asian winter monsoon, Int. J. Climatol., 36, 346–354, 2016.
Li, S., He, S. P., Li, F., and Wang, H. J.: Simulated and projected relationship between the East Asian winter monsoon and winter Arctic Oscillation in CMIP5 models, Atmos. Ocean. Sci. Lett., 11, 417–424, 2018.
Li, S. L. and Bates, G. T.: Influence of the Atlantic multidecadal oscillation on the winter climate of East China, Adv. Atmos. Sci., 24, 126–135, 2007.
Meehl, G. A., Stocker, T. F., Collins, W. D., Friedlingstein, P., Gaye, A. T., Gregory, J. M., Kitoh, A., Knutti, R., Murphy, J. M., Noda, A., Raper, S. C. B., Watterson, I. G., Weaver, A. J., and Zhao, Z. C.: Global climate projections, in: Climate Change 2007: The Physical Science Basis, Contribution of Working Group I to the Fourth Assessment Report of the Intergovernmental Panel on Climate Change, edited by: Solomon, S., Qin, D., Manning, M., Chen, Z., Marquis, M., Averyt, K. B., Tignor, M., and Miller, H. L., Cambridge University Press, Cambridge, UK and New York, NY, 2007.
Miao, J. P., Wang, T., Wang, H. J., Zhu, Y. L., and Sun, J. Q.: Interdecadal weakening of the East Asian winter monsoon in the mid-1980s: The roles of external forcings, J. Climate, 31, 8985–9000, 2018.
Mitas, C. M. and Clement, A.: Has the Hadley cell been strengthening in recent decades?, Geophys. Res. Lett., 32, L03809, https://doi.org/10.1029/2004GL021765, 2005.
Sun, B. M. and Li, C. Y.: Relationship between the disturbances of East Asian trough and tropical convective activities in boreal winter, Chinese Sci. Bull., 42, 500–504, 1997 (in Chinese).
Sun, J., Wu, S., and Ao, J.: Role of the North Pacific sea surface temperature in the East Asian winter monsoon decadal variability, Clim. Dynam., 46, 1–13, 2015.
Wang, B., Wu, Z. W., Chang, C. P., Liu, J., Li, J. P., and Zhou, T. J.: Another Look at interannual-to-interdecadal variations of the East Asian winter monsoon: the northern and southern temperature modes, J. Climate, 23, 1495–1512, 2010.
Wang, H. J. and Jiang, D. B.: A new East Asian winter monsoon intensity index and atmospheric circulation comparison between strong and weak composite, Quaternary Sci., 24, 19–27, 2004 (in Chinese).
Wang, L. and Chen, W.: The East Asian winter monsoon: Re-amplification in the mid-2000s, Chinese Sci. Bull., 59, 430–436, 2014.
Wang, L., Huang, R. H., Gu, L., Chen, W., and Kang, L. H.: Interdecadal Variations of the East Asian winter monsoon and their association with quasi-stationary planetary wave activity, J. Climate, 22, 4860–4872, 2009.
Xu, M. M., Xu, H. M., and Ma, J.: Responses of the East Asian winter monsoon to global warming in CMIP5 models, Int. J. Climatol., 36, 2139–2155, https://doi.org/10.1002/joc.4480, 2016.
Yun, J. H., Ha, K. J., and Jo, Y. H.: Interdecadal changes in winter surface air temperature over East Asia and their possible causes, Clim. Dynam., 51, 1375–1390, 2018.
Zhang, Y., Sperber, K. R., Boyle, J. S., Dix, M., Ferranti, L., Kitoh, A., Lau, K. M., Miyakoda, K., Randall, D., Takacs, L., and Wetherald, R.: East Asian winter monsoon: Results from eight AMIP models, Clim. Dynam., 13, 797–820, 1997.
Zhou, W., Chan, C. L. J., Chen, W., Ling, J., Pinto, J. G., and Shao, Y. P.: Synoptic-scale controls of persistent low temperature and icy weather over southern China in January 2008, Mon. Weather Rev., 137, 3978–3991, 2009.
Zhu, Y., Wang, H. J., Ma, J. H., Wang, T., and Sun, J.: Contribution of the phase transition of Pacific Decadal Oscillation to the late 1990s' shift in east china summer rainfall, J. Geophys. Res., 120, 8817–8827, 2015.