the Creative Commons Attribution 4.0 License.
the Creative Commons Attribution 4.0 License.
 | 01 Aug 2019
Gas-phase pyrolysis products emitted by prescribed fires in pine forests with a shrub understory in the southeastern United States
Nicole K. Scharko
Ashley M. Oeck
Tanya L. Myers
Russell G. Tonkyn
Catherine A. Banach
Stephen P. Baker
Emily N. Lincoln
Joey Chong
Bonni M. Corcoran
Gloria M. Burke
Roger D. Ottmar
Joseph C. Restaino
David R. Weise
Timothy J. Johnson
In this study we identify pyrolysis gases from prescribed burns conducted in pine forests with a shrub understory captured using a manual extraction device. The device selectively sampled emissions ahead of the flame front, minimizing the collection of oxidized gases, with the captured gases analyzed in the laboratory using infrared (IR) absorption spectroscopy. Results show that emission ratios (ERs) relative to CO for ethene and acetylene were significantly greater than in previous fire studies, suggesting that the sample device was able to collect gases predominantly generated prior to ignition. Further evidence that ignition had not begun was corroborated by novel IR detections of several species, in particular naphthalene. With regards to oxygenated species, several aldehydes (acrolein, furaldehyde, acetaldehyde, formaldehyde) and carboxylic acids (formic, acetic) were all observed; results show that ERs for acetaldehyde were noticeably greater, while ERs for formaldehyde and acetic acid were lower compared to other studies. The acetylene-to-furan ratio also suggests that high-temperature pyrolysis was the dominant process generating the collected gases.
- Article
(2165 KB) -
Supplement
(3196 KB) - BibTeX
- EndNote


Biomass burning contributes large quantities of trace gases to the earth's atmosphere (Crutzen and Andreae, 1990; Akagi et al., 2011; Andreae and Merlet, 2001; Crutzen et al., 1979; Yokelson et al., 2013; Andreae, 1991). The primary carbon-containing gases emitted during such burns are CO2, CO, and CH4, in order of decreasing concentration (Ward and Hardy, 1991). Hundreds of other trace gases have also been identified in the emissions, including many non-methane volatile organic compounds (NMVOCs), oxygenated volatile organic compounds (OVOCs), nitrogen-containing species, and sulfur compounds (Yokelson et al., 1996; Lobert et al., 1991; Talbot et al., 1988). The major sources of such biomass burning emissions are wildland fire and, to a lesser extent, prescribed fire. Prescribed fires are used to reduce dangerous fuel buildups and manage habitats (Fernandes and Botelho, 2003). The use of prescribed fire as a preventative tool is of particular importance in the western United States (US) where wildland fires are increasing in severity (Turetsky et al., 2011; Miller et al., 2009). In the southeastern US, prescribed fire is also used on a routine basis for purposes such as ecosystem management (Waldrop and Goodrick, 2012). For these and other beneficial reasons, an estimated 3.6 million hectares of forestry land are burned in the US by prescribed fire each year (Melvin, 2012). Agencies that conduct such burns often rely on fire-related models (Reinhardt et al., 1997; Prichard et al., 2006) to predict the impacts of the prescribed burn. Models and experience are used to determine desired fire behavior from fuel, weather, and topography in order to achieve the desired burn effects. The current operational models to predict fire behavior use a simplistic approach to the chemical aspects of combustion and fire spread (Albini, 1976; Rothermel, 1972). Physics-based fire behavior models, while not currently fast enough for operational use, have the ability to incorporate details of fire behavior including heat transfer and chemical reactions (Clark et al., 2010; Mell et al., 2009). These models, such as FIRETEC and FDS, often model the process of pyrolysis based only on results for wood or ground foliage samples. In order to improve the modeling of pyrolysis and combustion processes for such models, a study is currently underway (Weise et al., 2018) wherein pyrolysis products from the same plant species are being measured (1) in an oxygen-free environment using intact foliage samples (Amini et al., 2019a, b; Safdari et al., 2018, 2019), (2) in an atmospheric oxygen wind tunnel setting with relatively simple heterogeneous fuel beds (paper in preparation), and (3) in small field burns as discussed in this paper. One of the goals of the overall study is to determine the relationship between the controlled laboratory results and actual fire conditions in the field, as was done previously by Yokelson et al. (2013); they conducted a lab–field comparison study focusing mostly on the flaming and smoldering stages. The present study focuses only on early-stage emissions, particularly pyrolysis, in the hope that improved elucidation of the gas-phase pyrolysis products and other early-stage processes of prescribed burns will ultimately improve the overall ability to model fire behavior (Ferguson et al., 2013; Shotorban et al., 2018; Yashwanth et al., 2016).
In the broader community, there has also been considerable interest in identifying and quantifying gas emissions from fire due to the influential role of (wildland) fire in atmospheric chemistry and climate, as studied both in the laboratory and in field burns (Crutzen et al., 1979; Andreae et al., 1988, 1994; Lobert et al., 1991; Lindesay et al., 1996; Goode et al., 1999; Yokelson et al., 1996, 1999; Chi et al., 1979). The types of gases emitted and their relative abundances depend on many factors such as fuel type, fuel arrangement, land management activities, burning techniques, and environmental conditions (Ward et al., 1992, 1996). In the 1990s, Griffith, Yokelson, and coworkers conducted a series of laboratory studies using an open-path Fourier transform infrared (FTIR) spectrometer to investigate how some of these factors influence the concentrations of emitted gases (Goode et al., 1999; Yokelson et al., 1996, 1997). There have been several follow-on laboratory studies using IR spectroscopy as well as other analytical techniques to identify previously unknown fire emission products and to derive emission factors from various fuel types (Burling et al., 2010; Hatch et al., 2017; Selimovic et al., 2018; Stockwell et al., 2014; Yokelson et al., 2013; Gilman et al., 2015).
In addition to those laboratory studies, a number of field campaigns have also used FTIR spectroscopy to identify trace gases from prescribed fires (Akagi et al., 2013, 2014; Burling et al., 2011; Goode et al., 2000; Yokelson et al., 1999; Wooster et al., 2011; Alves et al., 2010; Hurst et al., 1994a, b; Paton-Walsh et al., 2008, 2010; Guérette et al., 2018). Studies that have the ability to measure emissions both near the fire and aloft are especially useful in understanding the complex chemistries that occur during and after prescribed fires, including the (oxidative) chemistry of the downwind plume. For example, Akagi et al. (2013) detected limonene from a prescribed burn with a land-based FTIR and linked it to the production of ozone, formaldehyde, and methanol, all of which were measured downwind with an airborne-based FTIR. In an earlier prescribed burn study, Burling et al. (2011) detected enhanced levels of isoprene and 1,3-butadiene in the smoke from a living tree when compared to dead stumps under the same conditions. However, preflame pyrolysis emissions can be relatively low compared to total emissions from a fire, and few investigations have studied the preignition or pyrolysis gases emitted prior to the flaming combustion stage. Pyrolysis, which is one of the first steps in the burning process (Collard and Blin, 2014), leads to char formation, depolymerization, and species fragmentation. Volatile products are generated and, if unstable, can continue to undergo secondary (noncombustion) reactions such as cracking or recombination (Collard and Blin, 2014). Pyrolytic reactions produce fuel gases that, if sufficient in quantity and in the presence of oxygen, will maintain the flame via combustion pathways (Ward and Hardy, 1991; Di Blasi, 1993).
While there are few field studies of pyrolysis, there have been many laboratory studies carried out in controlled environments. In one of the earliest investigations, DeGroot et al. (1988) detected H2O, CO2, CH3OH, HCOOH, and CH3COOH from the pyrolysis of wood. More recent studies have observed several other compounds, such as CO, CH4, lightweight hydrocarbons (C2–C5), and light tar compounds (e.g., benzene, its derivatives, and polycyclic aromatic hydrocarbons), from the slow pyrolysis of birchwood (Fagernäs et al., 2012). Oxygenated compounds (e.g., furan-related compounds) have been observed from the fast pyrolysis of levoglucosan, a known pyrolyzate of cellulose (Bai et al., 2013). Laboratory experiments that have investigated the condensed and/or gas-phase compounds generated by pyrolysis under controlled conditions have revealed that the speciation and distribution of the products are dependent on a number of factors such as heating rate, temperature, fuel composition, live vs. dead fuels, and the amount of available oxygen (Azeez et al., 2011; Lu et al., 2011; Shen et al., 2010; Safdari et al., 2018; Ren and Zhao, 2012, 2013a, b). For instance, Ren and Zhao (2013a) found that the amount and speciation of nitrogen-containing pyrolyzates is complicated and influenced by the content of mineral matter, the presence of oxygen (Ren and Zhao, 2012), the structure (e.g., aliphatic vs. heterocyclic) of the amino acids, and the amount of cellulose, hemicellulose, and lignin in the sample. Similarly, the release of oxygenated compounds (e.g., phenolic compounds) from the pyrolysis of lignin is sensitive to the presence of oxygen (Kibet et al., 2012).
All the above pyrolysis studies, however, were conducted in controlled settings or on smaller scales. There remains a paucity of data that identify and quantify gas-phase pyrolysis species emitted from actual prescribed burns at the field scale. The present study differs from these earlier works in that we exclusively attempt to investigate gas-phase pyrolysis species generated during prescribed burns. To the best of our knowledge, this is one of the first field studies that discriminatively measures pyrolysis and early-phase gases for southeastern US fuels. Isolating such species is indeed challenging as they often blend with the background atmosphere and are rapidly mixed with other gases from the onset of combustion. One must thus isolate the “pyrolysis molecules” optically, mechanically, or temporally. In this study, we selectively probe the pyrolysis gases by using a simple manually operated spatial collection device that attempts to collect only gases in front of the flame. While not a perfect solution, the information gathered in this study adds important insights into the primary products generated during pyrolysis and other early-stage processes for prescribed fires.
2.1 Site description
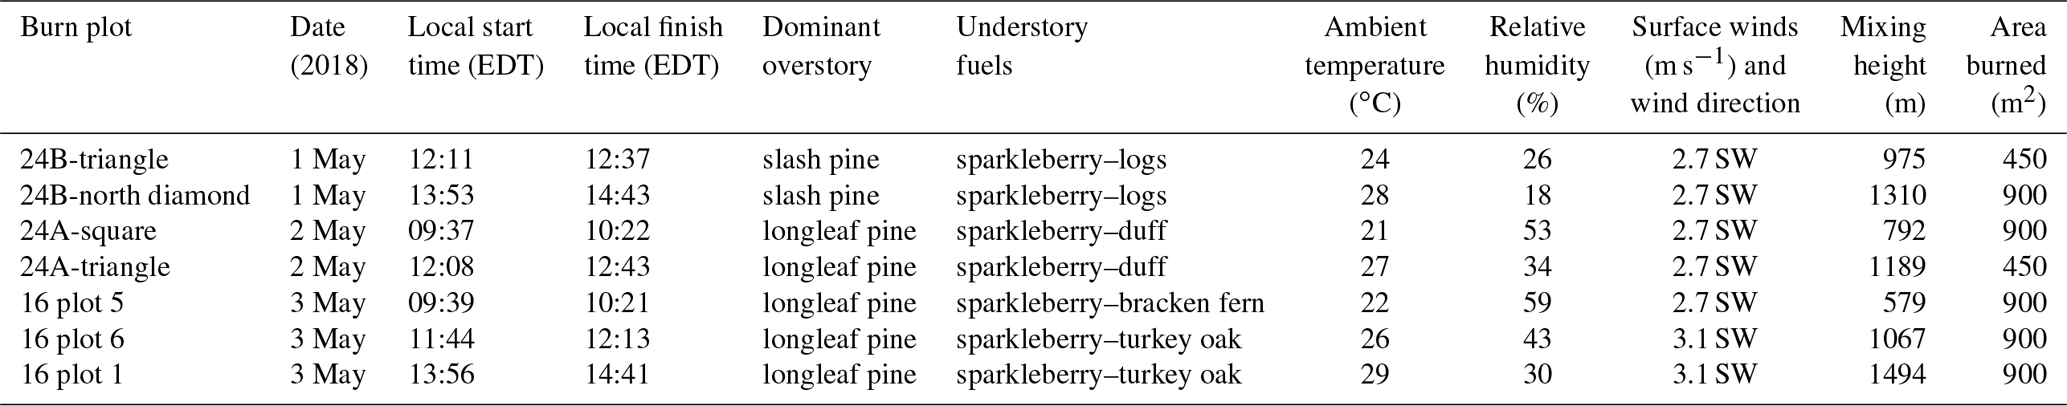
During the week of 29 April 2018, a total of seven small plots (450 to 900 m2) were burned using prescribed fire at Ft. Jackson, South Carolina (SC; 34.05∘ N, 80.83∘ W), approximately 10 km east of Columbia, SC. The fort lies entirely within the Sandhills ecosystem in the SC coastal plain, which runs approximately parallel to the Atlantic Ocean coast, 175 km inland. The Sandhills region thus forms a belt that tracks southwest–northeast across sands of varying depth with a high content of pure silica (Porcher and Rayner, 2001). The deep sands support an overstory vegetation that has significant amounts of turkey oak (Quercus laevis Walter) and two native pine species relatively unique to the southeastern US: longleaf pine (Pinus palustris Mill.) and slash pine (Pinus elliottii Engelm.). The understory has substantial quantities of immature turkey oak as well as longleaf and slash pine, along with sparkleberry (Vaccinium arboreum Marshall), and a heterogeneous organic layer of woody material, litter, duff, and cones atop the mineral soil. The longleaf ecosystem depends on fire for maintenance (Cary, 1932). Site details for the seven burn plots, all with a 2-year rough (i.e., burned 2 years prior), are summarized in Table 1. Eight prefire and postfire 1.0 m2 biomass clipped plots were established at each 160 m2 research block within the larger burn plots where organic vegetative material was collected before and after each fire. Shrub, grasses, forbs, down woody material (0–0.6, 0.6–2.5, 2.5–7.6, 7.6–22.9 cm in diameter), litter, and duff are the major fuel bed components that were targeted. Fuel moisture samples for each major component were collected before ignition to determine fuel moisture content for each fuel bed component. Figure 1 shows photographs of site 16, plot 1 before, during, and after the burn as well as a thermal image of the flame interacting with the fuel.
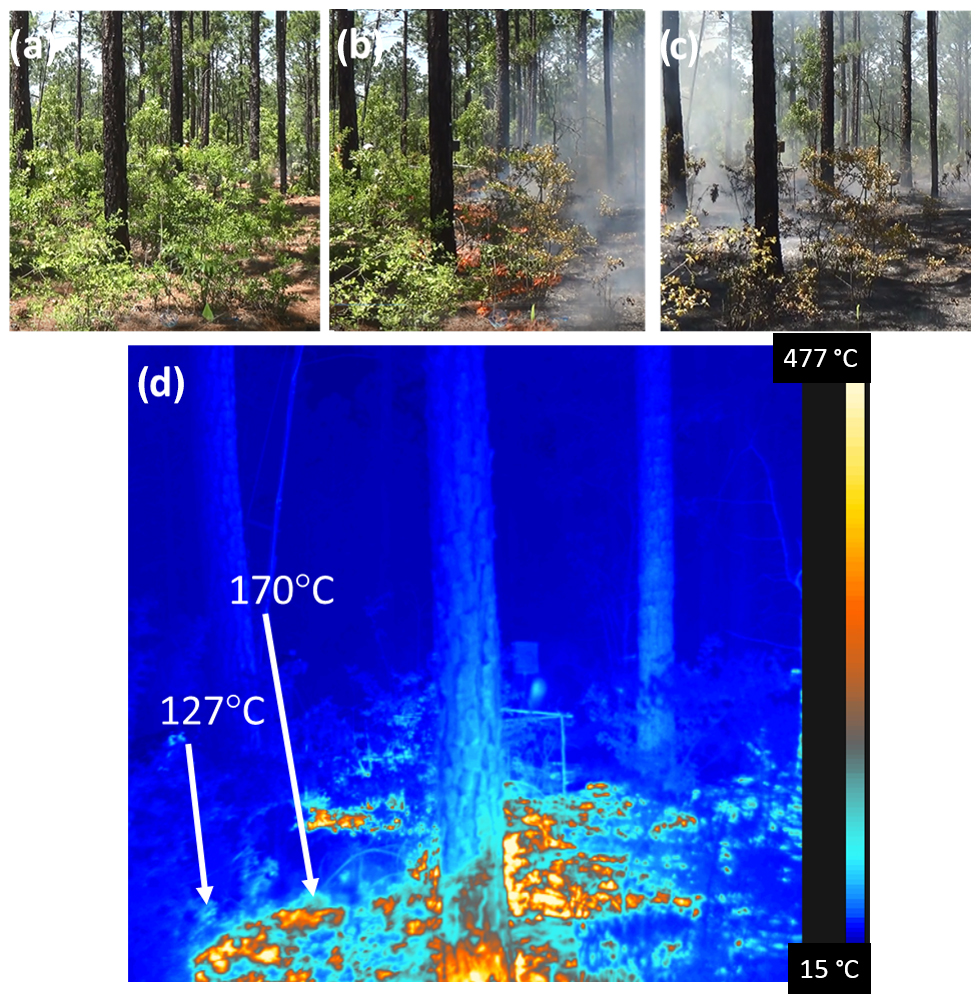
Figure 1Photographs of site 16, plot 1 on 3 May 2018 between 14:00 and 14:40 local time. The plot (a) before the flame, (b) while the flame interacted with the fuel at 14:33, and (c) smoldering combustion of the fuel. The primary species seen in the understory for this burn plot are sparkleberry and a litter layer of pine needles. (d) Thermal image of the flame interacting with the fuel at 14:33.
Table 1Plot name, date and time, fuel description, atmospheric conditions (all clear-sky days), and area for the prescribed burns.
2.2 Collection device
Our approach to sampling used an extractive collection device whose tube inlet sampled air and emissions directly ahead of the flame. This simple solution is similar to other canister methods often used with gas chromatographic analysis (Young et al., 1997) and also conceptually similar to the land-based FTIR used to sample emissions as described by Akagi et al. (2013, 2014) and Burling et al. (2011). The canister sampling package, mounted on a metal frame, contained a set of evacuated canisters that were carried to the individual burn plots. The sampling package consisted of a 12 V swing-piston KNF Neuberger pump (NPK09DC) plumbed with stainless-steel tubing and a pressure-relief valve to regulate the pressure of the system and ultimately the fill pressure of the canisters. The flow rate to fill the canisters was 15 L min−1. A sampling probe (2.5 m of 6 mm stainless-steel tubing plus 2 m of flexible stainless-steel line) was attached to the inlet of the package to collect pyrolysis gases from point sources of vegetation within the burning plots. The device had an in-line two-way valve to control the sampling interval. To capture a pyrolysis sample, the probe was placed near the base of the flame, immediately above the fuel where the pyrolysis gases should be emitted at maximal levels. A total of 7 to 10 aliquots of gas sample were added to a single canister as the device was moved in front of the flame to capture pyrolysis gases. Each 3 L Summa canister was filled to approximately 138 kPa (20 psia) for the FTIR analysis.
2.3 FTIR spectrometer and spectral analysis
Experimental details regarding FTIR measurement and ensuing spectral analysis procedures have been previously reported (Scharko et al., 2019) but are briefly summarized as follows: gases in the canisters were returned from the field to the laboratory and analyzed the same day or the following day using an 8 m White cell (Bruker A136/2-L) and FTIR; canisters were connected to the gas cell via stainless-steel tubing with both the tubing and gas cell heated to 70 ∘C to prevent analyte adhesion. The cell was coupled to a purged FTIR spectrometer (Bruker Tensor 37) equipped with a glow bar source, KBr beam splitter, and liquid-N2-cooled mercury cadmium telluride detector. Spectra were collected from 4000 to 500 cm−1 at 0.6 cm−1 resolution. Spectral analysis was carried out using the MALT5 program (Griffith, 2016) and 50 ∘C reference spectra from the PNNL database (Sharpe et al., 2004; Johnson et al., 2010) as well as absorption lines from HITRAN (Gordon et al., 2017). MALT5 fits the assigned reference spectral lines to the measured spectrum by optimizing the fit of all gases ascribed to the spectral window and minimizing the residual. The calculation involves input parameters such as path length, resolution, and apodization accompanied by reference absorption cross sections and the measured spectrum with its associated temperature–pressure values. Both H2O and CO2 had peaks that were saturated; these regions were eliminated from analysis. In some instances, peaks for the gases of interest were also saturated, in which case the pressure in the gas cell was reduced and the measurement repeated.
2.4 Calculation of emission ratios and emission factors
A convenient quantity to compare emissions is the emission ratio (ER). This ratio is calculated by computing the change in the concentration of the analyte of interest relative to that of a co-emitted, long-lived gas, typically CO or CO2. For the present study, the chosen long-lived gas is CO:
It is important to note that these are the changes in the analyte and CO relative to the background atmosphere (i.e., relative to ambient “clean air” conditions). The background levels of CO and CO2 were measured using an open-path gas analyzer (OPAG 22) prior to the series of burns. The initial CO2 level was measured to be 409 ppm (this value agrees with the global averaged CO2 for May 2018 of 408.7 ppm; Dlugokencky and Tans, 2012), whereas the CO level was often below the OPAG detection limit. (Due to challenging experimental conditions and moderate CO band intensities, the OPAG detection limit was poor for these CO measurements and could not achieve 200 ppb.) Without an instrument to measure ambient CO with sufficient sensitivity we chose 200 ppb for an estimated background level, which is within the range for a typical CO mixing ratio (Seinfeld and Pandis, 2012). We note that the 200 ppb value is sufficiently small that it has a negligible effect on the calculated Δanalyte ∕ ΔCO ratios. Emission ratios can be calculated for a single point in time during the fire, or they can incorporate the full length of the fire. The present ERs were calculated based on the contents of the individual canisters, which represent multiple aliquots, all from the early fire stages. Other studies have obtained fire-integrated ERs, which integrate over the entire duration of the fire (Koss et al., 2018), or fire-averaged ERs determined from the slope of the regression with the intercept set to zero (Yokelson et al., 1999).
Another useful quantity is the emission factor (EF), defined as the number of grams emitted of a given analyte per kilogram of dry fuel consumed and estimated using the following equation (Yokelson et al., 1999; Ward and Radke, 1993):
where Fcarbon is the mass fraction of carbon in the fuel, MWanalyte and MWcarbon are the molar masses of the analyte and carbon, respectively, is the emission ratio of the analyte relative to CO2, is the emission ratio of species j relative to CO2, and NCj is the number of carbons in species j. Note that ΔCO2 cancels out in Eq. (2). Elemental analysis of similar southeastern fuels was reported in a previous study (Safdari et al., 2018), and the average carbon content by mass for longleaf pine foliage and litter as well as sparkleberry was 0.52, which was the value used for Fcarbon. One assumption in Eq. (2) is that all of the carbon in the fuel is released and accounted for in the measurements of the j carbon species. Most carbon emissions are in the chemical form of CO2, CO, or CH4. It should be noted that the EF quantities reported here include only compounds measured by the FTIR, and EF values may be overestimated by 1 % to 2 % for most fuels due to undetected carbon species (Akagi et al., 2011).
3.1 Estimating the contribution from high- and low-temperature processes
Modified combustion efficiency (MCE) uses the excess CO and CO2 values to quantify the degree of combustion that has occurred in a given smoke plume, and the MCE will be discussed below. However, in a recent study Sekimoto et al. (2018) suggested that MCE may not be the best quantity to adequately describe pyrolysis, but rather that emissions of volatile organic compounds (VOCs) from biomass burning may be correlated with high- and low-temperature pyrolysis factors obtained by carrying out positive matrix factorization (PMF) analysis on the emission profiles. The authors further suggested that the ratio of acetylene (C2H2) to furan (C4H4O) could be used to estimate the high- and low-temperature pyrolysis factors. They used the emission profiles from the analysis of 15 different fuels to calculate the following ratio that estimates the high- and low-temperature VOC emissions:
We have adopted this estimation approach and have used the acetylene-to-furan ratio to assess the relative contributions from high- and low-temperature processes. The average results are displayed in Fig. 2 alongside the results from Koss et al. (2018), Gilman et al. (2015), and Akagi et al. (2013). For comparison purposes, the values displayed in Fig. 2 were determined using average ERs for acetylene and furan. The present results (right-most bar) are approximately an order of magnitude greater than all previous studies, likely due to the timing of collection and the sampling probe's proximity to the flame. The juxtaposed values from the previous studies were obtained using (a) fire-integrated ERs, (b) discrete ERs sampled every 20 to 300 s, or (c) fire-averaged ERs, all of which incorporate several different phases of the fire compared to the present flame-front measurements. Using the Sekimoto et al. (2018) estimation approach, higher acetylene-to-furan ratios indicate a greater contribution from the high-temperature processes. The markedly high ratio observed in this study suggests that samples were collected when high-temperature pyrolysis was indeed the dominant process. This observation is consistent with the time profile for the contribution of the high-temperature pyrolysis factor presented by Sekimoto et al. (2018), which demonstrates that the contribution from high-temperature pyrolysis [high-T ∕ (high-T + low-T)] can easily exceed 0.95 in the early stages of fire but is reduced to smaller fractions (≤0.3) in the latter stages. Another key difference is that the sampling probe used at Ft. Jackson was positioned to extract gases directly before the flame front, yet in close proximity to it, in order to limit further reactions. In particular, if the highly flammable acetylene molecules were captured prior to subsequent oxidation reactions, this would explain the enhanced ratio of high- to low-temperature VOC emissions as seen in Fig. 2.
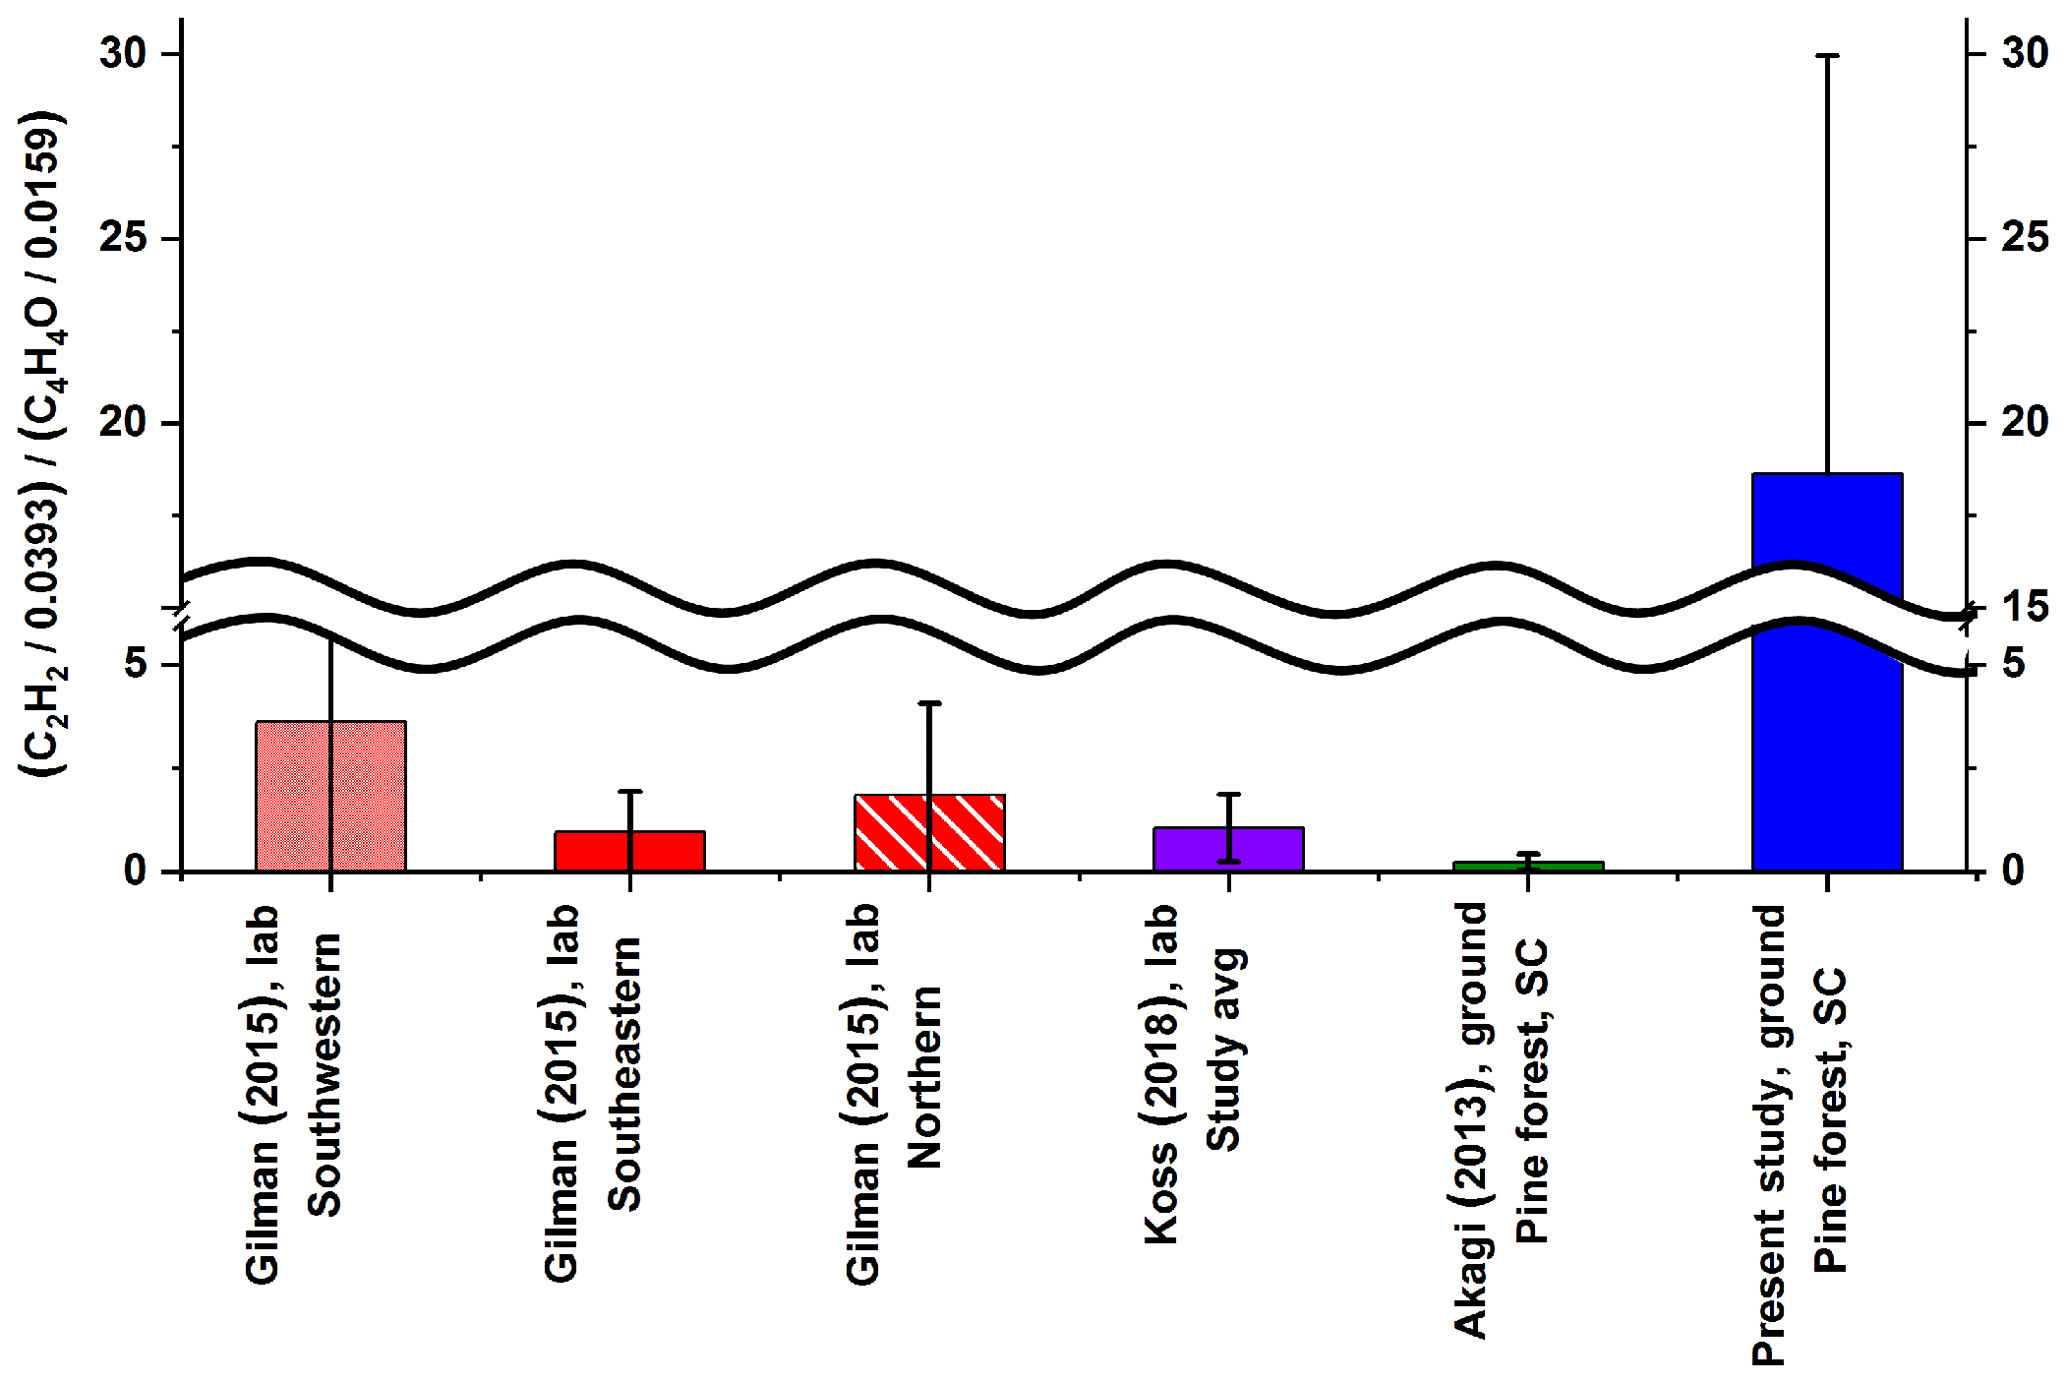
Figure 2Ratio of acetylene (C2H2) ∕ 0.0393 to furan (C4H4O) ∕ 0.0159 to predict the ratio of high- to low-temperature VOC emissions as outlined by Sekimoto et al. (2018). Error bars represent 1σ. For the present study average results were determined from the 10 collected samples preceding the flame front for acetylene and furan. Koss et al. (2018) values were fire integrated, while Gilman et al. (2015) used 20–300 s integrations. Akagi et al. (2013) reported EFs that were used to calculate ERs for acetylene and furan.
3.2 CO2 and CO emissions and MCE values
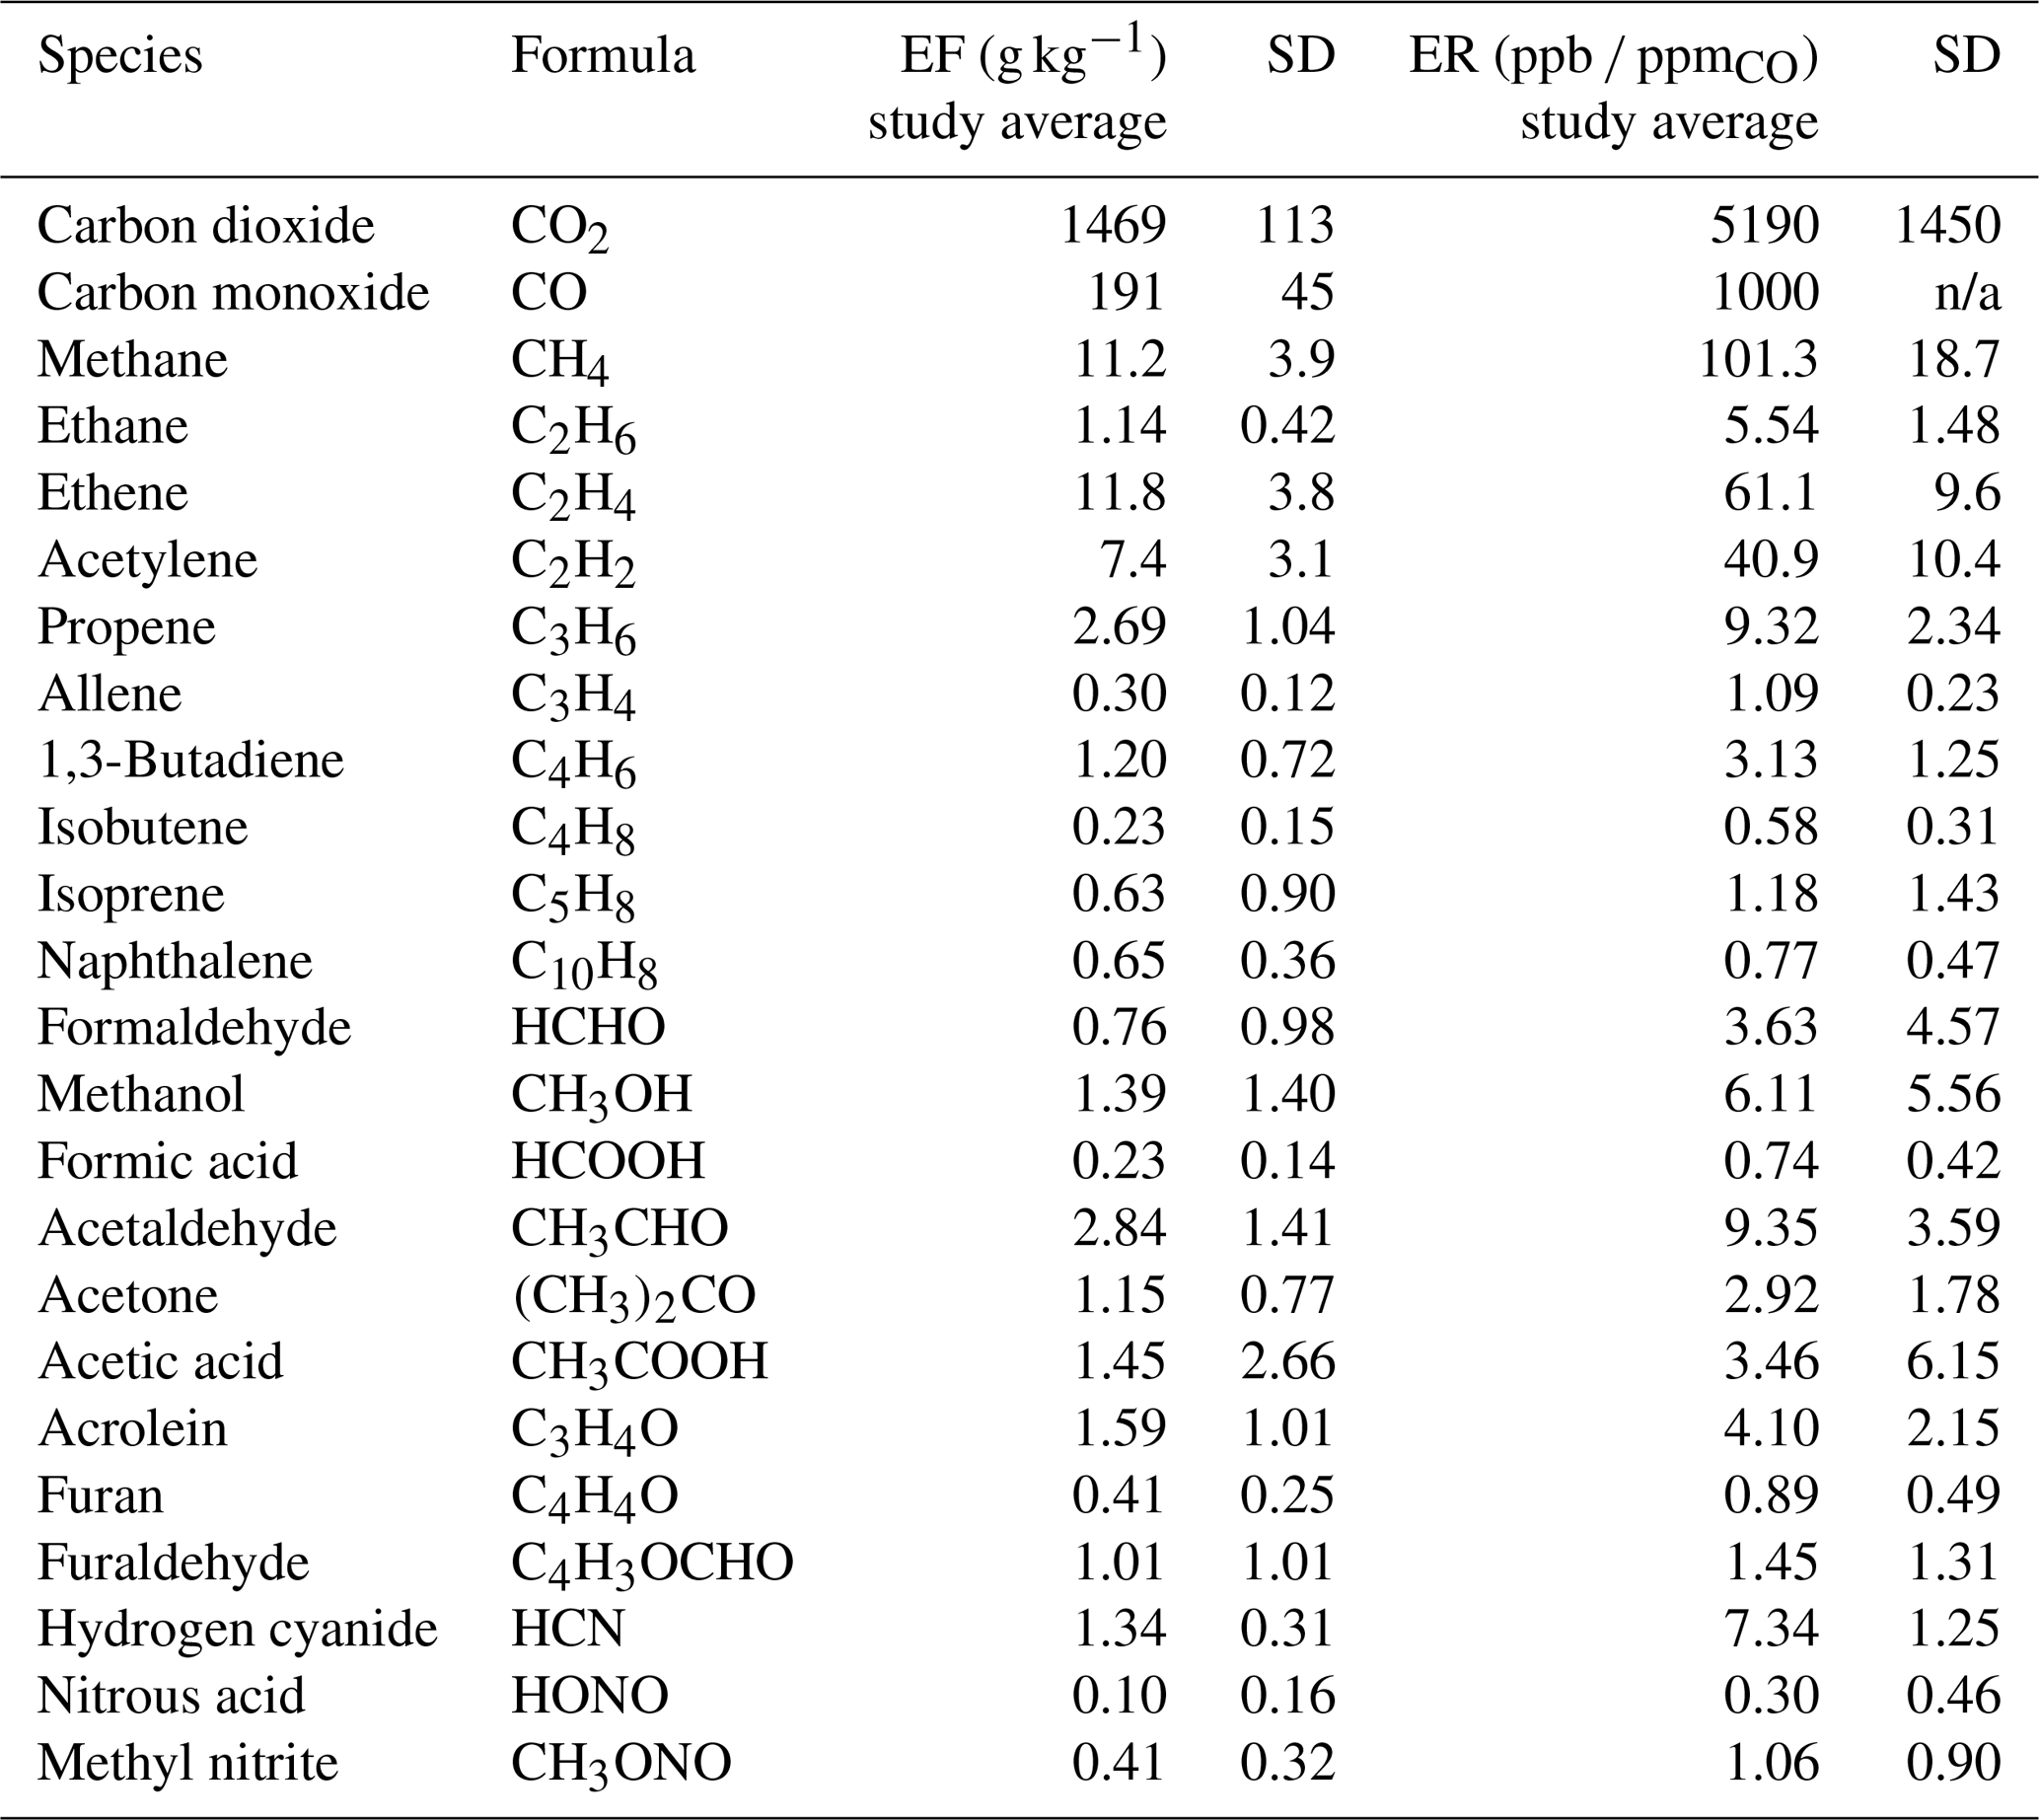
As expected, other than H2O vapor, CO and CO2 were the predominant gases observed as emissions. Table 2 displays the EF (g kg−1) and ER (ppb ∕ ppmCO) values averaged for the 10 field measurements. Most prescribed burn studies have focused only on the flaming and smoldering stages. The flaming stage is characterized by more oxidized products and a higher modified combustion efficiency (e.g., 0.85–0.97, even 0.99 for pure flaming) (Ward and Hao, 1991), where the MCE is defined as
The smoldering phase, with lower MCE values (typically ranging 0.65–0.85) (Urbanski, 2013), displays more nonoxidized (or less-oxidized) species but with a greater fraction of OVOCs observed. The arithmetic mean MCE and standard deviation for all 10 measurements at Ft. Jackson was 0.83±0.04. Such MCE values would normally characterize data gathered during smoldering combustion wherein a combination of processes such as pyrolysis along with glowing combustion of char take place (Yokelson et al., 1997). Since the present study was aimed at the collection of pyrolysis gases preceding the flame front, characterizing the results in terms of MCE values may not be appropriate: the lower MCE values do not represent the fire being in the smoldering stage but rather suggest that pyrolysis and other early-phase process gases were captured (at least in part) prior to the onset of combustion. As noted, the methodology used with this collection device ideally extracts the pyrolysis gases before they are combusted. Due to the proximity of these gases to the flame, some entrainment of ambient air and air from the flame region was likely unavoidable. As we were sampling a moving zone, some combustion products were also likely to be sampled.
Table 2Study averages of EF (g kg−1) and ER (ppb ∕ ppmCO) for the 10 pyrolysis measurements along with standard deviation (SD). The SD represents the variation for the 10 nonidentical measurements. For the study averages, the arithmetic mean MCE was found to be 0.83±0.04; n/a – not applicable.
3.3 Emissions of lightweight hydrocarbons
Besides CO and CO2, the second most abundant class of gases generated during the prescribed burns was lightweight hydrocarbons (HCs). The lightweight HCs detected by the FTIR include methane, ethane, ethene, acetylene, propene, allene, 1,3-butadiene, isoprene, and isobutene. Most have been previously identified in fire emissions using FTIR either in laboratory experiments (Burling et al., 2010; Christian et al., 2003, 2004; Gilman et al., 2015; Goode et al., 1999; Hatch et al., 2017; Selimovic et al., 2018; Stockwell et al., 2014; Yokelson et al., 1996, 1997) or field settings (Akagi et al., 2013, 2014; Alves et al., 2010; Burling et al., 2011; Goode et al., 2000; Hurst et al., 1994a, b; Karl et al., 2007; Paton-Walsh et al., 2010), but the present experiment reports the first IR detection of allene (Scharko et al., 2019). Figure 3 shows the individual correlations between these lightweight HCs and excess CO mixing ratios. The analyte vs. ΔCO correlation coefficients range from 0.97 (ethene and allene) to 0.66 (isoprene and isobutene). In all cases, the correlation coefficients were larger with CO than with CO2. Positive relationships have been observed for CO correlations in previous burning studies (Hurst et al., 1994a, b).
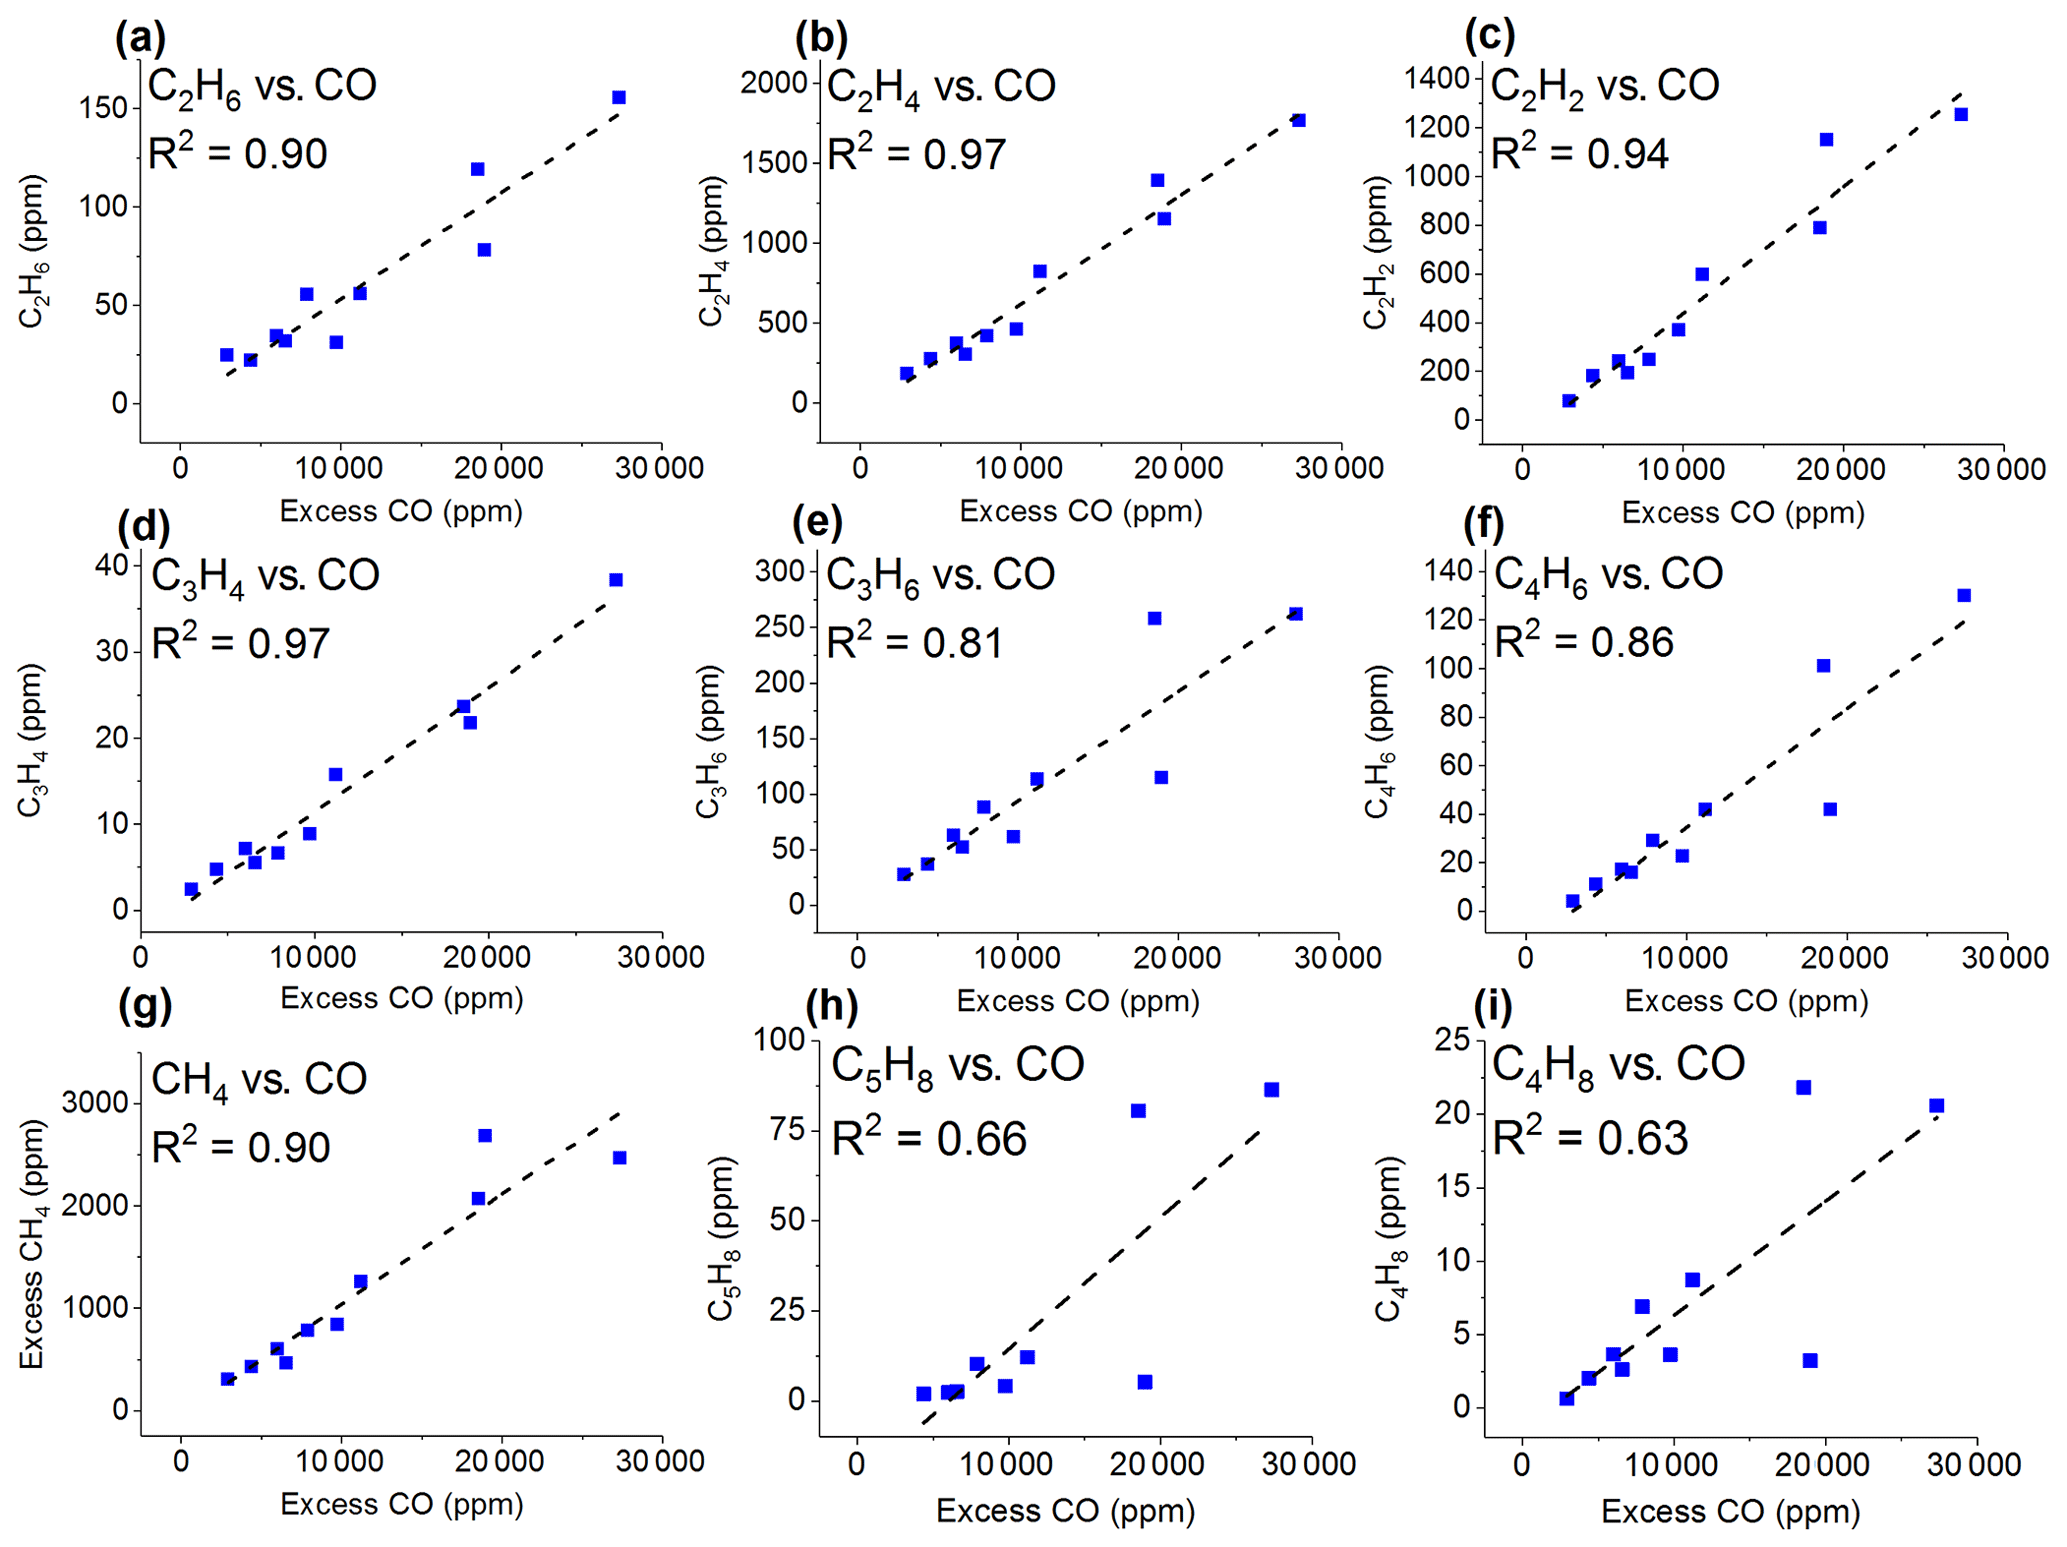
Figure 3Mixing ratios (ppm) for the 10 measurements as a function of excess CO (ppm) for (a) ethane (C2H6), (b) ethene (C2H4), (c) acetylene (C2H2), (d) allene (C3H4), (e) propene (C3H6), (f) 1,3-butadiene (C4H6), (g) excess methane (CH4), (h) isoprene (C5H8), and (i) isobutene (C4H8). The dashed lines are a linear fit to the data.
While the observed ER for excess methane was comparable, ERs for ethene and acetylene were considerably greater than previously reported values. Specifically, Fig. 4 shows a comparison of emission ratios for methane, ethene, and acetylene to previously reported values of Gilman et al. (2015) and Akagi et al. (2013). As noted, different sampling methods complicate the comparison. The present data represent a collection of instantaneous grab samples extracted directly before the flame front, whereas the other data represent time-averaged values. Ethene and acetylene have both been observed as pyrolysis products in prior laboratory work (Palma, 2013) but may react further. For example, the addition reaction of acetylene to benzene or naphthalene can produce styrene or cyclopenta-fused polycyclic aromatic hydrocarbons (Ledesma et al., 2002). Alternatively, ethene and acetylene can undergo combustion (Simmie, 2003). Nevertheless, the high ER values for ethene and especially for acetylene in the present study further suggest that the samples were collected when the high-temperature pyrolysis process was dominant; Sekimoto et al. (2018) also observed that high-temperature pyrolysis profiles are often associated with unsaturated hydrocarbons.
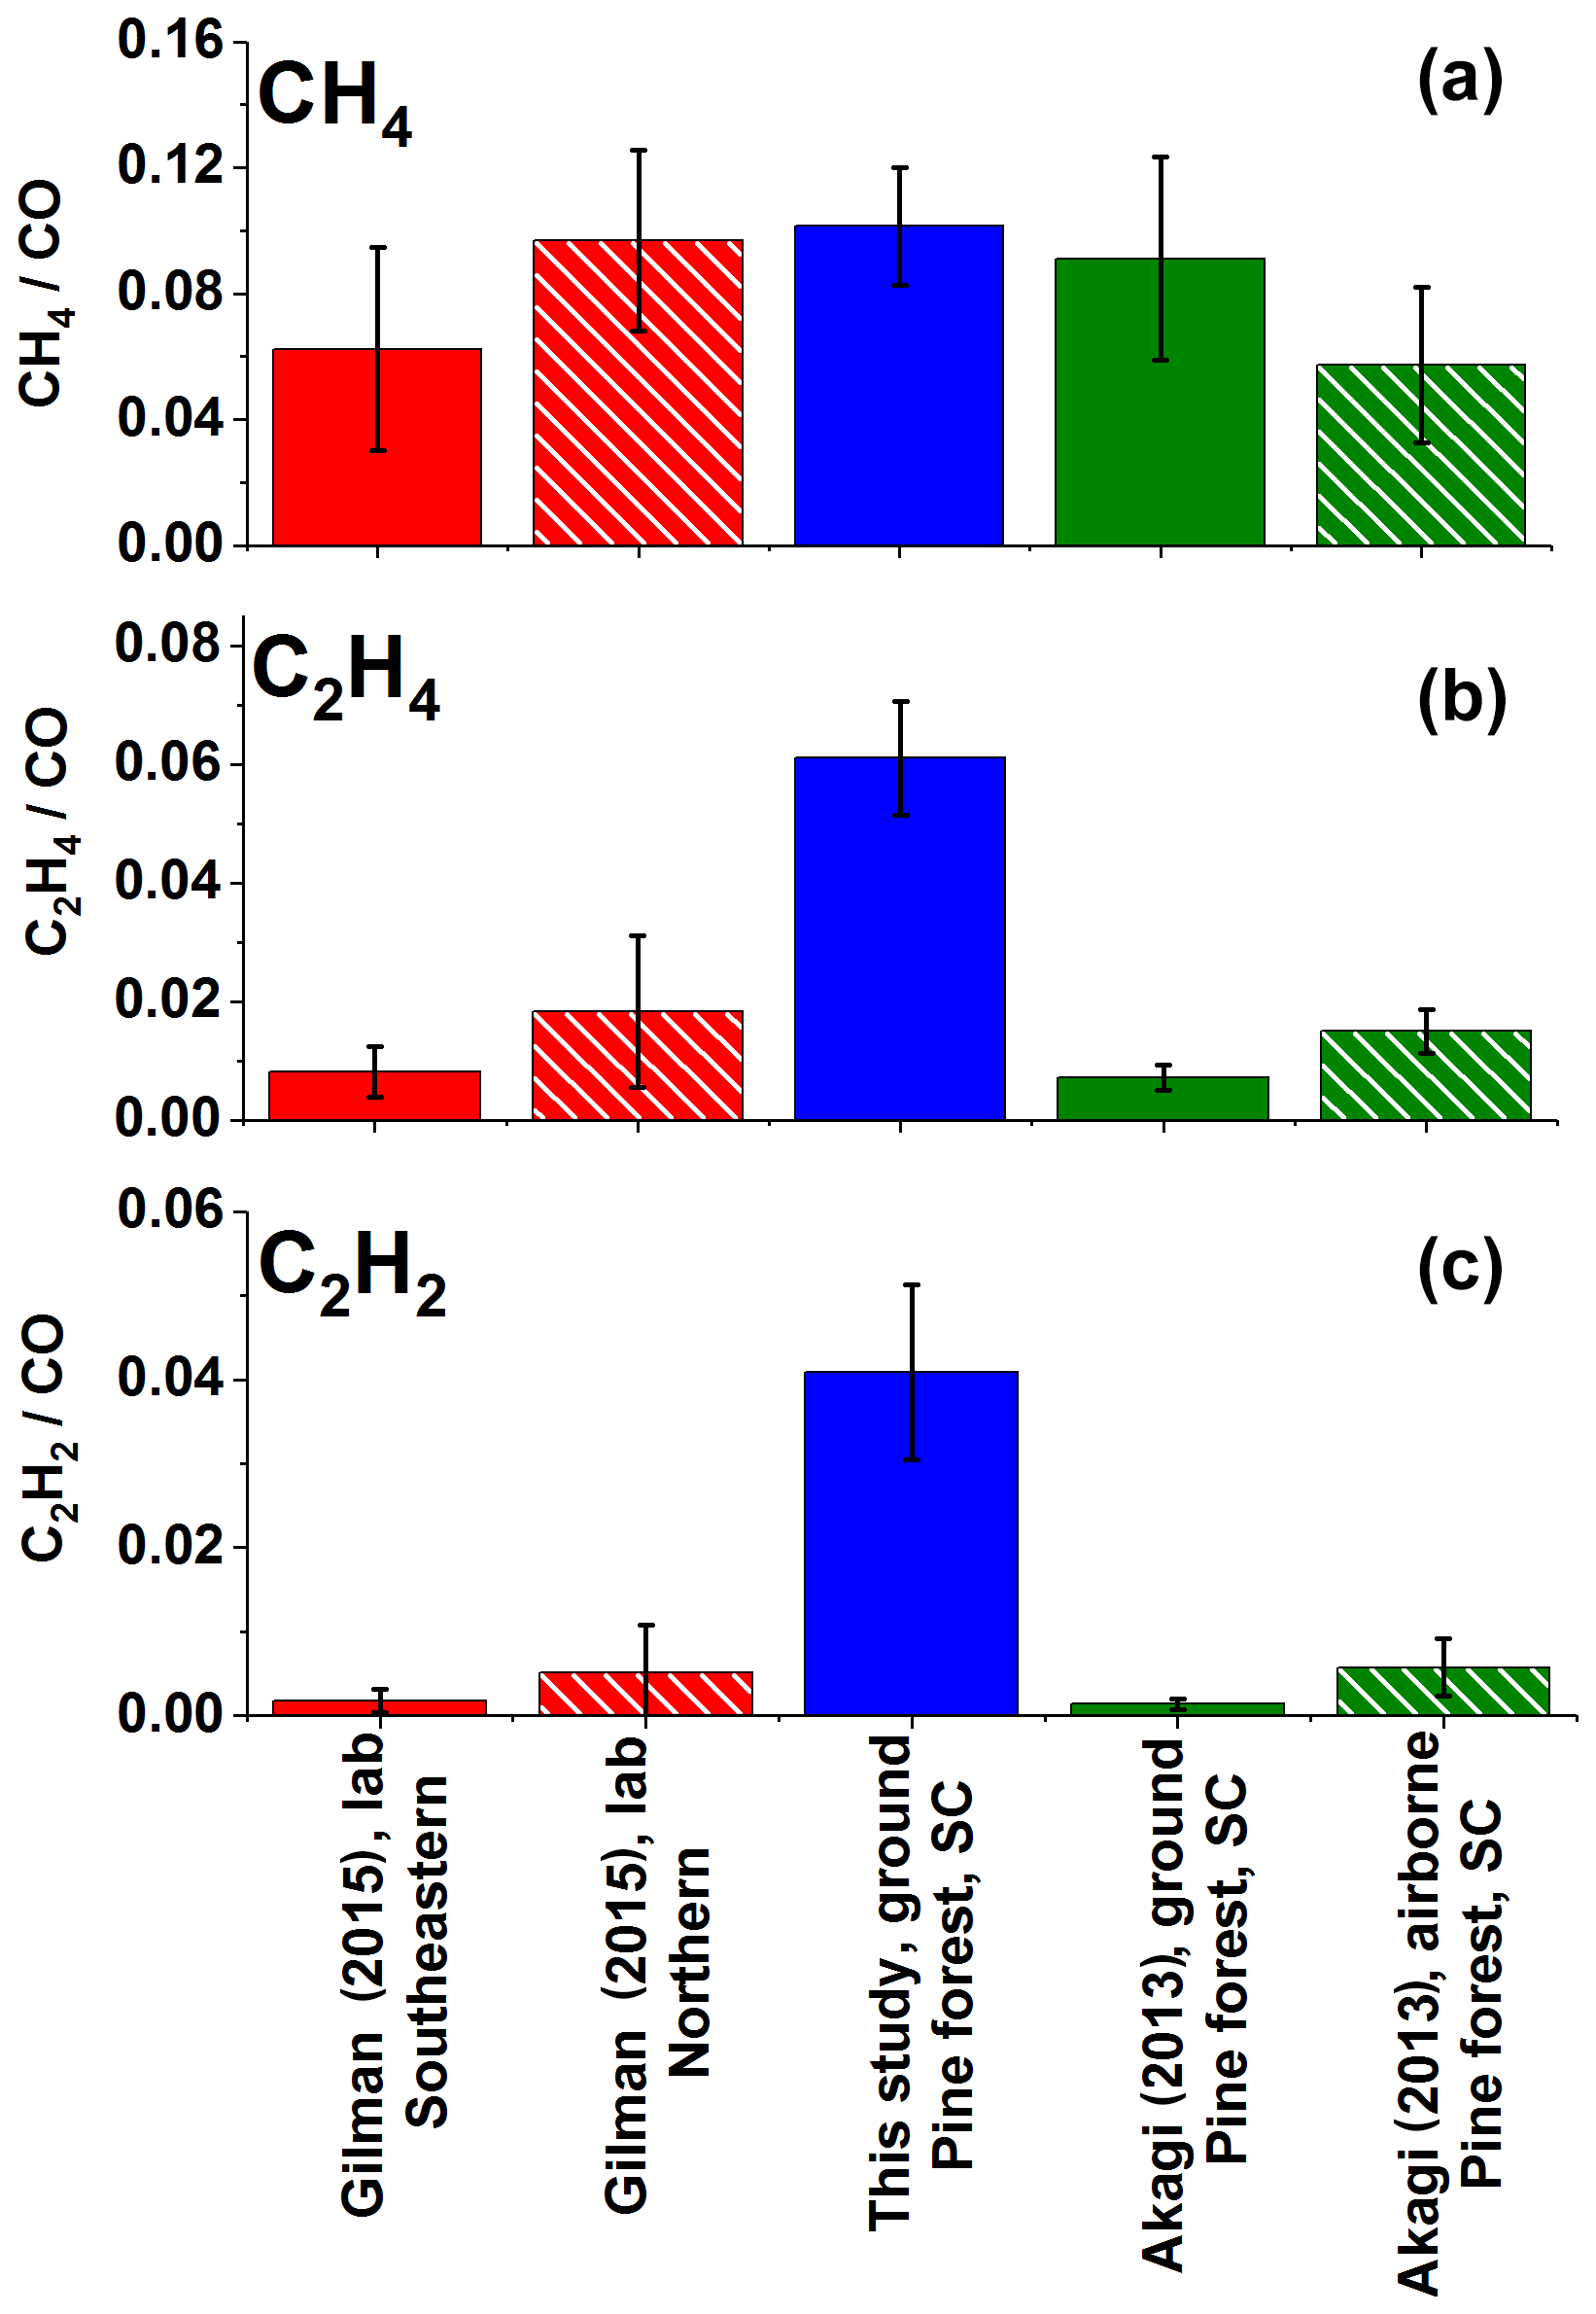
Figure 4Average ERs (ppm ∕ ppmCO) for (a) excess methane, (b) ethene, and (c) acetylene for this study and for previously published laboratory and field (ground and air based) investigations. Error bars represent 1σ. Gilman et al. (2015) present discrete ERs with sample acquisition of 20 to 300 s. Akagi et al. (2013) present fire-averaged EFs calculated using ERs derived by the regression method. The ERs for Akagi et al. (2013) shown above were derived from the ratio of the EFs for the gas of interest and CO multiplied by the molar mass of CO ∕ molar mass of the analyte.
3.4 Emissions of lightweight oxygenated hydrocarbons
The noncyclic oxygenated hydrocarbons detected via FTIR analysis include formaldehyde, methanol, formic acid, acetaldehyde, acetone, acetic acid, and acrolein. On average, acetaldehyde and methanol had the highest ER values in this group, with ERs relative to CO of 0.009 and 0.006, respectively, as seen in both Table 2 and Fig. S2 in the Supplement. For all measurements collected at sites 16 and 24A, acetaldehyde was consistently the highest, with ER values ranging from 0.005 to 0.014. Site 24B (north diamond plot only) followed a different trend with highest ER values for acetic acid, followed by methanol, acetaldehyde, and formaldehyde in decreasing order. The ERs for acetic acid and formaldehyde at site 24B are at least 7.9 and 2.5 times greater, respectively, than the other burn sites. One key difference observed for site 24B was fuel composition, namely the presence and partial consumption of larger logs (i.e., 7.6–20.3 cm diameter woody material). Other differences include the presence of live pine seedlings and less turkey oak compared to other plots. This particular plot had the highest herbaceous and forb prefire loading and consumption with a higher fuel moisture content (205 % compared to the next highest value of 144 %). This high fuel moisture content was reflected in the ER for water, which was at least 4.7 times greater than the other plots. The pyrolysis of cellulose (one of the three primary components of biomass as discussed below) forms levoglucosan. Shen and Gu (2009) outline secondary decomposition pathways for levoglucosan, in which the initial step is rehydration to generate glucopyranose. They demonstrate how glucopyranose can then form formaldehyde, methanol, and acetic acid via secondary decomposition routes. This pathway (or a similar one) may have been favored at site 24B: the greater ERs for acetic acid and formaldehyde observed at plot 24B may have thus been influenced by the greater fraction of woody material and the presence of herbaceous and forb fuels, all with higher moisture contents. This hypothesis warrants further investigation and could be studied in the laboratory.
Table 3 compares the present ER values with values from Akagi et al. (2013), Stockwell et al. (2014), Gilman et al. (2015), and Koss et al. (2018). The present ERs are comparable to other burn studies except for acetaldehyde, which appears to be marginally greater, and formaldehyde and acetic acid, which both appear to be lower. The higher ratio for acetaldehyde may be due to differences in the sampling approach; i.e., samples collected in the present study may contain species that were generated during an earlier period in the thermal decomposition process. In a controlled laboratory study by Stein et al. (1983), acetaldehyde was observed as one of the initial products emitted from the pyrolysis of glycerol, a product pyrolyzed from levoglucosan. This same study also observed that acetaldehyde would continue to decompose (under pyrolysis conditions) to smaller molecules such as ethene, methane, H2, and CO (Stein et al., 1983). The greater average ER for acetaldehyde observed in the present study may be due to gases being captured (via the collection device) and removed from heat either between decomposition steps or before combustion. It is also possible that the trends seen for the OVOCs in Table 3, in particular the higher values for acetaldehyde, arise due to (a) differing vapor pressures, (b) differing degrees of the onset of combustion, (c) differing degrees of pyrolysis emissivity as suggested by Stein et al. (1983), (d) differing degrees of IR-spectroscopic sensitivity (i.e., certain other species with limited or no detectability), or (e) some combination of all these effects. Further analysis is warranted.
Table 3Average emission ratios (ppb ∕ ppmCO) for this study and for previously published fire studies; n/a – not applicable.
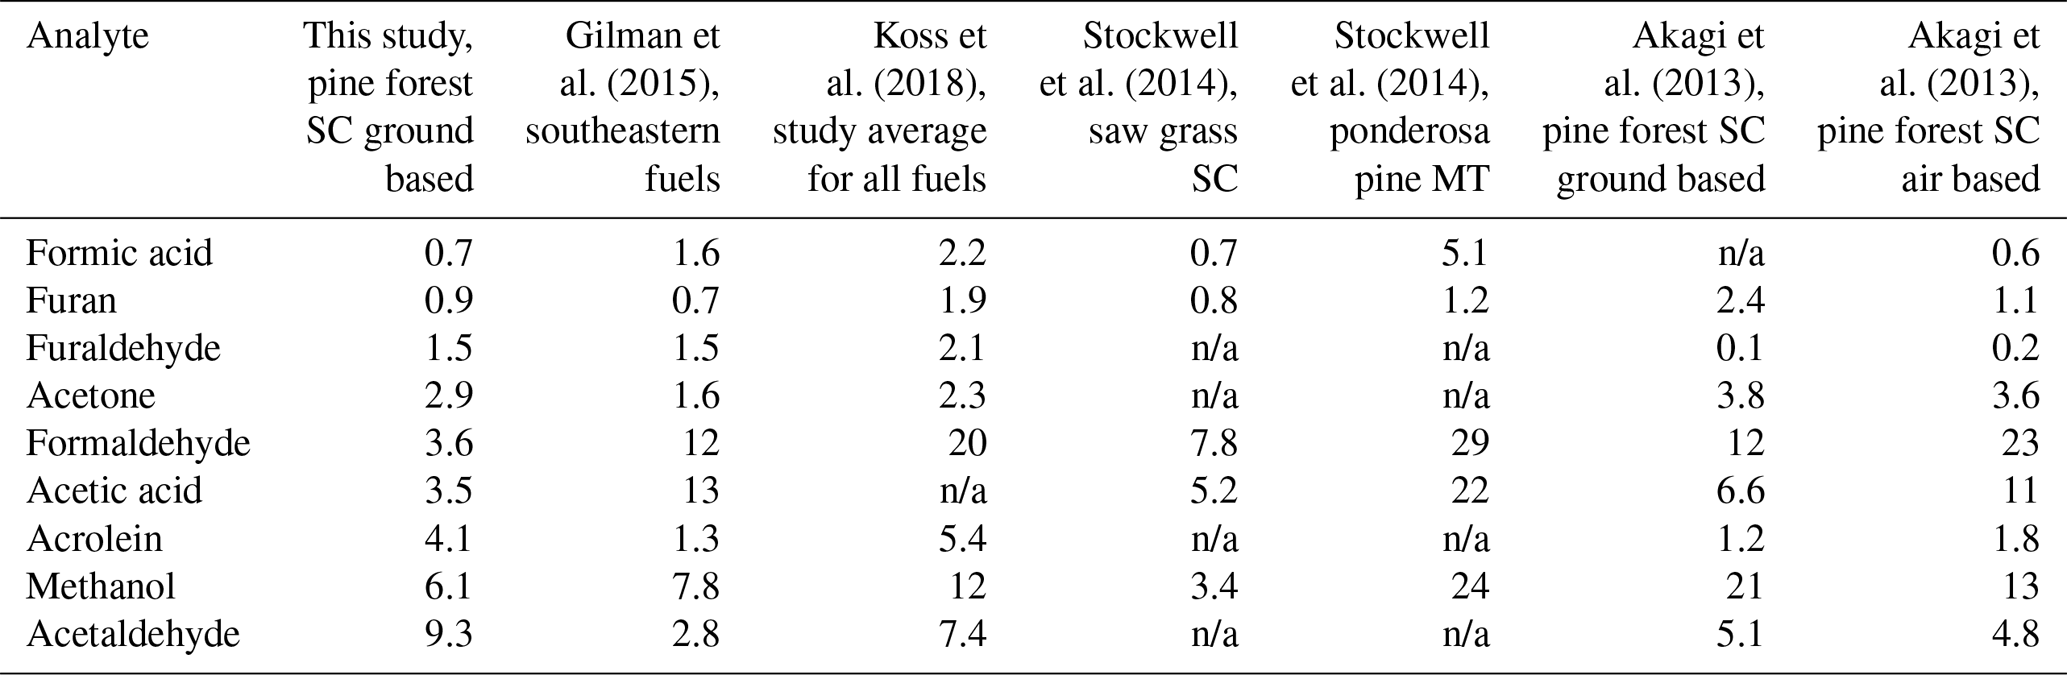
Koss et al. (2018) present the fire-integrated ERs. Gilman et al. (2015) present discrete ERs with sample acquisition of 20 to 300 s. Stockwell et al. (2014) present the fire-integrated ERs. Akagi et al. (2013) present fire-averaged EFs calculated using ERs derived by the regression method. The emission ratios for Akagi et al. (2013) were obtained from the ratio of the emission factors for the analyte and CO multiplied by the molar mass of CO ∕ molar mass of the analyte.
The slightly lower ERs for formaldehyde and acetic acid may in part be explained by secondary decomposition pathways. Proposed pathways that generate formaldehyde and acetic acid proceed through intermediates formed by the decomposition of levoglucosan (Shen and Gu, 2009). Formaldehyde is generated from a number of intermediates such as hydroxyacetone (acetol) (Lindenmaier et al., 2016) and 5-hydroxymethyl-furfural. While the formation mechanism for acetic acid is via the decomposition of the intermediate hydroxyacetaldehyde (glycolaldehyde) (Johnson et al., 2013), which undergoes a dehydration reaction to a ketene and then a rehydration to acetic acid (Shen and Gu, 2009), it is possible that the present conditions and fuels (save for site 24B) were not favorable for the above chemical pathways.
3.5 Emissions of aromatic compounds
In the present study, furan, furaldehyde, and naphthalene were all detected via FTIR. Previous fire studies have used FTIR to detect phenol and/or furan (Burling et al., 2011; Akagi et al., 2014; Hatch et al., 2017; Christian et al., 2003, 2004; Stockwell et al., 2014; Karl et al., 2007; Selimovic et al., 2018; Yokelson et al., 2013; Burling et al., 2010; Akagi et al., 2013). One of these studies also detected furaldehyde (Selimovic et al., 2018). To the best of our knowledge, however, this is the first burning study that has used IR spectroscopy to identify naphthalene vapor, though it has previously been detected in biomass burning emissions via other methods (Koss et al., 2018; Gilman et al., 2015). Naphthalene has also been detected in tar samples generated from the controlled pyrolysis of similar fuels (Safdari et al., 2018).
Phenol and phenolic compounds were not definitively observed in this study due to their IR bands being somewhat weak and obscured by a number of other species, namely acetic acid, carbon dioxide, acetylene, and hydrogen cyanide. However, phenolic compounds have been identified in products generated from the pyrolysis of lignin in controlled laboratory experiments by Kibet et al. (2012). Lignin, one of the three main components of biomass, can account for 10 %–35 % of the biomass, and its chemical structure consists of polymers of various phenolic alkyl side-chain subunits (Shen et al., 2015). When undergoing thermal decomposition, lignin will release volatiles at temperatures between 200 and 400 ∘C. The proposed mechanism can generate intermediates such as phenoxy radicals that ultimately lead to the formation of phenols (Kibet et al., 2012). In the present study, spectral evidence of phenol was in fact observed in some measurements, but the IR bands at 1176 and 752 cm−1 were weak and were masked by other compound signatures, hindering spectral quantification. Mixing ratios of phenol above the detection limit might have been anticipated since prior controlled pyrolysis investigations of sparkleberry and longleaf pine have detected phenol as a component in the tar (Safdari et al., 2018, 2019; Amini et al., 2019a). While the phenol signal was weak, furan and furaldehyde, however, were clearly detected, and their formation likely stemmed from the thermal degradation of the other main constituents of biomass. Besides lignin, the other primary macromolecular components are cellulose and hemicellulose, which account for approximately 50 % and 15 %–35 % by weight, respectively (Shen et al., 2015). The pyrolysis of cellulose is known to produce furaldehyde, furan, and other low-weight oxygenated compounds (e.g., acetic acid) via the intermediate levoglucosan (Bai et al., 2013). Moreover, furaldehyde and methanol have both been observed as volatile products from the pyrolysis of methyl β-D-xylopyranoside, a model compound for xylan-based hemicellulose (Shafizadeh et al., 1972).
Naphthalene is a polycyclic aromatic hydrocarbon with several sources, including as a biomass burning emission product. It was detected using FTIR for the first time in these studies (Scharko et al., 2019). Its IR detection was not unexpected given that it has been observed in collected tar samples generated by the laboratory pyrolysis of similar fuel types (Safdari et al., 2018), but its identification in an experimental IR spectrum can be challenging as depicted in Fig. 5. Most of its IR bands have only moderate cross sections with the exception of the ν46 band, which has a strong Q branch at 782.3 cm−1 (green trace in Fig. 5). For this band to be observed, however, it needs to be deconvoluted from the acetylene rotational–vibrational lines also present in this spectral domain (red trace in Fig. 5). Better retrievals for naphthalene were obtained using a higher spectral resolution (0.6 cm−1) since the Q branch of the ν46 band is quite sharp (FWHM ∼ 1 cm−1), even at atmospheric pressure (Scharko et al., 2019) .
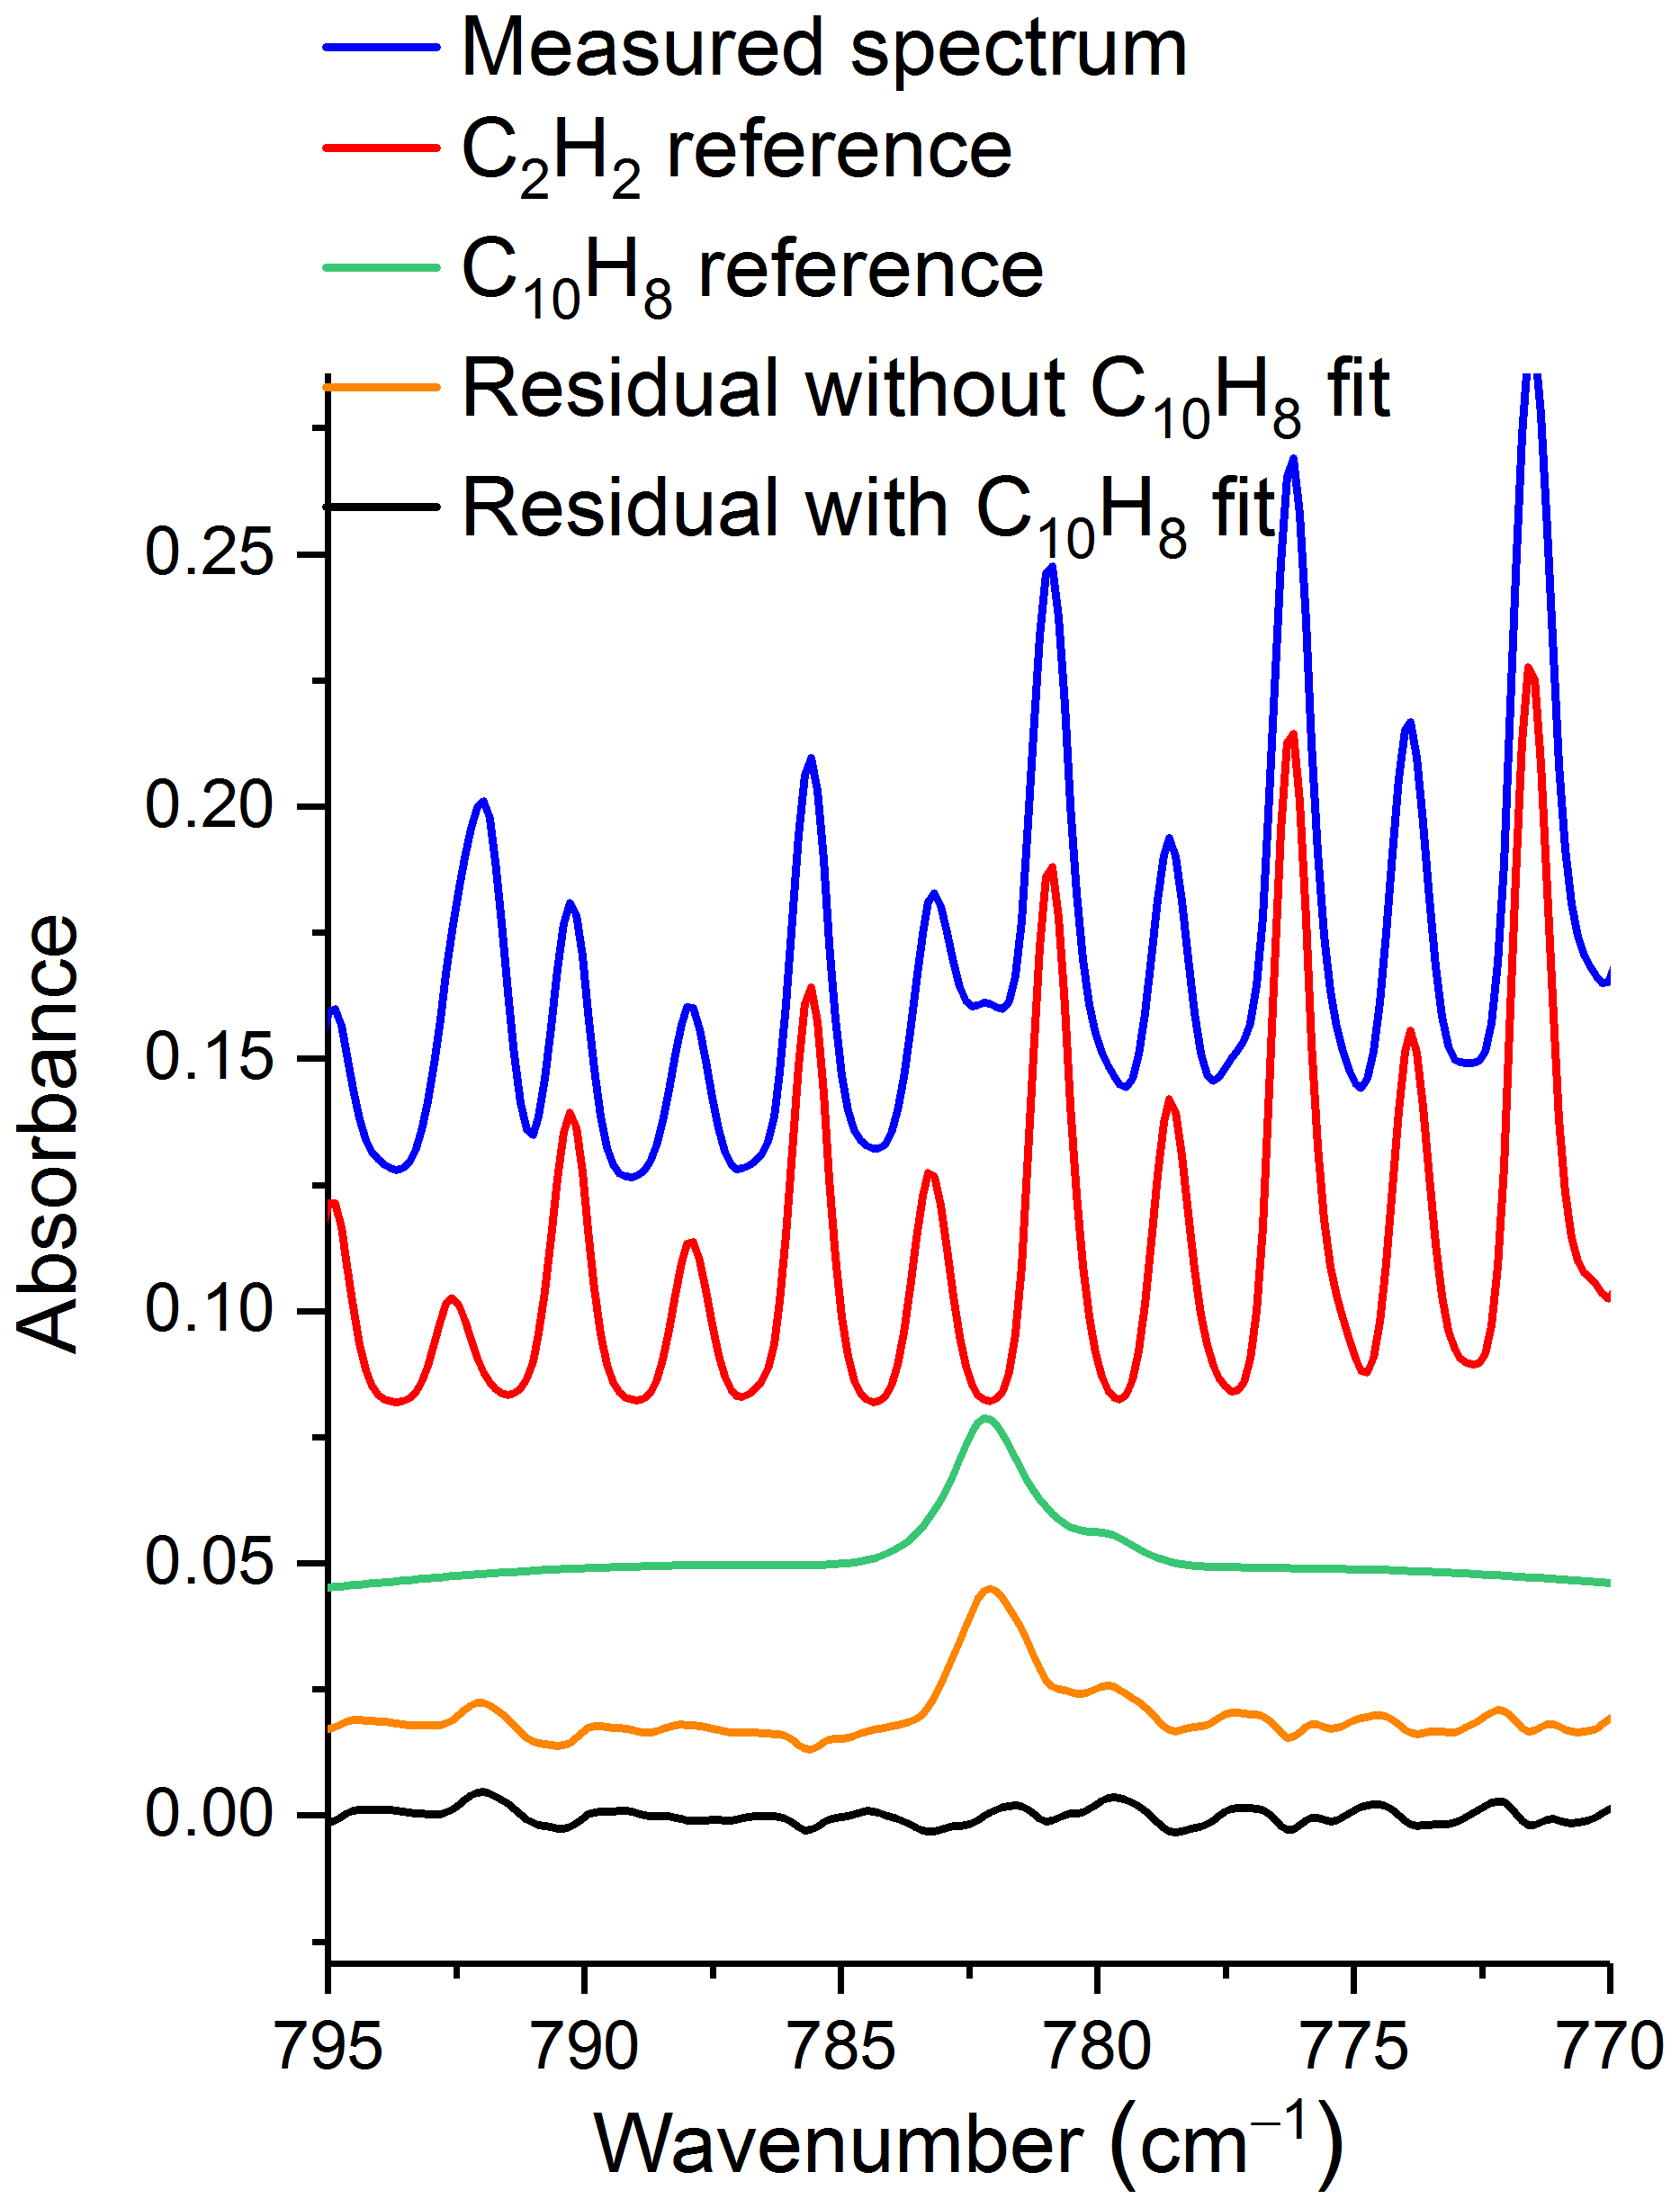
Figure 5Measured and scaled reference spectra for acetylene (C2H2) and naphthalene (C10H8) as well as residual with and without C10H8 fit. The measurement is from site 16, plot 6, msmt. 2, and the detected mixing ratio for naphthalene is 7.37 ppm. Spectra are offset for clarity. Reference absorption lines for acetylene are from HITRAN, and the reference spectrum for naphthalene is from PNNL.
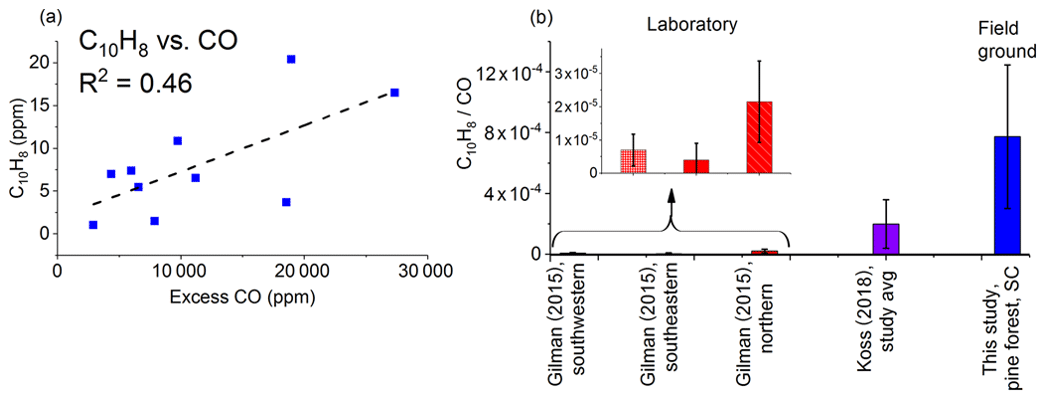
Figure 6(a) Mixing ratios (ppm) for naphthalene (C10H8) as a function of excess CO (ppm) measured by FTIR for each of the 10 canisters. The dashed line is a linear fit. (b) Average emission ratios (ppm ∕ ppmCO) for this study and for previous laboratory studies. Error bars represent 1σ. Koss et al. (2018) present the fire-integrated ERs. Gilman et al. (2015) present discrete ERs with sample acquisition of 20 to 300 s.
Figure 6a plots the mixing ratios (ppm) for naphthalene as a function of excess CO (ppm), while Fig. 6b displays the ERs for naphthalene for this study and previous studies. The average naphthalene ER for this study is substantially greater than the values from both Gilman et al. (2015) and Koss et al. (2018). The average for Koss et al. (2018), however, is in turn an order of magnitude greater than the highest average for Gilman et al. (2015). The higher ER for naphthalene in this study (shown in Fig. 6) clearly suggests that the method to capture pyrolysis gases was (at least in part) quite successful; i.e., we were able to collect naphthalene gas prior to it undergoing further reactions. Besides oxidation, under the right conditions naphthalene can also continue to react in a Diels–Alder type of reaction to form still larger polyaromatics (Fairburn et al., 1990; Richter and Howard, 2000). Sekimoto et al. (2018) also linked naphthalene with the high-temperature profile, and it appears that the samples in the present study were indeed collected when the high-temperature process was dominant. The detection of naphthalene suggests that benzene and/or styrene, which are the main precursors to polycyclic aromatic hydrocarbons, may also be present. Styrene was not detected via FTIR methods, and benzene is challenging for IR analysis since its one strong band (ν11 mode at 673 cm−1) is obfuscated by the CO2 ν2 bending mode under such polluted atmospheric conditions.
3.6 Emissions of nitrogen-containing species
Gases such as NH3, NO2, NO, HCN, and HONO have been identified using FTIR spectroscopy in fire laboratory experiments multiple times (Selimovic et al., 2018; Gilman et al., 2015; Christian et al., 2003, 2004; Goode et al., 1999; Yokelson et al., 1996, 1997; Stockwell et al., 2014; Hatch et al., 2017; Burling et al., 2010; Karl et al., 2007) as well as in field studies (Yokelson et al., 1999; Burling et al., 2011; Goode et al., 2000; Akagi et al., 2013, 2014; Karl et al., 2007). Multiple other methods have also been used to detect N-containing gases, such as HNCO and CH3CN (Gilman et al., 2015; Christian et al., 2003, 2004; Yokelson et al., 2009; Akagi et al., 2013; Karl et al., 2007; Roberts et al., 2010). The amount and speciation of N-containing compounds emitted are dependent on fuel type and nitrogen content (Stockwell et al., 2014; Burling et al., 2010; Coggon et al., 2016). Moreover, emissions can usually be linked to a stage of combustion: NO, NO2, HNCO, and HONO are all associated with the flaming stage, while NH3 and HCN are primarily associated with smoldering combustion but have also been suggested as pyrolysis gases (Goode et al., 1999; Yokelson et al., 1996; Roberts et al., 2010; Burling et al., 2010; Hansson et al., 2004; Di Blasi, 2008). Biomass pyrolysis experiments carried out in an inert (i.e., oxygen-free) atmosphere have revealed that NH3, HCN, and HNCO are all generated (Hansson et al., 2004). These compounds are all considered to be NOx (NO+NO2) and N2O precursors because they are oxidized via combustion (Hansson et al., 2004).
It is important to note that ammonia and related amine compounds are often best sampled via open-path techniques such as an open White cell, as these compounds are notorious for adhering to the walls of sampling or analysis devices, including those made from steel, glass, or Teflon (Stockwell et al., 2014; Yokelson et al., 2003). Sampling and passivation techniques have been discussed extensively (Neuman et al., 1999; Roscioli et al., 2015) for these “sticky” molecules, and the present method may thus not be optimal for these compounds. This caveat in mind, the major N-containing compound that was identified in the present pyrolysis study was HCN. This is consistent with previous small-scale and controlled laboratory studies that have shown HCN as the primary N product resulting from the pyrolysis of amino acids (Haidar et al., 1981; Johnson and Kan, 1971). This observation is further evidence that the gas samples were extracted when high temperature was the dominant process; Sekimoto et al. (2018) have associated HCN with the high-temperature pyrolysis profile. Figure 7a shows the correlation between HCN and excess CO (R2=0.89). Previous field fire studies have observed similar trends (Simpson et al., 2011; Stockwell et al., 2016). Figure 7b shows a comparison between the ERs for HCN for this study as well as from previous laboratory and field (both ground and airborne) studies. The present values are comparable to other ground-based measurements (Guérette et al., 2018; Akagi et al., 2013) but differ significantly from a few of the laboratory studies. It should be noted that although conducted at a different time of the year (late October–early November 2011), the studies by Akagi et al. (2013) took place near the same location as the current study (i.e., the same military base), and the ERs for HCN they report are not significantly different from the present measurements. This suggests that the ratio of initial gases released of HCN to CO is consistent with the ratio of these gases over the duration of the fire, or at least the fire-averaged ratio. With regards to ERs for HCN, the major factor that appears to influence these values is fuel type, particularly the fuel's peat content. Both laboratory (Stockwell et al., 2014) and field (Stockwell et al., 2016) studies of Indonesian peat have shown greatly enhanced ERs for HCN compared to the studies represented in Fig. 7b, which consist mostly of pine, grasses, and fuels of non-peat origin. The range of averages of ERs for HCN shown in Fig. 7b is 0.0028–0.0095; the averages for the Indonesian peat in laboratory and field studies were 0.015 and 0.021, respectively (Stockwell et al., 2014, 2016), and interestingly are about an order of magnitude greater than the range of values seen in Fig. 7b.
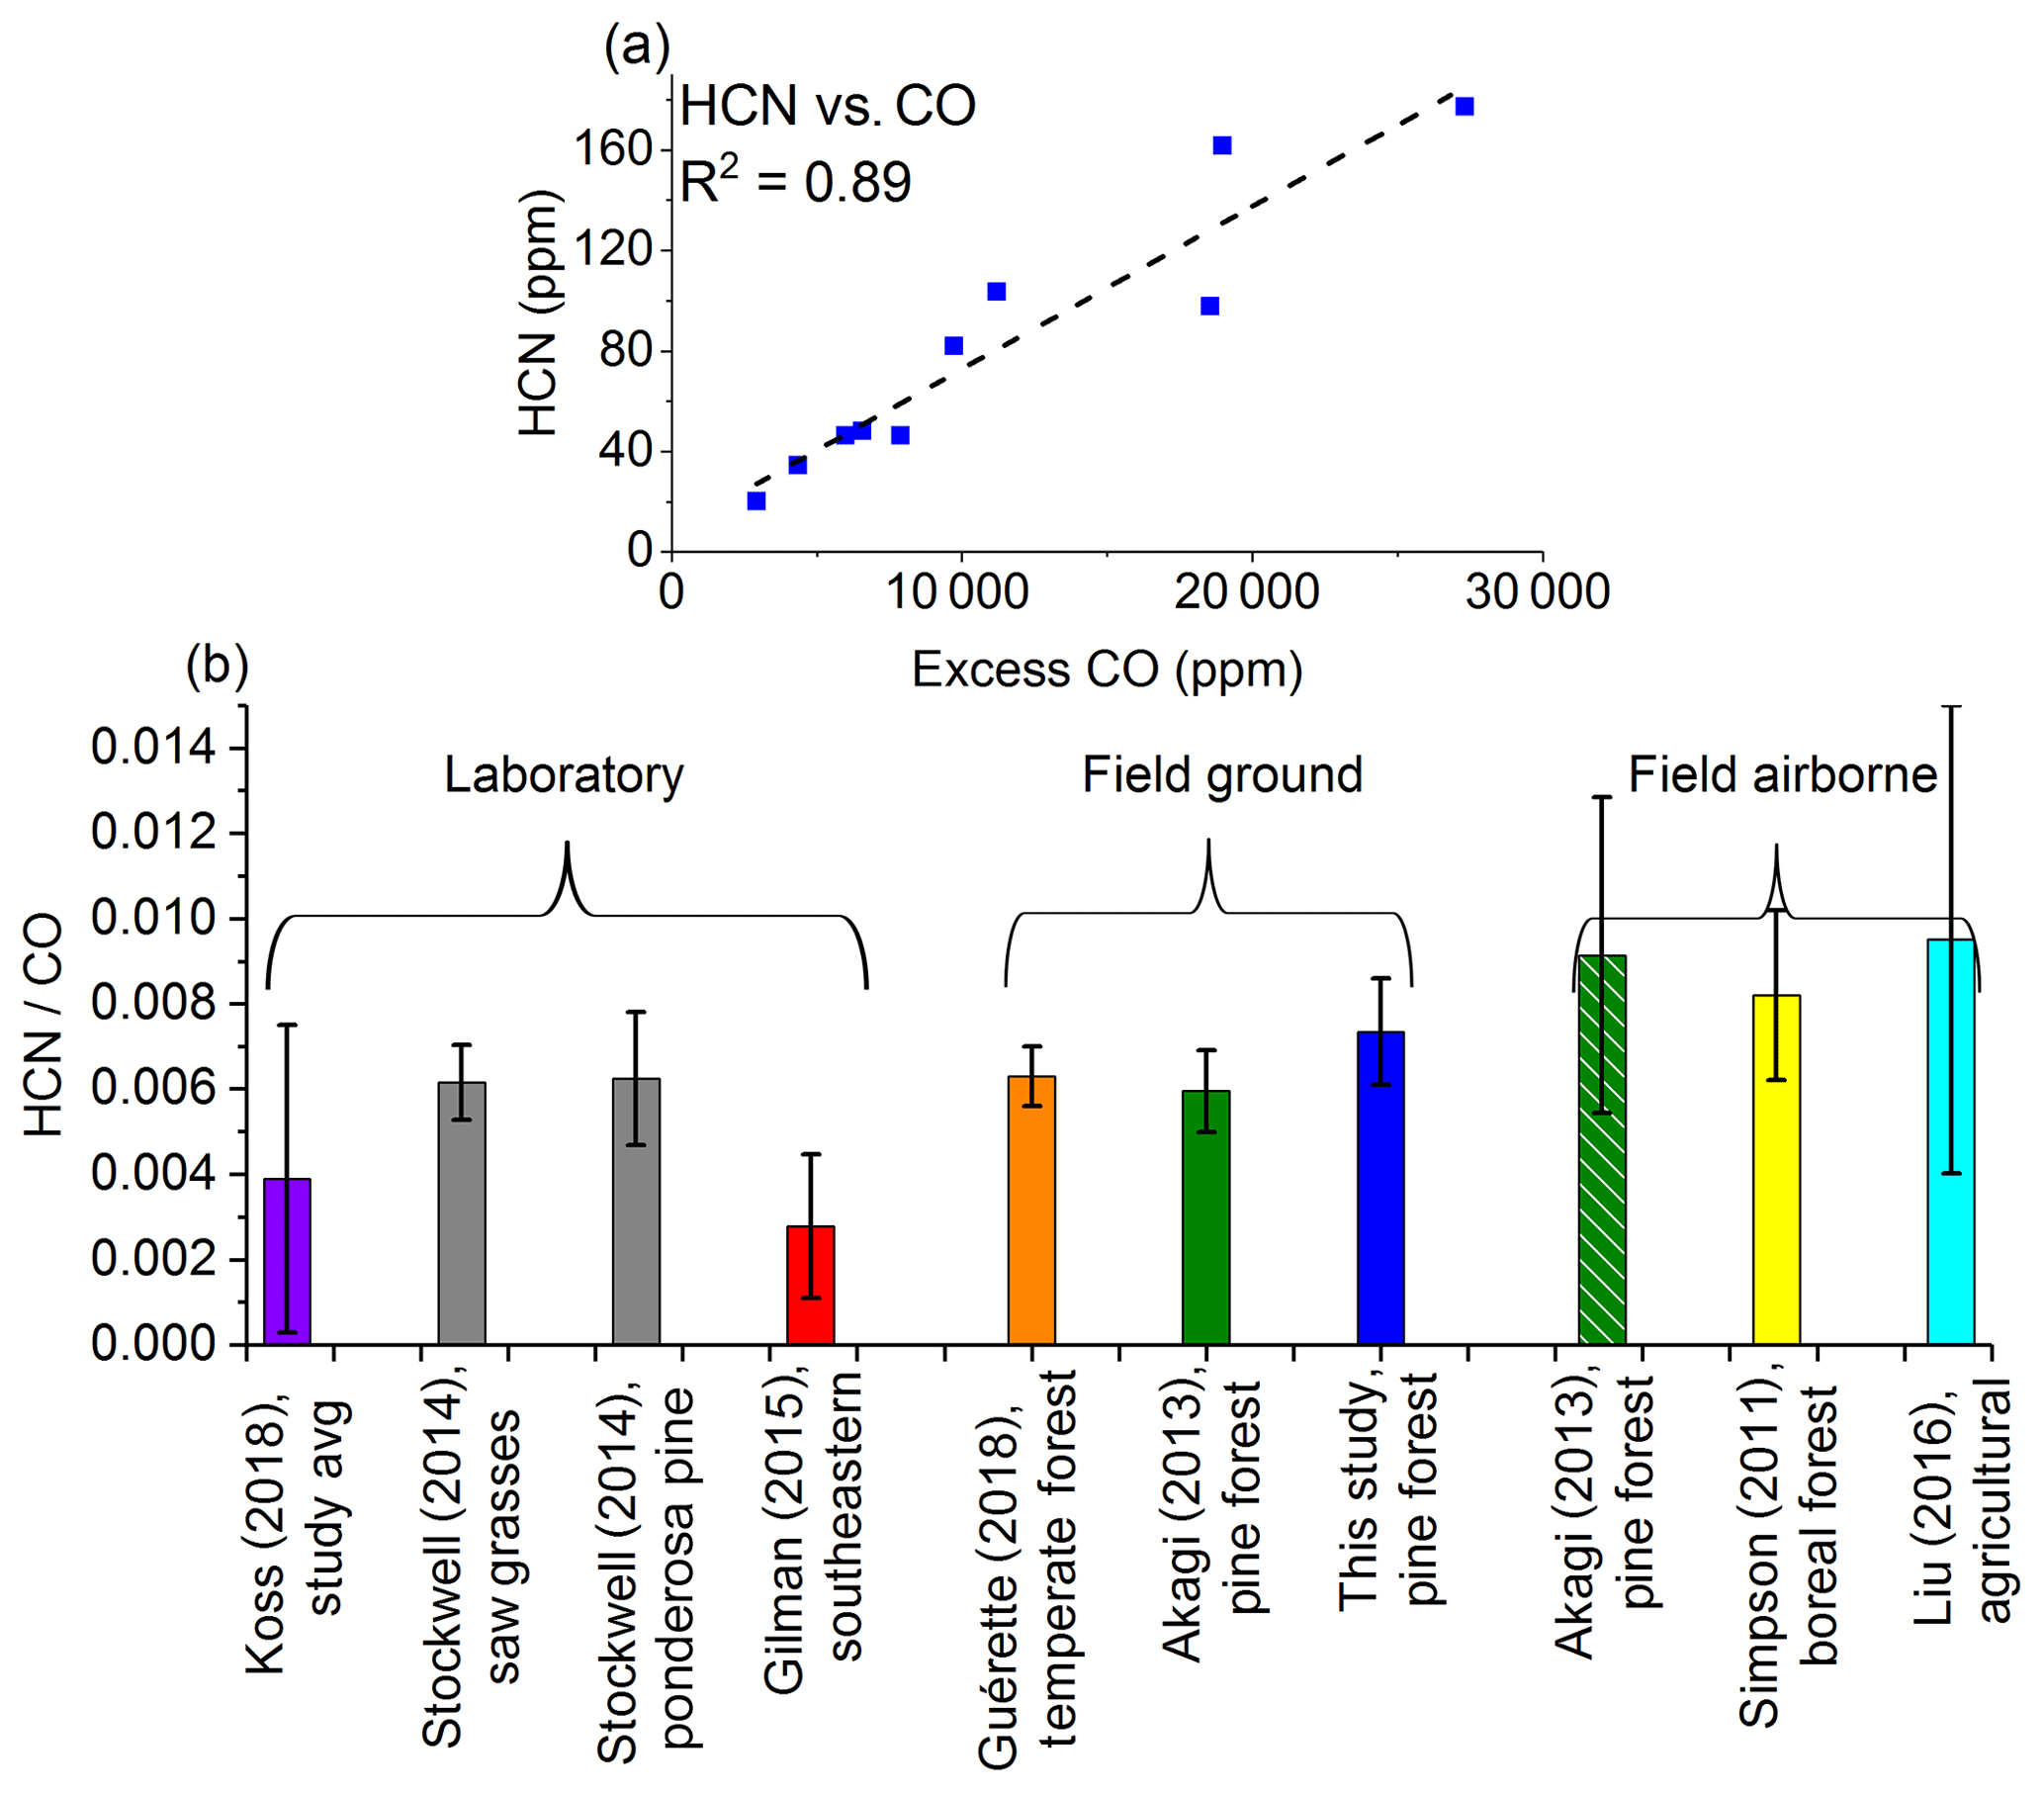
Figure 7(a) Mixing ratios (ppm) for HCN as a function of excess CO (ppm) measured by FTIR. The dashed line is a linear fit. (b) Average emission ratios (ppmHCN ∕ ppmCO) for this study and previous laboratory and field investigations. Error bars represent 1σ. Koss et al. (2018) and Stockwell et al. (2014) present fire-integrated ERs. Gilman et al. (2015) present discrete ERs with sample acquisition of 20–300 s. Simpson et al. (2011) present fire-averaged ERs derived by regression. Guérette et al. (2018) present a single ER from all fires and derived by regression. Akagi et al. (2013) and Liu et al. (2016) present fire-averaged EFs calculated using ERs derived by regression. The ERs for Akagi et al. (2013) and Liu et al. (2016) were derived from the ratio of the EFs for HCN and CO multiplied by the molar mass of CO ∕ molar mass of HCN.
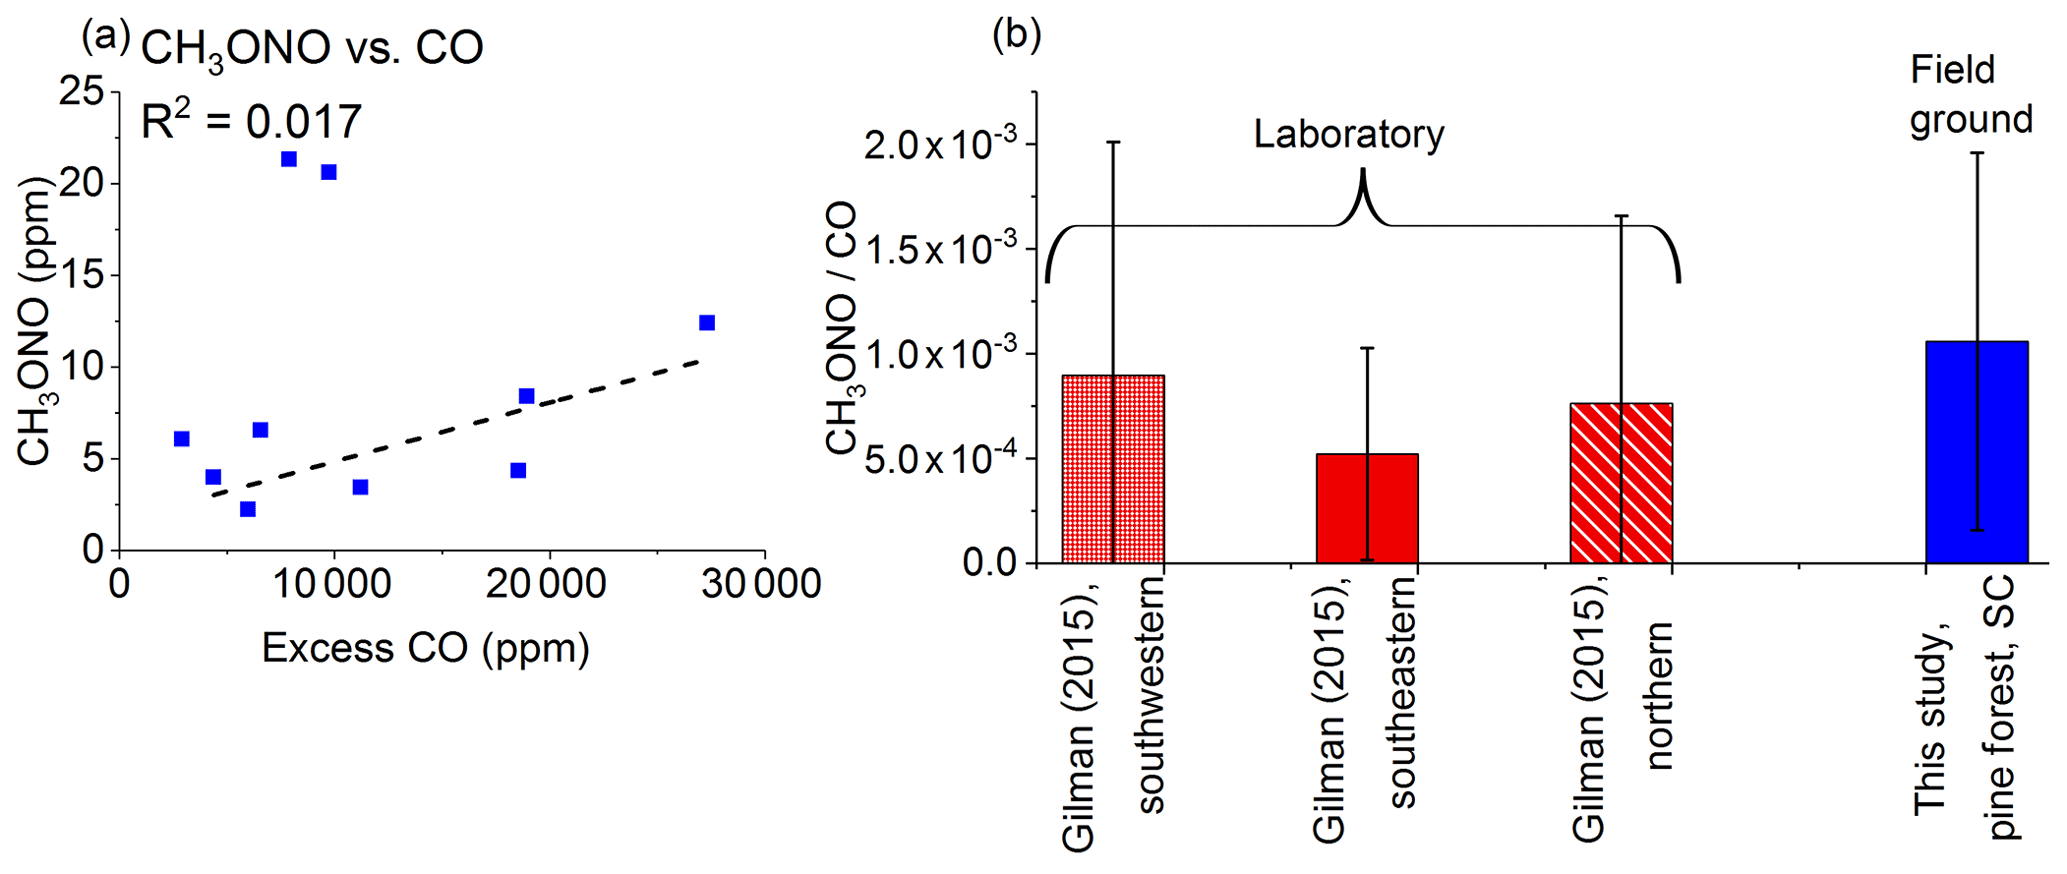
Figure 8(a) Mixing ratios (ppm) for methyl nitrite (CH3ONO) as a function of excess CO (ppm) as measured by FTIR. The dashed line is a linear fit. (b) Average emission ratios (ppm ∕ ppmCO) for this study and a previously published study carried out in the laboratory using different fuels representative of three US regions. Error bars represent 1σ. Gilman et al. (2015) present discrete ERs with sample acquisition of 20 to 300 s.
In the present study, trace amounts of HONO were detected, but NH3 was not observed. The absence of NH3 was somewhat unexpected since, similar to HCN, it is a known product from the pyrolysis of amino acids (Haidar et al., 1981) and has been observed in prior prescribed fires conducted at Ft. Jackson (Akagi et al., 2013, 2014). There are several possible explanations for the lack of NH3 in the measurements. First and foremost, experimentally NH3 is well known to adhere to certain surfaces (e.g., steel), and in this study it may have adhered to the canisters or tubing walls and was thus not detected (Neuman et al., 1999; Roscioli et al., 2015; Stockwell et al., 2014; Yokelson et al., 2003). Second, Sekimoto et al. (2018) observed that NH3 is more often associated with a low-temperature pyrolysis profile, and it appears that the present samples were extracted during a period when high-temperature pyrolysis was the main process. Third, NH3 is strongly linked with the smoldering phase (Goode et al., 1999; Yokelson et al., 1996), and samples were not collected during this phase. Fourth, the speciation of the N species emitted is dependent on the fuel composition and amount of oxygen (Ren and Zhao, 2012, 2013a, b), so it is possible that in the present study the conditions favored HCN instead of NH3.
The IR quantification of other N species, such as NO, NO2, CH3NO2, and HNCO, was obstructed due to interferences from H2O, CO, and CO2 as well as the low emission values for some of these N species. Specifically, NO and NO2 were likely not observed as these species are usually associated with flaming combustion. HNCO has been linked with pyrolysis processes, and its main formation pathway is the cracking of cyclic amides along with HCN, which is also a product of pyrolysis (Hansson et al., 2004). After accounting for the challenges in measuring NO, NO2, and HNCO, the second most prevalent N-containing species observed in this work was methyl nitrite (CH3ONO). Methyl nitrite has previously been detected in emissions from biomass burning using other methods (Gilman et al., 2015). Figure 8a shows the plot of mixing ratios for methyl nitrite as a function of excess CO. Unlike HCN (Fig. 7a), methyl nitrite exhibits only minimal correlation with excess CO. As one possible alternative explanation, methyl nitrite is known to be associated with rocket-propelled grenades (RPGs), but the Ft. Jackson military base records did not indicate RPG usage for these burn plots (Scharko et al., 2019). While few fire studies have observed methyl nitrite, Gilman et al. (2015) have detected it using gas chromatography–mass spectrometry (GC-MS). Figure 8b shows a comparison of the results from Gilman et al. (2015), separated by US region, with the present results. It is worthy to note that both studies observed similar ERs and that in the Gilman study, methyl nitrite had the second highest mean ER after HCN for N-bearing species in southwestern fuels. Our observation of methyl nitrite is thus not unprecedented, but this was its first reported detection via FTIR (Scharko et al., 2019). In the present study, three measurements (site 16, plot 1, msmt. 1; plot 24A, msmt. 3; and plot 24B) had higher ERs for methyl nitrite than the others, and it is unclear why this is the case. Other measurements collected at the same location reported lower ER values. If the three highest ER measurements in question are not included in the regression then the correlation between methyl nitrite and CO is stronger, and the average ER is closer to values reported by Gilman et al. (2015) for southeastern fuels. One possible explanation for the three greater ER values is that the fuels may have contained more components such as nitrate esters and isopropyl nitrate, both of which are known to release minor amounts of methyl nitrite under controlled pyrolysis conditions (Boschan et al., 1955; Griffiths et al., 1975).
While it is clearly important to sample fires, as was done in this prescribed fire study, it is also important to recall that significant differences may exist in the emissions between wildfire and prescribed fire. For example, as pointed out by Liu et al. (2017), there is far more particulate matter emitted from a wildfire than for a controlled prescribed fire. Other differences in emissions from prescribed fires and wildfires must surely exist, e.g., fuel consumption, fire meteorology, etc. This paper only explores gas-phase emissions of the early stages of prescribed fires in the southeastern US.
The main objective of this study was to collect and quantify gas-phase compounds emitted ahead of the flame front (prior to the onset of combustion) in prescribed burns conducted in a pine forest. Primary and secondary decomposition pathways generate volatile products, which in turn can act as fuel gases that undergo combustion and contribute to sustaining the fire. The main observation is that the estimated ratio of high- to low-temperature VOC emissions suggests that the samples were indeed extracted when the high-temperature pyrolysis process was dominant. The acetylene ∕ furan ratio suggested by Sekimoto et al. (2018) was nearly 10 times higher than in previous studies; this is in fact consistent, as previous works all had longer collection times and in some cases fire-averaged values. The significantly greater ERs observed for specific compounds, e.g., lightweight HCs such as ethene and acetylene as well as unoxidized aromatics such as naphthalene, all support the hypothesis that the grab samples were collected prior to the onset of decomposition, recombination, or combustion reactions and that such gases represent pyrolytic processes. For the oxidized organics, acetaldehyde and methanol consistently had the highest ER values relative to CO for this collection of pyrolysis gases. The ERs for acetic acid and formaldehyde were found to be high in one instance, but this appeared to be related to fuel composition of the individual burn site. The major N component released was HCN, while NH3 was not observed. This is consistent with the collected gases representing species associated with the high-temperature pyrolysis process, but the collection of NH3 and amines in such systems is always problematic due to wall adhesion. It would be interesting to study the effects of initial pyrolysis gas composition ratios on the composition of the downwind plume (Johnson et al., 2006, 2009).
Data are not publicly available as they are not released by the sponsor. All publicly available data are in the paper and the Supplement.
The supplement related to this article is available online at: https://doi.org/10.5194/acp-19-9681-2019-supplement.
NKS, TLM, and TJJ contributed to the writing of this paper. AMO and RGT set up the laboratory and recorded infrared data. NKS, AMO, and CAB provided data processing and analysis. SPB, ENL, JC, BMC, and GMB aided in the collection of field samples. JC provided thermal imaging and videography. RDO and JRC contributed to fuel characterization. DRW and TJJ were the project managers.
The authors declare that they have no conflict of interest.
This work was supported by the Department of Defense's Strategic Environmental Research and Development Program (SERDP) within project RC-2640, and we gratefully acknowledge our sponsors for their support. PNNL is operated for the U.S. Department of Energy by the Battelle Memorial Institute under contract DE-AC06-76RLO 1830. We gratefully thank David W. T. Griffith for his valuable guidance and direction using the program MALT5 for spectral analysis. We are grateful to John Maitland and colleagues at Fort Jackson for hosting the field campaign and carrying out the burns. We thank Olivia Williams for help with spectral analysis using MALT5. In addition, we are thankful to Michael L. Myrick and his students at the University of South Carolina for hosting us in their laboratory and for their helpful support setting up the instrument. This paper is dedicated to Angela “Nicole” Chadwick Hawkins, Fort Jackson Wildlife Biologist. Nicole was a champion for the use of prescribed fire and the conservation of all natural resources, especially the red-cockaded woodpecker and longleaf pine ecosystem. She dedicated much of her professional career to bird conservation as an exceptionally dedicated and talented biologist. Nicole was a devoted mother of three.
This research has been supported by the Department of Defense Strategic Environmental Research and Development Program (grant no. RC-2460).
This paper was edited by James Roberts and reviewed by two anonymous referees.
Akagi, S. K., Yokelson, R. J., Wiedinmyer, C., Alvarado, M. J., Reid, J. S., Karl, T., Crounse, J. D., and Wennberg, P. O.: Emission factors for open and domestic biomass burning for use in atmospheric models, Atmos. Chem. Phys., 11, 4039–4072, https://doi.org/10.5194/acp-11-4039-2011, 2011.
Akagi, S. K., Yokelson, R. J., Burling, I. R., Meinardi, S., Simpson, I., Blake, D. R., McMeeking, G. R., Sullivan, A., Lee, T., Kreidenweis, S., Urbanski, S., Reardon, J., Griffith, D. W. T., Johnson, T. J., and Weise, D. R.: Measurements of reactive trace gases and variable O3 formation rates in some South Carolina biomass burning plumes, Atmos. Chem. Phys., 13, 1141–1165, https://doi.org/10.5194/acp-13-1141-2013, 2013.
Akagi, S. K., Burling, I. R., Mendoza, A., Johnson, T. J., Cameron, M., Griffith, D. W. T., Paton-Walsh, C., Weise, D. R., Reardon, J., and Yokelson, R. J.: Field measurements of trace gases emitted by prescribed fires in southeastern US pine forests using an open-path FTIR system, Atmos. Chem. Phys., 14, 199–215, https://doi.org/10.5194/acp-14-199-2014, 2014.
Albini, F. A.: Estimating wildfire behavior and effects, USDA Forest Service General Technical Report, INT-30, 1976.
Alves, C. A., Gonçalves, C., Pio, C. A., Mirante, F., Caseiro, A., Tarelho, L., Freitas, M. C., and Viegas, D. X.: Smoke emissions from biomass burning in a Mediterranean shrubland, Atmos. Environ., 44, 3024–3033, 2010.
Amini, E., Safdari, M.-S., DeYoung, J. T., Weise, D. R., and Fletcher, T. H.: Characterization of pyrolysis products from slow pyrolysis of live and dead vegetation native to the southern United States, Fuel, 235, 1475–1491, https://doi.org/10.1016/j.fuel.2018.08.112, 2019a.
Amini, E., Safdari, M.-S., Weise, D. R., and Fletcher, T. H.: Pyrolysis Kinetics of Live and Dead Wildland Vegetation from the Southern United States, J. Anal. Appl. Pyrol., https://doi.org/10.1016/j.jaap.2019.05.002, 2019b.
Andreae, M. O.: Biomass burning: Its history, use, and distribution and its impact on environmental quality and global climate, in: Global Biomass Burning: Atmospheric, Climatic, and Biospheric Implications, edited by: Levine, J. S., MIT Press, Cambridge, Mass, 3–21, 1991.
Andreae, M. O. and Merlet, P.: Emission of trace gases and aerosols from biomass burning, Global Biogeochem. Cy., 15, 955–966, 2001.
Andreae, M. O., Browell, E. V., Garstang, M., Gregory, G. L., Harriss, R. C., Hill, G. F., Jacob, D. J., Pereira, M. C., Sachse, G. W., Setzer, A. W., Silva Dias, P. L., Talbot, R. W., Torres, A. L., and Wofsy, S. C.: Biomass-burning emissions and associated haze layers over Amazonia, J. Geophys. Res.-Atmos., 93, 1509–1527, 1988.
Andreae, M. O., Anderson, B. E., Blake, D. R., Bradshaw, J. D., Collins, J. E., Gregory, G. L., Sachse, G. W., and Shipham, M. C.: Influence of plumes from biomass burning on atmospheric chemistry over the equatorial and tropical South Atlantic during CITE 3, J. Geophys. Res.-Atmos., 99, 12793–12808, 1994.
Azeez, A. M., Meier, D., and Odermatt, J.: Temperature dependence of fast pyrolysis volatile products from European and African biomasses, J. Anal. Appl. Pyrol., 90, 81–92, 2011.
Bai, X., Johnston, P., Sadula, S., and Brown, R. C.: Role of levoglucosan physiochemistry in cellulose pyrolysis, J. Anal. Appl. Pyrol., 99, 58–65, 2013.
Boschan, R., Merrow, R. T., and van Dolah, R. W.: The chemistry of nitrate esters, Chem. Rev., 55, 485–510, 1955.
Burling, I. R., Yokelson, R. J., Griffith, D. W. T., Johnson, T. J., Veres, P., Roberts, J. M., Warneke, C., Urbanski, S. P., Reardon, J., Weise, D. R., Hao, W. M., and de Gouw, J.: Laboratory measurements of trace gas emissions from biomass burning of fuel types from the southeastern and southwestern United States, Atmos. Chem. Phys., 10, 11115–11130, https://doi.org/10.5194/acp-10-11115-2010, 2010.
Burling, I. R., Yokelson, R. J., Akagi, S. K., Urbanski, S. P., Wold, C. E., Griffith, D. W. T., Johnson, T. J., Reardon, J., and Weise, D. R.: Airborne and ground-based measurements of the trace gases and particles emitted by prescribed fires in the United States, Atmos. Chem. Phys., 11, 12197–12216, https://doi.org/10.5194/acp-11-12197-2011, 2011.
Cary, A.: Some relations of fire to longleaf pine, J. For., 30, 594–601, 1932.
Chi, C., Horn, D., Reznik, R., Zanders, D., Opferkuch, R., Nyers, J., Pierovich, J., Lavdas, L., Mcmahon, C., and Nelson, R.: Source assessment: prescribed burning, state of the art, US Environmental Protection Agency, EPA (US) Report EPA-600/2-79-019h, 1979.
Christian, T. J., Kleiss, B., Yokelson, R. J., Holzinger, R., Crutzen, P. J., Hao, W. M., Saharjo, B. H., and Ward, D. E.: Comprehensive laboratory measurements of biomass-burning emissions: 1. Emissions from Indonesian, African, and other fuels, J. Geophys. Res.-Atmos., 108, 4719, https://doi.org/10.1029/2003JD003704, 2003.
Christian, T. J., Kleiss, B., Yokelson, R. J., Holzinger, R., Crutzen, P. J., Hao, W. M., Shirai, T., and Blake, D. R.: Comprehensive laboratory measurements of biomass-burning emissions: 2. First intercomparison of open-path FTIR, PTR-MS, and GC-MS/FID/ECD, J. Geophys. Res.-Atmos., 109, D02311, https://doi.org/10.1029/2003JD003874, 2004.
Clark, M. M., Fletcher, T. H., and Linn, R. R.: A sub-grid, mixture–fraction-based thermodynamic equilibrium model for gas phase combustion in FIRETEC: development and results, Int. J. Wildland Fire, 19, 202–212, 2010.
Coggon, M. M., Veres, P. R., Yuan, B., Koss, A., Warneke, C., Gilman, J. B., Lerner, B. M., Peischl, J., Aikin, K. C., Stockwell, C. E., Hatch, L. E., Ryerson, T. B., Roberts, J. M., Yokelson, R. J., and de Gouw, J. A.: Emissions of nitrogen-containing organic compounds from the burning of herbaceous and arboraceous biomass: Fuel composition dependence and the variability of commonly used nitrile tracers, Geophys. Res. Lett., 43, 9903–9912, 2016.
Collard, F.-X. and Blin, J.: A review on pyrolysis of biomass constituents: Mechanisms and composition of the products obtained from the conversion of cellulose, hemicelluloses and lignin, Renew. Sustain. Energy Rev., 38, 594–608, 2014.
Crutzen, P. J., Heidt, L. E., Krasnec, J. P., Pollock, W. H., and Seiler, W.: Biomass burning as a source of atmospheric gases CO, H2, N2O, NO, CH3Cl and COS, Nature, 282, 253–256, https://doi.org/10.1038/282253a0, 1979.
Crutzen, P. J. and Andreae, M. O.: Biomass burning in the tropics: Impact on atmospheric chemistry and biogeochemical cycles, Science, 250, 1669–1678, 1990.
DeGroot, W. F., Pan, W.-P., Rahman, M. D., and Richards, G. N.: First chemical events in pyrolysis of wood, J. Anal. Appl. Pyrol., 13, 221–231, 1988.
Di Blasi, C.: Modeling and simulation of combustion processes of charring and non-charring solid fuels, Prog. Energy Combust. Sci., 19, 71–104, 1993.
Di Blasi, C.: Modeling chemical and physical processes of wood and biomass pyrolysis, Prog. Energy Combust. Sci., 34, 47–90, 2008.
Dlugokencky, E., and Tans, P.: NOAA/ESRL, available at: https://www.esrl.noaa.gov/gmd/ccgg/trends/ (last access: 22 July 2019), 2012.
Fagernäs, L., Kuoppala, E., and Simell, P.: Polycyclic aromatic hydrocarbons in birch wood slow pyrolysis products, Energy Fuels, 26, 6960–6970, 2012.
Fairburn, J. A., Behie, L. A., and Svrcek, W. Y.: Ultrapyrolysis of n-hexadecane in a novel micro-reactor, Fuel, 69, 1537–1545, 1990.
Ferguson, S. C., Dahale, A., Shotorban, B., Mahalingam, S., and Weise, D. R.: The role of moisture on combustion of pyrolysis gases in wildland fires, Combust. Sci. Technol., 185, 435–453, 2013.
Fernandes, P. M. and Botelho, H. S.: A review of prescribed burning effectiveness in fire hazard reduction, Int. J. Wildland Fire, 12, 117–128, 2003.
Gilman, J. B., Lerner, B. M., Kuster, W. C., Goldan, P. D., Warneke, C., Veres, P. R., Roberts, J. M., de Gouw, J. A., Burling, I. R., and Yokelson, R. J.: Biomass burning emissions and potential air quality impacts of volatile organic compounds and other trace gases from fuels common in the US, Atmos. Chem. Phys., 15, 13915–13938, https://doi.org/10.5194/acp-15-13915-2015, 2015.
Goode, J. G., Yokelson, R. J., Susott, R. A., and Ward, D. E.: Trace gas emissions from laboratory biomass fires measured by open-path Fourier transform infrared spectroscopy: Fires in grass and surface fuels, J. Geophys. Res.-Atmos., 104, 21237–21245, 1999.
Goode, J. G., Yokelson, R. J., Ward, D. E., Susott, R. A., Babbitt, R. E., Davies, M. A., and Hao, W. M.: Measurements of excess O3, CO2, CO, CH4, C2H4, C2H2, HCN, NO, NH3, HCOOH, CH3COOH, HCHO, and CH3OH in 1997 Alaskan biomass burning plumes by airborne Fourier transform infrared spectroscopy (AFTIR), J. Geophys. Res.-Atmos., 105, 22147–22166, 2000.
Gordon, I. E., Rothman, L. S., Hill, C., Kochanov, R. V., Tan, Y., Bernath, P. F., Birk, M., Boudon, V., Campargue, A., Chance, K. V., Drouin, B. J., Flaud, J.-M., Gamache, R. R., Hodges, J. T., Jacquemart, D., Perevalov, V. I., Perrin, A., Shine, K. P., Smith, M.-A. H., Tennyson, J., Toon, G. C., Tran, H., Tyuterev, V. G., Barbe, A., Császár, A. G., Devi, V. M., Furtenbacher, T., Harrison, J. J., Hartmann, J.-M., Jolly, A., Johnson, T. J., Karman, T., Kleiner, I., Kyuberis, A. A., Loos, J., Lyulin, O. M., Massie, S. T., Mikhailenko, S. N., Moazzen-Ahmadi, N., Müller, H. S. P., Naumenko, O. V., Nikitin, A. V., Polyansky, O. L., Rey, M., Rotger, M., Sharpe, S. W., Sung, K., Starikova, D., Tashkun, S. A., Vander Auwera, J., Wagner, G., Wilzewski, J., Wcisło, P., Yu, S., and Zak, E. J.: The HITRAN2016 molecular spectroscopic database, J. Quant. Spectrosc. Ra., 203, 3–69, 2017.
Griffith, D. W. T.: MALT5 User guide Version 5.5.9, 2016.
Griffiths, J. F., Gilligan, M. F., and Gray, P.: Pyrolysis of isopropyl nitrate. I. Decomposition at low temperatures and pressures, Combust. Flame, 24, 11–19, 1975.
Guérette, E.-A., Paton-Walsh, C., Desservettaz, M., Smith, T. E. L., Volkova, L., Weston, C. J., and Meyer, C. P.: Emissions of trace gases from Australian temperate forest fires: emission factors and dependence on modified combustion efficiency, Atmos. Chem. Phys., 18, 3717–3735, https://doi.org/10.5194/acp-18-3717-2018, 2018.
Haidar, N. F., Patterson, J. M., Moors, M., and Smith Jr, W. T.: Effects of structure on pyrolysis gases from amino acids, J. Agric. Food Chem., 29, 163–165, 1981.
Hansson, K.-M., Samuelsson, J., Tullin, C., and Åmand, L.-E.: Formation of HNCO, HCN, and NH3 from the pyrolysis of bark and nitrogen-containing model compounds, Combust. Flame, 137, 265–277, 2004.
Hatch, L. E., Yokelson, R. J., Stockwell, C. E., Veres, P. R., Simpson, I. J., Blake, D. R., Orlando, J. J., and Barsanti, K. C.: Multi-instrument comparison and compilation of non-methane organic gas emissions from biomass burning and implications for smoke-derived secondary organic aerosol precursors, Atmos. Chem. Phys., 17, 1471–1489, https://doi.org/10.5194/acp-17-1471-2017, 2017.
Hurst, D. F., Griffith, D. W. T., Carras, J. N., Williams, D. J., and Fraser, P. J.: Measurements of trace gases emitted by Australian savanna fires during the 1990 dry season, J. Atmos. Chem., 18, 33–56, 1994a.
Hurst, D. F., Griffith, D. W. T., and Cook, G. D.: Trace gas emissions from biomass burning in tropical Australian savannas, J. Geophys. Res.-Atmos., 99, 16441–16456, 1994b.
Johnson, T. J., Masiello, T., and Sharpe, S. W.: The quantitative infrared and NIR spectrum of CH2I2 vapor: vibrational assignments and potential for atmospheric monitoring, Atmos. Chem. Phys., 6, 2581–2591, https://doi.org/10.5194/acp-6-2581-2006, 2006.
Johnson, T. J., Sams, R. L., Burton, S. D., and Blake, T. A.: Absolute integrated intensities of vapor-phase hydrogen peroxide (H2O2) in the mid-infrared at atmospheric pressure, Anal. Bioanal. Chem., 395, 377–386, 2009.
Johnson, T. J., Profeta, L. T. M., Sams, R. L., Griffith, D. W. T., and Yokelson, R. L.: An infrared spectral database for detection of gases emitted by biomass burning, Vib. Spectrosc., 53, 97–102, 2010.
Johnson, T. J., Sams, R. L., Profeta, L. T., Akagi, S. K., Burling, I. R., Yokelson, R. J., and Williams, S. D.: Quantitative IR spectrum and vibrational assignments for glycolaldehyde vapor: glycolaldehyde measurements in biomass burning plumes, J. Phys. Chem. A, 117, 4096–4107, 2013.
Johnson, W. R. and Kan, J. C.: Mechanisms of hydrogen cyanide formation from the pyrolysis of amino acids and related compounds, J. Org. Chem., 36, 189–192, 1971.
Karl, T. G., Christian, T. J., Yokelson, R. J., Artaxo, P., Hao, W. M., and Guenther, A.: The Tropical Forest and Fire Emissions Experiment: method evaluation of volatile organic compound emissions measured by PTR-MS, FTIR, and GC from tropical biomass burning, Atmos. Chem. Phys., 7, 5883–5897, https://doi.org/10.5194/acp-7-5883-2007, 2007.
Kibet, J., Khachatryan, L., and Dellinger, B.: Molecular products and radicals from pyrolysis of lignin, Environ. Sci. Technol., 46, 12994–13001, 2012.
Koss, A. R., Sekimoto, K., Gilman, J. B., Selimovic, V., Coggon, M. M., Zarzana, K. J., Yuan, B., Lerner, B. M., Brown, S. S., Jimenez, J. L., Krechmer, J., Roberts, J. M., Warneke, C., Yokelson, R. J., and de Gouw, J.: Non-methane organic gas emissions from biomass burning: identification, quantification, and emission factors from PTR-ToF during the FIREX 2016 laboratory experiment, Atmos. Chem. Phys., 18, 3299–3319, https://doi.org/10.5194/acp-18-3299-2018, 2018.
Ledesma, E. B., Marsh, N. D., Sandrowitz, A. K., and Wornat, M. J.: Global kinetic rate parameters for the formation of polycyclic aromatic hydrocarbons from the pyrolyis of catechol, a model compound representative of solid fuel moieties, Energy Fuels, 16, 1331–1336, 2002.
Lindenmaier, R., Tipton, N., Sams, R. L., Brauer, C. S., Blake, T. A., Williams, S. D., and Johnson, T. J.: Assignment of the Fundamental Modes of Hydroxyacetone Using Gas-Phase Infrared, Far-Infrared, Raman, and ab Initio Methods: Band Strengths for Atmospheric Measurements, J. Phys. Chem. A, 120, 5993–6003, 2016.
Lindesay, J. A., Andreae, M. O., Goldammer, J. G., Harris, G., Annegarn, H. J., Garstang, M., Scholes, R. J., and Van Wilgen, B. W.: International geosphere-biosphere programme/international global atmospheric chemistry SAFARI-92 field experiment: Background and overview, J. Geophys. Res.-Atmos., 101, 23521–23530, 1996.
Liu, X., Zhang, Y., Huey, L. G., Yokelson, R. J., Wang, Y., Jimenez, J. L., Campuzano-Jost, P., Beyersdorf, A. J., Blake, D. R., Choi, Y., St. Clair, H. M., Crounse, J. D., Day, D. A., Diskin, G. S., Fried, A., Hall, S. R., Hanisco, T. F., King, L. E., Meinardi, S., Mikoviny, T., Palm, B. B., Peischl, J., Perring, A. E., Pollack, I. B., Ryerson, T. B., Sachse, G., Schwarz, J. P., Simpson, I. J., Tanner, D. J., Thornhill, K. L., Ullmann, K., Weber, R. J., Wennberg, P. O., Wisthaler, A., Wolfe, G. M., and Ziemba, L. D.: Agricultural fires in the southeastern US during SEAC4RS: Emissions of trace gases and particles and evolution of ozone, reactive nitrogen, and organic aerosol, J. Geophys. Res.-Atmos., 121, 7383–7414, https://doi.org/10.1002/2016JD025040, 2016.
Liu, X., Huey, L. G., Yokelson, R. J., Selimovic, V., Simpson, I. J., Müller, M., Jimenez, J. L., Campuzano-Jost, P., Beyersdorf, A. J., Blake, D. R., Butterfield, Z., Choi, Y., Crounse, J. D., Day, D. A., Diskin, G. S., Dubey, M. K., Fortner, E., Hanisco, T. F., Hu, W., King, L. E., Kleinman, L., Meinardi, S., Milkoviny, T., Onasch, T. B., Palm, B. B., Peischl, J., Pollack, I. B., Ryerson, T. B., Sachse, G. W., Sedlacek, A. J., Shilling, J. E., Springston, S., St. Clair, J. M., Tanner, D. J., Teng, A. P., Wennberg, P. O., Wisthaler, A., and Wolfe, G. M.: Airborne measurements of western US wildfire emissions: Comparison with prescribed burning and air quality implications, J. Geophys. Res.-Atmos., 122, 6108–6129, 2017.
Lobert, J. M., Scharffe, D. H., Weimin, H., Kuhlbusch, T. A.,Seuwen, R., Warneck, P., and Crutzen, P. J.: Experimental evaluation of biomass burning emissions: Nitrogen and carbon containing compounds, in: Global Biomass Burning, Atmospheric,climatic, and biospheric implications, edited by: Levine, J. S., MIT Press, Cambridge, Mass., 1991.
Lu, Q., Yang, X.-C., Dong, C.-Q., Zhang, Z.-F., Zhang, X.-M., and Zhu, X.-F.: Influence of pyrolysis temperature and time on the cellulose fast pyrolysis products: Analytical Py-GC/MS study, J. Anal. Appl. Pyrol., 92, 430–438, 2011.
Mell, W., Maranghides, A., McDermott, R., and Manzello, S. L.: Numerical simulation and experiments of burning douglas fir trees, Combust. Flame, 156, 2023–2041, 2009.
Melvin, M. A.: National prescribed fire use survey report, Coalition of Prescribed Fire Councils Technical Report, 01-12, 2012.
Miller, J. D., Safford, H. D., Crimmins, M., and Thode, A. E.: Quantitative evidence for increasing forest fire severity in the Sierra Nevada and southern Cascade Mountains, California and Nevada, USA, Ecosystems, 12, 16–32, 2009.
Neuman, J., Huey, L., Ryerson, T., and Fahey, D.: Study of inlet materials for sampling atmospheric nitric acid, Environ. Sci. Technol., 33, 1133–1136, 1999.
Palma, C. F.: Modelling of tar formation and evolution for biomass gasification: a review, Appl. Energy, 111, 129–141, 2013.
Paton-Walsh, C., Wilson, S. R., Jones, N. B., and Griffith, D. W. T.: Measurement of methanol emissions from Australian wildfires by ground-based solar Fourier transform spectroscopy, Geophys. Res. Lett., 35, L08810, https://doi.org/10.1029/2007GL032951, 2008.
Paton-Walsh, C., Deutscher, N. M., Griffith, D. W. T., Forgan, B. W., Wilson, S. R., Jones, N. B., and Edwards, D. P.: Trace gas emissions from savanna fires in northern Australia, J. Geophys. Res.-Atmos., 115, D16314, https://doi.org/10.1029/2009JD013309, 2010.
Porcher, R. D. and Rayner, D. A.: A guide to the wildflowers of South Carolina, University of South Carolina Press Columbia, South Carolina, 2001.
Prichard, S., Ottmar, R., and Anderson, G.: Consume 3.0 user's guide, USDA Forest Service, p. 234, 2006.
Reinhardt, E. D., Keane, R. E., and Brown, J. K.: First order fire effects model: FOFEM 4.0, user's guide, Gen. Tech. Rep. INT-GTR-344. Ogden, UT: US Department of Agriculture, Forest Service, Intermountain Research Station, 65 p., 344, 1997.
Ren, Q., and Zhao, C.: NOx and N2O precursors from biomass pyrolysis: Nitrogen transformation from amino acid, Environ. Sci. Technol., 46, 4236–4240, 2012.
Ren, Q. and Zhao, C.: NOx and N2O precursors from biomass pyrolysis: role of cellulose, hemicellulose and lignin, Environ. Sci. Technol., 47, 8955–8961, 2013a.
Ren, Q. and Zhao, C.: NOx and N2O precursors (NH3 and HCN) from biomass pyrolysis: interaction between amino acid and mineral matter, Appl. Energy, 112, 170–174, 2013b.
Richter, H. and Howard, J. B.: Formation of polycyclic aromatic hydrocarbons and their growth to soot – a review of chemical reaction pathways, Prog. Energy Combust. Sci., 26, 565–608, 2000.
Roberts, J. M., Veres, P., Warneke, C., Neuman, J. A., Washenfelder, R. A., Brown, S. S., Baasandorj, M., Burkholder, J. B., Burling, I. R., Johnson, T. J., Yokelson, R. J., and de Gouw, J.: Measurement of HONO, HNCO, and other inorganic acids by negative-ion proton-transfer chemical-ionization mass spectrometry (NI-PT-CIMS): application to biomass burning emissions, Atmos. Meas. Tech., 3, 981–990, https://doi.org/10.5194/amt-3-981-2010, 2010.
Roscioli, J., Zahniser, M., Nelson, D., Herndon, S., and Kolb, C.: New Approaches to measuring sticky molecules: improvement of instrumental response times using active passivation, J. Phys. Chem. A, 120, 1347–1357, 2015.
Rothermel, R. C.: A mathematical model for predicting fire spread in wildland fuels, INT-115, 1972.
Safdari, M.-S., Rahmati, M., Amini, E., Howarth, J. E., Berryhill, J. P., Dietenberger, M., Weise, D. R., and Fletcher, T. H.: Characterization of pyrolysis products from fast pyrolysis of live and dead vegetation native to the Southern United States, Fuel, 229, 151–166, 2018.
Safdari, M.-S., Amini, E., Weise, D. R., and Fletcher, T. H.: Heating rate and temperature effects on pyrolysis products from live wildland fuels, Fuel, 242, 295–304, 2019.
Scharko, N. K., Oeck, A. M., Tonkyn, R. G., Baker, S. P., Lincoln, E. N., Chong, J., Corcoran, B. M., Burke, G. M., Weise, D. R., Myers, T. L., Banach, C. A., Griffith, D. W. T., and Johnson, T. J.: Identification of gas-phase pyrolysis products in a prescribed fire: first detections using infrared spectroscopy for naphthalene, methyl nitrite, allene, acrolein and acetaldehyde, Atmos. Meas. Tech., 12, 763–776, https://doi.org/10.5194/amt-12-763-2019, 2019.
Seinfeld, J. H. and Pandis, S. N.: Atmospheric chemistry and physics: from air pollution to climate change, John Wiley & Sons, Hoboken, 2012.
Sekimoto, K., Koss, A. R., Gilman, J. B., Selimovic, V., Coggon, M. M., Zarzana, K. J., Yuan, B., Lerner, B. M., Brown, S. S., Warneke, C., Yokelson, R. J., Roberts, J. M., and de Gouw, J.: High- and low-temperature pyrolysis profiles describe volatile organic compound emissions from western US wildfire fuels, Atmos. Chem. Phys., 18, 9263–9281, https://doi.org/10.5194/acp-18-9263-2018, 2018.
Selimovic, V., Yokelson, R. J., Warneke, C., Roberts, J. M., de Gouw, J., Reardon, J., and Griffith, D. W. T.: Aerosol optical properties and trace gas emissions by PAX and OP-FTIR for laboratory-simulated western US wildfires during FIREX, Atmos. Chem. Phys., 18, 2929–2948, https://doi.org/10.5194/acp-18-2929-2018, 2018.
Shafizadeh, F., McGinnis, G., and Philpot, C.: Thermal degradation of xylan and related model compounds, Carbohydr. Res., 25, 23–33, 1972.
Sharpe, S. W., Johnson, T. J., Sams, R. L., Chu, P. M., Rhoderick, G. C., and Johnson, P. A.: Gas-phase databases for quantitative infrared spectroscopy, Appl. Spectrosc., 58, 1452–1461, 2004.
Shen, D., Gu, S., and Bridgwater, A. V.: Study on the pyrolytic behaviour of xylan-based hemicellulose using TG-FTIR and Py-GC-FTIR, J. Anal. Appl. Pyrol., 87, 199–206, 2010.
Shen, D., Jin, W., Hu, J., Xiao, R., and Luo, K.: An overview on fast pyrolysis of the main constituents in lignocellulosic biomass to valued-added chemicals: Structures, pathways and interactions, Renew. Sustain. Energy Rev., 51, 761–774, 2015.
Shen, D. K. and Gu, S.: The mechanism for thermal decomposition of cellulose and its main products, Bioresour. Technol., 100, 6496–6504, https://doi.org/10.1016/j.biortech.2009.06.095, 2009.
Shotorban, B., Yashwanth, B. L., Mahalingam, S., and Haring, D. J.: An investigation of pyrolysis and ignition of moist leaf-like fuel subject to convective heating, Combust. Flame, 190, 25–35, 2018.
Simmie, J. M.: Detailed chemical kinetic models for the combustion of hydrocarbon fuels, Prog. Energy Combust. Sci., 29, 599–634, 2003.
Simpson, I. J., Akagi, S. K., Barletta, B., Blake, N. J., Choi, Y., Diskin, G. S., Fried, A., Fuelberg, H. E., Meinardi, S., Rowland, F. S., Vay, S. A., Weinheimer, A. J., Wennberg, P. O., Wiebring, P., Wisthaler, A., Yang, M., Yokelson, R. J., and Blake, D. R.: Boreal forest fire emissions in fresh Canadian smoke plumes: C1–C10 volatile organic compounds (VOCs), CO2, CO, NO2, NO, HCN and CH3CN, Atmos. Chem. Phys., 11, 6445–6463, https://doi.org/10.5194/acp-11-6445-2011, 2011.
Stein, Y. S., Antal Jr, M. J., and Jones Jr., M.: A study of the gas-phase pyrolysis of glycerol, J. Anal. Appl. Pyrol., 4, 283–296, 1983.
Stockwell, C. E., Yokelson, R. J., Kreidenweis, S. M., Robinson, A. L., DeMott, P. J., Sullivan, R. C., Reardon, J., Ryan, K. C., Griffith, D. W. T., and Stevens, L.: Trace gas emissions from combustion of peat, crop residue, domestic biofuels, grasses, and other fuels: configuration and Fourier transform infrared (FTIR) component of the fourth Fire Lab at Missoula Experiment (FLAME-4), Atmos. Chem. Phys., 14, 9727–9754, https://doi.org/10.5194/acp-14-9727-2014, 2014.
Stockwell, C. E., Jayarathne, T., Cochrane, M. A., Ryan, K. C., Putra, E. I., Saharjo, B. H., Nurhayati, A. D., Albar, I., Blake, D. R., Simpson, I. J., Stone, E. A., and Yokelson, R. J.: Field measurements of trace gases and aerosols emitted by peat fires in Central Kalimantan, Indonesia, during the 2015 El Niño, Atmos. Chem. Phys., 16, 11711–11732, https://doi.org/10.5194/acp-16-11711-2016, 2016.
Talbot, R. W., Beecher, K. M., Harriss, R. C., and Cofer, W. R.: Atmospheric geochemistry of formic and acetic acids at a mid-latitude temperate site, J. Geophys. Res.-Atmos., 93, 1638–1652, 1988.
Turetsky, M. R., Kane, E. S., Harden, J. W., Ottmar, R. D., Manies, K. L., Hoy, E., and Kasischke, E. S.: Recent acceleration of biomass burning and carbon losses in Alaskan forests and peatlands, Nat. Geosci., 4, 27–31, 2011.
Urbanski, S. P.: Combustion efficiency and emission factors for wildfire-season fires in mixed conifer forests of the northern Rocky Mountains, US, Atmos. Chem. Phys., 13, 7241–7262, https://doi.org/10.5194/acp-13-7241-2013, 2013.
Waldrop, T. A. and Goodrick, S. L.: Introduction to prescribed fires in Southern ecosystems, Science Update SRS-054, Asheville, NC: US Department of Agriculture Forest Service, Southern Research Station, 80 p., 54, 1–80, 2012.
Ward, D., Susott, R., Kauffman, J., Babbitt, R., Cummings, D., Dias, B., Holben, B., Kaufman, Y., Rasmussen, R., and Setzer, A.: Smoke and fire characteristics for cerrado and deforestation burns in Brazil: BASE-B experiment, J. Geophys. Res.-Atmos. , 97, 14601–14619, 1992.
Ward, D. and Radke, L.: Emissions measurements from vegetation fires: A comparative evaluation of methods and results, in: Fire in the Environment: The Ecological, Atmospheric, and Climatic Importance of Vegetation Fires, edited by: Crutzen, P. J., Goldammer, J. G., Dahlem Workshop Reports: Environmental Sciences Research Report 13, John Wiley & Sons, Chischester, 53–76, 1993.
Ward, D. E. and Hao, W.: Projections of emissions from burning of biomass for use in studies of global climate and atmospheric chemistry, Paper 91-128.4, Presented at the 84th Annual Meeting and Exhibition; Vancouver, British Columbia; 16–21 June, Air and Waste Management Association, 16, 1991.
Ward, D. E. and Hardy, C. C.: Smoke emissions from wildland fires, Environ. Int., 17, 117–134, 1991.
Ward, D. E., Hao, W. M., Susott, R. A., Babbitt, R. E., Shea, R. W., Kauffman, J. B., and Justice, C. O.: Effect of fuel composition on combustion efficiency and emission factors for African savanna ecosystems, J. Geophys. Res.-Atmos., 101, 23569–23576, 1996.
Weise, D. R., Fletcher, T. H., Johnson, T. J., Hao, W., Dietenberger, M., Princevac, M., Butler, B., McAllister, S., O'Brien, J., Loudermilk, L., Ottmar, R. D., Hudak, A., Kato, A., Shotorban, B., Mahalingam, S., and Mell, W. E.: A project to measure and model pyrolysis to improve prediction of prescribed fire behavior [Chapter 3], In: Advances in Forest Fire Research 2018, edited by: Viegas, D. X., Coimbra, Portugal: Imprensa da Universidade de Coimbra, 308–218, 2018.
Wooster, M. J., Freeborn, P. H., Archibald, S., Oppenheimer, C., Roberts, G. J., Smith, T. E. L., Govender, N., Burton, M., and Palumbo, I.: Field determination of biomass burning emission ratios and factors via open-path FTIR spectroscopy and fire radiative power assessment: headfire, backfire and residual smouldering combustion in African savannahs, Atmos. Chem. Phys., 11, 11591–11615, https://doi.org/10.5194/acp-11-11591-2011, 2011.
Yashwanth, B., Shotorban, B., Mahalingam, S., Lautenberger, C., and Weise, D.: A numerical investigation of the influence of radiation and moisture content on pyrolysis and ignition of a leaf-like fuel element, Combust. Flame, 163, 301–316, 2016.
Yokelson, R. J., Griffith, D. W. T., and Ward, D. E.: Open-path Fourier transform infrared studies of large-scale laboratory biomass fires, J. Geophys. Res.-Atmos., 101, 21067–21080, 1996.
Yokelson, R. J., Susott, R., Ward, D. E., Reardon, J., and Griffith, D. W. T.: Emissions from smoldering combustion of biomass measured by open-path Fourier transform infrared spectroscopy, J. Geophys. Res.-Atmos., 102, 18865–18877, 1997.
Yokelson, R. J., Goode, J. G., Ward, D. E., Susott, R. A., Babbitt, R. E., Wade, D. D., Bertschi, I., Griffith, D. W. T., and Hao, W. M.: Emissions of formaldehyde, acetic acid, methanol, and other trace gases from biomass fires in North Carolina measured by airborne Fourier transform infrared spectroscopy, J. Geophys. Res.-Atmos., 104, 30109–30125, 1999.
Yokelson, R. J., Christian, T. J., Bertschi, I. T., and Hao, W. M.: Evaluation of adsorption effects on measurements of ammonia, acetic acid, and methanol, J. Geophys. Res.-Atmos., 108, 4649, https://doi.org/10.1029/2003JD003549, 2003.
Yokelson, R. J., Crounse, J. D., DeCarlo, P. F., Karl, T., Urbanski, S., Atlas, E., Campos, T., Shinozuka, Y., Kapustin, V., Clarke, A. D., Weinheimer, A., Knapp, D. J., Montzka, D. D., Holloway, J., Weibring, P., Flocke, F., Zheng, W., Toohey, D., Wennberg, P. O., Wiedinmyer, C., Mauldin, L., Fried, A., Richter, D., Walega, J., Jimenez, J. L., Adachi, K., Buseck, P. R., Hall, S. R., and Shetter, R.: Emissions from biomass burning in the Yucatan, Atmos. Chem. Phys., 9, 5785–5812, https://doi.org/10.5194/acp-9-5785-2009, 2009.
Yokelson, R. J., Burling, I. R., Gilman, J. B., Warneke, C., Stockwell, C. E., de Gouw, J., Akagi, S. K., Urbanski, S. P., Veres, P., Roberts, J. M., Kuster, W. C., Reardon, J., Griffith, D. W. T., Johnson, T. J., Hosseini, S., Miller, J. W., Cocker III, D. R., Jung, H., and Weise, D. R.: Coupling field and laboratory measurements to estimate the emission factors of identified and unidentified trace gases for prescribed fires, Atmos. Chem. Phys., 13, 89–116, https://doi.org/10.5194/acp-13-89-2013, 2013.
Young, V. L., Kieser, B. N., Chen, S. P., and Niki, H.: Seasonal trends and local influences on nonmethane hydrocarbon concentrations in the Canadian boreal forest, J. Geophys. Res.-Atmos., 102, 5913–5918, 1997.