the Creative Commons Attribution 4.0 License.
the Creative Commons Attribution 4.0 License.
 | 31 Jul 2019
Seasonal differences in formation processes of oxidized organic aerosol near Houston, TX
Benjamin C. Schulze
Xiaohui Bi
Alexander A. T. Bui
Fangzhou Guo
Henry W. Wallace
Nancy P. Sanchez
James H. Flynn
Barry L. Lefer
Robert J. Griffin
Submicron aerosol was measured to the southwest of Houston, Texas, during winter and summer 2014 to investigate its seasonal variability. Data from a high-resolution time-of-flight aerosol mass spectrometer (HR-ToF-AMS) indicated that organic aerosol (OA) was the largest component of nonrefractory submicron particulate matter (NR-PM1) (on average, 38 % ± 13 % and 47 % ± 18 % of the NR-PM1 mass loading in winter and summer, respectively). Positive matrix factorization (PMF) analysis of the OA mass spectra demonstrated that two classes of oxygenated OA (less- and more-oxidized OOA, LO and MO) together dominated OA mass in summer (77 %) and accounted for 39 % of OA mass in winter. The fraction of LO-OOA (out of total OOA) is higher in summer (70 %) than in winter (44 %). Secondary aerosols (sulfate + nitrate + ammonium + OOA) accounted for ∼76 % and 88 % of NR-PM1 mass in winter and summer, respectively, indicating NR-PM1 mass was driven mostly by secondary aerosol formation regardless of the season. The mass loadings and diurnal patterns of these secondary aerosols show a clear winter–summer contrast. Organic nitrate (ON) concentrations were estimated using the ratio method, with contributions of 31 %–66 % and 9 %–17 % to OA during winter and summer, respectively. The estimated ON in summer strongly correlated with LO-OOA (r=0.73) and was enhanced at nighttime.
The relative importance of aqueous-phase chemistry and photochemistry in processing OOA was investigated by examining the relationship of aerosol liquid water content (LWC) and the sum of ozone (O3) and nitrogen dioxide (NO2) (Ox = O3+NO2) with LO-OOA and MO-OOA. The processing mechanism of LO-OOA apparently was related to relative humidity (RH). In periods of RH < 80 %, aqueous-phase chemistry likely played an important role in the formation of wintertime LO-OOA, whereas photochemistry promoted the formation of summertime LO-OOA. For periods of high RH > 80 %, these effects were opposite those of low-RH periods. Both photochemistry and aqueous-phase processing appear to facilitate increases in MO-OOA concentration except during periods of high LWC, which is likely a result of wet removal during periods of light rain or a negative impact on its formation rate.
The nighttime increases in MO-OOA during winter and summer were 0.013 and 0.01 µg MO-OOA per µg of LWC, respectively. The increase in LO-OOA was larger than that for MO-OOA, with increase rates of 0.033 and 0.055 µg LO-OOA per µg of LWC at night during winter and summer, respectively. On average, the mass concentration of LO-OOA in summer was elevated by nearly 1.2 µg m−3 for a ∼20 µg change in LWC, which was accompanied by a 40 ppb change in Ox.
- Article
(9003 KB) -
Supplement
(3453 KB) - BibTeX
- EndNote


Tropospheric particulate matter (PM) has adverse effects on air quality, visibility and ecosystems and participates in climate forcing (Watson, 2002; Grantz et al., 2003; Racherla and Adams, 2006; Tai et al., 2010; Liu et al., 2017). The various effects of PM depend on its physical, chemical and optical properties, which are determined by its emission, formation and evolution/aging processes. Atmospheric PM can either be directly emitted from primary sources (fossil fuel combustion, soil dust, sea salt, biomass burning, etc.) or formed through chemical reactions of gaseous precursors, as is the case for secondary inorganic sulfate () and nitrate () and secondary organic aerosol (SOA). Understanding the source contributions and formation pathways of PM is essential for mitigating its effects (Jimenez et al., 2009).
Houston, TX, is of great interest to the scientific community with respect to air quality) as it is the fourth most populous city in the United States (US) and is well known for its energy and chemical industries. Numerous efforts, from modeling (McKeen et al., 2009; Li et al., 2015; Ying et al., 2015) to field measurements (for example, TexAQS 2000 and II, Bates et al., 2008; Parrish et al., 2009; Atkinson et al., 2010; Go-MACCS, McKeen et al., 2009; Parrish et al., 2009; TRAMP2006, Mao et al., 2010; Cleveland et al., 2012; GC-ARCH, Allen and Fraser, 2006; SHARP, Olaguer et al., 2014; and DISCOVER-AQ, Bean et al., 2016; Leong et al., 2017) have been made in the Houston metropolitan area during the past two decades, providing critical insights into our understanding of air quality and atmospheric chemistry with respect to the sources and formation of PM. Previous field campaigns underscore that OA accounts for a major fraction of nonrefractory submicron PM (NR-PM1) in Houston (Bates et al., 2008; Russell et al., 2009; Cleveland et al., 2012; Brown et al., 2013; Bean et al., 2016; Leong et al., 2017; Wallace et al., 2018). The spatial variation of NR-PM1 in Houston was investigated by Leong et al. (2017), who divided greater Houston into two zones based on marked differences in NR-PM1 levels, characteristics and dynamics measured at 16 sampling locations. Zone 1 is northwest of Houston and is dominated by SOA, likely driven by nighttime biogenic organic nitrate (ON) formation. Intensive attention has been paid recently to such anthropogenic–biogenic interactions (Bahreini et al., 2009; Bean et al., 2016). Zone 2 is the industrial/urban area south/east of Houston. Wallace et al. (2018) found mobile source exhaust and petrochemical emissions likely are the most important factors impacting the NR-PM1 and trace gases at a site in Zone 2.
Formation of SOA in clouds and the aqueous phase of aerosol particles has been reported worldwide (Lim et al., 2010; Ervens et al., 2011; Xu et al., 2017). Given that both photochemical oxidation and aqueous-phase chemistry are conducive to the formation of SOA, it is of interest to compare the relative importance of photochemistry and aqueous-phase chemistry for SOA formation in different seasons. The roles of photochemistry and aqueous-phase processing on SOA formation and evolution in different seasons in Beijing have been investigated by Hu et al. (2016) and Xu et al. (2017). Generally, aqueous-phase processing has a dominant influence on the formation of more-oxidized SOA, and photochemistry plays a major role in the formation of less-oxidized SOA in summer and winter in Beijing, while the relative importance of these two pathways in the formation processes of SOA in autumn is different from those in summer and winter. The relative roles of aqueous-phase and photochemical processes in the formation of SOA likely vary with location and time. The seasonal differences in the spectral patterns, oxidation degrees and contributions of SOA may result from different volatile organic compound (VOC) precursors, meteorological conditions and atmospheric oxidizing capacity, which are not well understood in Houston, particularly in different seasons.
This study presents observations of NR-PM1 from two high-resolution time-of-flight aerosol mass spectrometer (HR-ToF-AMS) measurement campaigns conducted during the winter and summer of 2014 at a site in the suburbs of Houston, where industrial and vehicular emission sources and photochemical processes are likely to play an important role in NR-PM1 formation (Leong et al., 2017). In addition to local emissions, this site was possibly impacted by regional marine aerosol transported from the Gulf of Mexico (Schulze et al., 2018). The aims of this work are to (1) investigate the seasonal characteristics of NR-PM1 in the Houston area, (2) characterize the primary and secondary sources by applying positive matrix factorization (PMF) analysis to the measured OA mass spectra, and (3) evaluate the seasonal dependence of SOA composition and formation, with a main focus on the relative effects of photochemistry and aqueous-phase chemistry.
2.1 Sampling site and campaigns
Instrumentation was deployed in the University of Houston–Rice University Mobile Air Quality Laboratory (MAQL), as described in Leong et al. (2017) and Wallace et al. (2018). The winter campaign was conducted from 3 to 17 February 2014, and the summer campaign was conducted from 1 to 31 May 2014. The measurement site was located on the campus of the University of Houston at Sugar Land (UHSL) (29.5740∘ N, 95.6518∘ W). The campus is situated southwest of downtown and the Houston Ship Channel (HSC). The map of the measurement site is presented in Fig. S1 in the Supplement. The nearby interstate highway (I-69) extends to the west of downtown and serves as a major traffic emission source. The WA Parish Generating Station, a coal-fired power plant that is the largest electricity-generating facility in Texas, is ∼ 10 km south of the site (Fig. S1). The data collected in the winter campaign are limited in duration; thus, the following discussion focuses primarily on the summer campaign.
2.2 Measurements
The data used in this paper are reported in local time, which is 6 and 5 h behind Universal Coordinated Time in winter and summer, respectively. The details regarding the instrumental setup and data processing of these measurements were the same as described in Wallace et al. (2018). The NR-PM1 composition was measured using an Aerodyne HR-ToF-AMS (DeCarlo et al., 2006; Canagaratna et al., 2007). A PM2.5 Teflon®-coated cyclone inlet was installed above the MAQL at a height of 6 m above ground to remove coarse particles and to introduce air into the sampling line at a rate of 16.7 SLPM. A Nafion dryer (Perma Pure, LLC) was mounted upstream of the HR-ToF-AMS to dry the sample to below 45 % relative humidity (RH). Particles are focused into a narrow beam via an aerodynamic lens and accelerated under high vacuum into the particle sizing measurement chamber. After passing the particle sizing chamber, the nonrefractory components are flash vaporized at near 600 ∘C and ionized using electron impact at 70 eV. Ionized mass fragments are then transmitted directly into the time-of-flight region so that the mass spectra can be obtained. In this study, the HR-ToF-AMS was operated in V mode to obtain the nonrefractory chemical components with a higher sensitivity and lower mass spectral resolution compared to the W mode. Ionization efficiency (IE) calibration was performed using monodisperse ammonium nitrate (NH4NO3) at the beginning and end of each campaign. Filtered ambient air was sampled every 2 days for approximately 20 to 30 min to provide a baseline of signal for the HR-ToF-AMS during campaigns. The detection limits (Table S1) were calculated by multiplying the standard deviations of the filter periods by 3.
Trace gas mixing ratios and meteorological parameters also were measured on the MAQL during the campaigns. Carbon monoxide (CO) was measured with high-resolution cavity enhanced direct-absorption spectroscopy (Los Gatos Research, Inc.), and sulfur dioxide (SO2) was quantified using a pulsed fluorescence analyzer (ThermoFischer Scientific, model 43i-TLE). Nitric oxide (NO) and nitrogen dioxide (NO2) were measured with a chemiluminescence monitor with an ultraviolet-light-emitting-diode NO2 photolytic converter on the NO2 channel (AQD, Inc.) The total reactive nitrogen (NOy) was measured with a Thermo 49c-TL with a heated molybdenum inlet converter. Ozone (O3) mixing ratio was measured with ultraviolet absorption (2BTech, Inc., model 205). Meteorological parameters including ambient temperature, solar radiation, RH, wind speed (WS) and wind direction (WD) were measured using an RM Young meteorological station. Precipitation totals from a nearby Texas Commission on Environmental Quality (TCEQ) monitoring site (EPA Site: 48_157_0696) were downloaded from the TCEQ website. The total cloud cover data were downloaded from the READY Archived Meteorology website of the National Oceanic and Atmospheric Administration.
2.3 Data processing
The HR-ToF-AMS data analysis was performed using SQUIRREL version 1.56A and PIKA version 1.19D in Igor Pro 6.37 (Wave Metrics Inc.). The relative IEs were applied to OA (1.4), (1.2), (1.1), (4.0) and chloride (Cl−, 1.3) following the standard data analysis procedures. The composition-dependent collection efficiency was applied to the data based on Middlebrook et al. (2012). Elemental ratios (H ∕ C, O ∕ C and N ∕ C, where H is hydrogen, C is carbon, and N is nitrogen) and the ratio of organic mass to organic carbon (OM ∕ OC) were generated using the procedures described by Canagaratna et al. (2015). Example data are shown in Fig. S2.
2.3.1 Quantification of the contributions of ON
The mass loading of measured by HR-ToF-AMS includes both organic and inorganic . The fragmentation ratio of to NO+ ( ratio) is different for ON and inorganic (Farmer et al., 2010; Fry et al., 2013), and the and NO+ mass loadings for ON (NO2,ON and NOON) can be estimated using the method proposed by Farmer et al. (2010):
where Robs is the ambient ratio (0.531 and 0.260 for the winter and summer campaign, respectively; see Fig. S3 for details). ( ratio of NH4NO3) is determined by IE calibration using monodisperse NH4NO3 before and after the campaigns. The average of the two IE calibrations was used as the for the campaign (0.588 and 0.381 for the winter and summer campaigns, respectively), which is comparable with the value reported elsewhere (Xu et al., 2015; Zhu et al., 2016). The value of RON is hard to determine because it varies with instruments and precursor VOCs (Fry et al., 2013). Previous studies found that isoprene was the main biogenic VOC (BVOC) in Houston (Leuchner and Rappengluck, 2010; Kota et al., 2014), and Brown et al. (2013) reported that monoterpenes and isoprene were frequently present within the nocturnal boundary layer in the Houston area and underwent rapid oxidation, mainly by nitrate radical (denoted as with a dot to differentiate it from aerosol ). Given the abundance of monoterpene and isoprene in the Houston area, similar to Xu et al. (2015), we assume organic nitrates formed via isoprene and beta-pinene oxidation are representative. Fry et al. (2013) assumed that the value is instrument-independent and further estimated the average of 2.25 for the organic nitrate standards. The values vary with precursor VOC. We utilized the of isoprene (2.08, Bruns et al., 2010) and beta-pinene organic nitrates (3.99, Boyd et al., 2015) from the literature to obtain an estimation range of RON by using the method.
The measured ratio can be used to separately quantify ammonium and organic nitrates as
The nitrate functionality from organic nitrate was calculated as
Thus, the nitrate functionality from inorganic nitrate (assuming NH4NO3 is the solely important inorganic nitrate in the submicron mode) can be calculated as
The accurate estimation of the total mass of ON via this method is uncertain as the actual molecular weight of the particle-phase species is unclear. The mass range of ON is estimated by assuming that the average molecular weights of organic molecules with nitrate functional groups are 200 to 300 g mol−1 (Surratt et al., 2008; Rollins et al., 2012). Previous work found that the reaction with monoterpenes resulted in significant SOA formation and that a hydroperoxy nitrate (C10H17NO5) was likely a major -oxidized terpene product in the southeastern US (Ayres et al., 2015). Here, we use the molecular weight of C10H17NO5 (231 g mol−1) to calculate the ON mass. Example periods of significant ON contribution to PM are given in Fig. S4. While the values of ON concentration estimated using this method are presented in the text, the result of estimated ON including uncertainties is available in Table S2.
2.3.2 PMF analysis
The PMF technique has been used widely for source apportionment (Paatero and Tapper, 1994), including with HR-TOF-AMS data (Ulbrich et al., 2009; Zhang et al., 2011). The high-resolution NR-PM1 OA mass spectra matrix (mass-to-charge ratio, to ) and the associated error matrix obtained by using PIKA version 1.19 D were used for PMF analysis. Data were prepared according to the protocol proposed by Ulbrich et al. (2009) and Zhang et al. (2011) prior to PMF analysis. The PMF model was used to decompose the measured OA mass spectra matrix by solving
where X is the m×n matrix of measurement data, the m rows of X are the OA mass spectra measured at each time step, the n columns of X are the time series of each organic m∕z and p is the number of factors. Gi,p is the matrix that denotes the contributions of factor p at time step i, and Fp,j represents the factor mass spectral profiles. E is the residual matrix. The least-squares algorithm is used to fit the data to minimize iteratively a quality of fit parameter, Q:
where σi,j is the matrix of estimated errors of the data.
Solutions using PMF with two to seven factors were explored. The best solution with the optimum number of factors was evaluated carefully using an open-source PMF evaluation tool (PET version 2.08D, Ulbrich et al., 2009) following the procedures described in Zhang et al. (2011). Selection criteria included (1) variation of the ratio of Q to expected Qexp (, the degrees of freedom of the fitted data, Paatero et al., 2002) after adding an additional factor, (2) agreement between the reconstructed OA mass concentrations and the measured concentrations, (3) scaled residuals for the different ion fragments included in the dataset and variations of the residual of the solution as a function of time, (4) agreement between factor time series and time series of external tracers/individual ions, and (5) examination of factor profiles. The last two are considered to determine the physical meaningfulness of the factors. The PMF solution with factor numbers greater than five and four for winter and summer dataset, respectively, yielded no new distinct and physical meaningful factors. The Q∕Qexp and the factors obtained for different FPEAK (from −1 to 1 with a step value of 0.2) values resulted in a small difference in the OA components. Because of the lowest Q∕Qexp and because the use of FPEAK values different from 0 did not improve the correlations between PMF factors and potentially associated tracers, the five- and four-factor solutions with FPEAK = 0 can be well interpreted in winter and summer, respectively. The convergence of the PMF model containing five and four factors was examined by running each model from 15 different starting values (SEEDs 0–30 with a step value of 2). The small variation observed in Q∕Qexp and the mass fraction of different factors as SEED changed indicate the solutions were stable. As a result, SEED 0 was chosen for the final solution. The factors were interpreted as hydrocarbon-like OA (HOA), biomass burning OA (BBOA), cooking OA (COA, identified only in the winter campaign), and two oxidized OAs – named less-oxygenated (LO-) OOA and more-oxygenated (MO-) OOA. The data treatment, factor selection and interpretation are detailed in the Supplement. As suggested by El-Sayed et al. (2016), drying of aerosol water may have led to the evaporation of condensed-phase organics. Thus, the resolved mass concentrations of OA factors here are a lower-bound, conservative estimate due to losses of aqueous-SOA in the dryer element.
2.3.3 Estimation of aerosol liquid water content (LWC)
Aerosol LWC includes water associated with inorganic aerosol and OA, which were calculated using a thermodynamic model and an empirical method, respectively. Inorganic LWC (Wi) in moles per liter (mol L−1) was predicted by ISORROPIA-II in forward mode (Fountoukis and Nenes, 2007). Inputs for ISORROPIA-II include inorganic aerosol mass concentrations (, inorganic and ) and meteorological parameters (temperature and RH). Calculation of empirical organic LWC (WO) follows (Petters and Kreidenweis, 2007; Guo et al., 2015)
where morg is the organic mass concentration (µg m−3) and ρw is the density of water (1 g cm−3). The organic density (ρorg, g cm−3) was estimated using an empirical equation based on elemental ratios (Kuwata et al., 2012; Guo et al., 2015):
The hygroscopicity of SOA generated during chamber studies under subsaturated regimes depends on the OA degree of oxidation (Prenni et al., 2007; Jimenez et al., 2009; Petters et al., 2009; Chang et al., 2010). A simple linear relationship between the OA degree of oxidation (defined as the fraction of the total signal at m∕z 44, f44) and hygroscopicity (κorg) is used (Duplissy et al., 2011):
The total LWC is then found by summing the water content associated with each mass fraction:

Figure 1Time series of data collected at UHSL in Houston during the sampling periods in winter and summer 2014. Time series of 5 min average campaign data for (a, f) ambient temperature (T), relative humidity (RH) and total cloud cover (%, with 3 h interval); (b, g) precipitation and wind direction (WD), with colors showing different wind speeds (WS); (c, h) CO, SO2 and NO2; (d, i) O3, Ox (NO2+O3) and solar radiometer; (e, j) NR-PM1 species, including OA, , , and Cl−.
Table 1Statistics of meteorological parameters, gas-phase pollutants, NR-PM1 species and PMF OA factors for the winter and summer campaigns at UHSL.

a BDL: below detection limit. b Statistically determined factor concentrations with values below are listed as 0.
3.1 Temporal dependences of submicron aerosol composition
Campaign overview data for winter and summer are shown in Table 1 and Fig. 1. This includes meteorological parameters (e.g., temperature, RH, radiometer, precipitation, wind direction and speed), trace gases (e.g., CO, SO2, NO2 and O3) and chemically resolved NR-PM1 concentrations.
Data indicate that the average concentration of NR-PM1 during the winter campaign was 6.0 ± 3.7 µg m−3, ranging from 0.5 to 14.8 µg m−3. Mass loadings of NR-PM1 at this measurement site are relatively smaller than at a site near the HSC in winter 2015 (10.8 µg m−3, Wallace et al., 2018), perhaps suggesting a weaker industrial influence at the UHSL site.
The average concentration of NR-PM1 during summer was 3.6 ± 1.7 µg m−3, ranging from 0.3 to 13.7 µg m−3. For comparison, a summer campaign in 2006 on an elevated building near downtown Houston showed an average NR-PM1 concentration of approximately 11 µg m−3 (Cleveland et al., 2012). An elevated NR-PM1 episode was observed from 28 to 31 May (Fig. 1j), with high solar radiation and Ox (Ox = NO2+O3) levels during the daytime, and high RH at night, resulting in OA becoming the largest fractional species, likely due to gas-phase photochemical production of SOA together with the nighttime increase in SOA associated with high RH, lowered boundary layer and cooler temperatures.
In winter, OA was the largest component of NR-PM1, accounting for 38 % ± 13 % on average of the total mass, followed by (23 % ± 11 %), (23 % ± 11 %), (15 % ± 5 %) and Cl− (1 % ± 0.2 %) (Fig. 2). Primary OA (POA = HOA + BBOA + COA) was responsible for 61 % ± 19 % of OA mass. Secondary species () accounted for ∼ 76 % ± 21 % of NR-PM1 mass, which is higher than that in winter in Seoul (Kim et al., 2017) and Beijing (Hu et al., 2016).
In contrast to winter, OA during the summer campaign constituted on average 47 % ± 18 % of NR-PM1 mass, and was the second largest component (36 % ± 15 %), followed by (14 % ± 5 %). only accounted for 2 % ± 1 % of NR-PM1 mass in the summer, and Cl− contributed 1 % ± 0.5 % of NR-PM1 mass. The increased planetary boundary layer (PBL) height in summer (Haman et al., 2012) likely contributed to relatively lower trace gas and NR-PM1 levels in the summer. Secondary species contributed ∼ 88 % ± 15 % of NR-PM1 mass, indicating that the relative importance of secondary aerosol formation increased during summer as compared to winter, especially for species such as and MO-OOA.

Figure 2Average composition of NR-PM1 species and OA factors during the winter (a, c) and summer campaign (b, d) at UHSL.
The total OA displayed high values during the nighttime hours in both winter and summer, maintaining a high level until morning rush hour and then decreasing to a minimum value after 09:00 (Fig. 3). The summertime OA presented a small peak at noon, suggesting that photochemical formation of OA played a more important role in summer than in winter. Increasing ambient temperature and PBL height after sunrise causes repartitioning to the gas phase, likely contributing to the decrease in OA, LO-OOA and ON during daytime.
Contributions of PMF factors to wintertime and summertime OA show significant differences. For wintertime OA, on average, BBOA contributed to 26 % of OA mass; MO-OOA and COA made the same contributions of 22 % to total OA mass. The LO-OOA accounted for 17 % of OA mass, followed by HOA (13 %). The POA constituted more than half of OA mass (61 %), with the remainder being OOA (39 %). In the summer, LO-OOA represented the largest fraction of the OA mass (54 % on average), followed by MO-OOA (23 %), HOA (15 %) and BBOA (8 %). In the case of summer, OOA constituted 77 % of OA and 36 % of total NR-PM1 mass, which are almost 2 times their relative contributions in winter. The time series of mass concentrations of NR-PM1 species (Fig. 1) and OA factors (Fig. 4) in summer were relatively stable and repeatable, while they varied dramatically in winter due to the different meteorological conditions.
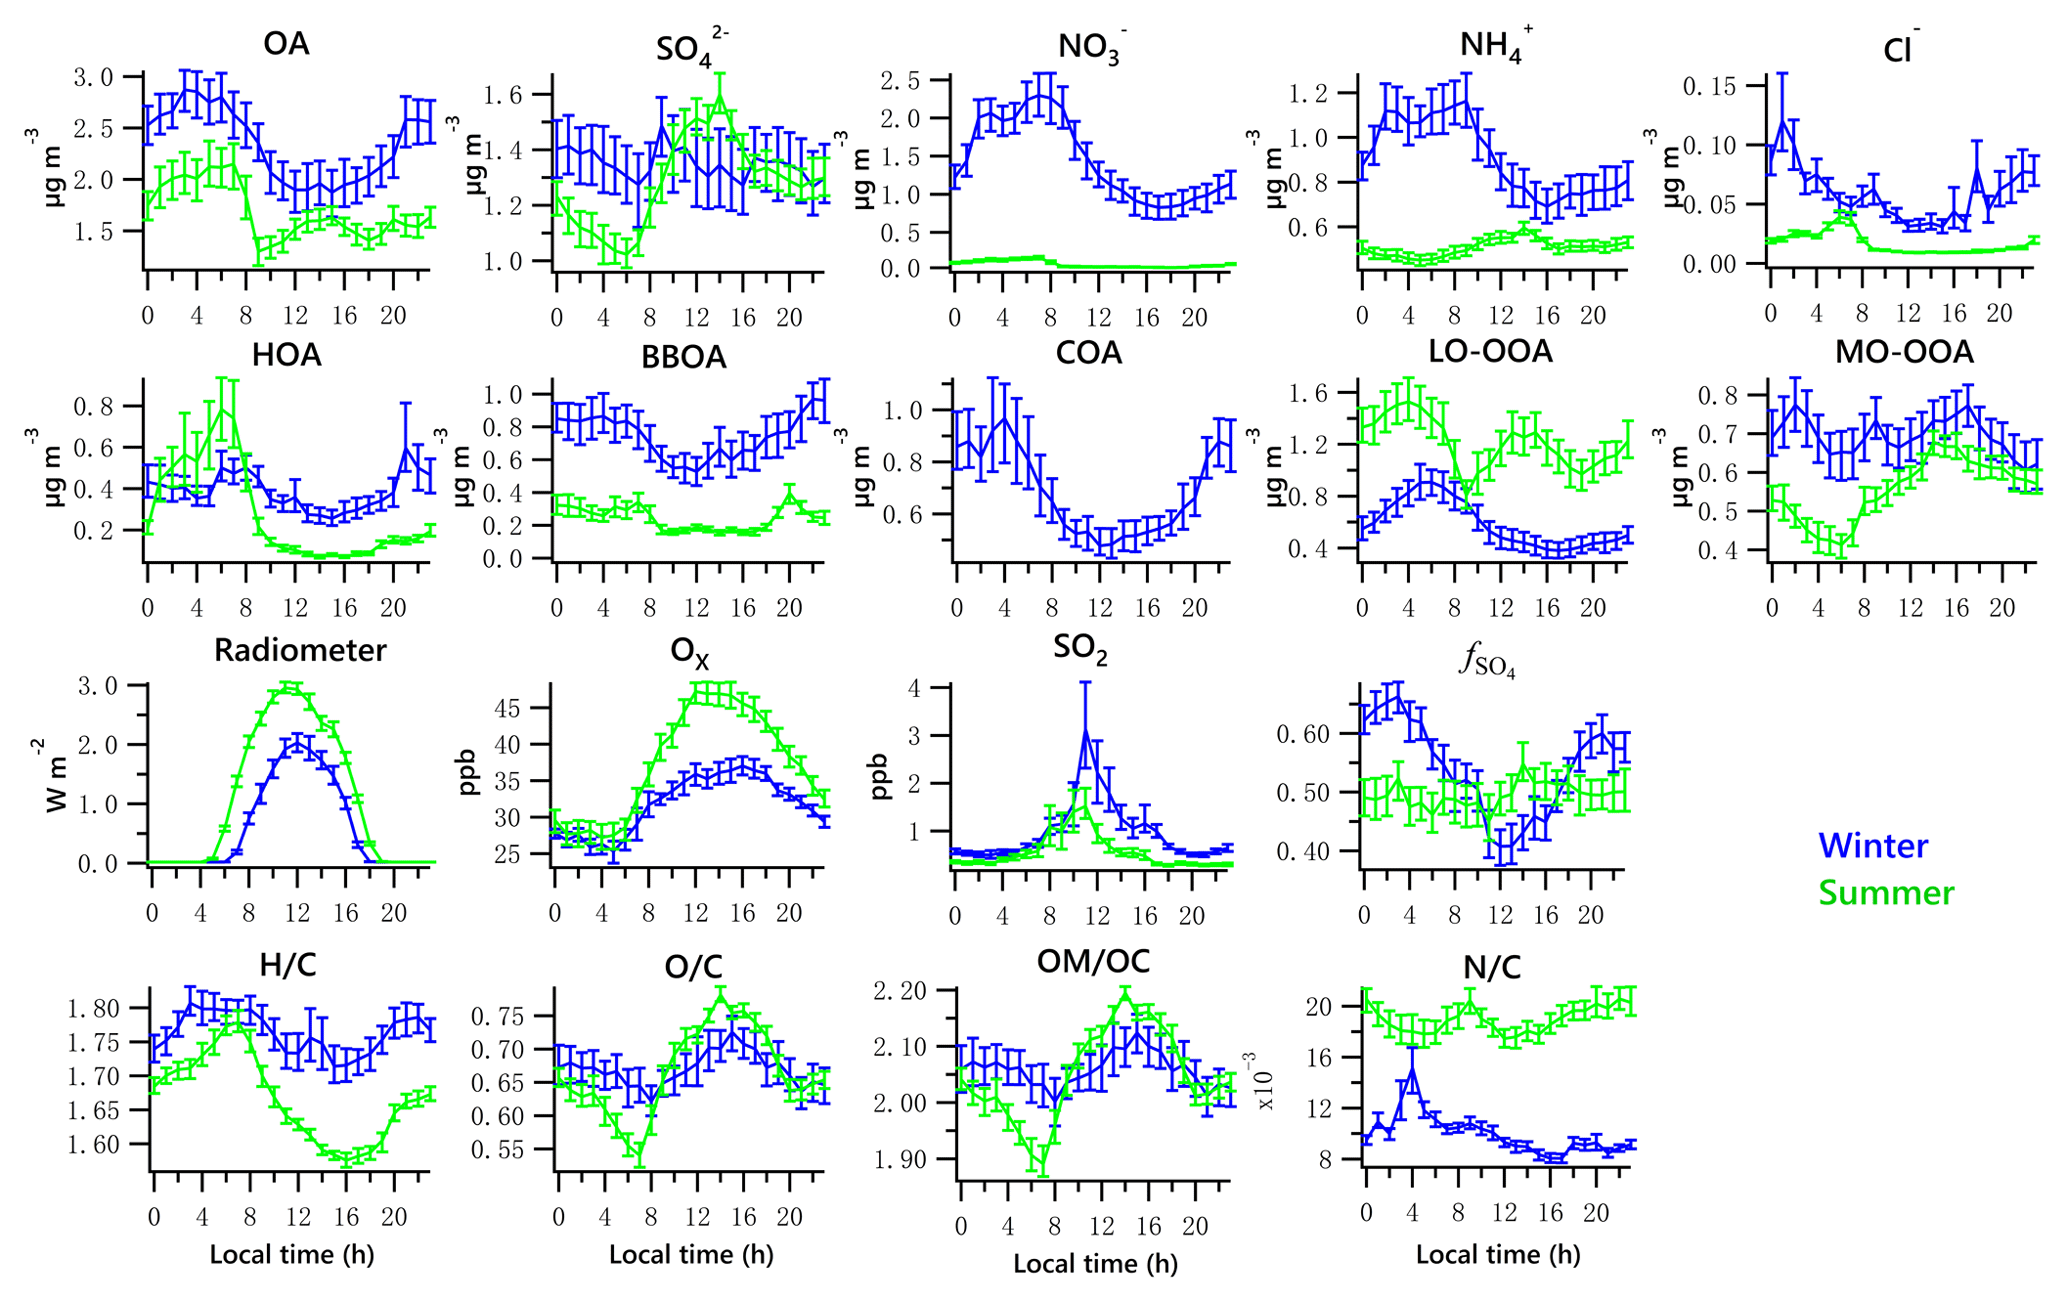
Figure 3Diurnal profiles of the five NR-PM1 species (OA, , , and Cl−), PMF-resolved factors (HOA, BBOA, COA, LO-OOA and MO-OOA), radiometer, Ox, SO2, and elemental ratios (H ∕ C, O ∕ C, OM ∕ OC and N ∕ C). Lines denote the mean value, and bars represent the 5 % and 95 % confidence interval in the mean (blue for winter, green for summer).
3.2 Seasonal variation of the formation of sulfate and nitrate
During the summer campaign, the prevailing southerly winds from the Gulf of Mexico carry marine aerosols to Houston (Schulze et al., 2018), resulting in a relatively high fraction of . As shown in Fig. 1g and j, the increased contribution of occurred when winds originated from the south at a high speed (e.g., 16–27 May), while the contribution of decreased significantly when winds originated from the north (e.g., 10 May and 13–15 May). During periods of southerly winds, O ∕ C and OM ∕ OC were relatively higher (Fig. S2c). In addition, elevated SO2 plumes were recorded during periods of southerly winds (Fig. 1g, h), potentially as a result of emissions from the Parish coal-fired power plant. In contrast to , the fractional contribution of and OA increased greatly when the winds were not southerly. Primary pollutants such as CO and NO2 were elevated when winds were northerly (Fig. 1h), accompanied by lower O ∕ C and higher H ∕ C ratios during the corresponding periods (Fig. S2c, e.g., 1, 2, 10, 15 May).
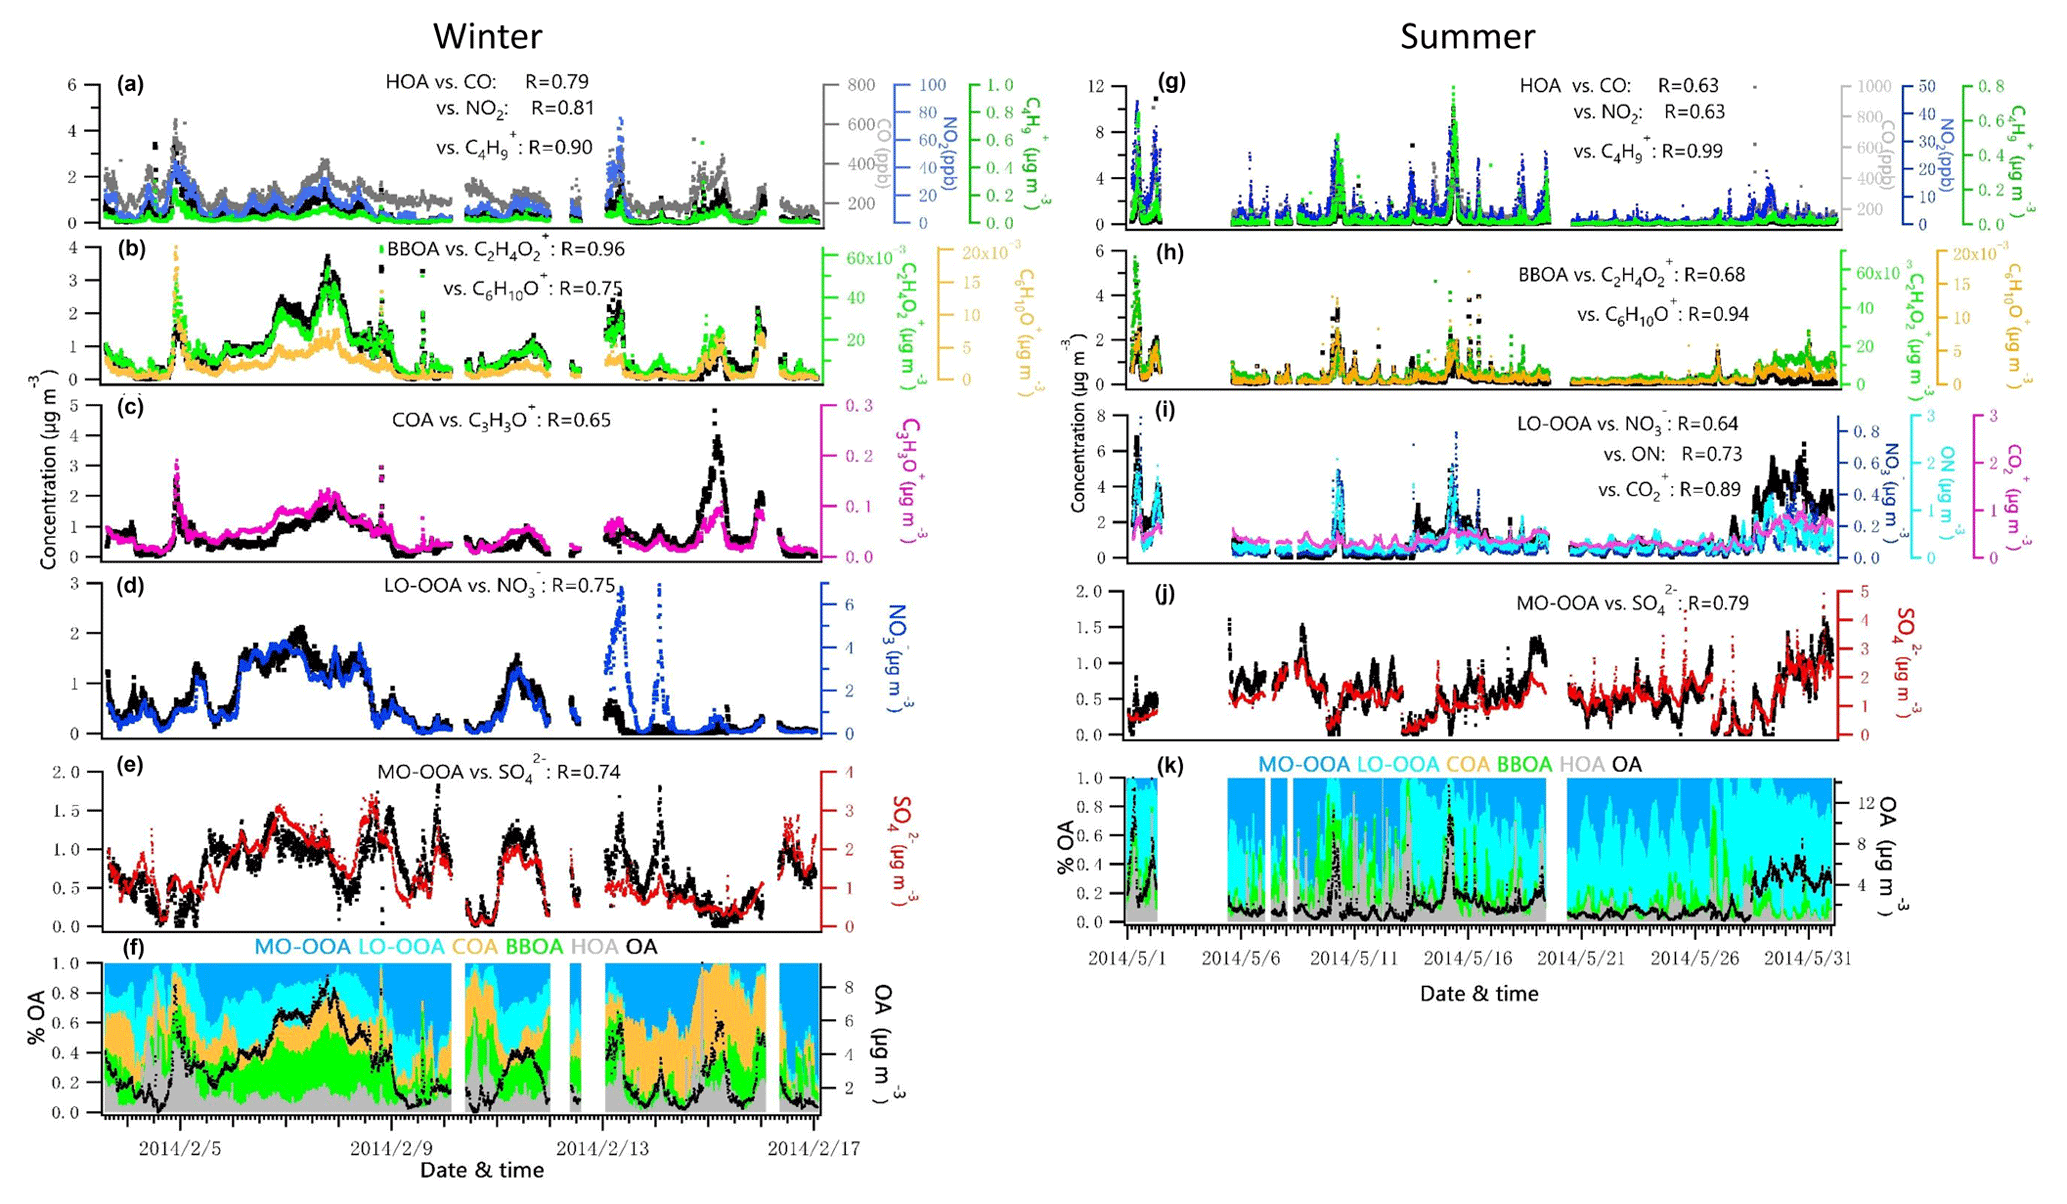
Figure 4Time series of each OA factor and associated correlated species for the winter and summer campaign at UHSL.
Figure 5Diurnal profiles of the estimated range of nitrate functionality from organic nitrate (a) and inorganic nitrate (b) for the winter and summer campaigns. Estimated water associated with inorganic and organic aerosol for the winter (c) and summer campaigns (d). Solid lines denote the mean value (blue for winter, green for summer), and bars represent the 5 % and 95 % confidence interval in the mean.
Diurnal patterns of NR-PM1 and other species in the winter and summer (Fig. 3) suggest significant seasonal dependence of sources and formation processes of NR-PM1 species in Houston. In the case of , the diurnal pattern displayed a daytime peak in both winter and summer, with the peak much more pronounced in summer midday. In winter, the (mole ratio of [] to the sum of [SO2] and []) and LWC have concurrent peak values during the night (Fig. 5). However, there is no obvious correlation between and LWC in summer, though a moderate correlation (r=0.44) was found in winter. By comparing the diurnal plots of sulfate in winter and summer, it appears that sulfate generated from aqueous chemistry accounted for more mass and a greater fraction of total sulfate production in winter than in summer.
The total nitrate concentration was higher in winter than in summer. The was very low in summer due to its thermal instability under high temperature, while it was relatively enhanced in winter. According to the ratio method described in Sect. 2.3.1, the mass fraction of in total nitrate was in the range of 65 %–66 % in winter and in the range of 19 %–39 % in summer. The averaged bound concentrations of NO3,ON ranged from 0.22 to 0.34 µg m−3 in winter and 0.05 to 0.06 µg m−3 in summer. The seasonal variation of is much stronger than that of NO3,ON. This is in accordance with previous observations in Atlanta, Georgia; and Centreville, Alabama (Xu et al., 2015).
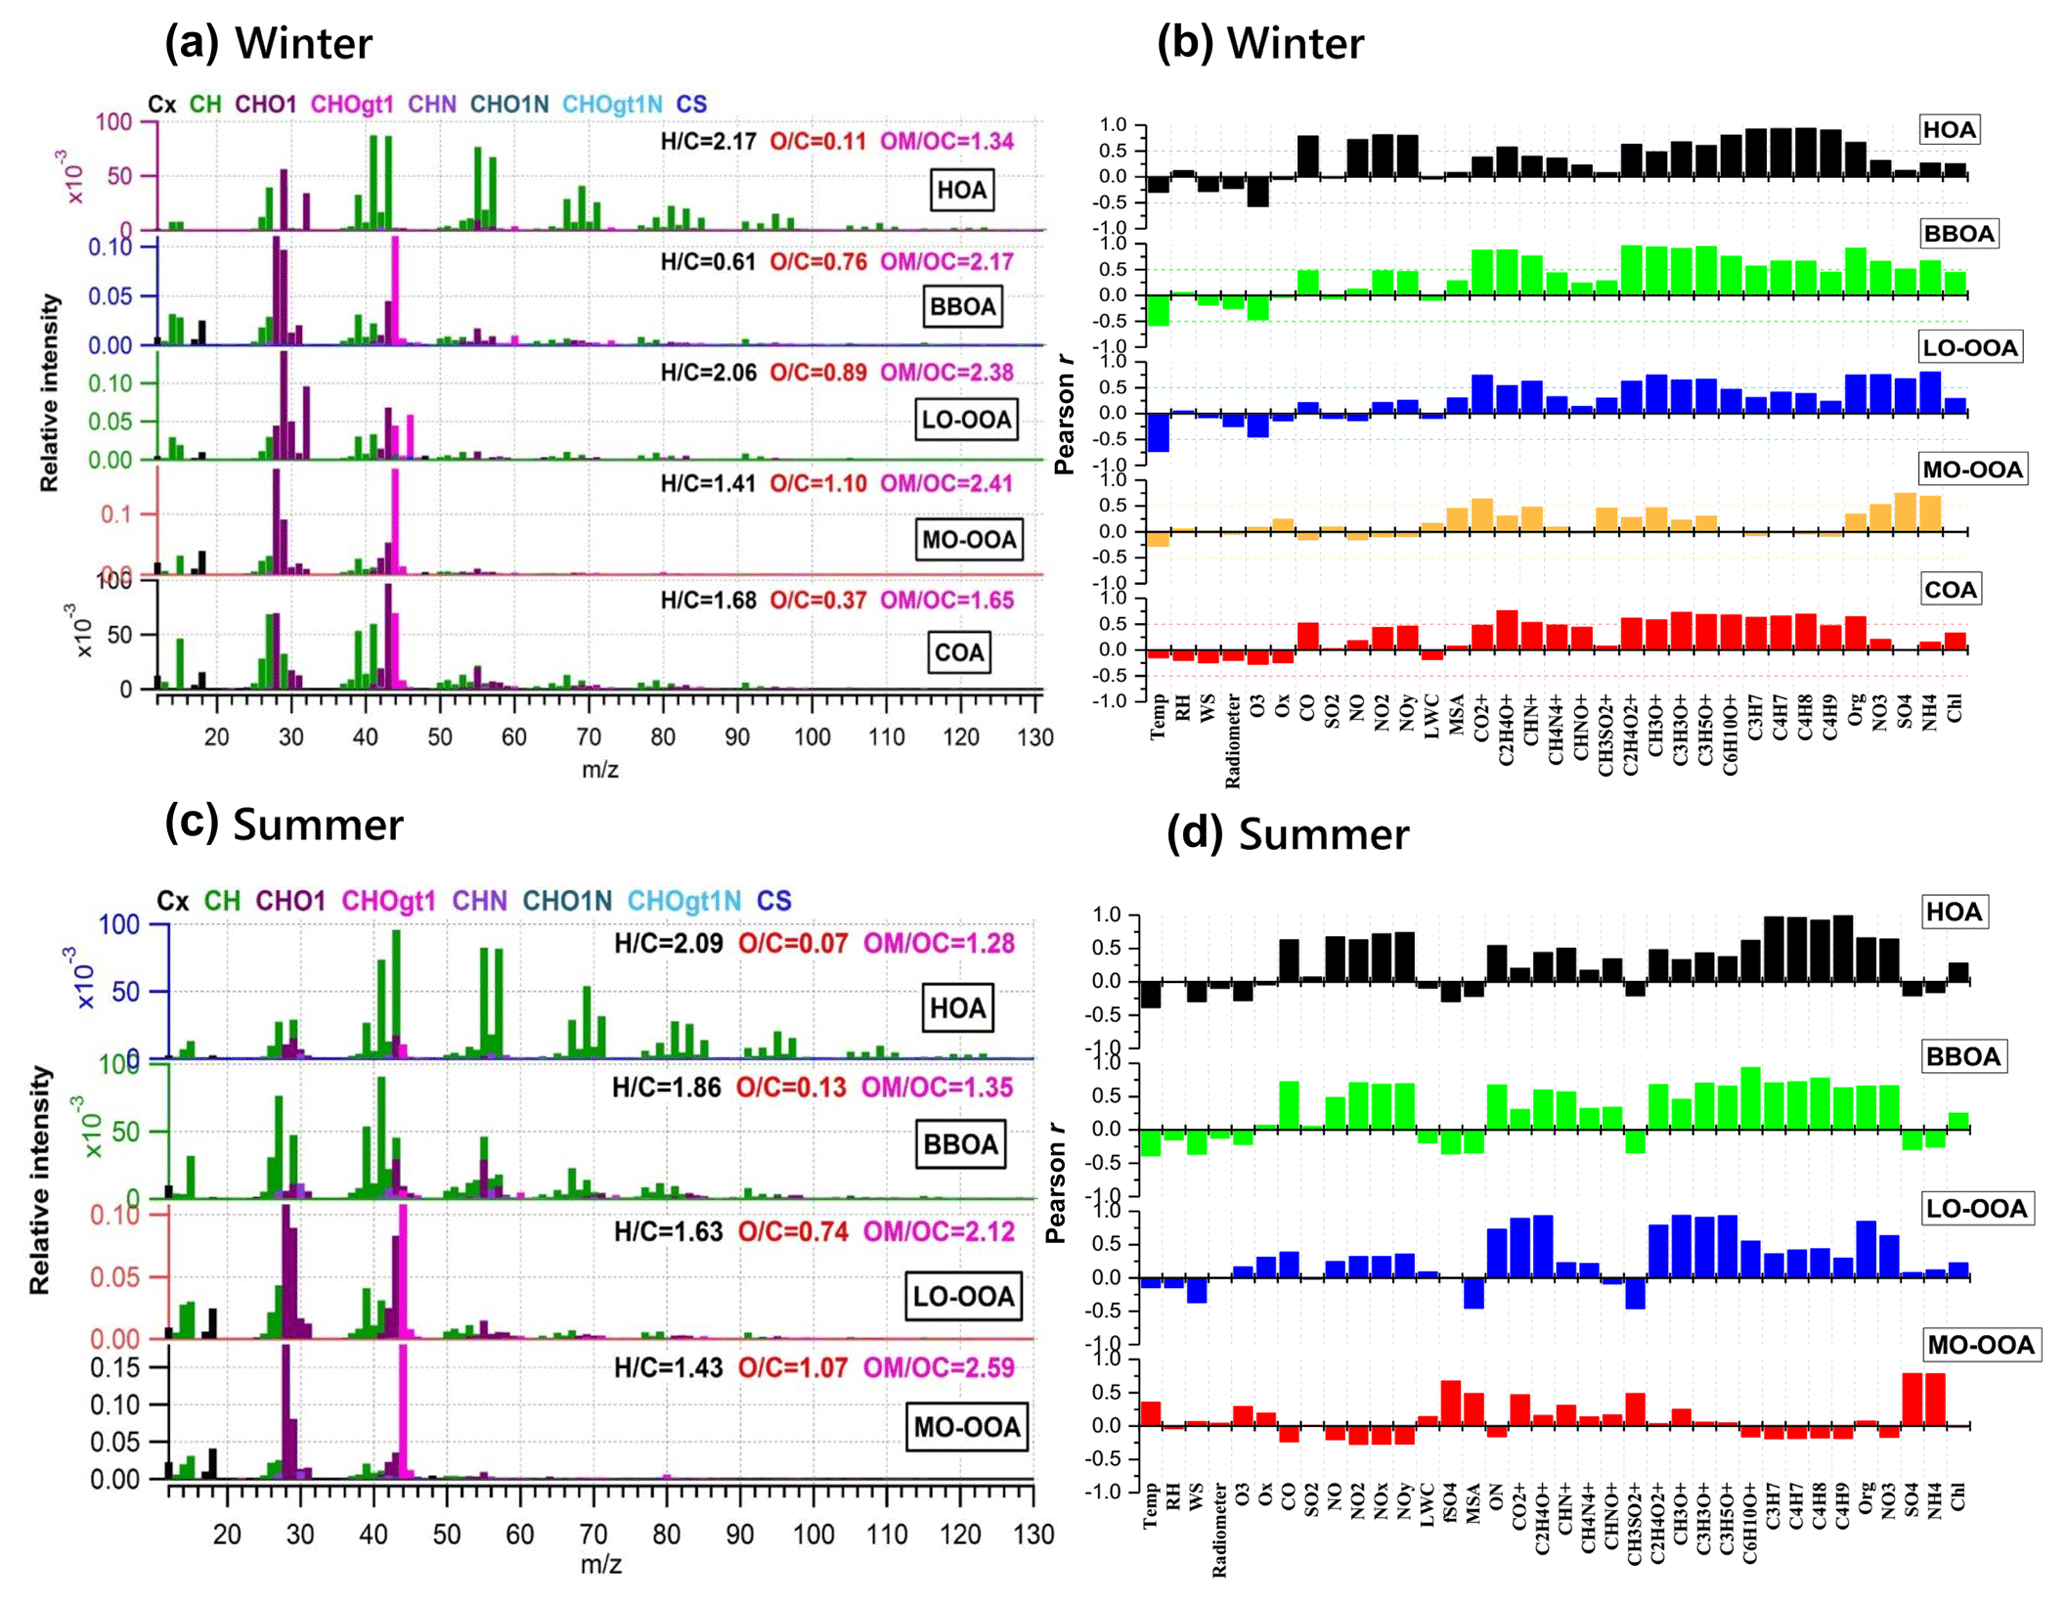
Figure 6Mass spectra of PMF-resolved OA factors (a, c) and correlation coefficients between OA factors and other variables (tracer ions, trace gas, meteorological parameters, etc.) (b, d) for winter and summer campaigns at UHSL.
The diurnal profiles of NO3,ON show that it reached peak value before dawn in both seasons (Fig. 5). However, presents a bimodal diurnal profile in both seasons. The , which increased from late afternoon and peaked at 02:00–04:00, was likely formed through nighttime chemistry from dinitrogen pentoxide (N2O5) hydrolysis, as the LWC displayed a trend similar to that of . This was corroborated by the observation of Ox (>25 ppb), which is needed to form N2O5 (via ). The second peak observed during morning rush hour was likely formed through photochemical processing of NOx emitted from vehicles because the traffic flow and Ox level are elevated during morning rush hour. The decreasing trend of after 09:00 is presumed to be a result of enhanced PBL height and evaporation.
The estimated ON accounted for 4 %–8 % of the total NR-PM1 and 9 %–17 % of the OA in summer and 12 %–27 % of the total NR-PM1 and 31 %–66 % percent of the OA in winter, comparable to other studies (Fry et al., 2009; Rollins et al., 2010; Xu et al., 2015; Berkemeier et al., 2016). A proxy for the production rate is based on the product of the observations of [NO2] and [O3] (Rollins et al., 2012), where brackets represent mixing ratios in parts per billion (ppb). The Ox (> 25 ppb) and elevated NOx observed at night in summer (Fig. 3) resulted in rapid formation. Thus, the concurrent enhancement in ON and O3 times NO2 occurring during nighttime (Fig. S4) likely indicates the nocturnal -initiated oxidation of anthropogenic and biogenic VOCs, with the latter probably being larger than the former (Brown et al., 2013). The high N ∕ C ratio of LO-OOA, concurrent peak value in LO-OOA and ON (MW = 231 g mol−1) during nighttime hours (Fig. 3), and appreciable correlation of LO-OOA and ON in summer (r=0.73) (Fig. 4) together suggest that particle-phase ON from -initiated chemistry contributed to nighttime LO-OOA in summer.
3.3 Effects of aqueous-phase and photochemical oxidation on OOA formation
On average, OOA accounted for 39 % ± 19 % of OA mass in winter but increased to 77 % ± 16 % in summer. Note that MO-OOA accounted for more than half of OOA in winter (56 %), indicating the more important role of MO-OOA in winter as compared to LO-OOA on a relative basis. In contrast, LO-OOA dominated OOA in summer (70 %). The mass spectra of MO-OOA in winter and summer are similar (Fig. 6, r=0.84) as is the extent of oxidation (O ∕ C = 1.10 vs. 1.07). However, LO-OOA in winter showed a different spectral pattern compared with that in summer. The mass spectrum of LO-OOA in winter was characterized by high m∕z 32 (mainly CH4O+) and 46 (mainly ) peaks, resulting in a relatively high O ∕ C (0.89) in winter that suggest LO-OOA in winter was more aged than that in summer (O ∕ C = 0.74).
Table 2Correlation (r) of OOA mass spectra with the previously published spectra database (http://cires1.colorado.edu/jimenez-group/HRAMSsd/, last access: 9 July 2019).
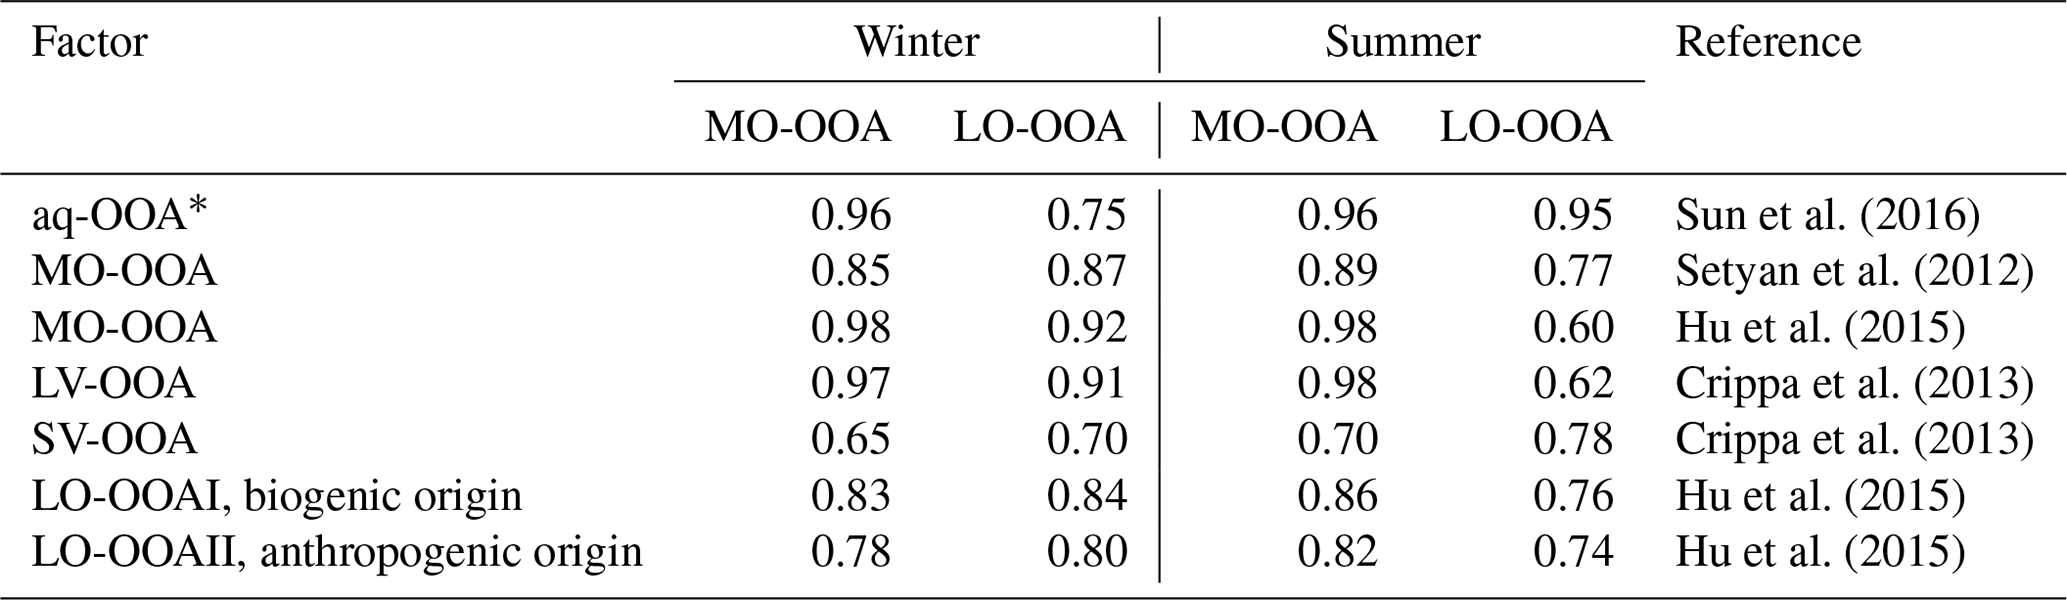
* aq-OOA is an aqueous-phase-processed SOA reported by Sun et al. (2016); LV: less volatile; SV: semivolatile.
Sun et al. (2016) reported a unique OOA in ambient air, termed aq-OOA (aqueous-phase-processed SOA), that strongly correlated with particle LWC, sulfate and S-containing ions. As shown in Table 2, by comparing the mass spectra of OOA in this work with aq-OOA, it is found that the mass spectra of MO-OOA in winter in this study present a much stronger correlation (r=0.96) with aq-OOA than does LO-OOA in winter in this study (r=0.75). Both MO-OOA and LO-OOA in summer highly correlated with aq-OOA. This result indicates that the formation of LO-OOA in summer and MO-OOA in both seasons may involve aqueous-phase chemistry.
Assuming that OOA deduced from PMF analysis can be used as a surrogate of SOA (Wood et al., 2010; Xu et al., 2017), the two OOA were used to investigate the formation mechanisms and evolutionary processes of SOA. Previous studies have found SOA correlated well with odd oxygen (Ox) in many cities (Wood et al., 2010; Sun et al., 2011; Hayes et al., 2013; Zhang et al., 2015; Xu et al., 2017) and that SOA formation is significantly impacted by aqueous-phase processing (Lim et al., 2010; Ervens et al., 2011; Xu et al., 2017). The relationships between OOA factors and Ox ∕ LWC were used as the metrics to characterize SOA formation mechanisms associated with photochemistry/aqueous oxidation chemistry (Xu et al., 2017).
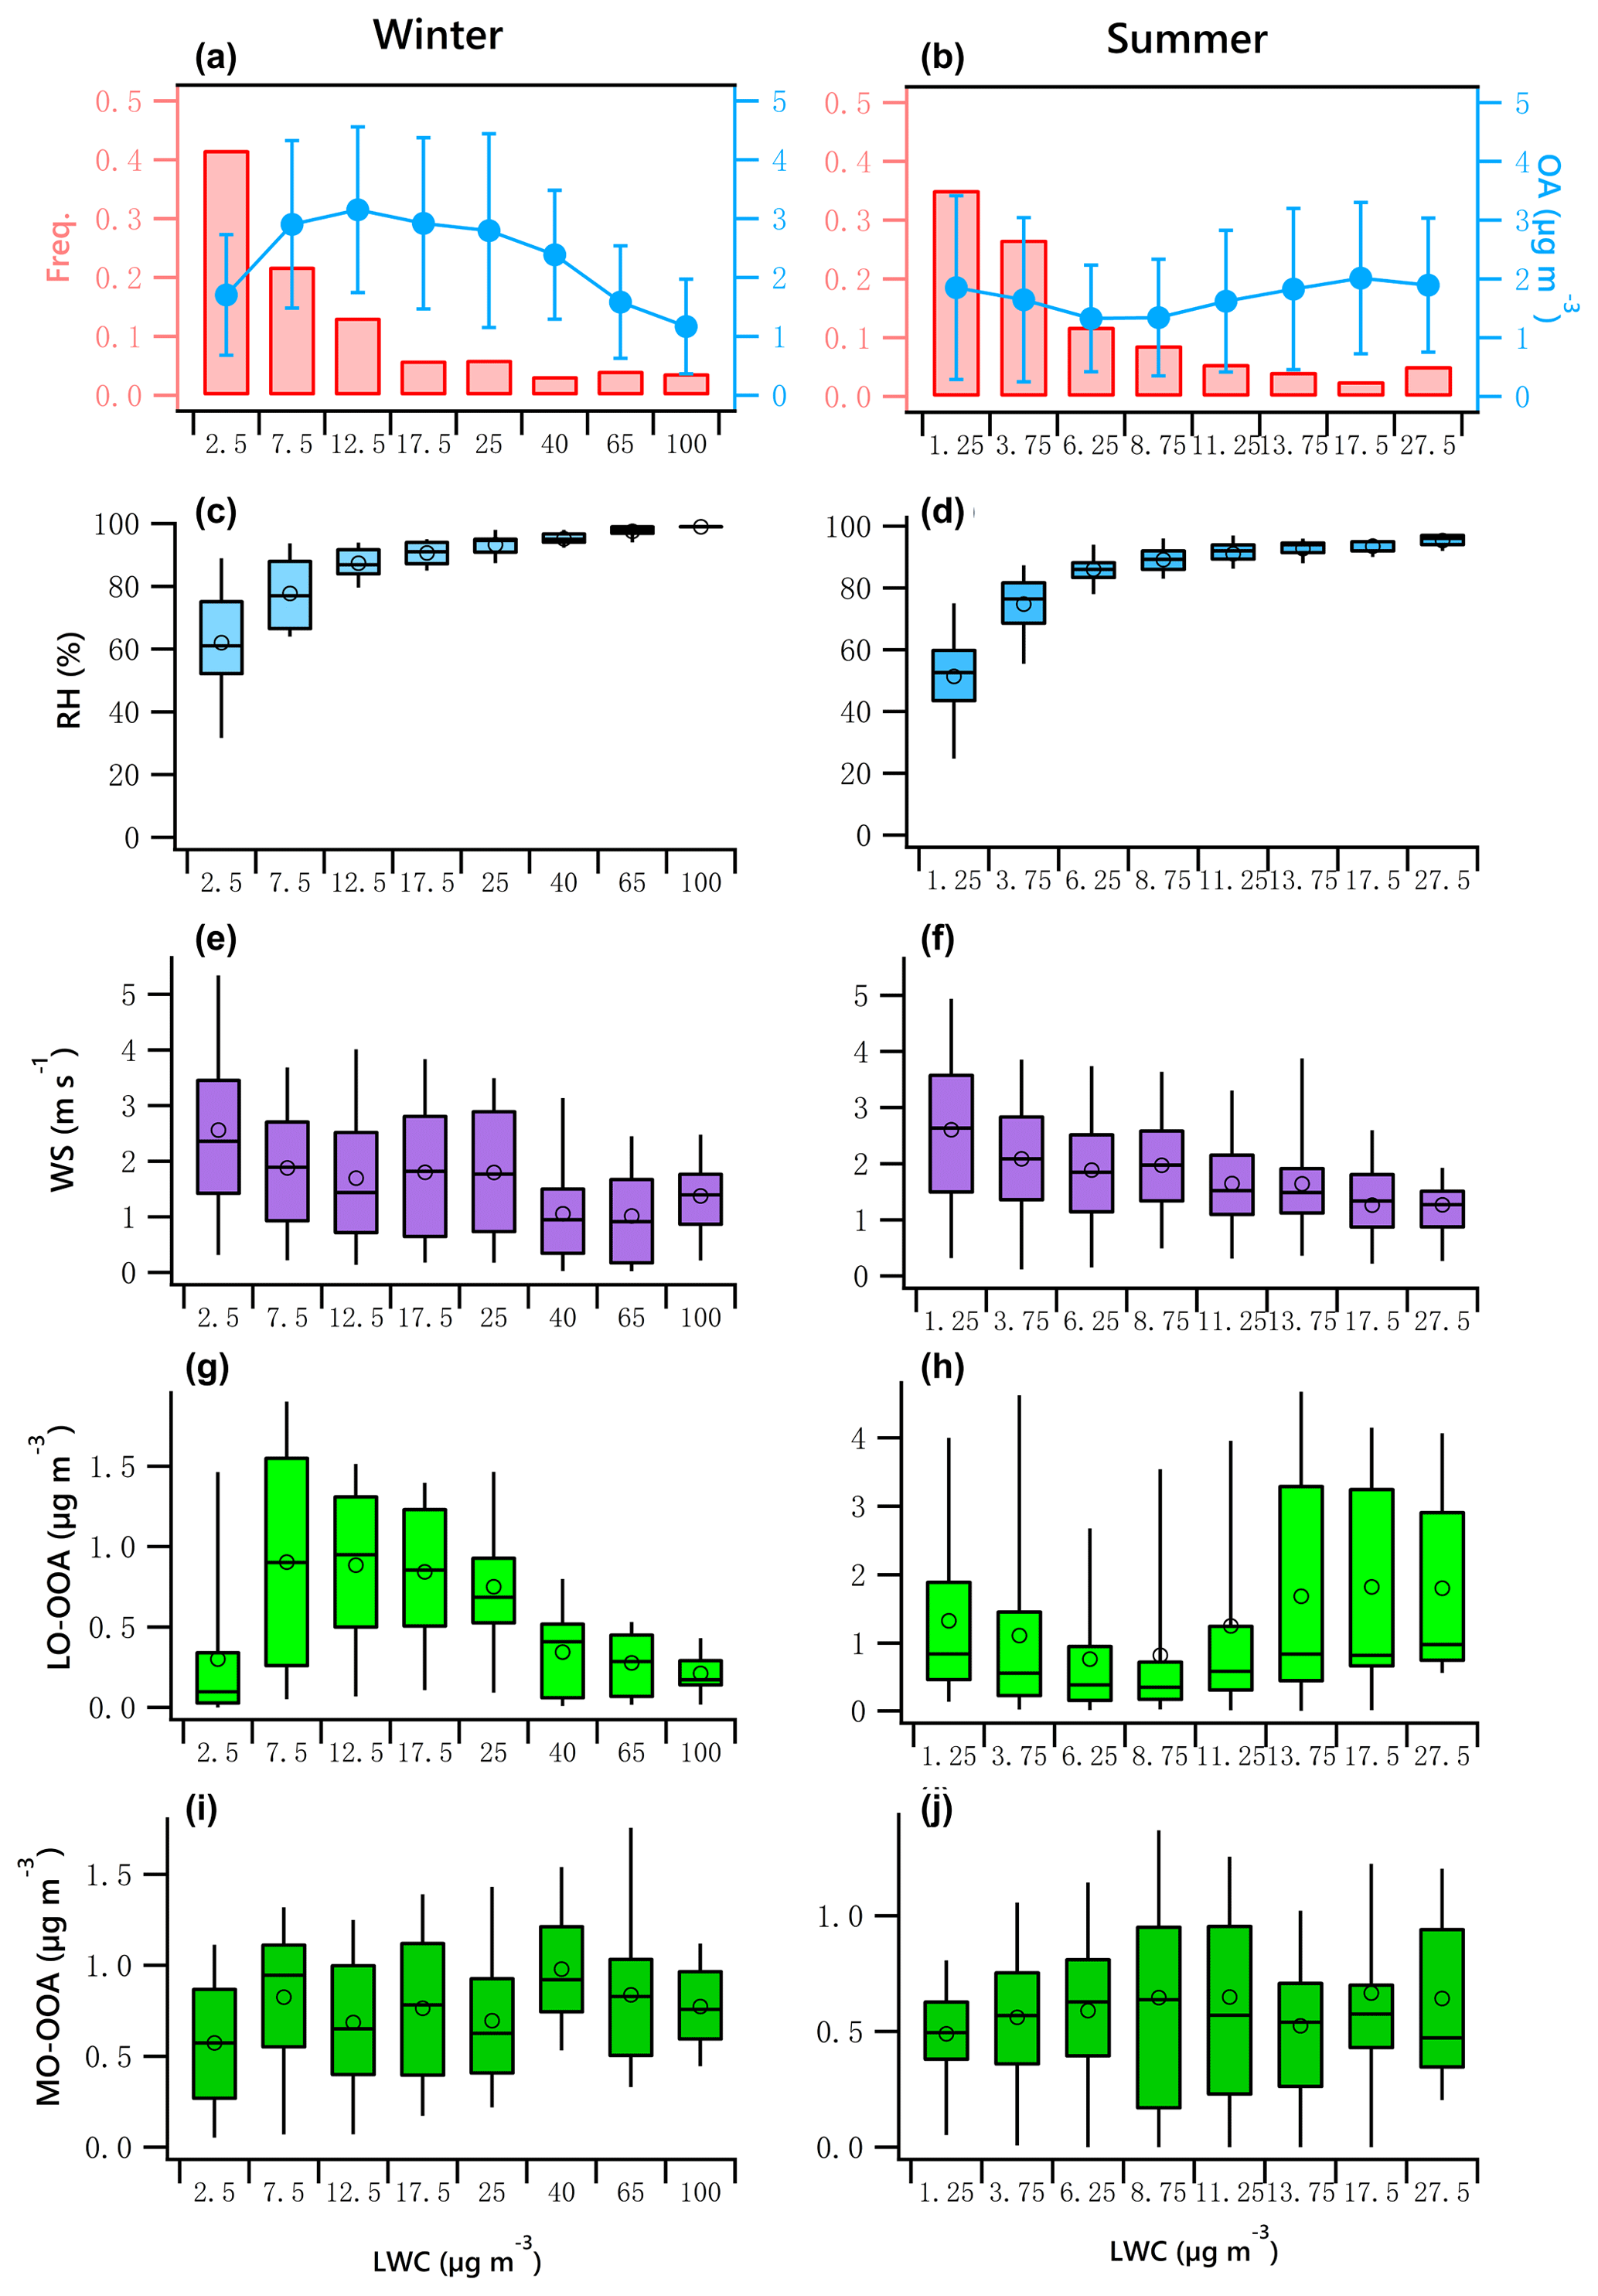
Figure 7OA mass and frequency histograms of data points in each LWC bin for winter (a) and summer (b). Variations of RH, WS, LO-OOA and MO-OOA mass as a function of LWC in winter (c, e, g, i) and summer (d, f, h, j). The data were binned according to the LWC (with different increment values), and mean (circle), median (horizontal line), 25th and 75th percentiles (lower and upper box), and 5th and 95th percentiles (lower and upper whiskers) are displayed for data in each bin.
Figure 7a and b indicate the LWC frequency distribution. Winter LWC values are binned in 5 µg m−3 increments from 0 to 20 µg m−3. Data in the ranges of 20 to 30 µg m−3, 30 to 50 µg m−3, 50 to 80 µg m−3, and 80 to 120 µg m−3 are shown as 25, 40, 65 and 100 µg m−3, respectively. Summer LWC values are binned in 2.5 µg m−3 increments from 0 to 15 µg m−3. The bins shown as 17.5 and 27.5 µg m−3 represent data from 15 to 20 µg m−3 and 20 to 35 µg m−3. It should be noted that a fit for the binned data likely results in an increase in R2 compared to the fit for the original data. For example, the correlation coefficient of the fit for the averaged binned wintertime MO-OOA (increased from 0.57 to 0.98 µg m−3) vs. LWC (increased from 2.5 to 40 µg m−3) is 0.55, while it is 0.06 for the original data (Fig. 7i).
The data associated with the artificially created bins in both seasons did not pass the normal test and homogeneity test of variances. The statistical significance of differences between bins was then tested using the Kruskal–Wallis analysis of variance (K–W ANOVA). The differences between winter and summer data of the bins were significant. Thus, the Dunn–Bonferroni test was performed for the post hoc pairwise comparisons. It was found that the difference of all measured variables in different bins shown in Fig. 7 were significant (p<0.01). The results can be found in Tables S6–S7. Figure 7c and d present a clear positive trend of RH as a function of LWC in both winter and summer, which implies an increased potential for aqueous-phase processing at high RH level, enhanced by low wind speed that allows accumulation of pollutants (Fig. 7e, f). The patterns of other parameters as LWC increases in winter were different from those in summer.
The variation of binned mean OA mass against LWC presents a significant seasonal difference (Fig. 7a, b). In winter, the OA mass increased when LWC increased from 2.5 to 12.5 µg m−3 but decreased as the LWC increased further. In summer, the OA mass slightly decreased when LWC increased from 1.25 to 6.25 µg m−3 but slightly increased when LWC increased further, suggesting the production of OA is not as strong as that in winter because of the relatively lower LWC in summer.
The winter LO-OOA mass decreased dramatically when LWC > 12.5 µg m−3 (RH > 80 %, Fig. 7c), while MO-OOA continues increasing until LWC > 40 µg m−3. This result indicates that wet removal may dominate under an extremely high RH environment coupled with stagnant air (WS < 2 m s−1, Fig. 7e) or that LO-OOA production decreased at extremely high LWC level (Fig. 7a). Specifically, average LO-OOA (Fig. 7g, h) in winter increased from 0.3 to 0.9 µg m−3 when LWC increased from 2.5 to 7.5 µg m−3 but decreased as the LWC increased further, particularly when LWC > 40 µg m−3. The slope of this decrease was approximately −0.008 µg LO-OOA per µg of LWC. Figure 7a shows that 64 % of the data points were observed in the situation of low LWC (< 12.5 µg m−3, RH < 80 %), when the increase in LO-OOA was largest.
In contrast, LO-OOA in summer showed a decreasing trend under low LWC level (LWC < 6.25 µg m−3, RH < 80 %) but an increasing trend from approximately 0.77 to 1.8 µg m−3 as LWC increased from 6.25 to 27.5 µg m−3, a slope of 0.053 µg LO-OOA per µg of LWC. The relatively high summer LO-OOA under low LWC level was likely more regional, with contributions from possibly transported nonaqueous OOA, as the wind speed in this case was relatively high and RH was low. The production of LO-OOA under high LWC level may have been enhanced by local aqueous-phase heterogeneous chemistry.
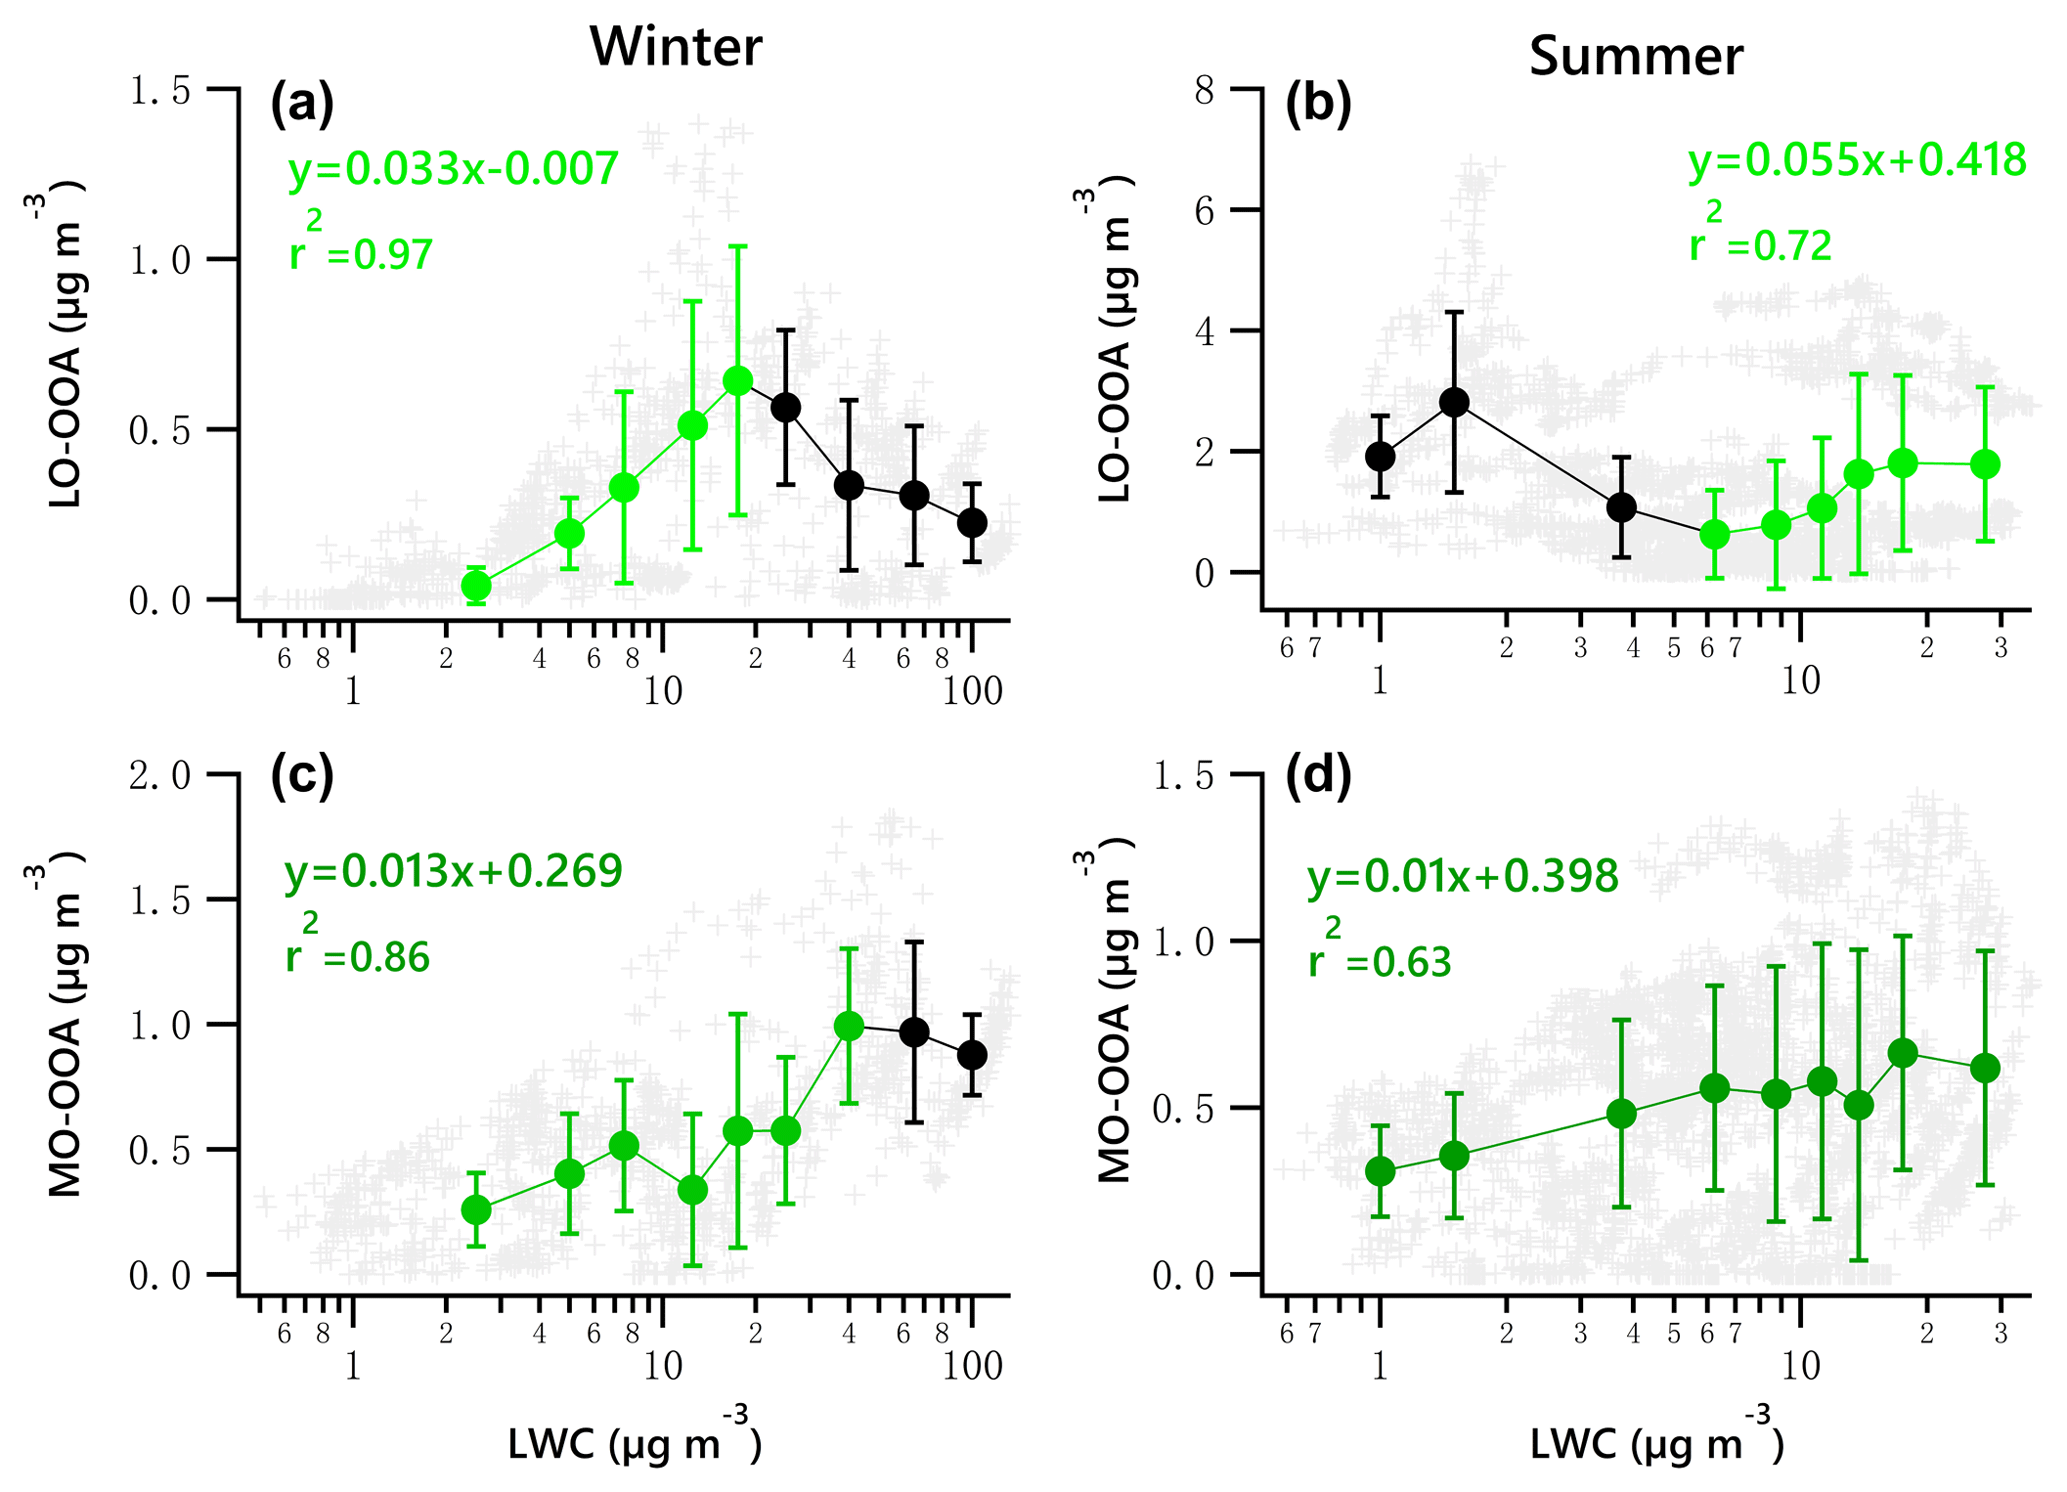
Figure 8Scatter plots of nighttime OOA vs. LWC for the winter and summer campaign. The linear equations are given for fitting only the green dots. Solid dots denote the average value of data in each bin. Bars indicate standard deviations.
MO-OOA slightly increased during both seasons as LWC increased (Fig. 7i, j). In winter, MO-OOA presented an increasing trend from 0.57 to 0.98 µg m−3 when LWC increased from 2.5 to 40 µg m−3 but decreased slightly as the LWC increased further. The slope of this increase was approximately 0.008 µg MO-OOA per µg of LWC with a correlation coefficient of 0.55. In summer, MO-OOA appears to increase from 0.49 to 0.64 µg m−3 when LWC increased from 2.5 to 27.5 µg m−3, with a slope of 0.005 µg MO-OOA per µg of LWC (R2=0.34). In winter, because of the decrease in LO-OOA with LWC, the relative fraction of MO-OOA increases as LWC increases.
The mutual effect of aqueous-phase and photochemistry on OOA formation prevents solely evaluating the role of the two processes. Sullivan et al. (2016) reported multiple lines of evidence for local aq-SOA formation observed in the Po Valley, Italy, during times of increasing RH, which coincided with dark conditions. Thus, the daytime data were separated to examine the variation of OOA against Ox. The relationship between OOA and aqueous-phase chemistry was investigated further by excluding the daytime data, with the aim of diminishing the instantaneous influence of photochemistry on the data. To do so, nighttime and daytime were based on sunrise and sunset in Houston during the two campaigns (https://www.timeanddate.com/sun/usa/houston, last access: 9 July 2019). On average, the day lengths are 11 h 10 min and 13 h 35 min for the campaigns in February and May 2014, respectively.
A potential linear relationship between OOA and LWC for the nighttime data was investigated by fitting the data with a locally weighted scatter plot smoothing algorithm (LOWESS, Cleveland, 1981). According to the LOWESS curves for the original nighttime data and the resampled data obtained by a bootstrap method (Figs. S14–15), there likely exists a linear relationship between LO-OOA and LWC for data points with LWC less than 20 µg m−3 and greater than 6 µg m−3 for the winter and summer periods, respectively. As for MO-OOA, such a linear relationship likely exists when LWC is less than 50 and 7 µg m−3 for the winter and summer periods, respectively.
Figure 8 presents the scatter plots of OOA vs. LWC during nighttime for the two campaigns. The green dots denote the increasing trend of OOA against LWC. It is found that the increase in wintertime LO-OOA under low LWC level (< 20 µg m−3) during the night is stronger than that shown in Fig. 7g. The nighttime LO-OOA linearly increased from 0.04 to 0.64 µg m−3 when LWC increased from 2.5 to 17.5 µg m−3, a slope of 0.033 µg LO-OOA per µg of LWC. This result indicates that the nighttime production of LO-OOA in winter may be more likely formed via aqueous-phase chemistry in aerosol liquid water than that in daytime. The production of LO-OOA under high LWC level (LWC > 6.25 µg m−3) in summer during nighttime (0.055 µg LO-OOA per µg of LWC) was comparable to the increase rate of whole dataset (0.053 µg LO-OOA per µg of LWC). The nighttime increasing trends of MO-OOA against LWC in both seasons are stronger than those shown in Fig. 7i and j with respect to the correlation coefficient values. The slope of the nighttime increase in MO-OOA against LWC during the winter campaign was 0.013 µg MO-OOA per µg of LWC, which is 1.7 times the slope for the whole dataset (daytime and nighttime). For the summer campaign, the increase in nighttime MO-OOA is 2.2 times the rate for the whole dataset.
These results suggest that aqueous-phase processing likely has a strong positive impact, particularly at night, on the production of MO-OOA in the two seasons except for instances when LWC exceeds 100 µg m−3 in winter. It also appears to facilitate the local production of LO-OOA under low LWC level (< 17.5 µg m−3) in winter and under relatively high LWC level (> 6.25 µg m−3) in summer.
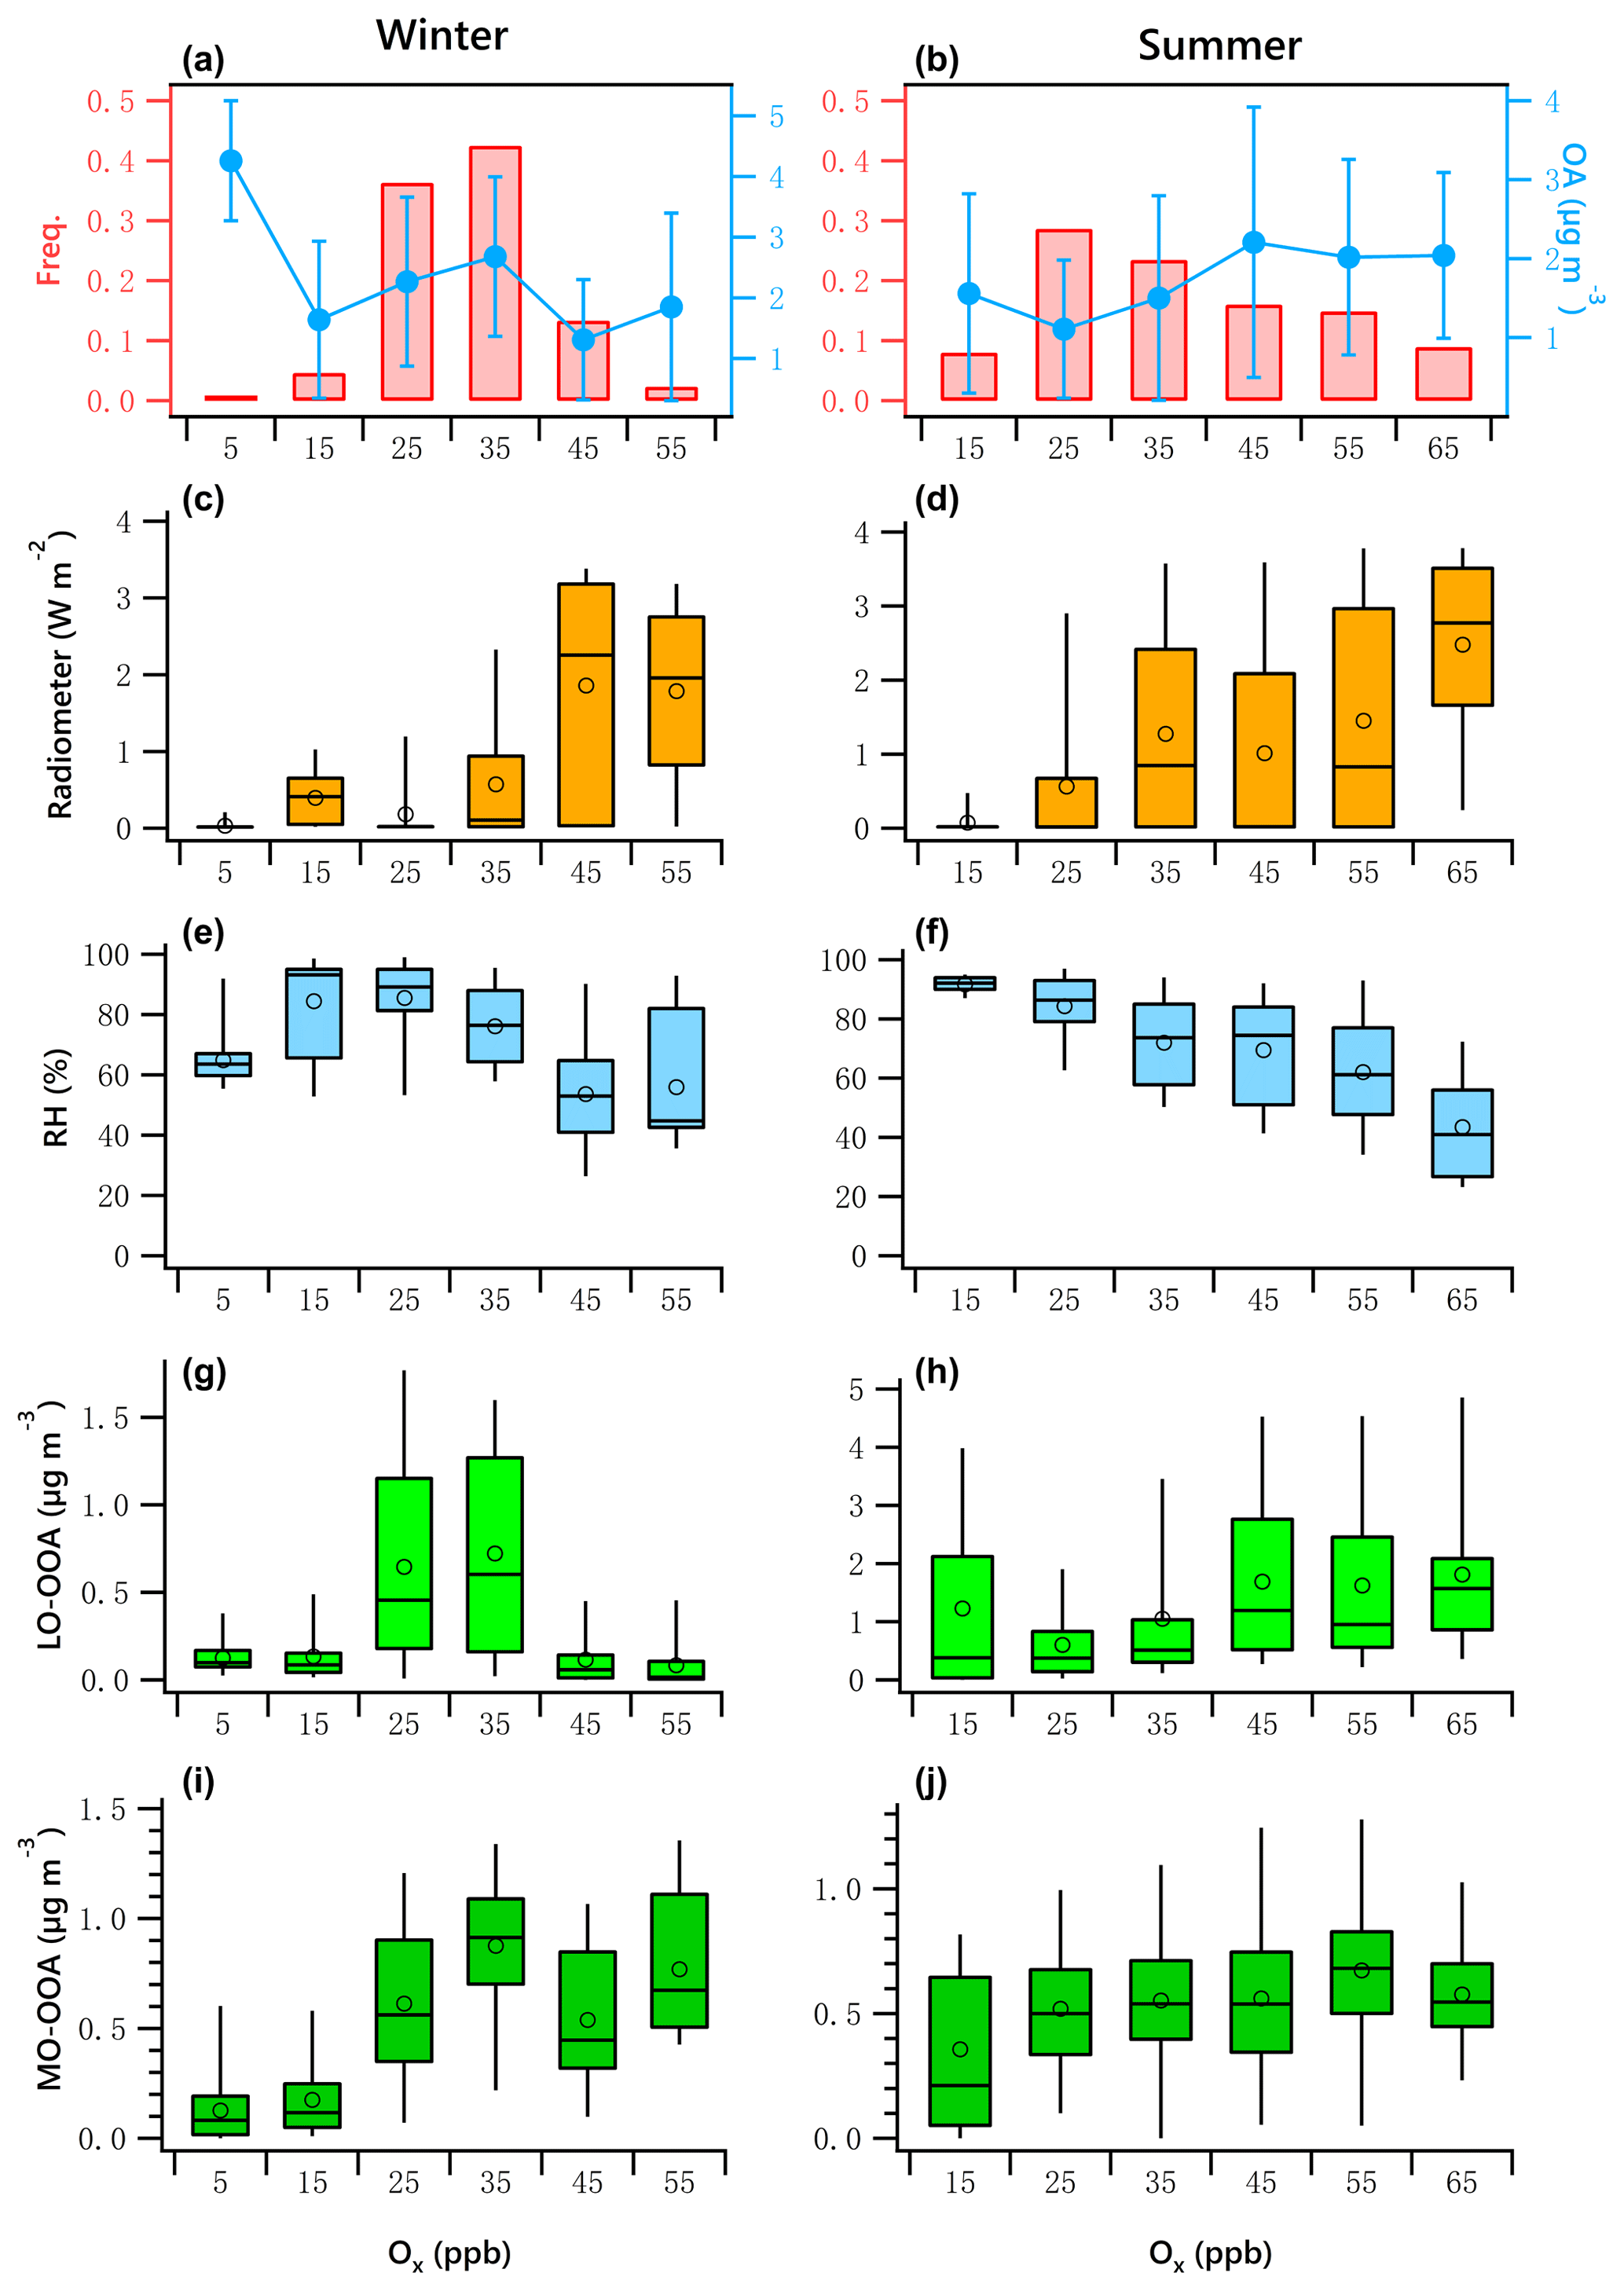
Figure 9OA mass and frequency histograms of data points in each Ox bin for winter (a) and summer (b). Variations of solar radiation, RH, LO-OOA and MO-OOA mass as a function of LWC in winter (c, e, g, i) and summer (d, f, h, j). The data were binned according to the Ox (10 ppb increment), and mean (circle), median (horizontal line), 25th and 75th percentiles (lower and upper box), and 5th and 95th percentiles (lower and upper whiskers) are displayed for data in each bin.
As mentioned previously, ON contributes significantly to summertime LO-OOA, and the concurrent enhancement in ON and LO-OOA during night was associated with elevated RH (Fig. 3). A previous study found that the partitioning of organic compounds to the particle phase was significantly increased at elevated RH levels (70 %) in an urban area dominated by biogenic emissions in Atlanta (Hennigan et al., 2008). The correlation of ON and LO-OOA in summer nighttime (r=0.76) was stronger than that during daytime (r=0.53). This is likely due to the higher ON yields from -initiated chemistry involving BVOCs during nighttime compared to hydroxyl-radical-initiated chemistry involving BVOCs during daytime. Additionally, the concurrent enhancement of the LWC and nitrate functionality from organic nitrate during nighttime demonstrates that the LWC does not inhibit increases in concentration, as might be expected if hydrolysis occurred rapidly.
Figure 9a and b present the frequency distribution of Ox. Winter Ox are binned in 10 ppb increments from 0 to 60 ppb. The range for summer is 20 to 70 ppb. The data associated with the artificially created Ox bins in both seasons did not pass the normal test and homogeneity test of variances. The K–W ANOVAs for winter and summer data of the bins were significant. The Dunn–Bonferroni test for the post hoc pairwise comparisons shows that the differences of measured variables among different bins shown in Fig. 9 were significant (Tables S8–S9). The clear positive relationship between solar radiation and Ox is shown in Fig. 9c and d, and the negative relationship between RH and Ox is shown in Fig. 9e and f, confirming strong atmospheric photochemical activity associated with high-Ox periods.
The variations of LO-OOA and MO-OOA showed substantially different patterns with increases in Ox in winter and summer. In winter, LO-OOA and MO-OOA showed comparable increasing trends at low Ox level (< 35 ppb), with MO-OOA having a stronger response. The LO-OOA increased from 0.13 to 0.72 µg m−3 when Ox increased from 5 to 35 ppb but decreased as the Ox increased further. The slope of this increase was approximately 0.023 µg LO-OOA per ppb of Ox. MO-OOA increased from 0.13 to 0.88 µg m−3 when the Ox increased from 5 to 35 ppb, with a slope of 0.027 µg MO-OOA per ppb of Ox. This leads to a maximum in the mass fraction of MO-OOA as Ox approached its highest observed levels.
In summer, there is a clear decreasing trend of RH with increases in Ox. As discussed previously, the high level of summertime LO-OOA likely was associated with high LWC. Therefore, the high mass fraction of LO-OOA at the lowest Ox level (< 20 ppb) associated with the high RH ∕ LWC was likely from aqueous-phase chemistry. After excluding low-Ox data (< 20 ppb), LO-OOA showed a much stronger response to Ox than did MO-OOA. The summer LO-OOA increased from approximately 0.6 to 1.8 µg m−3 when Ox increased from 25 to 65 ppb, a slope of 0.03 µg LO-OOA per ppb of Ox. This increase was likely in the case of low-RH conditions (< 80 %, Fig. 7d), when aqueous-phase chemistry was less likely to promote the production of LO-OOA (Fig. 7h). Summer MO-OOA increased from 0.36 to 0.67 µg m−3 when Ox increased from 25 to 55 ppb but decreased as the Ox increased further. The slope of this increase was 0.007 µg MO-OOA per ppb of Ox. Contrary to winter, LO-OOA in summer responded more strongly to increases in Ox than MO-OOA did.
The relationship of OOA vs. Ox was examined further by excluding nighttime data. According to the LOWESS curves for the original daytime data and the resampled data obtained using a bootstrap method (Figs. S16–S17), there likely exists a linear relationship between LO-OOA and Ox when Ox is less than 35 ppb and greater than 20 ppb for the winter and summer period, respectively. As for MO-OOA, the linear relationship likely exists for data points with Ox less than 35 ppb for the winter period, but it is less prominent.
Figure 10 presents the scatter plots of daytime OOA vs. Ox for the winter and summer campaign. The daytime responses of LO-OOA and MO-OOA to Ox in winter were ∼ 1.5 times that for the whole dataset (Fig. 9g, i), and the increase rate of MO-OOA was higher than that of LO-OOA. In summer, the slope of the daytime increase in LO-OOA was 1.24 times that for the whole campaign (Fig. 9h). These results suggest that the photochemical enhancement of OOA in winter on a per-Ox basis was more prominent than that in summer. For the summer campaign, the formation of LO-OOA appears to be more strongly linked to photochemistry compared to MO-OOA.

Figure 10Scatter plots of daytime OOA vs. Ox for the winter and summer campaign. The linear equations are given for fitting the green dots. Bars indicate standard deviations.
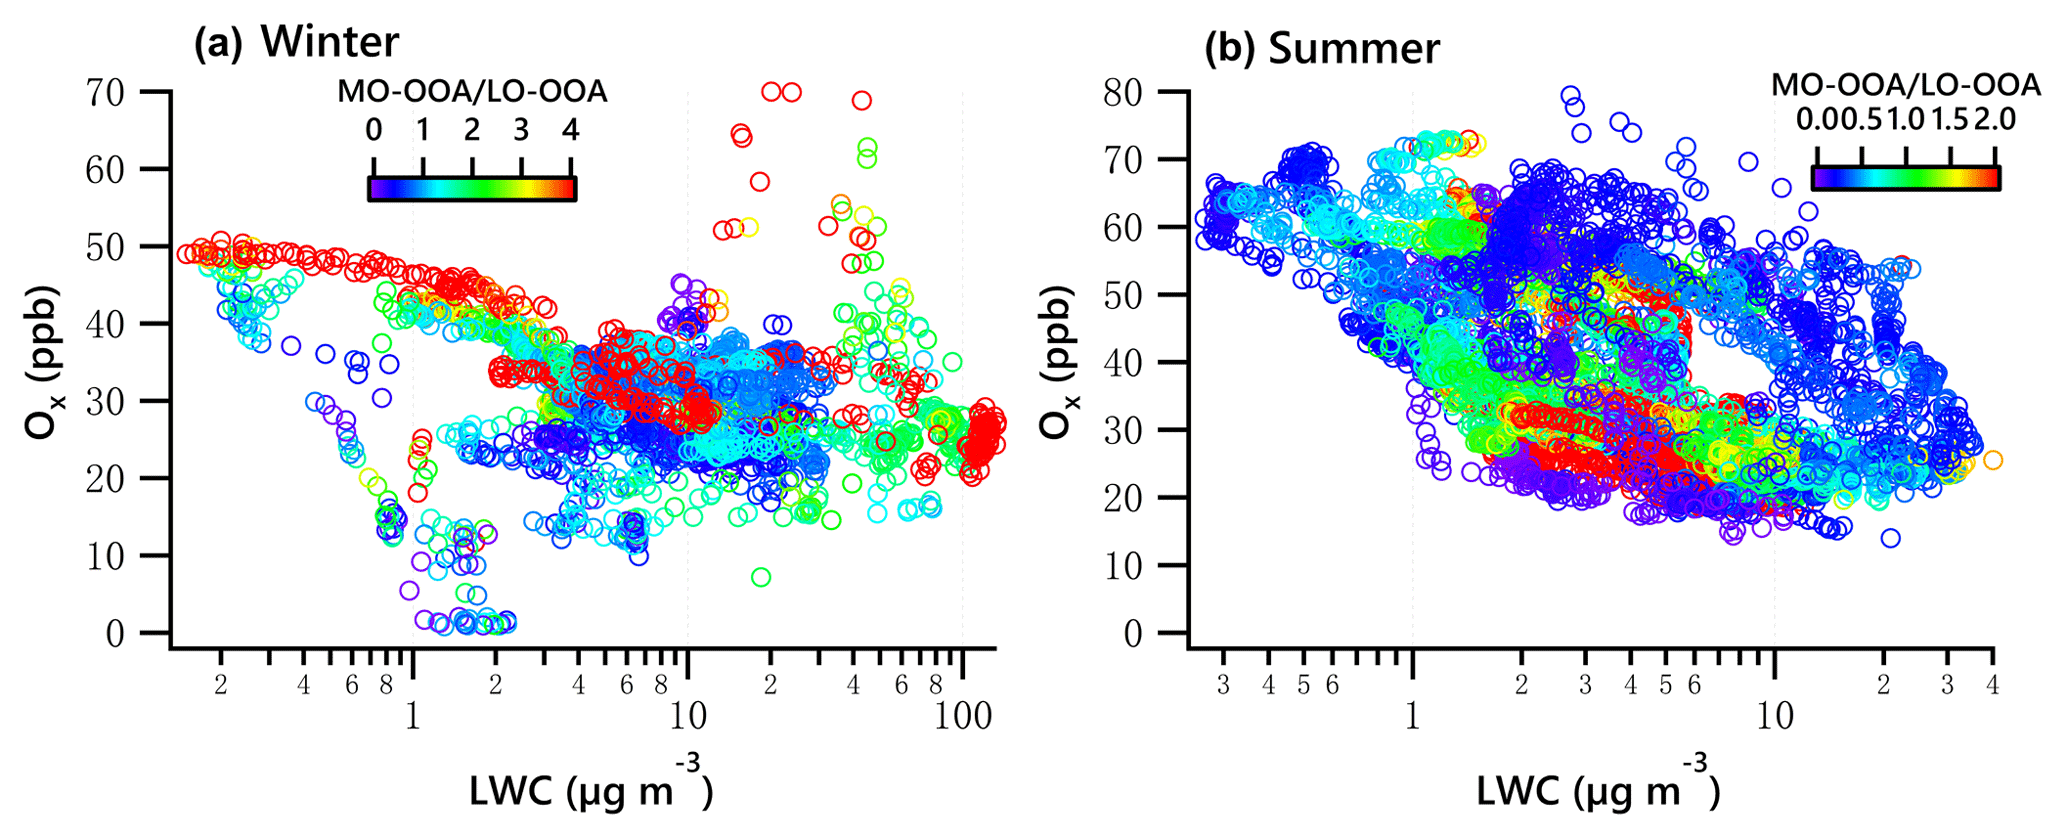
Figure 11Ox vs. LWC dependence of the ratio of MO-OOA ∕ LO-OOA in winter (a) and summer (b).
The combined effects of photochemistry and aqueous-phase chemistry on OOA composition during winter and summer are further demonstrated in Fig. 11. The ratio of MO-OOA ∕ LO-OOA in winter showed the highest values on the top-left corner in Fig. 11a, suggesting photochemical processing was likely responsible for MO-OOA formation, under low LWC levels (< 10 µg m−3). Additionally, data with high MO-OOA ∕ LO-OOA on the bottom-right corner in Fig. 11a indicate the important role of aqueous-phase chemistry under low Ox and high LWC levels. Overall, the concentration of MO-OOA in winter increased as Ox ∕ LWC increased, whereas LO-OOA markedly decreased. This result indicates both photochemical and aqueous-phase processing played a more important role in enhancing MO-OOA than LO-OOA in winter.
In summer, data points with a low MO-OOA ∕ LO-OOA value on the top left of Fig. 11b illustrated that LO-OOA was enhanced in high-Ox and low-LWC conditions, though the low MO-OOA ∕ LO-OOA values are not confined to just the top left. In the case of a high LWC level (LWC > 6.5 µg m−3), MO-OOA ∕ LO-OOA were much lower (on the right of Fig. 11b, particularly when LWC > 10 µg m−3). Although MO-OOA increased with LWC and Ox, the increase in LO-OOA was more significant. The effects of both photochemistry (≥ 25 ppb) and aqueous-phase chemistry (≥ 6.5 µg m−3) were more relevant for the formation of LO-OOA than MO-OOA. On average, the mass concentration of LO-OOA was elevated by nearly 1.2 µg m−3 as a ∼ 20 µg change in LWC (increased from 6.25 to 27.5 µg m−3, Fig. 7h), which is equivalent to a 40 ppb change in Ox (increased from 25 to 65 ppb, Fig. 9h). This result further suggests that the aqueous-phase chemistry is comparable to photochemistry in processing LO-OOA in summer.
Seasonal characterization of NR-PM1 collected using HR-ToF-AMS near Houston in 2014 demonstrated that the mass loading, diurnal patterns and important formation pathways of NR-PM1 vary seasonally. The OA was the largest component of NR-PM1 mass, on average, accounting for 38 % and 47 % of the mass loadings in winter and summer, respectively, which is less than that in the north part of Houston, which is influenced by high biogenic emission rates. Nitrate was the second largest component in winter (23 %) but accounted for only 2 % of NR-PM1 mass in summer; was the second largest component in winter (23 %) and summer (36 %), respectively. ON, on average, accounted for 31 %–66 % and 9 %–17 % of OA during the winter and summer campaign, respectively. The summertime ON correlated very well with LO-OOA and concurrently peaked at nighttime. It is likely that ON from -initiated oxidation of BVOC in the forested northeastern Houston contributed greatly to nighttime LO-OOA in summer and that LWC did not inhibit the resulting concentration growth.
Contributions of factors to wintertime and summertime OA show distinct differences. For wintertime OA, on average, BBOA contributed 26 % of OA mass, and MO-OOA and COA made the same contribution of 22 % to total OA mass. LO-OOA accounted for 17 % of OA mass, followed by HOA (13 %). In the summer, LO-OOA represented the largest fraction of the OA mass, 54 % on average. The second largest contributor was MO-OOA (23 %). Together, POA constituted more than half of OA mass (61 %) in winter, while it accounted for 23 % of OA mass in summer, highlighting the enhanced impact of primary emissions on OA level during wintertime. Secondary aerosols account for ∼ 76 % and 88 % of NR-PM1 mass in winter and summer, respectively, indicating NR-PM1 mass was likely driven mostly by secondary aerosol formation.
The two proxies of SOA (LO-OOA and MO-OOA) presented seasonal differences in their spectral patterns, oxidation degrees and contributions to SOA. MO-OOA showed a higher contribution to SOA than LO-OOA in winter (56 % vs. 44 %). In contrast, LO-OOA dominated SOA in summer (70 %). Our results indicate that both photochemical and aqueous-phase chemistry, as suggested by relationships to Ox and LWC, played important roles in the formation of MO-OOA and LO-OOA. Aqueous-phase processing likely has a strong positive impact on the formation of MO-OOA in the two seasons, especially in winter. The relationships between MO-OOA and LWC were 0.008 and 0.005 µg MO-OOA per µg of LWC during winter and summer, respectively. Wet removal or decreased formation rates likely limit MO-OOA when LWC exceeds 100 µg m−3 in winter. The relative importance of aqueous-phase chemistry vs. photochemistry in processing LO-OOA was dependent on RH. Aqueous-phase processing potentially facilitated the local formation of wintertime LO-OOA at a low LWC level (< 17.5 µg m−3, RH < 80 %), with a stronger dependence (0.033 µg LO-OOA per µg of LWC) than MO-OOA. In summer, the formation of LO-OOA may have been enhanced by aqueous-phase processing at a relatively high LWC level (> 6.25 µg m−3, RH > 80 %) with a slope of 0.053 µg LO-OOA per µg of LWC, while LO-OOA was likely transported nonaqueous regional OOA when LWC < 6.25 µg m−3. These increases in OOA in relation to LWC were greatly enhanced during nighttime. Aqueous-phase chemistry also appears important in the formation of summertime LO-OOA at low atmospheric oxidative capacity (Ox < 20 ppb). In general, summertime LO-OOA showed a much stronger response to Ox than did MO-OOA, with a slope of 0.030 µg LO-OOA per ppb of Ox. LO-OOA in summer was elevated by nearly 1.2 µg m−3 as a ∼ 20 µg change in LWC, which is equivalent to a 40 ppb change in Ox.
Datasets are available by contacting the corresponding author.
The supplement related to this article is available online at: https://doi.org/10.5194/acp-19-9641-2019-supplement.
QD performed the data analysis and wrote the manuscript. RJG and YF assisted heavily with manuscript development and editing. HWW, AATB, JHF and BLL contributed to data collection during the field campaigns. BCS, HWW, AATB and NPS contributed with data analysis. XB, BCS, AATB, FG, NPS and JHF provided helpful comments and edits.
The authors declare that they have no conflict of interest.
The authors would like to acknowledge Yele Sun (Institute of Atmospheric Physics, Chinese Academy of Sciences) for providing the aq-OOA mass spectra and Qiao Zhu (Peking University Shenzhen Graduate School) for assistance in the calculation of organic nitrates and PMF analysis. The scholarships provided by China Scholarship Council to Qili Dai and Xiaohui Bi are gratefully acknowledged. Support of the Houston Endowment in the development and deployment of the MAQL also is gratefully acknowledged.
This research has been supported by the National Key R&D Program of China (grant no. 2016YFC0208505), the Tianjin Science and Technology Plan Program (grant no. 18ZXSZSF00160) and the Houston Endowment (grant no. 2014-177-0163-03).
This paper was edited by Eleanor Browne and reviewed by two anonymous referees.
Allen, D. T. and Fraser, M.: An overview of the Gulf Coast Aerosol Research and Characterization Study: The Houston Fine Particulate Matter Supersite, J. Air Waste Manage., 56, 456–466, https://doi.org/10.1080/10473289.2006.10464514, 2006.
Atkinson, D. B., Massoli, P., O'Neill, N. T., Quinn, P. K., Brooks, S. D., and Lefer, B.: Comparison of in situ and columnar aerosol spectral measurements during TexAQS-GoMACCS 2006: testing parameterizations for estimating aerosol fine mode properties, Atmos. Chem. Phys., 10, 51–61, https://doi.org/10.5194/acp-10-51-2010, 2010.
Ayres, B. R., Allen, H. M., Draper, D. C., Brown, S. S., Wild, R. J., Jimenez, J. L., Day, D. A., Campuzano-Jost, P., Hu, W., de Gouw, J., Koss, A., Cohen, R. C., Duffey, K. C., Romer, P., Baumann, K., Edgerton, E., Takahama, S., Thornton, J. A., Lee, B. H., Lopez-Hilfiker, F. D., Mohr, C., Wennberg, P. O., Nguyen, T. B., Teng, A., Goldstein, A. H., Olson, K., and Fry, J. L.: Organic nitrate aerosol formation via NO3 + biogenic volatile organic compounds in the southeastern United States, Atmos. Chem. Phys., 15, 13377–13392, https://doi.org/10.5194/acp-15-13377-2015, 2015.
Bahreini, R., Ervens, B., Middlebrook, A. M., Warneke, C., de Gouw, J. A., DeCarlo, P. F., Jimenez, J. L., Brock, C. A., Neuman, J. A., Ryerson, T. B., Stark, H., Atlas, E., Brioude, J., Fried, A., Holloway, J. S., Peischl, J., Richter, D., Walega, J., Weibring, P., Wollny, A. G., and Fehsenfeld, F. C.: Organic aerosol formation in urban and industrial plumes near Houston and Dallas, Texas, J. Geophys. Res., 114, D00f16, https://doi.org/10.1029/2008jd011493, 2009.
Bates, T. S., Quinn, P. K., Coffman, D., Schulz, K., Covert, D. S., Johnson, J. E., Williams, E. J., Lerner, B. M., Angevine, W. M., Tucker, S. C., Brewer, W. A., and Stohl, A.: Boundary layer aerosol chemistry during TexAQS/GoMACCS 2006: Insights into aerosol sources and transformation processes, J. Geophys. Res., 113, D00F01, https://doi.org/10.1029/2008jd010023, 2008.
Bean, J. K., Faxon, C. B., Leong, Y. J., Wallace, H. W., Cevik, B. K., Ortiz, S., Canagaratna, M. R., Usenko, S., Sheesley, R. J., Griffin, R. J., and Hildebrandt, L: Composition and sources of particulate matter measured near Houston, TX; Anthropogenic-biogenic interactions, Atmosphere, 7, 73, https://doi.org/10.3390/atmos7050073, 2016
Berkemeier, T., Ammann, M., Mentel, T. F., Poschl, U., and Shiraiwa, M.: Organic Nitrate Contribution to New Particle Formation and Growth in Secondary Organic Aerosols from alpha-Pinene Ozonolysis, Environ. Sci. Technol., 50, 6334–6342, https://doi.org/10.1021/acs.est.6b00961, 2016.
Boyd, C. M., Sanchez, J., Xu, L., Eugene, A. J., Nah, T., Tuet, W. Y., Guzman, M. I., and Ng, N. L.: Secondary organic aerosol formation from the β-pinene + NO3 system: effect of humidity and peroxy radical fate, Atmos. Chem. Phys., 15, 7497–7522, https://doi.org/10.5194/acp-15-7497-2015, 2015.
Brown, S. S., Dubé, W. P., Bahreini, R., Middlebrook, A. M., Brock, C. A., Warneke, C., de Gouw, J. A., Washenfelder, R. A., Atlas, E., Peischl, J., Ryerson, T. B., Holloway, J. S., Schwarz, J. P., Spackman, R., Trainer, M., Parrish, D. D., Fehshenfeld, F. C., and Ravishankara, A. R.: Biogenic VOC oxidation and organic aerosol formation in an urban nocturnal boundary layer: aircraft vertical profiles in Houston, TX, Atmos. Chem. Phys., 13, 11317–11337, https://doi.org/10.5194/acp-13-11317-2013, 2013.
Bruns, E. A., Perraud, V., Zelenyuk, A., Ezell, M. J., Johnson, S. N., Yu, Y., Imre, D., Finlayson-Pitts, B. J., and Alexander, M. L.: Comparison of FTIR and Particle Mass Spectrometry for the Measurement of Particulate Organic Nitrates, Environ. Sci. Technol., 44, 1056–1061, 2010.
Canagaratna, M. R., Jayne, J. T., Jimenez, J. L., Allan, J. D., Alfarra, M. R., Zhang, Q., Onasch, T. B., Drewnick, F., Coe, H., Middlebrook, A., Delia, A., Williams, L. R., Trimborn, A. M., Northway, M. J., DeCarlo, P. F., Kolb, C. E., Davidovits, P., and Worsnop, D. R.: Chemical and microphysical characterization of ambient aerosols with the aerodyne aerosol mass spectrometer, Mass Spectrom. Rev., 26, 185–222, https://doi.org/10.1002/mas.20115, 2007.
Canagaratna, M. R., Jimenez, J. L., Kroll, J. H., Chen, Q., Kessler, S. H., Massoli, P., Hildebrandt Ruiz, L., Fortner, E., Williams, L. R., Wilson, K. R., Surratt, J. D., Donahue, N. M., Jayne, J. T., and Worsnop, D. R.: Elemental ratio measurements of organic compounds using aerosol mass spectrometry: characterization, improved calibration, and implications, Atmos. Chem. Phys., 15, 253–272, https://doi.org/10.5194/acp-15-253-2015, 2015.
Chang, R. Y.-W., Slowik, J. G., Shantz, N. C., Vlasenko, A., Liggio, J., Sjostedt, S. J., Leaitch, W. R., and Abbatt, J. P. D.: The hygroscopicity parameter (κ) of ambient organic aerosol at a field site subject to biogenic and anthropogenic influences: relationship to degree of aerosol oxidation, Atmos. Chem. Phys., 10, 5047–5064, https://doi.org/10.5194/acp-10-5047-2010, 2010.
Cleveland, M. J., Ziemba, L. D., Griffin, R. J., Dibb, J. E., Anderson, C. H., Lefer, B., and Rappengluck, B.: Characterization of urban aerosol using aerosol mass spectrometry and proton nuclear magnetic resonance spectroscopy, Atmos. Environ., 54, 511–518, https://doi.org/10.1016/j.atmosenv.2012.02.074, 2012.
Cleveland, W. S.: LOWESS: A program for smoothing scatterplots by robust locally weighted regression, Am. Stat., 35, 54 pp., 1981.
Crippa, M., El Haddad, I., Slowik, J. G., DeCarlo, P. F., Mohr, C., Heringa, M. F., Chirico, R., Marchand, N., Sciare, J., Baltensperger, U., and Prevot, A. S. H.: Identification of marine and continental aerosol sources in Paris using high resolution aerosol mass spectrometry, J. Geophys. Res., 118, 1950–1963, https://doi.org/10.1002/jgrd.50151, 2013.
DeCarlo, P. F., Kimmel, J. R., Trimborn, A., Northway, M. J., Jayne, J. T., Aiken, A. C., Gonin, M., Fuhrer, K., Horvath, T., Docherty, K. S., Worsnop, D. R., and Jimenez, J. L.: Field-deployable, high-resolution, time-of-flight aerosol mass spectrometer, Anal. Chem., 78, 8281–8289, https://doi.org/10.1021/ac061249n, 2006.
Duplissy, J., DeCarlo, P. F., Dommen, J., Alfarra, M. R., Metzger, A., Barmpadimos, I., Prevot, A. S. H., Weingartner, E., Tritscher, T., Gysel, M., Aiken, A. C., Jimenez, J. L., Canagaratna, M. R., Worsnop, D. R., Collins, D. R., Tomlinson, J., and Baltensperger, U.: Relating hygroscopicity and composition of organic aerosol particulate matter, Atmos. Chem. Phys., 11, 1155–1165, https://doi.org/10.5194/acp-11-1155-2011, 2011.
El-Sayed, M. M. H., Amenumey, D., and Hennigan, C. J.: Drying-Induced Evaporation of Secondary Organic Aerosol during Summer, Environ. Sci. Technol., 50, 3626–3633, https://doi.org/10.1021/acs.est.5b06002, 2016.
Ervens, B., Turpin, B. J., and Weber, R. J.: Secondary organic aerosol formation in cloud droplets and aqueous particles (aqSOA): a review of laboratory, field and model studies, Atmos. Chem. Phys., 11, 11069–11102, https://doi.org/10.5194/acp-11-11069-2011, 2011.
Farmer, D. K., Matsunaga, A., Docherty, K. S., Surratt, J. D., Seinfeld, J. H., Ziemann, P. J., and Jimenez, J. L.: Response of an aerosol mass spectrometer to organonitrates and organosulfates and implications for atmospheric chemistry, P. Natl. Acad. Sci. USA, 107, 6670–6675, https://doi.org/10.1073/pnas.0912340107, 2010.
Fountoukis, C. and Nenes, A.: ISORROPIA II: a computationally efficient thermodynamic equilibrium model for aerosols, Atmos. Chem. Phys., 7, 4639–4659, https://doi.org/10.5194/acp-7-4639-2007, 2007.
Fry, J. L., Kiendler-Scharr, A., Rollins, A. W., Wooldridge, P. J., Brown, S. S., Fuchs, H., Dubé, W., Mensah, A., dal Maso, M., Tillmann, R., Dorn, H.-P., Brauers, T., and Cohen, R. C.: Organic nitrate and secondary organic aerosol yield fr om NO3 oxidation of β-pinene evaluated using a gas-phase kinetics/aerosol partitioning model, Atmos. Chem. Phys., 9, 1431–1449, https://doi.org/10.5194/acp-9-1431-2009, 2009.
Fry, J. L., Draper, D. C., Zarzana, K. J., Campuzano-Jost, P., Day, D. A., Jimenez, J. L., Brown, S. S., Cohen, R. C., Kaser, L., Hansel, A., Cappellin, L., Karl, T., Hodzic Roux, A., Turnipseed, A., Cantrell, C., Lefer, B. L., and Grossberg, N.: Observations of gas- and aerosol-phase organic nitrates at BEACHON-RoMBAS 2011, Atmos. Chem. Phys., 13, 8585–8605, https://doi.org/10.5194/acp-13-8585-2013, 2013.
Grantz, D. A., Garner, J. H. B., and Johnson, D. W.: Ecological effects of particulate matter, Environ. Int., 29, 213–239, https://doi.org/10.1016/S0160-4120(02)00181-2, 2003.
Guo, H., Xu, L., Bougiatioti, A., Cerully, K. M., Capps, S. L., Hite Jr., J. R., Carlton, A. G., Lee, S.-H., Bergin, M. H., Ng, N. L., Nenes, A., and Weber, R. J.: Fine-particle water and pH in the southeastern United States, Atmos. Chem. Phys., 15, 5211–5228, https://doi.org/10.5194/acp-15-5211-2015, 2015.
Haman, C. L., Lefer, B., and Morris, G. A.: Seasonal Variability in the Diurnal Evolution of the Boundary Layer in a Near-Coastal Urban Environment, J. Atmos. Ocean. Tech., 29, 697–710, https://doi.org/10.1175/Jtech-D-11-00114.1, 2012.
Hayes, P. L., Ortega, A. M., Cubison, M. J., Froyd, K. D., Zhao, Y., Cliff, S. S., Hu, W. W., Toohey, D. W., Flynn, J. H., Lefer, B. L., Grossberg, N., Alvarez, S., Rappenglueck, B., Taylor, J. W., Allan, J. D., Holloway, J. S., Gilman, J. B., Kuster, W. C., De Gouw, J. A., Massoli, P., Zhang, X., Liu, J., Weber, R. J., Corrigan, A. L., Russell, L. M., Isaacman, G., Worton, D. R., Kreisberg, N. M., Goldstein, A. H., Thalman, R., Waxman, E. M., Volkamer, R., Lin, Y. H., Surratt, J. D., Kleindienst, E., Offenberg, J. H., Dusanter, S., Griffith, S., Stevens, P. S., Brioude, J., Angevine, W. M., and Jimenez, J. L.: Organic aerosol composition and sources in Pasadena, California, during the 2010 CalNex campaign, J. Geophys. Res., 118, 9233–9257, https://doi.org/10.1002/jgrd.50530, 2013.
Hennigan, C. J., Bergin, M. H., Dibb, J. E., and Weber, R. J.: Enhanced secondary organic aerosol formation due to water uptake by fine particles, Geophys. Res. Lett., 35, L18801, https://doi.org/10.1029/2008gl035046, 2008.
Hu, W. W., Campuzano-Jost, P., Palm, B. B., Day, D. A., Ortega, A. M., Hayes, P. L., Krechmer, J. E., Chen, Q., Kuwata, M., Liu, Y. J., de Sá, S. S., McKinney, K., Martin, S. T., Hu, M., Budisulistiorini, S. H., Riva, M., Surratt, J. D., St. Clair, J. M., Isaacman-Van Wertz, G., Yee, L. D., Goldstein, A. H., Carbone, S., Brito, J., Artaxo, P., de Gouw, J. A., Koss, A., Wisthaler, A., Mikoviny, T., Karl, T., Kaser, L., Jud, W., Hansel, A., Docherty, K. S., Alexander, M. L., Robinson, N. H., Coe, H., Allan, J. D., Canagaratna, M. R., Paulot, F., and Jimenez, J. L.: Characterization of a real-time tracer for isoprene epoxydiols-derived secondary organic aerosol (IEPOX-SOA) from aerosol mass spectrometer measurements, Atmos. Chem. Phys., 15, 11807–11833, https://doi.org/10.5194/acp-15-11807-2015, 2015.
Hu, W. W., Hu, M., Hu, W., Jimenez, J. L., Yuan, B., Chen, W. T., Wang, M., Wu, Y. S., Chen, C., Wang, Z. B., Peng, J. F., Zeng, L. M., and Shao, M.: Chemical composition, sources, and aging process of submicron aerosols in Beijing: Contrast between summer and winter, J. Geophys. Res., 121, 1955–1977, https://doi.org/10.1002/2015jd024020, 2016.
Jimenez, J. L., Canagaratna, M. R., Donahue, N. M., Prevot, A. S. H., Zhang, Q., Kroll, J. H., DeCarlo, P. F., Allan, J. D., Coe, H., Ng, N. L., Aiken, A. C., Docherty, K. S., Ulbrich, I. M., Grieshop, A. P., Robinson, A. L., Duplissy, J., Smith, J. D., Wilson, K. R., Lanz, V. A., Hueglin, C., Sun, Y. L., Tian, J., Laaksonen, A., Raatikainen, T., Rautiainen, J., Vaattovaara, P., Ehn, M., Kulmala, M., Tomlinson, J. M., Collins, D. R., Cubison, M. J., Dunlea, E. J., Huffman, J. A., Onasch, T. B., Alfarra, M. R., Williams, P. I., Bower, K., Kondo, Y., Schneider, J., Drewnick, F., Borrmann, S., Weimer, S., Demerjian, K., Salcedo, D., Cottrell, L., Griffin, R., Takami, A., Miyoshi, T., Hatakeyama, S., Shimono, A., Sun, J. Y., Zhang, Y. M., Dzepina, K., Kimmel, J. R., Sueper, D., Jayne, J. T., Herndon, S. C., Trimborn, A. M., Williams, L. R., Wood, E. C., Middlebrook, A. M., Kolb, C. E., Baltensperger, U., and Worsnop, D. R.: Evolution of Organic Aerosols in the Atmosphere, Science, 326, 1525–1529, https://doi.org/10.1126/science.1180353, 2009.
Kim, H., Zhang, Q., Bae, G.-N., Kim, J. Y., and Lee, S. B.: Sources and atmospheric processing of winter aerosols in Seoul, Korea: insights from real-time measurements using a high-resolution aerosol mass spectrometer, Atmos. Chem. Phys., 17, 2009–2033, https://doi.org/10.5194/acp-17-2009-2017, 2017.
Kota, S. H., Park, C., Hale, M. C., Werner, N. D., Schade, G. W., and Ying, Q.: Estimation of VOC emission factors from flux measurements using a receptor model and footprint analysis, Atmos. Environ., 82, 24–35, 10.1016/j.atmosenv.2013.09.052, 2014.
Kuwata, M., Zorn, S. R., and Martin, S. T.: Using Elemental Ratios to Predict the Density of Organic Material Composed of Carbon, Hydrogen, and Oxygen, Environ. Sci. Technol., 46, 787–794, https://doi.org/10.1021/es202525q, 2012.
Leong, Y. J., Sanchez, N. P., Wallace, H. W., Cevik, B. K., Hernandez, C. S., Han, Y., Flynn, J. H., Massoli, P., Floerchinger, C., Fortner, E. C., Herndon, S., Bean, J. K., Hildebrandt Ruiz, L., Jeon, W., Choi, Y., Lefer, B., and Griffin, R. J.: Overview of surface measurements and spatial characterization of submicrometer particulate matter during the DISCOVER-AQ 2013 campaign in Houston, TX, J. Air Waste Manage., 67, 854–872, https://doi.org/10.1080/10962247.2017.1296502, 2017.
Leuchner, M. and Rappengluck, B.: VOC source-receptor relationships in Houston during TexAQS-II, Atmos. Environ., 44, 4056–4067, 10.1016/j.atmosenv.2009.02.029, 2010.
Li, J. Y., Cleveland, M., Ziemba, L. D., Griffin, R. J., Barsanti, K. C., Pankow, J. F., and Ying, Q.: Modeling regional secondary organic aerosol using the Master Chemical Mechanism, Atmos. Environ., 102, 52–61, https://doi.org/10.1016/j.atmosenv.2014.11.054, 2015.
Lim, Y. B., Tan, Y., Perri, M. J., Seitzinger, S. P., and Turpin, B. J.: Aqueous chemistry and its role in secondary organic aerosol (SOA) formation, Atmos. Chem. Phys., 10, 10521–10539, https://doi.org/10.5194/acp-10-10521-2010, 2010.
Liu, J. B., Rhland, K. M., Chen, J. H., Xu, Y. Y., Chen, S. Q., Chen, Q. M., Huang, W., Xu, Q. H., Chen, F. H., and Smol, J. P.: Aerosol-weakened summer monsoons decrease lake fertilization on the Chinese Loess Plateau, Nat. Clim. Change, 7, 190–194, https://doi.org/10.1038/Nclimate3220+, 2017.
Mao, J. Q., Ren, X. R., Chen, S. A., Brune, W. H., Chen, Z., Martinez, M., Harder, H., Lefer, B., Rappengluck, B., Flynn, J., and Leuchner, M.: Atmospheric oxidation capacity in the summer of Houston 2006: Comparison with summer measurements in other metropolitan studies, Atmos. Environ., 44, 4107–4115, https://doi.org/10.1016/j.atmosenv.2009.01.013, 2010.
McKeen, S., Grell, G., Peckham, S., Wilczak, J., Djalalova, I., Hsie, E. Y., Frost, G., Peischl, J., Schwarz, J., Spackman, R., Holloway, J., de Gouw, J., Warneke, C., Gong, W., Bouchet, V., Gaudreault, S., Racine, J., McHenry, J., McQueen, J., Lee, P., Tang, Y., Carmichael, G. R., and Mathur, R.: An evaluation of real-time air quality forecasts and their urban emissions over eastern Texas during the summer of 2006 Second Texas Air Quality Study field study, J. Geophys. Res., 114, D00f11, https://doi.org/10.1029/2008JD011697, 2009.
Middlebrook, A. M., Bahreini, R., Jimenez, J. L., and Canagaratna, M. R.: Evaluation of Composition-Dependent Collection Efficiencies for the Aerodyne Aerosol Mass Spectrometer using Field Data, Aerosol Sci. Tech., 46, 258–271, https://doi.org/10.1080/02786826.2011.620041, 2012.
Olaguer, E. P., Kolb, C. E., Lefer, B., Rappenglueck, B., Zhang, R. Y., and Pinto, J. P.: Overview of the SHARP campaign: Motivation, design, and major outcomes, J. Geophys. Res., 119, 2597–2610, https://doi.org/10.1002/2013jd019730, 2014.
Paatero, P., Hopke, P. K., Song, X. H., and Ramadan, Z.: Understanding and controlling rotations in factor analytic models, Chemometr. Intell. Lab, 60, 253–264, https://doi.org/10.1016/S0169-7439(01)00200-3, 2002.
Paatero, P. and Tapper, U.: Positive matrix factorization: A non-negative factor model with optimal utilization of error estimates of data values, Environmetrics, 5, 111–126, https://doi.org/10.1002/env.3170050203, 1994.
Parrish, D. D., Allen, D. T., Bates, T. S., Estes, M., Fehsenfeld, F. C., Feingold, G., Ferrare, R., Hardesty, R. M., Meagher, J. F., Nielsen-Gammon, J. W., Pierce, R. B., Ryerson, T. B., Seinfeld, J. H., and Williams, E. J.: Overview of the Second Texas Air Quality Study (TexAQS II) and the Gulf of Mexico Atmospheric Composition and Climate Study (GoMACCS), J. Geophys. Res., 114, D00F13, https://doi.org/10.1029/2009jd011842, 2009.
Petters, M. D. and Kreidenweis, S. M.: A single parameter representation of hygroscopic growth and cloud condensation nucleus activity, Atmos. Chem. Phys., 7, 1961–1971, https://doi.org/10.5194/acp-7-1961-2007, 2007.
Petters, M. D., Wex, H., Carrico, C. M., Hallbauer, E., Massling, A., McMeeking, G. R., Poulain, L., Wu, Z., Kreidenweis, S. M., and Stratmann, F.: Towards closing the gap between hygroscopic growth and activation for secondary organic aerosol – Part 2: Theoretical approaches, Atmos. Chem. Phys., 9, 3999–4009, https://doi.org/10.5194/acp-9-3999-2009, 2009.
Prenni, A. J., Petters, M. D., Kreidenweis, S. M., DeMott, P. J., and Ziemann, P. J.: Cloud droplet activation of secondary organic aerosol, J. Geophys. Res., 112, D10223, https://doi.org/10.1029/2006jd007963, 2007.
Racherla, P. N. and Adams, P. J.: Sensitivity of global tropospheric ozone and fine particulate matter concentrations to climate change, J. Geophys. Res., 111, D24103, 10.1029/2005JD006939, 2006.
Rollins, A. W., Smith, J. D., Wilson, K. R., and Cohen, R. C.: Real Time In Situ Detection of Organic Nitrates in Atmospheric Aerosols, Environ. Sci. Technol., 44, 5540–5545, https://doi.org/10.1021/es100926x, 2010.
Rollins, A. W., Browne, E. C., Min, K. E., Pusede, S. E., Wooldridge, P. J., Gentner, D. R., Goldstein, A. H., Liu, S., Day, D. A., Russell, L. M., and Cohen, R. C.: Evidence for NOx Control over Nighttime SOA Formation, Science, 337, 1210–1212, https://doi.org/10.1126/science.1221520, 2012.
Russell, L. M., Takahama, S., Liu, S., Hawkins, L. N., Covert, D. S., Quinn, P. K., and Bates, T. S.: Oxygenated fraction and mass of organic aerosol from direct emission and atmospheric processing measured on the R/V Ronald Brown during TEXAQS/GoMACCS 2006, J. Geophys. Res., 114, D00F05, https://doi.org/10.1029/2008JD011275, 2009.
Schulze, B. C., Wallace, H. W., Bui, A. T., Flynn, J. H., Erickson, M. H., Alvarez, S., Dai, Q., Usenko, S., Sheesley, R. J., and Griffin, R. J.: The impacts of regional shipping emissions on the chemical characteristics of coastal submicron aerosols near Houston, TX, Atmos. Chem. Phys., 18, 14217–14241, https://doi.org/10.5194/acp-18-14217-2018, 2018.
Setyan, A., Zhang, Q., Merkel, M., Knighton, W. B., Sun, Y., Song, C., Shilling, J. E., Onasch, T. B., Herndon, S. C., Worsnop, D. R., Fast, J. D., Zaveri, R. A., Berg, L. K., Wiedensohler, A., Flowers, B. A., Dubey, M. K., and Subramanian, R.: Characterization of submicron particles influenced by mixed biogenic and anthropogenic emissions using high-resolution aerosol mass spectrometry: results from CARES, Atmos. Chem. Phys., 12, 8131–8156, https://doi.org/10.5194/acp-12-8131-2012, 2012.
Sullivan, A. P., Hodas, N., Turpin, B. J., Skog, K., Keutsch, F. N., Gilardoni, S., Paglione, M., Rinaldi, M., Decesari, S., Facchini, M. C., Poulain, L., Herrmann, H., Wiedensohler, A., Nemitz, E., Twigg, M. M., and Collett Jr., J. L.: Evidence for ambient dark aqueous SOA formation in the Po Valley, Italy, Atmos. Chem. Phys., 16, 8095–8108, https://doi.org/10.5194/acp-16-8095-2016, 2016.
Sun, Y.-L., Zhang, Q., Schwab, J. J., Demerjian, K. L., Chen, W.-N., Bae, M.-S., Hung, H.-M., Hogrefe, O., Frank, B., Rattigan, O. V., and Lin, Y.-C.: Characterization of the sources and processes of organic and inorganic aerosols in New York city with a high-resolution time-of-flight aerosol mass apectrometer, Atmos. Chem. Phys., 11, 1581–1602, https://doi.org/10.5194/acp-11-1581-2011, 2011.
Sun, Y., Du, W., Fu, P., Wang, Q., Li, J., Ge, X., Zhang, Q., Zhu, C., Ren, L., Xu, W., Zhao, J., Han, T., Worsnop, D. R., and Wang, Z.: Primary and secondary aerosols in Beijing in winter: sources, variations and processes, Atmos. Chem. Phys., 16, 8309–8329, https://doi.org/10.5194/acp-16-8309-2016, 2016.
Surratt, J. D., Gomez-Gonzalez, Y., Chan, A. W. H., Vermeylen, R., Shahgholi, M., Kleindienst, T. E., Edney, E. O., Offenberg, J. H., Lewandowski, M., Jaoui, M., Maenhaut, W., Claeys, M., Flagan, R. C., and Seinfeld, J. H.: Organosulfate formation in biogenic secondary organic aerosol, J. Phys. Chem. A, 112, 8345–8378, https://doi.org/10.1021/jp802310p, 2008.
Tai, A. P. K., Mickley, L. J., and Jacob, D. J.: Correlations between fine particulate matter (PM2.5) and meteorological variables in the United States: Implications for the sensitivity of PM2.5 to climate change, Atmos. Environ., 44, 3976–3984, https://doi.org/10.1016/j.atmosenv.2010.06.060, 2010.
Ulbrich, I. M., Canagaratna, M. R., Zhang, Q., Worsnop, D. R., and Jimenez, J. L.: Interpretation of organic components from Positive Matrix Factorization of aerosol mass spectrometric data, Atmos. Chem. Phys., 9, 2891–2918, https://doi.org/10.5194/acp-9-2891-2009, 2009.
Wallace, H. W., Sanchez, N. P., Flynn, J. H., Erickson, M. H., Lefer, B. L., and Griffin, R. J.: Source apportionment of particulate matter and trace gases near a major refinery near the Houston Ship Channel, Atmos. Environ., 173, 16–29, https://doi.org/10.1016/j.atmosenv.2017.10.049, 2018.
Watson, J. G.: Visibility: Science and regulation, J. Air Waste Manage., 52, 628–713, https://doi.org/10.1080/10473289.2002.10470813, 2002.
Wood, E. C., Canagaratna, M. R., Herndon, S. C., Onasch, T. B., Kolb, C. E., Worsnop, D. R., Kroll, J. H., Knighton, W. B., Seila, R., Zavala, M., Molina, L. T., DeCarlo, P. F., Jimenez, J. L., Weinheimer, A. J., Knapp, D. J., Jobson, B. T., Stutz, J., Kuster, W. C., and Williams, E. J.: Investigation of the correlation between odd oxygen and secondary organic aerosol in Mexico City and Houston, Atmos. Chem. Phys., 10, 8947–8968, https://doi.org/10.5194/acp-10-8947-2010, 2010.
Xu, L., Suresh, S., Guo, H., Weber, R. J., and Ng, N. L.: Aerosol characterization over the southeastern United States using high-resolution aerosol mass spectrometry: spatial and seasonal variation of aerosol composition and sources with a focus on organic nitrates, Atmos. Chem. Phys., 15, 7307–7336, https://doi.org/10.5194/acp-15-7307-2015, 2015.
Xu, W. Q., Han, T. T., Du, W., Wang, Q. Q., Chen, C., Zhao, J., Zhang, Y. J., Li, J., Fu, P. Q., Wang, Z. F., Worsnop, D. R., and Sun, Y. L.: Effects of Aqueous-Phase and Photochemical Processing on Secondary Organic Aerosol Formation and Evolution in Beijing, China, Environ. Sci. Technol., 51, 762–770, https://doi.org/10.1021/acs.est.6b04498, 2017.
Ying, Q., Li, J. Y., and Kota, S. H.: Significant Contributions of Isoprene to Summertime Secondary Organic Aerosol in Eastern United States, Environ. Sci. Technol., 49, 7834–7842, https://doi.org/10.1021/acs.est.5b02514, 2015.
Zhang, Q., Jimenez, J. L., Canagaratna, M. R., Ulbrich, I. M., Ng, N. L., Worsnop, D. R., and Sun, Y. L.: Understanding atmospheric organic aerosols via factor analysis of aerosol mass spectrometry: a review, Anal. Bioanal. Chem., 401, 3045–3067, https://doi.org/10.1007/s00216-011-5355-y, 2011.
Zhang, Q. J., Beekmann, M., Freney, E., Sellegri, K., Pichon, J. M., Schwarzenboeck, A., Colomb, A., Bourrianne, T., Michoud, V., and Borbon, A.: Formation of secondary organic aerosol in the Paris pollution plume and its impact on surrounding regions, Atmos. Chem. Phys., 15, 13973–13992, https://doi.org/10.5194/acp-15-13973-2015, 2015.
Zhu, Q., He, L.-Y., Huang, X.-F., Cao, L.-M., Gong, Z.-H., Wang, C., Zhuang, X., and Hu, M.: Atmospheric aerosol compositions and sources at two national background sites in northern and southern China, Atmos. Chem. Phys., 16, 10283–10297, https://doi.org/10.5194/acp-16-10283-2016, 2016.