the Creative Commons Attribution 4.0 License.
the Creative Commons Attribution 4.0 License.
 | 23 Jul 2019
The impact of aerosols on photolysis frequencies and ozone production in Beijing during the 4-year period 2012–2015
Wenjie Wang
Min Shao
Limin Zeng
Yusheng Wu
Tianyi Tan
During the period 2012–2015, photolysis frequencies were measured at the Peking University site (PKUERS), a site representative of Beijing. We present a study of the effects of aerosols on two key photolysis frequencies, j(O1D) and j(NO2). Both j(O1D) and j(NO2) display significant dependence on aerosol optical depth (AOD; 380 nm) with a non-linear negative correlation. With the increase in AOD, the slopes of photolysis frequencies vs. AOD decrease, which indicates that the capacity of aerosols to reduce the actinic flux decreases with AOD. The absolute values of slopes are equal to 4.2– and s−1 per AOD unit for j(O1D) and j(NO2) respectively at a solar zenith angle (SZA) of 60∘ and AOD smaller than 0.7, both of which are larger than those observed in a similar, previous study in the Mediterranean. This indicates that the aerosols in Beijing have a stronger extinction effect on actinic flux than absorptive dust aerosols in the Mediterranean. Since the photolysis frequencies strongly depended on the AOD and the SZA, we established a parametric equation to quantitatively evaluate the effect of aerosols on photolysis frequencies in Beijing. According to the parametric equation, aerosols lead to a decrease in seasonal mean j(NO2) by 24 % and 30 % for summer and winter, respectively, and a corresponding decrease in seasonal mean j(O1D) by 27 % and 33 %, respectively, compared to an aerosol-free atmosphere (AOD =0). Based on an observation campaign in August 2012, we used a photochemical box model to simulate the ozone production rate (P(O3)). The simulation results shows that the monthly mean daytime net ozone production rate is reduced by up to 25 % due to the light extinction of aerosols. Through further in-depth analysis, it was found that particulate matter concentrations maintain a high level under the condition of high concentrations of ozone precursors (volatile organic compounds, VOCs, and NOx), which inhibits the production of ozone to a large extent. This phenomenon implies a negative feedback mechanism in the atmospheric environment of Beijing.
- Article
(3677 KB) -
Supplement
(382 KB) - BibTeX
- EndNote


Solar radiation plays an important role in atmospheric photochemistry, driving the photolysis of many key species. The photolysis of ozone (O3), gaseous nitrous acid (HONO), and carbonyl species, contributes to the primary production of HOx (Volkamer et al., 2010). The photolysis of ozone produces O1D, which then reacts with H2O to form OH radicals; these radicals are the main source of OH radicals in the troposphere, as shown by Reactions (R1) and (R2). The strong dependence of OH concentration on j(O1D) was found in a number of field measurements (Ehhalt and Rohrer, 2000; Rohrer et al., 2014; Stone et al., 2012). In addition, the photolysis of NO2 produces O3P, and then O3P reacts with O2 to produce O3, as shown by Reactions (R3) and (R4), which is the only significant chemical source of ozone in the troposphere (Finlayson-Pitts and Pitts, 2000). The photolysis frequencies of Reactions (R1) and (R3) are j(O1D) and j(NO2), respectively.
The photolysis frequencies are calculated by the following formula:
F(λ) is the actinic flux dependent on wavelength. Since the photolysis rates are proportional to the actinic flux, and not all stations acquire a 2π spectroradiometer or chemical actinometer for J measurements, several methods have been developed to determine actinic flux and photolysis frequencies from ground-based measurements of irradiance (Kylling et al., 2003; Kazadzis et al., 2000, 2004; Topaloglou et al., 2005; Trebs et al., 2009). σ(λ,T) is the absorption cross section of the species that is absorbed in the wavelength range λ1-λ2. φ(λ,T) is the quantum yield of the photodissociation reaction product. λ and T represent wavelength species and temperature, respectively.
The effect of aerosols on photolysis frequencies depends on the aerosol optical properties, solar zenith angle (SZA), and altitude (Liao et al., 1999). The aerosol optical depth (AOD) characterizes the integral of the extinction coefficient of aerosols in the vertical direction. The light extinction of aerosols includes scattering and absorption, which have different effects on the actinic flux. Previous studies showed that scattering aerosols can enhance the actinic flux throughout the troposphere, while absorptive aerosols reduce the actinic flux throughout the boundary layer (Jacobson, 1998; Dickerson et al., 1997; Castro et al., 2001; Flynn et al., 2010). To distinguish between these two components, single scattering albedo (SSA) is defined as the ratio of the scattering coefficient to the total extinction coefficient. In areas with severe aerosol pollution, aerosols can significantly affect photolysis frequencies and ozone production. Studies in Los Angeles (Jacobson, 1998), Mexico City (Castro et al., 2001; Raga et al., 2001; Li et al., 2011), São Paulo (de Miranda et al., 2005), Houston (Flynn et al., 2010), Europe (Real and Sartelet, 2011), and Russia (Péré et al., 2015) have found that aerosols reduce ozone concentration by 5 %–30 % by attenuating photolysis frequencies. Studies in the eastern United States have shown that scattering aerosols increase ozone concentration by 5 %–60 % by increasing the photolysis frequencies (Dickerson et al., 1997; He and Carmichael, 1999). Therefore, it is necessary to quantitatively evaluate the effect of aerosols on photolysis frequencies for a better understanding of ozone formation under highly polluted conditions.
Currently, the methods for quantitatively evaluating the influence of aerosols on photolysis frequencies mainly include the radiative transfer model and the parameterization method (Madronich, 1993). The radiative transfer model is based on an algorithm for calculating solar radiation and photolysis frequencies (Madronich and Flocke, 1999). The observed data of related influential factors of the photolysis frequencies are taken as the model's input to calculate the photolysis frequencies. This method comprehensively considers the influence of aerosol optical properties on the photolysis frequencies, but it does not necessarily reflect the true quantitative relationship in the atmosphere due to complicated environmental conditions, and thus the simulated results do not necessarily reproduce observed values well (Lefer et al., 2003; Shetter, 2003; Hofzumahaus et al., 2004). For example, the simulated slope of j(O1D) vs. AOD by the Fast-JX algorithm within the CHIMERE model was significantly smaller than the observed slope, particularly for the high SZA values (Mailler et al., 2016). The parameterization method is based on the observation data taken from a certain region and is used to establish the parameterized relationship between the photolysis frequencies and optical properties of aerosols (such as AOD). The method can reflect the actual atmospheric environment conditions; it also considers less influential factors and thus is easy to apply (Casasanta et al., 2011; Gerasopoulos et al., 2012). The disadvantage of this method is that the established parametric equations apply only to a specific region and cannot be extended to other regions.
With rapid economic development and urbanization in past decades, China's atmospheric pollution has become more and more severe, characterized by high concentrations of particulate matter and ozone. Satellite observations indicate that both the particulate matter and the ozone of eastern China are at higher levels compared with other locations around the globe (Verstraeten et al., 2015; Ma et al., 2014). Levels of pollution in the Beijing–Tianjin–Hebei region are even more severe (Chang et al., 2009; Che et al., 2008; Zhang et al., 2014, 2016). Therefore, it is necessary to study the effects of aerosols on photolysis frequencies and ozone production in the urban areas of China.
Previous model studies have shown that aerosols in China can affect ozone production by changing the photolysis frequencies. Tang et al. (2004) used a sulfur transmission–emission model (STEM) to discover that ozone concentration in north-eastern China was reduced by 0.1 %–0.8 % in the sandstorm due to the change in photolysis frequencies. Tie et al. (2005) used a global aerosol–chemical model to show that aerosols caused j(O1D) and j(NO2) to decrease in winter by 20 %–30 % and 10 %–30 %, respectively, and in summer by 5 %–20 % and 1 %–10 %, respectively, resulting in 2 %–5 % and 2 % reductions in ozone concentration in winter and summer, respectively. Li et al. (2011) used an air quality model to estimate the changes in the photolysis frequencies caused by sulfate, nitrate, ammonium, and mineral dust aerosols in the central and eastern regions of China from 1 June to 12 June 2006. This study showed that the daily average j(O1D) in the troposphere at altitudes of 1, 3, and 10 km from the ground was reduced by 53 %, 37 %, and 21 %, respectively, resulting in a decrease in the ozone concentration by 5.4 %, 3.8 %, and 0.10 % in the three layers. Lou et al. (2014) found that with aerosols, annual mean photolysis frequencies, j(O1D)) and j(NO2), were simulated to be reduced by 6 %–18 % in polluted eastern China, leading to reductions in O3 of up to 0.5 ppbv in those regions in spring and summer using a global chemical transport model (GEOS-Chem). However, all of these studies base their results on model simulations. Research using long-term observational data to evaluate the effects of aerosols on photolysis frequencies and ozone production in China has not yet been published.
Our overall goal is to quantitatively evaluate the effect of aerosols in Beijing on photolysis frequencies and thus on ozone production. First, the relationship between PM2.5 and AOD was investigated. Second, based on long-term observations (2012–2015) of photolysis frequencies, we discussed the impact of AOD on photolysis frequencies (j(O1D) and j(NO2)) in Beijing in detail. The relationship between photolysis frequencies and AOD is adequately compared with a previous study in the Mediterranean (Casasanta et al., 2011; Gerasopoulos et al., 2012). Then, the quantitative relationship between photolysis frequencies, AOD, and SZA was acquired by the parameterization method, which could be used to quantitatively evaluate the effect of AOD on photolysis frequencies in Beijing. Finally, a photochemistry box model was used to evaluate the effect of aerosols on ozone production.
2.1 Measurement
From August 2012 to December 2015, j(O1D) and j(NO2) were measured continuously at the Peking University site (PKUERS). The data of the period during October 2012 to March 2013 and August 2015 are missed due to instrument maintenance and other measurement campaigns. The site (39.99∘ N, 116.31∘ E) is located on the sixth floor of a campus building at Peking University, 20 km north-west of Tiananmen Square. The height from the ground is about 30 m. The sampling point is surrounded by classroom buildings. Concentration level and composition of air pollutants were thought to be similar to the downtown area and thus representative of the whole of Beijing (Wang et al., 2010; Xu et al., 2011; Zhang et al., 2012, 2014).
The actinic flux was measured using a spectroradiometer, and the photolysis frequencies were calculated from the absorption cross section and quantum yield of each species (Shetter and Müller, 1999). The spectroradiometer consisted of a single monochromator with a fixed grating (Carl Zeiss), an entrance optic with a 2π steradian (sr) solid angle quartz diffusor, and a 2048 pixel × 64 pixel photodiode array detector. The spectral measurements were performed with a wavelength resolution of 2 nm, covering a wavelength range of 290–650 nm (Hofzumahaus et al., 1999). A 1000 W National Institute of Standard and Technology (NIST) traceable lamp was used for calibration under laboratory conditions (Bohn et al., 2008). The measured spectra were corrected for dark signal and stray light. For j(O1D), the quantum yields used were taken from Matsumi et al. (2002), while the ozone cross section was derived from Daumont et al. (1992) and Malicet et al. (1995). Measured temperatures were used to retrieve the ozone absorption cross section and quantum yield. For j(NO2), absorption cross sections by Merienne et al. (1995) and quantum yields by Troe (2000) were used. The calculated photolysis frequencies had a time resolution of 10 s and an accuracy of ±10 % including uncertainties associated with the quartz receiver and stray-light effects (Edwards and Monks, 2003).
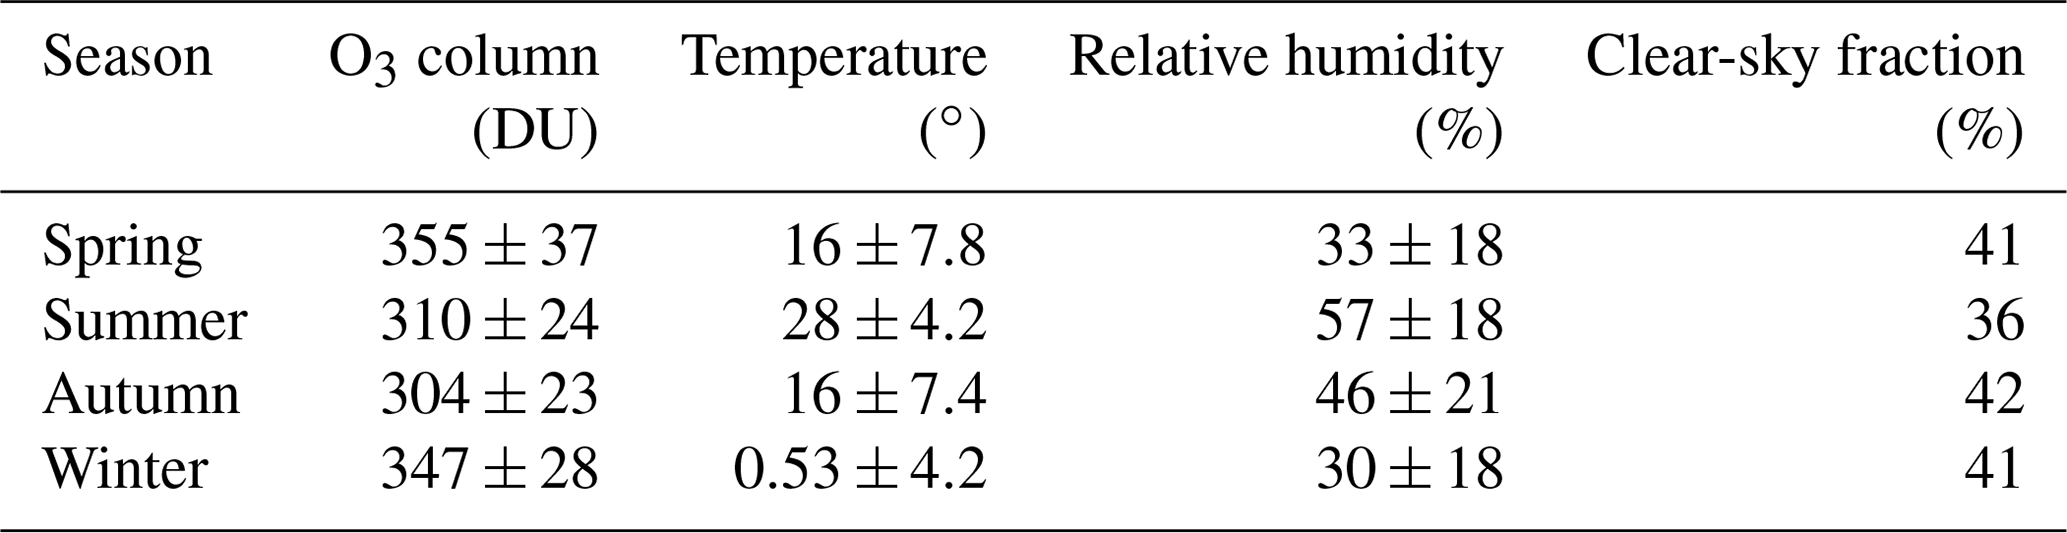
The optical properties of aerosols were measured by a CIMEL solar photometer (AERONET level 2 data collection; http://aeronet.gsfc.nasa.gov/, last access: 1 august 2018), and the site selected is the Beijing-CAMS site (39.93∘ N, 116.32∘ E), which is 6.4 km from PKUERS. The CIMEL solar photometer is an automatic solar-sky scanning radiometer that uses selected spectral channels. The instrumentation, data acquisition, retrieval algorithms, and calibration procedure conform to the standards of the global AErosol RObotic NETwork (AERONET) and have been described in detail by Fotiadi et al. (2006). The solar extinction measurement was performed every 3 min in the spectral range 340–1020 nm for the calculation of AOD at wavelengths 340, 380, 440, 500, 675, 870, 970, and 1020 nm. Under cloudless conditions, the overall uncertainty of AOD data is ±0.01 at λ >440 nm and ±0.02 at shorter wavelengths. In this study, AOD at the wavelength of 380 nm was chosen for analysis. This wavelength was selected as it is more representative of j(NO2). Additionally, at this wavelength we can better compare AOD with the results of Gerasopoulos et al. (2012). The daytime clear-sky conditions were identified according to the presence of AOD data of AERONET since AOD data are unavailable under cloudy conditions. The Ångström exponent (AE) and SSA (440 nm) were also acquired from AERONET. In addition, the SSA (525 nm) data were derived from a field campaign undertaken in August 2012. The absorption and scattering coefficients were measured with an aethalometer (AE-31, Magee) and a Single Wavelength Integrating Nephelometer (Aurora-1000), respectively, with a time resolution of 1 min. As aerosol particles were dried by decreasing relative humidity (RH) to <40 % when SSA was measured, we used the measured hygroscopic factor (Liu et al., 2009) and measured RH to correct the SSA. The 5 min averages of AOD, SSA, and photolysis frequencies were analysed in this study. The total ozone column was obtained by OMI (Ozone Monitoring Instrument) for the years 2012–2015, using overpass data (http://www.temis.nl/protocols/O3global.html, last access: 1 August 2018) (Eskes et al., 2003). In addition, meteorological parameters such as temperature, relative humidity, and pressure were simultaneously observed at this site. Table 1 presents total O3 column, temperature, relative humidity, daytime clear-sky fraction, and respective standard deviation for different seasons.
Table 1O3 column concentration, temperature, relative humidity, daytime clear-sky fraction and respective standard deviation for different seasons (spring: March, April, and May; summer: June, July, and August; autumn: September, October, and November; winter: December, January, and February).
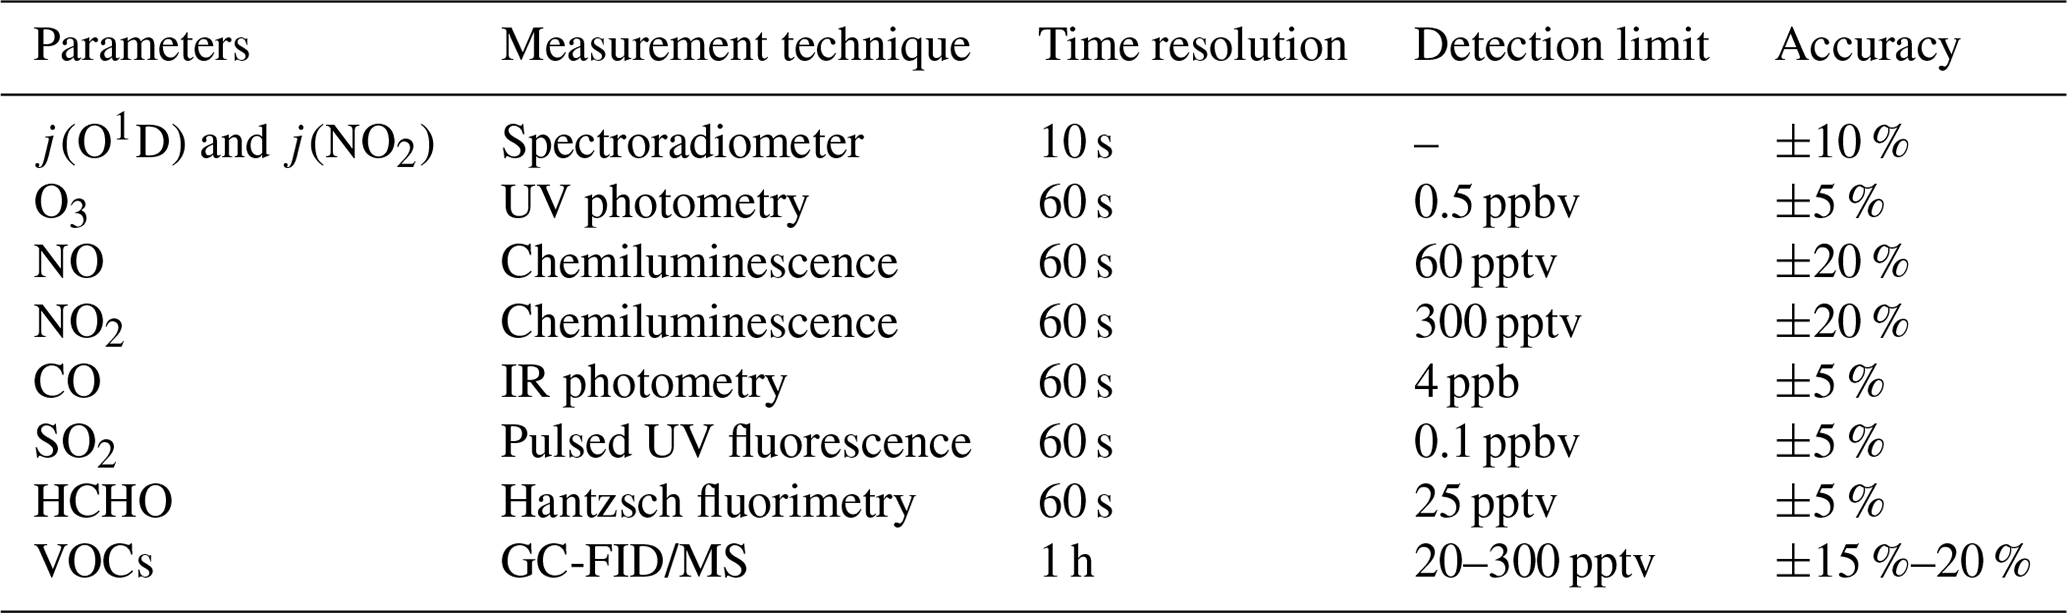
The analysis of the effects of aerosols on ozone production (Sect. 3.4) was based on the field campaign undertaken in August 2012. The relevant contents and methods of observation are shown in Table 2. Since the time resolution of volatile organic compounds (VOCs) is 1 h, all data analysed in Sect. 3.4 were processed as 1 h average values. In this study, we focused on the effects of aerosols on photolysis frequencies and ozone production under cloudless conditions.
Table 2Instruments deployed in the field campaign undertaken in August 2012 and used for data analysis.
2.2 Radiative transfer model description
We use the Tropospheric Ultraviolet and Visible (TUV) radiation model (version 5.3) provided by Sasha Madronich (Madronich, 1993). In order to solve the radiative transfer equation, TUV uses the discrete-ordinate algorithm (DISORT) with four streams and calculates the actinic flux spectra with a wavelength range of 280–420 nm in 1 nm steps and resolution. Measured temperatures were used to calculate the absorption cross sections and quantum yields. The key aerosol optical properties including AOD, SSA, and AE were input into the model to test the effect of aerosols on photolysis frequencies. AE(380∕550 nm) is taken from AERONET, and the mean value of 1.2 during June 2012–December 2015 is used in the TUV model.
2.3 Photochemical box model
The photochemical box model used in this study is based on a regional atmospheric chemical mechanism (RACM2) described by Goliff et al. (2013). The mechanism includes 17 stable inorganic compounds, 4 intermediate inorganic compounds, 55 stable organic compounds, and 43 intermediate organic compounds. Compounds not specifically treated in RACM2 are incorporated into species with similar functional groups. The isoprene-related mechanism used in this model is the LIM mechanism proposed by Peeters et al. (2009). In this study, the observed NO2, CO, SO2, C2−C12 non-methane hydrocarbons (NMHCs), HCHO, photolysis frequencies, temperature, pressure, and relative humidity were used as constraints to simulate the concentrations of reactive radicals (RO2, HO2, and OH), intermediate species, and associated reaction rate constants. HONO was not measured during the period and was calculated according to the concentration of NO2 and the observed ratio of HONO to NO2 at a site in Beijing, which had a marked diurnal cycle, a maximum in the early morning (ratio values up to ∼0.05–0.08 in summer) and a decrease during daytime to values around 0.01–0.02 (Hendrick et al., 2014). The model was spun up for 2 d once it started running in order to ensure that the simulation was stable. It was assumed that the lifetime of simulated species removed by dry deposit was 24 h. The lifetime corresponds to the assumed deposit rate of 1.2 cm s−1 and a well-mixed boundary layer height of about 1 km (Lu et al., 2012). Net ozone production is equal to the reaction rate between peroxy radicals (RO2 and HO2) and NO minus the loss rate of NO2 and O3 as shown in Eqs. (2), (3), and (4) as derived by Mihelcic et al. (2003). The ozone production rate (P(O3)), the ozone loss rate (D(O3)), and the net P(O3) were calculated from the simulation results.
where θ is the fraction of O1D from ozone photolysis that reacts with water vapour, and i and j represent the number of species of RO2 and alkenes, respectively.
3.1 The correlation between PM2.5 and AOD
Compared with AOD, PM2.5 is a more common proxy for evaluating the level of particulate matter pollution in spite of AOD being a more closely related parameter of photolysis frequencies. As a result, we attempted to analyse the quantitative relationship between PM2.5 and AOD to evaluate the influence of PM2.5 on AOD and thus on photolysis frequencies. The factors that affect this relationship include aerosol type, aerosol size distribution, aerosol distribution in the vertical direction, relative humidity (RH), and planetary boundary layer height (PBLH) (van Donkelaar et al., 2010). Figure 1 shows the correlation between AOD and PM2.5 in four different seasons. The determination coefficient (r2) is 0.53, 0.58, 0.62, and 0.59 for spring (March, April, and May), summer (June, July, and August), autumn (September, October, and November), and winter (December, January, and February), respectively. Meanwhile, the correlation exhibits significant seasonal differences, having a relatively smaller slope (23.56) in summer and a relatively larger slope (73.76) in winter. This implies that PM2.5 in summer has a stronger light extinction capacity than in winter. One reason for the seasonal differences is the variation in RH among different seasons (Table 1). There is higher RH in summer (57.2 % on average) than in winter (30.4 % on average), leading to stronger hygroscopic growth of aerosol particles and thus resulting in a higher scattering ability of aerosol particles. According to another study in Beijing, the higher the RH, the smaller the slope, and the higher the PBLH, the smaller the slope (Zheng et al., 2017). In addition, the slope was smaller for scattering-dominant aerosols than for absorbing-dominant aerosols and smaller for coarse-mode aerosols than for fine-mode aerosols (Zheng et al., 2017). The slopes of the correlation between AOD (at 550 nm) and PM2.5 in this study in summer and winter are equal to 42.2 and 119.2 µg m−3, respectively, close to those from Ma et al. (2016) (54.9 and 110.5 µg m−3) and Xin et al. (2016) (55.2 and 93.4 µg m−3) but significantly smaller than those from Zheng et al. (2017) (65–74 µg m−3 and 143–158 µg m−3). The differences mainly depend on the aerosol composition and size distribution at different observational sites in Beijing. Compared with other cities in North China (Tianjin, Shijiazhuang, and Baoding) (Ma et al., 2016), the slope in Beijing for winter is significantly higher. Consequently, using PM2.5 to estimate AOD has a large uncertainty due to multiple interference factors.
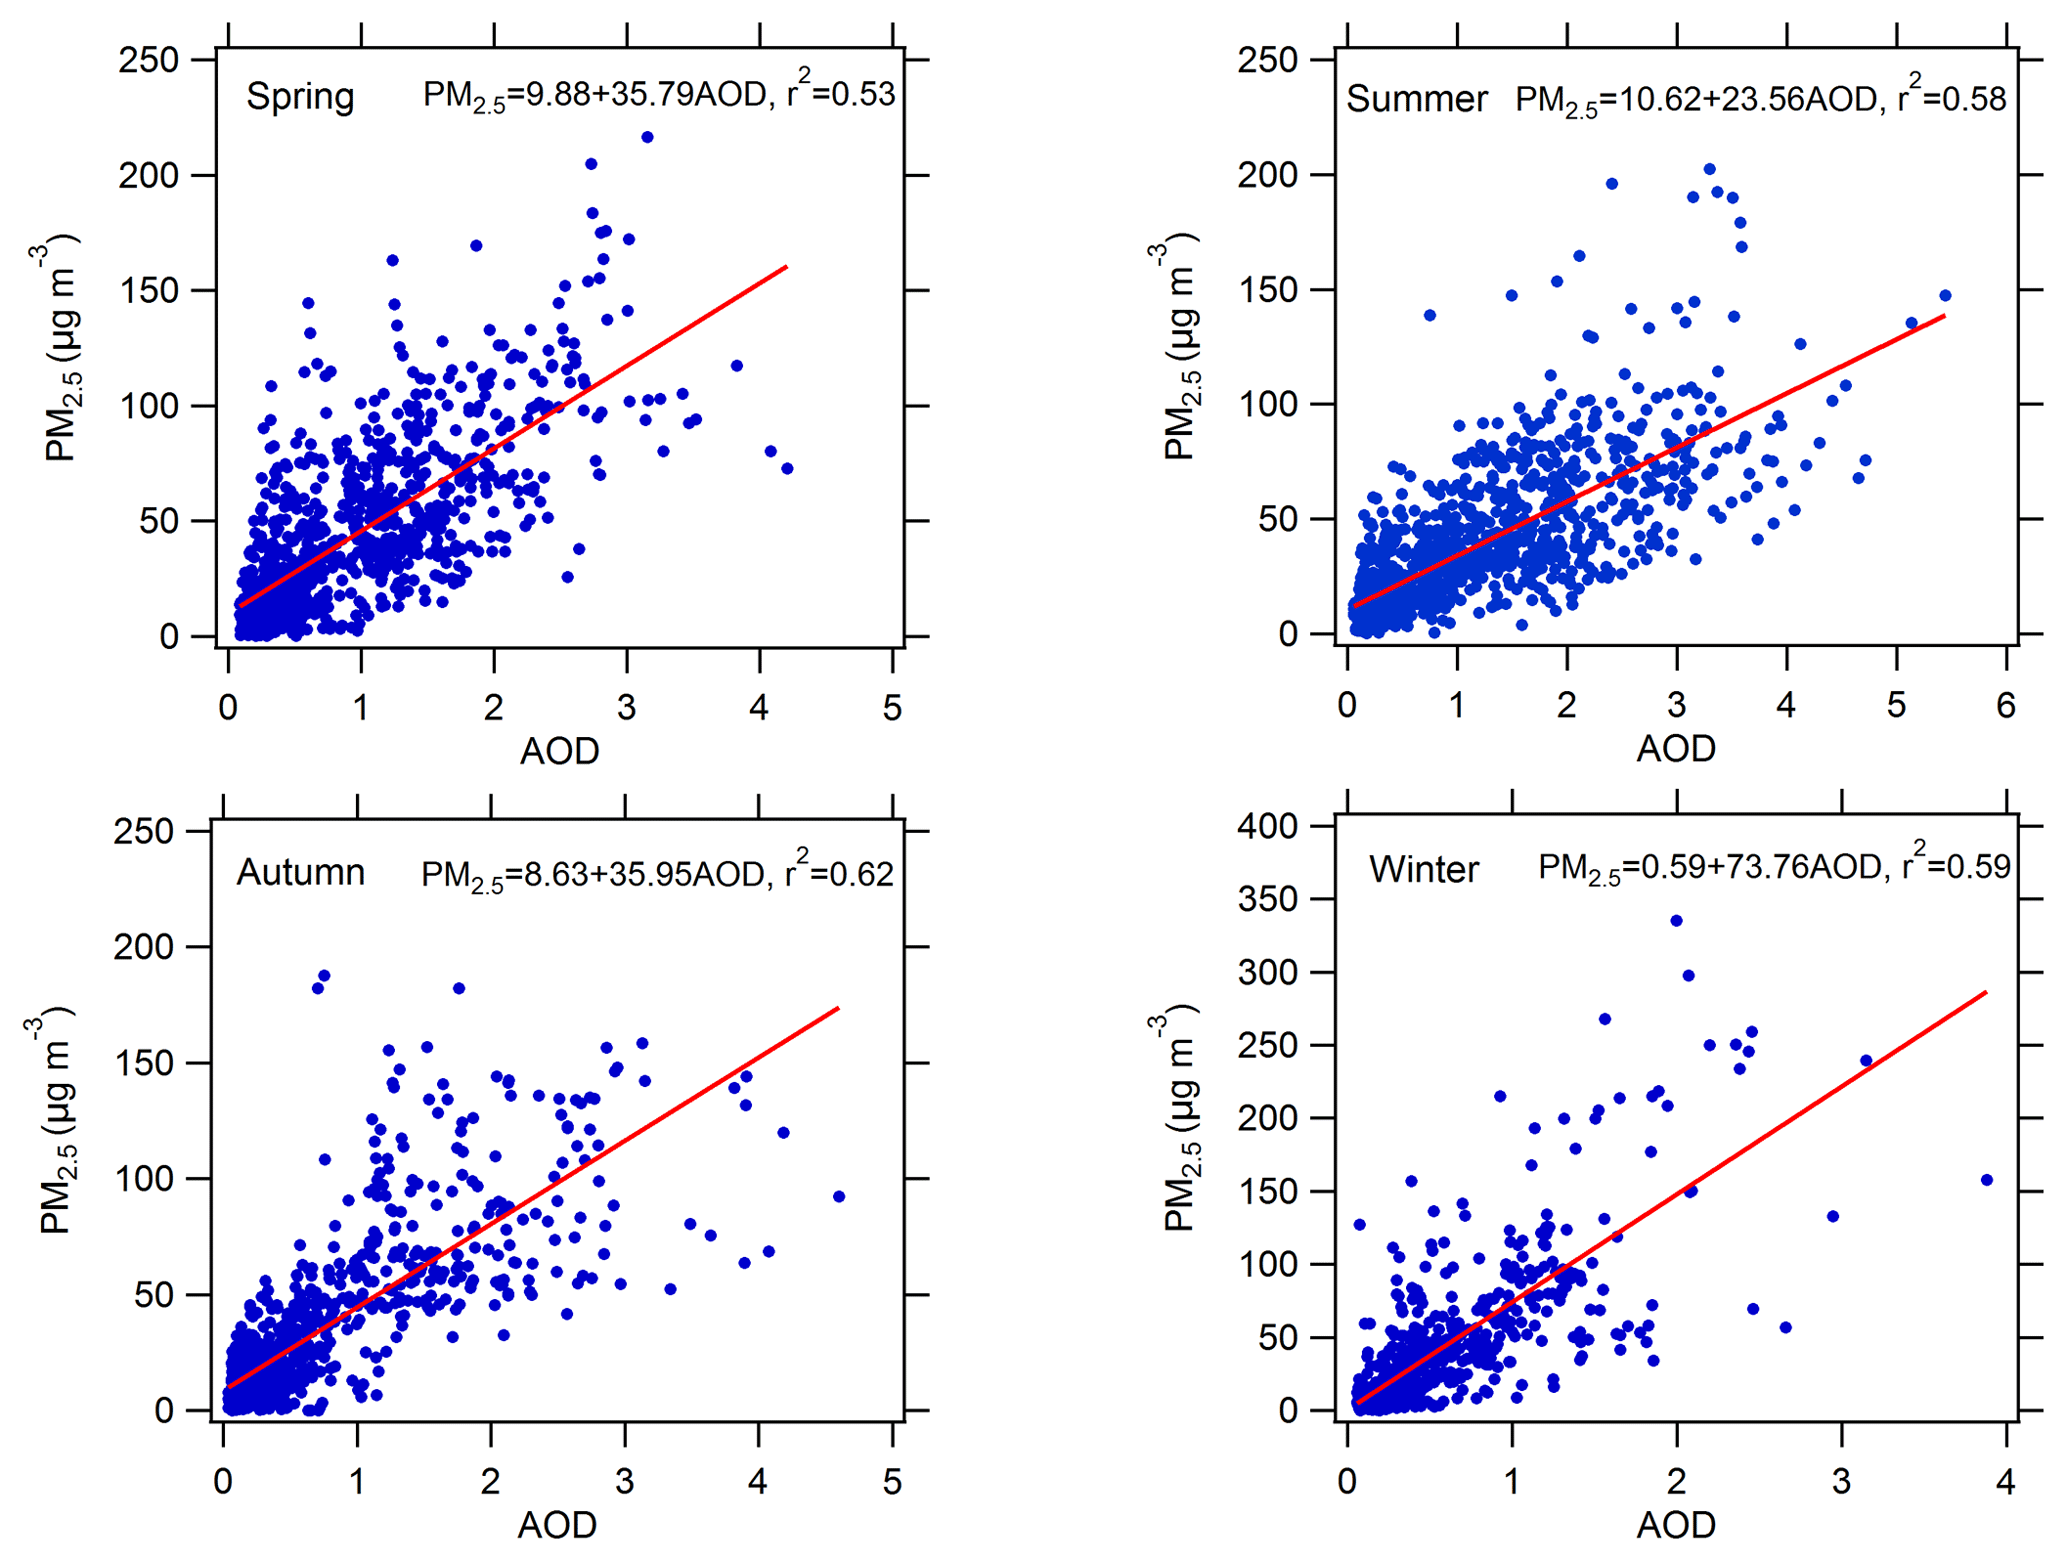
Figure 1Scatter plots between AOD at 380 nm and PM2.5 in four different seasons. The slope, intercept, and determination coefficient (r2) were calculated.
3.2 Seasonal and diurnal variability of AOD and photolysis frequencies
The diurnal cycles of AOD are shown in Fig. 2. AOD displays obvious diurnal variation, with a relatively high level at noon and a low level at dawn and in the evening. The diurnal variation of PM2.5 is significantly different from AOD. In addition, AOD has obvious seasonal differences, with the highest AOD in summer and the lowest AOD in winter. Conversely, PM2.5 in winter (42 µg m−3) is significantly higher than in summer (35 µg m−3). In spite of lower PM2.5 in summer, AOD in summer is higher due to the stronger extinction capacity of PM2.5 as discussed in Sect. 3.1. Figure 3 shows the diurnal variation of the photolysis frequencies under cloudless conditions for each season. j(O1D) and j(NO2) are both highest in summer, followed by spring and autumn, and lowest in winter. This seasonal difference is mainly determined by the difference in SZA for the four seasons.

Figure 2Diurnal cycles of (a) mean AOD and (b) mean PM2.5 in the four seasons under cloudless conditions.
The observed mean daily maxima of photolysis frequencies at this site are lower than those observed in the eastern Mediterranean (Crete, Greece; N, E) (Gerasopoulos et al., 2012) by and s−1 for j(O1D) and and s−1 for j(NO2), in summer and winter respectively. The corresponding lower photolysis frequencies of Beijing than the eastern Mediterranean due to SZA difference are and s−1 for j(O1D) and and s−1 for j(NO2) according to the TUV model under aerosol-free conditions, which are significantly lower than observed decreased magnitudes. Additionally, we know that the temperature is lower in Beijing during the winter compared to conditions in Crete. The measured mean temperature in Beijing during winter is equal to 0.53±4.2∘ (Table 1). When we consider the temperature in Crete is 10∘ higher than in Beijing, the lower j(O1D) of Beijing than Crete is s−1, which is also not able to compensate for the j(O1D) gap between the two sites during winter. Taking into account the similar levels of ozone column concentration in the two sites, the large gap of photolysis frequencies in the two sites is mainly attributed to the higher AOD in Beijing (0.76±0.75) than in the eastern Mediterranean (0.27±0.13).
It can be seen from Fig. 3 that the difference between winter and summer for j(O1D) is significantly larger than that for j(NO2), for which the summer midday averages of j(O1D) and j(NO2) are 5 times and 2 times those of winter, respectively. There are two reasons for this phenomenon. One, compared with j(NO2), j(O1D) is more sensitive to the change in SZA, and the same change in SZA results in a larger change in j(O1D) than j(NO2). Two, the main influential factors of j(NO2) under cloudless conditions are SZA and AOD, and the influence of ozone column concentration and temperature on j(NO2) is negligible. However, j(O1D) is significantly affected by the ozone column concentration and temperature, in addition to SZA and AOD. The higher ozone column concentration and lower temperature in winter than in summer lead to the difference in j(O1D) further increasing (Table 1).
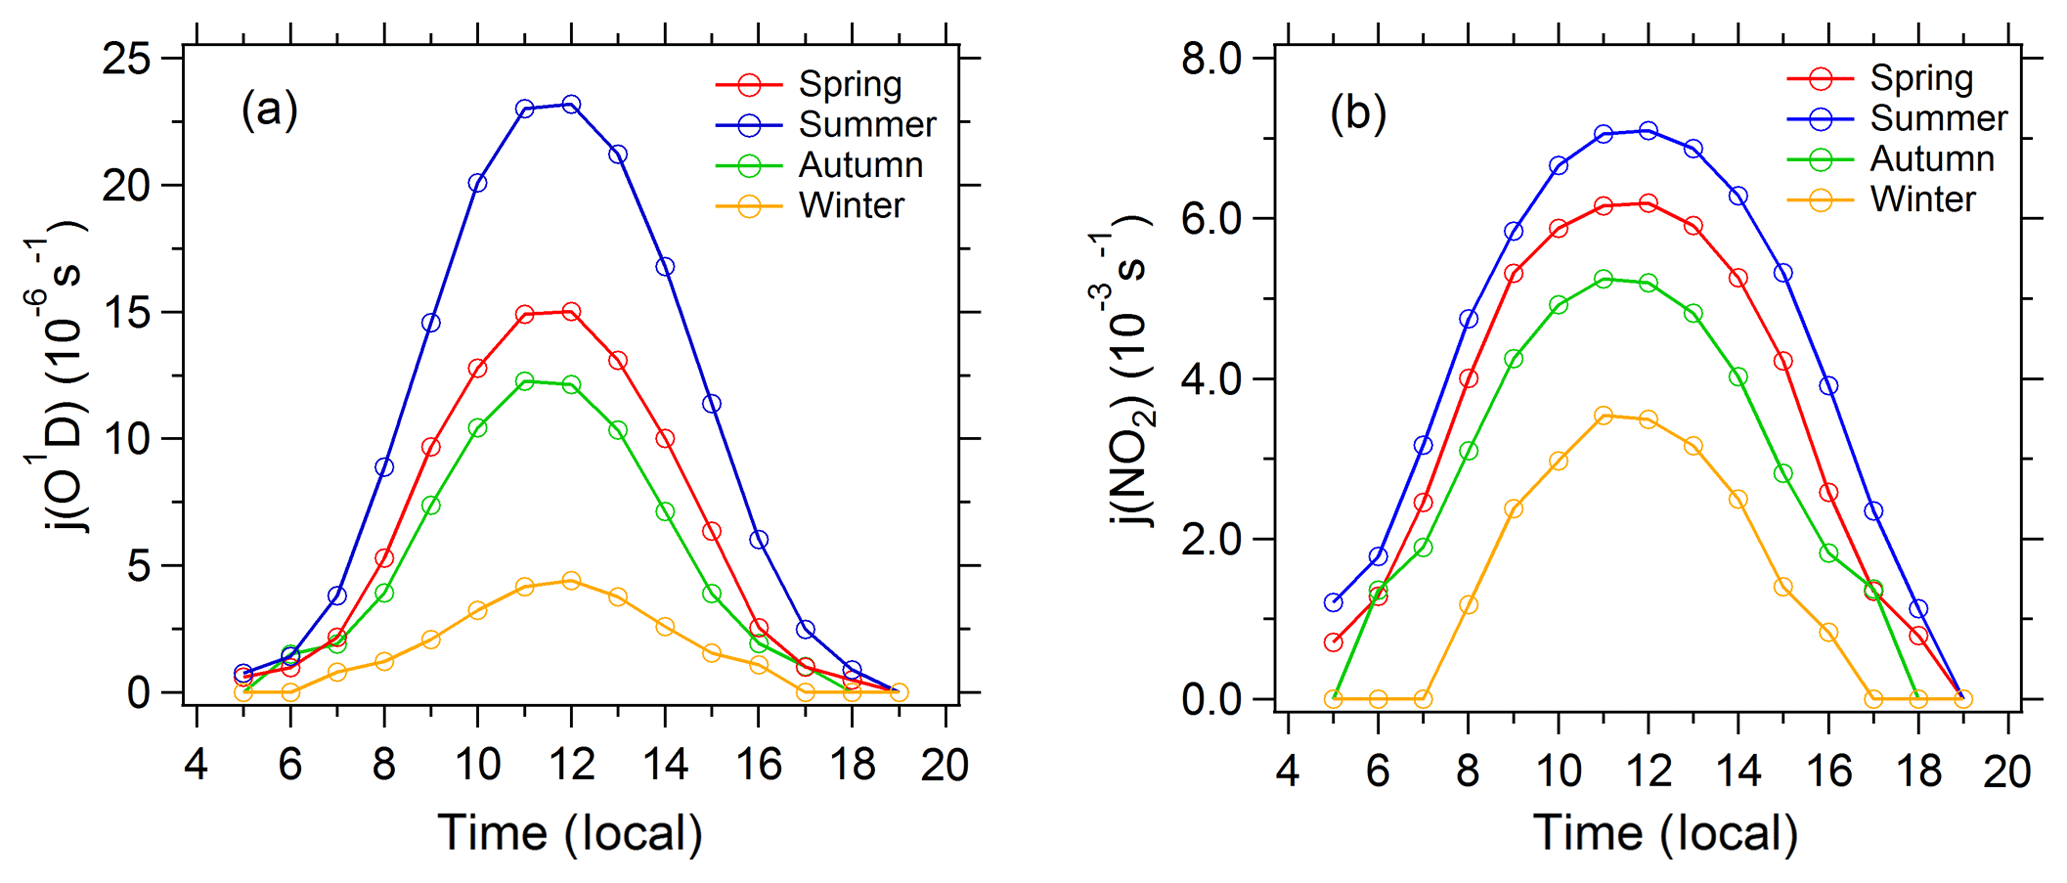
Figure 3Diurnal cycles of (a) mean j(O1D) and (b) mean j(NO2) in the four seasons under cloudless conditions.
3.3 The correlation between photolysis frequencies and AOD
3.3.1 The correlation between j(O1D) and AOD
In order to rule out the effect of SZA on photolysis frequencies, we chose SZAs equal to 30 and 60∘ () for analysis. Figure 4 presents the dependence of j(O1D) on AOD at different levels of ozone column concentration at SZAs of 30 and 60∘ (). The ozone column concentration has a classification width of 30 DU. This relatively large classification width is chosen to make sure that there are enough points to fit the relationship between j(O1D) and AOD. j(O1D) exhibits a clear dependence on AOD, with a non-linear negative correlation. The scatter of these points is mainly due to variations in ozone column and temperature. As AOD increased, the slope of j(O1D)-AOD gradually decreases, indicating that the ability of aerosols to reduce j(O1D) gradually decreases with AOD. This result differs from that found in Mediterranean, where j(O1D) was linearly negatively correlated with AOD (Casasanta et al., 2011; Gerasopoulos et al., 2012). A larger variation range of AOD in Beijing (0–3) compared with Mediterranean (0–0.6) is one reason for the difference.
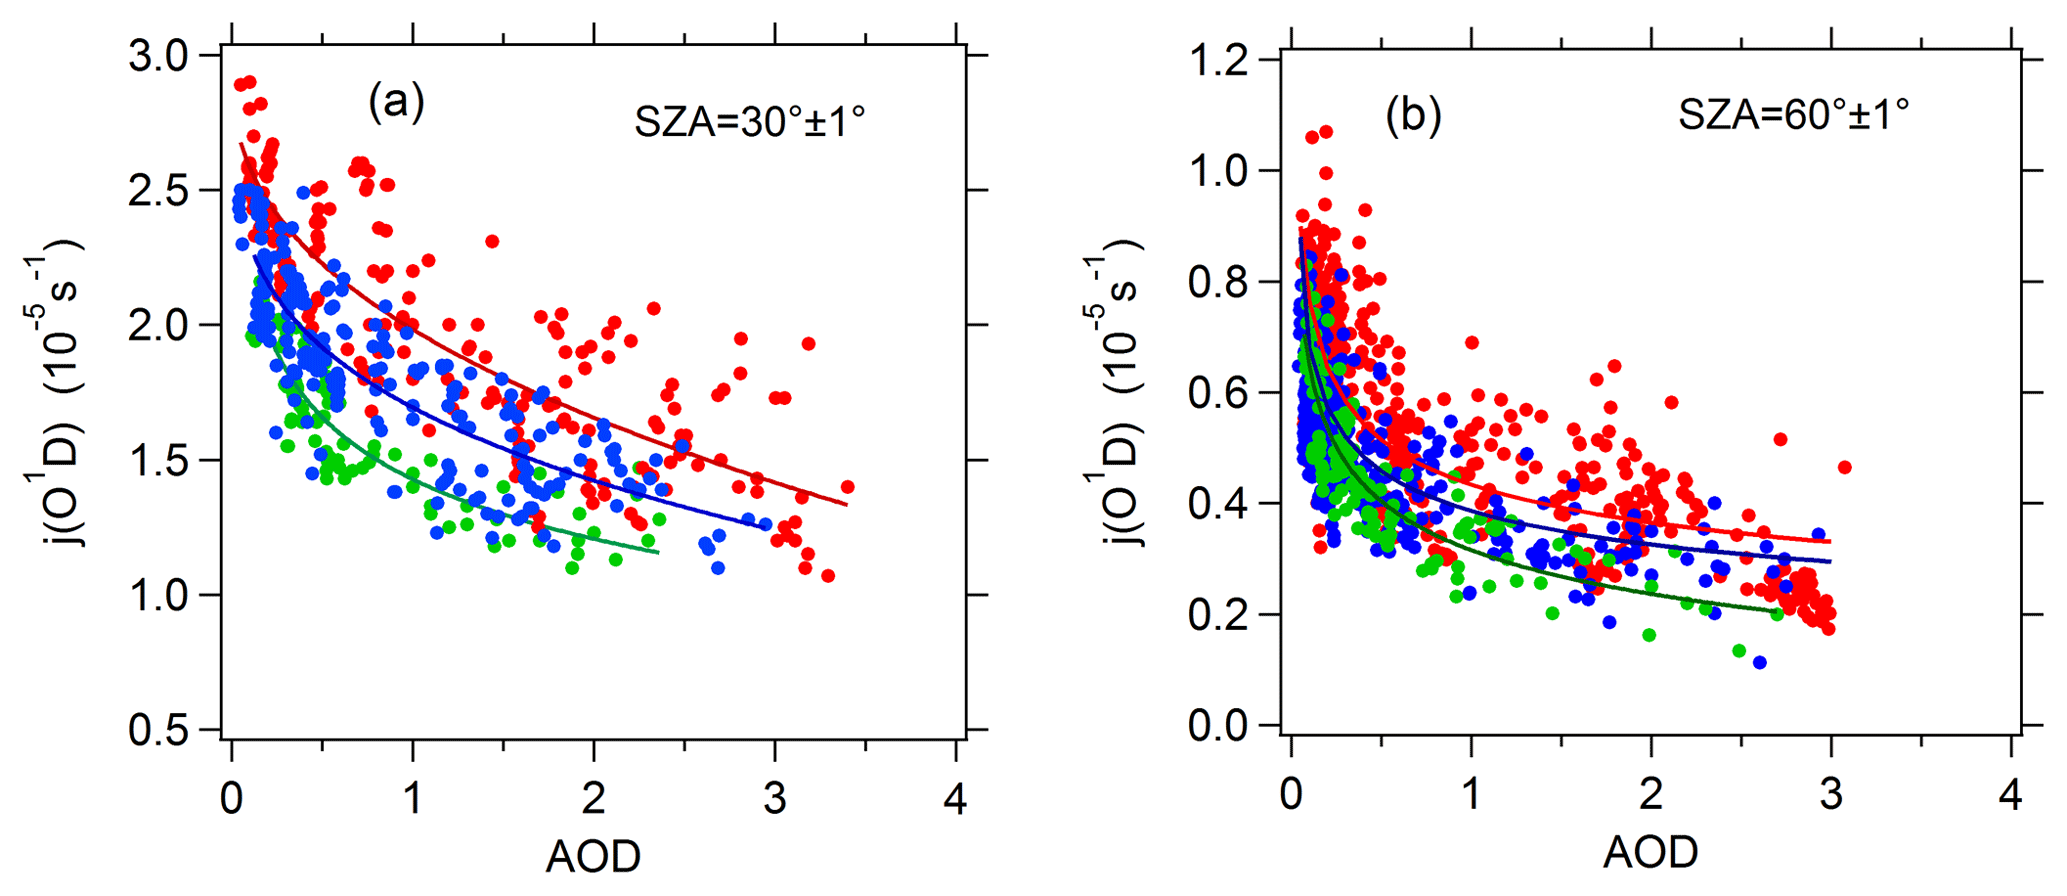
Figure 4Dependence of j(O1D) on AOD (380 nm) at SZAs of (a) 30∘ and (b) 60∘ and at different classes of ozone column concentration: 300–330 DU (red), 330–360 DU (blue), and 360–390 DU (green). The full lines are fitted by the exponential function.
For further analysis, the observed relation between j(O1D) and AOD was compared with TUV-simulated results. Panels (a) and (b) of Fig. 5 present the comparison between observed and TUV-simulated j(O1D) against AOD at a SZA of 30 and 60∘ respectively and ozone column concentration of 330–360 DU. The observed j(O1D) was at ozone column of 330–360 DU and were scaled to the temperature of 298 K. AE(380∕550 nm) =1.2, ozone column =345 and temperature =298 K were used in TUV model for all simulations. Mean Earth–Sun distance was used in the calculations of TUV model and measured j values were scaled to the mean Earth–Sun distance. At low AOD level (<0.8), the observed slope of j(O1D) vs. AOD is significantly larger than the simulated slope at a SSA of 0.95 and slightly larger than the simulated slope at a SSA of 0.85. With AOD increasing, the observed slope decreases rapidly to the level smaller than the simulated slopes.
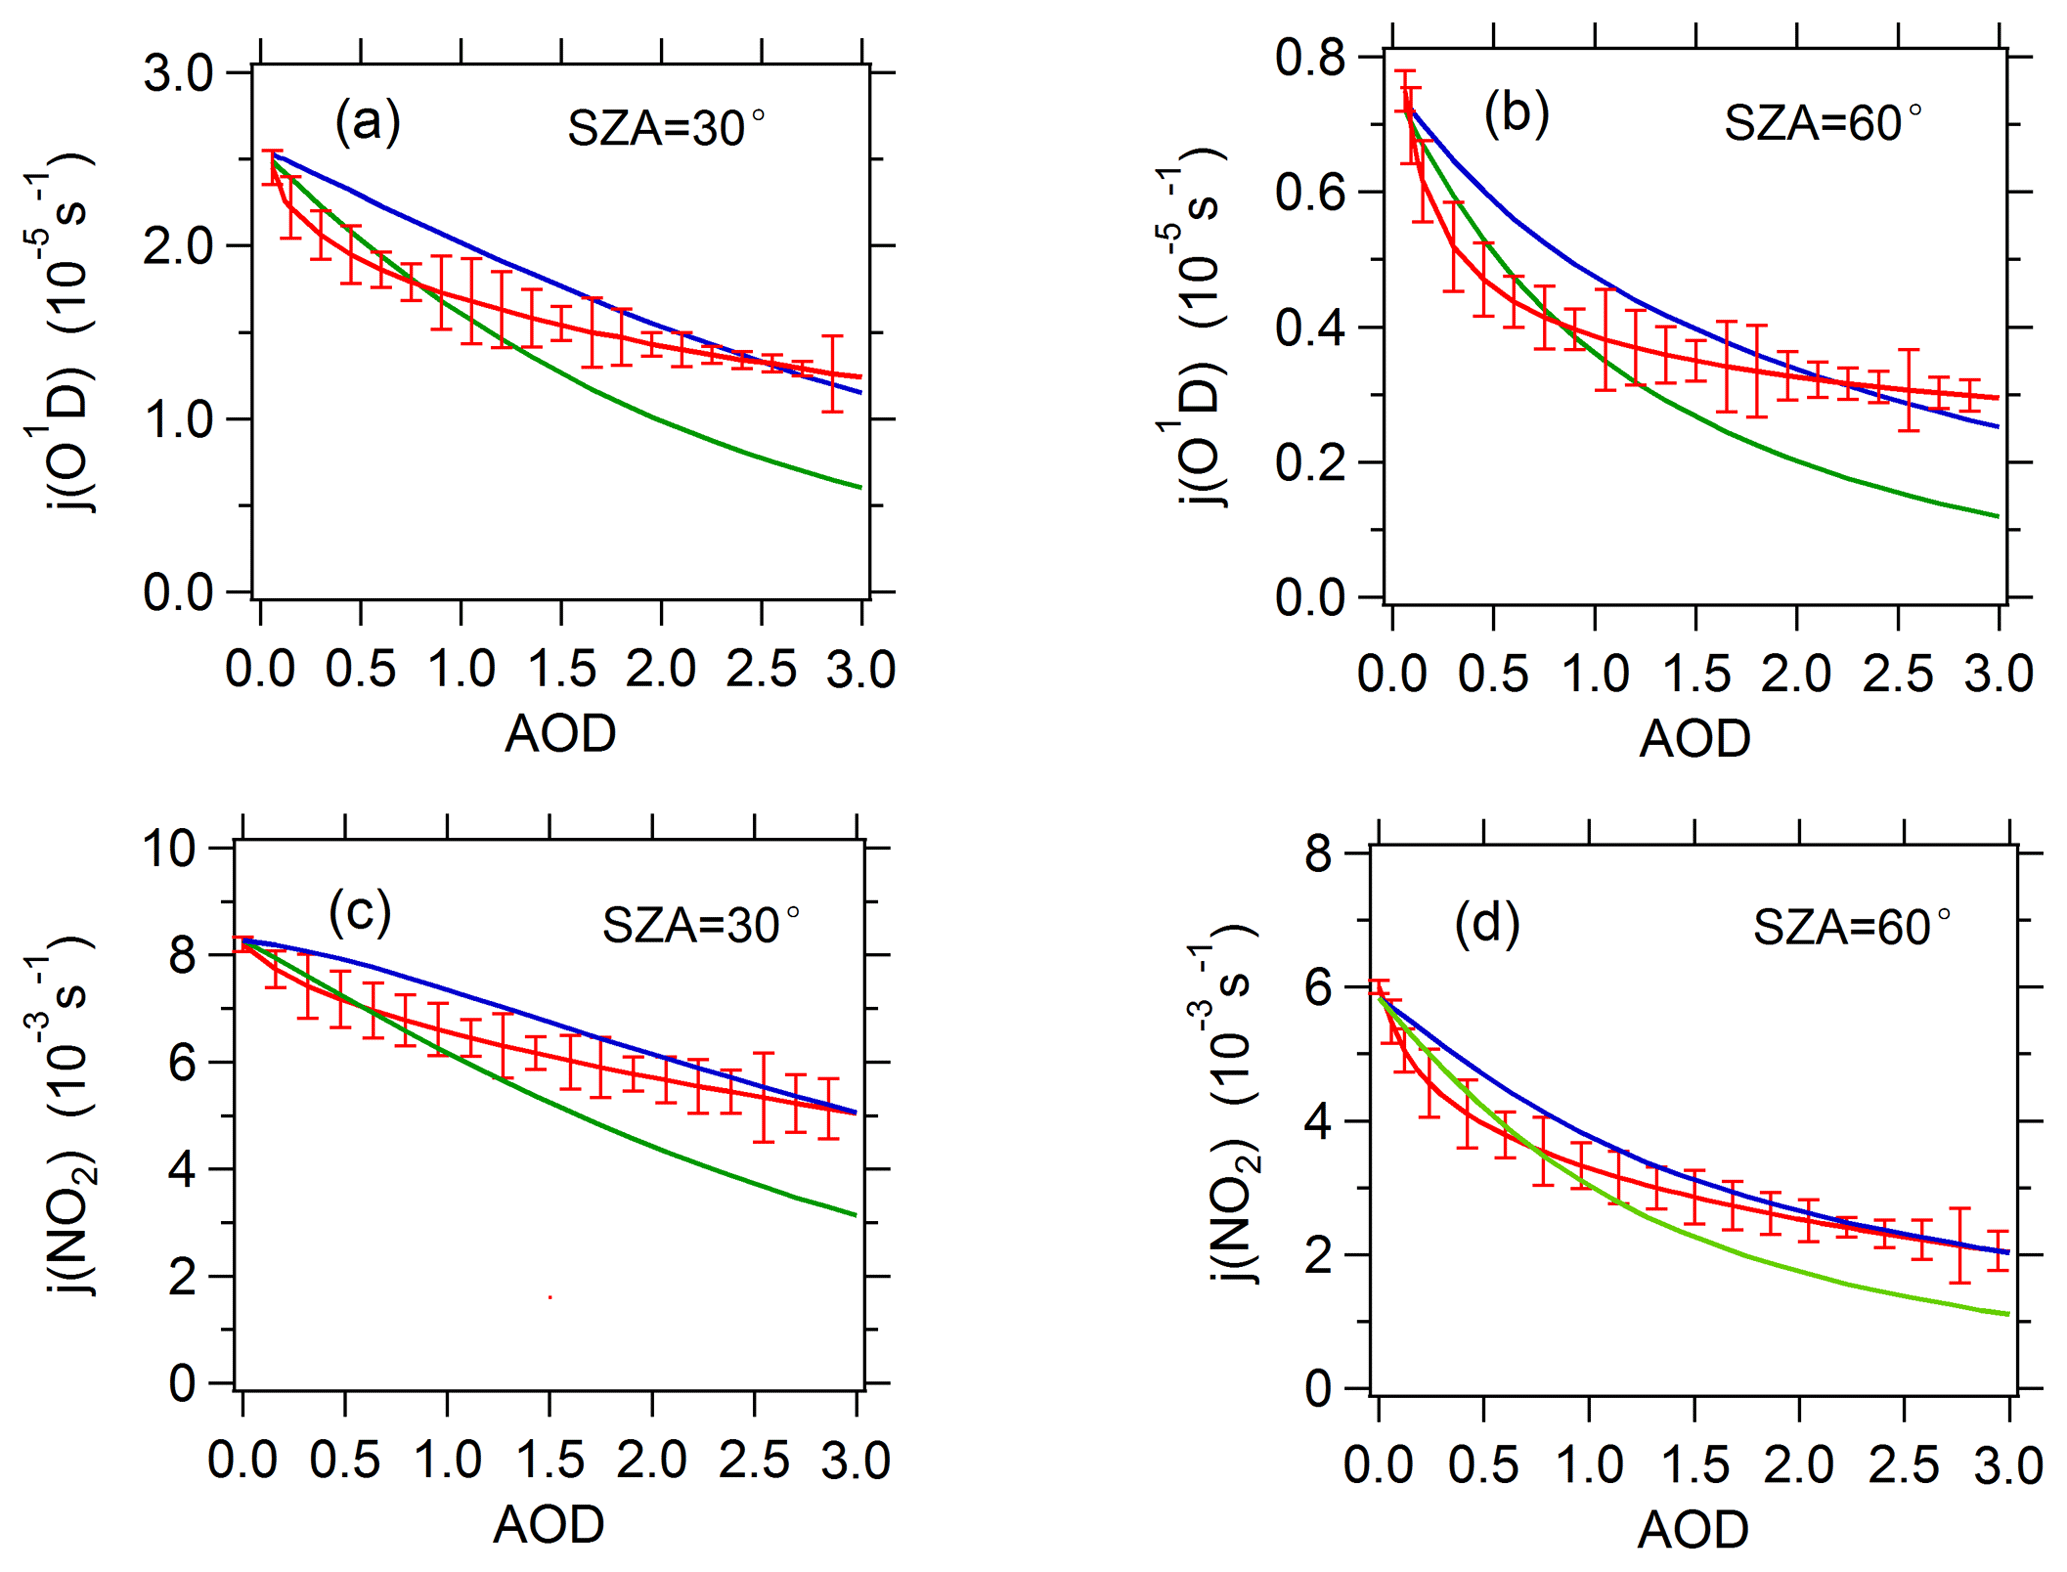
Figure 5The relationship between observed or TUV-simulated photolysis frequencies and AOD (380 nm) at SZAs of 30 and 60∘. For j(O1D), a total ozone column classification of 330–360 DU is chosen. The red line represents observed average photolysis frequencies; the blue line and green line represent TUV-simulated average photolysis frequencies at SSAs of 0.95 and 0.85 respectively.
The rapid change of the slope with AOD can be related to the variation of SSA at different AOD level. Figure 6 presents the relationship between SSA and AOD. Figure 6a presents the relationship between AERONET-based SSA (440 nm) and AOD during 2012–2015. The result suggests a significant positive correlation between SSA and AOD. Additionally, Fig. 6b also presents a significant positive correlation between near-ground SSA (525 nm) from measurement campaign in August 2012 and AOD. With the increase in AOD, SSA is elevated; meanwhile, the slope of SSA vs. AOD is gradually reduced. Similar results in other regions have been obtained by Bais et al. (2005), Krotkov et al. (2005) and Kazadzis et al. (2012). SSA characterizes the ratio of the scattering extinction coefficient to the total extinction coefficient (scattering extinction coefficient plus absorptive extinction coefficient) of aerosols. The smaller the SSA, the higher the absorptive component and the lower the scattering component of the aerosol and the stronger the ability of the aerosol to reduce the actinic flux (Dickerson et al., 1997). Figure 6 indicates that aerosols in Beijing under low AOD conditions had a higher proportion of absorptive aerosol components than under high AOD conditions and, as a result, had a stronger ability to reduce the photolysis frequencies, which contributed to the rapidly reduced slope of j(O1D) vs. AOD with AOD. However, due to the absence of more SSA data of the period 2012–2015, we cannot give more sufficient evidence for the dependence of SSA on AOD. From another perspective, owing to the biomass burning and soot emission generated from heating, the fine-mode heavily absorbing aerosol percentage is higher in winter than in summer (Zheng et al., 2017; Liu et al., 2016; Zhang et al., 2013), and thus aerosols in winter have a stronger ability to reduce the photolysis frequencies. Table S1 in the Supplement indicates that SSA in summer is significantly higher than in winter. High AOD levels often appeared in summer, and low AOD levels occurred mostly in winter (Fig. 2 and Table S1), another fact that may also explain the rapidly reduced slope of j(O1D) vs. AOD with AOD.
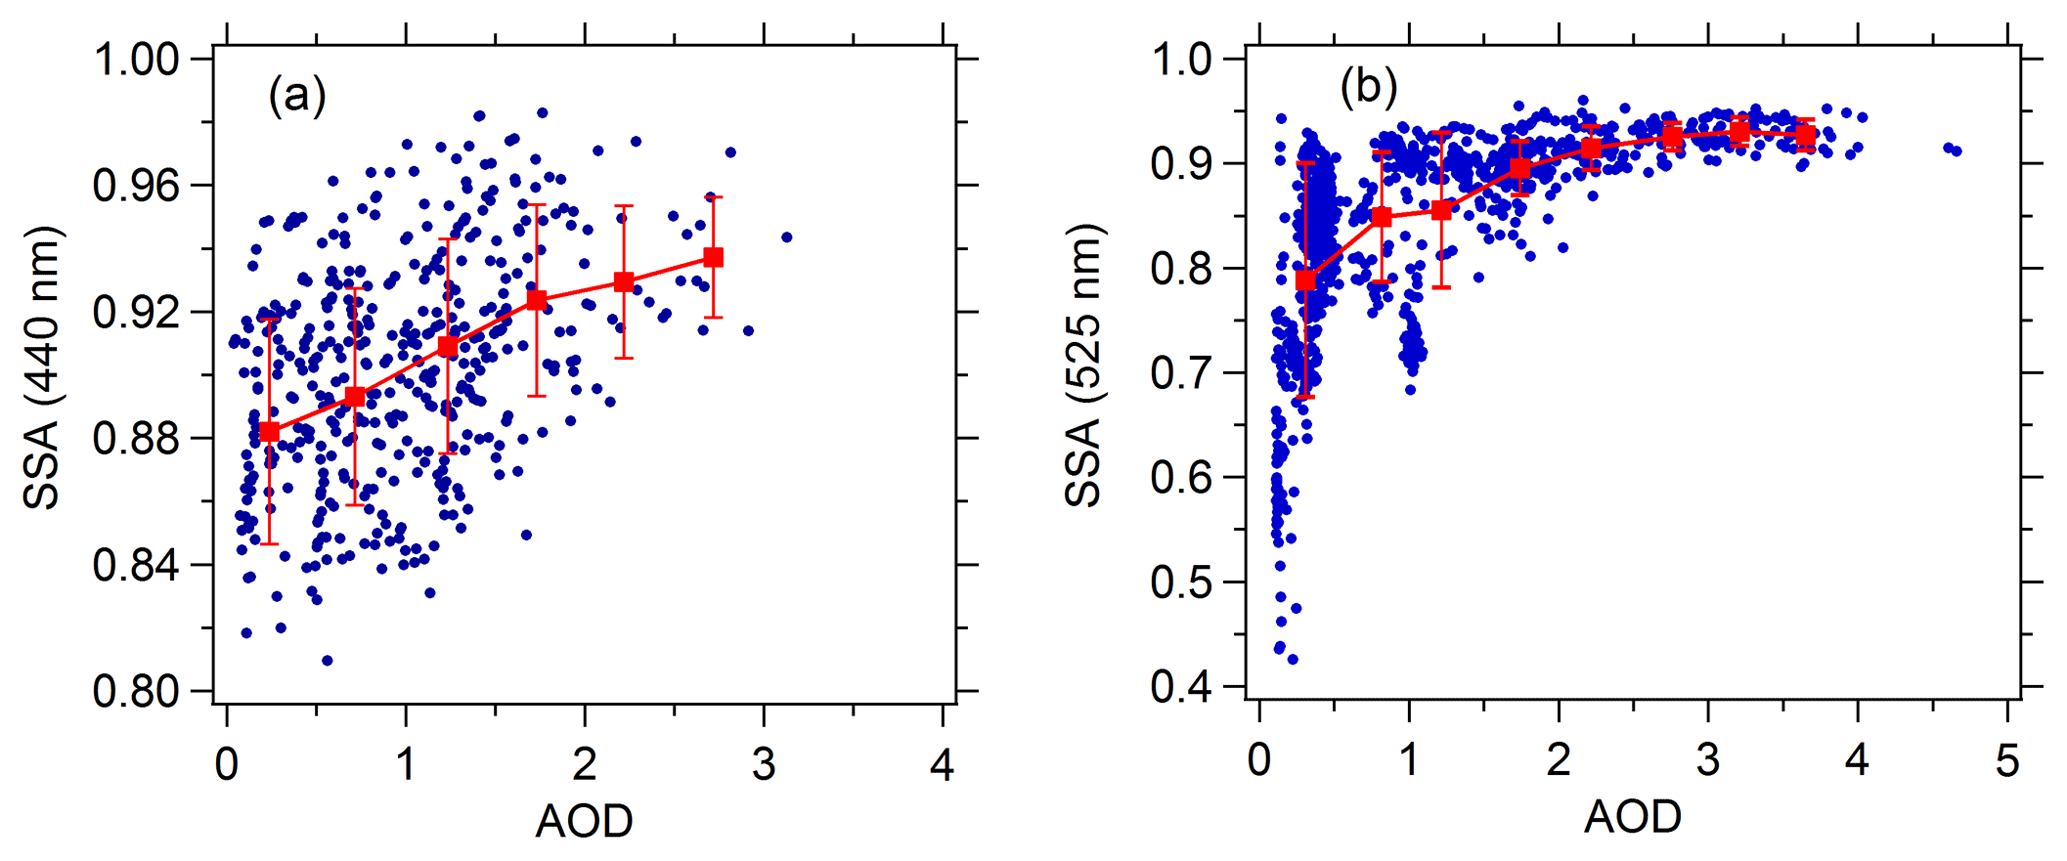
Figure 6Correlation between SSA and AOD (380 nm). (a) SSA (440 nm) is acquired from AERONET during 2012–2015. (b) SSA (525 nm) is acquired from the near-ground measurement campaign in August 2012.
It is worth noting that the mean near-ground SSA (525 nm) in August 2012 (0.88±0.08) is significantly lower than the mean AERONET-based SSA (440 nm) in the same period (0.94±0.02) and in summer (0.94±0.02). The different wavelength plays a minor role in the different SSA according to the wavelength dependence of AERONET-based SSA in the range of 440–1020 nm (Fig. S3). This difference is mainly because the AERONET-based SSA represents the column, and in situ SSA happens near the ground. The effect of the difference in SSA (0.88 vs. 0.94) results in photolysis frequencies changing by 11 %–16 % according to the TUV model. It means that due to the in situ SSA use, the photolysis frequencies tend to be underestimated. Krotkov et al. (2005) and Corr et al. (2009) pointed out that SSA in the UV can be lower than the visible. So in general this 11 %–16 % could be less. The AERONET-based SSA generally reproduces the slope of j(O1D) vs. AOD well in spite of it significantly underestimating the absolute value of the slope in the low AOD range (AOD <0.7), which is probably due to the uncertainty of AERONET-based SSA in the low AOD range. In addition to the uncertainty of SSA, SSA at both 440 nm and 525 nm differs from the 305–315 nm wavelength range of j(O1D), which is likely to lead to some uncertainties for the analysis of the relationship between j(O1D) and AOD.
Comparing Fig. 4a and b, we see that at AOD smaller than 1, the slope of j(O1D) vs. AOD exhibits a significant dependence on SZA, and the slope at 30∘ of SZA is about 1.5–2.0 times larger than that at 60∘ of SZA. This result is similar to that of the observations made in the central Mediterranean (Casasanta et al., 2011). For the purpose of comparison with the study in the Mediterranean, the slope of j(O1D) vs. AOD was calculated at AOD smaller than 0.7.
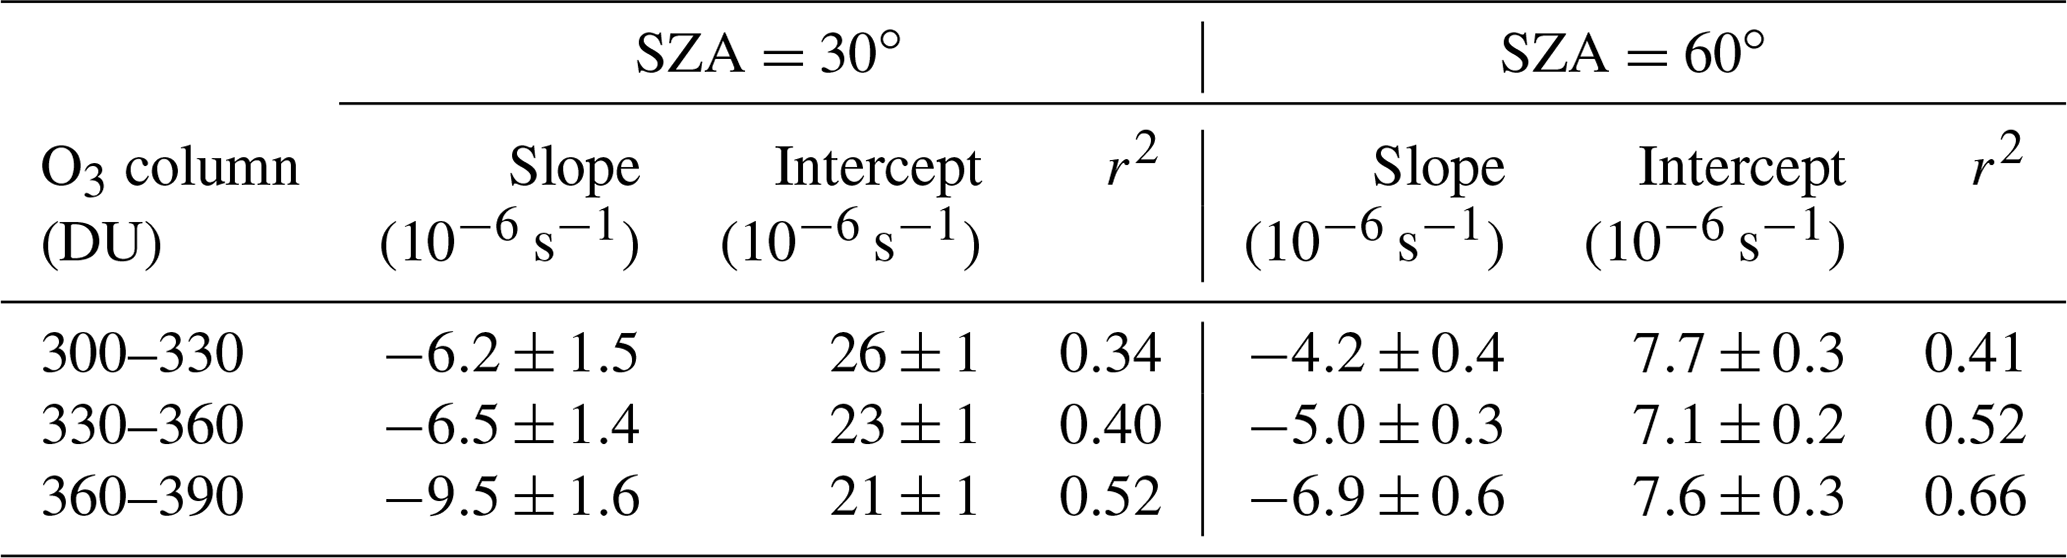
Table 3 presents the slope, intercept and determination coefficient (r2) of linear fits of correlation between j(O1D) and AOD for each ozone column class at AOD smaller than 0.7. At a SZA of 60∘ and O3 column concentration of 300–330 DU, the respective slope of the linear regression indicates a reduction of j(O1D) by s−1 per AOD unit. Gerasopoulos et al. (2012) reported that the observed slope in the eastern Mediterranean was equal to s−1 at an O3 column of 300–320 DU. Casasanta et al. (2011) reported that the observed slope in the central Mediterranean varied from to s−1 at an O3 column of 300–330 DU. All of these results are smaller than the value of the present study, indicating that aerosols in Beijing had a stronger extinction capacity on j(O1D) than those in the Mediterranean that was influenced by both natural absorptive aerosols and anthropogenic aerosols. A previous study indicated that SSA in Beijing ranged from 0.80 to 0.86 (Garland et al., 2009; T. T. Han et al., 2015, 2017; Tian et al., 2015). The relatively low SSA in Beijing could be an important reason for the stronger extinction capacity.
Table 3Slope, intercept, and the square of correlation coefficient (r2) of linear fits of correlation between j(O1D) and AOD for each ozone column class at AOD smaller than 0.7.
3.3.2 The correlation between j(NO2) and AOD
Unlike j(O1D), j(NO2) is negligibly affected by ozone column concentration and depends mainly on AOD and SZA under cloudless conditions. Figure 7 presents the dependence of j(NO2) on AOD at different SZA levels under cloudless conditions. The cosine of SZA (cos(SZA)) is categorized according to a width of 0.2. In the same category of cos(SZA), j(NO2) displays a strong dependence on AOD. The scatter of these points is due to the relatively large classification width of SZA to a large extent. When cos(SZA) is at its maximum level (0.8–1), the correlation between j(NO2) and AOD is close to linear. When cos(SZA) decreases, the correlation tends to be non-linear. Similar to j(O1D), the observed slopes of j(NO2) vs. AOD are also larger than the TUV-simulated slope at SSA of 0.95 and 0.85 when AOD is smaller than 0.8 and decreased rapidly with increasing AOD (Fig. 5c and d). The reason for this result is the same as that for j(O1D) as explained above.
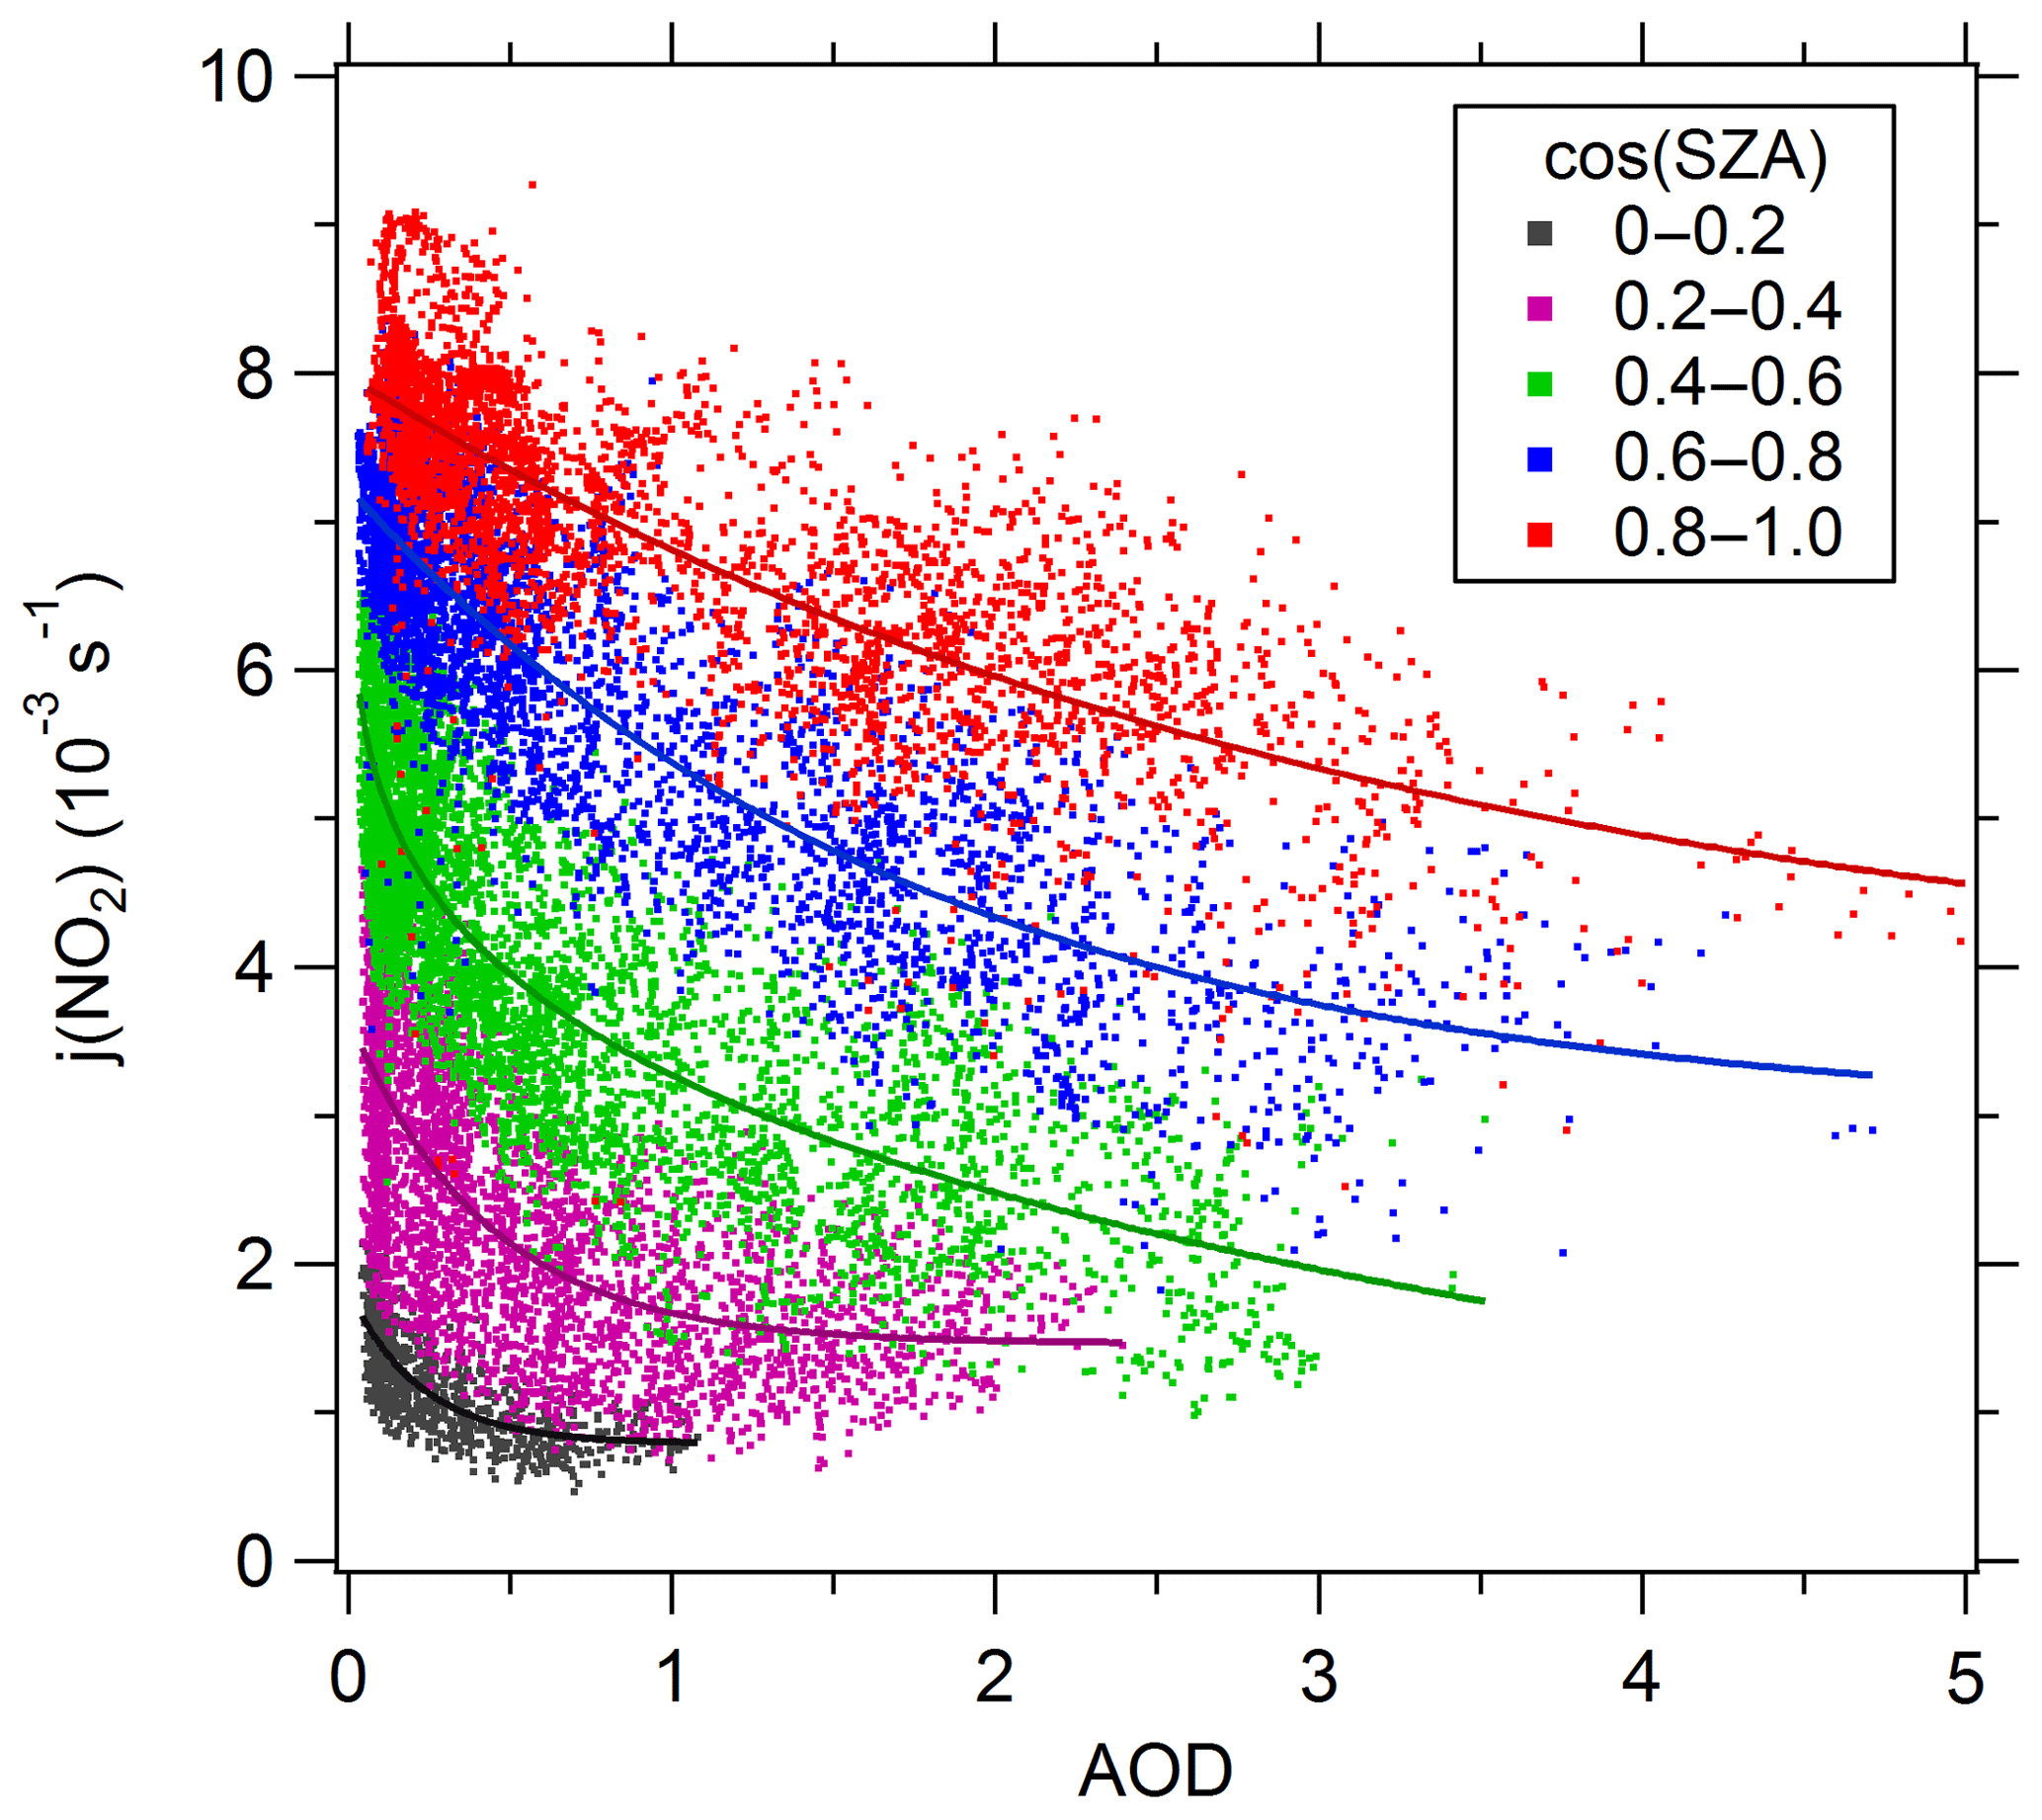
Figure 7Dependence of j(NO2) on AOD (380 nm) in different SZA classes. The classes of cos(SZA) are 0–0.2 (black), 0.2–0.4 (purple), 0.4–0.6 (green), 0.6–0.8 (blue), and 0.8–1 (red). The full lines are fitted by the exponential function.
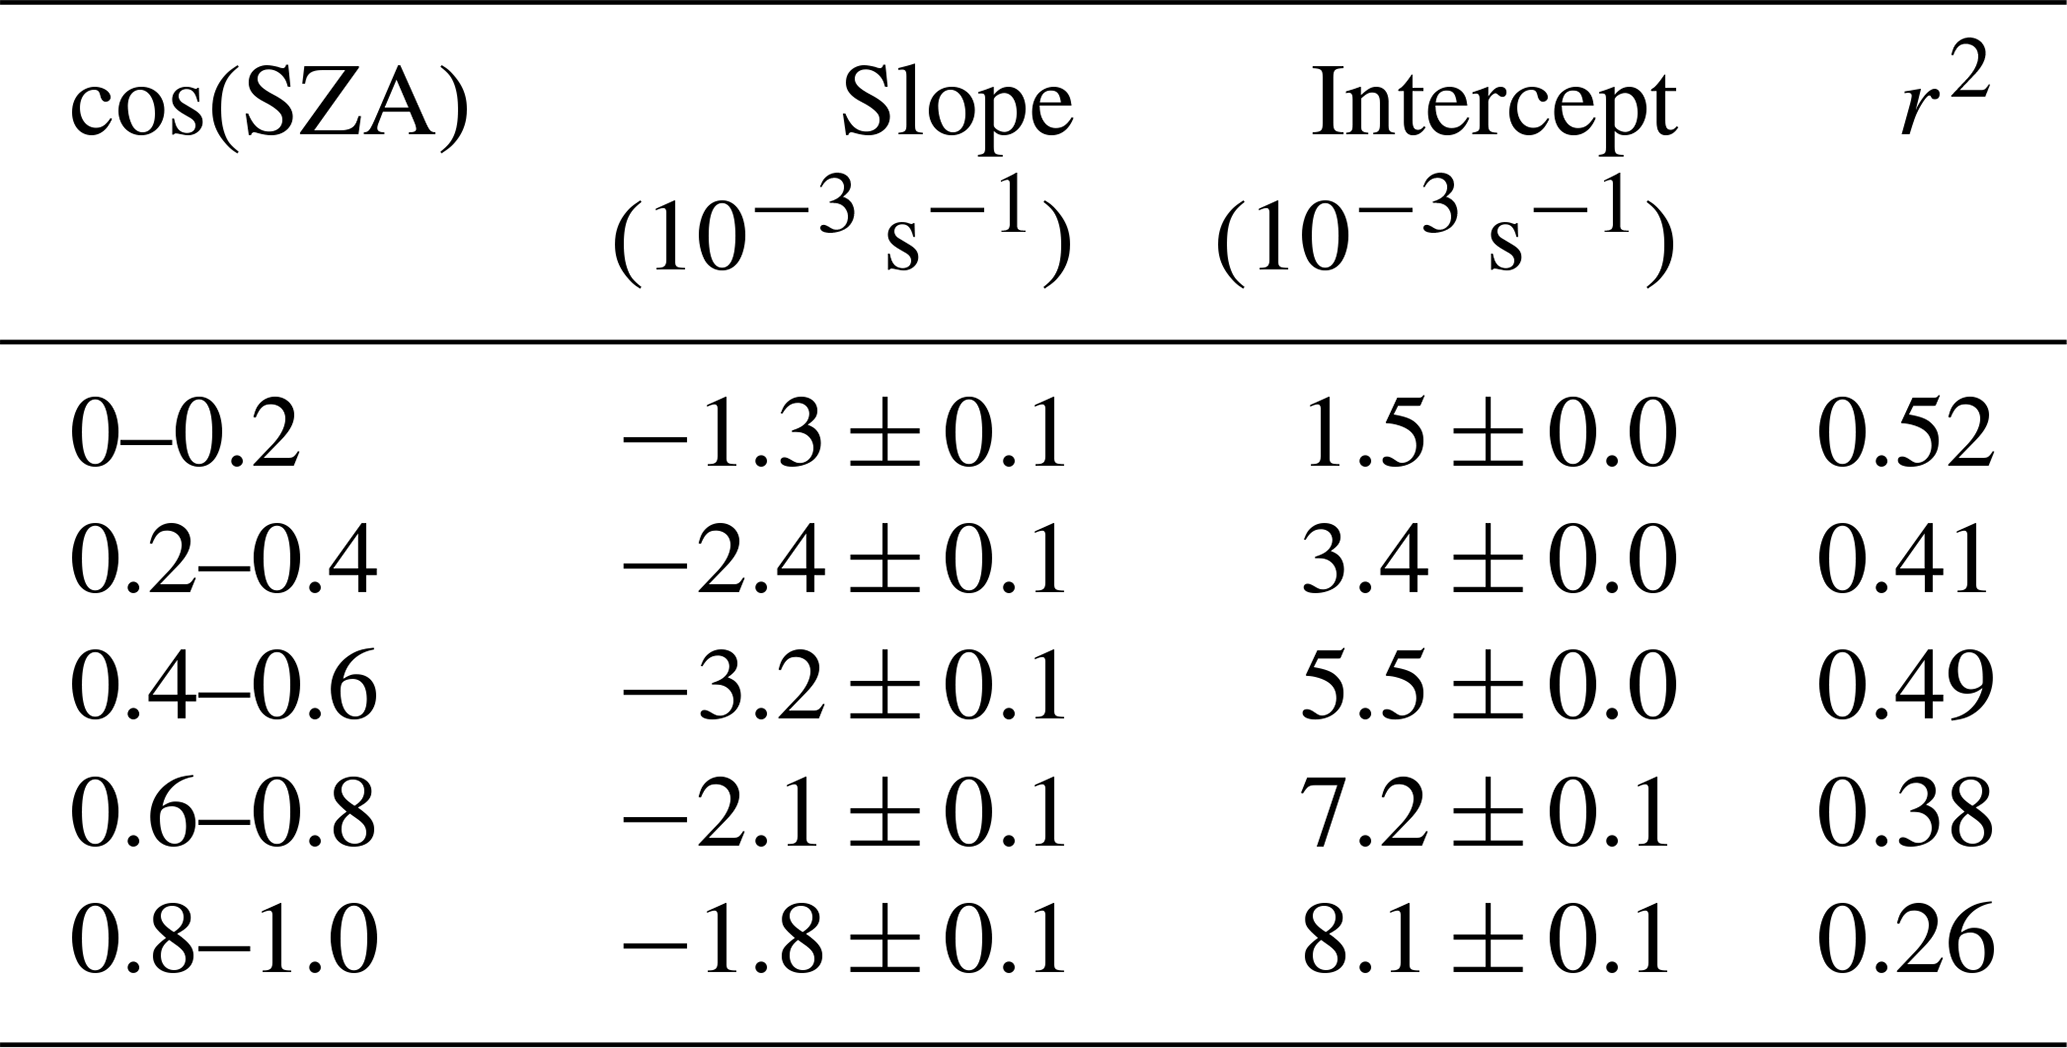
Table 4 presents the slope, intercept, and determination coefficient (r2) of linear fits of correlation between j(NO2) and AOD for each ozone column class at AOD smaller than 0.7. The slope of j(NO2) vs. AOD also displays a significant dependence on cos(SZA). The slope increases as cos(SZA) increases from 0 to 0.5 and then decreases as cos(SZA) increases from 0.5 to 1. At a SZA of (cos(SZA) ), the respective slope of the linear regression indicates a reduction of j(NO2) by s−1 per AOD unit. This result is larger than the value for non-dust aerosols ( s−1) and close to the value for dust aerosols ( s−1) in the eastern Mediterranean reported by Gerasopoulos et al. (2012).
Table 4Slope, intercept, and the square of correlation coefficient (r2) of linear fits of correlation between j(NO2) and AOD for each ozone column class at AOD smaller than 0.7.
3.4 The parameterization relationship between photolysis frequencies, AOD, and SZA
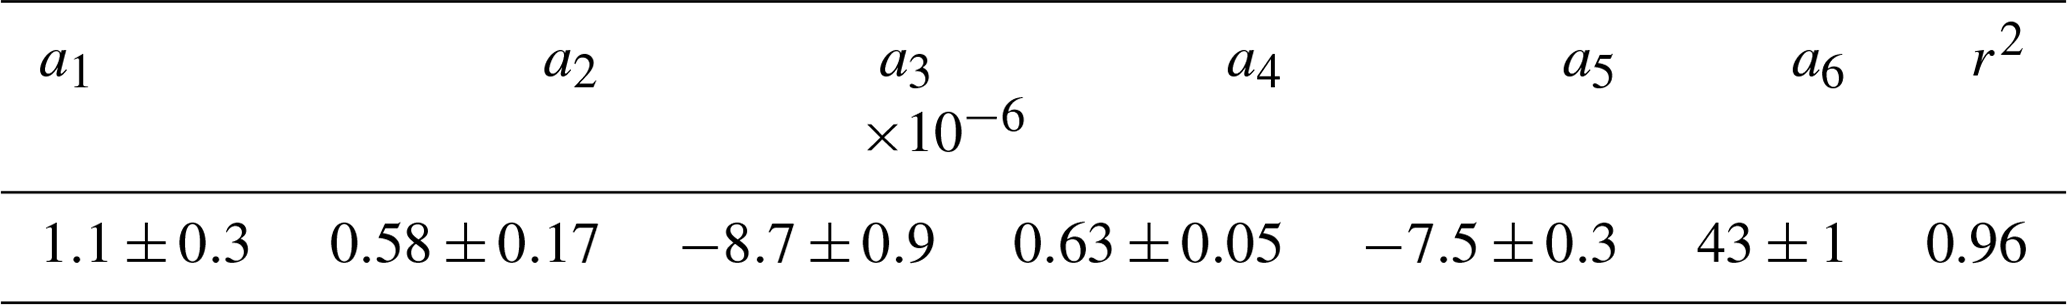
As analysed above, the photolysis frequencies (j(O1D) and j(NO2)) strongly depended on AOD and cos(SZA) and could be fit into Eq. (5) using a quadratic polynomial form. The fitting parametric equations for j(NO2) are shown in Table 5. For j(O1D), both the O3 column and temperature affect j(O1D) significantly. Figure S1 presents the dependence of j(O1D) on ozone column at a low AOD level (AOD <0.3) and SZAs of (a) and (b) , respectively. The ozone column ranging from 270 to 400 DU leads to j(O1D) reducing by about 50 %. In order to evaluate the impact of temperature on j(O1D), we calculated the ratio of j(O1D) at measured temperature to j(O1D) at temperature =298 K () (Fig. S2). varied from 0.82 to 1.03, indicating that temperature changed j(O1D) by no more than 21 %. Therefore, temperature played a minor role in changing j(O1D) compared with the ozone column. As a result, when we fitted the relationship among j(O1D), AOD, and cos(SZA), the effect of the ozone column is considered but the effect of temperature is not considered. By fitting the relationship in different ozone classes (classification width = 30 DU), we found that the ozone column increasing by 30 DU results in j(O1D) at a constant SZA and AOD decreasing by 18 %. Therefore, the parametric equation for j(O1D) is transformed into the form Eq. (6), which reflects the influence of ozone column. The parameters a1–a6 correspond to the ozone column range of 300–330 DU; thus we use 315 DU as the weighted standard of the ozone column. The fitting parameters a1–a6 for j(O1D) is shown in Table 6.
Table 5The fitting parameters a1–a6 and determination coefficients of Eq. (5) for j(NO2).
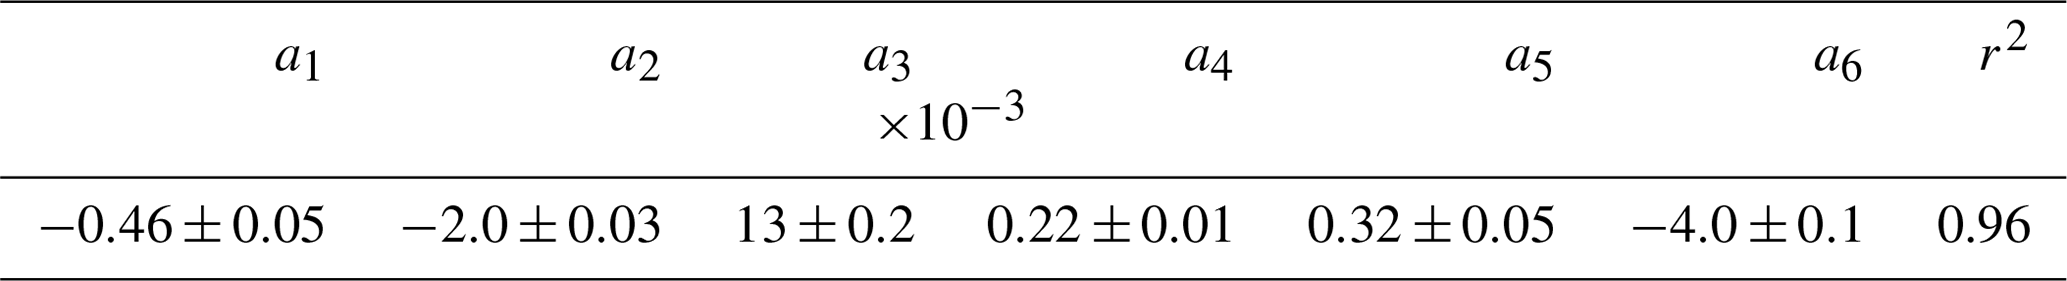
The coefficients of determination of the fitting equations are greater than 0.95 for j(NO2) and j(O1D) in a certain O3 column, indicating that both of the photolysis frequencies strongly depended on AOD and cos(SZA), and the effect of other factors such as SSA and AE is integrated into the constant term in the parametric equation. Since the ozone column concentration has a greater influence on j(O1D) than on j(NO2), the parameters of fitting equations for j(NO2) are similar, but the parameters of fitting equations for j(O1D) have a large fluctuation in different O3 column ranges (especially a1 and a2). The parametric equations can be used to quantitatively evaluate the effect of AOD on photolysis frequencies in Beijing. According to the parametric equations, aerosols lead to a decrease in seasonal mean j(NO2) by 24 % and 30 % and a decrease in seasonal mean j(O1D) by 27 % and 33 % in summer and winter under clear-sky conditions, respectively, compared to an aerosol-free atmosphere. The decreasing ratio of the photolysis frequencies in winter is higher than in summer mainly due to the higher SZA in winter.
The effect of aerosols on photolysis frequencies in Beijing is compared with other studies. Real and Sartelet (2011) reported a reduction in j(NO2) and j(O1D) of 13 %–14 % due to aerosols using the radiative transfer code Fast-J during summer 2001 over European regions. Flynn et al. (2010) reported that aerosols reduced j(NO2) by 3 % in Houston during 2006 using the TUV model. Gerasopoulos et al. (2012) reported that aerosols reduced j(NO2) and j(O1D) by 5 %–15 %, with a 5-year mean AOD at 380 nm equal to 0.27. All of these results are lower than the reduction ratio of this study, mainly due to the higher aerosol level in Beijing (4-year mean AOD equal to 0.76±0.75). Hodzic et al. (2007) simulated a 15 %–30 % j(NO2) photolysis reduction during the 2003 European summer heatwave in the case of absorbing biomass burning aerosols, with AOD at 550 nm equal to 0.7–0.8 and SSA at 532 nm equal to 0.83–0.87. The result of Hodzic et al. (2007) is comparable with the reduction ratio of this study, possibly due to the equivalent levels of AOD and SSA. In addition, Péré et al. (2015) simulated a higher reduction (20 %–50 %) in j(NO2) and j(O1D) along the transport of the aerosol plume during the 2010 Russian summer wildfires episode. The higher reduction is due to the higher level of AOD (peak value of AOD at 400 nm reached 2–4), even though SSA is very high (0.97).
3.5 The influence of AOD on ozone production
In order to explain the effect of aerosol light extinction on ozone production, we used the data from the field observation campaign undertaken in August 2012. Ozone production depends on its precursors (NOx and VOCs), meteorological factors, and solar radiation. Solar radiation is the driving force for tropospheric photochemical reactions, in which j(O1D) and j(NO2) are both important for ozone production. On the one hand, the increase in j(NO2) promotes the photolysis of NO2, thereby accelerating the formation of ozone. On the other hand, the increase in j(O1D) accelerates the photolysis of ozone. In addition, the increase in the photolysis frequencies will accelerate the photolysis of OVOC (especially formaldehyde and acetaldehyde), HONO, and H2O2, resulting in increases in OH and HO2, which will promote the reaction between OH and VOCs and thus produce more RO2. As a result, more ozone is produced by increasing the reaction rate between RO2 (or HO2) and NO. However, the increase in OH and HO2 also consumes ozone and NO2, which contributes to the increase in D(O3). In brief, the overall effect of changes in photolysis frequencies on the sources and sinks of ozone determines the change in the net ozone production rate.
Ozone production (HO2 + NO, RO2 + NO), ozone loss (O1D + H2O, HO2 + O3, O3 + OH, NO2 + OH, and O3 + alkenes), and net ozone production rate during August 2012 were calculated using the box model. We used the observed photolysis frequencies (i.e. j_obs), and the calculated photolysis frequencies by parametric equation under the conditions of AOD equal to 0 (i.e. j_AOD = 0) were used to constrain the box model. The difference of simulated results in the two scenarios can be attributed to the effect of aerosol light extinction. As a result, the presence of aerosols causes a decrease in both ozone production rate and loss rate, as is shown in Fig. 8. Since the decreasing amplitude of the daytime ozone production rate is far larger than that of the daytime ozone loss rate, the mean daytime net production rate of ozone is reduced by 25 %. This reduction is comparable with the results of the study in Mexico City, where aerosols caused a 20 % reduction in the ozone concentrations (Castro et al., 2001). Studies in Houston and Crete have shown that aerosols cause ozone production rates to decrease by about 4 % and 12 %, respectively, which are lower than those found in this study (Flynn et al., 2010; Gerasopoulos et al., 2012).
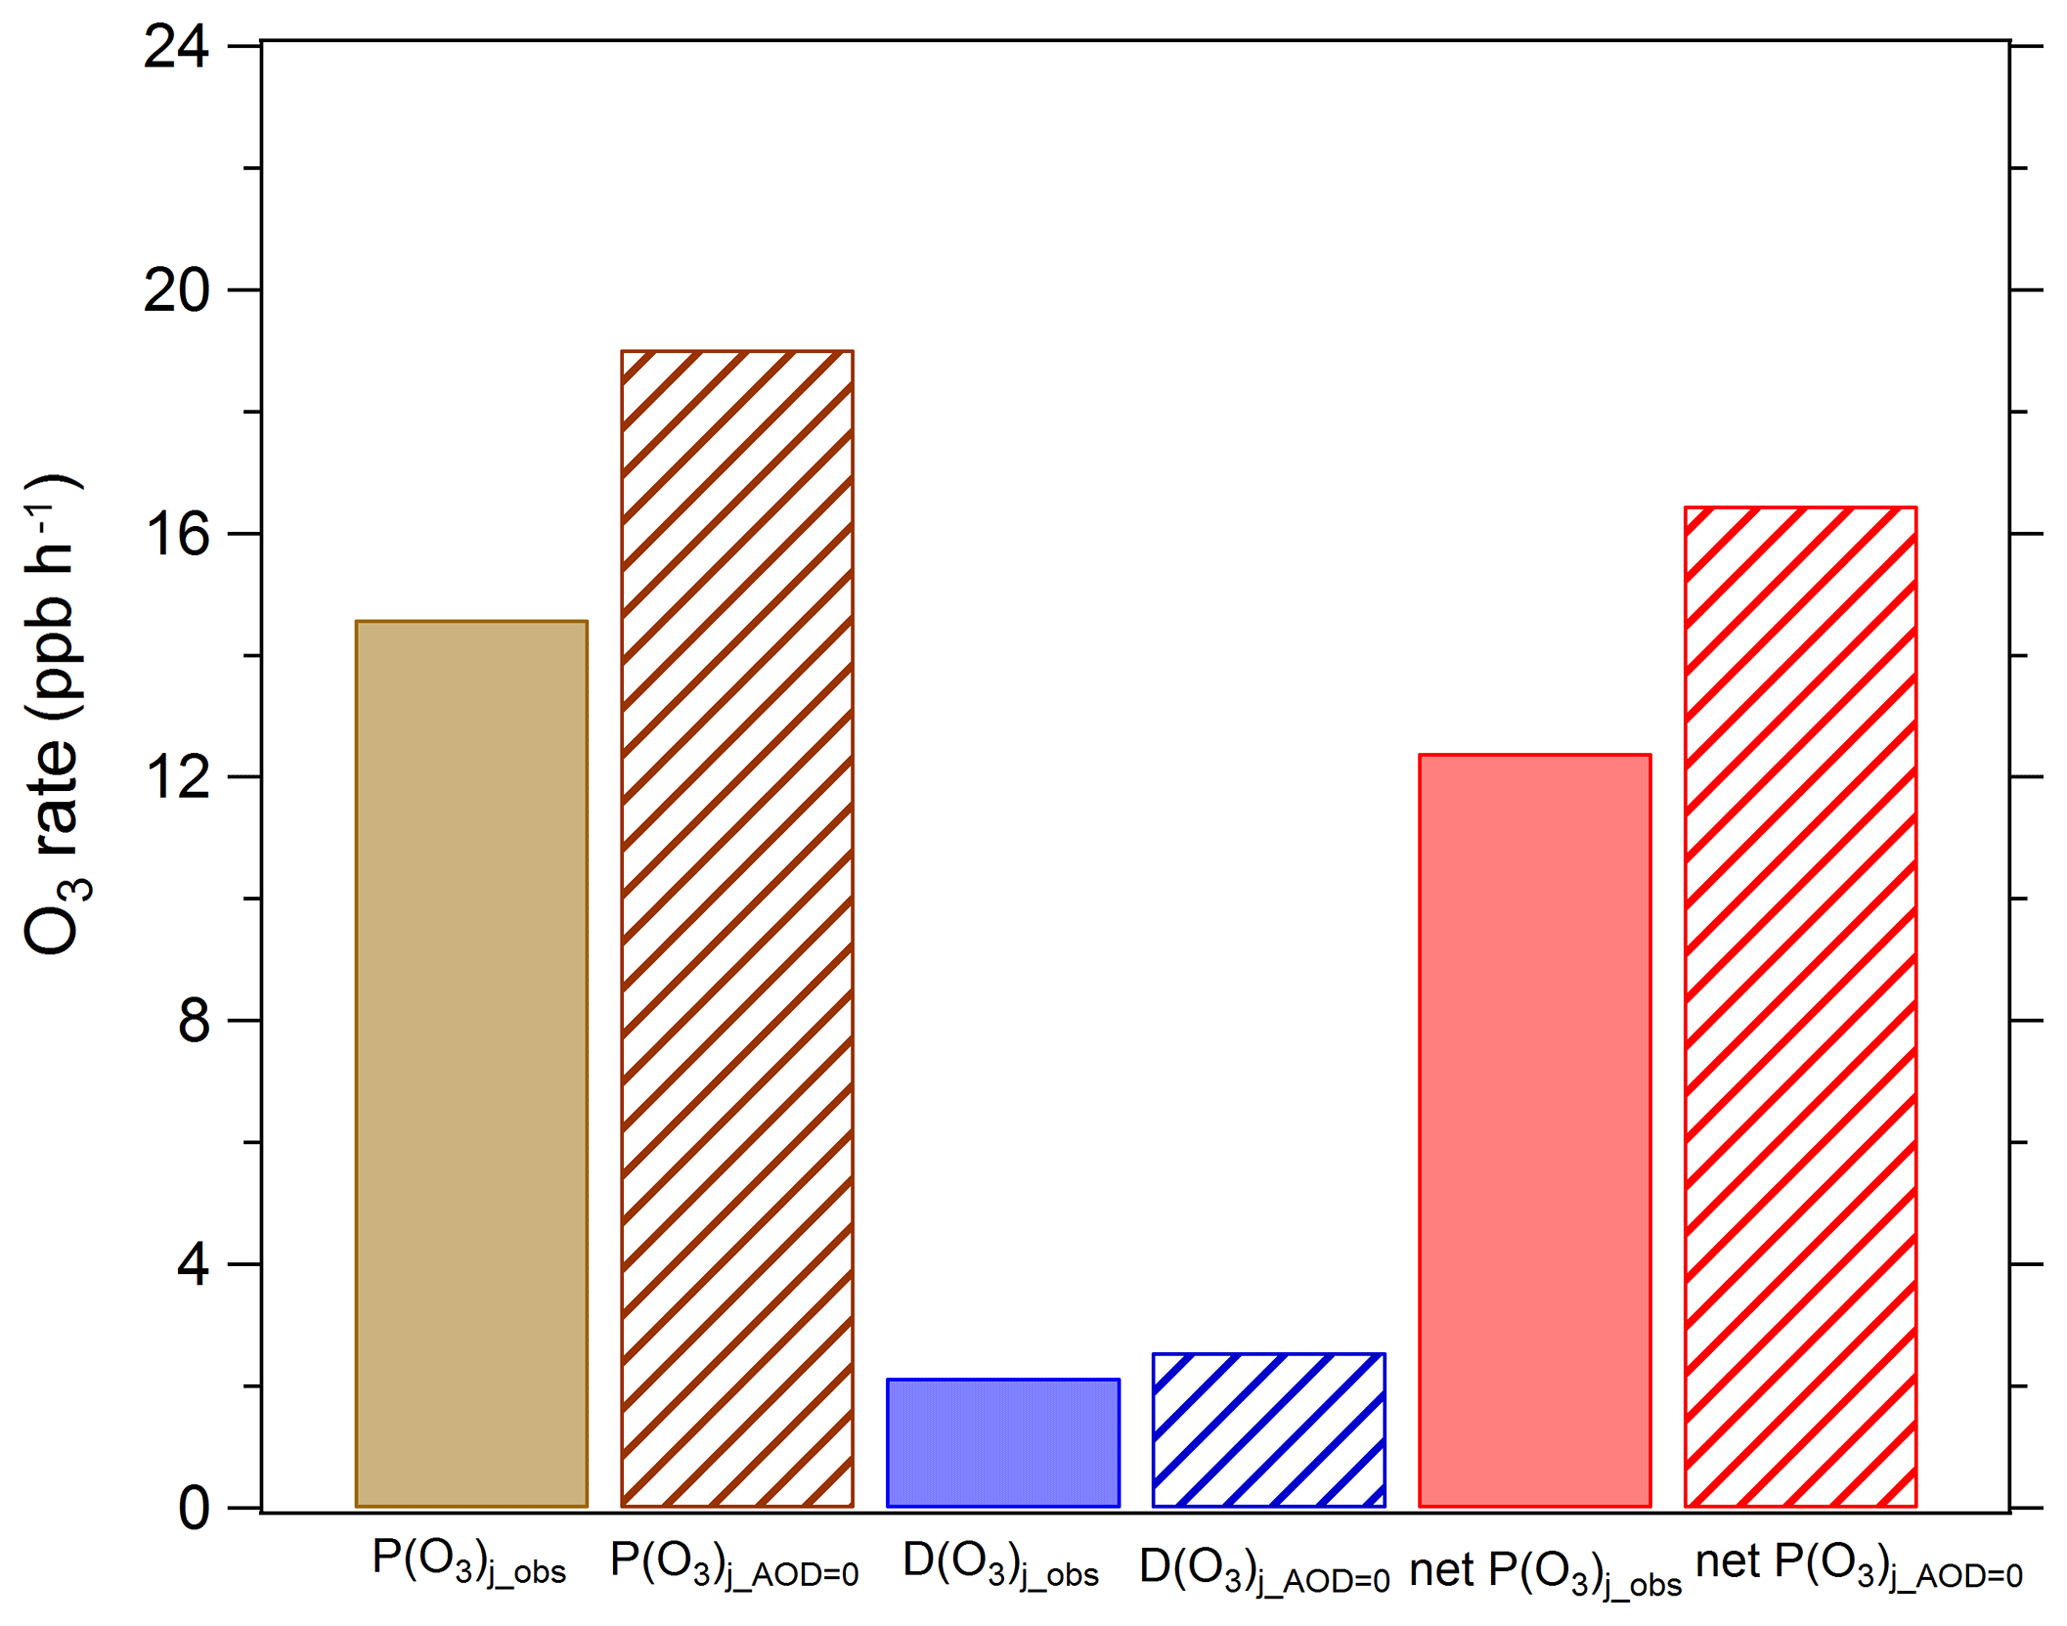
Figure 8Mean daytime ozone production and loss terms in August 2012. P(O3)j_obs, D(O3)j_obs, and net P(O3)j_obs represent ozone production rate, ozone loss rate, and net ozone production rate under observed photolysis frequencies; P(O3)j_AOD=0, D(O3)j_AOD=0, and net P(O3)j_AOD=0 represent ozone production rate, ozone loss rate, and net ozone production rate under calculated photolysis frequencies when AOD is equal to 0.
The ratio of the observed photolysis frequencies to the photolysis frequencies at AOD equal to 0 is defined as JIF (Flynn et al., 2010). A JIF of less than 1 indicates that the aerosols cause a decrease in the photolysis frequencies. Figure 9 shows the relation between (or ) and JIF. The majority of JIF values were less than 1, with an average of 0.72, indicating that aerosols greatly attenuated photolysis frequencies due to high levels of AOD (average of 1.07) during the observation period. and are both linearly positively correlated with JIF, and the scatters are mostly above the 1:1 line. As can be seen from the Fig. 9, a 30 % reduction in photolysis frequencies (JIF =0.7) due to the presence of aerosols results in a decrease in ozone production rate and loss rate by about 26 % and 15 %, respectively. The decreasing amplitude in the ozone production rate is greater than the decrease in the ozone loss rate because the corresponding processes of ozone production are all light-driven, but the corresponding processes of ozone loss are not all light-driven because the reaction of O3 with alkenes does not depend on solar radiation. According to the simulated results, the reaction of ozone with alkenes during this campaign accounts for 17 % of total ozone loss.
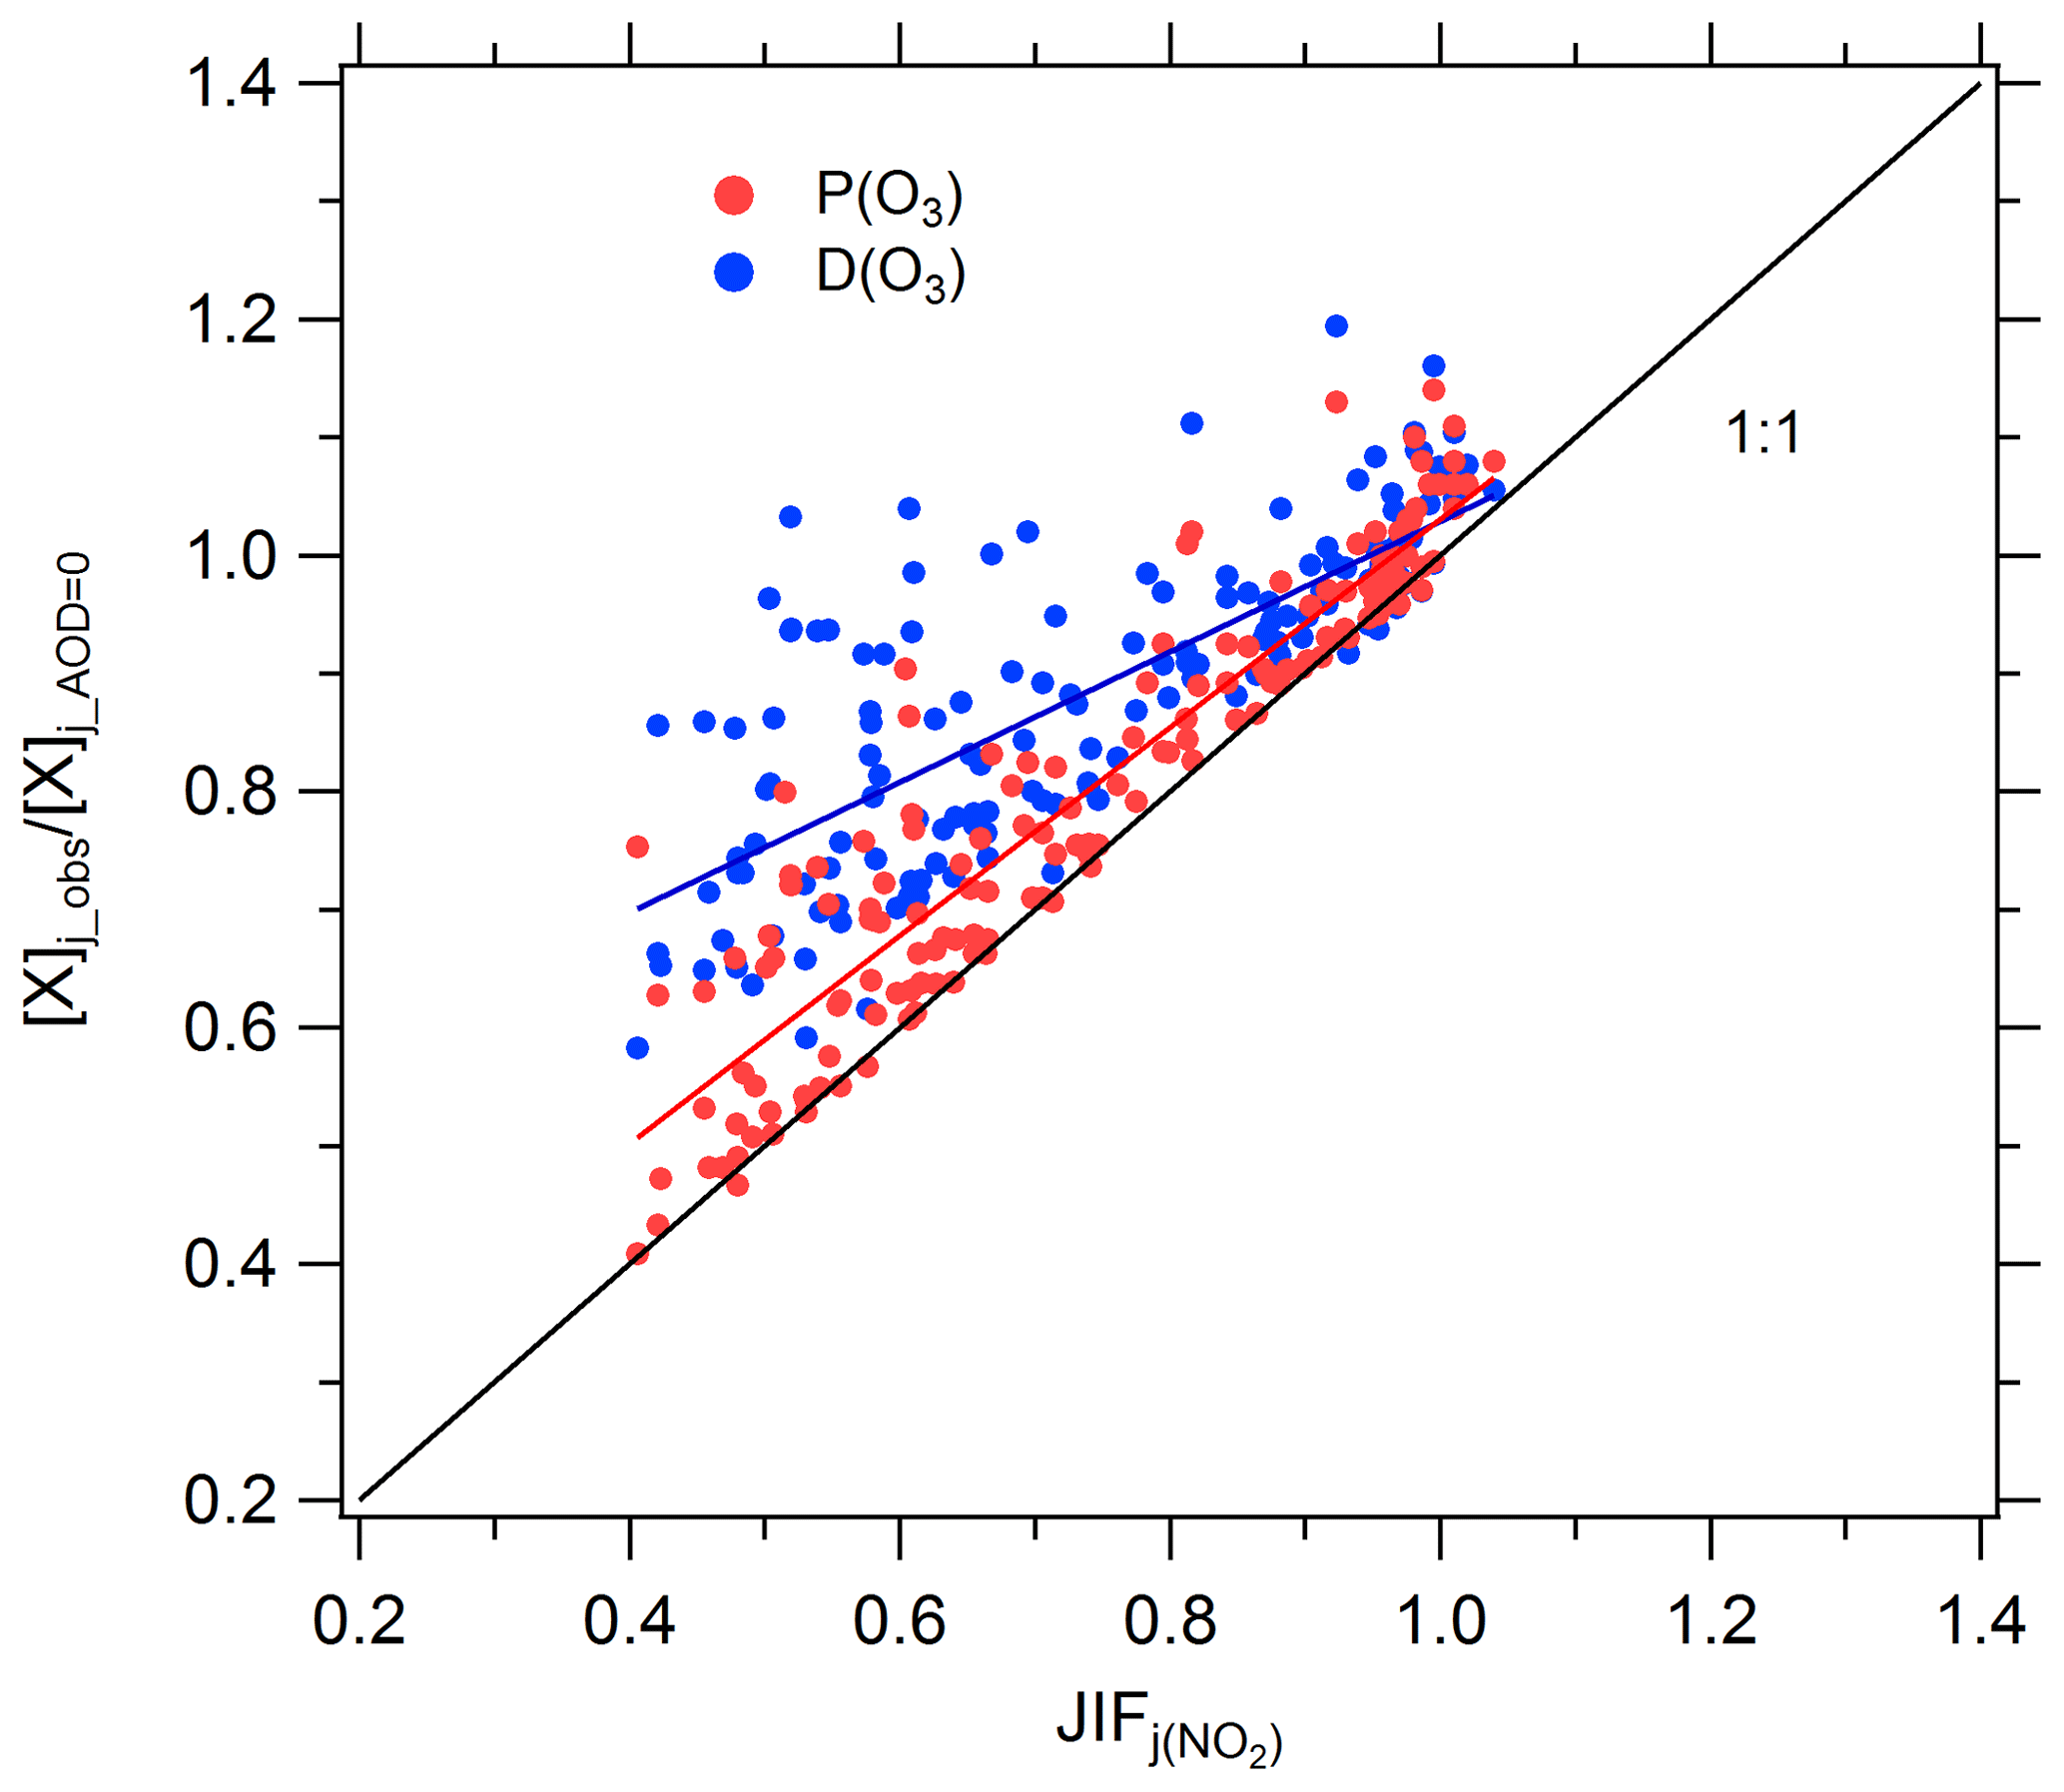
Figure 9Correlation between (or ) and JIF of j(NO2). Single data points represent daytime hourly mean values.
The diurnal profile of the mean ozone production and loss rate is shown in Fig. 10. P(O3) peaks midday between 12:00 and 14:00 local time at 31 ppb h−1 without aerosol impact and 23 ppb h−1 with aerosol impact. The maximum D(O3) also occurs between 12:00 and 14:00 at 4.2 ppb h−1 without aerosol impact and 3.5 ppb h−1 with aerosol impact. There is little difference between aerosol-impact and aerosol-free P(O3) (or D(O3)) in the hours of 06:00–11:00, but the difference in the afternoon (12:00–18:00) is large, indicating that the reduction effect of aerosol on ozone production mainly occurs during the afternoon.
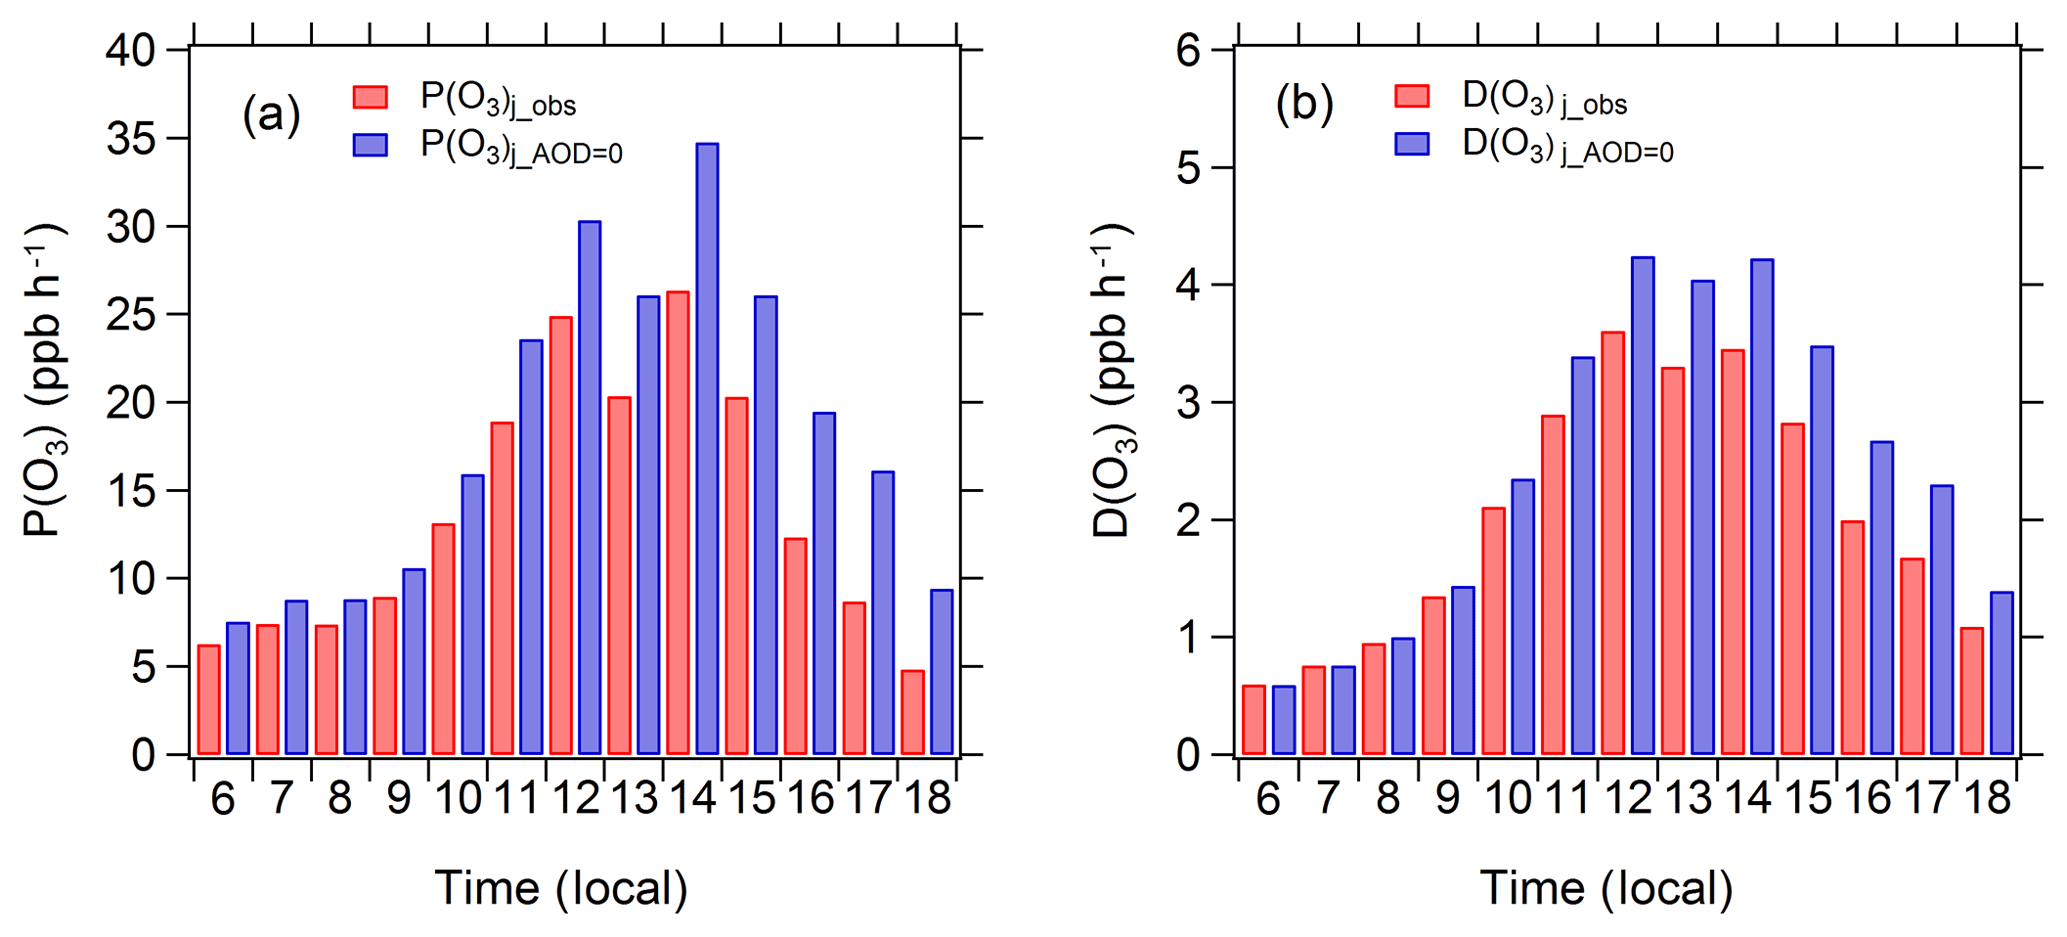
Figure 10Diurnal profiles of mean P(O3)j_obs, P(O3)j_AOD=0, D(O3)j_obs, and D(O3)j_AOD=0 in August 2012 under clear-sky conditions.
Table 6The fitting parameters a1–a6 and determination coefficients of Eq. (6) for j(O1D) in the ozone column range of 300–330 DU.
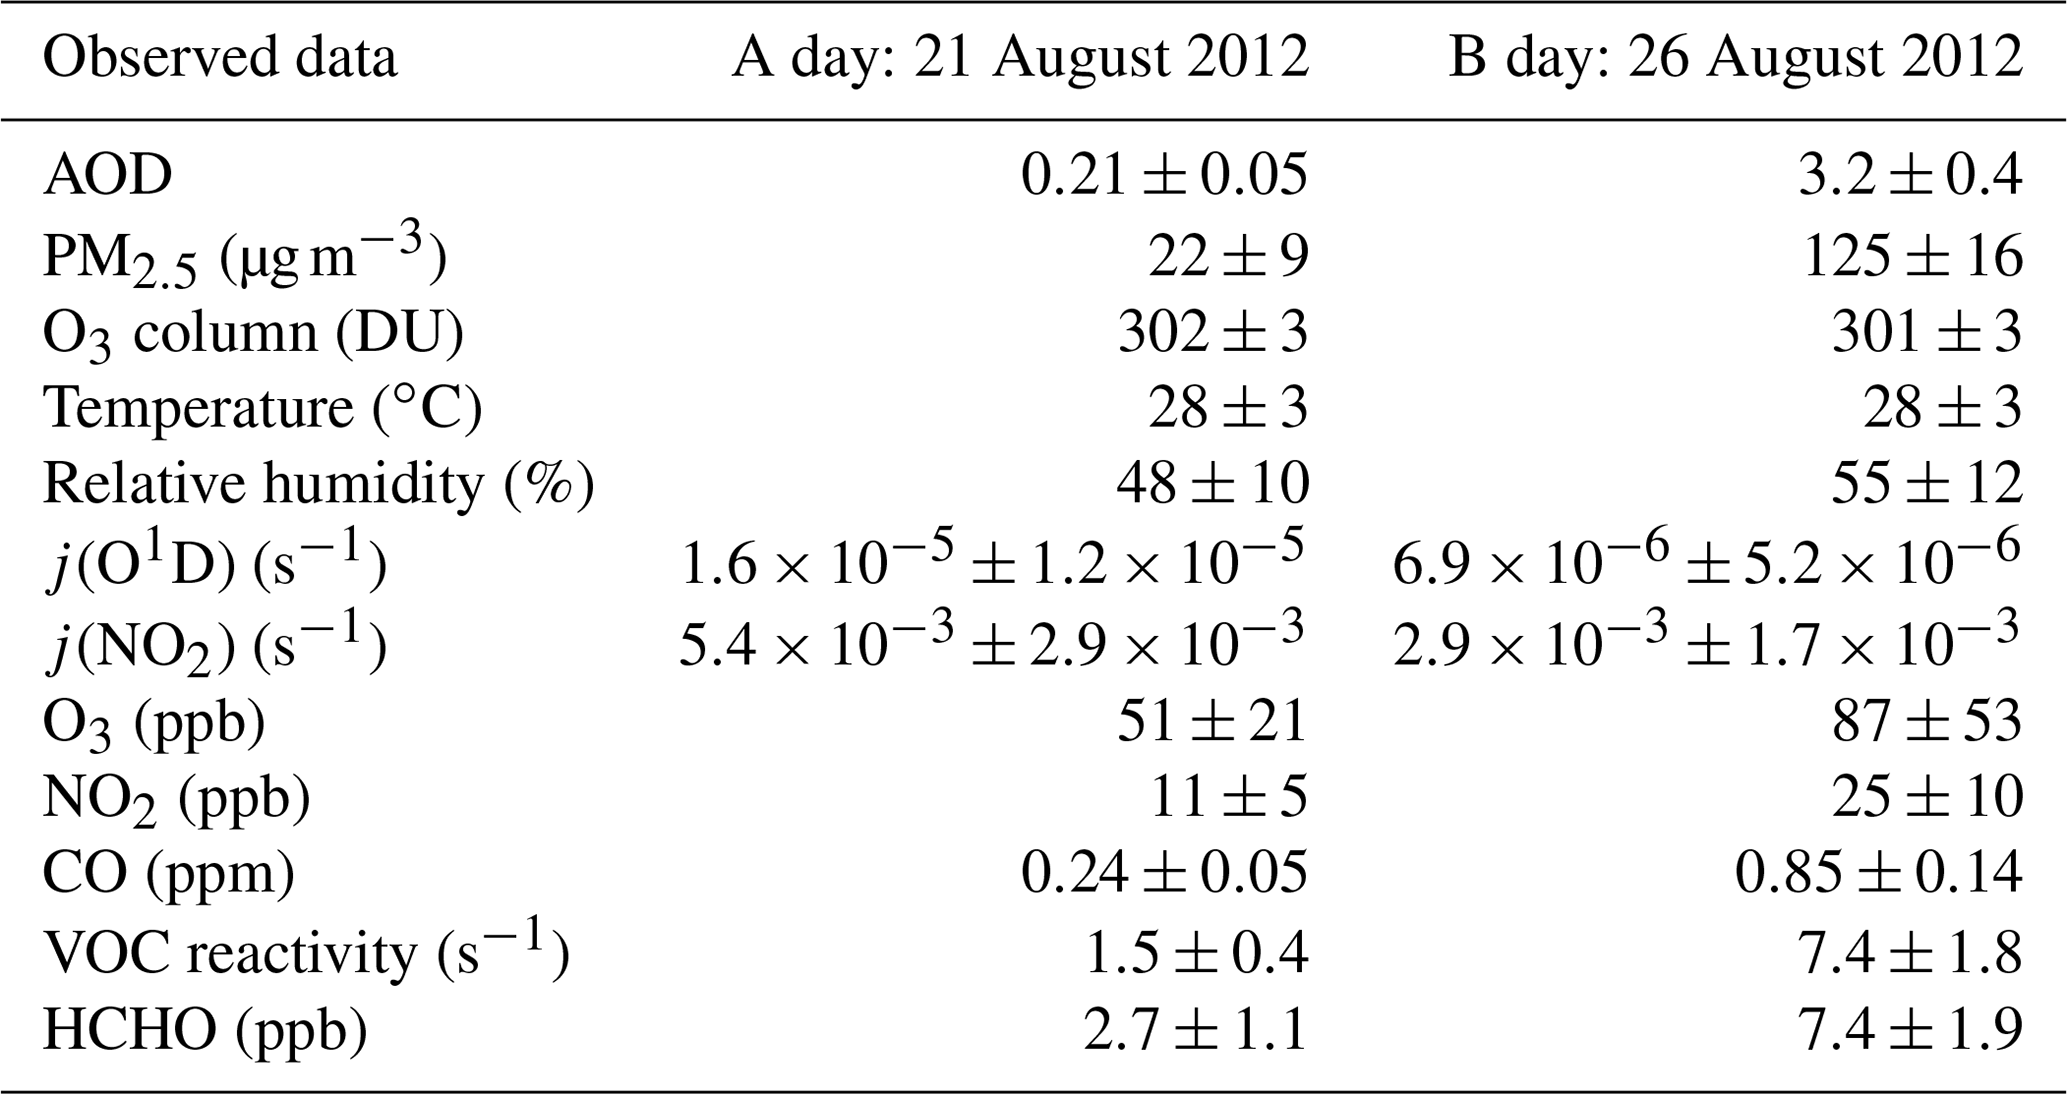
The above analysis focuses on the effect of aerosol on the ozone production due to aerosol light extinction. However, it does not consider the close relationship between aerosol and ozone's gaseous precursors in the actual atmosphere. To explain this problem, we chose two adjacent days (small SZA effect) with obviously different AOD levels: a clean day (A day: August 21, 2012; AOD =0.21, PM2.5=21.6 µg m−3) and a day with high aerosol pollution (B day; 26 August 2012; AOD =3.2, PM2.5=125.0 µg m−3) (Table 7). The difference in AOD between the two days can be taken to represent the maximum daytime gap of AOD for this month. The ozone column concentrations for these two days were 302 and 301 DU, respectively, of which the effect on j(O1D) is negligible. Under these conditions, the j(O1D) value at noon decreases from 3.23×10⁵ s−1 on A day to 1.29×10⁵ s−1 on B day (i.e., a 60 % reduction), and the j(NO2) value at noon decreases from s−1 on A day to s−1 on B day (i.e., a 49.2 % reduction). As shown in Table 7, B day has higher AOD and higher concentrations of gaseous pollutants. The concentrations of CO, NO2, and HCHO and the OH reactivity of VOCs in B day are much higher than in A day, with ratios of 3.5, 2.3, 3.4, and 4.9, respectively. The simultaneous increases of gaseous pollutants and AOD are due to the fact that gaseous pollutants (NOx, SO2, and VOCs) emitted by major pollution sources in Beijing, including traffic and industry, have undergone the processes of gas-phase oxidation and nucleation to generate secondary particulate matter that contributes to aerosol light extinction. Previous studies have reported that secondary particulate matter has accounted for more than 60 % of total particulate matter during severe smog pollution in Beijing summers (T. Han et al., 2015; Guo et al., 2014). In addition, several studies have shown that secondary components in particulate matter (especially secondary organics and ammonium sulfate) have dominated the aerosol light extinction (Han et al., 2014, 2017; Wang et al., 2015). Observations made in Beijing during the summer of 2006 showed that ammonium sulfate and ammonium nitrate contributed 44.6 % and 22.3 %, respectively, to the total extinction coefficient during a severe period of smog (Han et al., 2014); in the summer of 2014 in Beijing, ammonium sulfate, secondary organic aerosols, and ammonium nitrate contributed 30 %, 22 %, and 18 %, respectively, to the total extinction coefficient (Han et al., 2017).
Table 7Mean and standard deviation of observed data during daytime (06:00–18:00) for A day and B day.
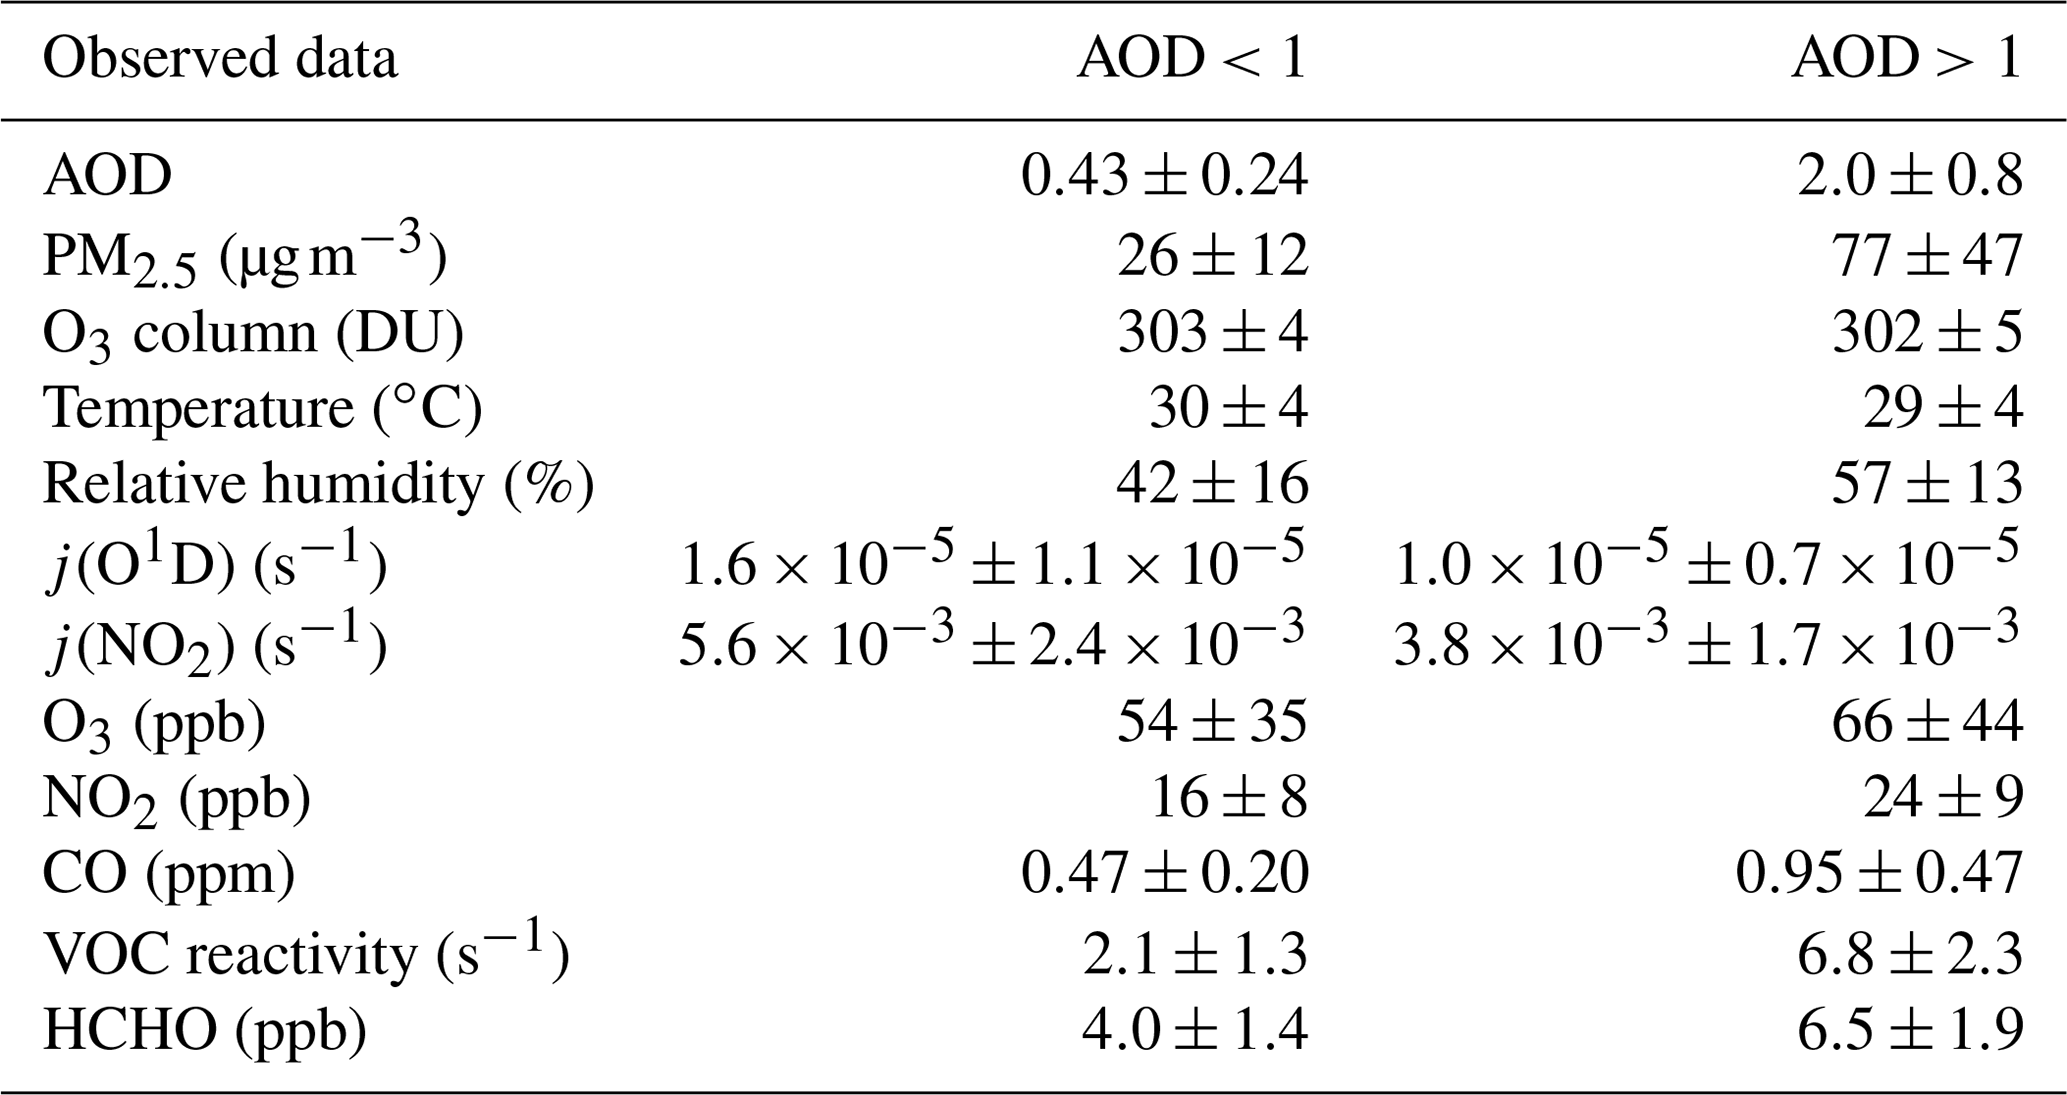
As shown in Fig. 11, the simulation results indicate that the net P(O3) of B day is 36.2 % higher than that of A day due to higher concentrations of ozone precursors on B day. This result is consistent with the observed ozone concentrations, of which the observed ozone concentration in B day is 1.7 times higher than that of A day. If we adjust the photolysis frequencies level of B day to the level of A day, the net P(O3) increases by 70.0 %, which indicates that the high level of particulate matter in B day greatly inhibits ozone production. This result means that the system is under negative feedback, thus keeping O3 at a relatively stable level. Table 8 summarizes the average levels of gaseous pollutants and photolysis frequencies for AOD less than 1 and greater than 1, as measured during August 2012. It shows that the concentrations of ozone's precursors are higher and the photolysis frequencies are lower at high AOD levels (AOD >1) than those at a low AOD level (AOD <1). This result means that the negative feedback mechanism is prevalent throughout the whole campaign period. Therefore, the prevention and control measures of air pollution in Beijing need to incorporate this coupling mechanism between particulate matter and ozone to achieve effective control of these two main pollutants.
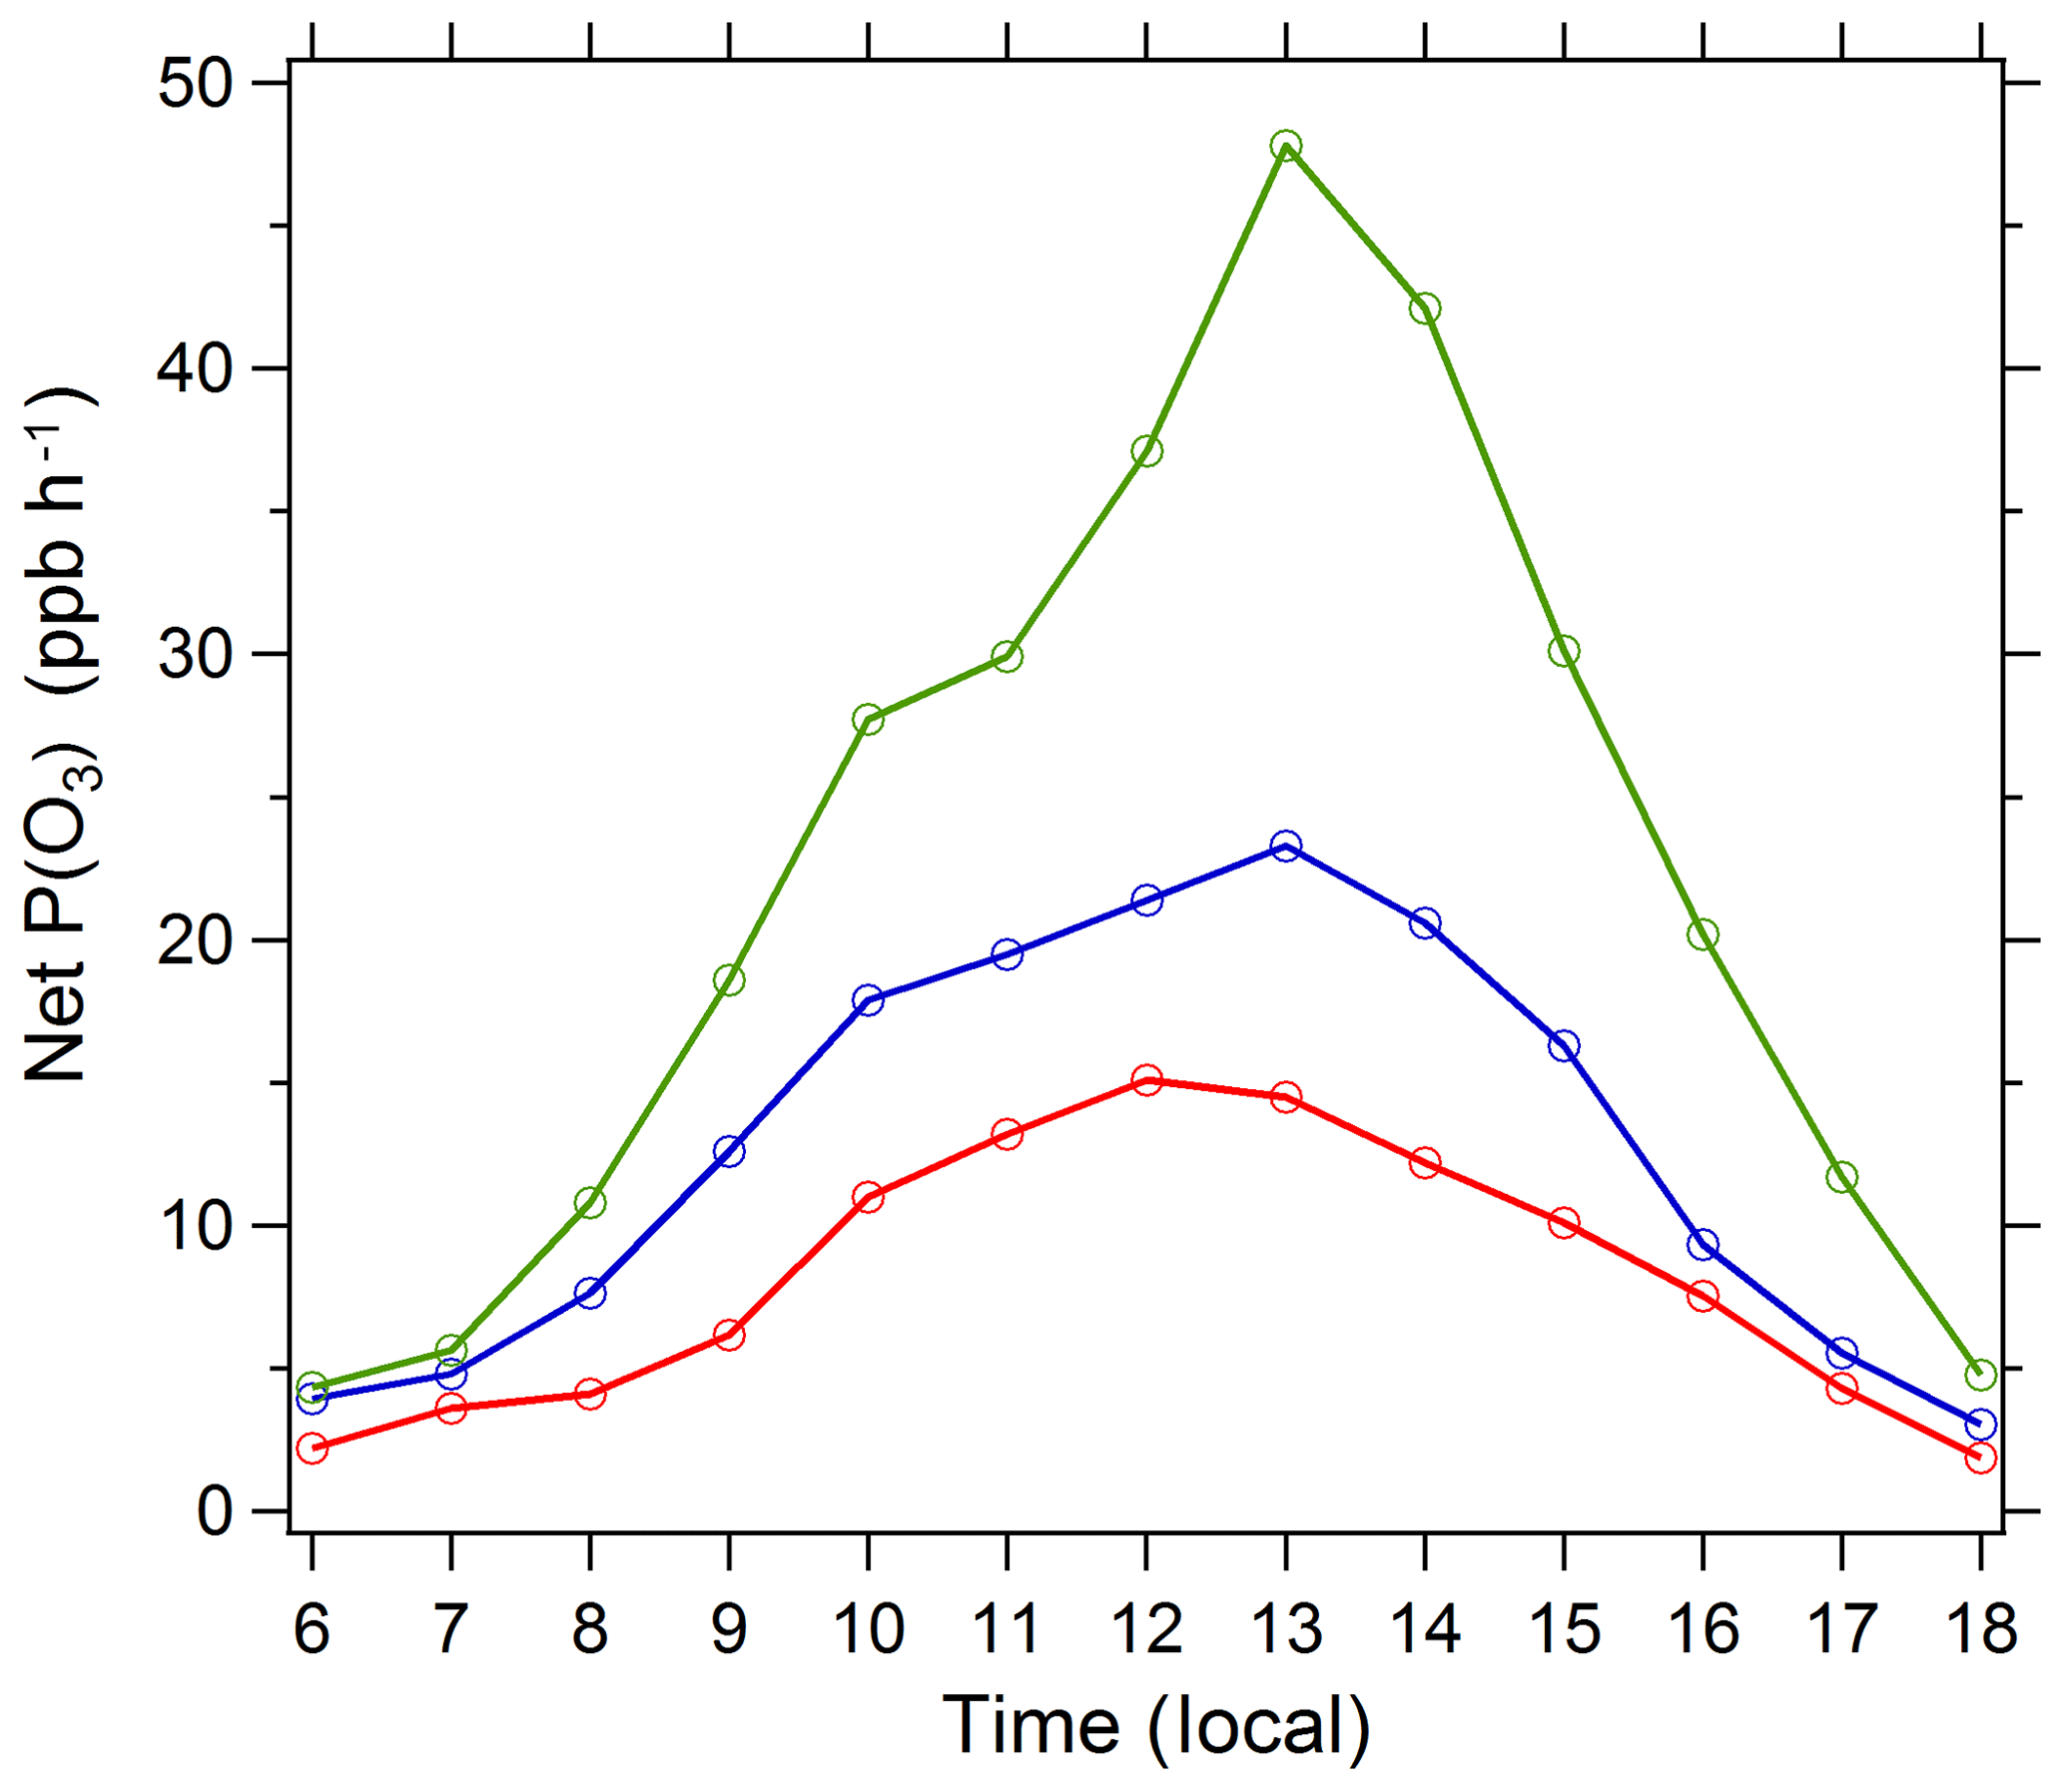
Figure 11Diurnal profile of net P(O3) simulated by the box model. Three cases are displayed: (1) A day (red circles), 21 August 2012, with a low AOD level and high photolysis frequencies; (2) B day (blue circles), 26 August 2012, with a high AOD level and low photolysis frequencies; and (3) the photolysis frequencies of B day adjusted to the level of A day with other conditions unchanged (green circles). The specific conditions of A day and B day are listed in Table 7.
Table 8Monthly mean and standard deviation of observed data during daytime (06:00–18:00) under the conditions of AOD less than 1 and larger than 1 in August 2012.
Photolysis reactions are important driving forces for tropospheric photochemical oxidation processes and ozone production. In this study, we explored in detail the effects of aerosols on photolysis frequencies and ozone production in Beijing, based on a long observation period of 4 years. We have found the following:
-
There is a strong correlation between PM2.5 and AOD, and the slope in summer is significantly smaller than in winter, which indicates that aerosols in summer have a more efficient extinction capacity than in winter.
-
As AOD increased, the extinction effect of aerosol on photolysis frequencies was decreased; this result was probably related to a higher proportion of scattering aerosols under high AOD conditions than under low AOD conditions. The slope of the correlation between photolysis frequencies and AOD indicates that the aerosols in Beijing have a stronger extinction on actinic flux than absorptive dust aerosols in the Mediterranean.
-
The influence of AOD on photolysis frequencies was evaluated quantitatively by establishing parametric equations. According to the parametric equation, aerosols lead to a decrease in seasonal mean j(NO2) by 24 % and 30 % for summer and winter, respectively, and a corresponding decrease in seasonal mean j(O1D) by 27 % and 33 % respectively, compared to an aerosol-free atmosphere.
-
In order to evaluate the effects of aerosols on ozone production rate, we carried out an observation campaign in August 2012. The results show that aerosols reduced the net ozone production rate by 25 % by reducing the photolysis frequencies. High concentrations of ozone gaseous precursors were often accompanied by high concentrations of particulate matter, which, to a large extent, inhibited excessive levels of ozone generation and reflected the negative feedback effect of the atmospheric system. Therefore, the influence of aerosol on photolysis frequencies and thus on the rate of oxidation of VOCs and NOx to ozone and secondary aerosol is important for determining the atmospheric effects of controlling the precursor emissions of these two important air pollutants (aerosols and ozone).
The data can be accessed upon contact with the corresponding authors.
The supplement related to this article is available online at: https://doi.org/10.5194/acp-19-9413-2019-supplement.
WW acquired, analysed, and interpreted data, drafted the article, and revised it critically. MS and XL substantially contributed to conception and design and revised the article critically. MH, LZ, YW, and TT collected data.
The authors declare that they have no conflict of interest.
We thank Hongbin Chen and Philippe Goloub for data management of AOD and other aerosol optical properties on AERONET.
This research has been supported by the Major Program of the National Natural Science Foundation of China (grant no. 91644222).
This paper was edited by Stelios Kazadzis and reviewed by two anonymous referees.
Bais, A. F., Kazantzidis, A., Kazadzis, S., Balis, D. S., Zerefos, C. S., and Meleti, C.: Deriving an effective aerosol single scattering albedo from spectral surface UV irradiance measurements, Atmos. Environ., 39, 1093–1102, https://doi.org/10.1016/j.atmosenv.2004.09.080, 2005.
Bohn, B., Corlett, G. K., Gillmann, M., Sanghavi, S., Stange, G., Tensing, E., Vrekoussis, M., Bloss, W. J., Clapp, L. J., Kortner, M., Dorn, H.-P., Monks, P. S., Platt, U., Plass-Dülmer, C., Mihalopoulos, N., Heard, D. E., Clemitshaw, K. C., Meixner, F. X., Prevot, A. S. H., and Schmitt, R.: Photolysis frequency measurement techniques: results of a comparison within the ACCENT project, Atmos. Chem. Phys., 8, 5373–5391, https://doi.org/10.5194/acp-8-5373-2008, 2008.
Casasanta, G., di Sarra, A., Meloni, D., Monteleone, F., Pace, G., Piacentino, S., and Sferlazzo, D.: Large aerosol effects on ozone photolysis in the Mediterranean, Atmos. Environ., 45, 3937–3943, https://doi.org/10.1016/j.atmosenv.2011.04.065, 2011.
Castro, T., Madronich, S., Rivale, S., Muhlia, A., and Mar, B.: The influence of aerosols on photochemical smog in Mexico City, Atmos. Environ., 35, 1765–1772, https://doi.org/10.1016/S1352-2310(00)00449-0, 2001.
Chang, D., Song, Y., and Liu, B.: Visibility trends in six megacities in China 1973–2007, Atmos. Res., 94, 161-167, https://doi.org/10.1016/j.atmosres.2009.05.006, 2009.
Che, H., Zhang, X., Li, Y., Zhou, Z., Qu, J. J., and Hao, X.: Haze trends over the capital cities of 31 provinces in China, 1981–2005, Theor. Appl. Climatol., 97, 235–242, https://doi.org/10.1007/s00704-008-0059-8, 2009.
Corr, C. A., Krotkov, N., Madronich, S., Slusser, J. R., Holben, B., Gao, W., Flynn, J., Lefer, B., and Kreidenweis, S. M.: Retrieval of aerosol single scattering albedo at ultraviolet wavelengths at the T1 site during MILAGRO, Atmos. Chem. Phys., 9, 5813–5827, https://doi.org/10.5194/acp-9-5813-2009, 2009.
Daumont, D., Brion, J., Charbonnier, J., and Malicet, J.: Ozone UV spectroscopy I: absorption cross-sections at room temperature, J. Atmos. Chem., 15, 145–155, 1992.
de Miranda, R., Andrade, M. F., and Fattori, A. P.: Preliminary studies of the effect of aerosols on nitrogen dioxide photolysis rates in the city of Sao Paulo, Brazil, Atmos. Res., 75, 135–148, https://doi.org/10.1016/j.atmosres.2004.12.004, 2005.
Dickerson, R. R., Kondragunta, S., Stenchikov, G., Civerolo, K. L., Doddridge, B. G., and Holben, N.: The impact of aerosols on solar ultraviolet radiation and photochemical smog, Science, 278, 827–830, https://doi.org/10.1126/science.278.5339.827, 1997.
Edwards, G. D. and Monks, P. S.: Performance of a single monochromator diode array spectroradiometer for the determi- nation of actinic flux and atmospheric photolysis frequencies, J. Geophys. Res., 108, 8546, doi:10.1029/2002JD002844, 2003.
Ehhalt, D. H. and Rohrer, F.: Dependence of the OH concentration on solar UV, J. Geophys. Res.-Atmos., 105, 3565–3571, https://doi.org/10.1029/1999JD901070, 2000.
Eskes, H. J., Van Velthoven, P. F. J., Valks, P. J. M., and Kelder, H. M.: Assimilation of GOME total ozone satellite observations in a three-dimensional tracer transport model, Q. J. Roy. Meteor. Soc., 129, 1663–1681, https://doi.org/10.1256/qj.02.14, 2003.
Finlayson-Pitts, B. J. and Pitts, J. N.: Chemistry of the Upper and Lower Atmosphere, Academic Press, New York, 2000.
Flynn, J., Lefer, B., Rappenglück, B., Leuchner, M., Perna, R., Dibb, J., Ziemba, L., Anderson, C., Stutz, J., Brune, W., and Ren, X. R.: Impact of clouds and aerosols on ozone production in Southeast Texas, Atmos. Environ., 44, 4126–4133, https://doi.org/10.1016/j.atmosenv.2009.09.005, 2010.
Fotiadi, A., Hatzianastassiou, N., Drakakis, E., Matsoukas, C., Pavlakis, K. G., Hatzidimitriou, D., Gerasopoulos, E., Mihalopoulos, N., and Vardavas, I.: Aerosol physical and optical properties in the Eastern Mediterranean Basin, Crete, from Aerosol Robotic Network data, Atmos. Chem. Phys., 6, 5399–5413, https://doi.org/10.5194/acp-6-5399-2006, 2006.
Garland, R. M., Schmid, O., Nowak, A., Achtert, P., Wiedensohler, A., Gunthe, S. S., Takegawa, N., Kita, K., Kondo, Y., and Hu, M.: Aerosol optical properties observed during Campaign of Air Quality Research in Beijing 2006 (CAREBeijing-2006): Characteristic differences between the inflow and outflow of Beijing city air, J. Geophys. Res.-Atmos., 114, D00G04, https://doi.org/10.1029/2008JD010780, 2009.
Gerasopoulos, E., Kazadzis, S., Vrekoussis, M., Kouvarakis, G., Liakakou, E., Kouremeti, N., Giannadaki, D., Kanakidou, M., Bohn, B., and Mihalopoulos, N.: Factors affecting O3 and NO2 photolysis frequencies measured in the eastern Mediterranean during the five-year period 2002–2006, J. Geophys. Res.-Atmos., 117, D22305, https://doi.org/10.1029/2012JD017622, 2012.
Goliff, W. S., Stockwell, W. R., and Lawson, C. V.: The regional atmospheric chemistry mechanism, version 2, Atmos. Environ., 68, 174–185, https://doi.org/10.1016/j.atmosenv.2012.11.038, 2013.
Guo, S., Hu M, Zamora, M. L., Peng, J. F., Shang, D. J., Zheng, J., Du, Z. F., Wu, Z. J., Shao, M., Zeng, L. M., Molina, M. J., and Zhang, R. Y.: Elucidating severe urban haze formation in China, P. Natl. Acad. Sci. USA, 111, 17373–17378, https://doi.org/10.1073/pnas.1419604111, 2014.
Han, T., Liu, X., Zhang, Y., Qu, Y., Zeng, L., Hu, M., and Zhu, T.: Role of secondary aerosols in haze formation in summer in the Megacity Beijing, J. Environ. Sci., 31, 51–60, https://doi.org/10.1016/j.jes.2014.08.026, 2015.
Han, T. T., Liu, X. G., Zhang, Y. H., Qu, Y., Gu, J. W., Ma, Q., Lu, K. D., Tian, H. Z,, Chen, J., and Zeng, L. M.: Characteristics of aerosol optical properties and their chemical apportionments during CAREBeijing 2006, Aerosol Air Qual. Res., 14, 1431–1442, https://doi.org/10.4209/aaqr.2013.06.0203, 2014.
Han, T. T., Xu, W. Q., Chen, C., Liu, X. G., Wang, Q. Q., Li, J., Zhao, X. J., Du, W., Wang, Z. F., and Sun, Y. L.: Chemical apportionment of aerosol optical properties during the Asia-Pacific Economic Cooperation summit in Beijing, China, J. Geophys. Res.-Atmos., 120, 12281–12295, https://doi.org/10.1002/2015JD023918, 2015.
Han, T. T., Xu, W. Q., Li, J., Freedman, A., Zhao, J., Wang, Q. Q., Chen, C., Zhang, Y. J., Wang, Z. F., and Fu, P. Q.: Aerosol optical properties measurements by a CAPS single scattering albedo monitor: Comparisons between summer and winter in Beijing, China, J. Geophys. Res.-Atmos., 122, 2513–2526, https://doi.org/10.1002/2016JD025762, 2017.
He, S. and Carmichael, G. R.: Sensitivity of photolysis rates and ozone production in the troposphere to aerosol properties, J. Geophys. Res.-Atmos., 104, 26307–26324, https://doi.org/10.1029/1999JD900789, 1999.
Hendrick, F., Müller, J.-F., Clémer, K., Wang, P., De Mazière, M., Fayt, C., Gielen, C., Hermans, C., Ma, J. Z., Pinardi, G., Stavrakou, T., Vlemmix, T., and Van Roozendael, M.: Four years of ground-based MAX-DOAS observations of HONO and NO2 in the Beijing area, Atmos. Chem. Phys., 14, 765–781, https://doi.org/10.5194/acp-14-765-2014, 2014.
Hodzic, A., Madronich, S., Bohn, B., Massie, S., Menut, L., and Wiedinmyer, C.: Wildfire particulate matter in Europe during summer 2003: meso-scale modeling of smoke emissions, transport and radiative effects, Atmos. Chem. Phys., 7, 4043–4064, https://doi.org/10.5194/acp-7-4043-2007, 2007.
Hofzumahaus, A., Kraus, A., and Muller, M.: Solar actinic flux spectroradiometry: A technique for measuring photolysis frequencies in the atmosphere, Appl. Optics, 38, 4443–4460, https://doi.org/10.1364/AO.38.004443, 1999.
Hofzumahaus, A., Lefer, B. L., Monks, P. S., Hall, S. R., Kylling, A., Mayer, B., Shetter, R. E., Junkermann, W., Bais, A., Calvert, J. G., Cantrell, C. A., Madronich, S., Edwards, G. D., and Kraus, A.: Photolysis frequency of O3 to O(1D): Measurements and modeling during the International Photolysis Frequency Measurement and Modeling Intercomparison (IPMMI), J. Geophys. Res.-Atmos., 109, D08S90, https://doi.org/10.1029/2003JD004333, 2004.
Jacobson, M, Z.: Studying the effects of aerosols on vertical photolysis rate coefficient and temperature profiles over an urban airshed, J. Geophys. Res.-Atmos., 103, 10593–10604, https://doi.org/10.1029/98JD00287, 1998.
Kazadzis, S., Bais, A. F., Balis, D., Zerefos, C. S., and Blumthaler, M.: Retrieval of down-welling UV actinic flux density spectra from spectral measurements of global and direct solar UV irradiance, J. Geophys. Res., 105, 4857–4864, 2000.
Kazadzis, S., Topaloglou, C., Bais, A. F., Blumthaler, M., Balis, D., Kazantzidis, A., and Schallhart, B.: Actinic flux and O1D photolysis frequencies retrieved from spectral measurements of irradiance at Thessaloniki, Greece, Atmos. Chem. Phys., 4, 2215–2226, https://doi.org/10.5194/acp-4-2215-2004, 2004.
Kazadzis, S., Amiridis, V., and Kouremeti, N.: The Effect of Aerosol Absorption in Solar UV Radiation, Advances in Meteorology, Climatology and Atmospheric Physics, 1041–1047, 2012.
Krotkov, N., Bhartia, P. K., Herman, J., Slusser, J., Scott, G., Labow, G., Vasilkov, A. P., Eck, T. F., Dubovik, O., and Holben, B. N.: Aerosol ultraviolet absorption experiment (2000 to 2004), part 2: Absorption optical thickness, refractive index, and single scattering albedo, Opt. Eng., 44, 041005, https://doi.org/10.1117/1.1886819, 2005.
Kylling, A., Webb, A. R., Bais, A. F., Blumthaler, M., Schmitt, R., Thiel, S., Kazantzidis, A., Kift, R., Misslebeck, M., Schallhart, B., Schreder, J., Topaloglou, C., Kazadzis, S., and Rimmer, J.: Actinic flux determination from measurements of irradiance, J. Geophys. Res., 108, 4506–4515, 2005.
Lefer, B. L., Shetter, R. E., and Hall, S. R.: Impact of clouds and aerosols on photolysis frequencies and photochemistry during TRACE-P: 1. Analysis using radiative transfer and photochemical box models, J. Geophys. Res.-Atmos., 108, 8821–8835, https://doi.org/10.1029/2002JD003171, 2003.
Li, J., Wang, Z. F., Wang, X., Yamaji, K., Takigawa, M., Kanaya, Y., Pochanart, P., Liu, Y., Irie, H., Hu, B., Tanimoto, H., and Akimoto, H.: Impacts of aerosols on summertime tropospheric photolysis frequencies and photochemistry over Central Eastern China, Atmos. Environ., 45, 1817–1829, https://doi.org/10.1016/j.atmosenv.2011.01.016, 2011.
Liao, H., Yung, Y. L., and Seinfeld, J. H.: Effects of aerosols on tropospheric photolysis rates in clear and cloudy atmospheres, J. Geophys. Res., 104, 23697–23707, 1999.
Liu, Q. Y., Ma, T. M., Olson, M. R., Liu, Y. J., Zhang, T. T., Wu, Y., and Schauer, J. J.: Temporal variations of black carbon during haze and non-haze days in Beijing, Sci. Rep., 6, 33331, https://doi.org/10.1038/srep33331, 2016.
Liu, X. G., Zhang, Y. H., Jung, J. S., Gu, J. W., Li, Y. P., Guo, S., Chang, S. Y., Yue, D. L., Lin, P., Kim, Y. J., Hu, M., Zeng, L. M., and Zhu, T.: Research on the hygroscopic properties of aerosols by measurement and modeling during CAREBeijing-2006, J. Geophys. Res.-Atmos., 114, D00G16, https://doi.org/10.1029/2008JD010805, 2009.
Lou, S. J., Liao, H., and Zhu, B.: Impacts of aerosols on surface-layer ozone concentrations in China through heterogeneous reactions and changes in photolysis rates. Atmos. Environ., 85, 123–138, https://doi.org/10.1016/j.atmosenv.2013.12.004, 2014.
Lu, K. D., Rohrer, F., Holland, F., Fuchs, H., Bohn, B., Brauers, T., Chang, C. C., Häseler, R., Hu, M., Kita, K., Kondo, Y., Li, X., Lou, S. R., Nehr, S., Shao, M., Zeng, L. M., Wahner, A., Zhang, Y. H., and Hofzumahaus, A.: Observation and modelling of OH and HO2 concentrations in the Pearl River Delta 2006: a missing OH source in a VOC rich atmosphere, Atmos. Chem. Phys., 12, 1541–1569, https://doi.org/10.5194/acp-12-1541-2012, 2012.
Ma, X. Y., Wang, J. Y., Yu, F. Q., Jia, H. L., and Hu, Y. N.: Can MODIS AOD be employed to derive PM2.5 in Beijing-Tianjin-Hebei over China?, Atmos. Res., 181, 250–256, https://doi.org/10.1016/j.atmosres.2016.06.018, 2016.
Ma, Z. W., Hu, X. F., Huang, L., Bi, J., and Liu, Y.: Estimating Ground-Level PM2.5 in China Using Satellite Remote Sensing, Environ. Sci. Technol., 48, 7436–7444, 2014.
Madronich, S.: The Atmosphere and UV-B Radiation at Ground Level, Environmental UV Photobiology, 1–39, https://doi.org/10.1007/978-1-4899-2406-3_1, 1993.
Madronich, S. and Flocke, S.: The role of solar radiation in atmospheric chemistry, in: Environmental Photochemistry, edited by: Boule, P., Springer-Verlag, New York, 1–26, 1999.
Mailler, S., Menut, L., di Sarra, A. G., Becagli, S., Di Iorio, T., Bessagnet, B., Briant, R., Formenti, P., Doussin, J.-F., Gómez-Amo, J. L., Mallet, M., Rea, G., Siour, G., Sferlazzo, D. M., Traversi, R., Udisti, R., and Turquety, S.: On the radiative impact of aerosols on photolysis rates: comparison of simulations and observations in the Lampedusa island during the ChArMEx/ADRIMED campaign, Atmos. Chem. Phys., 16, 1219–1244, https://doi.org/10.5194/acp-16-1219-2016, 2016.
Malicet, J., Daumont, D., Charbonnier, J., Parisse, C., Chakir, A., and Brion, J.: Ozone UV spectroscopy. II. Absorption cross-sections and temperature dependence, J. Atmos. Chem., 21, 263–273, 1995.
Matsumi, Y., Comes, F. J., Hancock, G., Hofzumahaus, A., Hynes, A. J., Kawasaki, M., and Ravishankara, A. R.: Quantum yields for production of O(1D) in the ultraviolet photolysis of ozone: recommendation based on evaluation of laboratory data, J. Geophys. Res., 107, 4024, https://doi.org/10.1029/2001JD000510, 2002.
Merienne, M. F., Jenouvrier, A., and Coquart, B.: The NO2 absorption spectrum: 1. Absorption cross-sections at ambient temperature in the 300–500 nm region, J. Atmos. Chem., 20, 281–297, 1995.
Mihelcic, D., Holland, F., Hofzumahaus, A., Hoppe, L., Konrad, S., Müsgen, P., Pätz, H. W., Schäfer, H. J., Schmitz, T., Volz-Thomas, A., Bächmann, K., Schlomski, S., Platt, U., Geyer, A., Alicke, B., and Moortga, G. K.: Peroxy radicals during BERLIOZ at Pabstthum: Measurements, radical budgets and ozone production, J. Geophys. Res., 108, 8254, https://doi.org/10.1029/2001JD001014, 2003.
Peeters, J., Nguyen, T. L., and Vereecken, L.: HOX radical regeneration in the oxidation of isoprene, Phys. Chem. Chem. Phys., 11, 5935–5939, https://doi.org/10.1039/b908511d, 2009.
Péré, J. C., Bessagnet, B., Pont, V., Mallet, M., and Minvielle, F.: Influence of the aerosol solar extinction on photochemistry during the 2010 Russian wildfires episode, Atmos. Chem. Phys., 15, 10983–10998, https://doi.org/10.5194/acp-15-10983-2015, 2015.
Raga, G. B., Castro, T., and Baumgardner, D.: The impact of megacity pollution on local climate and implications for the regional environment: Mexico City, Atmos. Environ., 35, 1805–1811, https://doi.org/10.1016/S1352-2310(00)00275-2, 2001.
Real, E. and Sartelet, K.: Modeling of photolysis rates over Europe: impact on chemical gaseous species and aerosols, Atmos. Chem. Phys., 11, 1711–1727, https://doi.org/10.5194/acp-11-1711-2011, 2011.
Rohrer, F., Lu, K. D., Hofzumahaus, A., Bohn, B., Brauers, T., Chang, C. C., Fuchs, H., Haseler, R., Holland, F., and Hu, M.: Maximum efficiency in the hydroxyl-radical-based self-cleansing of the troposphere, Nat. Geosci., 7, 559–563, 2014.
Shetter, R. E.: Photolysis frequency of NO2: measurement and modeling during the International Photolysis Frequency Measurement and Modeling Intercomparison (IPMMI), J. Geophys. Res.-Atmos., 108, 8544, https://doi.org/10.1029/2002JD002932, 2003.
Shetter, R. E. and Muller, M.: Photolysis frequency measurements using actinic flux spectroradiometry during PEM-Tropics Mission: Instrumentation description and some results, J. Geophys. Res.-Atmos., 104, 5647–5661, https://doi.org/10.1029/98JD01381, 1999.
Stone, D., Whalley, L. K., and Heard, D. E.: Tropospheric OH and HO2 radicals: field measurements and model comparisons, Chem. Soc. Rev., 41, 6348–6404, https://doi.org/10.1039/c2cs35140d, 2012.
Tang, Y., Carmichael, G. R., Kurata, G., Uno, I., Weber, R. J., Song, C. H., Guttikunda, S. K., Woo, J. H., Streets, D. G., Wei, C., Clarke, A. D., Huebert, B., and Anderson, T. L.: Impacts of dust on regional tropospheric chemistry during the ACE-Asia experiment: a model study with observations, J. Geophys. Res.-Atmos., 109, D19S21, https://doi.org/10.1029/2003JD003806, 2004.
Tian, P., Wang, G. F., Zhang, R. J., Wu, Y. F., and Yan, P.: Impacts of aerosol chemical compositions on optical properties in urban Beijing, China, Particuology, 18, 155–164, https://doi.org/10.1016/j.partic.2014.03.014, 2015.
Tie, X. X., Madronich, S., Walters, S., Edwards, D. P., Ginoux, P., Mahowald, N., Zhang, R. Y., Lou, C., and Brasseur, G.: Assessment of the global impact of aerosols on tropospheric oxidants, J. Geophys. Res.-Atmos., 110, D03204, https://doi.org/10.1029/2004JD005359, 2005.
Topaloglou, C., Kazadzis, S., Bais, A. F., Blumthaler, M., Schallhart, B., and Balis, D.: NO2 and HCHO photolysis frequencies from irradiance measurements in Thessaloniki, Greece, Atmos. Chem. Phys., 5, 1645–1653, https://doi.org/10.5194/acp-5-1645-2005, 2005.
Trebs, I., Bohn, B., Ammann, C., Rummel, U., Blumthaler, M., Königstedt, R., Meixner, F. X., Fan, S., and Andreae, M. O.: Relationship between the NO2 photolysis frequency and the solar global irradiance, Atmos. Meas. Tech., 2, 725–739, https://doi.org/10.5194/amt-2-725-2009, 2009.
Troe, J.: Are primary quantum yields of NO2 photolysis at λ≤398 nm smaller than unity?, Z. Phys. Chem., 214, 573–581, 2000.
van Donkelaar, A., Martin, R. V., Brauer, M., Kahn, R., Levy, R., Verduzco, C., and Villeneuve, P. J.: Global Estimates of Ambient Fine Particulate Matter Concentrations from Satellite-Based Aerosol Optical Depth: Development and Application, Environ. Health Persp., 118, 847–855, https://doi.org/10.1289/ehp.0901623, 2010.
Verstraeten, W, W., Neu, J. L., Williams, J. E., Bowman, K. W., Worden, J. R., and Boersma, K. F.: Rapid increases in tropospheric ozone production and export from China, Nat. Geosci., 8, 690–695, https://doi.org/10.1038/NGEO2493, 2015.
Volkamer, R., Sheehy, P., Molina, L. T., and Molina, M. J.: Oxidative capacity of the Mexico City atmosphere – Part 1: A radical source perspective, Atmos. Chem. Phys., 10, 6969–6991, https://doi.org/10.5194/acp-10-6969-2010, 2010.
Wang, B., Shao, M., Lu, S. H., Yuan, B., Zhao, Y., Wang, M., Zhang, S. Q., and Wu, D.: Variation of ambient non-methane hydrocarbons in Beijing city in summer 2008, Atmos. Chem. Phys., 10, 5911–5923, https://doi.org/10.5194/acp-10-5911-2010, 2010.
Wang, Q., Sun, Y., Jiang, Q., Du, W., Sun, C., Fu, P., and Wang, Z.: Chemical composition of aerosol particles and light extinction apportionment before and during the heating season in Beijing, China, J. Geophys. Res.-Atmos., 120, 12708–12722, https://doi.org/10.1002/2015JD023871, 2015.
Xin, J. Y., Gong, C. S., Liu, Z. R., Cong, Z. Y., Gao, W. K., Song, T., Pan, Y. P., Sun, Y., Ji, D. S., Wang, L. L., Tang, G. Q., and Wang, Y. S.: The observation-based relationships between PM2.5 and AOD over China, J. Geophys. Res.-Atmos., 121, 10701–10716, https://doi.org/10.1002/2015JD024655, 2016.
Xu, J., Ma, J. Z., Zhang, X. L., Xu, X. B., Xu, X. F., Lin, W. L., Wang, Y., Meng, W., and Ma, Z. Q.: Measurements of ozone and its precursors in Beijing during summertime: impact of urban plumes on ozone pollution in downwind rural areas, Atmos. Chem. Phys., 11, 12241–12252, https://doi.org/10.5194/acp-11-12241-2011, 2011.
Zhang, J. P., Zhu, T., Zhang, Q. H., Li, C. C., Shu, H. L., Ying, Y., Dai, Z. P., Wang, X., Liu, X. Y., Liang, A. M., Shen, H. X., and Yi, B. Q.: The impact of circulation patterns on regional transport pathways and air quality over Beijing and its surroundings, Atmos. Chem. Phys., 12, 5031–5053, https://doi.org/10.5194/acp-12-5031-2012, 2012.
Zhang, L., Shao, J., Lu, X., Zhao, Y., Hu, Y., Henze, D. K., Liao, H., Gong, S., and Zhang, Q.: Sources and Processes Affecting Fine Particulate Matter Pollution over North China: An Adjoint Analysis of the Beijing APEC Period, Environ. Sci. Technol., 50, 8731–8740, https://doi.org/10.1021/acs.est.6b03010, 2016.
Zhang, Q., Yuan, B., Shao, M., Wang, X., Lu, S., Lu, K., Wang, M., Chen, L., Chang, C.-C., and Liu, S. C.: Variations of ground-level O3 and its precursors in Beijing in summertime between 2005 and 2011, Atmos. Chem. Phys., 14, 6089–6101, https://doi.org/10.5194/acp-14-6089-2014, 2014.
Zhang, R., Jing, J., Tao, J., Hsu, S.-C., Wang, G., Cao, J., Lee, C. S. L., Zhu, L., Chen, Z., Zhao, Y., and Shen, Z.: Chemical characterization and source apportionment of PM2.5 in Beijing: seasonal perspective, Atmos. Chem. Phys., 13, 7053–7074, https://doi.org/10.5194/acp-13-7053-2013, 2013.
Zheng, C., Zhao, C., Zhu, Y., Wang, Y., Shi, X., Wu, X., Chen, T., Wu, F., and Qiu, Y.: Analysis of influential factors for the relationship between PM2.5 and AOD in Beijing, Atmos. Chem. Phys., 17, 13473–13489, https://doi.org/10.5194/acp-17-13473-2017, 2017.