the Creative Commons Attribution 4.0 License.
the Creative Commons Attribution 4.0 License.
 | 19 Jul 2019
The sensitivity of PM2.5 acidity to meteorological parameters and chemical composition changes: 10-year records from six Canadian monitoring sites
Ye Tao
Jennifer G. Murphy
Aerosol pH is difficult to measure directly but can be calculated if the chemical composition is known with sufficient accuracy and precision to calculate the aerosol water content and the H+ concentration through the equilibrium among acids and their conjugate bases. In practical terms, simultaneous measurements of at least one semi-volatile constituent, e.g. NH3 or HNO3, are required to provide a constraint on the calculation of pH. Long-term records of aerosol pH are scarce due to the limited monitoring of NH3 in conjunction with PM2.5. In this study, 10-year (2007–2016) records of pH of PM2.5 at six eastern Canadian sites were calculated using the E-AIM II model with the input of gaseous NH3, gaseous HNO3 and major water-soluble inorganic ions in PM2.5 provided by Canada's National Air Pollution Surveillance (NAPS) Program. Clear seasonal cycles of aerosol pH were found with lower pH (∼2) in summer and higher pH (∼3) in winter consistently across all six sites, while the day-to-day variations of aerosol pH were higher in winter compared to summer. Tests of the sensitivity of aerosol pH to meteorological parameters demonstrate that the changes in ambient temperature largely drive the seasonal cycle of aerosol pH. The sensitivity of pH to chemical composition shows that pH has different responses to the changes in chemical composition in different seasons. During summertime, aerosol pH was mainly determined by temperature with limited impact from changes in NHx or sulfate concentrations. However, in wintertime, both meteorological parameters and chemical composition contribute to the variations in aerosol pH, resulting in the larger variation during wintertime. This study reveals that the sensitivity of aerosol pH to chemical composition is distinctly different under different meteorological conditions and needs to be carefully examined for any particular region.
- Article
(7352 KB) -
Supplement
(4425 KB) - BibTeX
- EndNote


Aerosol acidity is among the most important parameters for atmospheric particulate chemistry as it has a large impact on both gas–particle partitioning of semi-volatile ionizable components and rates of many reactions occurring in aerosol liquid water (Seinfeld and Pandis, 2006; Losey et al., 2016; Guo et al., 2017a; Nah et al., 2018; Freedman et al., 2019). Laboratory and field studies have also shown that enhanced acidity in aerosol can increase the formation of secondary organic aerosol (Surratt et al., 2007; Zhang et al., 2007b), one of the major components responsible for particulate air pollution (Zhang et al., 2007a; Huang et al., 2014). Studies have shown that highly acidic particles can have adverse health effects related to respiratory diseases (Utell et al., 1983; Dockery et al., 1996). More acidic particles can enhance the solubility of several trace metals in fine particulate matter (PM2.5) to induce oxidative potential inside the human body as an indirect health effect of acidic particles (Fang et al., 2017).
pH is the parameter frequently used to describe the acidity of the aerosol aqueous phase and is calculated as the negative logarithm of hydrogen ion activity. Few methods can directly measure the pH of aerosol (Rindelaub et al., 2016; Craig et al., 2018; Wei et al., 2018), so aerosol acidity is usually presented using indirect proxies such as ion balance (cation-to-anion ratio), neutralization ratio and strong acidity (Σcation-Σanion) (Yao et al., 2006; Du et al., 2010; Zhou et al., 2017). However, these indirect methods can lead to substantial uncertainty in acidity assessment (Hennigan et al., 2015; Guo et al., 2016; Murphy et al., 2017). Calculation of pH through thermodynamic modelling such as E-AIM (Clegg et al., 1998) and ISORROPIA II (Fountoukis and Nenes, 2007), with the input of reliable chemical compositions of the aerosol and at least one semi-volatile gas and meteorological data, has been shown to be a more rigorous approach to calculate the pH of aerosol liquid water. Murphy et al. (2017) and Song et al. (2018) both showed that the constraint from phase partitioning of should be included in calculations using aerosol thermodynamic models to get reliable pH calculations, which indicates that NH3 observation can greatly improve the reliability of the aerosol acidity assessment.
However, long-term observations of NH3 with corresponding particulate matter composition measurements are very scarce. Some of the few long-term monitoring networks are NAMN in the UK, SEARCH in the US and NAPS in Canada. In the UK, 30 of the NAMN (National Ammonia Monitoring Network) sites have been providing monthly-integrated NH3 and particulate inorganic ionic composition data since 2000 (Tang et al., 2018). SEARCH (Southeastern Aerosol Research and CHaracterization Network) is one long-term monitoring program of NH3 in the United States, which has both 24 h average gas phase NH3 and particle phase ionic species measurements at eight sites located in the southeastern United States with a 3 d sampling frequency. In Canada, the National Air Pollution Surveillance (NAPS) program is the only program employing the long-term measurement of 24 h average NH3 concentrations with a 3 d sampling frequency at 12 monitoring sites where PM2.5 constituents are also measured.
Several studies have examined the response of pH to changes in chemical composition with conceptual modelling. Weber et al. (2016) showed that in summertime, aerosol tends to remain highly acidic with the reduction of sulfate and the increase in the ammonia-to-sulfate ratio. The modelling results of Guo et al. (2017b) showed that for wintertime meteorological conditions aerosol pH has similar sensitivity to NH3 concentrations in China and the eastern US under fixed temperature and relative humidity. These two sensitivity tests of aerosol pH suggest that aerosol pH seems to have weak response to chemical composition changes. However, these studies both carried out conceptual modelling or calculations under fixed meteorological parameters. The time series of aerosol pH in six regions within the United States calculated by Lawal et al. (2018) showed that pH has seasonal variation that depends on the region, suggesting that changes in meteorological conditions can also contribute to pH changes. Thus, the relative contributions of changes in meteorological conditions and chemical composition to variability in pH are still unclear and require systematic studies. As a result, in this study, we focus on the long-term variations of aerosol pH at six eastern Canadian sites (four urban and two rural) along with conceptual modelling of the sensitivity of aerosol pH to meteorological parameters and chemical composition changes to assess the major factors determining aerosol pH, and its variability, in different sites and seasons.
2.1 NAPS database and chosen study sites
All the PM2.5 composition and trace gas data used in this study were downloaded from the NAPS program website (http://maps-cartes.ec.gc.ca/rnspa-naps/data.aspx, last access: 4 December 2018). The NAPS program provides long-term monitoring of air-quality-relevant pollutants at various sites across Canada. Altogether, there are 12 sites with comprehensive gas phase and particle phase composition measurements, including 4 coastal sites (Halifax, Saint John, Burnaby and Abbotsford), 1 central site (Edmonton) and 7 eastern sites (Toronto, Simcoe, Hamilton, Windsor, Ottawa, Montreal and St Anicet). Ambient samples of gaseous components (including NH3 and HNO3) and the dominant inorganic components of PM2.5 were taken over 24 h from 00:00 to 24:00, generally every 3 d.
Six sites in the provinces of Ontario and Quebec were chosen for this study (Fig. 1), including Toronto (the largest city in Canada), Ottawa, two other metropolitan cities (Windsor and Montreal) and two sites in rural regions (Simcoe and St Anicet). The details of these monitoring sites including their longitudes and latitudes, NAPS monitoring station codes, and duration of the data record used for this study can be found in Table S1 in the Supplement. These sites were chosen because (1) they have long-term (at least 8-year) records of gaseous and PM2.5 chemical components concentrations, and (2) they are located in the central region of North America with little influence of sea salt (Vet et al., 2014) and therefore the acidity of PM2.5 is mainly dominated by the chemistry of sulfate, total nitrate and total ammonia (Young et al., 2013; Allen et al., 2015; Hennigan et al., 2015).
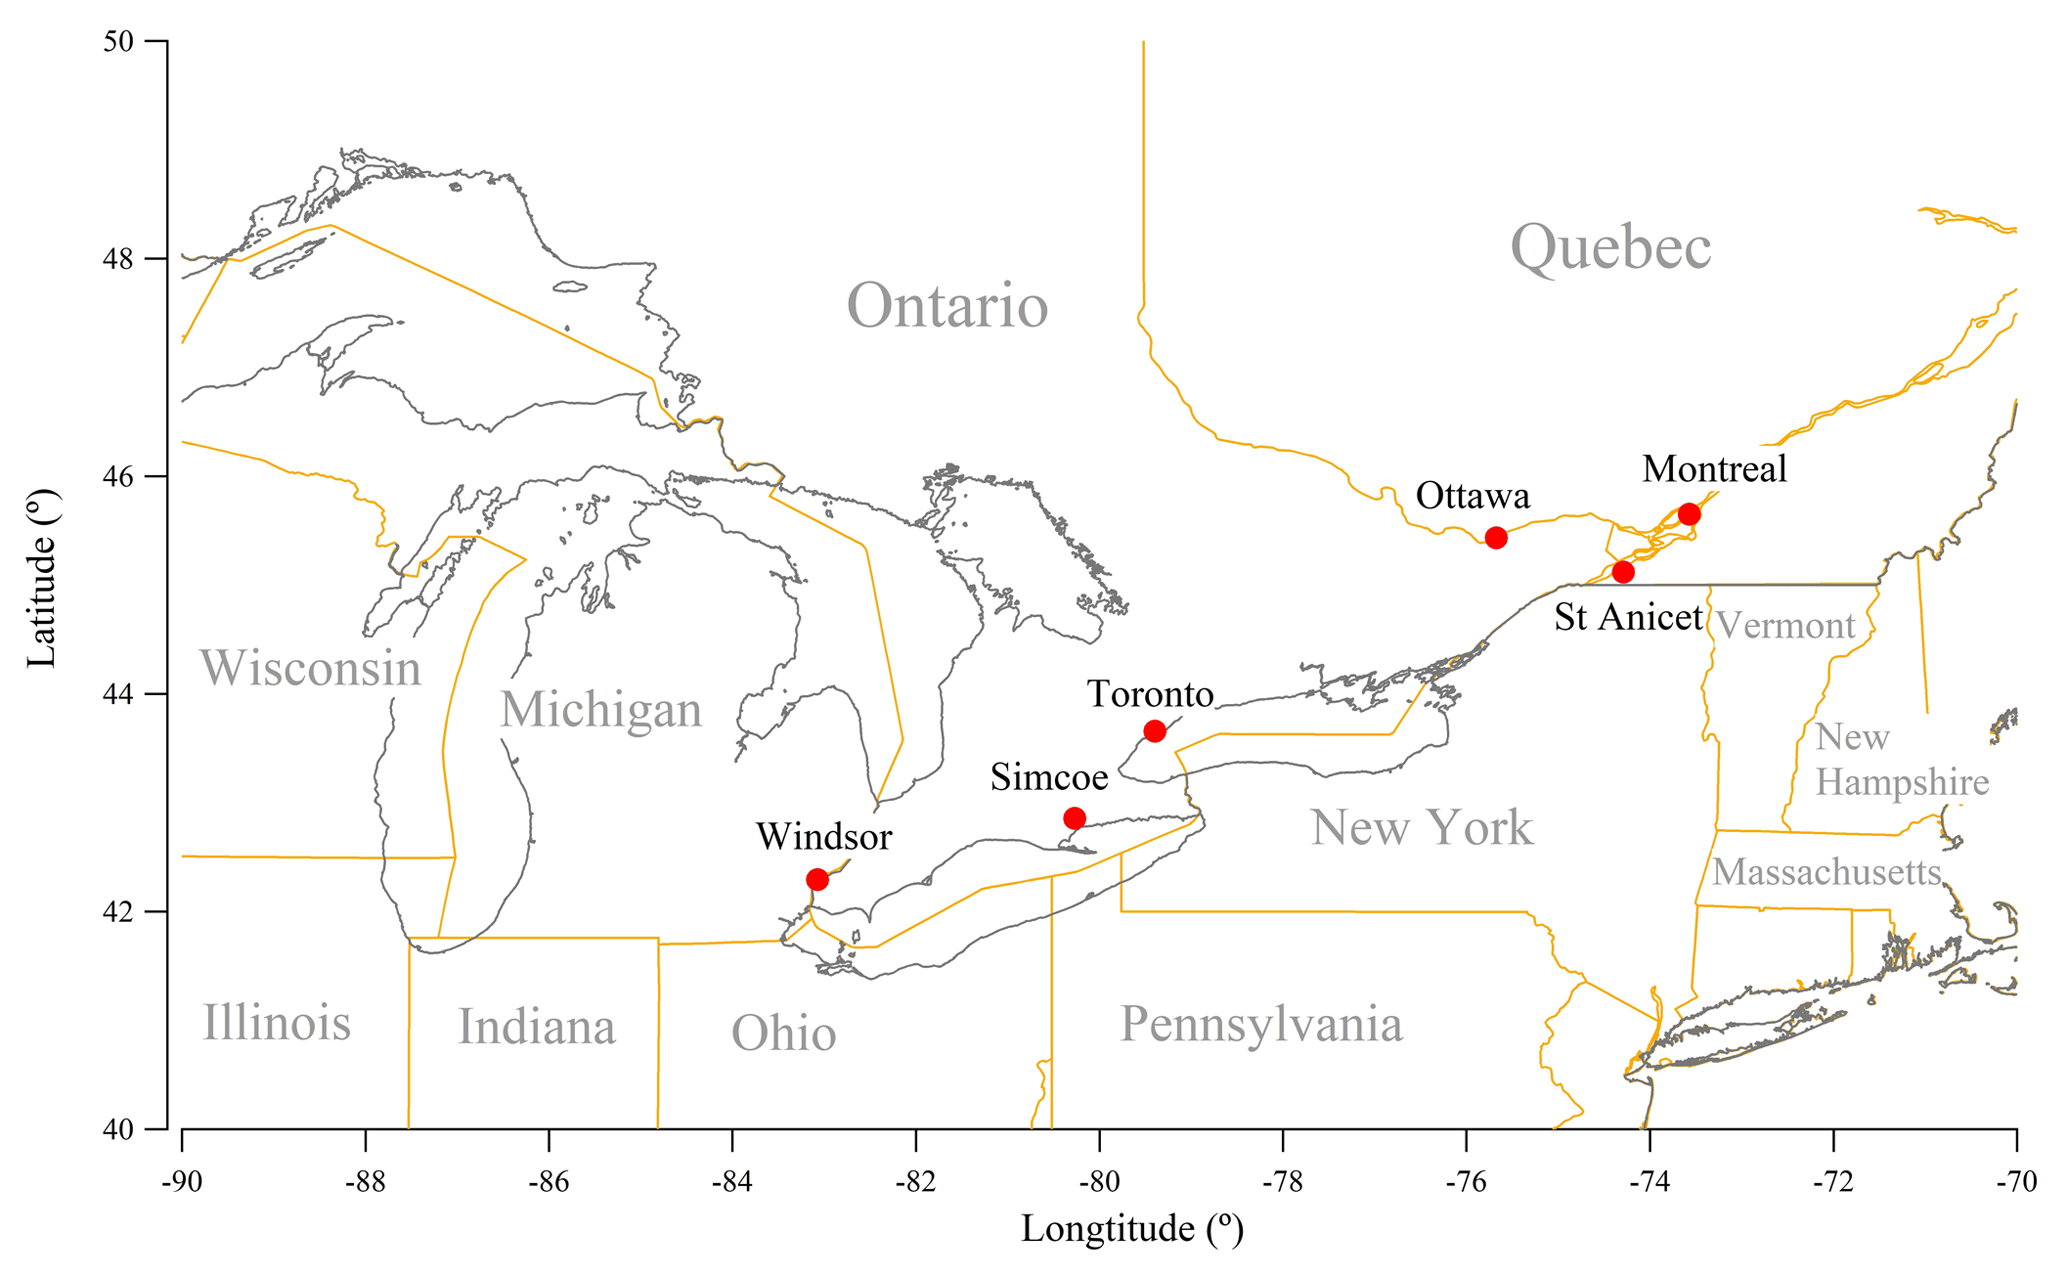
Figure 1Six NAPS monitoring sites chosen for this study: Toronto, Ottawa, Windsor, Montreal, Simcoe and St Anicet.
Measurements of 24 h average concentrations between 2007 and 2016 of alkaline and acidic gaseous components and major water-soluble inorganic ions in PM2.5 were used in this study for pH calculation. Citric acid-coated denuders were used to collect gas phase NH3 samples. Na2CO3-coated denuders were used to collect gas phase HNO3 samples. After alkaline and acidic gases were removed by passing through the two denuders, PM2.5 samples were captured by a filter pack consisting of a front Teflon filter and a back-up Nylon filter. The benefit of a nylon filter is that it captures volatized nitrate during sampling as the artefact of the evaporation ammonium nitrate and corrects the data accordingly (Yu et al., 2006; Babich et al., 2011). All the extracts were measured by ion chromatography. Field blanks were routinely performed as the background corrections. The detailed protocol for ambient constituent measurements for the NAPS database can be seen in Dabek-Zlotorzynska et al. (2011). In total, there are 1067, 851, 711, 840, 713 and 742 sets of valid data used at the sites of Toronto, Ottawa, Windsor, Montreal, Simcoe and St Anicet, respectively.
Relevant historical meteorological data including hourly average temperature, relative humidity and atmospheric pressure were downloaded from http://climate.weather.gc.ca (last access: 22 April 2019). The closest stations with complete data recordings were chosen as the meteorological data source. The 24 h average values of meteorological parameters during each sampling time period were calculated and used as the input for E-AIM thermodynamic calculation. Specifically, the St Clair meteorological station was chosen as the meteorological data source for the Toronto NAPS site (0.9 km from sampling site), the Delhi CS station for the Simcoe site (21 km), the Windsor A station for the Windsor site (9 km), the Ottawa CDA RCS station for the Ottawa site (6 km), the McTavish station for the Montreal site (16 km) and the St-Anicet 1 station for the St Anicet site (0.1 km).
2.2 E-AIM thermodynamic modelling
The Extended AIM thermodynamic model (http://www.aim.env.uea.ac.uk/aim/aim.php, last access: 29 August 2018) was applied for the calculation of aerosol acidity as E-AIM relies on few assumptions during the calculation of aerosol inorganic components' behaviour and it can also calculate the activity coefficient of each ion, which is crucial for aerosol pH calculation (Wexler, 2002). Specifically, model II, which mainly focuses on the thermodynamic calculations of the H+----H2O system (Clegg et al., 1998), was used in this study. Model II was chosen rather than model III or IV because it can deal with a wider range of relative humidity and temperature, which gives more reliable information on the seasonal variation of aerosol acidity. The SNA (sulfate, nitrate and ammonium) components in PM2.5 generally contributed more than 80 % of total measured charges in the particles. Temperature, relative humidity, total ammonia (summation of gas phase ammonia and ammonium in PM2.5), total nitrate (summation of gas phase nitrate acid and nitrate in PM2.5) and sulfate were used as the inputs for this model. Partitioning of both and allows for a strong constraint on the aerosol pH calculation (Murphy et al., 2017). Particles were forced to be metastable without any formation of salts or ice precipitation. Aerosol pH was calculated according to the following formula (Robinson and Stokes, 2002):
where is the activity of the hydrogen ion in aerosol liquid water, is the hydrogen ion's mole-fraction-based activity coefficient, is the mole fraction of the hydrogen ion, and 55.509 is the conversion factor from a mole-based activity coefficient to a molality-based one. Model IV was also used to assess the influence from non-volatile cations.
3.1 Time series of pH at six Canadian sites
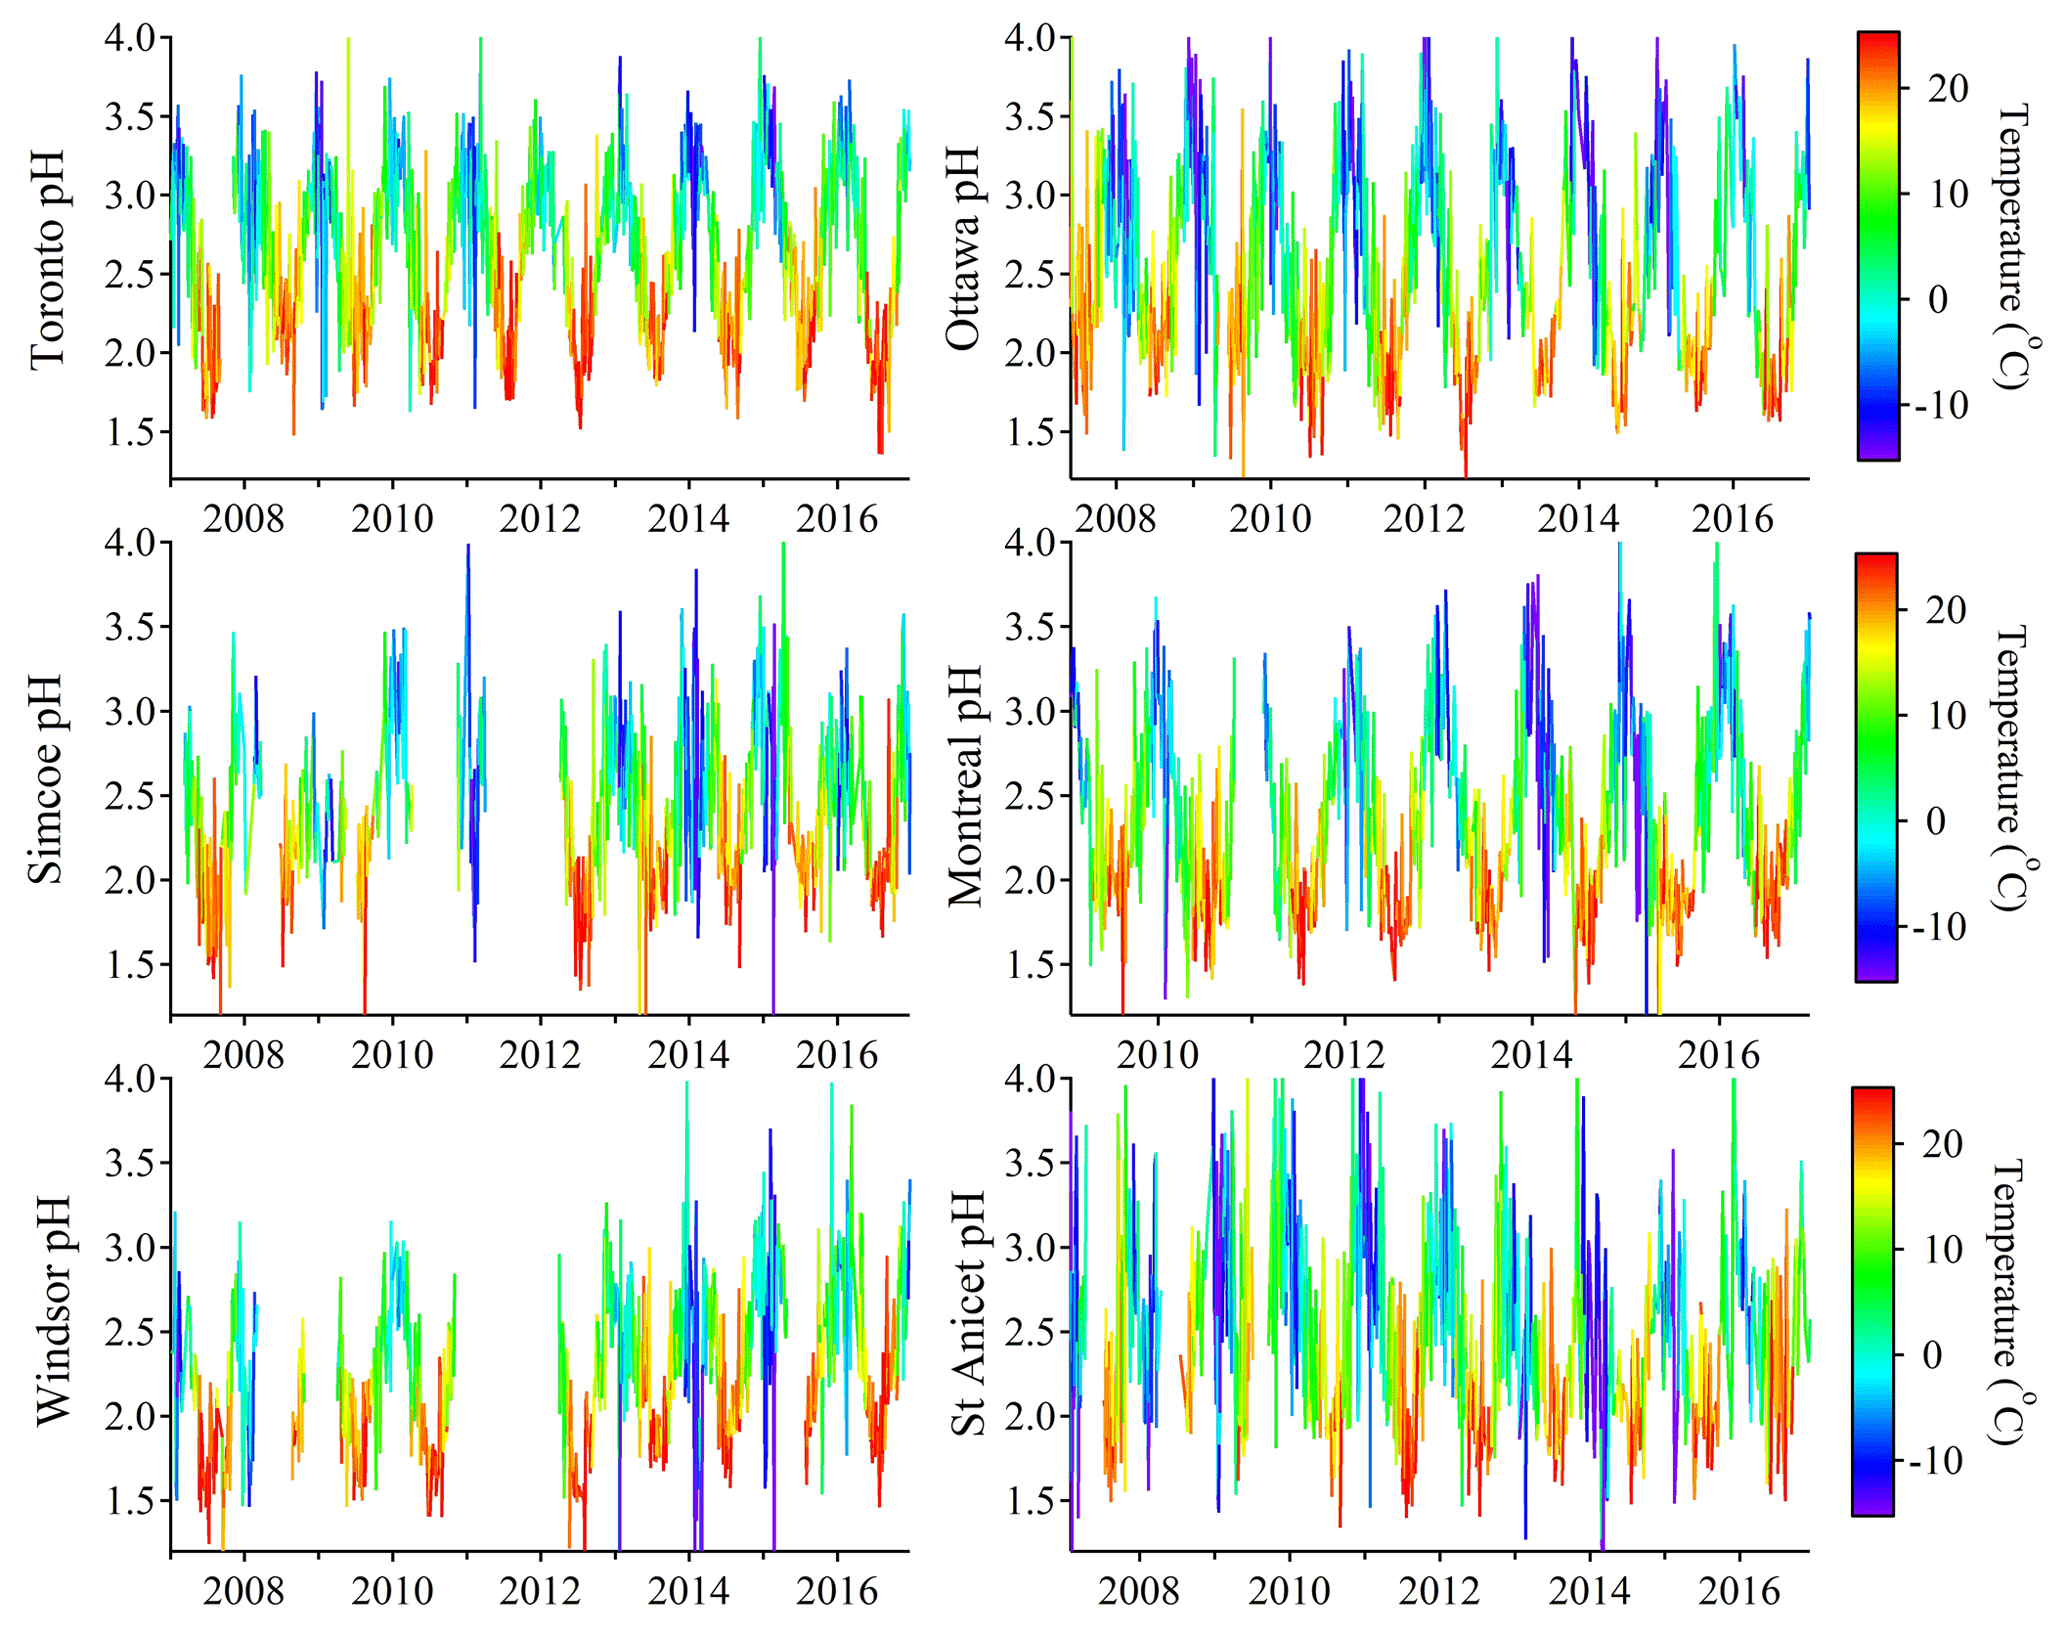
The 10-year time series of PM2.5 pH values at the six sites is illustrated in Fig. 2. To our knowledge, this is the first long-term study of aerosol pH in Canada and provides one of the longest records for the evaluation of trends anywhere in the world. The reliability of the pH calculations depends on several assumptions, including that daily average values are appropriate for the calculations, and that the gas and particle phases are equilibrated. The limitations of using the E-AIM II model also include the lack of consideration of non-volatile cations, aerosol liquid water contributed by organic species or possible phase separation etc. One rigorous method to evaluate the reliability of the calculated pH is to compare the input (measured) and output (modelled) gas-particle partitioning of semi-volatile species. The comparisons of modelled and measured gas phase fractions of total ammonia, denoted as , are plotted in Fig. S2 in the Supplement, where the linear regressions were all close to 1:1 line with high R2 (>0.88), indicating that the E-AIM modelling results are consistent with the observed phase partitioning characteristics of . The use of the phase partitioning of both and to constrain the aerosol pH helps to avoid significant over- or underpredictions (Murphy et al., 2017).
In Fig. 2, all the time series of aerosol pH show a strong seasonal oscillation pattern between 1.5 and 4.0. By colouring the pH values by ambient temperature, we can clearly see that particles were generally more acidic when ambient temperature was higher. This variation pattern is consistent in both spatial (six sites) and temporal (10-year) terms. In the long term, the seasonal variation of aerosol pH fits well with the variation of ambient temperature. However, larger variation of aerosol pH can be identified during wintertime. In some cases, the aerosol is very acidic, with pH < 2, even when temperature < 0 ∘C. This variation pattern is more clearly illustrated in the box-and-whisker plots of pH in each month at six sites shown in Fig. 3. The pH values are lowest in the summer (July and August averages <2) and highest in the winter (January and February averages >2.5). The aerosol was consistently more acidic and had smaller pH variation in warmer months, and showed higher average (and median) pH values but exhibited larger variation in wintertime.
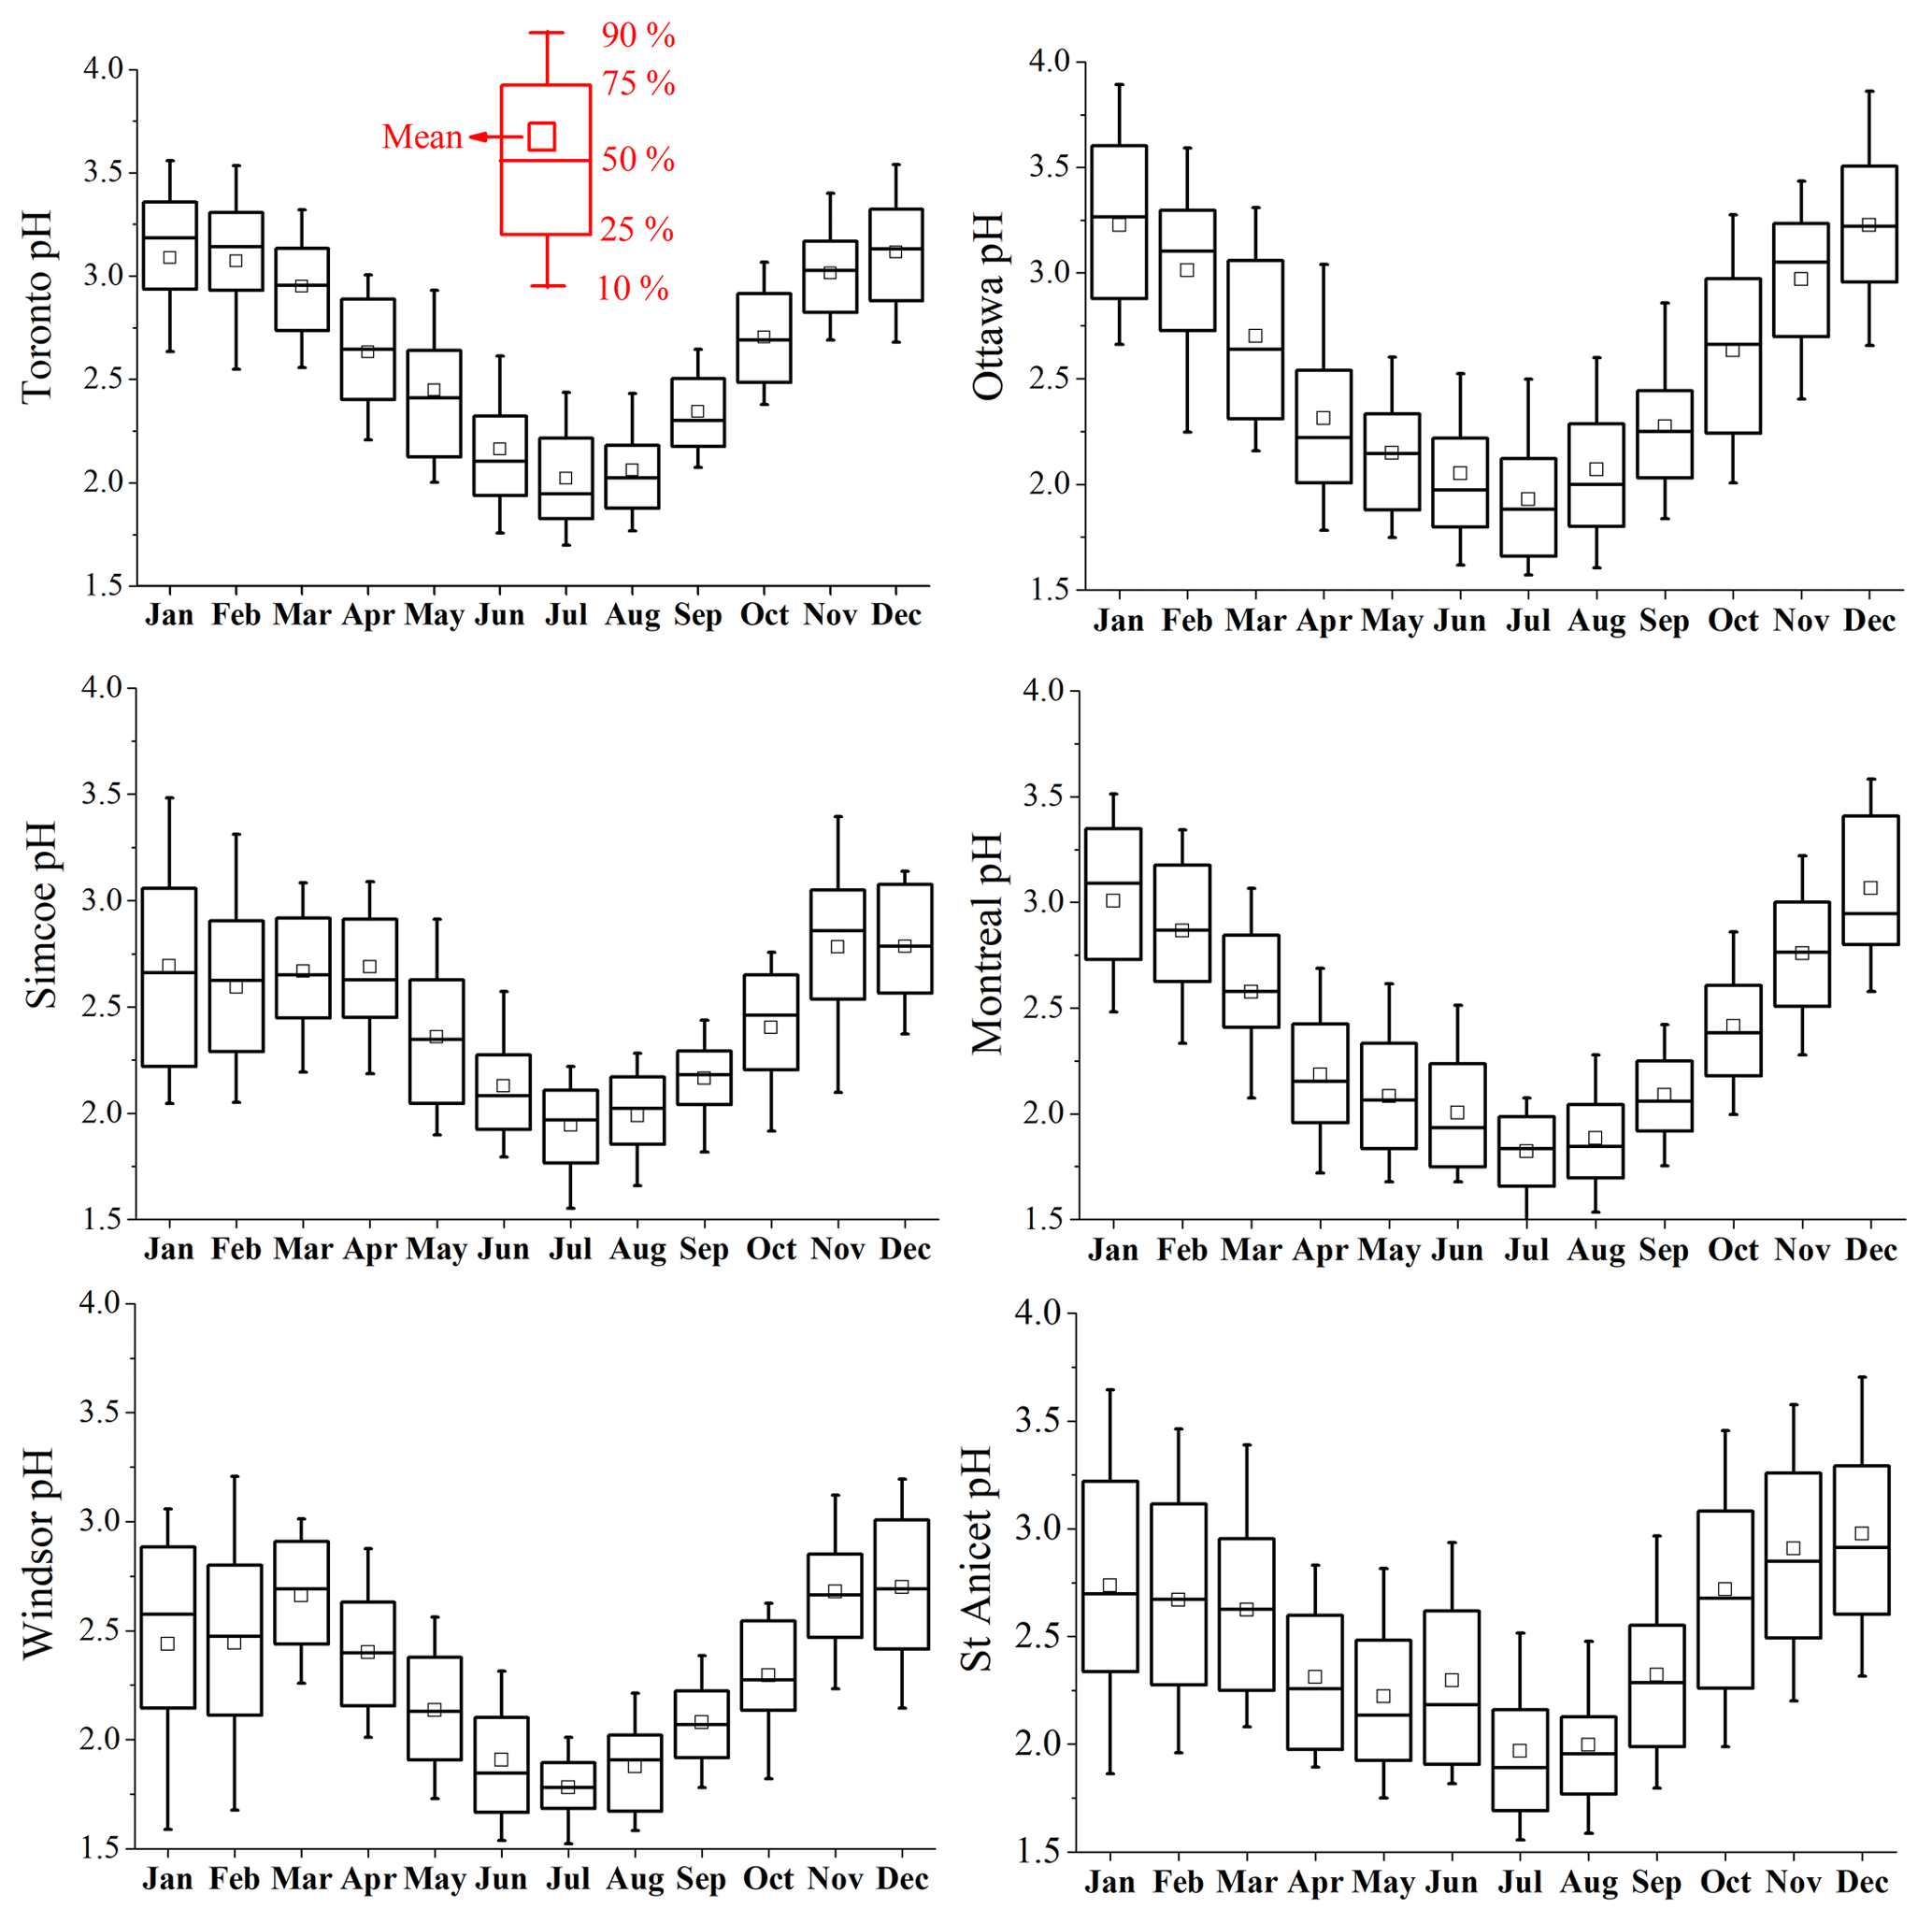
Figure 3The box-and-whisker plot of aerosol pH in each month at six sites. In each box, the top, middle and bottom lines represent the 75th, 50th and 25th percentiles of statistical data, the upper and lower whiskers represent 90th and 10th percentiles, and the square marks represent the mean value.
To assess the potential influence of non-volatile cations including Na+, K+, Mg2+ and Ca2+ on the seasonal variation pattern of aerosol pH, aerosol pH was also calculated using the E-AIM model IV (Friese and Ebel, 2010) with the input of a Na+ concentration representing the contributions of all non-volatile cations (). The pH calculation results are illustrated in Fig. S3. Because E-AIM IV deals with a narrower range of meteorological conditions (T≥263.15 K, RH ≥ 60 %), E-AIM IV calculations were only possible for a limited part of the data sets. However, shown in Fig. S3, E-AIM IV modelling results show similar time series compared to E-AIM II results. These results confirm that the aerosol pH seasonal variation pattern was not significantly affected by the non-volatile cations. The involvement of non-volatile cations typically increases pH values by less than 0.1, and the change is less than 0.4 for more than 90 % of data (shown in Fig. S4). Using Na+ to replace other non-volatile cations does not account for the precipitation of CaSO4, which has the same effect on aerosol pH of reducing sulfate. The substitution also does not perfectly reflect the impact on aerosol liquid water content, which may indirectly affect the pH. In general, the gas fraction of NHx calculated from the output of the thermodynamic model matches very closely with the measured gas fraction of NHx (Fig. S2), suggesting that we are not missing substantial contributions to the ion balance in the particles by only considering ammonium sulfate.
The factors influencing aerosol pH can be roughly classified into two categories: meteorological parameters (including ambient temperature and relative humidity) and chemical composition (including gas phase and particle phase components). The following discussion will focus on the conceptual modelling of aerosol pH sensitivity to meteorological conditions in comparison to the impacts of changes in chemical composition.
3.2 Seasonal cycle of aerosol pH
To assess the sensitivity of aerosol pH to meteorological conditions and chemical composition changes individually, we first examine the pH of aerosol with chemical composition held fixed at representative values under different meteorological conditions. Then we study the aerosol pH sensitivity to chemical composition changes under fixed typical meteorological conditions of each of the four seasons. Figure 4 displays the aerosol pH calculated under every combination of relative humidity from 30 % to 95 % and temperature from −10 to 30 ∘C with fixed chemical composition. The chosen concentrations for sulfate, and NHx are 15, 30 and 180 nmol m−3, respectively, which are close to the 10-year average concentrations of chemical composition in the Toronto atmosphere (which were 17.6 nmol m−3 of sulfate, 34.2 nmol m−3 of TNO3 and 188 nmol m−3 of NHx).
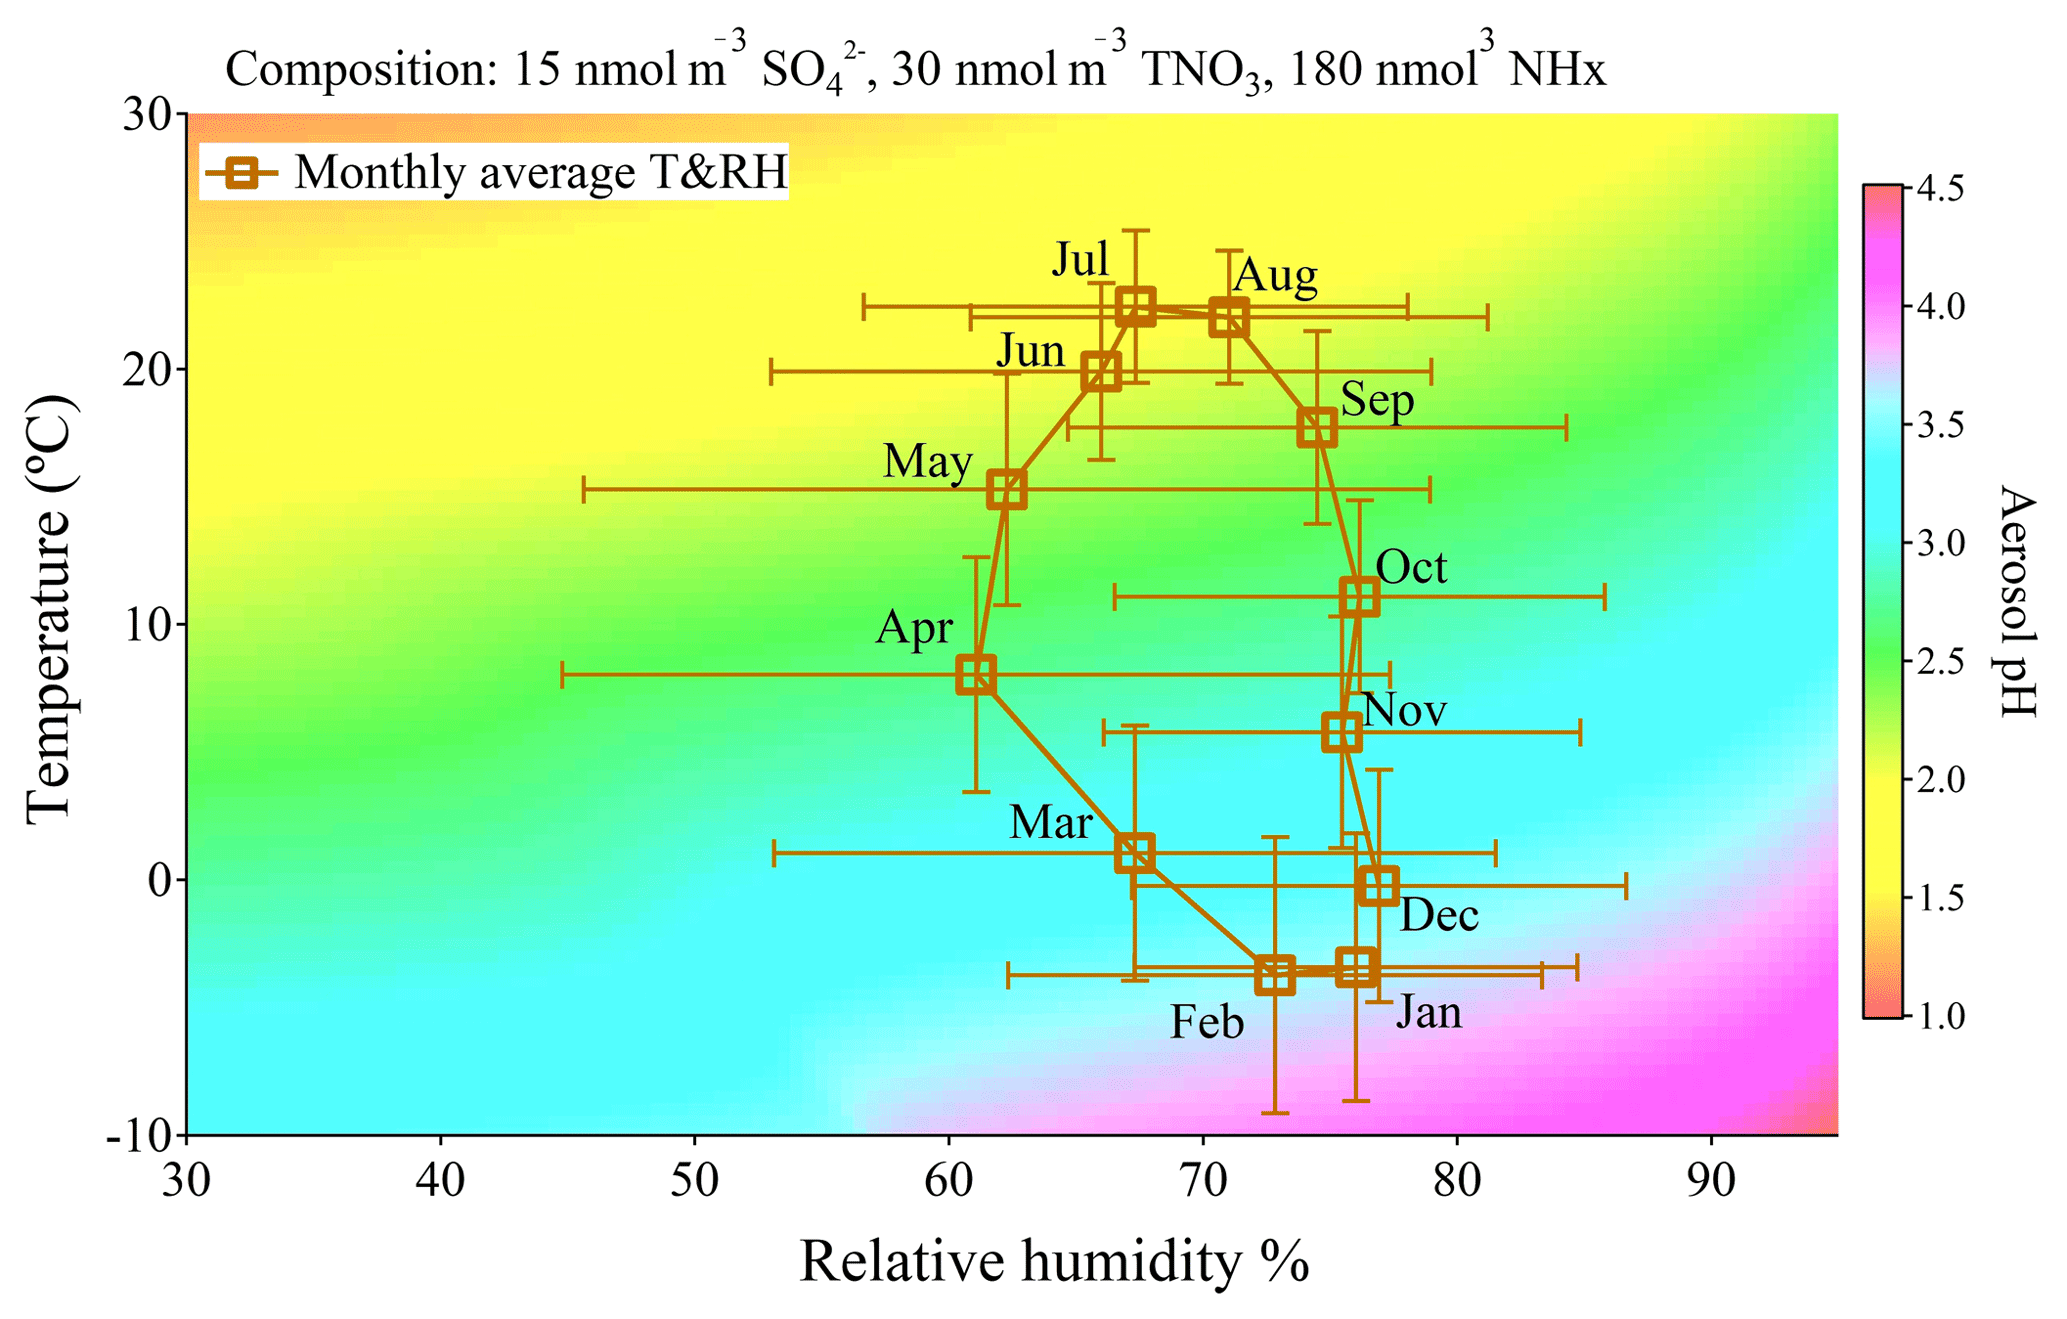
Figure 4Plot of E-AIM calculated pH under different combinations of relative humidity (from 30 % to 95 %) and temperature (from −10 to 30 ∘C) with the fixed input chemical compositions (15 nmol m−3 sulfate, 30 nmol m−3 TNO3 and 180 nmol m−3 NHx). The square plots on the graph represent monthly averages of meteorological parameters in Toronto from 2007 to 2016 with standard deviations as error bars.
It can be seen in Fig. 4 that particles tend to become more acidic at higher temperatures and lower relative humidity and become more neutralized when the temperature is lower or RH is higher. The square symbols in Fig. 4 are the monthly average values of ambient temperature and relative humidity in Toronto from 2007 to 2016 with standard deviations as error bars. The seasonal cycles of meteorological conditions at five other sites are listed in Table S2 and generally show similar seasonal cycling of RH and temperature. Even excluding changes in chemical composition, we find from Fig. 4 that we can explain the summer minimum and winter maximum in pH from Fig. 3. Temperature is the main factor driving the seasonal variation of aerosol pH while the changes due to RH variation are much smaller. This result suggests the central role of meteorological conditions, especially temperature, in the determination of aerosol pH seasonal cycle in mid- and high-latitude regions with NHx ≫ sulfate in chemical composition.
The temperature dependence of aerosol pH can be theoretically derived from the phase partitioning based on the equilibria NH3(g)↔NH3(aq) and , which are governed by KH and pKa, respectively (Hennigan et al., 2015). Under equilibrium, aerosol pH can be theoretically derived from the observed gas or particle concentration ratio of NHx and aerosol liquid water [ALW] as follows:
which Hennigan et al. (2015) showed as having good agreement with E-AIM modelling results. Because both KH and pKa have strong temperature dependencies (Chameides, 1984; Bell et al., 2007), aerosol pH is going to be temperature-dependent even if liquid water content or partitioning behaviour does not change. The partial derivative of aerosol pH dependence on temperature will give (K−1), which corresponds to 0.1 unit increase (decrease) of aerosol pH if temperature decreases (increases) by 2 ∘C. The pH gradient shown in Fig. 4 also illustrated that an approximately 10 ∘C increase of temperature is required for a 0.5 unit decrease in aerosol pH under the same chemical composition and RH, which is consistent with the temperature sensitivity derived through the NHx phase partitioning method.
It is possible that the sensitivity of aerosol pH to chemical composition is different in different seasons. As a result, the sensitivity of aerosol pH to composition changes in each season is further studied through the conceptual modelling. In Fig. 5a–d the pH calculated under different combinations of NHx and sulfate concentrations under typical temperature and RH conditions in spring (April; T=10 ∘C, RH = 60 %), summer (July and August; T=25 ∘C, RH = 70 %), fall (October; T=10 ∘C, RH = 75 %) and winter (January and February; ∘C, RH = 75 %) in the Toronto atmosphere are shown. Total nitrate concentrations were set to be 2 times larger than sulfate concentrations. This assumption is representative of the Toronto atmosphere as a 10-year average of sulfate concentration (17.6 nmol m−3) is approximately half of the total nitrate molar concentration (34.2 nmol m−3), though for any given day the ratio could be different. The corresponding calculation results of the particle phase fraction of nitrate in four seasons is shown in Fig. S5. During summer ammonium nitrate formation is unfavourable, while in wintertime ammonium nitrate can form very efficiently. As a result, in summertime, the aerosol liquid water content was mainly contributed by ammonium sulfate while in wintertime it was affected by both sulfate and nitrate. The effect of nitrate formation to aerosol pH will be further discussed in Sect. 3.4.
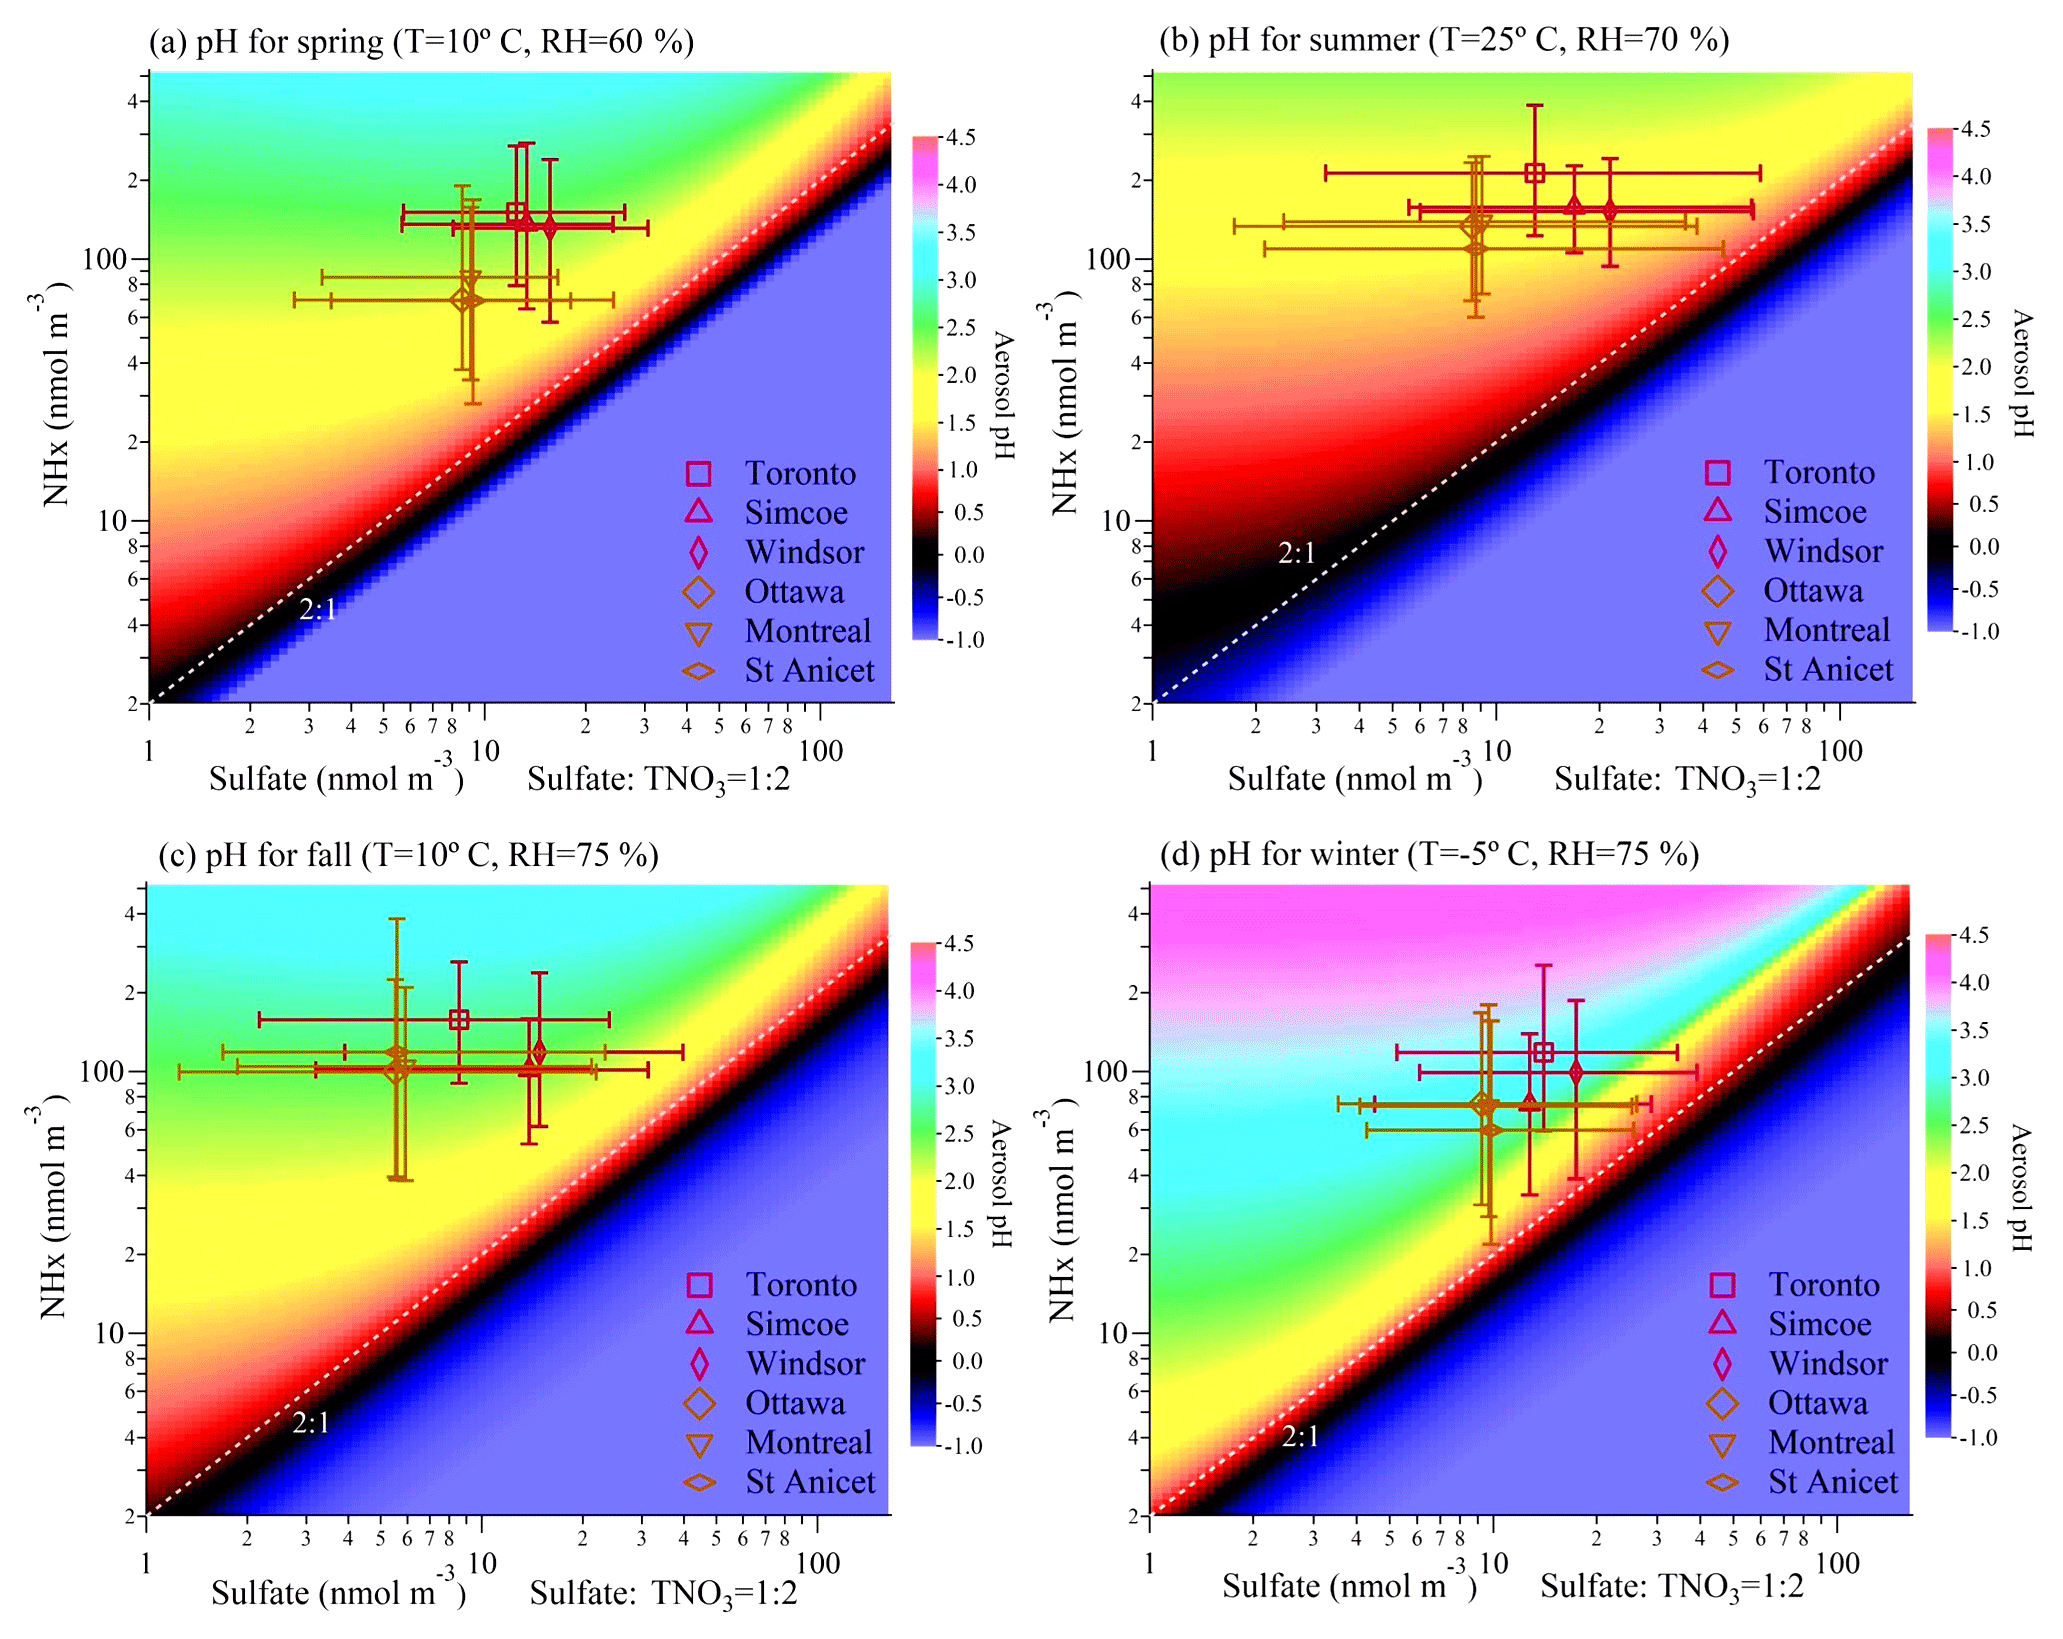
Figure 5Aerosol pH calculated with fixed meteorological parameters (temperature and RH) under different combinations of NHx and sulfate concentrations. Total nitrate concentrations are set to be 2 times that of sulfate. The markers on the graph represent median summertime concentrations of NHx and sulfate at six sites from year 2007 to 2016 with error bars indicating the 10th percentile to 90th percentile. The fixed meteorological parameters chosen in panels (a)–(d) are representative of the conditions in spring (April), summer (July and August), fall (October) and winter (January and February) shown in Fig. 4.
The markers in Fig. 5 represent the median and the range (from 10th percentile to 90th percentile) of NHx and sulfate concentrations in four seasons at six monitoring sites from 2007 to 2016. The three more westerly sites (Toronto, Windsor and Simcoe) tend to have higher sulfate in all seasons and Toronto has slightly higher NHx. However, overall all six sites occupy regions of similar chemical sensitivity in the plots. The conceptual modelling of aerosol pH under summertime conditions, shown in Fig. 5b, suggests that the relatively low variability in summertime pH, shown in Fig. 3, results from the aerosol pH being insensitive to chemical composition changes under the corresponding meteorological conditions. Specifically, in summertime, pH was very constrained to the small range around 2 with little influence from the variation of chemical composition, even though the sulfate loadings were the most variable in the summer. Judging from the concentration ranges of sulfate and NHx shown in all six sites, in summertime even decreasing sulfate concentration by 1 order of magnitude does not significantly change the pH values, and this effect became more obvious with a higher NHx:sulfate molar ratio.
By comparison, the pH calculated under spring and fall temperatures (10 ∘C) shown in Fig. 5a and c showed that pH became more sensitive to NHx variation but still remain quite insensitive to sulfate concentration changes within the relevant concentration range. In spring, the median concentrations of NHx at the sites of Toronto, Simcoe and Windsor were higher compared to the other three sites, leading to average April pH values in Toronto, Simcoe and Windsor (2.40–2.69) that were consistently higher than the other three sites (2.15–2.31). In October, NHx and sulfate concentrations had wider ranges of concentration, but we can conclude from Fig. 5c that the pH changes due to chemical composition were mainly driven by the variation of NHx. The effect of relative humidity changes can be seen from the comparison between Fig. 5a and c, where it is shown that with fixed chemical composition, aerosol will be slightly less acidic at higher RH.
By comparison, under wintertime meteorological conditions, aerosol pH was higher in the region . Apart from the effect of lower temperatures, a lower concentration of NHx and lower NHx-to-sulfate molar ratio also made aerosol pH much more sensitive to chemical composition changes than the other seasons because it will make the part in Eq. (2) more sensitive to chemical component changes. This could contribute to the larger variation of wintertime aerosol pH shown in Figs. 2 and 3. In Simcoe, Windsor and St Anicet, the sites with lower NHx:sulfate molar ratios, wintertime pH values all exhibited significant variations. Under these conditions, not only the uncertainty in the SNA concentration measurements, but also the potential contributions from organic matter such as organic ammonium salts (Schlag et al., 2017; Tao and Murphy, 2018) or organosulfates (Vogel et al., 2016; Glasius et al., 2018), which current thermodynamic models do not fully consider, can contribute to uncertainty in aerosol pH calculation. These conceptual modelling results also provide insight into the challenges posed in the direct measurement of aerosol pH off-line as it is both strongly impacted by ambient environmental conditions and the NH3 concentration equilibrated with the particle phase.
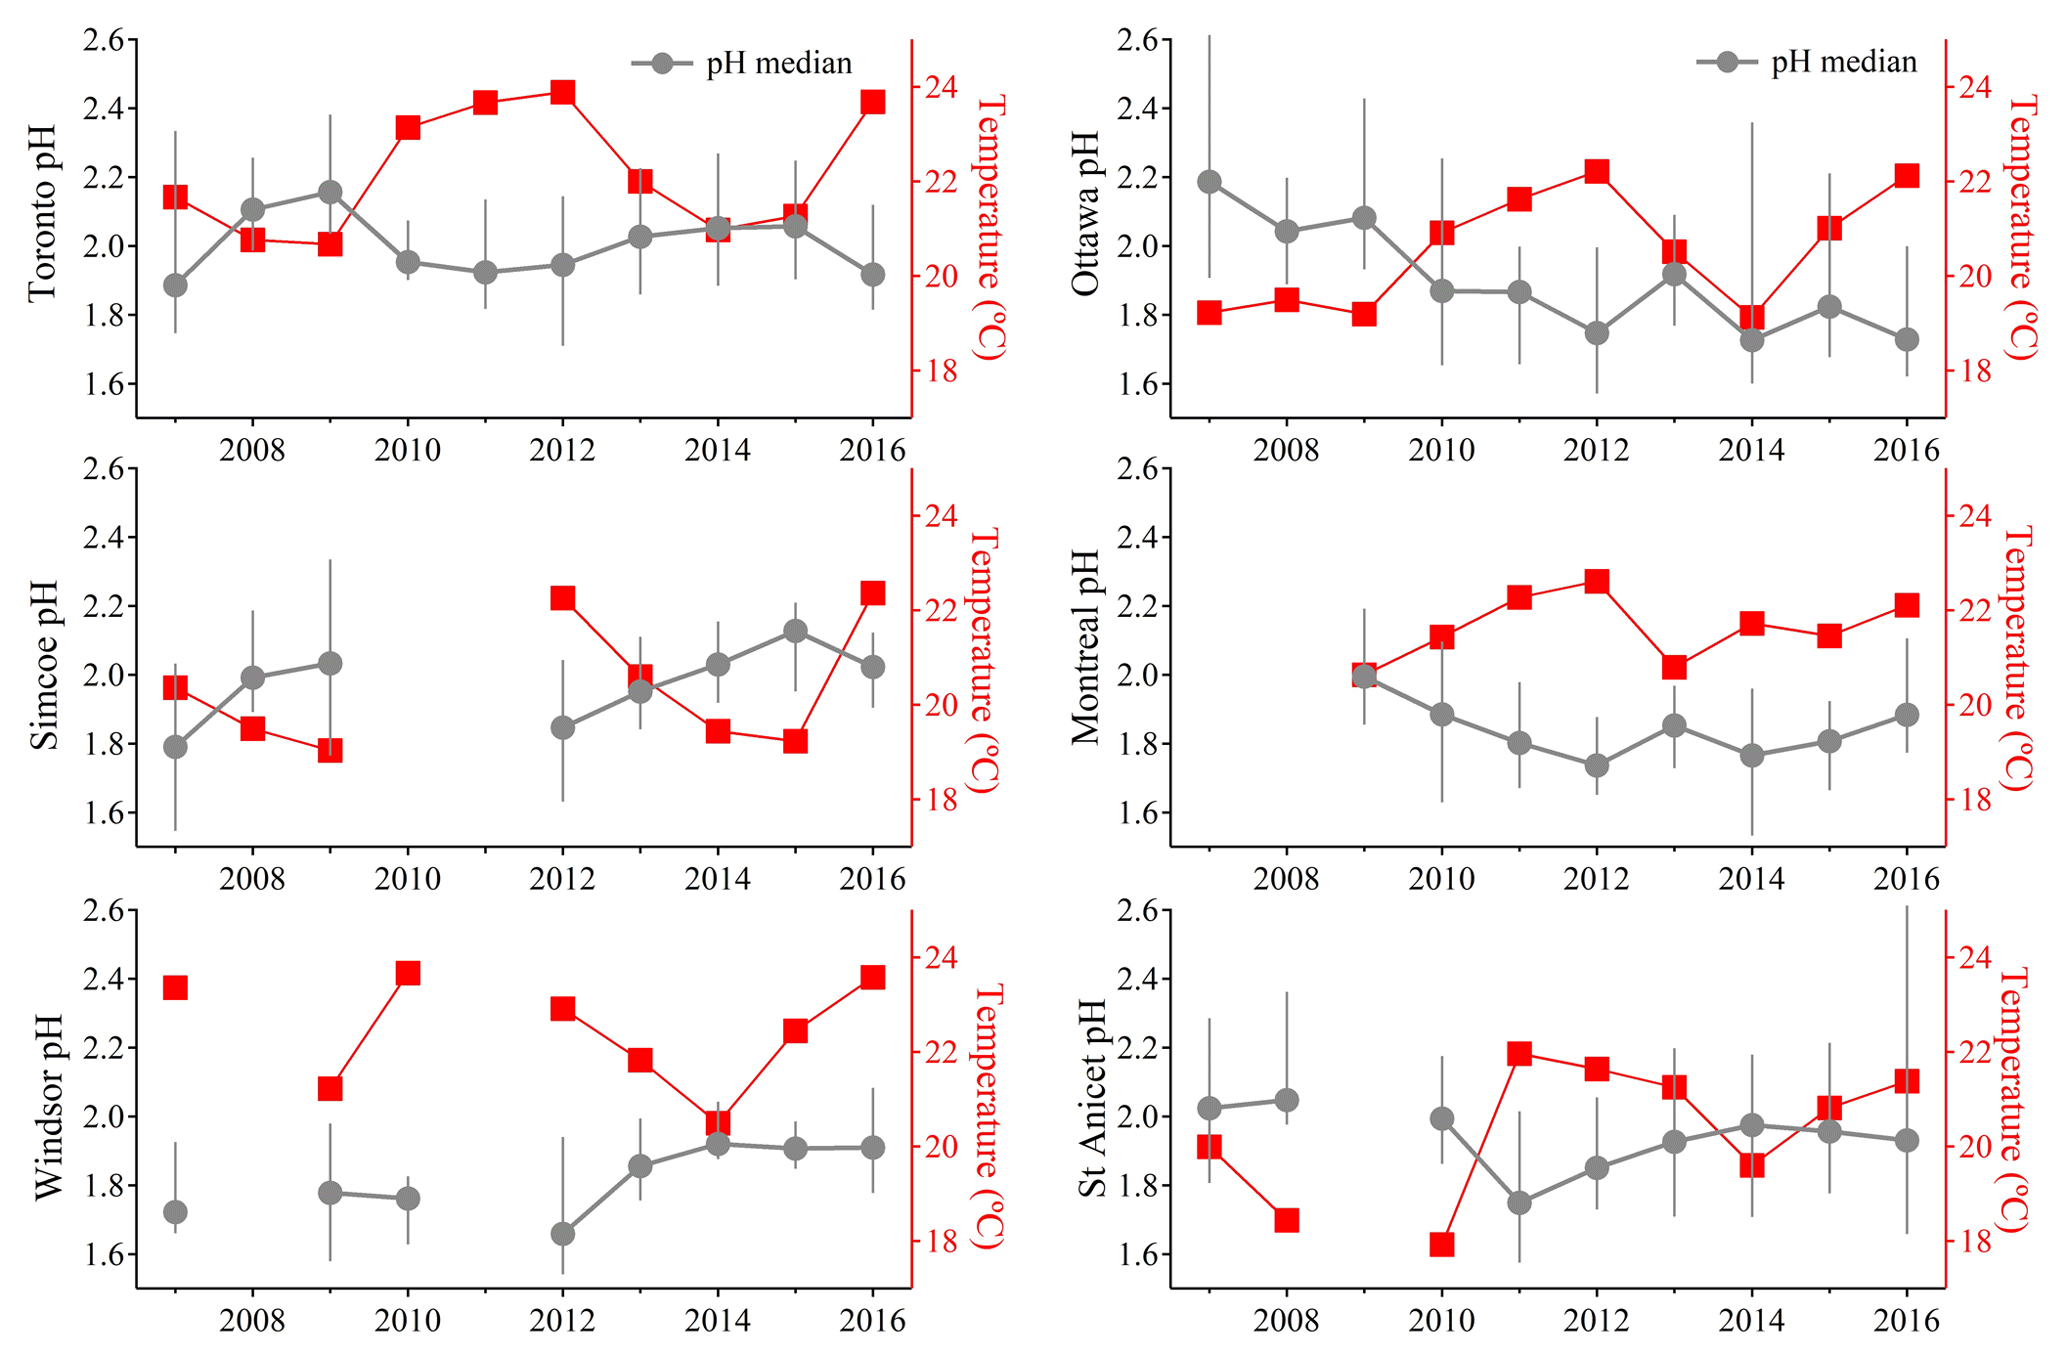
Figure 6Median of aerosol pH in summertime (data on July and August) from year 2007 to 2016 at six monitoring sites. The error bars with median pH values represent the range from the 25th to 75th percentiles. Average ambient temperature in summertime (July and August) at each site is also plotted on right axis to illustrate the reverse trend of temperature with pH inter-annual variation.
One key assumption in the above conceptual modelling is forcing the total nitrate-to-sulfate molar ratio to be 2. To test the effect of this assumption on the aerosol pH, we calculate the pH of aerosol on each sampling day, assuming total nitrate-to-sulfate molar ratio to be 2, and compare with the pH calculated with the measured total nitrate. The results show that this assumption has a negligible influence on aerosol pH for samples from April to November but has a larger influence on wintertime aerosol, indicating that wintertime aerosol is more sensitive to nitrate concentration (the statistical summary is shown in Fig. S6). The influence of nitrate on wintertime aerosol pH will be further discussed in Sect. 3.4.
3.3 Long-term trends of pH in summertime
The above time series analysis and conceptual modelling of aerosol pH suggest that in the study region during summertime, aerosol pH is strongly impacted by ambient temperature with much weaker response to the other factors, while during wintertime aerosol pH is affected by both temperature and chemical composition. Figure 6 shows the summertime (data from July and August) median aerosol pH in each year at the six monitoring sites. A summertime average temperature was also plotted on the right axes in each graph. The clear anti-correlation indicates that interannual variability in summer temperatures causes interannual variability in aerosol pH. Another application of this result can be found in Battaglia et al. (2017), who showed that urban aerosol in US cities tended to be more acidic than rural aerosol due to the urban heat island effect, consistent with the important role of temperature in aerosol pH determination.
The study conducted by Weber et al. (2016) found that in summertime, aerosol remained highly acidic even with a significant reduction of sulfate in the US. A similar conclusion could be drawn for conditions in Canada, where we found the role of temperature to be more significant than variations in chemical composition for trends in aerosol pH. Significant changes in the particle phase sulfate have been observed during the summers of 2007–2016. Figure 7 displays the summertime average (data from July and August) concentrations of PM2.5 sulfate at the six sites. Linear regressions are used to show the annual reductions in fine particulate sulfate. Significant decreasing trends (p value of linear regressions <0.05) of sulfate have been observed at five out of six sites (excluding the St Anicet site where large inter-annual variation was found). Specifically, sulfate concentrations have experienced 61 %, 56 %, 62 % and 67 % reductions in Toronto, Simcoe, Windsor and Ottawa, respectively, over the decade from 2007 to 2016. There is no statistically significant long-term trend in the NHx values at any of these sites. Summertime aerosol pH is not decreasing with the decreasing trend of sulfate but is mainly influenced by the inter-annual variation of meteorological conditions.
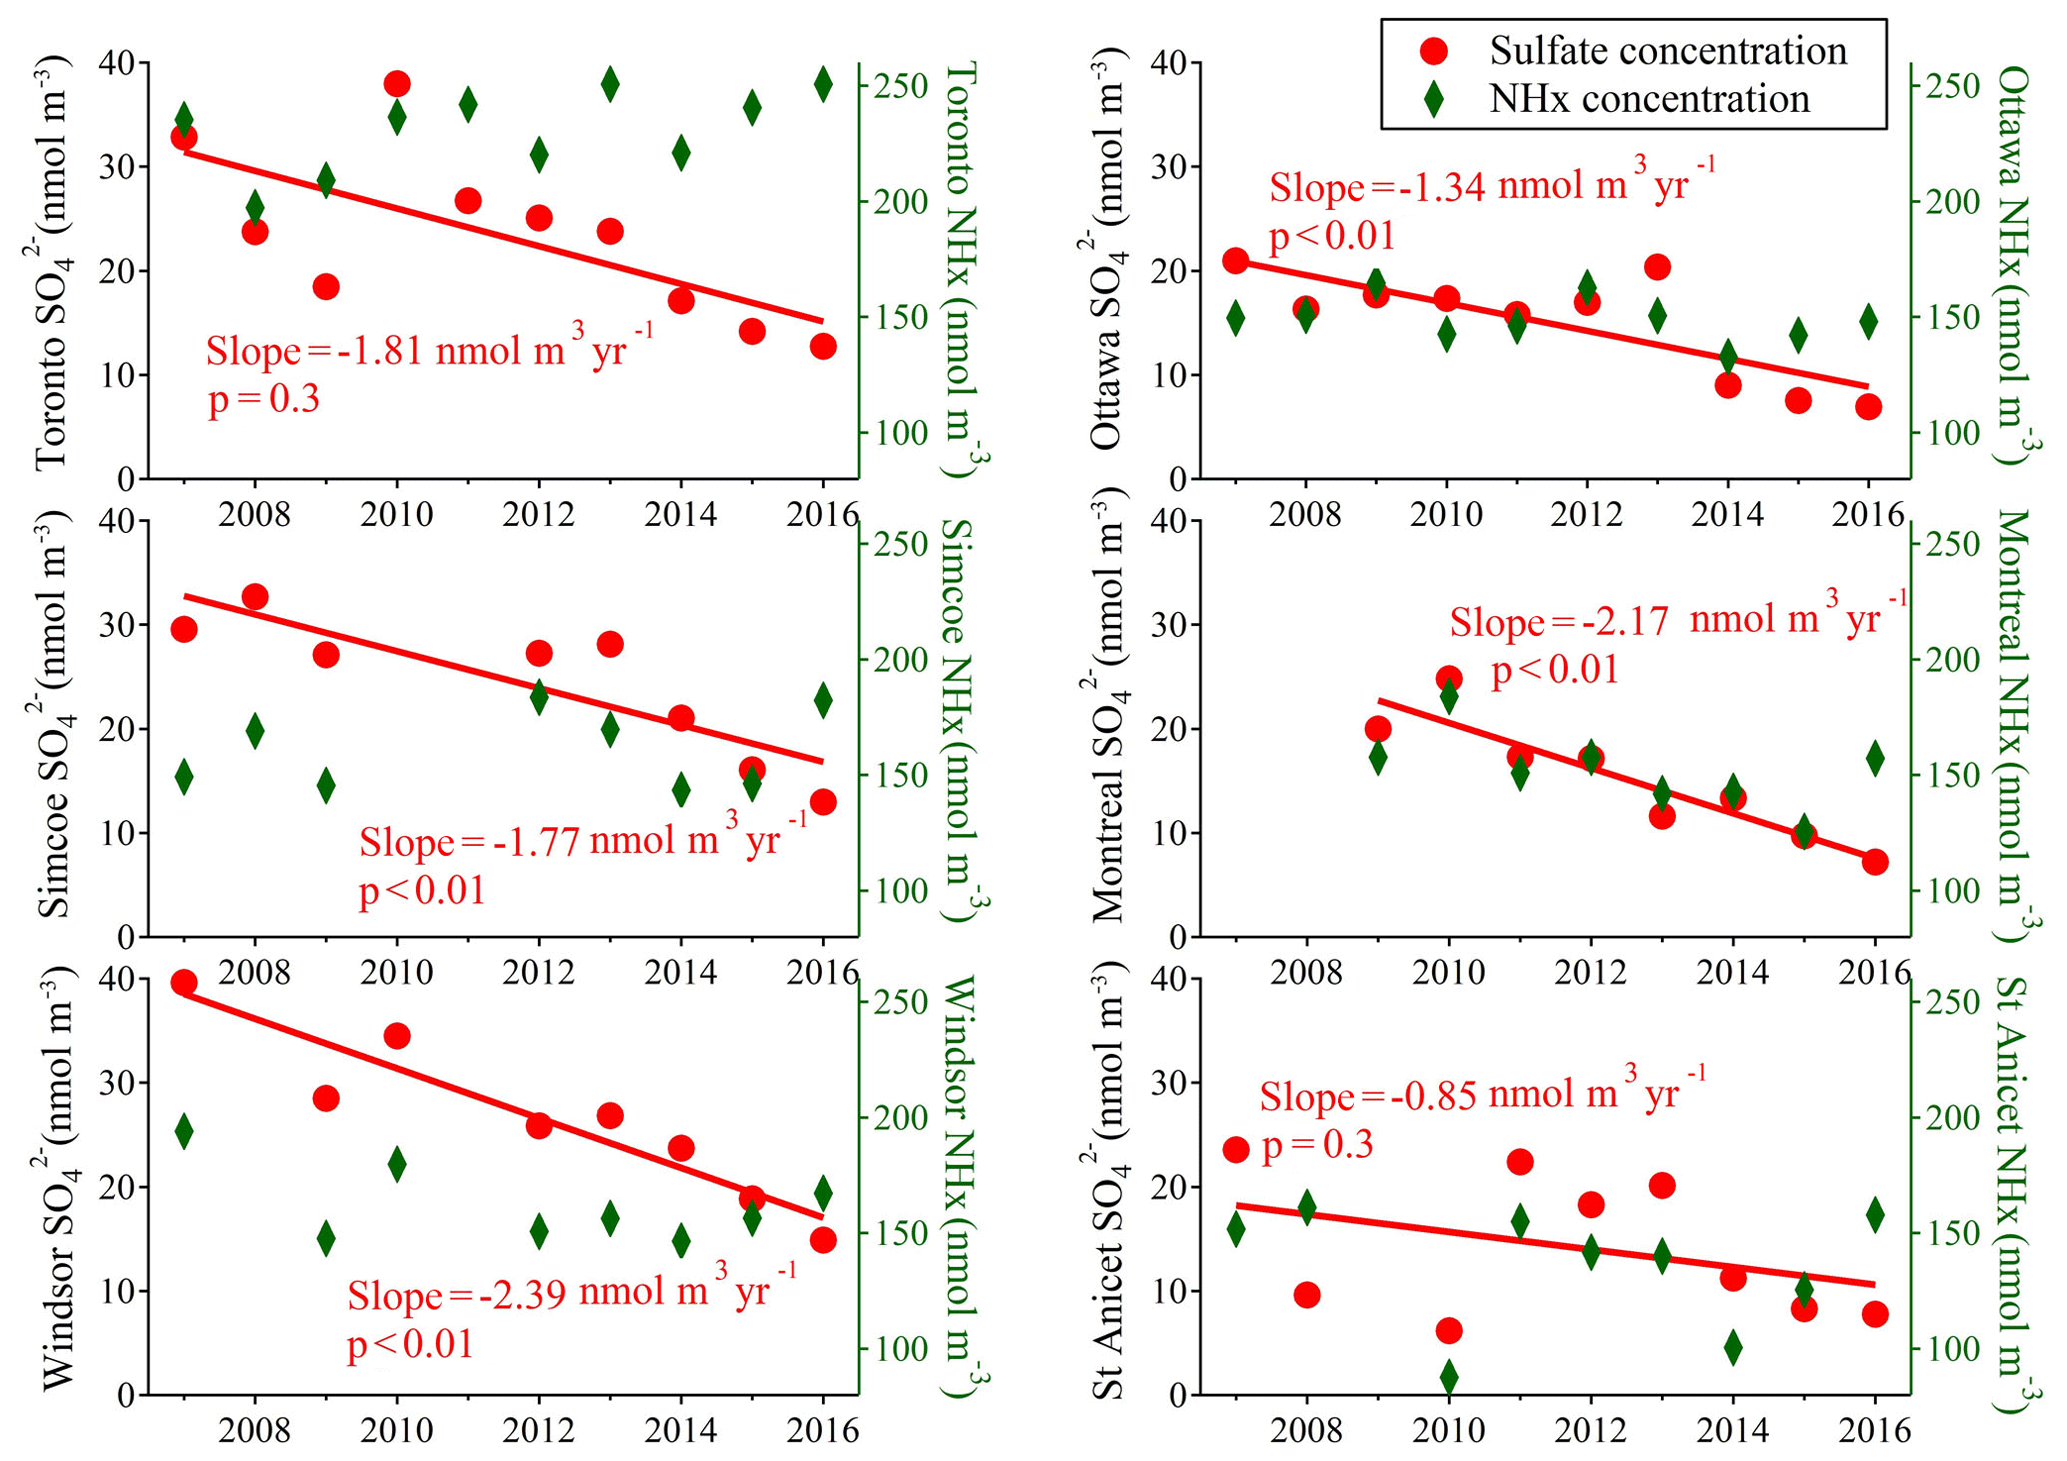
Figure 710-year trends of summertime average concentrations of sulfate and NHx at each site. Linear regressions of sulfate were illustrated on each graph to represent the reduction of particulate sulfate from 2007 to 2016.
3.4 pH trends in wintertime
To assess the effect of chemical composition changes on aerosol pH in winter meteorological conditions, wintertime average concentrations of sulfate and NHx in each year at each site were plotted in Fig. 8a with the colour representing the corresponding average pH values. The background colour in Fig. 8a represents pH calculated under different combinations of sulfate and NHx concentrations with fixed temperature (−5 ∘C), RH (75 %) and sulfate-to-TNO3 molar ratio (1:2), the same as Fig. 5d but with a different scale and focused on a smaller range of chemical conditions. The figure clearly shows that changes in chemical composition under wintertime meteorological conditions can lead to significant changes in aerosol pH. Changes of 20 nmol m−3 in either NHx or sulfate can change aerosol pH by more than 0.5 units for some cases. Also, although most of the wintertime average pH values calculated for the actual chemical composition at each site (colours of the markers) generally agree with the pH calculated as the conceptual model (colours of the same position in the background), some of the data points were slightly more acidic than the background value, and this is likely the result of our simplified assumption of a fixed sulfate-to-TNO3 molar ratio during the calculation in the conceptual modelling.
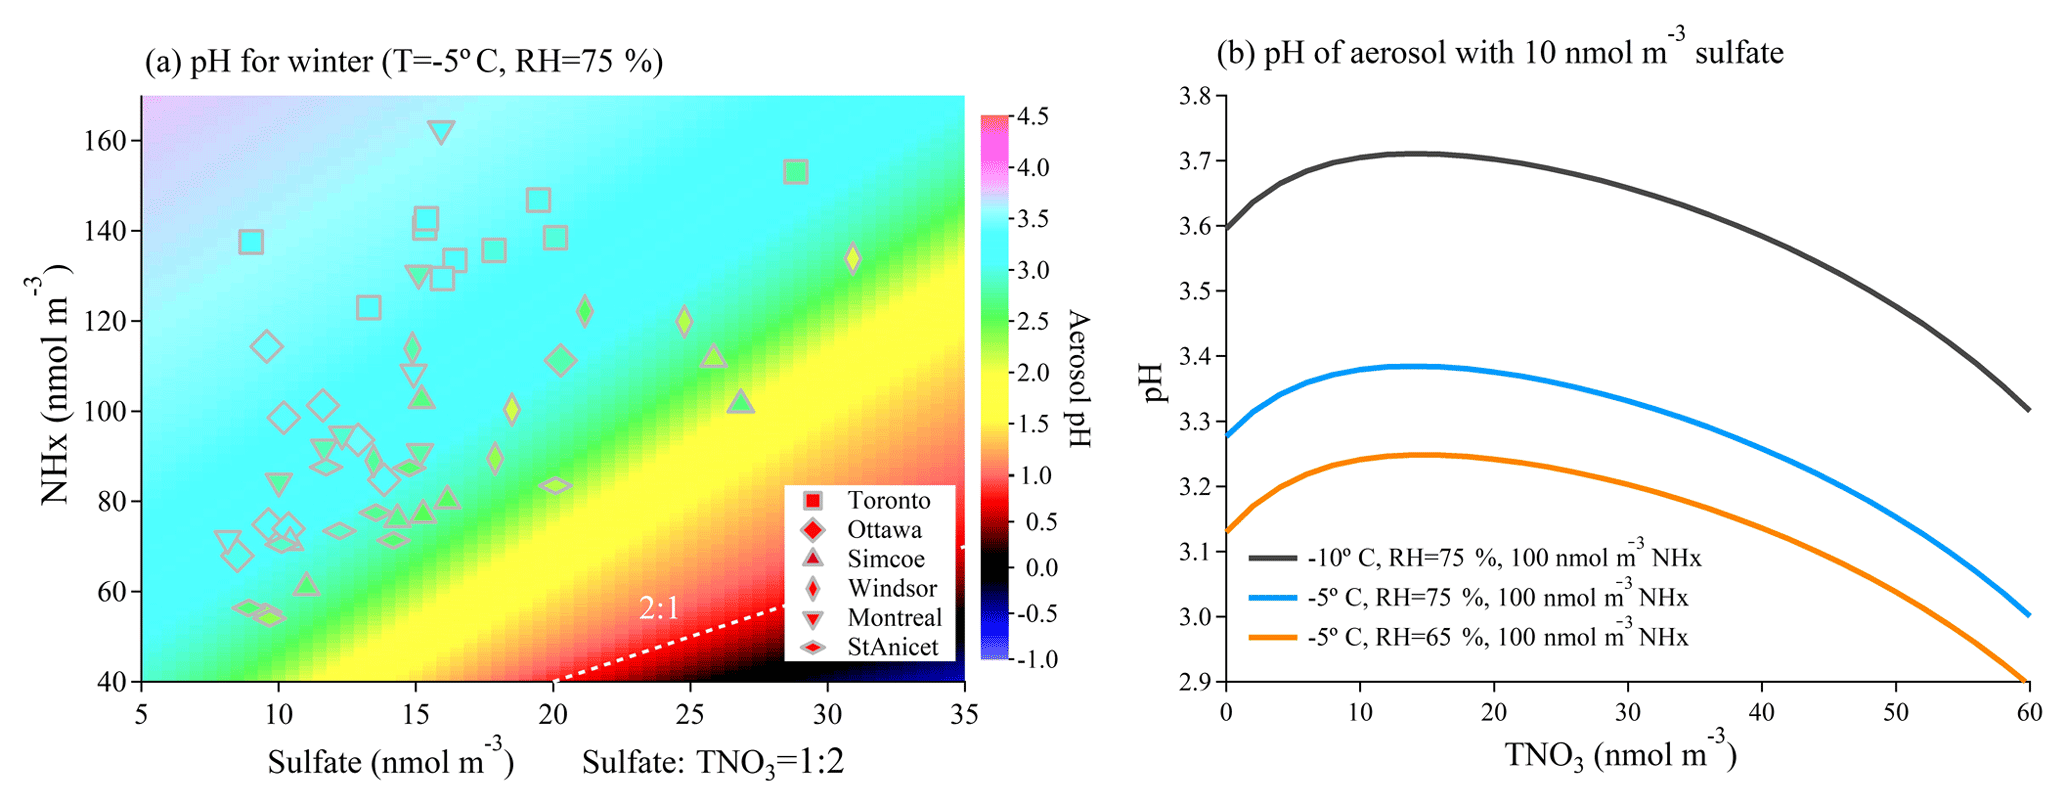
Figure 8(a) The plot of aerosol pH under wintertime meteorological conditions (−5 ∘C, RH = 75 %) under different combinations of sulfate and NHx with more focused region compared to Fig. 5d. The markers on the graph represents the average wintertime (data from January and February) sulfate and NHx concentrations in each year in each sampling site with colour indicating average pH value. (b) pH of aerosol with 10 nmol m−3 sulfate under different combinations of temperature and relative humidity as the function of TNO3 in the system.
Figure 8b shows the effects that temperature, relative humidity and TNO3 concentrations can have on the pH of aerosol with 10 nmol m−3 sulfate under wintertime meteorological conditions. Generally, a lower temperature and higher relative humidity will make aerosol pH higher. However, the effect of the addition of total nitrate is more complicated. Based on Eq. (2), the added TNO3 concentration can impact aerosol pH in two opposite ways. First, because ammonium nitrate is more hygroscopic than ammonium sulfate (Gysel et al., 2007), the particulate nitrate formation will raise the liquid water content [ALW] in aerosol, increasing the aerosol pH; however, nitrate formation will also scavenge NH3 from the gas phase, and the smaller value of will make the aerosol more acidic. These two factors altogether contribute to the arc-shaped curve of the relationship between aerosol pH and nitrate shown in Fig. 8b. Figure S7 shows the box-and-whisker plots of wintertime average molar ratio of TNO3 to sulfate concentration in each year at each sampling site, where it shows that the molar concentration of TNO3 was generally more than 2 times higher than the sulfate concentration, which could contribute to wintertime aerosol being more acidic than the value calculated using the forcing . As a result, during wintertime, both chemical composition and meteorological conditions can have significant impacts on aerosol pH without a clear dominant factor. As a corollary, the uncertainty in measurements of particle composition, the influence of non-volatile cations and the potential contribution from organic acids or organosulfates (the error caused by misrepresenting organosulfates as inorganic sulfate) will also have a more significant impact on the determination of aerosol pH in winter by potentially over- or underestimating the sulfate or nitrate that is balancing the ammonium.
The pH values of fine particulate matter at six eastern Canadian sites, including Toronto, Windsor, Simcoe, Ottawa, Montreal, and St Anicet from 2007 to 2016 were calculated by the E-AIM model constrained by input from the NAPS database and meteorological data. Strong seasonal cycles of aerosol pH were found at all six sites over the 10 years. A consistent pattern of aerosol pH fluctuation from acidic (pH < 2) in summer to higher pH around 3 in winter was found at all six sites. Ambient temperature proved to be mainly responsible for the seasonal cycle of aerosol pH. The sensitivity tests of pH to chemical composition shows aerosol pH has different sensitivity to chemical composition changes in different seasons. During summertime, aerosol pH was mainly controlled by ambient temperature while the fluctuation of NHx and sulfate concentrations did not contribute significantly to the inter-annual variation of aerosol pH. In comparison, in wintertime, aerosol pH can be greatly influenced by both chemical compositions and meteorological conditions. When temperatures are low, aerosol pH at these six sites are very sensitive to all the changes in NHx, sulfate and TNO3 concentrations, leading to the higher variation of aerosol pH in wintertime compared to that in summertime. This study focused on a number of sites with relatively low ambient mass loadings of aerosol inorganic constituents dominated by a sulfate–nitrate–ammonium system. Regions in which PM2.5 is strongly influenced by dust or marine sources may have different sensitivities for chemical and meteorological factors. However, for places with high particulate pollution and different concentration levels of NH3, similar approaches can also be applied to assess the aerosol pH sensitivity to chemical composition and meteorological parameters to assess the generalizability of our findings.
All the data and the model used in this study are publicly available, including chemical composition data (http://maps-cartes.ec.gc.ca/rnspa-naps/data.aspx, last access: 4 December 2018), meteorological data (http://climate.weather.gc.ca/, last access: 22 April 2018) and E-AIM modelling (http://www.aim.env.uea.ac.uk/aim/aim.php, last access: 29 August 2018). The time series of 24 h average meteorological data, chemical composition and aerosol pH calculated with E-AIM II and IV used in this study is available in the supplement Excel file of this paper. Further relevant information can be obtained upon request to the corresponding author.
The supplement related to this article is available online at: https://doi.org/10.5194/acp-19-9309-2019-supplement.
YT performed all the data processing and modelling calculation. YT and JGM analyzed data, drew the conclusions and wrote the paper together.
The authors declare that they have no conflict of interest.
The authors thank Enyu Xiong for the help of organizing data. The authors acknowledge the Environmental Canada National Air Pollution Surveillance Network and Analysis and Air Quality Section, who contributed to the analysis of PM chemical speciation.
This research has been supported by the Connaught Scholarship.
This paper was edited by Jason Surratt and reviewed by Rodney Weber and three anonymous referees.
Allen, H. M., Draper, D. C., Ayres, B. R., Ault, A., Bondy, A., Takahama, S., Modini, R. L., Baumann, K., Edgerton, E., Knote, C., Laskin, A., Wang, B., and Fry, J. L.: Influence of crustal dust and sea spray supermicron particle concentrations and acidity on inorganic aerosol during the 2013 Southern Oxidant and Aerosol Study, Atmos. Chem. Phys., 15, 10669–10685, https://doi.org/10.5194/acp-15-10669-2015, 2015.
Babich, P., Davey, M., Allen, G., and Koutrakis, P.: Method Comparisons for Particulate Nitrate, Elemental Carbon, and PM2.5 Mass in Seven U.S. Cities, J. Air Waste Manage., 50, 1095–1105, https://doi.org/10.1080/10473289.2000.10464152, 2011.
Battaglia, M. A., Douglas, S., and Hennigan, C. J.: Effect of the Urban Heat Island on Aerosol pH, Environ. Sci. Technol., 51, 13095–13103, https://doi.org/10.1021/acs.est.7b02786, 2017.
Bell, T. G., Johnson, M. T., Jickells, T. D., and Liss, P. S.: Ammonia/ammonium dissociation coefficient in seawater: A significant numerical correction, Environ. Chem., 4, 183–186, https://doi.org/10.1071/en07032, 2007.
Chameides, W. L.: The photochemistry of a remote marine stratiform cloud, J. Geophys. Res., 89, 4739–4755, https://doi.org/10.1029/JD089iD03p04739, 1984.
Clegg, S. L., Brimblecombe, P., and Wexler, A. S.: Thermodynamic Model of the System H+----H2O at Tropospheric Temperatures, J. Phys. Chem. A, 102, 2137–2154, https://doi.org/10.1021/jp973042r, 1998.
Craig, R. L., Peterson, P. K., Nandy, L., Lei, Z., Hossain, M. A., Camarena, S., Dodson, R. A., Cook, R. D., Dutcher, C. S., and Ault, A. P.: Direct Determination of Aerosol pH: Size-Resolved Measurements of Submicrometer and Supermicrometer Aqueous Particles, Anal. Chem., 90, 11232–11239, https://doi.org/10.1021/acs.analchem.8b00586, 2018.
Dabek-Zlotorzynska, E., Dann, T. F., Kalyani Martinelango, P., Celo, V., Brook, J. R., Mathieu, D., Ding, L., and Austin, C. C.: Canadian National Air Pollution Surveillance (NAPS) PM2.5 speciation program: Methodology and PM2.5 chemical composition for the years 2003–2008, Atmos. Environ., 45, 673–686, https://doi.org/10.1016/j.atmosenv.2010.10.024, 2011.
Dockery, D. W., Cunningham, J., Damokosh, A. I., Neas, L. M., Spengler, J. D., Koutrakis, P., Ware, J. H., Raizenne, M., and Speizer, F. E.: Health effects of acid aerosols on North American children: respiratory symptoms, Environ. Health Persp., 104, 500–505, https://doi.org/10.1289/ehp.96104500, 1996.
Du, H., Kong, L., Cheng, T., Chen, J., Yang, X., Zhang, R., Han, Z., Yan, Z., and Ma, Y.: Insights into Ammonium Particle-to-Gas Conversion: Non-sulfate Ammonium Coupling with Nitrate and Chloride, Aerosol Air Qual. Res., 10, 589–595, https://doi.org/10.4209/aaqr.2010.04.0034, 2010.
Fang, T., Guo, H., Zeng, L., Verma, V., Nenes, A., and Weber, R. J.: Highly acidic ambient particles, soluble metals and oxidative potential: A link between sulfate and aerosol toxicity, Environ. Sci. Technol., 51, 2611–2620, https://doi.org/10.1021/acs.est.6b06151, 2017.
Fountoukis, C. and Nenes, A.: ISORROPIA II: a computationally efficient thermodynamic equilibrium model for K+-Ca2+-Mg2+--Na+---Cl−-H2O aerosols, Atmos. Chem. Phys., 7, 4639–4659, https://doi.org/10.5194/acp-7-4639-2007, 2007.
Freedman, M. A., Ott, E. E., and Marak, K. E.: Role of pH in Aerosol Processes and Measurement Challenges, J. Phys. Chem. A, 123, 1275–1284, https://doi.org/10.1021/acs.jpca.8b10676, 2019.
Friese, E. and Ebel, A.: Temperature dependent thermodynamic model of the system H+--Na+---Cl−-H2O, J. Phys. Chem. A, 114, 11595–11631, https://doi.org/10.1021/jp101041j, 2010.
Glasius, M., Bering, M. S., Yee, L. D., de Sa, S. S., Isaacman-VanWertz, G., Wernis, R. A., Barbosa, H. M. J., Alexander, M. L., Palm, B. B., Hu, W., Campuzano-Jost, P., Day, D. A., Jimenez, J. L., Shrivastava, M., Martin, S. T., and Goldstein, A. H.: Organosulfates in aerosols downwind of an urban region in central Amazon, Environmental science, Processes & Impacts, 20, 1546–1558, https://doi.org/10.1039/c8em00413g, 2018.
Guo, H., Sullivan, A. P., Campuzano-Jost, P., Schroder, J. C., Lopez-Hilfiker, F. D., Dibb, J. E., Jimenez, J. L., Thornton, J. A., Brown, S. S., Nenes, A., and Weber, R. J.: Fine particle pH and the partitioning of nitric acid during winter in the northeastern United States, J. Geophys. Res.-Atmos., 121, 10355–10376, https://doi.org/10.1002/2016jd025311, 2016.
Guo, H., Liu, J., Froyd, K. D., Roberts, J. M., Veres, P. R., Hayes, P. L., Jimenez, J. L., Nenes, A., and Weber, R. J.: Fine particle pH and gas–particle phase partitioning of inorganic species in Pasadena, California, during the 2010 CalNex campaign, Atmos. Chem. Phys., 17, 5703–5719, https://doi.org/10.5194/acp-17-5703-2017, 2017a.
Guo, H., Weber, R. J., and Nenes, A.: High levels of ammonia do not raise fine particle pH sufficiently to yield nitrogen oxide-dominated sulfate production, Sci. Rep.-UK, 7, 12109, https://doi.org/10.1038/s41598-017-11704-0, 2017b.
Gysel, M., Crosier, J., Topping, D. O., Whitehead, J. D., Bower, K. N., Cubison, M. J., Williams, P. I., Flynn, M. J., McFiggans, G. B., and Coe, H.: Closure study between chemical composition and hygroscopic growth of aerosol particles during TORCH2, Atmos. Chem. Phys., 7, 6131–6144, https://doi.org/10.5194/acp-7-6131-2007, 2007.
Hennigan, C. J., Izumi, J., Sullivan, A. P., Weber, R. J., and Nenes, A.: A critical evaluation of proxy methods used to estimate the acidity of atmospheric particles, Atmos. Chem. Phys., 15, 2775–2790, https://doi.org/10.5194/acp-15-2775-2015, 2015.
Huang, R. J., Zhang, Y., Bozzetti, C., Ho, K. F., Cao, J. J., Han, Y., Daellenbach, K. R., Slowik, J. G., Platt, S. M., Canonaco, F., Zotter, P., Wolf, R., Pieber, S. M., Bruns, E. A., Crippa, M., Ciarelli, G., Piazzalunga, A., Schwikowski, M., Abbaszade, G., Schnelle-Kreis, J., Zimmermann, R., An, Z., Szidat, S., Baltensperger, U., El Haddad, I., and Prevot, A. S.: High secondary aerosol contribution to particulate pollution during haze events in China, Nature, 514, 218–222, https://doi.org/10.1038/nature13774, 2014.
Lawal, A. S., Guan, X., Liu, C., Henneman, L. R. F., Vasilakos, P., Bhogineni, V., Weber, R. J., Nenes, A., and Russell, A. G.: Linked Response of Aerosol Acidity and Ammonia to SO2 and NOx Emissions Reductions in the US, Environ. Sci. Technol., 52, 9861–9873, https://doi.org/10.1021/acs.est.8b00711, 2018.
Losey, D. J., Parker, R. G., and Freedman, M. A.: pH Dependence of Liquid-Liquid Phase Separation in Organic Aerosol, J. Phys. Chem. Lett., 7, 3861–3865, https://doi.org/10.1021/acs.jpclett.6b01621, 2016.
Murphy, J. G., Gregoire, P., Tevlin, A., Wentworth, G., Ellis, R., Markovic, M., and VandenBoer, T.: Observational constraints on particle acidity using measurements and modelling of particles and gases, Faraday Discuss., 200, 379–395, https://doi.org/10.1039/c7fd00086c, 2017.
Nah, T., Guo, H., Sullivan, A. P., Chen, Y., Tanner, D. J., Nenes, A., Russell, A., Ng, N. L., Huey, L. G., and Weber, R. J.: Characterization of aerosol composition, aerosol acidity, and organic acid partitioning at an agriculturally intensive rural southeastern US site, Atmos. Chem. Phys., 18, 11471–11491, https://doi.org/10.5194/acp-18-11471-2018, 2018.
Rindelaub, J. D., Craig, R. L., Nandy, L., Bondy, A. L., Dutcher, C. S., Shepson, P. B., and Ault, A. P.: Direct Measurement of pH in Individual Particles via Raman Microspectroscopy and Variation in Acidity with Relative Humidity, J. Phys. Chem. A, 120, 911–917, https://doi.org/10.1021/acs.jpca.5b12699, 2016.
Robinson, R. A. and Stokes, R. H.: Electrolyte solutions, Courier Corporation, Dover Publications, New York, USA, 2002.
Schlag, P., Rubach, F., Mentel, T. F., Reimer, D., Canonaco, F., Henzing, J. S., Moerman, M., Otjes, R., Prevot, A. S. H., Rohrer, F., Rosati, B., Tillmann, R., Weingartner, E., and Kiendler-Scharr, A.: Ambient and laboratory observations of organic ammonium salts in PM1, Faraday Discuss., 200, 331–351, https://doi.org/10.1039/c7fd00027h, 2017.
Seinfeld, J. H. and Pandis, S. N.: Atmospheric chemistry and physics: from air pollution to climate change, John Wiley & Sons, Inc., New Jersey, USA, 2006.
Song, S., Gao, M., Xu, W., Shao, J., Shi, G., Wang, S., Wang, Y., Sun, Y., and McElroy, M. B.: Fine-particle pH for Beijing winter haze as inferred from different thermodynamic equilibrium models, Atmos. Chem. Phys., 18, 7423–7438, https://doi.org/10.5194/acp-18-7423-2018, 2018.
Surratt, J. D., Lewandowski, M., Offenberg, J. H., Jaoui, M., Kleindienst, T. E., Edney, E. O., and Seinfeld, J. H.: Effect of Acidity on Secondary Organic Aerosol Formation from Isoprene, Environ. Sci. Technol., 41, 5363–5369, https://doi.org/10.1021/es0704176, 2007.
Tang, Y. S., Braban, C. F., Dragosits, U., Dore, A. J., Simmons, I., van Dijk, N., Poskitt, J., Dos Santos Pereira, G., Keenan, P. O., Conolly, C., Vincent, K., Smith, R. I., Heal, M. R., and Sutton, M. A.: Drivers for spatial, temporal and long-term trends in atmospheric ammonia and ammonium in the UK, Atmos. Chem. Phys., 18, 705–733, https://doi.org/10.5194/acp-18-705-2018, 2018.
Tao, Y., and Murphy, J. G.: Evidence for the importance of semi-volatile organic ammonium salts in ambient particulate matter, Environ. Sci. Technol., 53, 108–116, 10.1021/acs.est.8b03800, 2018.
Utell, M. J., Morrow, P. E., Speers, D. M., Darling, J., and Hyde, R. W.: Airway Responses to Sulfate and Sulfuric Acid Aerosols in Asthmatics, Am. Rev. Respir. Dis., 128, 444–450, https://doi.org/10.1164/arrd.1983.128.3.444, 1983.
Vet, R., Artz, R. S., Carou, S., Shaw, M., Ro, C.-U., Aas, W., Baker, A., Bowersox, V. C., Dentener, F., Galy-Lacaux, C., Hou, A., Pienaar, J. J., Gillett, R., Forti, M. C., Gromov, S., Hara, H., Khodzher, T., Mahowald, N. M., Nickovic, S., Rao, P. S. P., and Reid, N. W.: A global assessment of precipitation chemistry and deposition of sulfur, nitrogen, sea salt, base cations, organic acids, acidity and pH, and phosphorus, Atmos. Environ., 93, 3–100, https://doi.org/10.1016/j.atmosenv.2013.10.060, 2014.
Vogel, A. L., Schneider, J., Muller-Tautges, C., Phillips, G. J., Pohlker, M. L., Rose, D., Zuth, C., Makkonen, U., Hakola, H., Crowley, J. N., Andreae, M. O., Pöschl, U., and Hoffmann, T.: Aerosol Chemistry Resolved by Mass Spectrometry: Linking Field Measurements of Cloud Condensation Nuclei Activity to Organic Aerosol Composition, Environ. Sci. Technol., 50, 10823–10832, 10.1021/acs.est.6b01675, 2016.
Weber, R. J., Guo, H., Russell, A. G., and Nenes, A.: High aerosol acidity despite declining atmospheric sulfate concentrations over the past 15 years, Nat. Geosci., 9, 282–285, https://doi.org/10.1038/ngeo2665, 2016.
Wei, H., Vejerano, E. P., Leng, W., Huang, Q., Willner, M. R., Marr, L. C., and Vikesland, P. J.: Aerosol microdroplets exhibit a stable pH gradient, P. Natl. Acad. Sci. USA, 115, 7272–7277, https://doi.org/10.1073/pnas.1720488115, 2018.
Wexler, A. S.: Atmospheric aerosol models for systems including the ions H+, , Na+, , , Cl−, Br−, and H2O, J. Geophys. Res., 107, 1–14, https://doi.org/10.1029/2001jd000451, 2002.
Yao, X., Yan Ling, T., Fang, M., and Chan, C. K.: Comparison of thermodynamic predictions for in situ pH in PM2.5, Atmos. Environ., 40, 2835–2844, https://doi.org/10.1016/j.atmosenv.2006.01.006, 2006.
Young, A. H., Keene, W. C., Pszenny, A. A. P., Sander, R., Thornton, J. A., Riedel, T. P., and Maben, J. R.: Phase partitioning of soluble trace gases with size-resolved aerosols in near-surface continental air over northern Colorado, USA, during winter, J. Geophys. Res.-Atmos., 118, 9414–9427, https://doi.org/10.1002/jgrd.50655, 2013.
Yu, X. Y., Lee, T., Ayres, B., Kreidenweis, S. M., Malm, W., and Collett, J. L.: Loss of fine particle ammonium from denuded nylon filters, Atmos. Environ., 40, 4797–4807, https://doi.org/10.1016/j.atmosenv.2006.03.061, 2006.
Zhang, Q., Jimenez, J. L., Canagaratna, M. R., Allan, J. D., Coe, H., Ulbrich, I., Alfarra, M. R., Takami, A., Middlebrook, A. M., Sun, Y. L., Dzepina, K., Dunlea, E., Docherty, K., DeCarlo, P. F., Salcedo, D., Onasch, T., Jayne, J. T., Miyoshi, T., Shimono, A., Hatakeyama, S., Takegawa, N., Kondo, Y., Schneider, J., Drewnick, F., Borrmann, S., Weimer, S., Demerjian, K., Williams, P., Bower, K., Bahreini, R., Cottrell, L., Griffin, R. J., Rautiainen, J., Sun, J. Y., Zhang, Y. M., and Worsnop, D. R.: Ubiquity and dominance of oxygenated species in organic aerosols in anthropogenically-influenced Northern Hemisphere midlatitudes, Geophys. Res. Lett., 34, L13801, https://doi.org/10.1029/2007gl029979, 2007a.
Zhang, Q., Jimenez, J. L., Worsnop, D. R., and Canagaratna, M.: A Case Study of Urban Particle Acidity and Its Influence on Secondary Organic Aerosol, Environ. Sci. Technol., 41, 3213–3219, https://doi.org/10.1021/es061812j, 2007b.
Zhou, M., Zhang, Y., Han, Y., Wu, J., Du, X., Xu, H., Feng, Y., and Han, S.: Spatial and temporal characteristics of PM2.5 acidity during autumn in marine and coastal area of Bohai Sea, China, based on two-site contrast, Atmos. Res., 202, 196–204, https://doi.org/10.1016/j.atmosres.2017.11.014, 2017.