the Creative Commons Attribution 4.0 License.
the Creative Commons Attribution 4.0 License.
 | 23 Jan 2019
Impacts of climate change and emissions on atmospheric oxidized nitrogen deposition over East Asia
Junxi Zhang
L. Ruby Leung
Kun Luo
Jean-Francois Lamarque
Jianren Fan
Xiaohong Yao
Huiwang Gao
Tatsuya Nagashima
A multi-model ensemble of Atmospheric Chemistry and Climate Model Intercomparison Project (ACCMIP) simulations is used to study the atmospheric oxidized nitrogen (NOy) deposition over East Asia under climate and emission changes projected for the future. Both dry and wet NOy deposition show significant decreases in the 2100s under RCP4.5 and RCP8.5, primarily due to large anthropogenic emission reduction over both land and sea. However, in the near future of the 2030s, both dry and wet NOy deposition increase significantly due to continued increase in emissions. Marine primary production from both dry and wet NOy deposition increases by 19 %–34 % in the 2030s and decreases by 34 %–63 % in the 2100s over the East China Sea. The individual effect of climate or emission changes on dry and wet NOy deposition is also investigated. The impact of climate change on dry NOy deposition is relatively minor, but the effect on wet deposition, primarily caused by changes in precipitation, is much higher. For example, over the East China Sea, wet NOy deposition increases significantly in summer due to climate change by the end of this century under RCP8.5, which may subsequently enhance marine primary production. Over the coastal seas of China, as the transport of NOy from land becomes weaker due to the decrease in anthropogenic emissions, the effect of ship emissions and lightning emissions becomes more important. On average, the seasonal mean contribution of ship emissions to total NOy deposition is projected to be enhanced by 24 %–48 % and 3 %–37 % over the Yellow Sea and East China Sea, respectively, by the end of this century. Therefore, continued control of both anthropogenic emissions over land and ship emissions may reduce NOy deposition to the Chinese coastal seas.
- Article
(6593 KB) -
Supplement
(787 KB) - BibTeX
- EndNote


As a nutrient, nitrogen is essential to the terrestrial and marine ecosystems and plays vital roles in human health (Galloway et al., 2008), biodiversity (Butchart et al., 2010), primary production (PP) (Doney et al., 2007; Stevens et al., 2015), etc. The oceans comprise the largest and most important ecosystems on Earth and atmospheric nitrogen deposition is an important pathway for delivering nutrients to the ocean (Duce et al., 2008).
The characteristics of atmospheric deposition have been widely studied around the world. The concentrations and fluxes of trace elements in atmospheric deposition are influenced by many factors such as rainfall amount, local emissions, long-range transport of pollutants, etc. (Kim et al., 2000, 2012; Cong et al., 2010; Theodosi et al., 2010; Vuai and Tokuyama, 2011; Connan et al., 2013; Montoya-Mayor et al., 2013). Studies have shown significant changes of nitrogen deposition in the future under the influence of changes in both climate and emissions following the Representative Concentration Pathways (RCPs) (Van Vuuren et al., 2011; Ellis et al., 2013; Lamarque et al., 2013a).
Since projections of future changes in nitrogen deposition from individual models are prone to specific model errors (Reichler and Kim, 2008; Shindell et al., 2013), multi-model ensembles of either climate (Gao et al., 2014, 2016) or chemistry (Lamarque et al., 2013a, b) are important for identifying robust and non-robust changes projected by models. This study uses the nitrogen deposition from an ensemble of models that contributed to the Atmospheric Chemistry and Climate Model Intercomparison Project (ACCMIP; Lamarque et al., 2013b). The nitrogen deposition includes both the oxidized nitrogen deposition (NOy, mainly including NO, NO2, , N2O5, HNO3, HNO4 and organic nitrates) and reduced nitrogen (NHx, mainly including NH3, and organic ammonium). Since the number of models with NHx in ACCMIP is less than five, this study only focuses on the NOy (10 models or so) deposition, which mainly results from NOx emissions.
Due to rapid economic development in China, NOx emission increase in the past (Wang et al., 2013) has led to an increase in nitrogen deposition. For example, Liu et al. (2013) found that nitrogen deposition over land in China increased from 13.2 kg ha−1 in the 1980s to 21.1 kg ha−1 in the 2000s, with an increase of 60 %. In addition, the increased NOx emissions may also enhance NOy deposition in Chinese coastal seas due to the atmospheric and riverine transport of NOx (Luo et al., 2014). In particular, China has a long coastline of almost 18 000 km in length and over 300 million km2 sea areas, with high-density population and industries in the coastal provinces. For NOx emissions over the oceans, shipping emissions are the dominant contributor (Dalsøren et al., 2009; Eyring et al., 2010). Lauer et al. (2007) discussed the significant impact of shipping emissions on aerosols such as aerosol nitrate burden, implying potentially subsequent influence on nitrogen deposition. Fan et al. (2016) concluded that 85 % of ship emissions took place within 200 km of the coastlines, indicating a stronger influence of ship emissions on coastal seas than remote areas. Liu et al. (2016) reported that the shipping NOx emissions in East Asia increased from 1.08 Tg in 2002 to 2.8 Tg in 2013, accounting for nearly 9 % of total NOx emissions in East Asia and 16.5 % of global shipping NOx emissions. In ACCMIP, the NOx emissions over the ocean mainly come from shipping, with a much smaller amount from aircraft as well as lightning since lightning NOx is concentrated in the tropical land areas (Price et al., 1997).
Studies on the changes of nitrogen deposition under the influence of both climate and emission changes have been limited over East Asia. Using the old Special Report on Emissions Scenarios (SRES) such as A2, Lamarque et al. (2005) found large increases in nitrogen deposition over East Asia due to increased emissions, whereas the effect from climate change is much smaller and lacks consensus due to the small ensemble size. In 2100 nitrogen deposition changes due to changes in climate are much less than changes due to increased nitrogen emissions. In contrast, based on the new scenarios RCP4.5 and RCP8.5, Lamarque et al. (2013a) found that the total NOy deposition (wet + dry; Fig. 5a in Lamarque et al., 2013a) over East Asia was projected to decrease by the end of this century due to the combined effect of emissions and climate, but the changes are mainly triggered by the decrease in emissions. However, the individual effect of climate or emissions was not examined in that study. With the same dataset of ACCMIP, Allen et al. (2015) found that by keeping the emissions at the current level, aerosol wet deposition decreases over the land areas of the tropics and Northern Hemisphere midlatitudes due to the decrease in large-scale precipitation, subsequently enhancing the increase in wet deposition over the ocean through the transport effect. Climate change alone may modulate the changes in the deposition, particularly for wet deposition due to the response of precipitation to climate change. Hence, it is important to elucidate the influence of climate and emission changes on dry and wet NOy deposition over East Asia using the multi-model ensemble ACCMIP results.
In what follows, we first discuss the capability of ACCMIP in capturing the deposition patterns, followed by the changes of dry and wet deposition in the future under the combined effect of climate change and emissions. Lastly, we elucidate the individual effect from climate change or emissions.
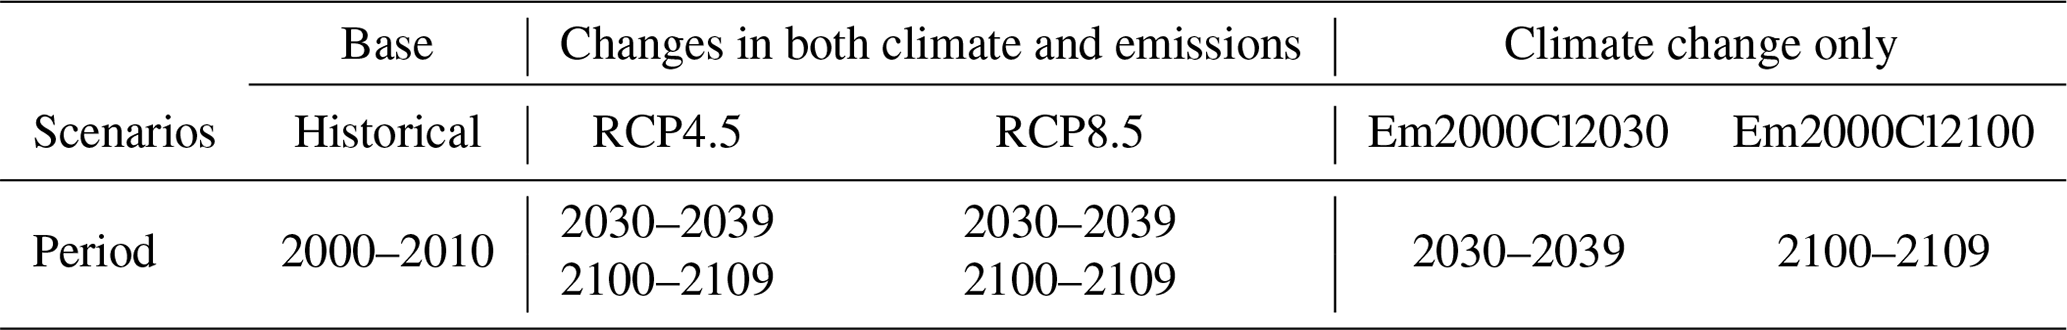
In this study, about 10 models from ACCMIP are used, similar to Lamarque et al. (2013b). All the data are interpolated to a spatial resolution of to facilitate analysis and comparison across models. To evaluate the impacts of climate and emission change as well as to isolate their individual effect, five cases of ACCMIP scenarios are used in this study, as listed in Table 1. The base case over the historical period covers the decade of 2000, mainly from 2001 to 2010. Two cases target the investigation of both climate and emission changes under future scenarios of RCP4.5 and RCP8.5, covering two periods in the decades of 2030 and 2100 (first column of Table 1). The remaining two cases are used to investigate the impact from climate change only in the 2030s and 2100s under RCP8.5 by maintaining emissions at the level of the year 2000 (last column of Table 1). As different models have different simulation years, some models may not cover the entire decades of the 2030s and 2100s. Detailed simulation lengths for each model are listed in Table S1 (in the Supplement). In the ACCMIP dataset, the summation of all simulated oxidized nitrogen species is referred to as NOy, which is the major focus of this study.
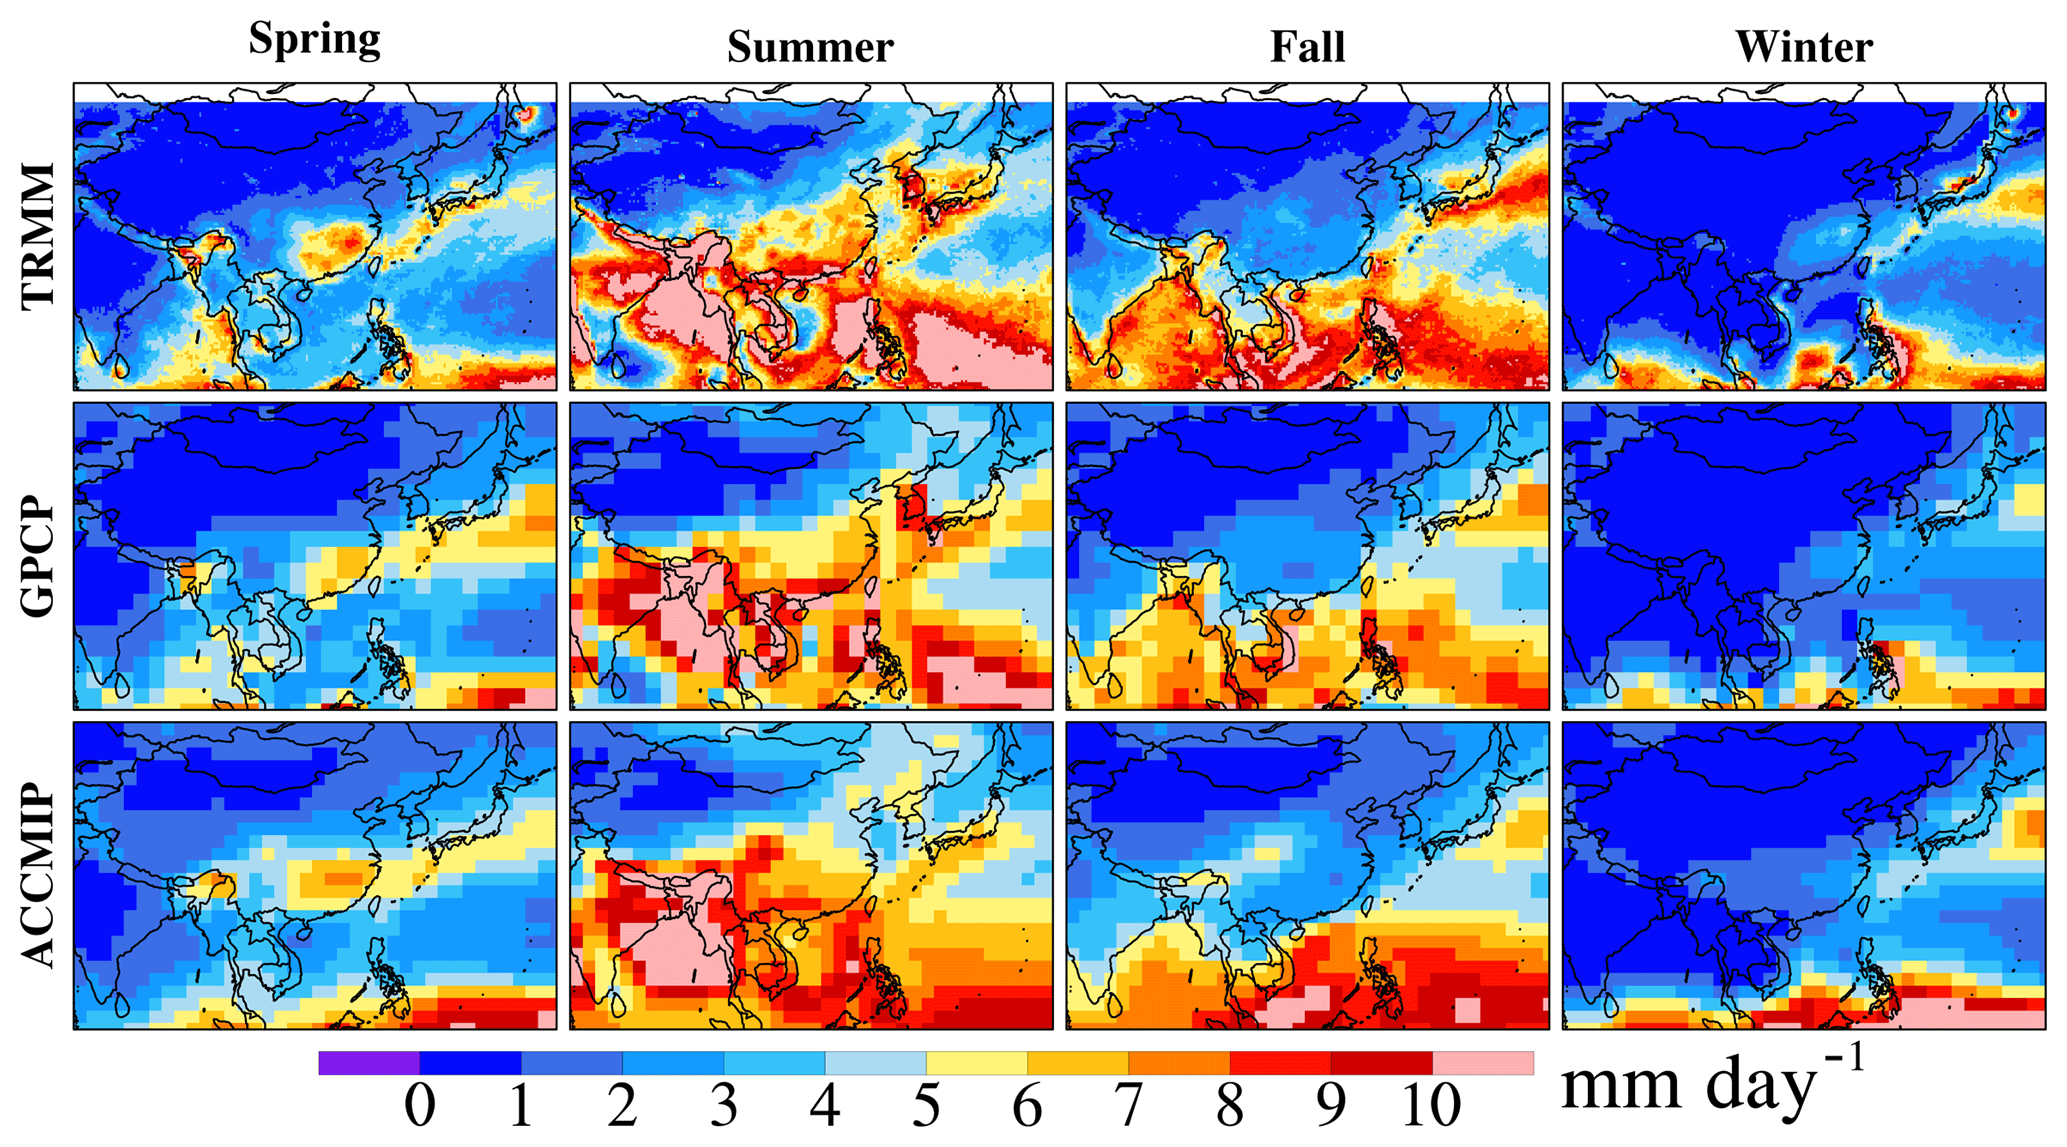
Figure 1Evaluation of seasonal mean precipitation during 2001–2010: ACCMIP multi-model ensemble mean vs. TRMM and GPCP.
The deposition results of ACCMIP have been extensively evaluated previously across land areas by comparing with three datasets including the National Atmospheric Deposition Program (NADP), European Monitoring and Evaluation Programme (EMEP) and Acid Deposition Monitoring Network in East Asia (EANET), and reasonable performance was demonstrated by the ACCMIP results (Lamarque et al., 2013a). There is a lack of deposition data over the ocean, making evaluation of the ACCMIP results across the oceans difficult. Recently, Baker et al. (2017) conducted an intensive evaluation of the ACCMIP multi-model mean based on a large number of dry NOy deposition samples, i.e., a total of 770 samples collected over the Pacific, showing comparable spatial distributions between observations and ACCMIP, such as a consistent northwest–southeast gradient with higher deposition flux closer to the coast (Fig. 12 in Baker et al., 2017). In terms of wet deposition, considering the close relationship between wet deposition and precipitation (Kryza et al., 2012; Wałaszek et al., 2013), evaluation of precipitation is performed using the Tropical Rainfall Measuring Mission (TRMM; http://pmm.nasa.gov/trmm, last access: 18 January 2019) and Global Precipitation Climatology Project (GPCP) v2.3 (Adler et al., 2018) precipitation data. Figure 1 shows a comparison of the annual mean precipitation over the historical period (2000–2010) among the ACCMIP multi-model ensemble mean, TRMM, which only covers 60∘ N–60∘ S, and GPCP. In general, the ACCMIP mean precipitation captures the spatial variations in the observed precipitation from both TRMM and GPCP well, with stronger precipitation in the southern part of Asia, particularly over the South China Sea and the Bay of Bengal, and lighter precipitation in northern China (i.e., northwest China). In particular, the rain belt stretching from the east of Japan to the Philippines in summer is also well captured by ACCMIP. To further illustrate the uncertainties among different models, the standard deviation of seasonal mean precipitation across all ACCMIP models over East Asia is shown in Fig. S1 (in the Supplement), within 1–2 mm day−1 over Chinese coastal seas.
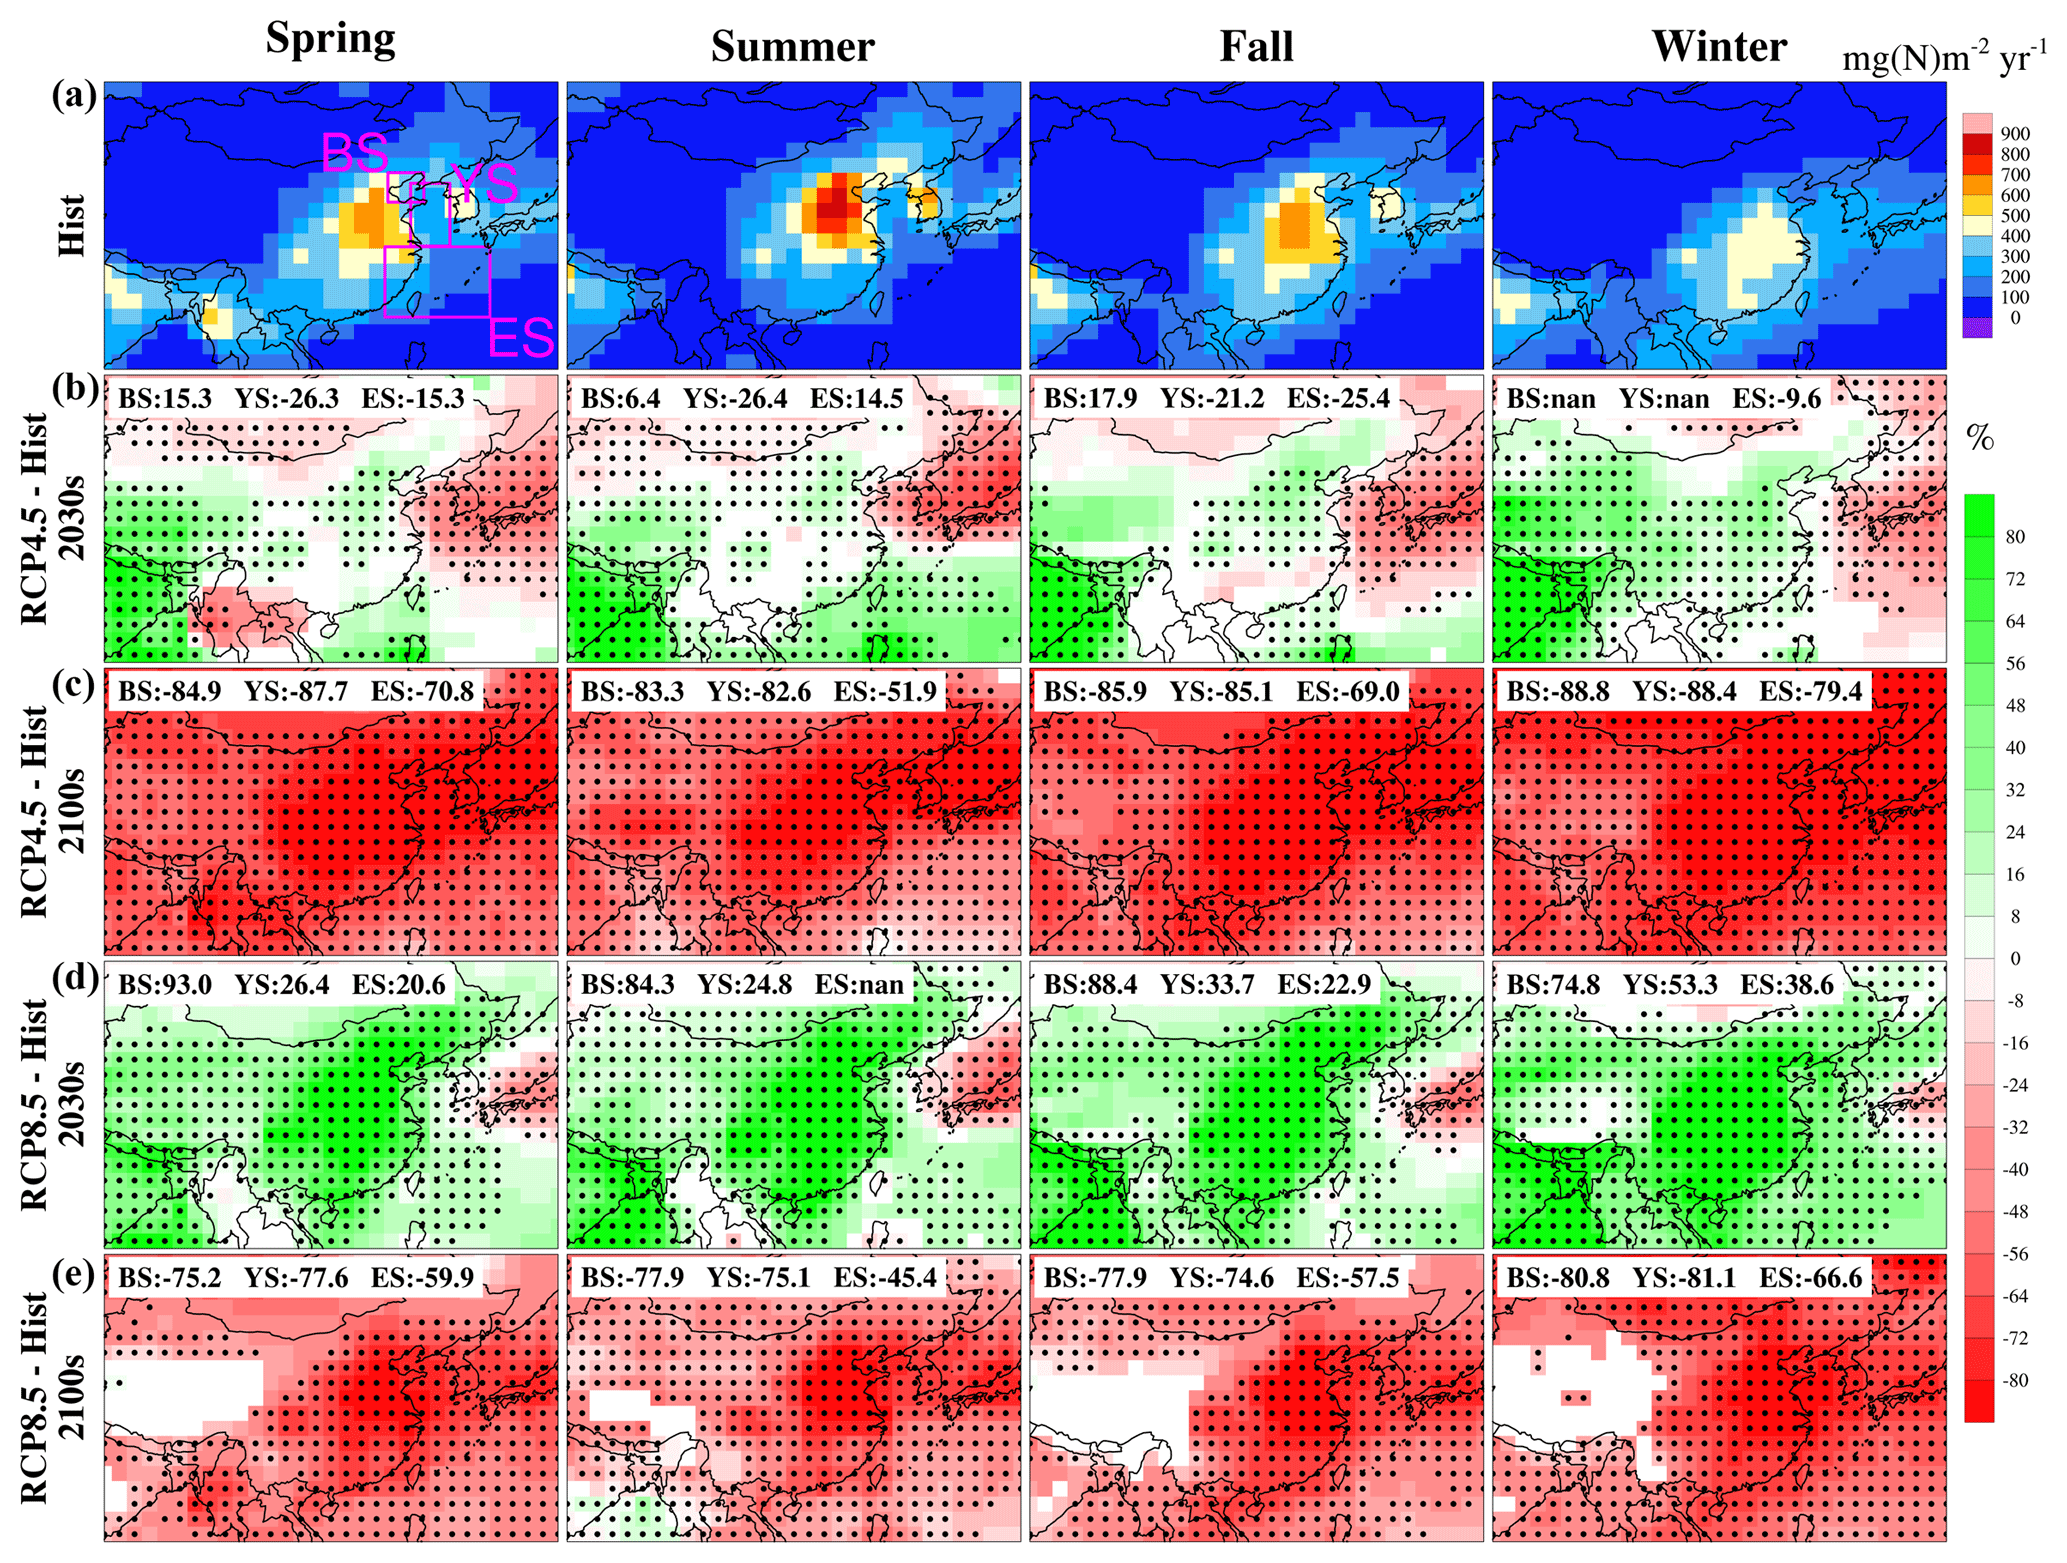
Figure 2Spatial distribution of mean seasonal dry NOy deposition over East Asia under historical (2001–2010; a) as well as future changes. Panels (b)–(e) represent changes under RCP4.5 2030s, RCP4.5 2100s, RCP8.5 2030s and RCP8.5 2100s relative to the historical period. Only grids with multi-model agreement are shown (grids without model agreement are in white), and stippling marks areas with statistical significance (t test; α=0.05). Regions of the Bohai Sea (BS), Yellow Sea (YS) and East China Sea (ES) are marked by the pink rectangles in the top left panel, with mean changes shown on the top left of each panel in (b)–(e). Only grids with significant change in the ocean areas are calculated. The mean change of a region is set to nan if the number of significant grids in this region is fewer than half of the area.
Considering the uncertainty and variability among multiple ACCMIP results, all analyses, i.e., the future changes of deposition, are performed based on model agreement and statistical significance. Following our previous studies (Gao et al., 2014, 2015), results at a model grid cell are considered to have agreement if at least 70 % of the ACCMIP models show the same sign of change as the ACCMIP multi-model ensemble mean. For models showing agreement with the ensemble mean, if more than half of the models show statistical significance at the 95 % level, then the ensemble mean change for that particular grid is considered to be statistically significant.
The seasonal mean distribution of dry NOy deposition over East Asia areas for historical (2001–2010) and projected future changes under RCP scenarios (RCP4.5 and RCP8.5) during the two periods of 2030 and 2100 are shown in Fig. 2. The four seasons defined in this study are spring (March–May), summer (June–August), fall (September–November) and winter (December–February). Regional mean changes over the BYE (Bohai Sea, Yellow Sea and East China Sea) areas are shown in each panel, calculated from multi-model mean results. The corresponding standard deviations of multiple models are shown in Table S2.
As anthropogenic activities play important roles in NOx emissions, high atmospheric dry nitrogen (NOy) deposition values mainly cluster around areas with high population density and industrial activities in the historical periods (Fig. 2a), e.g., high values of NOy deposition can be seen in east China, Korea, Japan and their coastal seas. In this study, in addition to the land areas, we also focus on three coastal seas in East Asia (BYE areas), marked by the three pink boxes in Fig. 2a. A gradient of decreasing NOy deposition is found (Fig. 2a) from eastern China to the coastal areas. Seasonal variations show that over mainland China summer is the season with the highest dry and wet NOy deposition, with high dry deposition likely caused by the high deposition velocity (Zhang et al., 2017) and wet deposition due to more precipitation in summer, consistent with previous studies (Liu et al., 2017; Zhang et al., 2017; Xu et al., 2018). Over the Yellow Sea and East China Sea, the notably higher NOy deposition (first row of Fig. 2) is partly attributed to NOx emissions transported from land to the coastal seas. In particular, the dry NOy deposition over the East China Sea is obviously higher in winter compared to summer, likely resulting from enhanced transport by the northwesterly winds during the winter monsoon (Ding, 1993).
Considering the projected future changes of NOy deposition, we show the distributions in the 2030s and 2100s under the RCP4.5 and RCP8.5 scenarios, representing near-term and long-term changes. Dry NOy deposition decreases remarkably in the 2100s under the RCP4.5 and RCP8.5 scenarios over East Asia, a result of a large decrease in emissions (second column in Fig. S2). In the 2030s, in addition to the decrease in dry deposition in Japan, Korea and the surrounding areas, RCP8.5 shows a predominant increase in dry deposition (Fig. 2d); in contrast, robust significant increases in western China and India are projected, with few or weak signals in eastern China in RCP4.5, consistent with the emission change patterns (first column in Fig. S2).
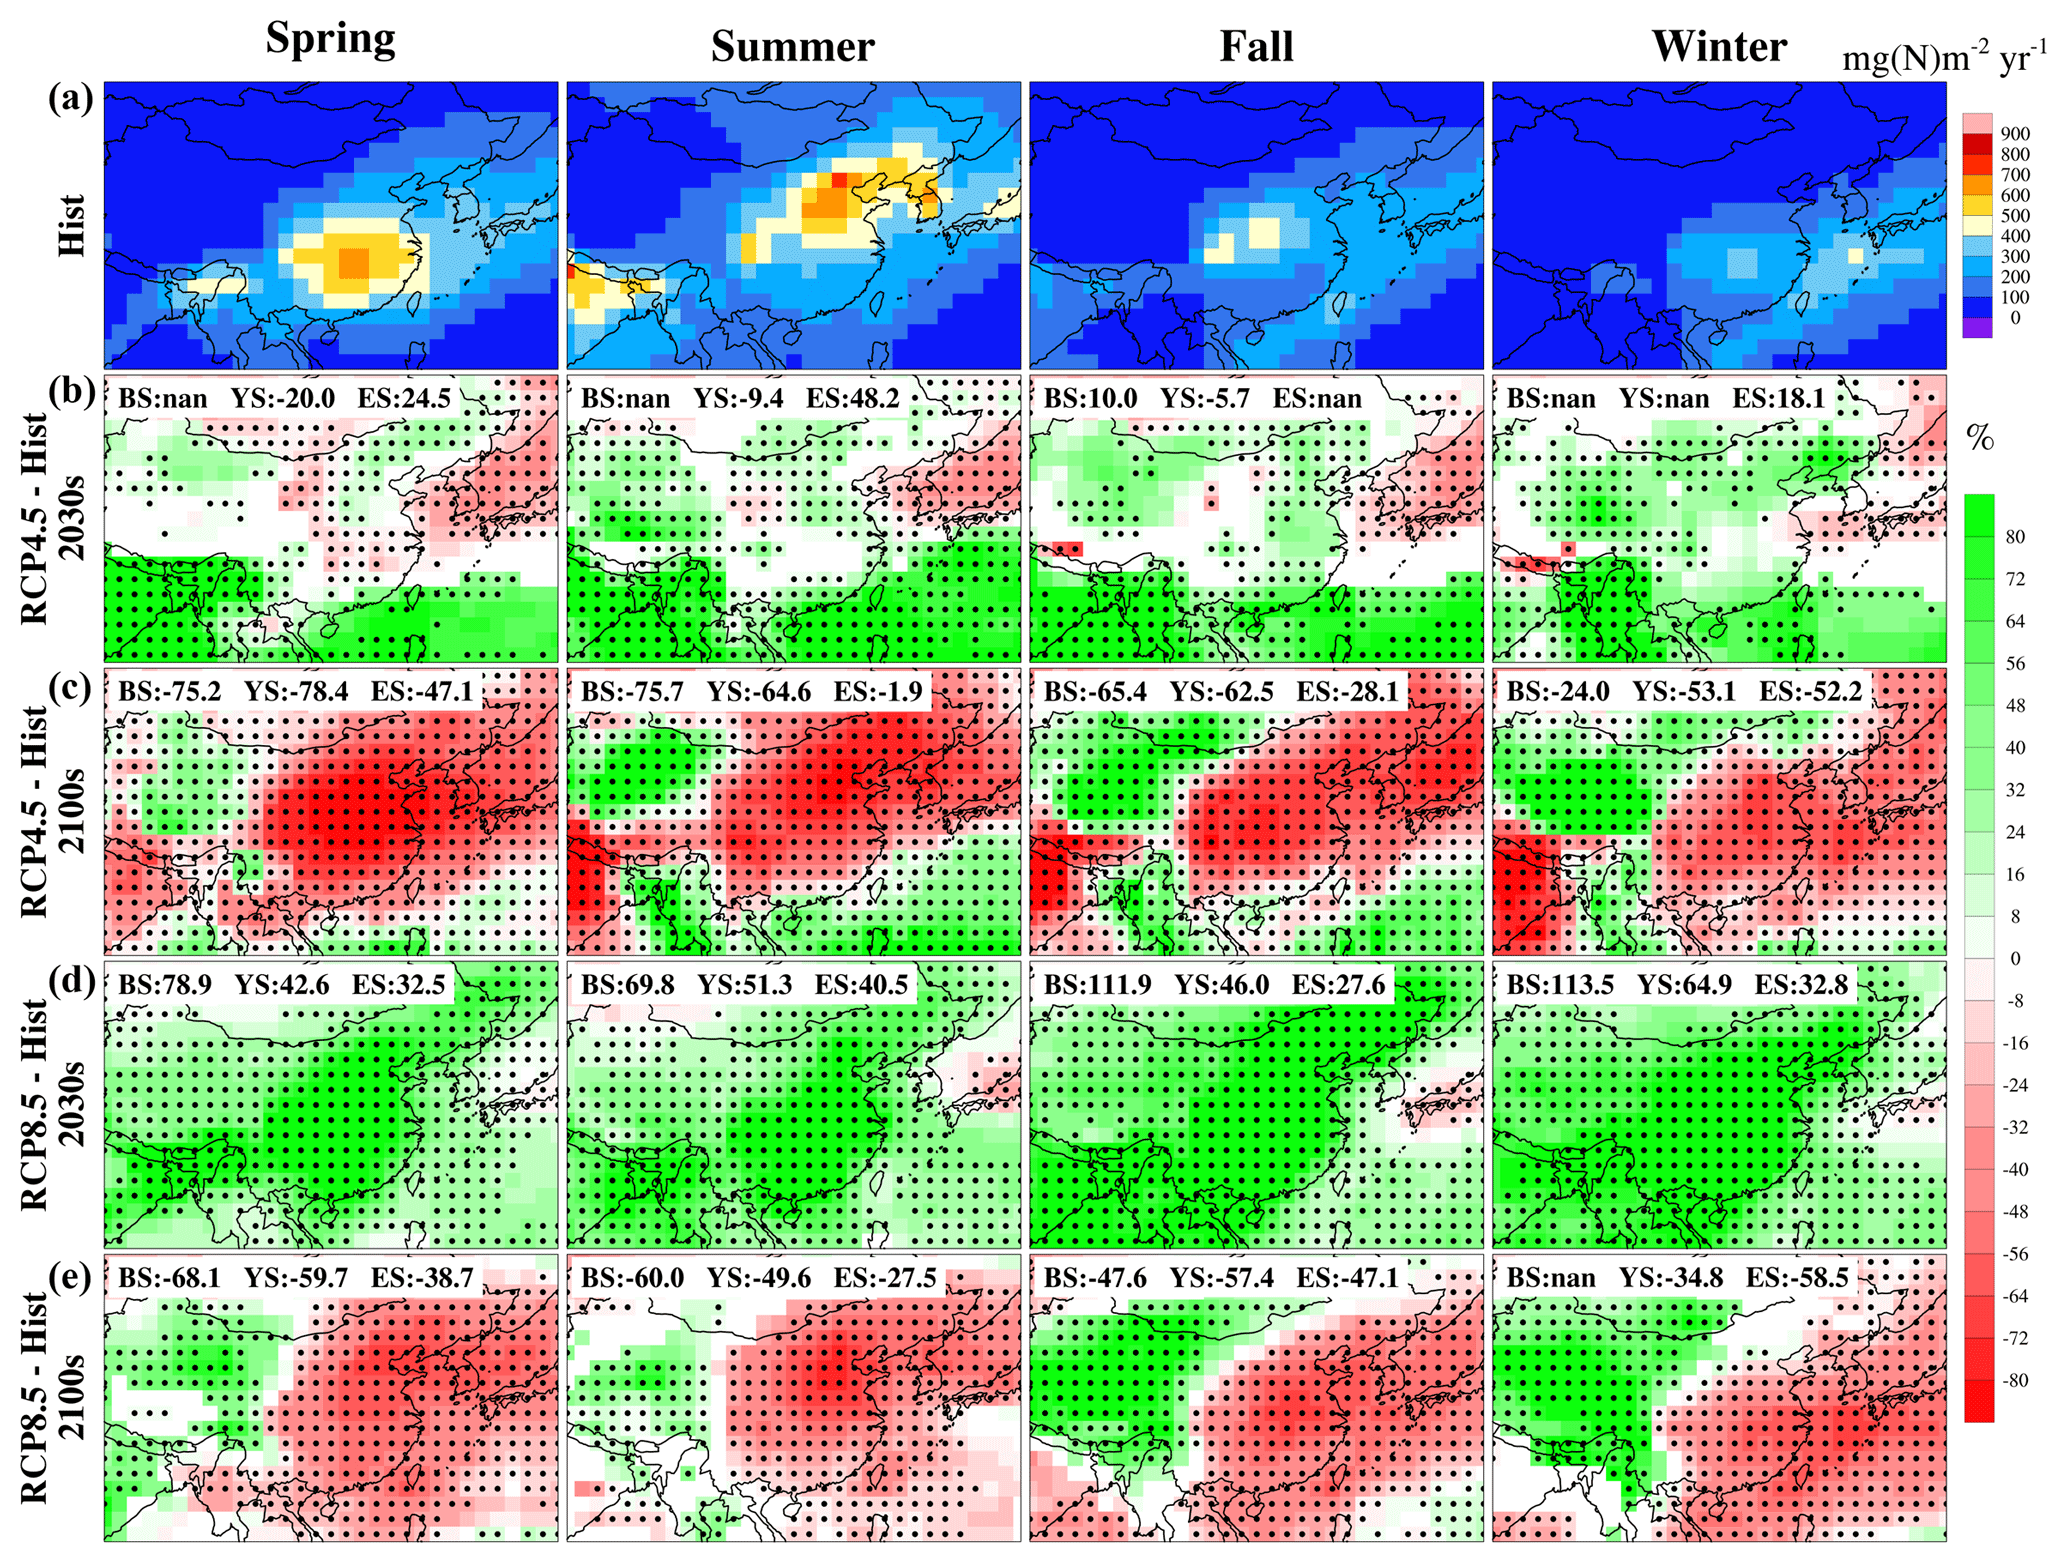
For wet NOy deposition, as discussed earlier, summer is the season with the strongest deposition (Fig. 3a), primarily caused by the highest precipitation among the four seasons (Fig. 1). In the 2030s, changes of wet deposition (Fig. 3b, d) are, in general, similar to the patterns of dry deposition changes (Fig. 2b, d), with standard deviation of wet deposition shown in Table S3. In the 2100s, the patterns of wet deposition changes are different from those of dry deposition, with relatively clear east–west dipole features, in particular under RCP8.5. To elucidate what controls the dipole patterns, the individual effect of climate change and emissions is discussed in the next section.
Two scenarios from ACCMIP are used in this study to isolate the influence of anthropogenic emissions and climate change on NOy deposition. The two scenarios are shown in Table 1, with emissions kept at the current level (the decade of 2000s) but climate for the 2030s and 2100s under RCP8.5 are compared.

Figure 4Spatial distribution of mean seasonal dry NOy deposition change over East Asia under experimental scenarios of ACCMIP (Em2000Cl2030 and Em2000Cl2100) relative to the historical period (2001–2010). The distribution of mean seasonal dry NOy deposition under the historical period is shown in Fig. 2a. Only grids with multi-model agreement are shown (grids without model agreement are in white), and among the grids with model agreement, stippling marks statistical significance (α=0.05).
Climate change alone has negligible contributions to the dry NOy deposition changes, as shown in Fig. 4. Generally, calculation of dry deposition flux in chemical models follows Eq. (1), where F is vertical dry deposition flux, C is concentration of specific gas or particle and vd is the dry deposition velocity.
All models in ACCMIP calculated dry deposition velocity using the resistance approach (Lamarque et al., 2013b), which defines the inverse of dry deposition velocity as Eq. (2),
where rt is the total resistance, ra is the aerodynamic resistance, which is common to all gases, rb is the quasilaminar sublayer resistance and rc is the bulk surface resistance (Steinfeld, 1998). As rb depends on the molecular properties of the target substance and deposition surface and rc depends on the nature of the surface (Steinfeld, 1998), they do not vary under climate change. As for ra, it plays a significant role in transporting gases and particles from the atmosphere to the receptor surface. Ra is governed by atmospheric turbulent transport, mainly controlled by the wind shear as well as buoyancy (Erisman and Draaijers, 2003). Therefore, climate change affects dry deposition velocity for the gases or particles mainly through its modulation of ra. As shown in Fig. 4, the changes of dry depositions from climate change alone are mostly negligible compared to the total changes from both climate change and emissions (Fig. 2), indicating statistically insignificant change of ra under a warmer climate.
Considering the impact of climate conditions on NOy deposition, precipitation is an important factor and has been shown to positively correlate with wet NOy deposition (Kryza et al., 2012; Wałaszek et al., 2013). In order to further quantify the relationship between wet deposition and precipitation, we display in Fig. 5 the correlation between the changes of precipitation and wet NOy deposition over the BYE areas for the scenarios with fixed emissions. All correlations are positive and statistically significant. There is a larger inter-model spread of changes in Em2000Cl2100 compared to Em2000Cl2030, and the larger changes in precipitation and wet deposition allow a stronger correlation between them to emerge in the 2100s relative to the 2030s. Meanwhile, winter shows the highest correlation in both Em2000Cl2030 and Em2000Cl2100, partly related to the significant decrease in both wet NOy deposition and precipitation in winter under Em2000Cl2100 over the East China Sea, which will be discussed in detail next.
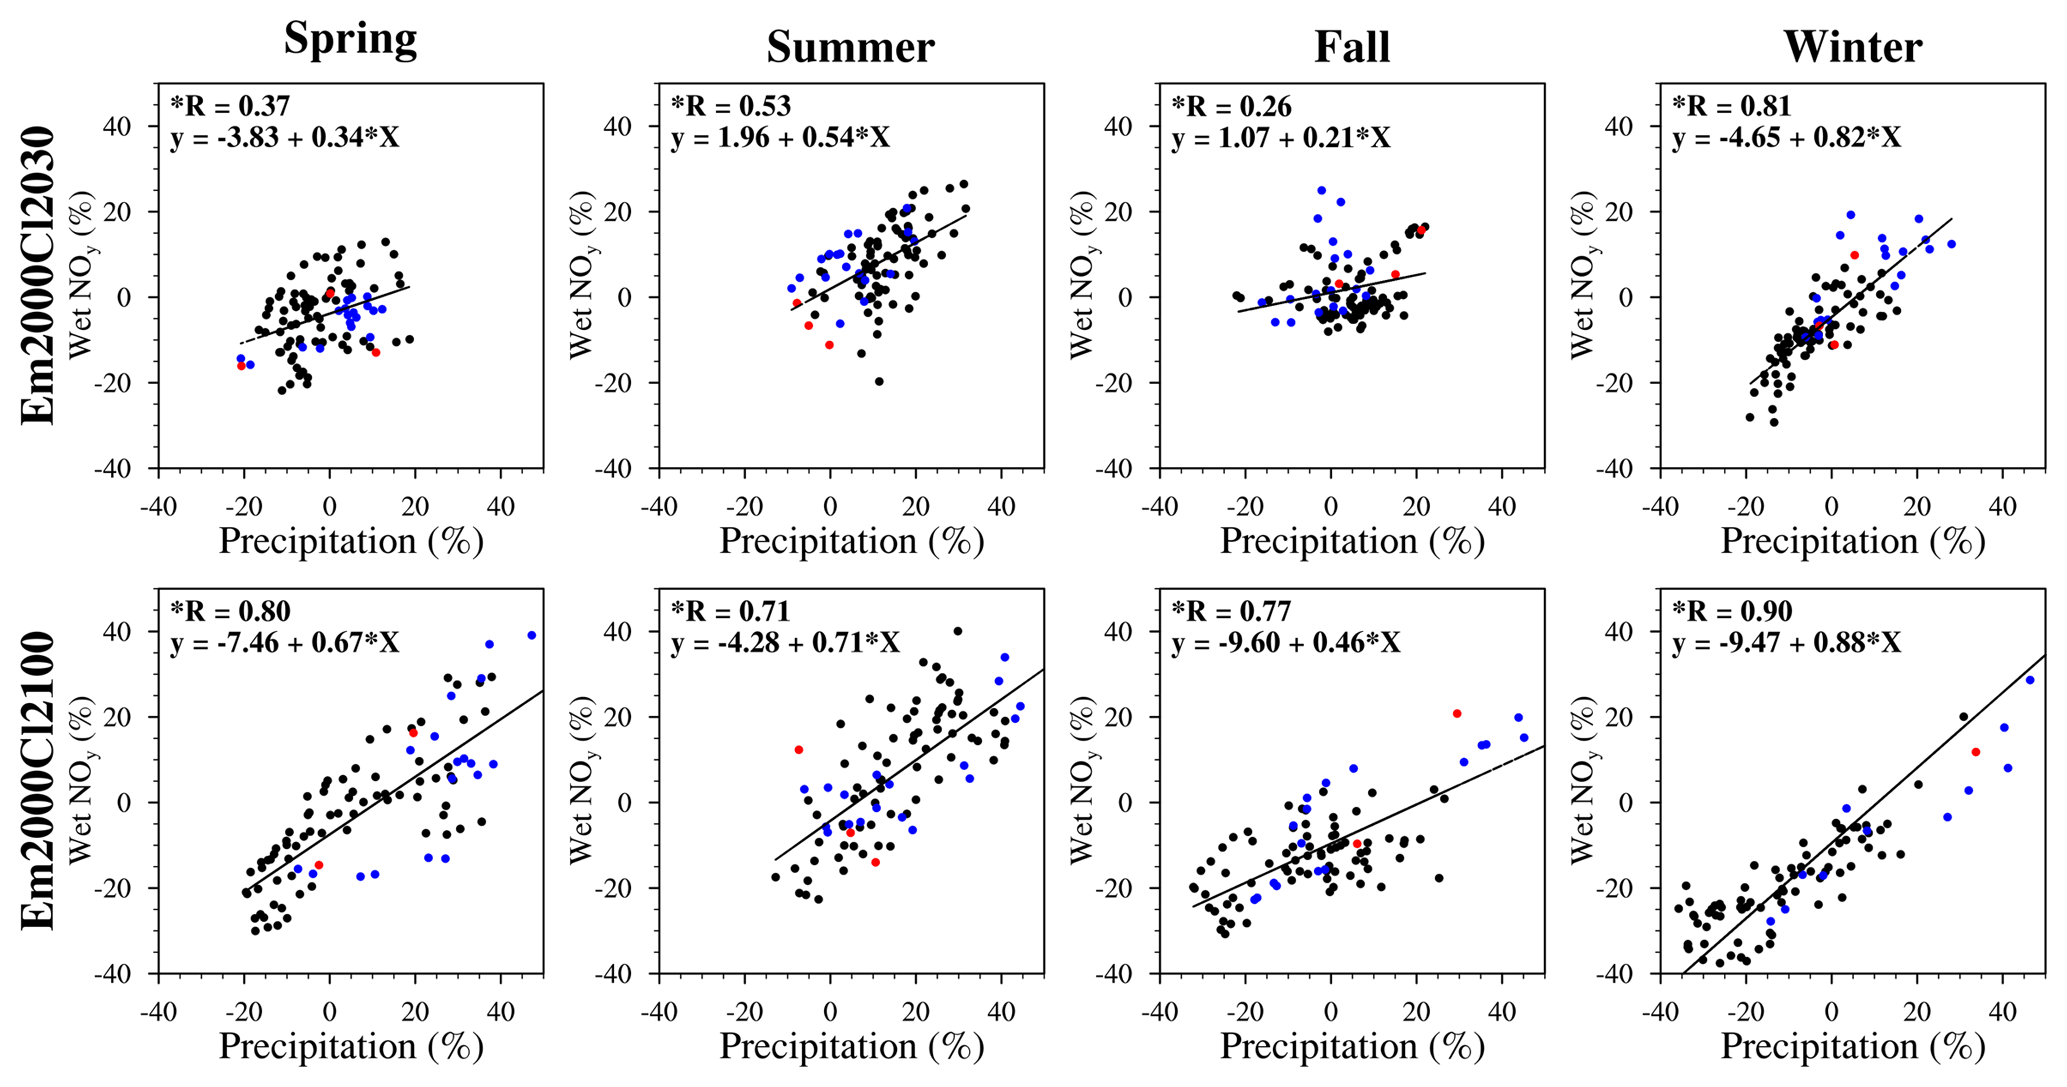
Figure 5Comparison between precipitation and wet NOy deposition changes under the experimental scenarios of ACCMIP (Em2000Cl2030 and Em2000Cl2100) relative to the historical period (2001–2010) over the Bohai Sea (red points), Yellow Sea (blue points) and East China Sea (black points). An r test (α=0.05) is performed in each panel for statistical significance and the star before “R” indicates statistical significance at the 95 % confidence level. Each point in this figure corresponds to the results from an individual model of ACCMIP.
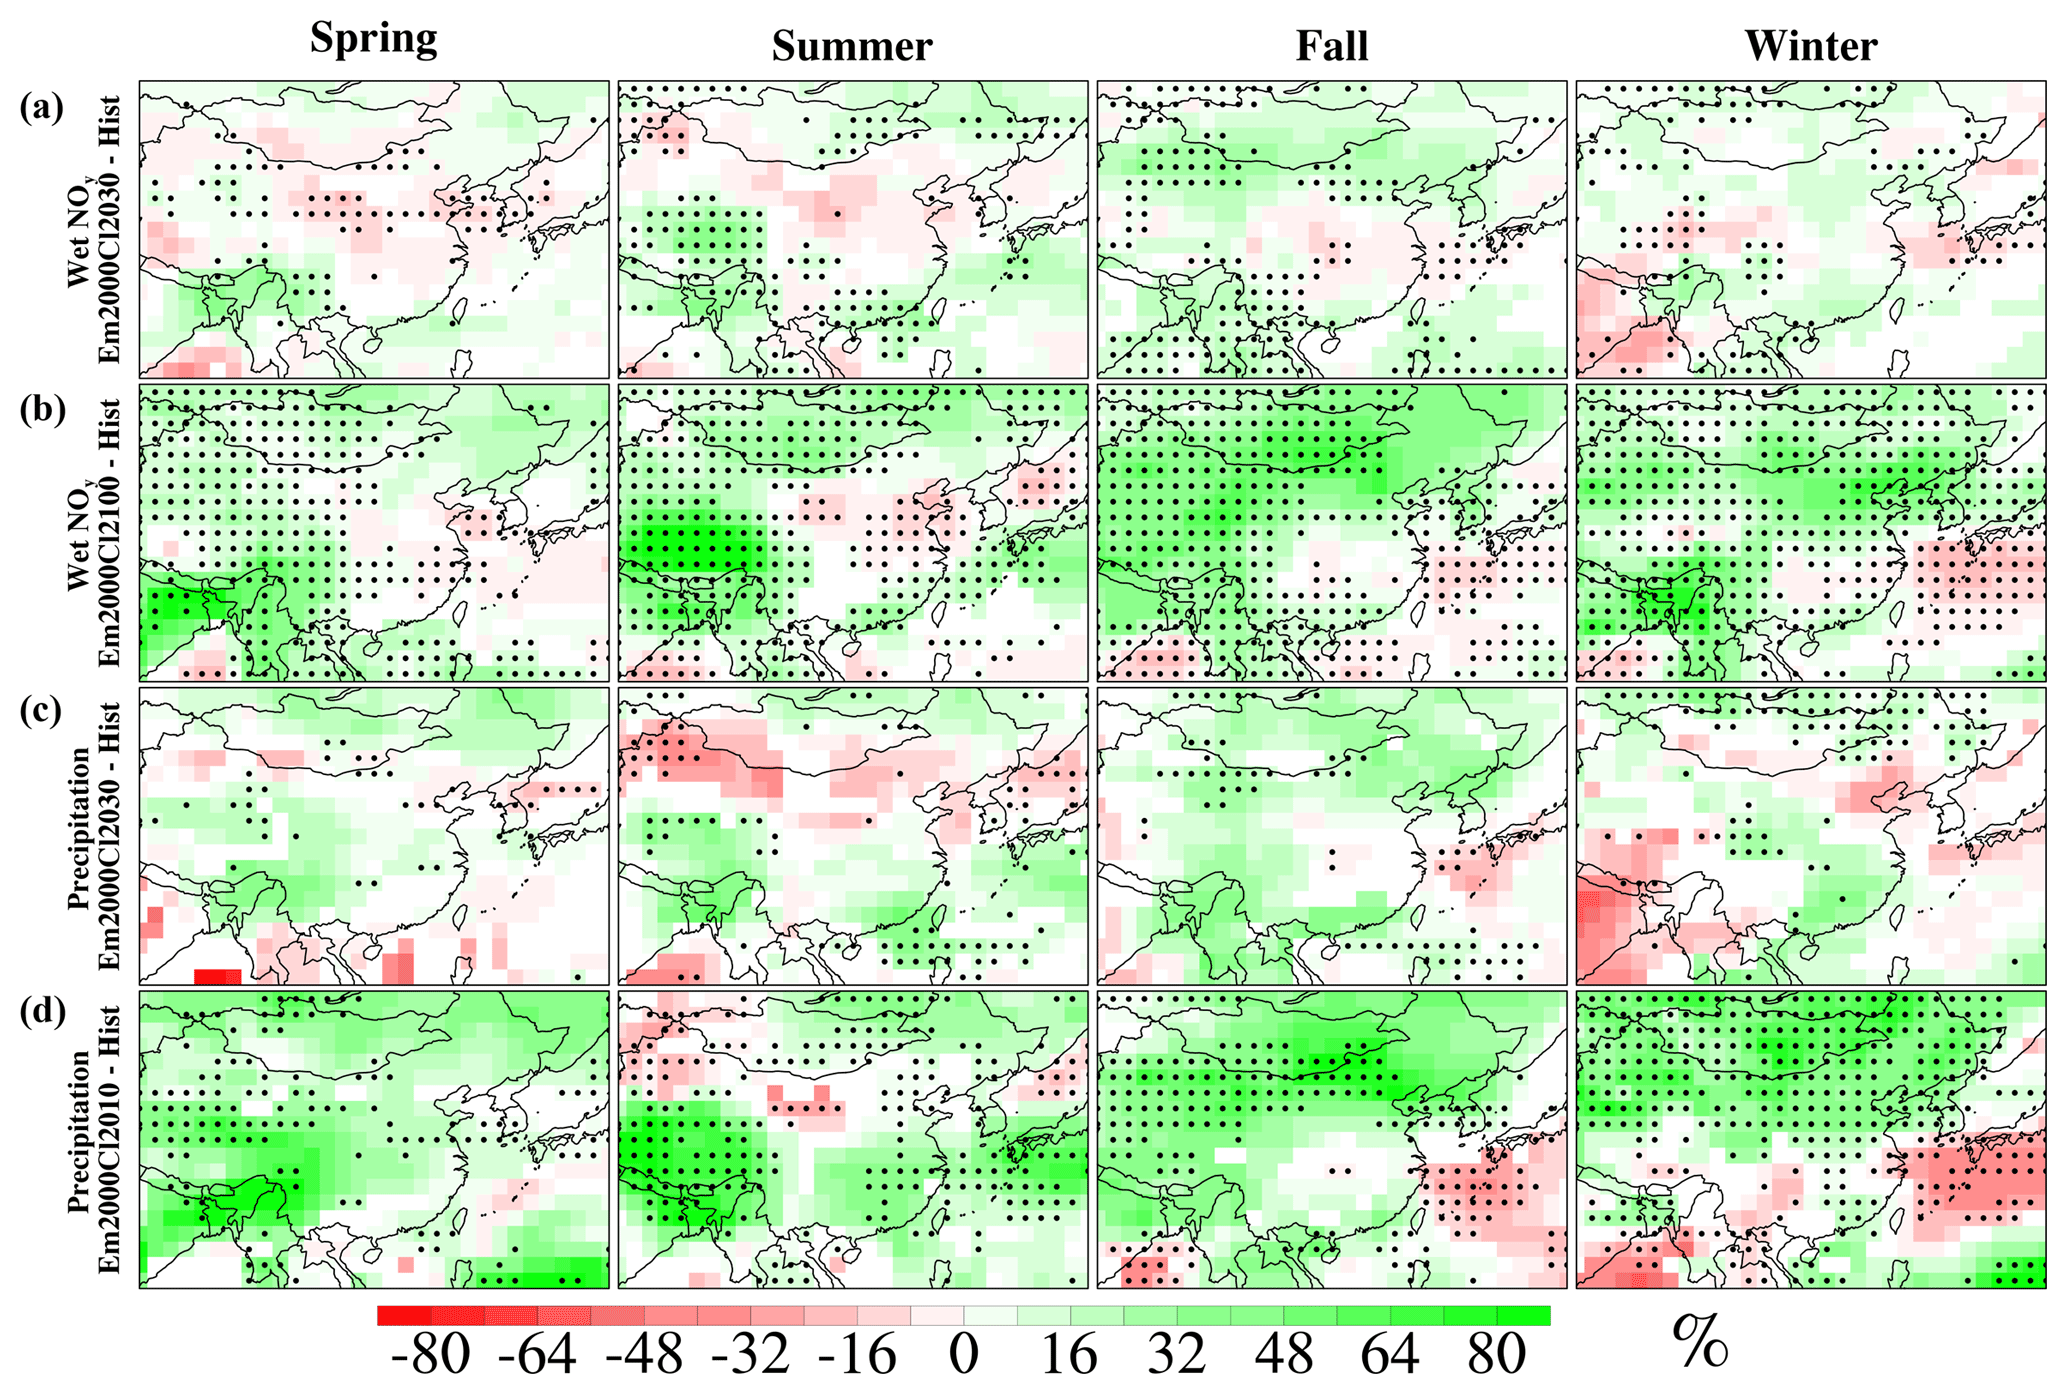
Figure 6Spatial distribution of mean seasonal wet NOy deposition change and precipitation change under EM2000Cl2030 and Em2000Cl2100 relative to the historical period (2001–2010). The panels are drawn and arranged in the same manner as Fig. 2.
As depicted in Fig. 6, the changes of wet deposition in the 2030s due to climate change are mostly insignificant (Fig. 6a) and correspond well with the insignificant changes of precipitation (Fig. 6c). Similarly, the patterns in the 2100s between the changes of wet deposition (Fig. 6b) and precipitation (Fig. 6d) are quite consistent. For example, in spring, summer and fall, a dominant increase in western China is projected (first three panels in Fig. 6b,d), whereas in winter a north and southeastern dipole feature is clearly seen. Over the East China Sea, wet NOy deposition increases significantly in summer (18 %) and decreases significantly in winter (−13 %), indicating a remarkable influence of climate change on the wet NOy deposition. The changes of precipitation are generally consistent with those reported in other studies. Both Chong-Hai and Ying (2012) and Wang and Chen (2014) show a significant increase in precipitation except for eastern south China at the end of the 21st century under RCP8.5. Comparing Fig. 6 with Fig. 3, it is clear that the dipole pattern of changes in wet deposition in the 2100s shown in Fig. 3 is primarily related to the large reduction of emissions over eastern China.
From the global perspective, the emissions of nitrogen oxide are, in general, balanced by the NOy deposition as documented in Lamarque et al. (2013a) using the ACCMIP model results, although NOy deposition might be larger due to the downward transport from the stratosphere. For a particular region, the NOy deposition can be considered to be the contribution of both local NOx emissions such as shipping and lightning as well as transport from the East Asian continent. Therefore, we calculate the multi-model seasonal mean NOy deposition and NOx emissions from shipping and lightning. As was documented by Liu et al. (2016), ship emissions from the East China Sea may account for a large percentage (31 %) of the total ship emissions in East Asia, indicating the strong effect of ship emissions over Chinese coastal seas. To avoid biases from spatial interpolation, calculation is performed based on the original model grid and regionally averaged for each model. Since the changes in the Bohai Sea are less significant in general, particularly in the near future (Figs. 2b, 3b), we only focus on the emission and deposition changes over the Yellow Sea and East China Sea. Summary of shipping and lightning NOx emissions over the Yellow Sea and East China Sea under historical, RCP and other scenarios is listed in Table S4. Overall, lightning emissions are much smaller than shipping emissions. In the future, seasonal mean shipping emissions increase in the 2030s, in particular under RCP8.5, and decrease in the 2100s under both RCP scenarios, whereas the changes of lightning emissions are small except in summer, with a mean increase of 73 % over the Yellow Sea and East China Sea. Based on NOx emissions and NOy deposition, the percentage of dry and wet deposition, as well as the ratio of ship emissions and lightning emissions to the total NOy deposition are shown in Figs. 7 and 8. The ratio of ship emissions and lightning emissions to the total NOy deposition is used to characterize their contribution to NOy deposition with the assumption that all ship and lightning emissions contribute to the NOy deposition, which can be considered an upper bound of their contribution.
A couple of features can be identified from Figs. 7 and 8. First, total NOy deposition was shown as the green dashed line, with all values consistent with the spatial distributions in Figs. 2–4. By the end of this century (2100), total NOy deposition decreases substantially under both RCP4.5 and RCP8.5, whereas in the 2030s, total deposition shows a dramatic increase in RCP8.5 but moderate change in RCP4.5 (slight decrease in the Yellow Sea and increase in the East China Sea). The percentage of dry deposition over the Yellow Sea and East China Sea (third and fifth blue color bars from the left in each panel of Figs. 7, 8) decreases in the 2100s under RCP4.5 and RCP8.5, consistent with the patterns shown in Figs. 2c, e and 3c, e, due primarily to emission reduction. Second, despite the decrease in shipping emissions in the 2100s, the contribution of ship emissions to total NOy deposition increases substantially under both RCP4.5 and RCP8.5 over the Yellow Sea and East China Sea (black color bars in Figs. 7, 8), due primarily to the larger emission reduction over land (e.g., eastern China) compared to ocean (Fig. S2). For instance, over the historical period, the seasonal contribution of ship emissions to total NOy deposition is 22 %–30 % and 52 %–82 % for the Yellow Sea and East China Sea, respectively; however, in the 2100s, it reaches 56 %–99 % (RCP4.5) and 42 %–58 % (RCP8.5) for the Yellow Sea and 81 % to almost 100 % (RCP4.5) and 74 % to almost 100 % (RCP8.5) for the East China Sea, with a mean seasonal increase of 24 %–48 % and 3 %–37 % for the Yellow Sea and East China Sea, respectively. Third, the contribution of lightning NOx in spring and winter is negligible; however, the contribution is nontrivial in summer and fall (orange bars in Figs. 7, 8). In particular, due to the reduction in anthropogenic emissions over land and ship emissions in the 2100s under RCP4.5 and RCP8.5 (Fig. S2) along with the increase in lightning NOx emissions over Chinese coastal seas (Table S4), the contribution of lightning NOx becomes more obvious compared with the case without emission reduction. For example, in summer in the 2100s, the contribution of lightning NOx increases from 1 % to 7 % (both RCP4.5 and RCP8.5) over the Yellow Sea and 3 %–7 % in RCP4.5 and 6 % in RCP8.5 over the East China Sea. In fall in the 2100s, the contribution of lightning NOx increases from less than 1 % to 3 % (both RCP4.5 and RCP8.5) over the Yellow Sea and from 1 % to 4 % (both RCP4.5 and RCP8.5) in the East China Sea. These results illustrate a shift in the future towards enhanced impact from ship and lightning emissions when anthropogenic emissions are largely controlled in the upwind land regions.
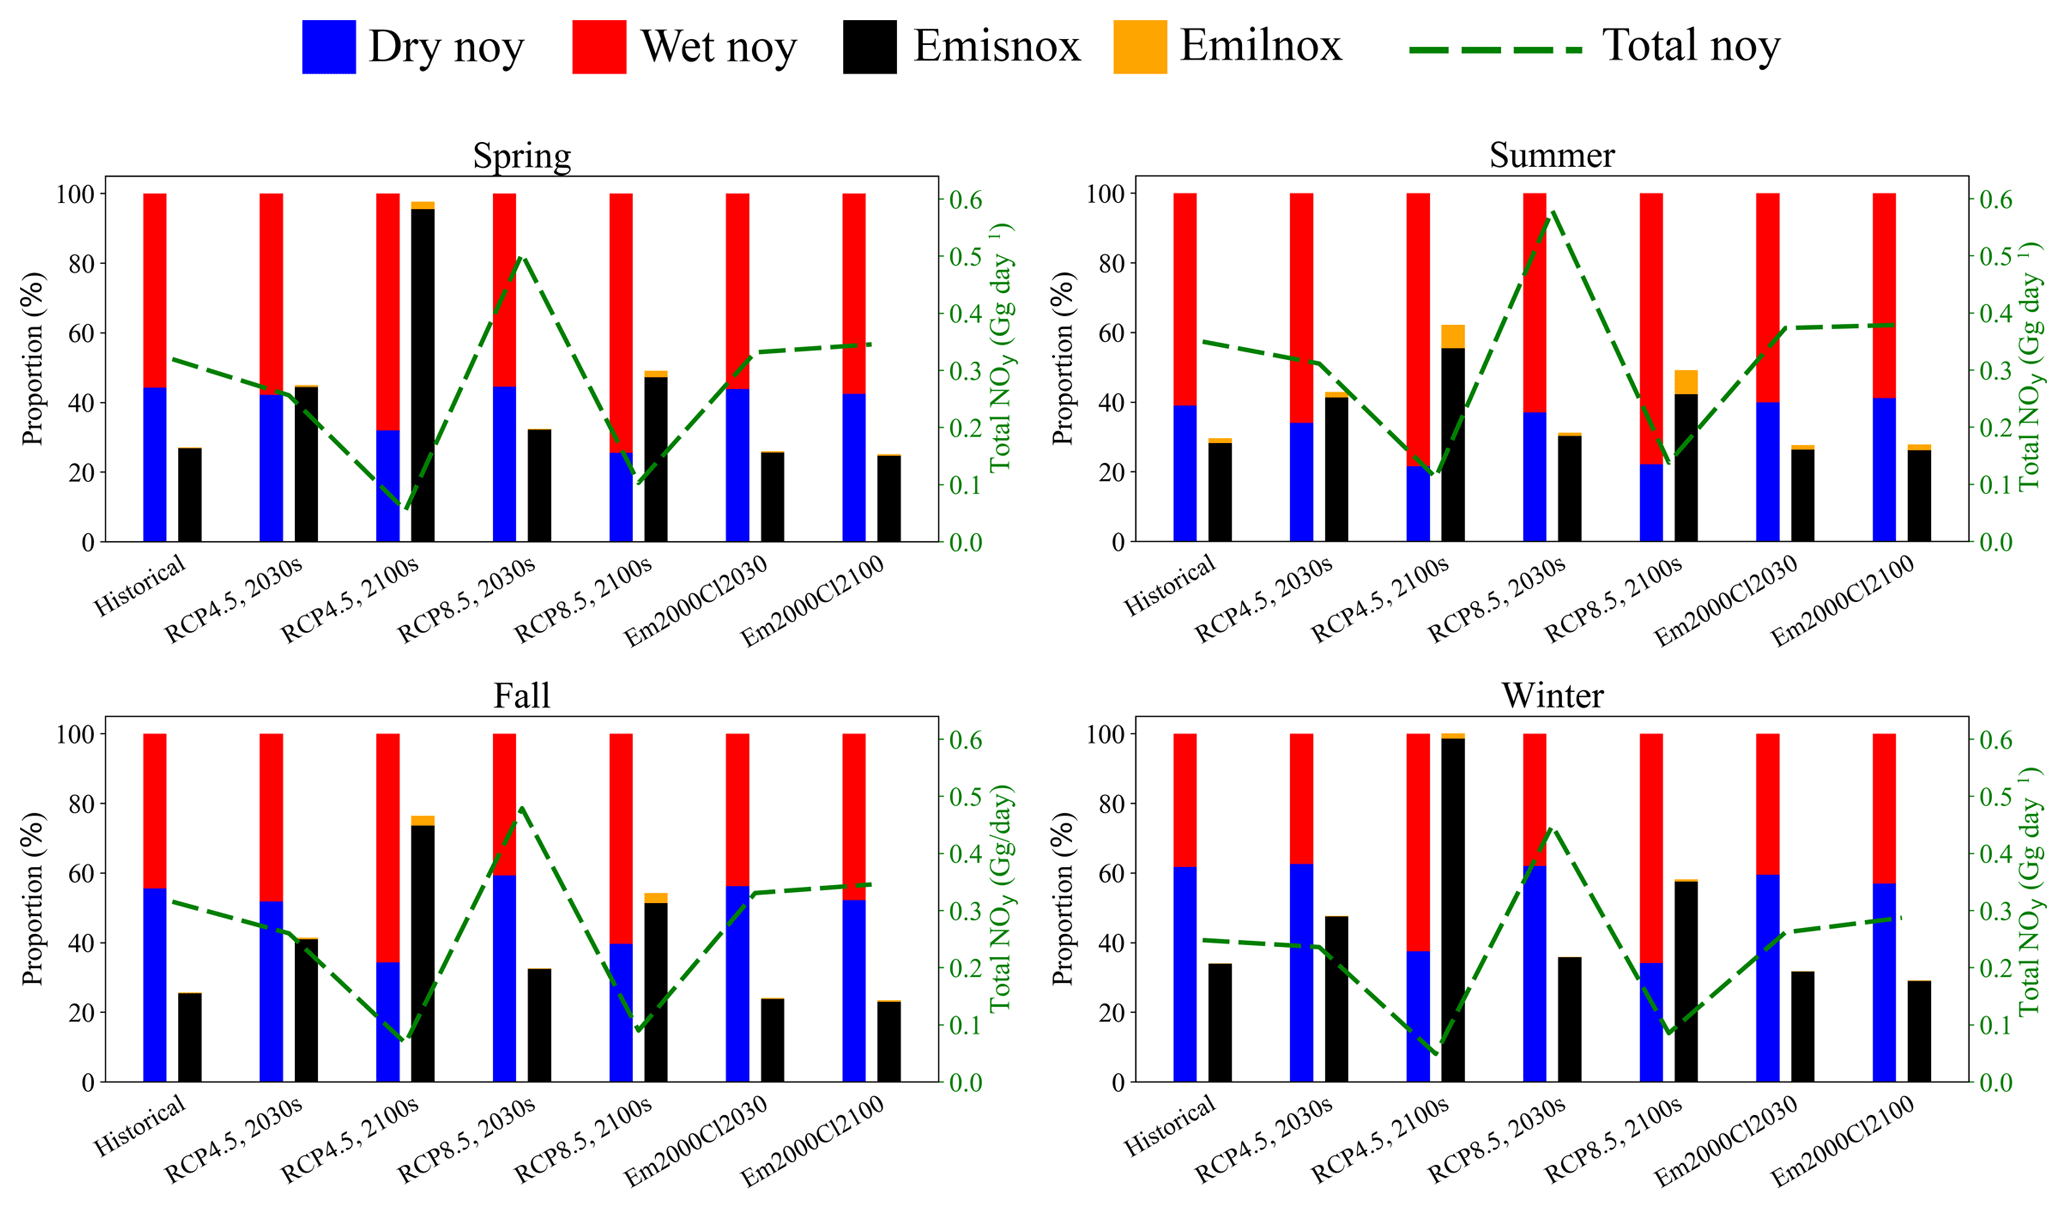
Figure 7Stacked bars of the seasonal ratio of NOy deposition from wet (wetnoy) and dry (drynoy) deposition and NOx emissions from shipping (emisnox) and lightning (emilnox) to the total (wet + dry) NOy deposition in the historical and RCP scenarios over the Yellow Sea. Two color bars are shown for each period with the left one representing dry NOy (blue) and wet NOy (red) deposition and the right one representing emisnox (black) and emilnox (orange). A green dashed line representing total NOy deposition is added to each panel with the y axis on the right.
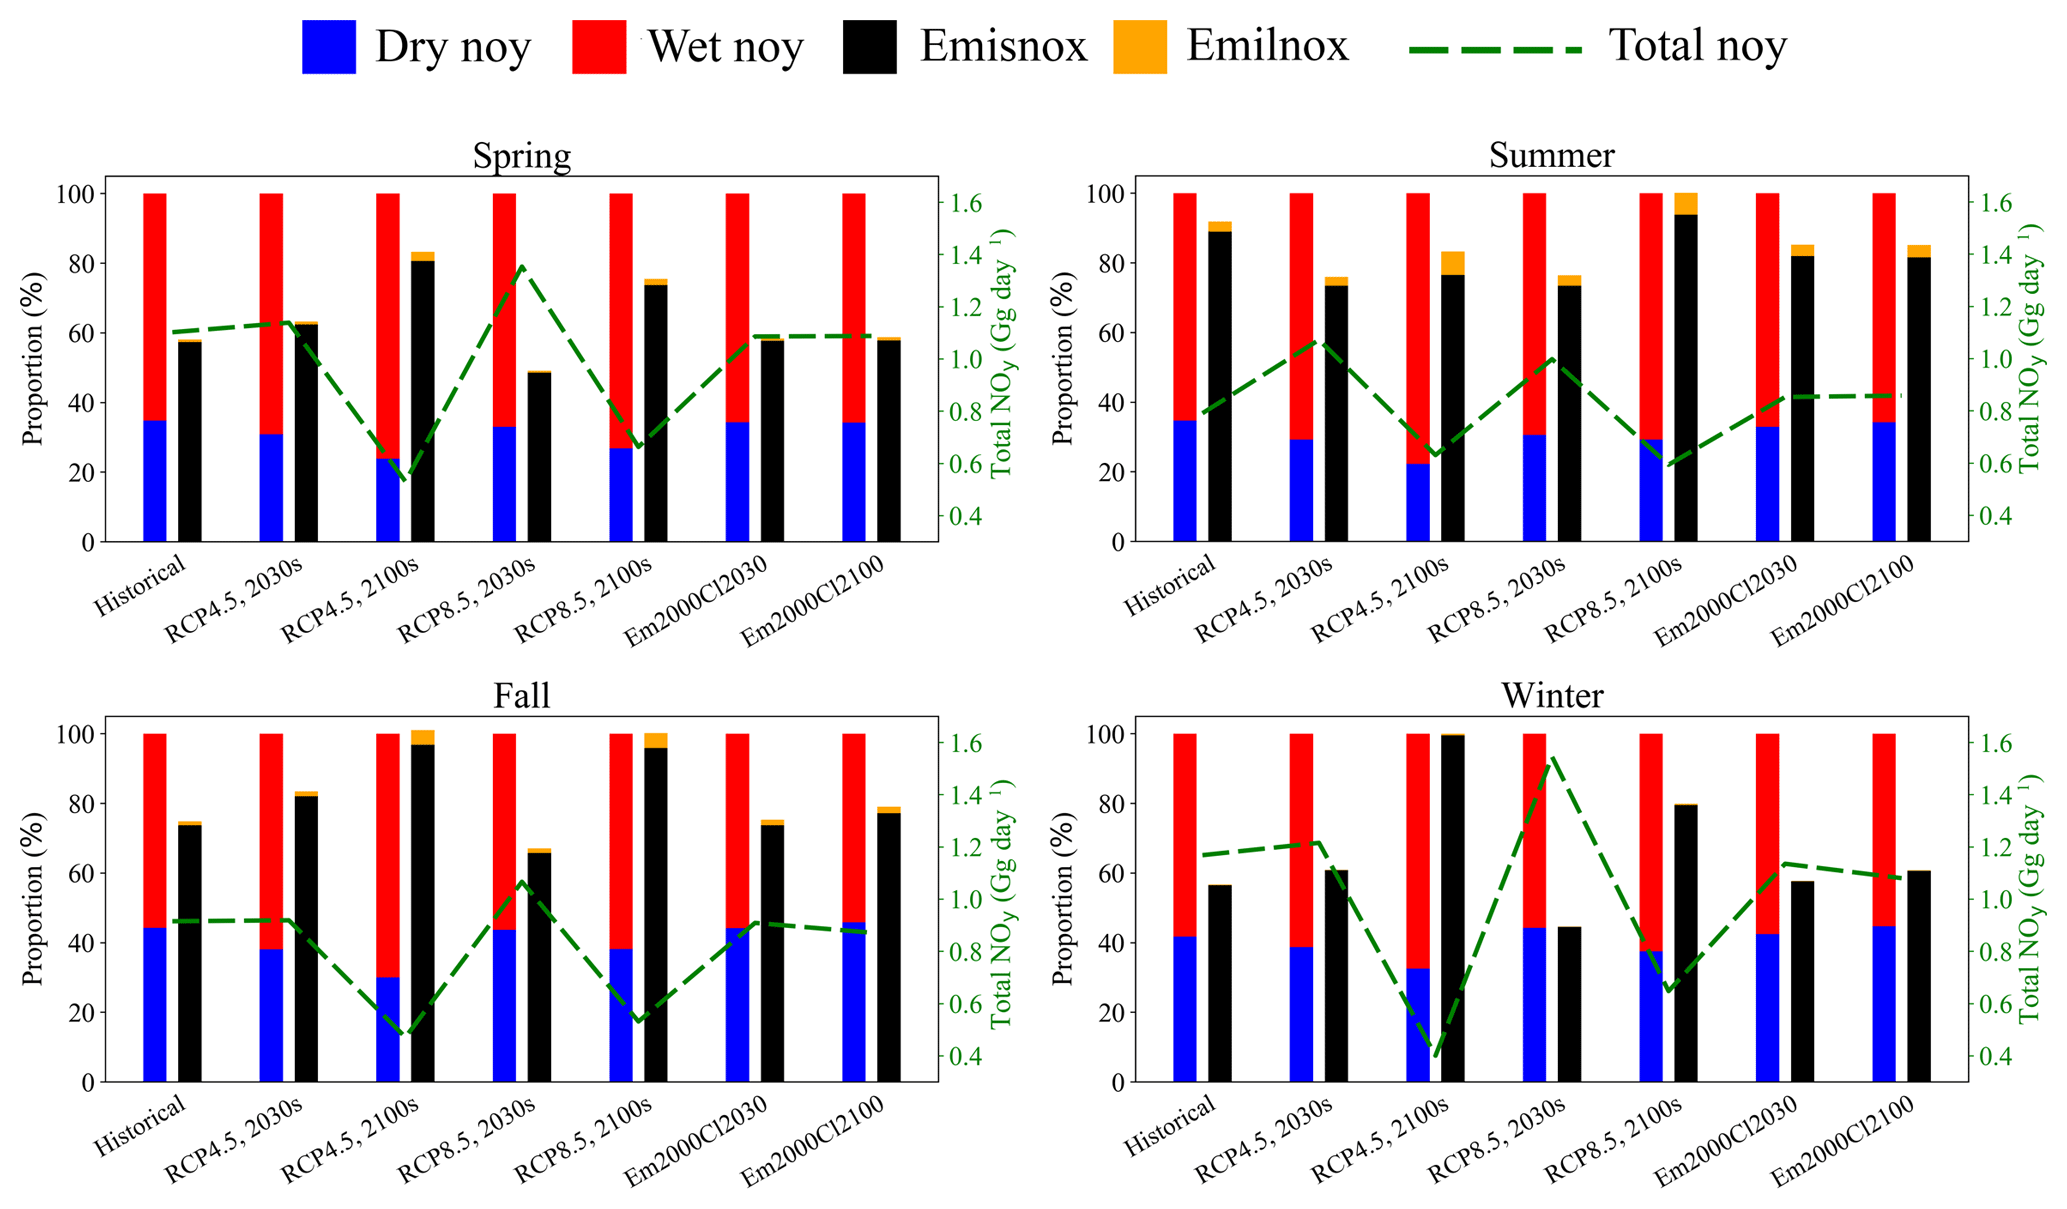

Figure 9Panel (a) shows spatial distribution of marine primary production resulting from NOy deposition over East Asia in historical periods. Areas over land are blank because the Redfield ratio is only applied to the ocean areas. The spatial distributions in (b)–(g) refer to the percentage change of total NOy deposition for all RCP scenarios and other scenarios used in this study. Values in the ocean areas can be seen as changes of PP from NOy based on the definition of the Redfield ratio. In (b)–(g) all distributions are the percentage change compared to the historical period and only values with agreement are shown. Values with statistical significance (α=0.05) are marked with a black dot.
Generally, the Chinese coastal seas have rich nutrients and high total PP (Gong et al., 2000; Son et al., 2005). Thus, these areas seldom lack nutrients but sometimes eutrophication is an environmental issue. For instance, a massive Ulva prolifera bloom occurred in June 2008 in the Yellow Sea and the harmful algal bloom garnered a lot of attention. Hu et al. (2010) found that algal blooms occur in each summer of 2000–2009 in the Yellow Sea and East China Sea. Atmospheric deposition is an important source of nutrients for the marine ecosystem, and it can facilitate PP in the ocean surface and contribute to the development of harmful algal blooms (Paerl, 1997; Paerl et al., 2002).
Several previous studies have investigated PP over the BYE areas and estimated the historical annual PP to be 97, 236 and 145 g C m−2 yr−1, respectively, for the Bohai Sea, Yellow Sea and East China Sea (Guan et al., 2005; Gong et al., 2003). In this study, based on the assumption that all NOy deposited into the surface ocean can be absorbed by phytoplankton, we estimate the model-averaged PP from NOy deposition in the historical period over the BYE areas according to the Redfield ratio (Tett et al., 1985). The Redfield ratio refers to the ratios of carbon, nitrogen and phosphorus in phytoplankton listed in Eq. (3). Equation (4) is used to calculate PP generated from NOy deposition, for which PPnoy represents the PP from NOy deposition and NOy represents total NOy (wet + dry) deposition.
Results show that PP from historical NOy deposition is 5, 5.4 and 4.4 g C m−2 yr−1 over the Bohai Sea, Yellow Sea and East China Sea, accounting for 5 %, 2 % and 3 % of PP in those three seas, respectively. These values are consistent, albeit slightly smaller due to the consideration of oxidized nitrogen in our study, with previous studies. For instance, Qi et al. (2013) indicated a contribution of 0.3 %–6.7 % to PP from total dissolved nitrogen deposition over the Yellow Sea from July 2005 to March 2006, and Zhang et al. (2010) found that total inorganic nitrogen deposition accounted for 1.1 %–3.9 % of PP over the East China Sea in 2004.
Recently, several studies have evaluated the change of global PP under future climate change (Steinacher et al., 2010; Koga et al., 2011; Laufkötter et al., 2015; Cabré et al., 2015). For instance, based on multi-model ensembles, Cabré et al. (2015) found a general global decrease (up to 30 %) in total PP projected under RCP8.5 by the end of this century. We calculate the seasonal PP from NOy using ACCMIP, with results shown in Fig. 9. It should be noted that Fig. 9b refers to the percentage changes of total NOy deposition. According to the Redfield ratio, PP from NOy is proportional to total NOy deposition, yielding the same percentage change between PP and NOy. Therefore, the values in the ocean (Fig. 9) also represent the changes of PP resulting from NOy deposition. Note that PP in Fig. 9a is the equivalent PP converted from NOy deposited into the ocean through nutrient uptake by phytoplankton. Due to low sea surface temperature in winter, the conversion can hardly happen and the nutrients may remain until spring (Reay et al., 1999). Therefore, actual PP from NOy may shift from winter to spring instead. Moreover, as the Redfield ratio is used to estimate PP from NOy under all scenarios, potential influence of changes in other nutrients (e.g., carbon and phosphorus) under RCP scenarios and experimental scenarios is not considered. Under RCP scenarios, consistent with the change patterns of total NOy deposition (not shown), PP from NOy decreases significantly over the BYE areas in the 2100s, by 60 %–68 % and 34 %–63 % in the four seasons over the Yellow Sea and East China Sea, respectively, under RCP8.5 (Fig. 9c, e). However, in the 2030s, PP from NOy shows an increase over the BYE areas under RCP8.5 (e.g., 32 %–53 % in the Yellow Sea and 19 %–34 % in East China Sea; Fig. 9d), with a smaller increase or decrease under RCP4.5 (Fig. 9b). The large increase in NOy in the near future suggests the increased risk of algal blooms if emissions continue to increase, and the reduction in NOy in 2100 indicates the importance of emission reduction in the long term. Without emission reduction, PP from NOy is projected to increase in 2100s during summer (Fig. 9g) over the East China Sea, consistent with the wet deposition pattern change depicted in Fig. 6, indicating that climate change increases eutrophication through enhancement of precipitation that increases wet deposition over this region. Hence our results illustrate the importance of reducing emissions and PP in the BYE areas in the future.
Atmospheric NOy deposition over East Asia is analyzed to delineate the influence of climate and emission changes based on the ACCMIP multi-model ensemble. Under both RCP4.5 and RCP8.5 scenarios with the combined effect of climate and emission changes, both dry and wet NOy deposition shows significant decreases in the 2100s, primarily as a result of a large reduction in anthropogenic emissions. In the 2030s, both the dry and wet NOy deposition increases significantly, particularly under RCP8.5, mainly because of enhanced emissions. The individual effect of climate change and emissions on the dry and wet NOy deposition is also identified, showing a relatively minor impact of climate change on dry NOy deposition. In terms of wet deposition, the spatial patterns are in general consistent with those in the changes of precipitation, particularly at the end of this century. Take the East China Sea as an example, wet NOy deposition increases significantly in summer (18 %) and decreases significantly in winter (−13 %). While climate change alone generally increases wet deposition, reduction of emissions has a dominant influence of reducing wet deposition over east China.
Over the Chinese coastal seas such as the Yellow Sea and East China Sea, with decreasing transport of NOx from mainland China due to emission reduction, shipping and lightning emissions from the ocean become the major source of NOy deposition, with a mean seasonal increase of 24 %–48 % and 3 %–37 % for the Yellow Sea and East China Sea, respectively. Therefore, reducing shipping emissions in the Chinese coastal areas is a key factor to reduce nitrogen deposition in the future.
In the 2030s, PP from NOy shows increases over the BYE areas under RCP8.5, suggesting the increased risk of algal blooms if emissions from ships continue to increase in the near future (Liu et al., 2016). With climate change only, PP from NOy is projected to increase in 2100 during summer over the East China Sea, indicating a supportive role of climate change on eutrophication, and hence the importance of emission controls.
Although the ACCMIP multi-model ensemble has provided valuable information for projecting future changes in NOy deposition, the models used in ACCMIP have relatively coarse spatial resolution for resolving the complex meteorological and chemical processes. Dynamical downscaling may be applied in the future to further investigate the impact of climate and emission on nitrogen deposition over East Asia and the detailed processes involved. For analysis of marine PP, we used a very simple approach that ignores biogeochemical processes in the ocean. An ocean biogeochemistry model will be useful to further quantify the effect of climate and emissions on PP.
The ACCMIP data used in this study are available at the British Centre for Environmental Data Analysis (http://badc.nerc.ac.uk/browse/badc/accmip; last access: 20 January 2019, Shindell et al., 2011).
The supplement related to this article is available online at: https://doi.org/10.5194/acp-19-887-2019-supplement.
YG came up with the original idea of investigating the impact of climate and emission on atmospheric deposition. YG and KL designed the analysis method. JZ conducted all the analyses. LRL, HL, JF, XY and HG helped in the discussion of the results. JFL helped in the interpretation and understanding of ACCMIP data. TN helped in the interpretation of the MIROC-CHEM model. All the authors contributed to the writing of the paper.
The authors declare that they have no conflict of interest.
This research was supported by grants from the National Key
Project of MOST (2017YFC1404101), Shandong Provincial Natural Science
Foundation, China (ZR2017MD026), and National Natural Science Foundation of
China (41705124, 41822505 and 91544110). PNNL is operated for DOE by the Battelle
Memorial Institute under contract DE-AC05-76RL01830.
Edited by: Alex B. Guenther
Reviewed by: three
anonymous referees
Adler, R. F., Sapiano, M. R. P., Huffman, G. J., Wang, J. J., Gu, G., Bolvin, D., Long, C., Schneider, U., Becker, A., and Nelkin, E.: The Global Precipitation Climatology Project (GPCP) Monthly Analysis (New Version 2.3) and a Review of 2017 Global Precipitation, Atmosphere, 9, 138, https://doi.org/10.3390/atmos9040138, 2018.
Allen, R. J., Landuyt, W., and Rumbold, S. T.: An increase in aerosol burden and radiative effects in a warmer world, Nat. Clim. Change, 6, 269–274, 2015.
Baker, A. R., Kanakidou, M., Altieri, K. E., Daskalakis, N., Okin, G. S., Myriokefalitakis, S., Dentener, F., Uematsu, M., Sarin, M. M., Duce, R. A., Galloway, J. N., Keene, W. C., Singh, A., Zamora, L., Lamarque, J.-F., Hsu, S.-C., Rohekar, S. S., and Prospero, J. M.: Observation- and model-based estimates of particulate dry nitrogen deposition to the oceans, Atmos. Chem. Phys., 17, 8189–8210, https://doi.org/10.5194/acp-17-8189-2017, 2017.
Butchart, S. H. M., Walpole, M., Collen, B., Strien, A. v., Scharlemann, J. P. W., Almond, R. E. A., Baillie, J. E. M., Bomhard, B., Brown, C., and Bruno, J.: Global biodiversity: indicators of recent declines, Science, 328, 1164–1168, 2010.
Cabré, A., Marinov, I., and Leung, S.: Consistent global responses of marine ecosystems to future climate change across the IPCC AR5 earth system models, Clim. Dynam., 45, 1–28, 2015.
Chong-Hai, X. and Ying, X.: The Projection of Temperature and Precipitation over China under RCP Scenarios using a CMIP5 Multi-Model Ensemble, Atmos. Ocean. Sci. Lib., 5, 527–533, 2012.
Cong, Z. Y., Kang, S. C., Zhang, Y. L., and Li, X. D.: Atmospheric wet deposition of trace elements to central Tibetan Plateau, Appl. Geochem., 25, 1415–1421, https://doi.org/10.1016/j.apgeochem.2010.06.011, 2010.
Connan, O., Maro, D., Hebert, D., Roupsard, P., Goujon, R., Letellier, B., and Le Cavelier, S.: Wet and dry deposition of particles associated metals (Cd, Pb, Zn, Ni, Hg) in a rural wetland site, Marais Vernier, France, Atmos. Environ., 67, 394–403, https://doi.org/10.1016/j.atmosenv.2012.11.029, 2013.
Dalsøren, S. B., Eide, M. S., Endresen, Ø., Mjelde, A., Gravir, G., and Isaksen, I. S. A.: Update on emissions and environmental impacts from the international fleet of ships: the contribution from major ship types and ports, Atmos. Chem. Phys., 9, 2171–2194, https://doi.org/10.5194/acp-9-2171-2009, 2009.
Ding, Y.: Monsoons over china, Springer Science & Business Media, 1993.
Doney, S. C., Mahowald, N., Lima, I., Feely, R. A., Mackenzie, F. T., Lamarque, J.-F., and Rasch, P. J.: Impact of anthropogenic atmospheric nitrogen and sulfur deposition on ocean acidification and the inorganic carbon system, P. Natl. Acad. Sci. USA, 104, 14580–14585, 2007.
Duce, R. A., LaRoche, J., Altieri, K., Arrigo, K. R., Baker, A. R., Capone, D. G., Cornell, S., Dentener, F., Galloway, J., Ganeshram, R. S., Geider, R. J., Jickells, T., Kuypers, M. M., Langlois, R., Liss, P. S., Liu, S. M., Middelburg, J. J., Moore, C. M., Nickovic, S., Oschlies, A., Pedersen, T., Prospero, J., Schlitzer, R., Seitzinger, S., Sorensen, L. L., Uematsu, M., Ulloa, O., Voss, M., Ward, B., and Zamora, L.: Impacts of Atmospheric Anthropogenic Nitrogen on the Open Ocean, Science, 320, 893–897, https://doi.org/10.1126/science.1150369, 2008.
Ellis, R. A., Jacob, D. J., Sulprizio, M. P., Zhang, L., Holmes, C. D., Schichtel, B. A., Blett, T., Porter, E., Pardo, L. H., and Lynch, J. A.: Present and future nitrogen deposition to national parks in the United States: critical load exceedances, Atmos. Chem. Phys., 13, 9083–9095, https://doi.org/10.5194/acp-13-9083-2013, 2013.
Erisman, J. W. and Draaijers, G.: Deposition to forests in Europe: most important factors influencing dry deposition and models used for generalisation, Environ. Pollut., 124, 379–388, 2003.
Eyring, V., Isaksen, I. S., Berntsen, T., Collins, W. J., Corbett, J. J., Endresen, O., Grainger, R. G., Moldanova, J., Schlager, H., and Stevenson, D. S.: Transport impacts on atmosphere and climate: Shipping, Atmos. Environ., 44, 4735–4771, 2010.
Fan, Q., Zhang, Y., Ma, W., Ma, H., Feng, J., Yu, Q., Yang, X., Ng, S. K., Fu, Q., and Chen, L.: Spatial and seasonal dynamics of ship emissions over the Yangtze River Delta and East China Sea and their potential environmental influence, Environ. Sci. Technol., 50, 1322–1329, 2016.
Galloway, J. N., Townsend, A. R., Erisman, J. W., Bekunda, M., Cai, Z. C., Freney, J. R., Martinelli, L. A., Seitzinger, S. P., and Sutton, M. A.: Transformation of the nitrogen cycle: Recent trends, questions, and potential solutions, Science, 320, 889–892, https://doi.org/10.1126/science.1136674, 2008.
Gao, Y., Leung, L. R., Lu, J., Liu, Y., Huang, M., and Qian, Y.: Robust spring drying in the southwestern U.S. and seasonal migration of wet/dry patterns in a warmer climate, Geophys. Res. Lett., 41, 1745–1751, https://doi.org/10.1002/2014GL059562, 2014.
Gao, Y., Leung, L. R., Lu, J., and Masato, G.: Persistent cold air outbreaks over North America in a warming climate, Environ. Res. Lett., 10, 044001, https://doi.org/10.1088/1748-9326/10/4/044001, 2015.
Gao, Y., Lu, J., and Leung, L. R.: Uncertainties in Projecting Future Changes in Atmospheric Rivers and Their Impacts on Heavy Precipitation over Europe, J. Climate, 29, 6711–6726, https://doi.org/10.1175/JCLI-D-16-0088.1, 2016.
Gong, G. C., Shiah, F. K., Liu, K. K., Wen, Y. H., and Liang, M. H.: Spatial and temporal variation of chlorophyll a , primary productivity and chemical hydrography in the southern East China Sea, Cont. Shelf. Res., 20, 411–436, 2000.
Gong, G. C., Wen, Y. H., Wang, B. W., and Liu, G. J.: Seasonal variation of chlorophyll a concentration, primary production and environmental conditions in the subtropical East China Sea, Deep-Sea Res. Pt. II, 50, 1219–1236, 2003.
Guan, W. J., Xian-Qiang, H. E., Pan, D. L., and Fang, G.: Estimation of ocean primary production by remote sensing in Bohai Sea, Yellow Sea and East China Sea, J. Fish. China, 29, 367–372, 2005.
Hu, C., Li, D., Chen, C., Ge, J., Muller-Karger, F. E., Liu, J., Yu, F., and He, M. X.: On the recurrent Ulva prolifera blooms in the Yellow Sea and East China Sea, J. Geophys. Res-Oceans, 115, C05017, https://doi.org/10.1029/2009JC005561, 2010.
Kim, G., Scudlark, J. R., and Church, T. M.: Atmospheric wet deposition of trace elements to Chesapeake and Delaware Bays, Atmos. Environ., 34, 3437–3444, https://doi.org/10.1016/S1352-2310(99)00371-4, 2000.
Kim, J. E., Han, Y. J., Kim, P. R., and Holsen, T. M.: Factors influencing atmospheric wet deposition of trace elements in rural Korea, Atmos. Res., 116, 185–194, https://doi.org/10.1016/j.atmosres.2012.04.013, 2012.
Koga, N., Smith, P., Yeluripati, J. B., Shirato, Y., Kimura, S. D., and Nemoto, M.: Estimating net primary production and annual plant carbon inputs, and modelling future changes in soil carbon stocks in arable farmlands of northern Japan, Agr. Ecosys. Environ., 144, 51–60, 2011.
Kryza, M., Werner, M., Dore, A. J., Błaś, M., and Sobik, M.: The role of annual circulation and precipitation on national scale deposition of atmospheric sulphur and nitrogen compounds, J. Environ. Manage., 109, 70–79, 2012.
Lamarque, J. F., Kiehl, J. T., Brasseur, G. P., Butler, T., Cameron-Smith, P., Collins, W. D., Collins, W. J., Granier, C., Hauglustaine, D., Hess, P. G., Holland, E. A., Horowitz, L., Lawrence, M. G., McKenna, D., Merilees, P., Prather, M. J., Rasch, P. J., Rotman, D., Shindell, D., and Thornton, P.: Assessing future nitrogen deposition and carbon cycle feedback using a multimodel approach: Analysis of nitrogen deposition, J. Geophys. Res-Atmos., 110, D19303, https://doi.org/10.1029/2005JD005825, 2005.
Lamarque, J.-F., Dentener, F., McConnell, J., Ro, C.-U., Shaw, M., Vet, R., Bergmann, D., Cameron-Smith, P., Dalsoren, S., Doherty, R., Faluvegi, G., Ghan, S. J., Josse, B., Lee, Y. H., MacKenzie, I. A., Plummer, D., Shindell, D. T., Skeie, R. B., Stevenson, D. S., Strode, S., Zeng, G., Curran, M., Dahl-Jensen, D., Das, S., Fritzsche, D., and Nolan, M.: Multi-model mean nitrogen and sulfur deposition from the Atmospheric Chemistry and Climate Model Intercomparison Project (ACCMIP): evaluation of historical and projected future changes, Atmos. Chem. Phys., 13, 7997–8018, https://doi.org/10.5194/acp-13-7997-2013, 2013a.
Lamarque, J.-F., Shindell, D. T., Josse, B., Young, P. J., Cionni, I., Eyring, V., Bergmann, D., Cameron-Smith, P., Collins, W. J., Doherty, R., Dalsoren, S., Faluvegi, G., Folberth, G., Ghan, S. J., Horowitz, L. W., Lee, Y. H., MacKenzie, I. A., Nagashima, T., Naik, V., Plummer, D., Righi, M., Rumbold, S. T., Schulz, M., Skeie, R. B., Stevenson, D. S., Strode, S., Sudo, K., Szopa, S., Voulgarakis, A., and Zeng, G.: The Atmospheric Chemistry and Climate Model Intercomparison Project (ACCMIP): overview and description of models, simulations and climate diagnostics, Geosci. Model Dev., 6, 179–206, https://doi.org/10.5194/gmd-6-179-2013, 2013b.
Lauer, A., Eyring, V., Hendricks, J., Jöckel, P., and Lohmann, U.: Global model simulations of the impact of ocean-going ships on aerosols, clouds, and the radiation budget, Atmos. Chem. Phys., 7, 5061–5079, https://doi.org/10.5194/acp-7-5061-2007, 2007.
Laufkötter, C., Vogt, M., Gruber, N., Aita-Noguchi, M., Aumont, O., Bopp, L., Buitenhuis, E., Doney, S. C., Dunne, J., Hashioka, T., Hauck, J., Hirata, T., John, J., Le Quéré, C., Lima, I. D., Nakano, H., Seferian, R., Totterdell, I., Vichi, M., and Völker, C.: Drivers and uncertainties of future global marine primary production in marine ecosystem models, Biogeosciences, 12, 6955–6984, https://doi.org/10.5194/bg-12-6955-2015, 2015.
Liu, H., Fu, M., Jin, X., Shang, Y., Shindell, D., Faluvegi, G., Shindell, C., and He, K.: Health and climate impacts of ocean-going vessels in East Asia, Nat. Clim. Change, 6, 1037–1041, 2016.
Liu, L., Zhang, X., Xu, W., Liu, X., Lu, X., Chen, D., Zhang, X., Wang, S., and Zhang, W.: Estimation of monthly bulk nitrate deposition in China based on satellite NO2 measurement by the Ozone Monitoring Instrument, Remote Sens. Environ., 199, 93–106, 2017.
Liu, X., Zhang, Y., Han, W., Tang, A., Shen, J., Cui, Z., Vitousek, P., Erisman, J. W., Goulding, K., and Christie, P.: Enhanced nitrogen deposition over China, Nature, 494, 459–462, 2013.
Luo, X. S., Tang, A. H., Shi, K., Wu, L. H., Li, W. Q., Shi, W. Q., Shi, X. K., Erisman, J. W., Zhang, F. S., and Liu, X. J.: Chinese coastal seas are facing heavy atmospheric nitrogen deposition, Environ. Res. Lett., 9, 095007, https://doi.org/10.1088/1748-9326/9/9/095007, 2014.
Montoya-Mayor, R., Fernandez-Espinosa, A. J., Seijo-Delgado, I., and Ternero-Rodriguez, M.: Determination of soluble ultra-trace metals and metalloids in rainwater and atmospheric deposition fluxes: A 2-year survey and assessment, Chemosphere, 92, 882–891, https://doi.org/10.1016/j.chemosphere.2013.02.044, 2013.
Paerl, H. W.: Coastal eutrophication and harmful algal blooms: Importance of atmospheric deposition and groundwater as “new” nitrogen and other nutrient sources, Limnol. Oceanogr., 42, 1154–1165, 1997.
Paerl, H. W., Dennis, R. L., and Whitall, D. R.: Atmospheric deposition of nitrogen: Implications for nutrient over-enrichment of coastal waters, Estuaries, 25, 677–693, 2002.
Price, C., Penner, J., and Prather, M.: NOx from lightning 1. Global distribution based on lightning physics, J. Geophys. Res.-Atmos., 102, 5929–5941, 1997.
Qi, J. H., Shi, J. H., Gao, H. W., and Sun, Z.: Atmospheric dry and wet deposition of nitrogen species and its implication for primary productivity in coastal region of the Yellow Sea, China, Atmos. Environ., 81, 600–608, 2013.
Reay, D. S., Nedwell, D. B., Priddle, J., and Ellis-Evans, J. C.: Temperature dependence of inorganic nitrogen uptake: reduced affinity for nitrate at suboptimal temperatures in both algae and bacteria, Appl. Environ. Microb., 65, 2577–2584, 1999.
Reichler, T. and Kim, J.: How well do coupled models simulate today's climate?, B. Am. Meteorol. Soc., 89, 303–311, https://doi.org/10.1175/Bams-89-3-303, 2008.
Shindell, D., Zeng, G., Lamarque, J. F., Szopa, S., Nagashima, T., Naik, V., Eyring, V., and Collins, W.: ACCMIP data, Atmospheric Chemistry and Climate Model Intercomparison Project (ACCMIP), available at: http://badc.nerc.ac.uk/browse/badc/accmip (last access: 20 January 2019), 2011.
Shindell, D. T., Lamarque, J.-F., Schulz, M., Flanner, M., Jiao, C., Chin, M., Young, P. J., Lee, Y. H., Rotstayn, L., Mahowald, N., Milly, G., Faluvegi, G., Balkanski, Y., Collins, W. J., Conley, A. J., Dalsoren, S., Easter, R., Ghan, S., Horowitz, L., Liu, X., Myhre, G., Nagashima, T., Naik, V., Rumbold, S. T., Skeie, R., Sudo, K., Szopa, S., Takemura, T., Voulgarakis, A., Yoon, J.-H., and Lo, F.: Radiative forcing in the ACCMIP historical and future climate simulations, Atmos. Chem. Phys., 13, 2939–2974, https://doi.org/10.5194/acp-13-2939-2013, 2013.
Son, S., Campbell, J., Dowell, M., Yoo, S., and Noh, J.: Primary production in the Yellow Sea determined by ocean color remote sensing, Mar. Ecol-Prog. Ser., 303, 91–103, 2005.
Steinacher, M., Joos, F., Frölicher, T. L., Bopp, L., Cadule, P., Cocco, V., Doney, S. C., Gehlen, M., Lindsay, K., Moore, J. K., Schneider, B., and Segschneider, J.: Projected 21st century decrease in marine productivity: a multi-model analysis, Biogeosciences, 7, 979–1005, https://doi.org/10.5194/bg-7-979-2010, 2010.
Steinfeld, J.: Atmospheric Chemistry and Physics: From Air Pollution to Climate Change, Environ. Sci. Policy Sustainable Dev., 40, 26–26, 1998.
Stevens, C. J., Lind, E. M., Hautier, Y., Harpole, W. S., Borer, E. T., Hobbie, S., Seabloom, E. W., Ladwig, L., Bakker, J. D., Chu, C. J., Collins, S., Davies, K. F., Firn, J., Hillebrand, H., La Pierre, K. J., MacDougall, A., Melbourne, B., McCulley, R. L., Morgan, J., Orrock, J. L., Prober, S. M., Risch, A. C., Schuetz, M., and Wragg, P. D.: Anthropogenic nitrogen deposition predicts local grassland primary production worldwide, Ecology, 96, 1459–1465, 2015.
Tett, P., Droop, M. R., and Heaney, S. I.: The Redfield Ratio and Phytoplankton Growth Rate, J. Mar. Biol. Assoc. UK, 65, 487–504, 1985.
Theodosi, C., Markaki, Z., Tselepides, A., and Mihalopoulos, N.: The significance of atmospheric inputs of soluble and particulate major and trace metals to the eastern Mediterranean seawater, Mar. Chem., 120, 154–163, https://doi.org/10.1016/j.marchem.2010.02.003, 2010.
Van Vuuren, D. P., Edmonds, J., Kainuma, M., Riahi, K., Thomson, A., Hibbard, K., Hurtt, G. C., Kram, T., Krey, V., and Lamarque, J.-F.: The representative concentration pathways: an overview, Clim. Change, 109, 5–31, https://doi.org/10.1007/s10584-011-0148-z, 2011.
Vuai, S. A. H. and Tokuyama, A.: Trend of trace metals in precipitation around Okinawa Island, Japan, Atmos. Res., 99, 80–84, https://doi.org/10.1016/j.atmosres.2010.09.010, 2011.
Wałaszek, K., Kryza, M., and Dore, A. J.: The impact of precipitation on wet deposition of sulphur and nitrogen compounds, Ecol. Chem. Eng. S., 20, 733–745, https://doi.org/10.2478/eces-2013-0051, 2013.
Wang, L. and Chen, W.: A CMIP5 multimodel projection of future temperature, precipitation, and climatological drought in China, Int. J. Climatol., 34, 2059–2078, 2014.
Wang, Y., Zhang, Q. Q., He, K., Zhang, Q., and Chai, L.: Sulfate-nitrate-ammonium aerosols over China: response to 2000–2015 emission changes of sulfur dioxide, nitrogen oxides, and ammonia, Atmos. Chem. Phys., 13, 2635–2652, https://doi.org/10.5194/acp-13-2635-2013, 2013.
Xu, W., Liu, L., Cheng, M., Zhao, Y., Zhang, L., Pan, Y., Zhang, X., Gu, B., Li, Y., Zhang, X., Shen, J., Lu, L., Luo, X., Zhao, Y., Feng, Z., Collett Jr., J. L., Zhang, F., and Liu, X.: Spatial-temporal patterns of inorganic nitrogen air concentrations and deposition in eastern China, Atmos. Chem. Phys., 18, 10931–10954, https://doi.org/10.5194/acp-18-10931-2018, 2018.
Zhang, X. Y., Lu, X. H., Liu, L., Chen, D. M., Zhang, X. M., Liu, X. J., and Zhang, Y.: Dry deposition of NO2 over China inferred from OMI columnar NO2 and atmospheric chemistry transport model, Atmos. Environ., 169, 238–249, 2017.
Zhang, Y., Yu, Q., Ma, W., and Chen, L.: Atmospheric deposition of inorganic nitrogen to the eastern China seas and its implications to marine biogeochemistry, J. Geophys. Res-Atmos., 115, D00K10, https://doi.org/10.1029/2009JD012814, 2010.
- Abstract
- Introduction
- Model description
- Evaluation of the ACCMIP results
- Future changes of NOy deposition in East Asia
- The impact of climate change or emissions on NOy deposition
- Marine primary production over the BYE areas and its future change
- Conclusions and discussions
- Data availability
- Author contributions
- Competing interests
- Acknowledgements
- References
- Supplement