the Creative Commons Attribution 4.0 License.
the Creative Commons Attribution 4.0 License.
 | 28 Jun 2019
Exploring 2016–2017 surface ozone pollution over China: source contributions and meteorological influences
Lin Zhang
Youfan Chen
Mi Zhou
Yiming Liu
Jintai Lin
Tzung-May Fu
Qiang Zhang
Severe surface ozone pollution over major Chinese cities has become an emerging air quality concern, raising a new challenge for emission control measures in China. In this study, we explore the source contributions to surface daily maximum 8 h average (MDA8) ozone over China in 2016 and 2017, the 2 years with the highest surface ozone averaged over Chinese cities in record. We estimate the contributions of anthropogenic, background, and individual natural sources to surface ozone over China using the GEOS-Chem chemical transport model at horizontal resolution with the most up-to-date Chinese anthropogenic emission inventory. Model results are evaluated with concurrent surface ozone measurements at 169 cities over China and show generally good agreement. We find that background ozone (defined as ozone that would be present in the absence of all Chinese anthropogenic emissions) accounts for 90 % (49.4 ppbv) of the national March–April mean surface MDA8 ozone over China and 80 % (44.5 ppbv) for May–August. It includes large contributions from natural sources (80 % in March–April and 72 % in May–August). Among them, biogenic volatile organic compound (BVOC) emissions enhance MDA8 ozone by more than 15 ppbv in eastern China during July–August, while lightning NOx emissions and ozone transport from the stratosphere both lead to ozone enhancements of over 20 ppbv in western China during March–April. Over major Chinese city clusters, domestic anthropogenic sources account for about 30 % of the May–August mean surface MDA8 ozone and reach 39–73 ppbv (38 %–69 %) for days with simulated MDA8 ozone > 100 ppbv in the North China Plain, Fenwei Plain, Yangtze River Delta, and Pearl River Delta city clusters. These high ozone episodes are usually associated with high temperatures, which induce large BVOC emissions and enhance ozone chemical production. Our results indicate that there would be no days with MDA8 ozone > 80 ppbv in these major Chinese cities in the absence of domestic anthropogenic emissions. We find that the 2017 ozone increases relative to 2016 are largely due to higher background ozone driven by hotter and drier weather conditions, while changes in domestic anthropogenic emissions alone would have led to ozone decreases in 2017. Meteorological conditions in 2017 favor natural source contributions (particularly soil NOx and BVOC ozone enhancements) and ozone chemical production, increase the thermal decomposition of peroxyacetyl nitrate (PAN), and further decrease ozone dry deposition velocity. More stringent emission control measures are thus required to offset the adverse effects of unfavorable meteorology, such as high temperature, on surface ozone air quality.
- Article
(16983 KB) -
Supplement
(3408 KB) - BibTeX
- EndNote


Ozone near the surface is a major air pollutant that harms human health and vegetation growth (Monks et al., 2015). China has become a global hot spot of urban ozone pollution (Wang et al., 2017; Lu et al., 2018a). The present-day (2013–2017) summertime fourth-highest daily maximum 8 h average (MDA8) ozone levels over eastern China are typically higher than 100 ppbv, inducing significantly larger human health and vegetation damage than those in other industrialized regions (i.e., Japan, Korea, Europe, and the United States) as estimated by different ozone exposure metrics (Fleming et al., 2018; Lu et al., 2018a). In particular, 2016 and 2017 witnessed the most severe surface ozone pollution in record over most Chinese cities. The summertime surface MDA8 ozone levels in 2016–2017 averaged over the major Chinese cities increased by about 20 % compared to 2013–2014 (Lu et al., 2018a), despite the fact that the Chinese Action Plan on Air Pollution Prevention and Control implemented in 2013 has significantly reduced anthropogenic emissions of nitrogen oxides () and alleviated winter haze pollution (Cheng et al., 2019; Zheng et al., 2018). Exploring source attributions to surface ozone in China is therefore critical to understanding the recent ozone increase and to reexamining the air pollution control strategy.
Surface ozone is mainly produced by the sunlight-driven photochemical oxidation of volatile organic compounds (VOCs) and carbon monoxide (CO) in the presence of NOx. These ozone precursors are emitted intensively in China from anthropogenic sources, including emissions from industry, plant powers, residential areas, and transportation (Li et al., 2017a; Zheng et al., 2018; Wang et al., 2019). Significant ozone production driven by intense anthropogenic emissions has been observed and modeled in many urban regions in China (Wang et al., 2006; Ran et al., 2009; Xue et al., 2014; Li et al., 2017b; Tan et al., 2018a). While anthropogenic contribution can be reduced by emission control measures, background ozone, defined as ozone concentration in the absence of domestic anthropogenic sources, presents a base below which ozone air quality cannot be improved by domestic emission controls. Background ozone includes ozone produced from natural emissions or originated from the stratosphere (together referred to as natural background ozone) and ozone produced from foreign anthropogenic emissions via long-range transport, as described in previous studies in the context of North American background ozone (McDonald-Buller et al., 2011; Zhang et al., 2011; Jaffe et al., 2018). Both natural emissions (e.g., from the biosphere or lightning) and transport processes are sensitive to meteorological conditions, such as temperature and wind, and can therefore significantly alter the spatiotemporal variability of ozone (Lin et al., 2008; Jacob and Winner, 2009; Fiore et al., 2012).
Source contributions are not observable and are therefore preferably quantified through modeling studies. Li et al. (2017a), using regional chemical models, estimated that anthropogenic emissions from industry, residential areas, and transportation together contributed up to 80 ppbv ozone (more than half of total ozone) during a severe ozone pollution episode over eastern China in May 2015. For the seasonal and nationwide average, however, background sources typically have a larger contribution. Wang et al. (2011) estimated that annual background sources contributed 89 % (44.1 ppbv) of mean surface ozone over China in 2006. Ni et al. (2018) also showed a large contribution from background sources to springtime surface ozone in 2008, with more than 40 ppbv over the North China Plain and 70 ppbv over western China. Long-range transport of ozone from Southeast Asia, Europe, and North America can enhance regional surface ozone by more than 2 ppbv in China (Ni et al., 2018). Several recent studies also examined the contribution from biogenic VOC emissions to regional surface ozone (Li et al., 2018a; Mo et al., 2018). No previous studies so far, however, provide a comprehensive view of anthropogenic vs. individual natural source contributions to present-day surface ozone levels in China. Their contributions to recent surface ozone increases over China remain unexplored.
In this study, we explore the sources contributing to surface ozone over China in 2016–2017 using the high-resolution (0.25∘ latitude × 0.3125∘ longitude) GEOS-Chem chemical transport model with the most up-to-date year-specific Chinese anthropogenic emission inventory to interpret nationwide hourly ozone observations over Chinese cities. We estimate ozone contributions from background, natural, and anthropogenic sources and further decompose the individual contributions from major natural sources. These include biogenic emissions, soil emissions, lightning emissions, biomass burning emissions, and stratospheric ozone transport. The source attributions and their interactions with meteorology are analyzed both seasonally from a nationwide perspective and at a daily scale in individual cities for high ozone episodes. We further compare model results for the 2 years (2016 vs. 2017) to investigate changes in source attributions contributing to recent ozone changes over China.
2.1 Surface ozone monitoring network
We obtain nationwide hourly ozone observations from the China National Environmental Monitoring Center (CNEMC) (http://www.cnemc.cn/en/, last access: 22 June 2019). The observational network became operational in 2013, and by 2017 it was monitoring six surface air pollutants (including ozone and particulate matter with an aerodynamic diameter less than or equal to 2.5 µm, PM2.5) in 454 cities (in total 1597 non-rural sites) in mainland China (Fig. 1). The datasets have been widely used to examine urban air quality issues over China in recent studies (Hu et al., 2017; Li et al., 2017b; Gao et al., 2018; Shen et al., 2019; Li et al., 2019). Quality controls to remove unreliable hourly observations are applied following our previous work (Lu et al., 2018a).
Table 1List of the 169 “key cities” for air pollution monitoring in China categorized by different regions. This city list was updated in July 2018 and can be accessed from http://www.mee.gov.cn/hjzl/dqhj/cskqzlzkyb/201809/P020180905326235405574.pdf (in Chinese). Locations of the cites are shown in Fig. 1. Abbreviations are NCP: North China Plain, YRD: Yangtze River Delta, FWP: Fenwei Plain, SCB: Sichuan Basin, CYR: central Yangtze River Plain, PRD: Pearl River Delta, NECH: northeastern China, WCH: western China, SCH: southern China. The number of cities for each region or province is shown in parentheses.


Figure 1Site locations (black dots) of the China National Environmental Monitoring Center (CNEMC) network. Also shown are the locations of 169 major cities grouped to 9 city clusters (Table 1): the North China Plain (NCP; red pluses) cluster, the Yangtze River Delta (YRD; blue pluses) cluster, the Fenwei Plain (FWP; blue crosses) cluster, the Sichuan Basin (SCB; red crosses) cluster, the central Yangtze River (CYR; purple crosses) cluster, the Pearl River Delta (PRD; purple pluses) cluster, the northeastern China (NECH; blue triangles) cluster, the western China (WCH; purple triangles) cluster, and southern China (SCH; black pluses). The provinces mentioned in the text are labeled in black, and the three cities analyzed in Figs. 7–9 are labeled in red. The underlying figure shows terrain elevation (m).
The Chinese Ministry of Environmental Protection (now the Chinese Ministry of Ecology and Environment) categorized a total of 74 major cities (provincial capital cities and major cities in the North China Plain (NCP), Yangtze River Delta (YRD), and Pearl River Delta (PRD); these are three well-developed city clusters in China with severe air pollution) as State I key cities for air pollution monitoring in 2013. The number of key cities for air pollution monitoring has expanded to 169 since July 2018 (CNEMC, 2018). The list not only includes more cities in the NCP (now 55 cities), YRD (41 cities), and PRD (9 cities), but also covers regions where air pollution is emerging. As shown in Table 1 and Fig. 1, they are the Fenwei Plain city cluster (FWP, 11 cities), Chengdu–Chongqing city cluster (or Sichuan Basin, SCB, 16 cities), central Yangtze River city cluster (CYR, 22 cities), and other provincial capital cities in northeastern China (NECH, 4 cities), western China (WCH, 7 cities), and southern China (SCH, 4 cities). We focus the analyses on these 169 cities grouped into 9 city clusters (Table 1) in this study. Each city contains several monitoring sites, and we average them hourly to represent air quality at the city level.
2.2 Model description
We use the GEOS-Chem chemical transport model (CTM) (v11-02rc; http://geos-chem.org, last access: 22 June 2019) to interpret surface ozone measurements in China. The model is driven by assimilated meteorological data obtained from the Goddard Earth Observing System (GEOS) of the NASA Global Modeling and Assimilation Office (GMAO). The GEOS-FP datasets are available at a native horizontal resolution of 0.25∘ latitude by 0.3125∘ longitude, a temporal resolution of 1 h for surface variables, and boundary layer height and 3 h for others. We use the nested-grid version of GEOS-Chem that has horizontal resolution over East Asia (70–140∘ E, 15–55∘ N) (Chen et al., 2009; Zhang et al., 2016; Shao et al., 2019), with boundary conditions archived from the global simulation at 2∘ latitude × 2.5∘ longitude resolution.
The model includes a detailed mechanism of tropospheric HOx–NOx–VOC–ozone–halogen–aerosol chemistry (Wang et al., 1998; Bey et al., 2001; Park et al., 2004; Mao et al., 2013). The chemical kinetics are obtained from the Jet Propulsion Laboratory (JPL) and International Union of Pure and Applied Chemistry (IUPAC) (Sander et al., 2011; IUPAC, 2013). Photolysis rates are calculated using the Fast-JX scheme (Bian and Prather, 2002). The linearized ozone parameterization (LINOZ) is used to simulate stratospheric ozone as described by McLinden et al. (2000). Other species in the stratosphere are calculated in the model based on archived monthly mean production and loss rates provided by the Global Modeling Initiative (GMI; Murray et al., 2013). Dry deposition of both gas and aerosols are calculated online based on the resistance-in-series algorithm (Wesely, 1989; Zhang et al., 2001). The wet deposition for water-soluble aerosols and gas in GEOS-Chem is described by Liu et al. (2001) and Amos et al. (2012). The non-local scheme for the boundary layer mixing process and the relaxed Arakawa–Schubert scheme for cloud convection are described in Lin and McElroy (2010) and Moorthi and Suarez (1992), respectively.
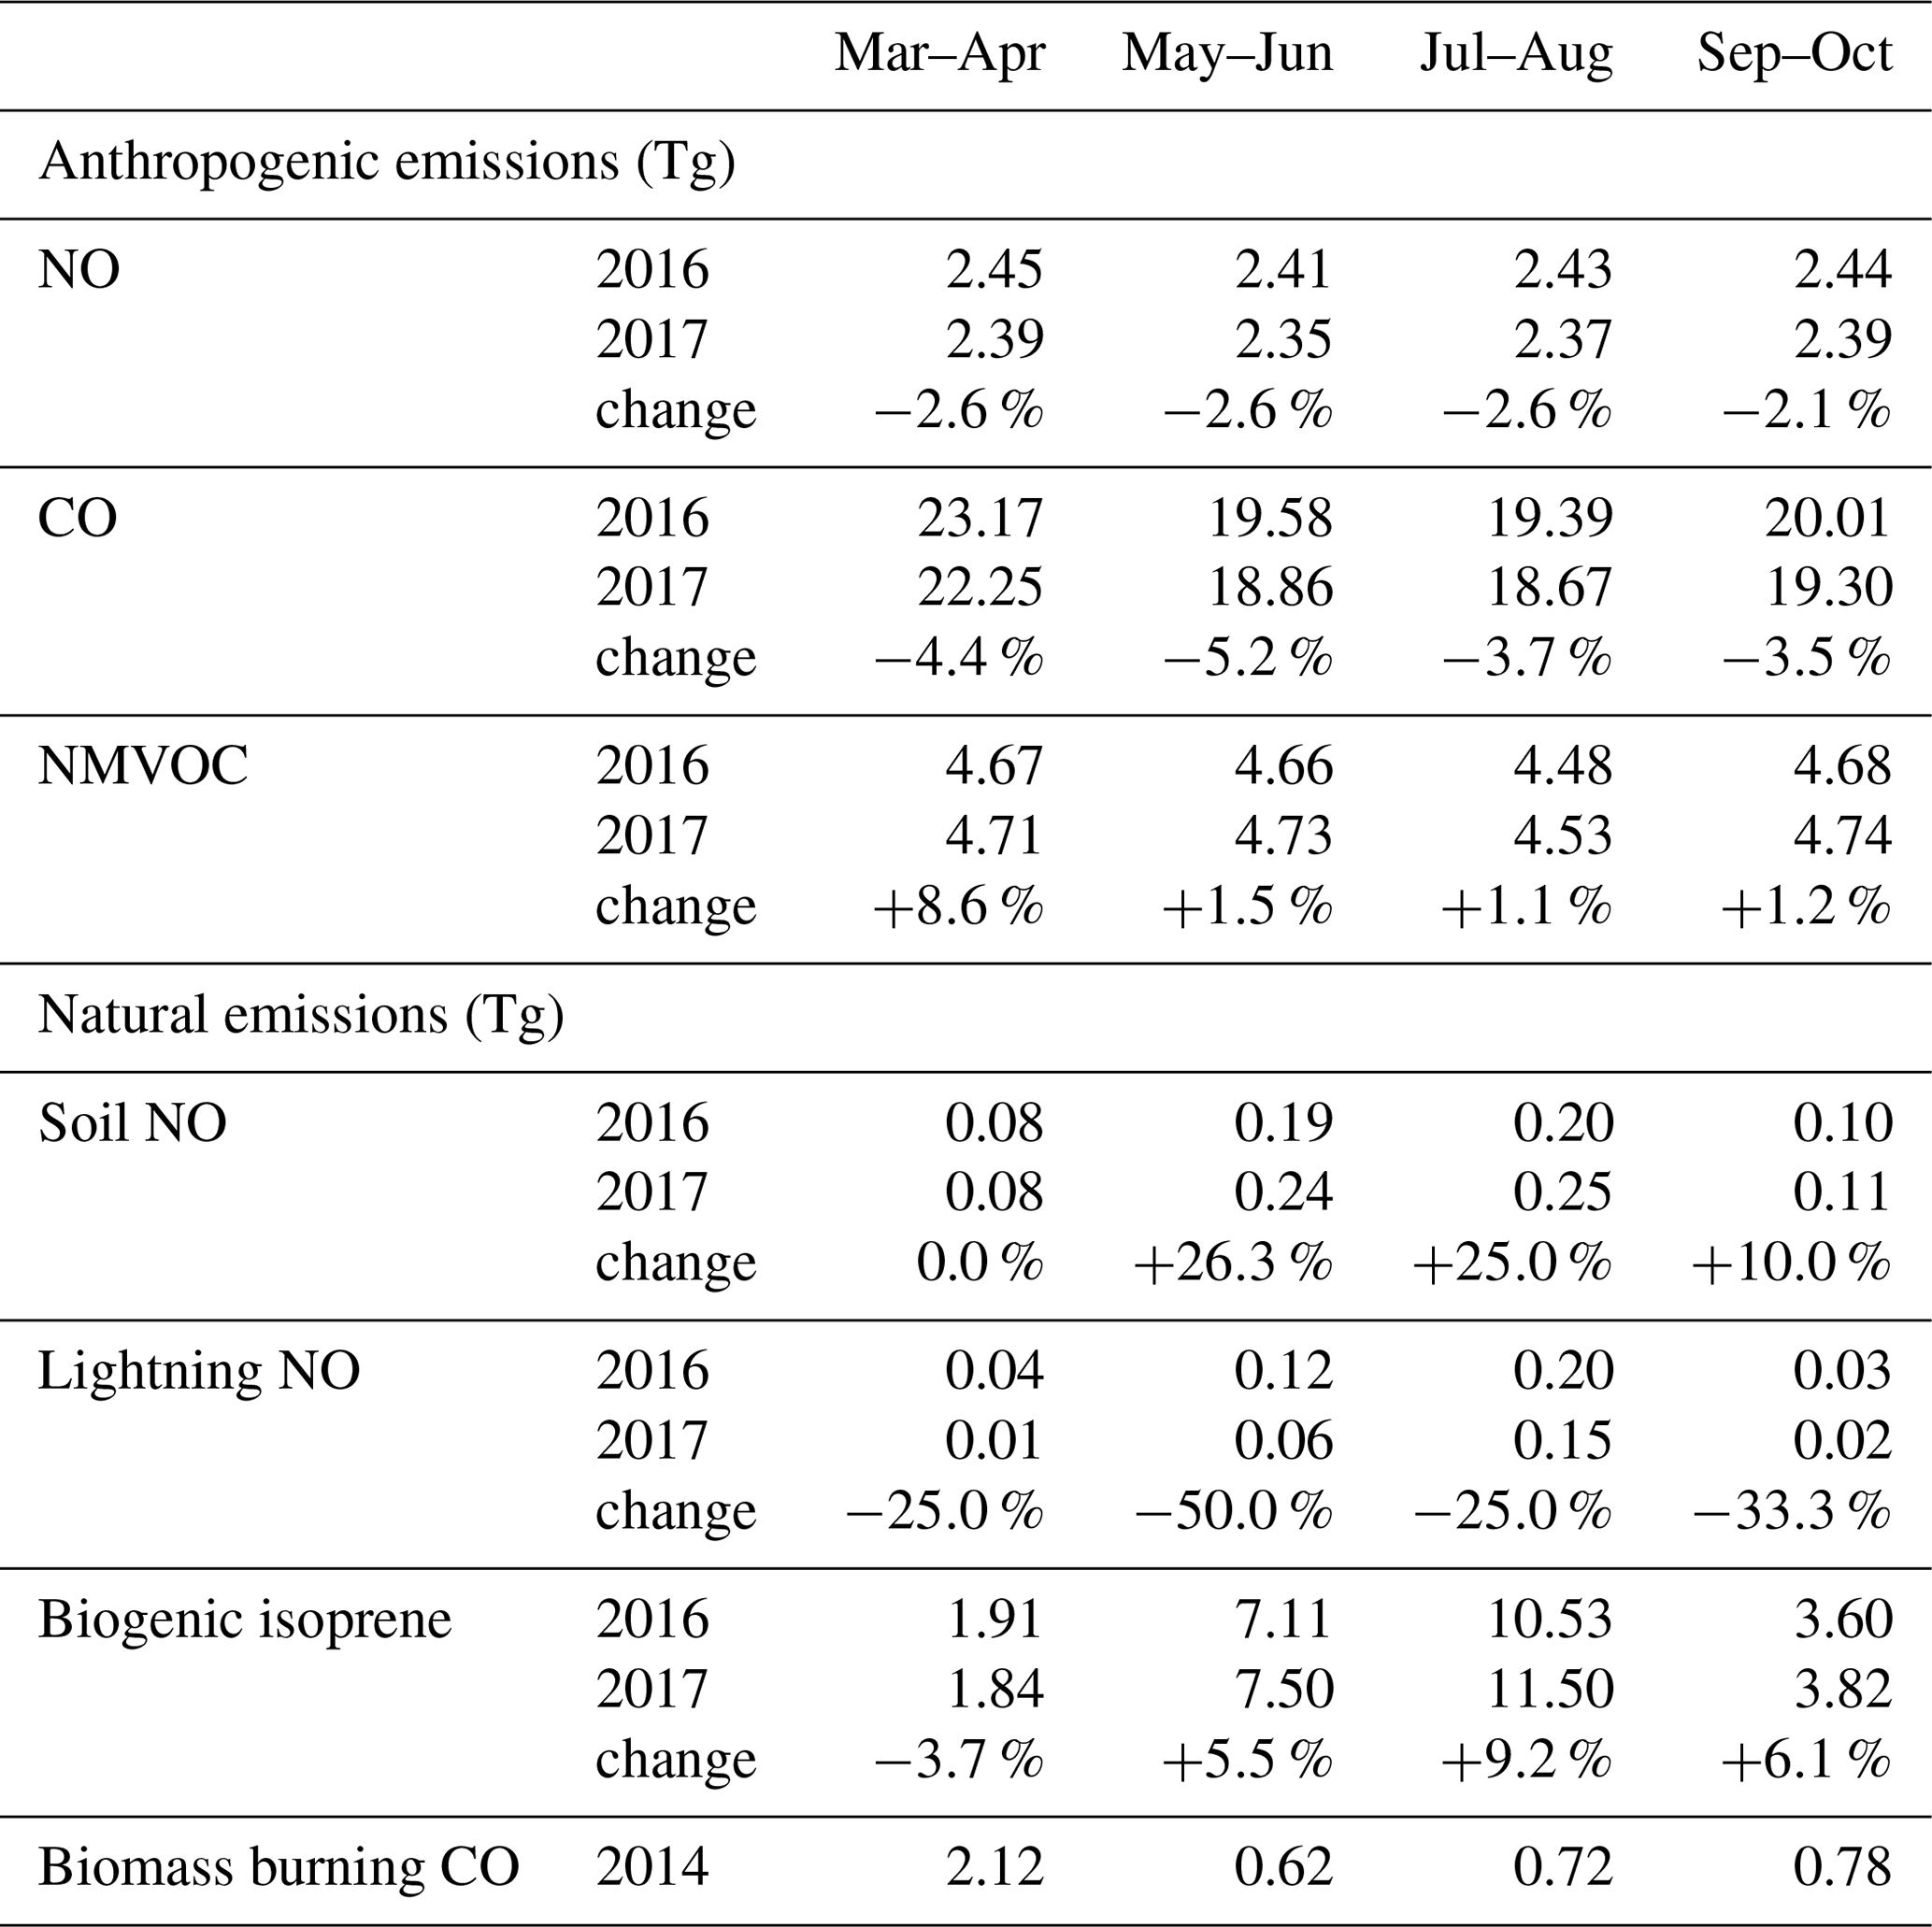
Emissions in GEOS-Chem are processed through the Harvard–NASA Emission Component (HEMCO) (Keller et al., 2014). Global anthropogenic emissions in this study are from the Community Emissions Data System (CEDS; the latest 2014 condition is used for the model simulation) (Hosely et al., 2018) overwritten by regional emission inventories over the US (National Emission Inventory, NEI), Canada (Canadian Criteria Air Contaminant), Mexico (Kuhns et al., 2005), Europe (European Monitoring and Evaluation Program, EMEP), Africa (DICE-Africa inventory) (Marais and Wiedinmyer, 2016), and East Asia and South Asia (MIX inventory) (Li et al., 2017a). In particular, we apply the latest Chinese anthropogenic emissions for 2016 and 2017 from the Multi-resolution Emission Inventory for China (MEIC; http://www.meicmodel.org, last access: 22 June 2019) (Zheng et al., 2018). The MEIC is a bottom-up emission inventory with particular improvements in the accuracy of unit-based power plant emission estimates (Liu et al., 2015), vehicle emission modeling (Zheng et al., 2014), and the NMVOC speciation method (Li et al., 2014). The bimonthly spatiotemporal distributions of anthropogenic NOx, CO, and non-methane VOC (NMVOC) emissions averaged for 2016–2017 are shown in Fig. S1 in the Supplement. The highest emissions are in the populated city clusters in central eastern China (typically includes NCP, FWP, YRD, CYR, and adjacent regions) with little seasonal variation. Total annual Chinese anthropogenic emissions of NOx, NMVOC, and CO are, respectively, 22.5, 28.4, and 141.9 Tg in 2016 and 22.0, 28.6, and 136.2 Tg in 2017 (Zheng et al., 2018). The annual Chinese NOx and CO emissions both decrease by approximately 20 % in 2017 compared to 2013 when the Chinese State Council initiated the Action Plan on Air Pollution Prevention and Control, but NMVOC emissions show a slight increase of 2 % (Zheng et al., 2018). All anthropogenic emissions are emitted at the lowest layer in the model with a thickness of 120 m. A recent study found that uncertainties in industrial emission injection heights could affect surface SO2 concentrations by about 80 % (Yang et al., 2019); this may further affect surface ozone concentrations and requires further study.
GEOS-Chem has implemented a number of natural emissions, some of which are calculated online in the model. Lightning NOx emissions are parameterized as a function of cloud-top height (Price and Rind, 1992), vertically distributed following Ott et al. (2010), and spatially constrained by climatological observations of lightning flash rates from the Lightning Imaging Sensor (LIS) and the Optical Transient Detector (OTD) satellite instruments (Murray et al., 2012). Following previous studies (Hudman et al., 2007; Zhang et al. 2014), the amount of NO released per flash is 500 moles for the lightning north of 35∘ N in Eurasia and 23∘ N in North America; it is 260 moles for the rest of the world. Soil NOx emissions are calculated based on nitrogen (N) availability in soil and edaphic conditions such as soil temperature and moisture as described in Hudman et al. (2010, 2012). Biogenic VOC (BVOC) emissions are calculated following the Model of Emissions of Gases and Aerosols from Nature (MEGAN version v2.1) algorithm (Guenther et al., 2012). Monthly mean biomass burning emissions for the year 2014 from the Global Fire Emissions Database version 4 (GFED4) are used in the simulation (van der Werf et al., 2017). Bimonthly mean total emissions of these natural processes averaged over China are summarized in Table 2. Mixing ratios of methane are prescribed in the model based on spatially interpolated monthly mean surface methane observations from the NOAA Global Monitoring Division for 1983–2016 and are extended to 2020 using the linear extrapolation of local 2011–2016 trends (Murray, 2016). We find that it leads to an approximate 1 % increase in methane concentration over eastern China in 2017 relative to 2016.
Table 2Bimonthly mean anthropogenic and natural sources over China used in the model.
2.3 Model configurations
Model configurations are summarized in Table 3. The standard simulation (BASE) includes all anthropogenic and natural emissions as described above. We then conduct sensitivity simulations (1) with all anthropogenic emissions (all emitted pollutants except methane, which is prescribed in all simulations here) turned off over China (noCH) and (2) with all anthropogenic emissions turned off globally (noGLOBE). Ozone concentrations in noCH therefore represent total background ozone in China (hereafter called background ozone), and those in noGLOBE represent natural background ozone (hereafter called natural ozone). The differences in ozone concentration between BASE and noCH denote the domestic anthropogenic ozone enhancements (CH anthropogenic ozone).
We also conduct several additional sensitivity simulations by turning off individual sources to estimate their ozone enhancements in the presence of all other sources. The ozone contribution from each source can therefore be estimated as the ozone difference between the BASE simulation and each sensitivity simulation. This difference quantifies the source contributions to present-day surface ozone, which includes the interaction of each specific source with all other sources rather than the pure impact from the specific source alone (Li et al., 2018a). Four such sensitivity simulations are conducted by turning off (1) BVOC emissions (noBVOC), (2) lightning NOx emissions (noLIGHT), (3) soil NOx emissions (noSOIL), and (4) biomass burning emissions (noBB).
Due to the long lifetime of ozone in the lower stratosphere (approximately years; Wang et al., 1998), the stratospheric contribution to tropospheric ozone is typically quantified using the tagged ozone simulation (TagO3) (Wang et al., 1998; Zhang et al., 2014) instead of perturbing the stratospheric ozone chemistry, which requires a long spin-up time. The tagged ozone simulation labels ozone produced above the tropopause from the photolysis of molecular oxygen as stratospheric ozone and then simulates its transport and chemical loss in the troposphere (Lu et al., 2019). This tagged stratospheric ozone is calculated based on ozone production and loss frequency archived from the BASE simulation.

For all simulations (except for the TagO3 simulation, which was spun up for 3 years), the global simulation (2∘ latitude × 2.5∘ longitude) was first conducted from April 2015 to November 2017. The results on 1 February 2016 were then interpolated to high resolution (0.25∘ latitude × 0.3125∘ longitude) over the nested domain and were used to initialize the nested model simulation. Results from the nested model for March–October in both 2016 and 2017 are analyzed.
3.1 Model evaluation
Figure 2 compares the spatial distributions of observed and simulated bimonthly mean surface MDA8 ozone concentrations at the 169 cities (Fig. 1) averaged for the 2 years (2016–2017). Figures S2–S3 further compare daily MDA8 values in the nine city clusters and in individual cities. We use MDA8 throughout the analysis as it is the ozone air quality standard in China and also an important metric of human health exposure (Turner et al., 2016).
The model reproduces the spatial distribution of observed surface MDA8 ozone in the warm season (May–August) with a high spatial correlation coefficient (r) of 0.81–0.82 and a relatively small positive mean bias of 4.5–7.4 ppbv (7 %–13 %) in the 169 cities. In particular, the model captures the ozone hot spots over eastern China (including the NCP, YRD, FWP, and CYR city clusters) in May–June when both observations and model results show MDA8 ozone > 60 ppbv in a number of cities (Fig. 2). In spring (March–April) and autumn (September–October), model results have larger positive biases (5.3–9.2 ppbv, 12 %–20 %) while still capturing the higher surface ozone in eastern China (r=0.32–0.46 for all 169 cities). The simulated daily MDA8 values are in good agreement with the observed values, with r ranging from 0.53 to 0.75 in the nine city clusters (Fig. S2). The model captures 57 % of the days with observed MDA8 > 75 ppbv (approximately the grade II Chinese national air quality standard for the protection of residential areas) for all nine city clusters (and more than 60 % for NCP, YRD, and FWP cities). The model also reproduces the seasonal variation of surface ozone over mainland China, i.e., the peak in summertime and lower values in other months (Fig. 2). The seasonality of surface ozone typically reflects the dominant role of temperature and solar radiation in enhancing natural emissions of ozone precursors and accelerating photochemical ozone production under high precursor concentrations, with modulations by the arrival of the summer monsoon (Ding et al., 2013; Li et al., 2018b; Lu et al., 2018a).

Figure 2Spatial distribution of observed (circles) and simulated (shaded) bimonthly mean surface daily maximum 8 h average (MDA8) ozone concentrations over China averaged for 2016–2017. Observations at the 169 major cities are plotted over the GEOS-Chem model results. Observed (OBS) and simulated (CTM) bimonthly mean values averaged for the 169 cities and their correlation coefficients (r) are inset.
Surface ozone levels at Chinese urban sites typically show large day-to-day variations driven by intense regional anthropogenic emissions, rapid chemical conversion, and shifts of meteorological patterns (Wang et al., 2006; Lu et al., 2010; Tan et al., 2018b). We find in Fig. S3 that observed MDA8 ozone concentrations in many cities can shift by more than 60 ppbv in 2 d. Such variations, however, are challenging for Eulerian chemical models to capture due to numerical diffusion, even at 10 km grid resolution, and representative issues when comparing gridded simulated results to observations at urban sites (Young et al., 2018). Artificial mixing of ozone precursors in model grids may cause higher ozone production efficiency and therefore positive ozone biases (Wild and Prather, 2006; Yu et al., 2016; Young et al, 2018). In addition, models have limited skills in presenting local emissions and meteorological conditions, particularly over complex terrain (e.g., in WCH and SCB cities) (Zhang et al., 2011; Ni et al., 2018). These limitations largely explain the ozone overestimates at Chinese urban sites and the deficiencies in capturing extremely high ozone values in our model, as well as many other modeling studies using GEOS-Chem at coarser resolutions (e.g., Wang et al., 2011; Ni et al., 2018) and regional models such as the Community Multi-scale Air Quality (CMAQ) model (Chen et al., 2018; Liu et al., 2018). We find that by increasing the resolution from to , model results show significant improvements in capturing the ozone daily variability and summertime high ozone episodes (model vs. observation correlation coefficients increase from 0.41–0.85 to 0.64–0.88 in individual cities), yet they are still not sufficient to reduce the high biases in spring and autumn (Fig. S3).
3.2 Anthropogenic vs. background ozone contributions over China
Figure 3 explores the contributions of anthropogenic, background, and natural sources to the bimonthly mean surface MDA8 ozone concentration in China averaged for 2016–2017. For the national average (averages of the model grids over the terrestrial land of China), we find that background ozone is the dominant source of present-day surface MDA8 ozone. Background contributions to surface ozone over China are as high as 90 % (49.4 ppbv) in March–April, followed by 84 % (43.2 ppbv) in September–October, 84 % (49.7 ppbv) in May–June, and 76 % (39.2 ppbv) in July–August (Fig. 3b). Natural sources contribute on average 80 % (44.1 ppbv) of the surface MDA8 ozone in March–April and 71 % (39.6 ppbv) in May–August (Fig. 3c). Higher background ozone concentrations are distributed in western and northern China where both natural ozone and ozone imported from foreign anthropogenic sources have larger influences than in eastern and southern China. The peak background contribution in spring reflects a mixed effect of larger transboundary transport from foreign anthropogenic sources driven by strong westerly winds (Zhang et al., 2008; HTAP, 2010; Ni et al., 2018) and larger transport from the stratosphere, as will be discussed in Sect. 3.3.
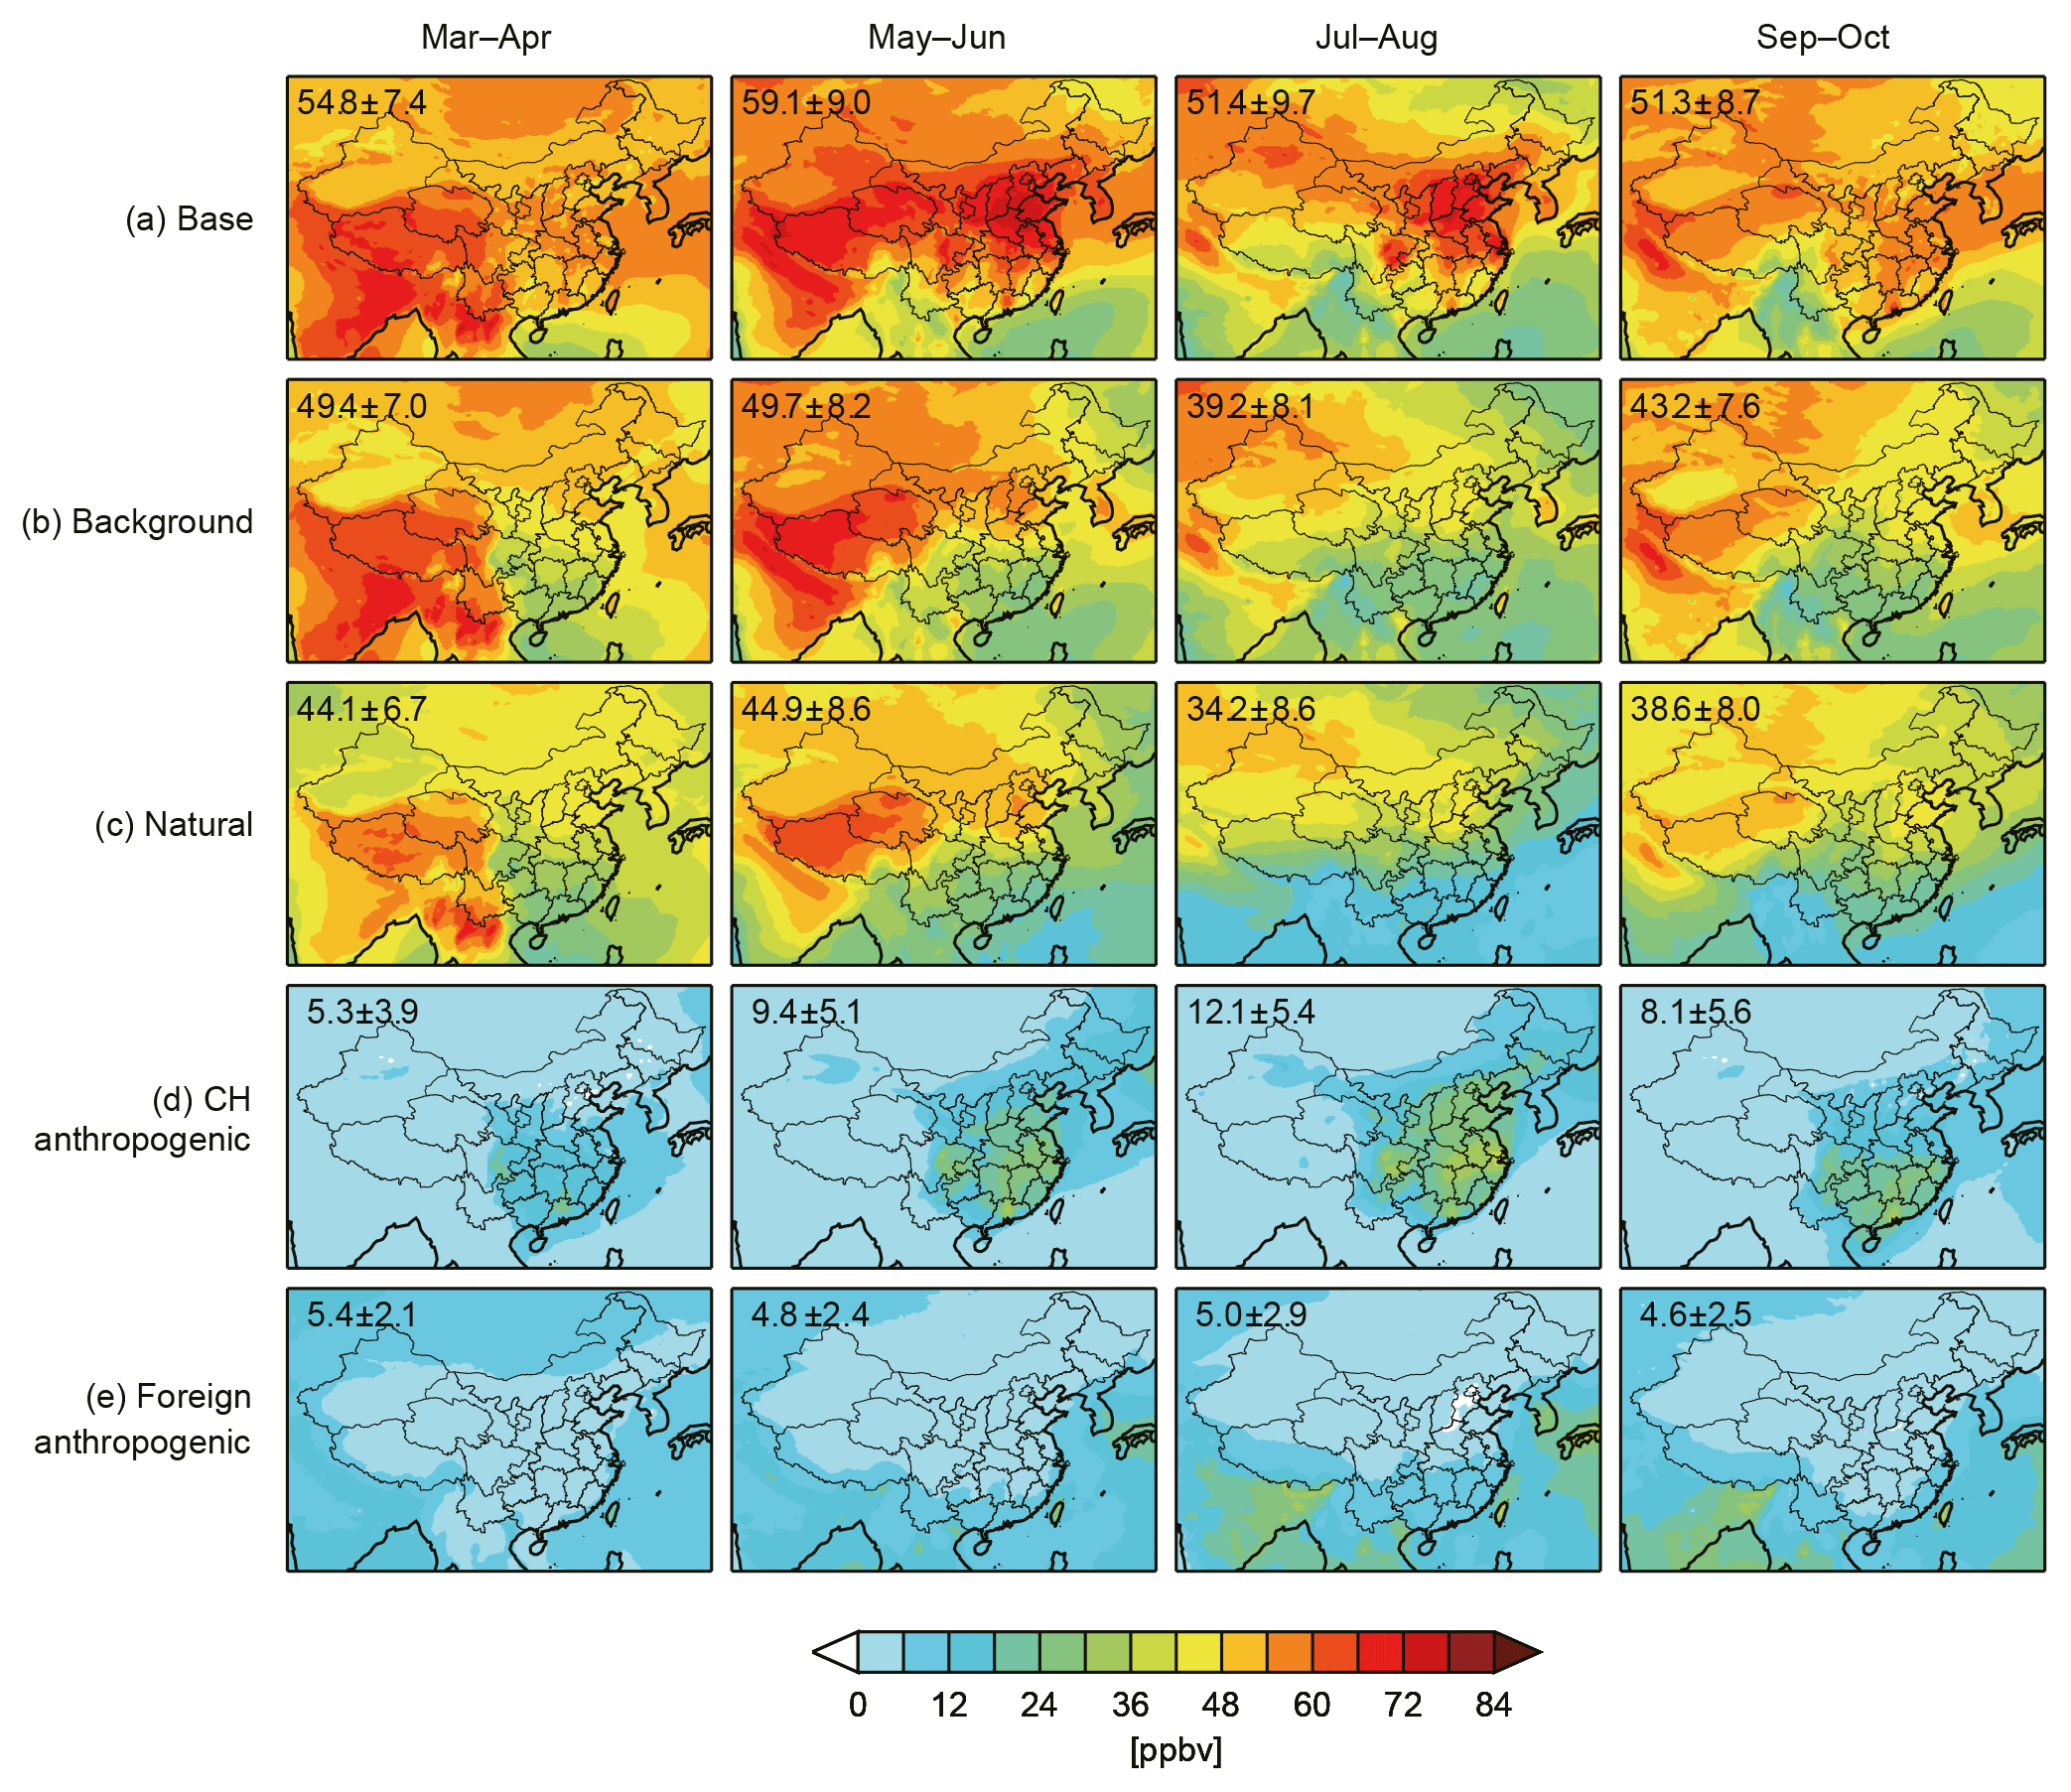
Figure 3Simulated bimonthly mean ± standard deviation of surface MDA8 ozone over China and the source attributions averaged for 2016–2017. Plots are (a) surface MDA8 ozone from the BASE simulation, (b) Chinese background MDA8 ozone estimated from the noCH simulation in which Chinese anthropogenic emissions are turned off in the model, (c) natural MDA8 ozone estimated from the noGLOBAL simulation in which global anthropogenic emissions are turned off in the model, (d) Chinese anthropogenic MDA8 ozone enhancement diagnosed as the difference between the BASE simulation and the noCH simulation, and (e) foreign anthropogenic MDA8 ozone enhancement diagnosed as the difference between the noCH simulation and the noGLOBAL simulation. The mean values averaged over China are inset.
In contrast, ozone contributions from domestic anthropogenic sources are much smaller when averaged over China, with a peak contribution of about 24 % (12.1 ppbv) in July–August and less than 15 % (5–9 ppbv) in other months (Fig. 3d). The largest anthropogenic ozone enhancements are spatially centered in central eastern China following the hot spots of anthropogenic emissions (Fig. S1) and population density; they seasonally peak in summer due to active photochemistry at higher temperature and solar radiation conditions (Fig. S4). There is over 30 ppbv of ozone enhancement by domestic anthropogenic sources in central eastern China during July–August, which is comparable to background ozone there. Figure 3e shows the spatial distribution of foreign anthropogenic ozone enhancements estimated as the difference between the background ozone (Fig. 3b) and natural ozone (Fig. 3c). Larger contributions are found near the national borders and in the springtime. The foreign anthropogenic contributions we estimate here (∼ 5 ppbv for all seasons averaged over China), however, may underestimate their true contribution, since they are derived in the absence of Chinese domestic anthropogenic emissions and thus do not consider possible interactions with domestic emissions, e.g., ozone produced by foreign precursor enhancements reacted with domestic anthropogenic emissions.
Wang et al. (2011) estimated the contribution of background and anthropogenic sources to surface ozone over China in 2006 with an earlier version of GEOS-Chem (v8-01-01) at resolution. They used daily mean ozone as a metric and found that background ozone accounted for about 93 % of total ozone in March–May and 80 % in June–August. In good agreement with Wang et al. (2011), our model results when converting to daily mean ozone as a metric estimate background ozone contributions of 95 % in March–April and 80 % in July–August. These are slightly higher than values derived from the MDA8 metric, reflecting higher domestic anthropogenic contributions to surface ozone at higher ozone levels as will be discussed later.
3.3 Identifying ozone enhancements from individual natural sources
We now illustrate in Fig. 4 the impacts of individual natural sources on surface MDA8 ozone concentrations in China, including ozone enhancements from BVOC emissions, lightning NOx emissions, soil NOx emissions, biomass burning emissions, and ozone transported from the stratosphere. Here we focus on the source contributions to bimonthly means averaged over China and will present the daily variations at the city level in Sect. 3.4.
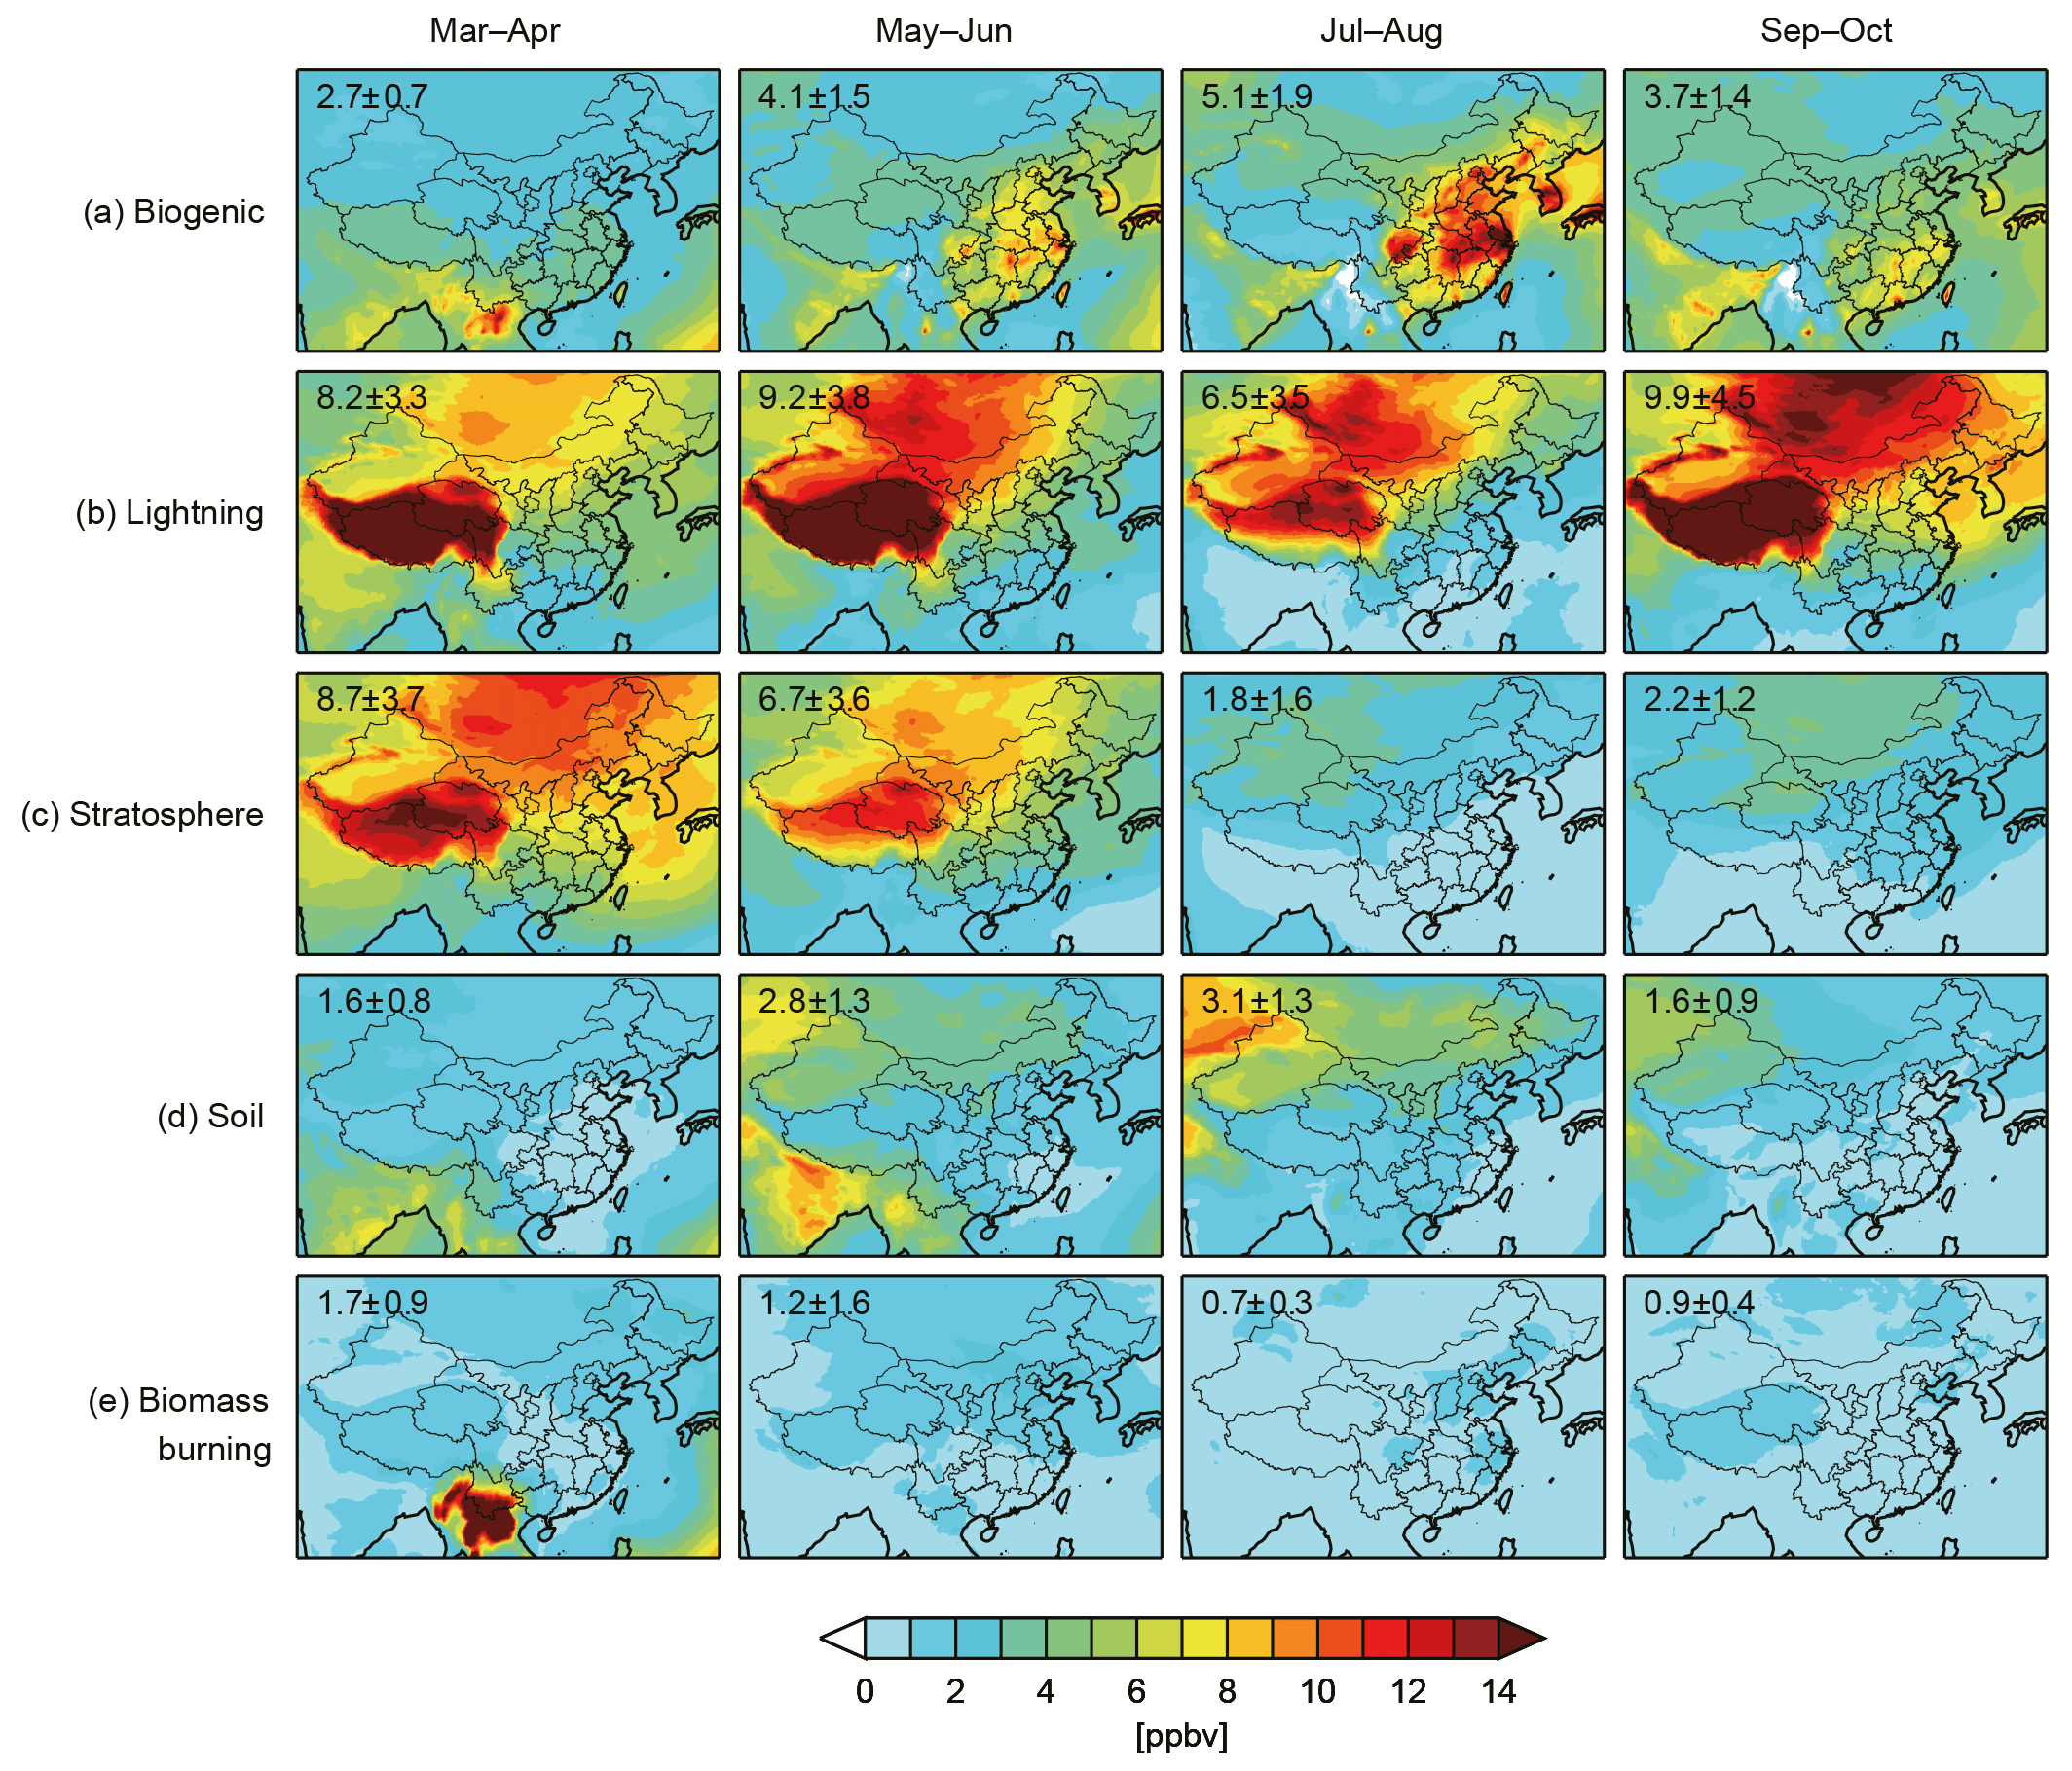
Figure 4Same as Fig. 3 but for ozone enhancements from (a) biogenic volatile organic compound emissions, (b) lightning NOx emissions, (c) the stratosphere, (d) soil NOx emissions, and (e) biomass burning emissions. The source attributions are diagnosed as the difference between the BASE simulation and a simulation with the specific source turned off, expect for ozone from the stratosphere, which is diagnosed by the TagO3 simulation as described in the text.
BVOC emissions enhance surface MDA8 ozone by 5.1 ppbv in July–August and 2.7–4.1 ppbv in other months averaged over China (Fig. 4a). The enhancements are particularly large over central eastern China where BVOCs enhance surface MDA8 ozone by more than 10 ppbv in July–August. These values are considered to be the actual contributions of BVOCs to ozone, which include the pure contributions, i.e., contributions of BVOCs to ozone in the absence of all other sources and the interactional effects of BVOCs with other sources. Li et al. (2018a) decomposed interactional and pure contributions and found that the interactional contributions of BVOCs and anthropogenic emissions enhanced summertime (August 2011) surface ozone in urban Xi'an by 14.3 ppbv, which is comparable with our results in this city, while the pure BVOC contributions alone are only about 2.6 ppbv. The seasonal and spatial variations of BVOC ozone enhancements (Fig. 4a) are mainly driven by the exponential dependency of BVOC emissions on temperature. As shown in Figs. S4 and S5, high biogenic isoprene emissions occur over central eastern China in July–August when daily maximum 2 m air temperature (TMAX) generally exceeds 30 ∘C. Previous studies have shown that estimates of BVOC ozone enhancements can be influenced by the model simulation of yields and fates of organic nitrates (RONO2), a by-product from the oxidation of isoprene and its carbonyl (Ito et al., 2009; Fu et al., 2015). Here the GEOS-Chem model assumes a 9 % yield of RONO2 from the reaction of isoprene peroxy radicals with NO, following recent laboratory observations (Paulot et al., 2012; Lee et al., 2014).
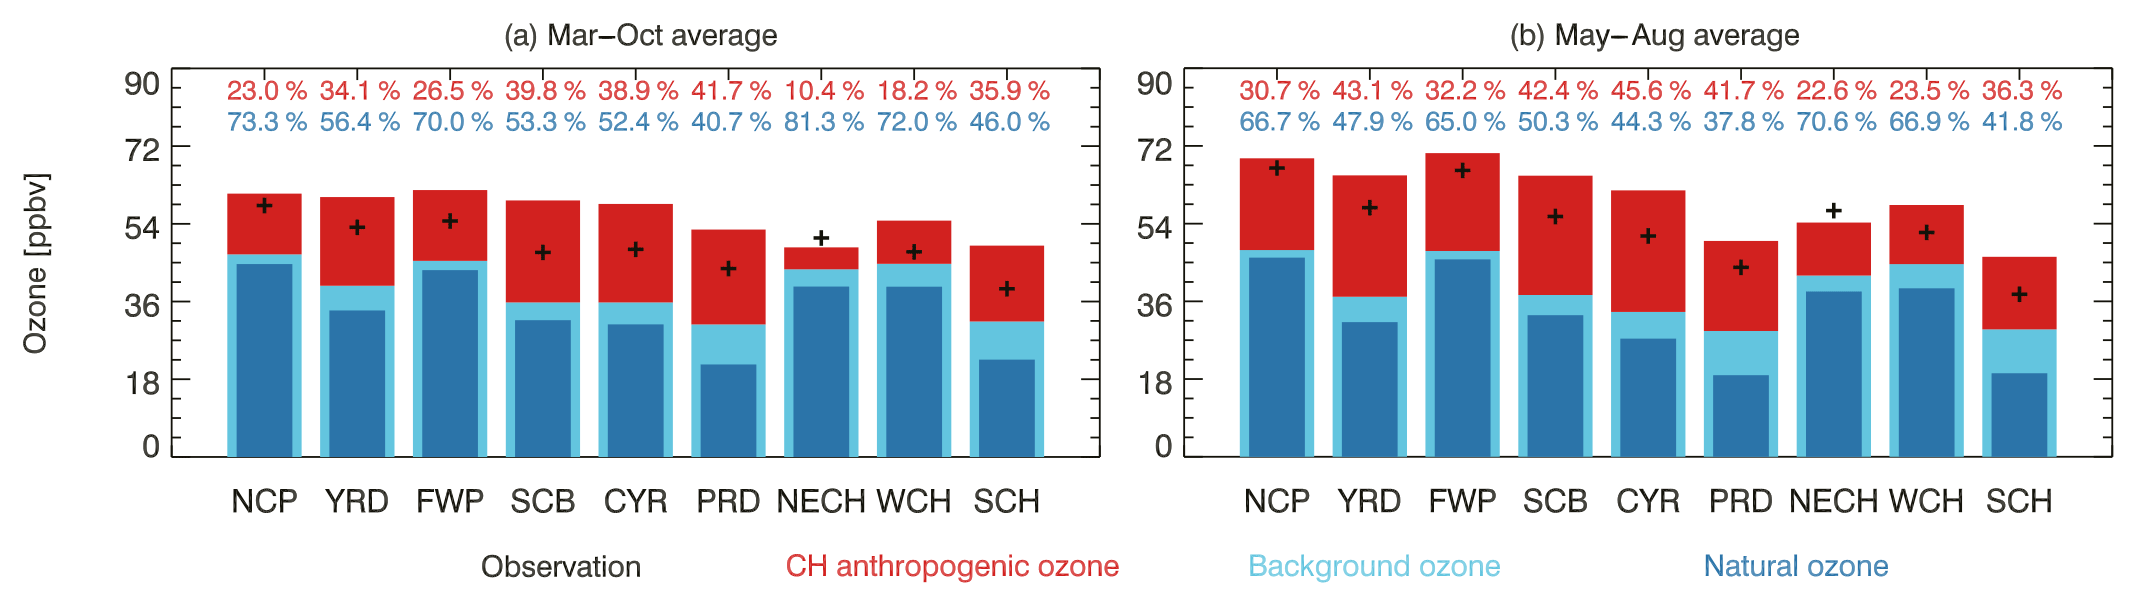
Figure 5Simulated MDA8 ozone and the source attributions in nine city clusters in 2016–2017 averaged for (a) March to October and (b) May to August. The black pluses denote the observed mean ozone MDA8 values. The bars present simulated mean ozone MDA8 values, with the domestic anthropogenic ozone contribution in red, the background ozone contribution in light blue, and the natural sources in dark blue. The percentage of domestic anthropogenic contribution (red) and natural contribution (dark blue) for each cluster is inset.
Lightning NOx emissions increase bimonthly mean surface MDA8 ozone by 6.5–9.9 ppbv averaged over China, with the largest contributions (typically more than 12 ppbv) found over the Tibetan Plateau (Fig. 4b). The large lightning ozone enhancements over western China (annual mean > 7 ppbv) were also simulated by Murray (2016), and these values were higher than those over the western US (annual mean of 3–5 ppbv). However, the model may overestimate springtime lightning ozone enhancements over the Tibetan Plateau as the model shows high surface ozone biases of more than 15 ppbv in spring over this region (Fig. 2). In central eastern China, lightning activities also enhance surface MDA8 ozone by about 2–8 ppbv for all seasons. The spatiotemporal patterns of lightning ozone enhancements, however, do not follow the lightning NOx emission patterns that typically peak in summer over central eastern China in the middle troposphere (600–400 hPa) driven by strong convection (Figs. S5–S6). The large lightning ozone enhancements for all seasons over the Tibetan Plateau and the Altai Mountains (in western Mongolia) are mainly due to their high elevations. Although lightning NOx emissions are larger in July–August, the shorter ozone lifetime and stronger upward transport over central eastern China in these months can suppress downward mixing of lightning ozone enhancements to the surface (Fig. S4), resulting in their minimum influences there in the period. This also partly explains the decreases in surface ozone from spring to summer in western China as shown in Fig. 2.
Stratosphere–troposphere exchange (STE) is typically active in the boreal spring at northern midlatitudes associated with synoptic-scale and mesoscale processes, such as tropopause folds, gravity wave breaking, and deep convection (Stohl et al., 2003). We show in Fig. 4c that stratospheric ozone contributions at the surface are 8.7 ppbv in March–April and 6.7 ppbv in May–June averaged for China. Western China, particularly the Tibetan Plateau, is strongly influenced by deep stratospheric intrusions with more than 20 ppbv of surface MDA8 ozone originating from the stratosphere, consistent with the estimate of Xu et al. (2018) using a different CTM. We also find important stratospheric influences (6–10 ppbv) on surface ozone over the NCP and FWP regions in March–June. Stratospheric contributions to surface ozone are at a minimum in summer when STE is weakest and upward transport is strongest, limiting downward mixing of stratospheric ozone.
Soil NOx emissions increase national mean surface MDA8 ozone by 1.6 to 3.1 ppbv (Fig. 4d). Figure S5 shows that the model simulates the highest soil NOx emissions in May–August over central eastern China and northern Asia, consistent with those derived from satellite observations (Vinken et al., 2014). Large emissions in these regions can be explained by the combined effect of high temperature and frequent pulsing emissions of soil NOx after rainfall (Hudman et al., 2012). The largest soil ozone enhancements are not colocated with the emission hot spots but in regions such as northern China (2–6 ppbv in May–August) where surface ozone production is more sensitive to NOx as indicated by the modeled H2O2∕HNO3 values (Fig. S7). The lower bimonthly mean soil NOx ozone contributions in central eastern China compared to other regions are due to averaging some negative daily values, as will be discussed in Sect. 3.4.
Compared to other natural sources, biomass burning emissions lead to lower ozone enhancements averaged over China (less than 2 ppbv). This is because biomass burning emissions are generally small over China (less than 2 % of the total NOx emissions over China) (Wang et al., 2007; Lin, 2012). Larger influences are found during boreal spring (March–April) in southwestern China than other seasons and regions in China. The enhancements are particularly large in the southern part of Yunnan Province with over 15 ppbv of ozone enhancement driven by intense fires in Southeast Asia (Fig. S5d). Previous studies have shown that Eulerian chemical models such as GEOS-Chem tend to overestimate ozone enhancements from biomass burning emissions in regions adjacent to emission sources (i.e., in southwestern China) but underestimate them in downwind regions (Zhang et al., 2014; Lu et al., 2016). This can reflect a number of limitations, including inadequate representation of wildfire emission and chemistry (e.g., missed short-lived VOCs, fewer PAN emissions, and improper emission height), as well as the stretched-flow numerical diffusion of narrow plumes in the model even at fine resolutions (Lu et al., 2016; Eastham et al., 2017).

Figure 6Simulated daily MDA8 ozone (x axis) and corresponding background contributions (y axis) in the nine city clusters for March–October 2017 with different months denoted in different colors. Also shown are box-and-whisker plots (minimum, 25th, 50th, and 75th percentiles, and maximum) of domestic anthropogenic ozone enhancements (y axis) over 10 ppbv bins of simulated ozone concentrations. The 1:1 line and number of cities in each cluster are inset.
It should be noted that the total contributions of the above individual natural sources (sum of Fig. 4) together account for about half (from 47.4 % in September–October to 53.4 % in July–August) of natural ozone levels (Fig. 3c). The missing rest can be largely attributed to contributions from global methane. Fiore et al. (2008) found that 1 Tg of methane emissions would lead to an increase in global mean surface ozone by about 15 pptv (∼ 9 ppbv with present-day annual emissions of 600 Tg), and such sensitivity doubled at high NOx levels. Further analyses are therefore needed to quantify the contributions of global methane levels to background ozone in China. The discrepancies may also be due to nonlinear interactional effects between different sources that are not captured by sensitivity simulations with individual emissions turned off.
3.4 Sources contributing to surface ozone in city clusters
It is of particular importance to assess sources contributing to surface MDA8 ozone in major Chinese cities. Figure 5 shows the ozone contributions from background, anthropogenic, and natural sources in nine city clusters (Fig. 1, Table 1) averaged for March–October (Fig. 5a) and for May–August (Fig. 5b) 2016–2017. For city-cluster averages in both time periods, background sources (and dominantly natural sources) have larger contributions than domestic anthropogenic sources to surface ozone. Averaged for March–October, domestic anthropogenic contributions are 23 %, 34 %, and 27 % for NCP, YRD, FWP city clusters, respectively. The smallest domestic anthropogenic contributions are found over northeastern China (NECH, 10 %) and western China (WCH, 18 %), where anthropogenic emissions are low and natural source influences from the stratosphere, lightning, and soil are relatively high. For the city clusters in central (CYR, SCB) and southern China (PRD, SCH), Chinese anthropogenic contributions account for 35 %–42 % in March–October. In May–August (Fig. 5b), the domestic anthropogenic contribution fractions increase by about 6 %–9 % in all city clusters except PRD and reach 31 % in the NCP, 43 % in the YRD, and 32 % in the FWP, reflecting the increasing importance of domestic anthropogenic contributions to surface ozone in the peak ozone season. The domestic anthropogenic contribution fractions in PRD remain the same for the March–October and May–August averages as surface ozone there typically peaks in September–October (Fig. 2).
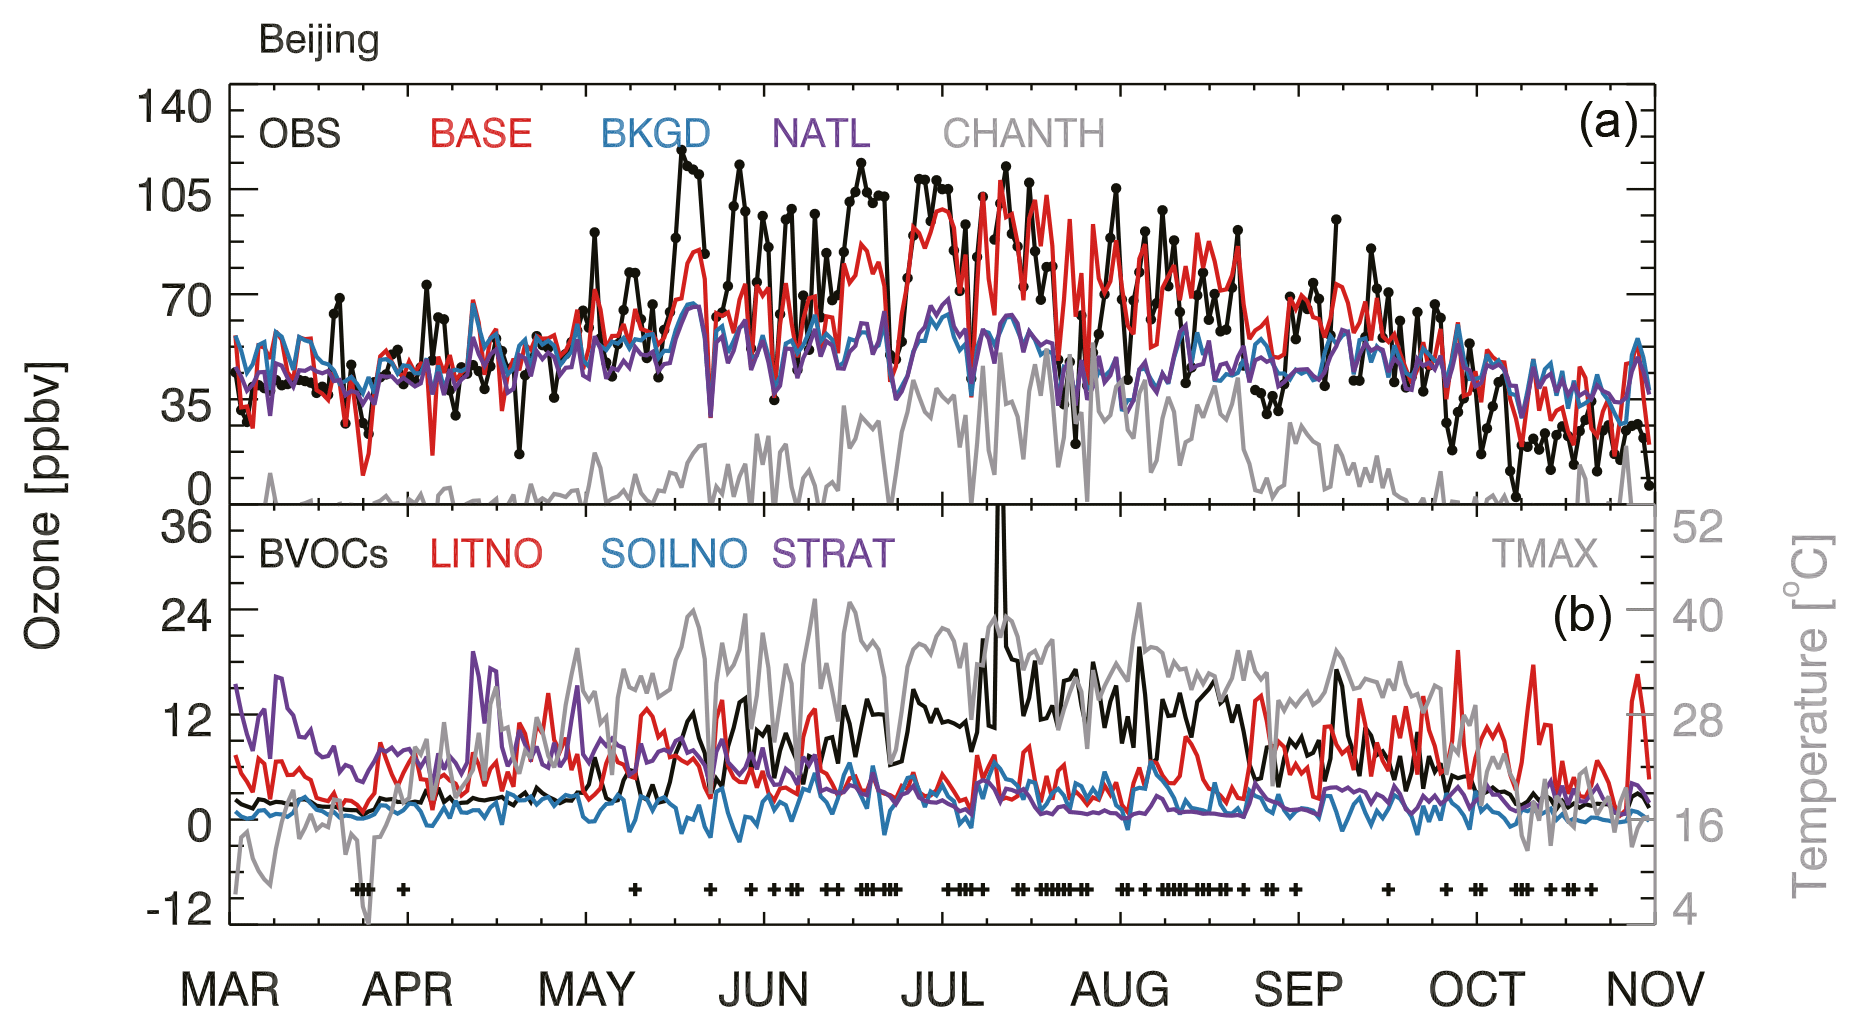
Figure 7Time series of observed and simulated daily MDA8 ozone concentrations and source attributions at Beijing in March–October 2017. Panel (a) shows observed MDA8 ozone (OBS, black), simulated ozone (BASE, red), estimated background ozone (BKGD, blue), natural ozone (NATL, purple), and domestic anthropogenic ozone (CHANTH, grey). Panel (b) shows the ozone enhancement from biogenic VOCs (BVOCs, black), lightning NOx (LITNO, red), soil NOx (SOILNO, blue), and the stratosphere (STRAT, purple). The estimation of ozone source attributions is described in the text. Also shown is daily maximum 2 m air temperature (TMAX, grey, right y axis) from the GEOS-FP data. The black pluses denote days with precipitation recorded from GEOS-FP data.
In Fig. 6, we present the source contributions to daily MDA8 surface ozone in 2017 categorized by different surface ozone levels, which further illustrates the higher contributions of domestic anthropogenic sources to higher daily MDA8 ozone values in Chinese cities. For all city clusters, domestic anthropogenic contributions are much smaller (typically less than 15 % of the total simulated ozone) when simulated MDA8 ozone concentrations are lower than 50 ppbv. These lower contributions are more prevalent during non-summer seasons when ozone is dominantly controlled by background ozone, except for PRD and SCH. Figure 6 also shows that domestic anthropogenic emissions can cause ozone decreases over central eastern China and northern China due to the NOx-saturated chemical regime in spring and fall (Fig. S7), leading to conditions with background ozone higher than simulated total ozone.

When simulated MDA8 ozone levels are higher than 75 ppbv, domestic anthropogenic contributions significantly increase to 28.8±6.8 ppbv (35 %) in NCP, 27.8±7.1 ppbv (33 %) in FWP, 38.8±10.7 ppbv (46 %) in YRD, 37.7±6.7 ppbv (46 %) in SCB, and 54.7±11.8 ppbv (61 %) in PRD. For the extremely high ozone episodes (simulated MDA8 ozone > 100 ppbv), their contributions are as high as 42.0±5.3 ppbv (41 %) in NCP, 39.1±4.8 ppbv (38 %) in FWP, 61.4±7.7 ppbv (58 %) in YRD, 52.4±10.7 ppbv (48 %) in SCB, and 73.2±7.0 ppbv (69 %) in PRD. We also find in Fig. 6 that there would be no days with MDA8 > 80 ppbv if there were no domestic anthropogenic influences in all 169 major Chinese cities. Our results show that background ozone has a dominant role in the monthly mean surface ozone, on top of which domestic anthropogenic contributions are of particular significance in ozone pollution episodes. Reducing anthropogenic contributions can therefore be effective in alleviating surface ozone pollution. One exception is the WCH region, where background ozone contributions are dominant for all seasons and even lead to high MDA8 ozone concentrations approaching 80 ppbv.
Figures 7–9 further show the time series of observed vs. simulated daily MDA8 ozone and the source contributions in representative cities from the three most polluted city clusters (Beijing in NCP, Shanghai in YRD, and Xi'an in FWP) in March–October 2017. The model is able to capture the daily variability of MDA8 ozone as well as the ozone peaks in Shanghai and Xi'an (r=0.78 and 0.87, respectively). However, it fails to reproduce the high ozone episodes in Beijing during May–June 2017, although still with a high temporal correlation coefficient (r=0.78), reflecting some model limitations as discussed in Sect. 3.1.

Analyses of the daily MDA8 ozone concentrations in the three cities indicate that both background and domestic anthropogenic ozone enhancements are significantly higher during high ozone episodes than clean days, consistent with Fig. 6. This may reflect their common correlations with meteorological parameters such as temperature. As shown in Figs. 7–9, the deseasonalized summertime (May–August) daily TMAX values are strongly correlated with both observed and simulated ozone, with r (TMAX vs. observed ozone) of 0.72 in Beijing, 0.54 in Shanghai, and 0.75 in Xi'an. We find that such positive temperature–ozone correlations (r > 0.60) are widespread in the cities over central eastern China in both observations and model results, as shown in Fig. 10. High summertime temperatures in China are typically associated with anticyclone systems (e.g., the West Pacific Subtropical High) that bring a clear sky with strong solar radiation and increased air stagnancy (Pu et al., 2017; Zhao et al., 2017). Such weather conditions tend to enhance ozone chemical production, weaken pollution ventilation, and favor natural emissions of ozone precursors. We find large temperature-driven daily variations of BVOC ozone enhancements during May–August in all three cities (Figs. 7–9). Taking Shanghai (Fig. 8) as an example, observed and simulated high ozone episodes are usually associated with large BVOC ozone enhancements of over 20 ppbv. Nevertheless, in the absence of anthropogenic emissions, the total MDA8 ozone would be below 70 ppbv despite high temperatures and background ozone in those cities. Implementing emission control measures under high temperature conditions can be effective to avoid ozone exceedance in Chinese cities.
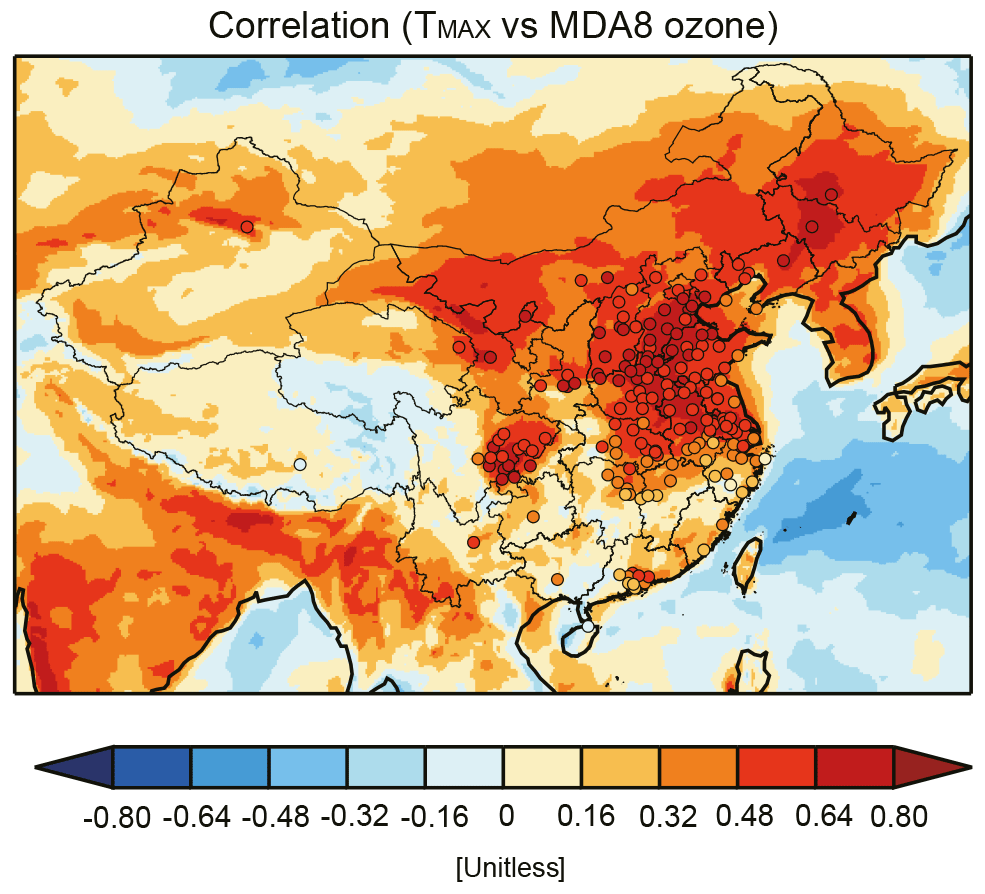
Figure 10Observed (circles) and simulated (shaded) correlation coefficients between deseasonalized surface daily MDA8 values and maximum 2 m air temperature (TMAX) for May–August 2016–2017.
Other natural processes such as lightning, soil emissions, and stratospheric transport also contribute to MDA8 ozone daily variations and can episodically lead to large ozone enhancements. For example, in Xi'an, a stratospheric intrusion enhanced surface ozone by over 25 ppbv in early May 2017 and pushed the observed MDA8 ozone to approach 80 ppbv (Fig. 9). Surface ozone enhancements by lightning are episodically higher than 10 ppbv and show a similar temporal evolution as stratospheric ozone enhancements, as downward air motion delivers both ozone enhancements originating from high altitudes. Ozone enhancements from soil NOx emissions become notable when there are pulsing soil emissions after rainfall (e.g., ∼ 10 ppbv in mid-August in Xi'an). They can be either positive or negative, reflecting the monthly or even daily shifts of the ozone chemical production regime, as also reported from satellite observations (Jin and Holloway, 2015) and several field campaigns in urban China (e.g., Lu et al., 2010). Biomass burning contributions to surface MDA8 ozone are generally small (less than 2 ppbv, not shown) in the three cities.
The 2-year model results allow us to compare the surface ozone concentrations and their source contributions between 2016 and 2017. Here we focus on the warm season (May–August) when most cities in eastern China show high surface ozone levels (Fig. 2). We examine the differences in anthropogenic and natural emissions, meteorological conditions, and their roles in the surface ozone changes. As shown in Table 2, domestic anthropogenic emissions of NO and CO in May–August decline by 0.12 Tg (2.6 %) and 1.44 Tg (3.7 %) in 2017 compared to 2016, respectively. The decreases in NO and CO emissions are widespread over eastern China, with the largest reductions in Hebei, Shandong, and Jiangsu provinces, except in Beijing, Shaanxi, and Ningxia provinces where both NO and CO emissions show slight increases (Fig. 11a and b). On the other hand, anthropogenic NMVOC emissions increase by 0.1 Tg (1.1 %) averaged over China, which is up to 4 % in the NCP (except in Hebei Province) and FWP regions (Fig. 11c).
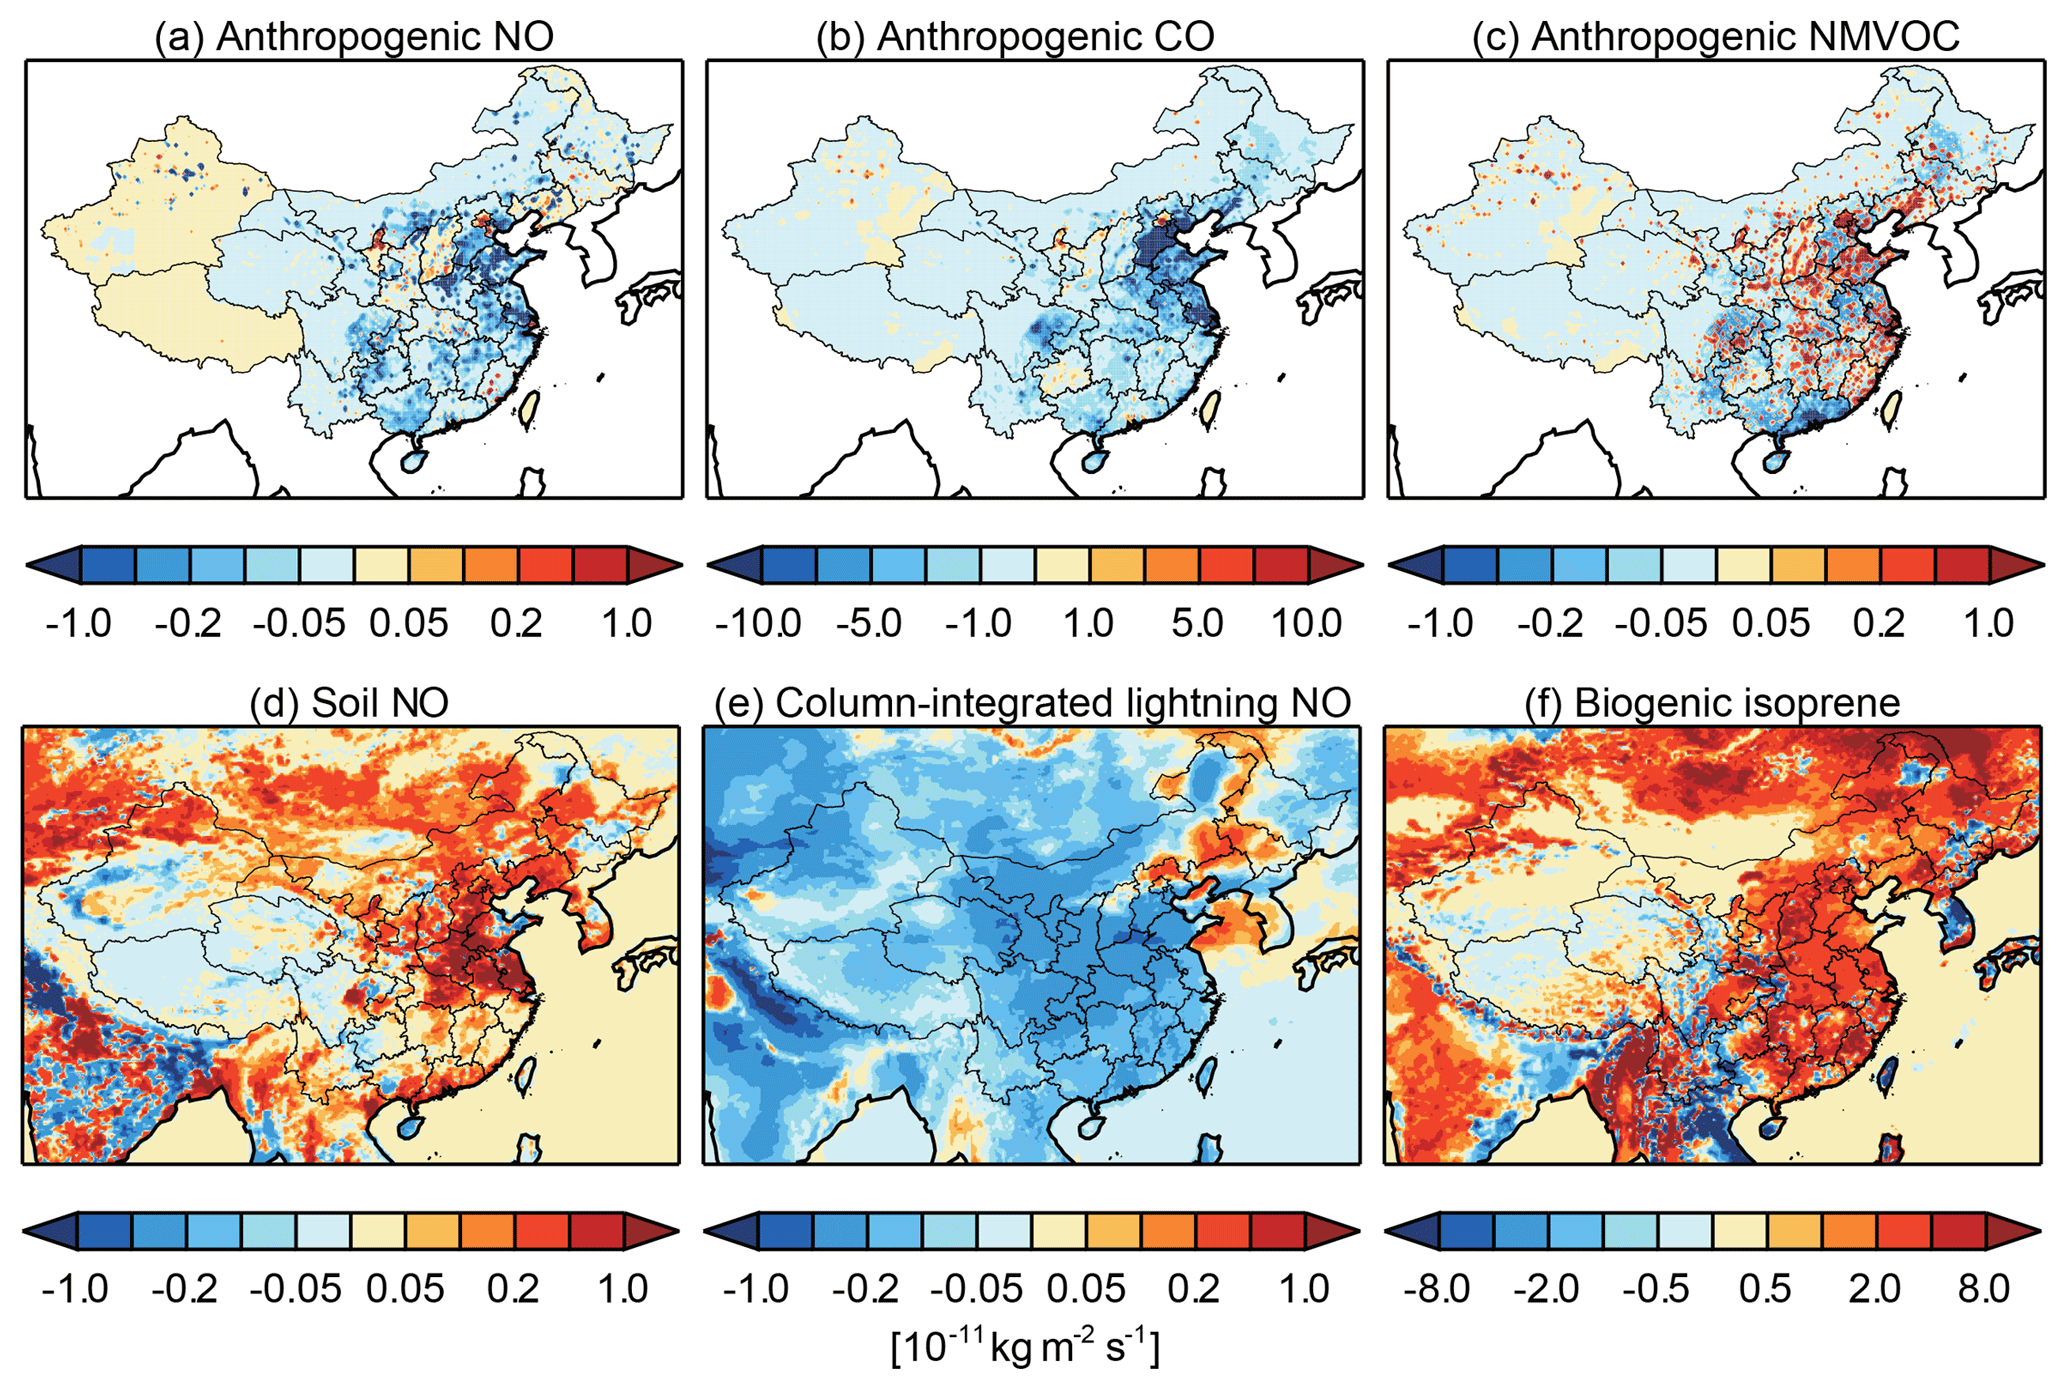
Figure 11Differences in May–August mean (a) anthropogenic NO emissions, (b) anthropogenic CO emissions, (c) anthropogenic NMVOC emissions, (d) soil NO emissions, (e) column-integrated lightning NO emissions, and (f) biogenic isoprene emissions between 2017 and 2016 (2017 minus 2016 conditions).
Figure 12 presents differences in May–August mean meteorological conditions between the 2 years. TMAX in central eastern China averaged for May–August is distinctly higher (> 2 K) in 2017 than 2016, together with drier air and more frequent clear sky as indicated by lower specific humidity and cloud cover fraction in 2017. Such warmer and drier weather conditions in 2017 are favorable for higher natural emissions of BVOCs and soil NOx. We can see that the model calculates larger biogenic isoprene (1.36 Tg larger) and soil NO (0.1 Tg larger) emissions in May–August 2017 than those in 2016 over China (Table 2), mainly over eastern China (Fig. 11d and f) following the spatial pattern of temperature differences. We find that regionally in eastern China the magnitude of soil NO emission enhancement exceeds the decrease in anthropogenic NO emissions, and their total changes over China are also comparable (Table 2). Lightning NOx emissions in 2017 are lower than those in 2016 (Fig. 11e).
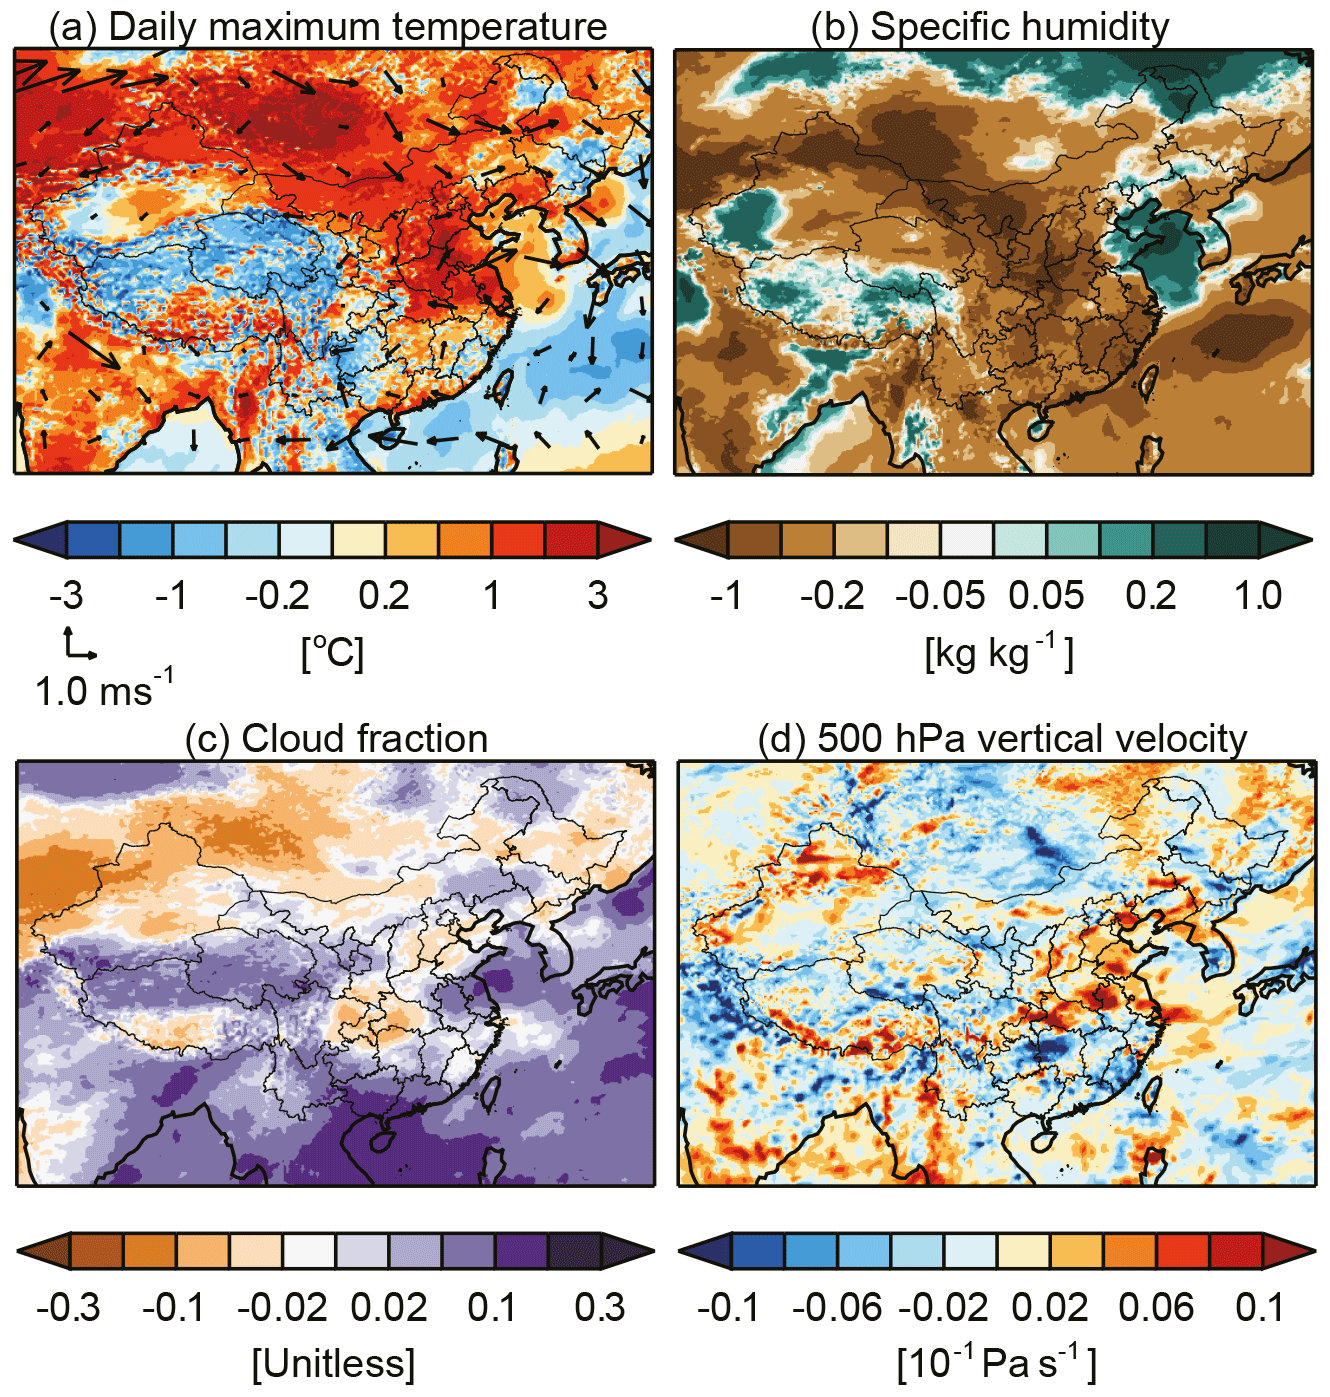
Figure 12Differences in May–August mean (a) daily maximum 2 m air temperature with 850 hPa wind vectors over-plotted, (b) specific humidity, (c) cloud cover faction, and (d) 500 hPa vertical velocity between 2017 and 2016.
We show in Fig. 13 the observed and simulated May–August mean surface MDA8 ozone differences between 2016 and 2017. Observed May–August mean surface ozone concentrations show significant increases in 2017 in the cities over central eastern China (Fig. 13a). The regional increases are 7.5±6.7 ppbv (mean ± standard deviation) averaged for NCP cities, 12.3±6.7 ppbv for YRD cities, and 12.2±12.2 ppbv for FWP cities. Several cities in PRD show ozone decreases during this period. Although the positive changes are widely distributed in eastern China, there are large variabilities among cities, indicating some local characteristics of ozone changes. Model results with year-specific meteorology and Chinese anthropogenic emissions successfully reproduce the pattern of ozone increases in central eastern China, yet the magnitudes (about 2–6 ppbv) are significantly lower than observations (Fig. 13a). This is likely due to the model limitations, as discussed in Sect. 3.1, and uncertainties in meteorological inputs and anthropogenic emissions. In western China and PRD cities, model results show that ozone decreases by about 2 ppbv in 2017 relative to 2016.

Figure 13Differences in May–August mean (a) observed (circles) and simulated (shaded) surface MDA8 ozone concentration, (b) background ozone, (c) domestic anthropogenic ozone contribution, (d) biogenic VOC ozone contribution, (e) soil NOx ozone contribution, and (f) lightning NOx ozone enhancement between 2017 and 2016.
Figure 13 also shows the surface ozone changes contributed from different sources as estimated by the model. We find that changes in background ozone alone lead to ozone increases in eastern China, particularly in the NCP, FWP, and YRD regions, and decreases in western China (Fig. 13b). The changes in background ozone concentrations are in good agreement with the changes in total ozone for both the spatial pattern and magnitude and are therefore identified as the main driver of surface ozone changes in 2017 from the 2016 levels. The changes in background ozone are entirely due to changes in meteorological conditions between the 2 years (except for slight increases in prescribed methane concentrations that are not addressed in the present study). By contrast, changes in domestic anthropogenic emissions generally lead to slight ozone decreases in central eastern China and in the PRD, except for some regions in the Shandong, Hubei, Fujian, and Sichuan provinces (Fig. 13c).
The higher background ozone concentrations in China in May–August 2017 than 2016 can be partly explained by higher contributions from natural sources. Figure 13d and e show that the larger emissions of biogenic VOCs and soil NOx driven by the warmer weather (Figs. 11–12) each could have enhanced surface ozone by 1–2 ppbv over central eastern China in 2017. We find that the soil ozone enhancements are more important in driving the surface ozone changes in northern Asia (e.g., Mongolia and Inner Mongolia), where ozone chemical regimes are highly NOx sensitive (Fig. S7), while both soil and biogenic emissions enhance surface ozone in central eastern China where ozone production is sensitive to both NOx and VOCs during May–August. In addition, the abnormal northwestern winds over Mongolia in 2017 (Fig. 12a) promote the transport of large meteorology-driven soil ozone enhancement to the NCP regions. Although lightning NOx emissions are smaller in 2017 than 2016, stronger subsidence in the lower troposphere (Fig. 12d) in 2017 allows for stronger transport of lightning-produced ozone from the middle–upper troposphere to the surface, contributing slightly higher surface ozone in the NCP and FWP regions by about 1 ppbv (Fig. 13f). This also leads to slightly higher stratospheric contributions to surface ozone by 0.6 ppbv in 2017.
Furthermore, changes in meteorology can alter tropospheric ozone by modulating the chemical kinetics as discussed in Sect. 3.4. The warmer and drier weather conditions in May–August 2017 are expected to accelerate ozone production rates and also favor the thermal decomposition of peroxyacetyl nitrate (PAN, a NOx reservoir species whose decomposition is strongly temperature dependent), providing additional NOx to produce ozone (Steiner et al., 2010; Doherty et al., 2013). This is evident from the lower background PAN concentrations (model results in noCH only reflect changes in meteorology) over eastern China simulated in 2017 (Fig. 14a), which follow the spatial pattern of higher temperature (Fig. 12a). Additional influences can come from changes in ozone dry deposition. The model parametrization of dry deposition includes suppression of the stomatal uptake of ozone and thus the suppression of ozone dry deposition due to the closure of stomata to protect plants from desiccation in warm air and soil temperature (typically > 293 K) (Wesely, 1989). We show in Fig. 14b that the ozone dry deposition velocities decrease by about 2–10 % in May–August 2017 compared to 2016, so more ozone can remain in the surface layer.
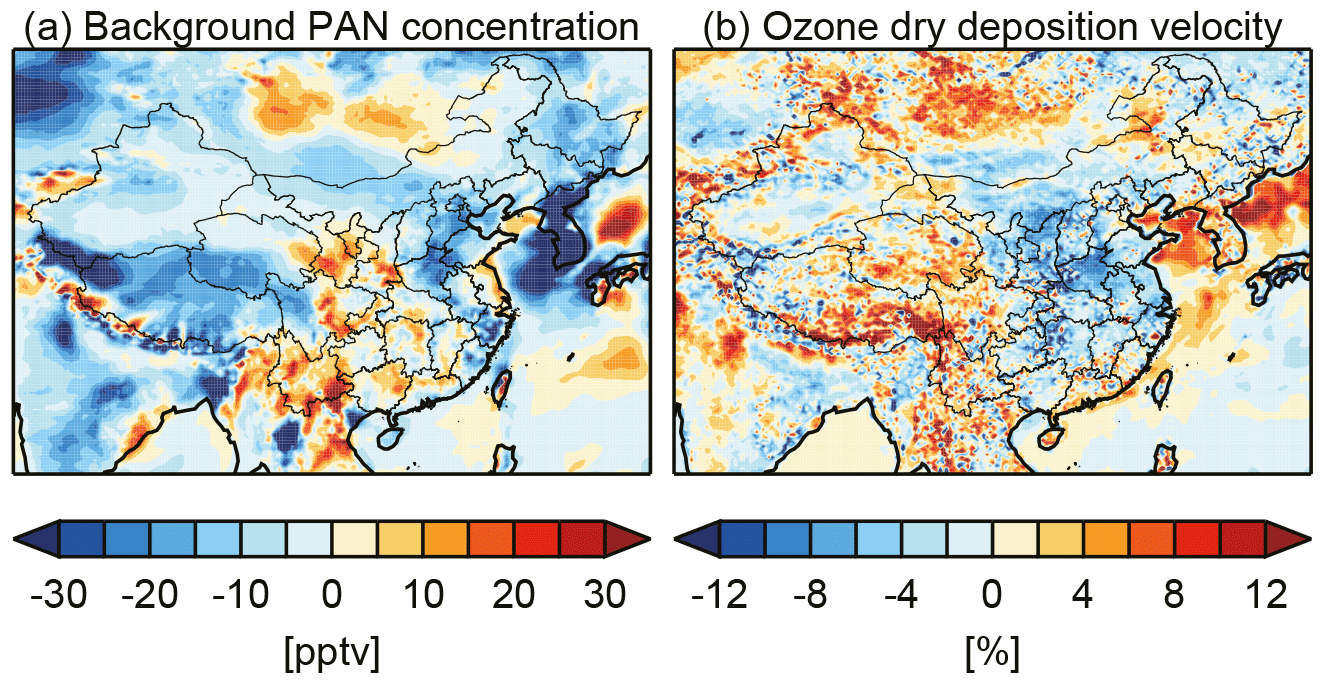
Figure 14Differences in May–August mean (a) background PAN concentration and (b) ozone dry deposition velocity between 2017 and 2016.
The changes in Chinese anthropogenic ozone as shown in Fig. 13c result from the combined effects of changes in domestic anthropogenic emissions and meteorological conditions. While the overall decreases in CH anthropogenic ozone mainly reflect decreasing anthropogenic NO emissions in 2017, the expected ozone reductions due to domestic anthropogenic emission controls may have been largely offset by the higher production rates and lower deposition velocities induced by meteorology as discussed above. Figure 13c also accounts for the impact of decreasing anthropogenic PM2.5 on ozone by affecting heterogeneous chemistry on the aerosol surface (i.e., reactive uptake of HO2, N2O5, NO2, and NO3) and photolysis rates (Lou et al., 2014; Li et al., 2019). A recent study by Li et al. (2019) shows that reducing PM2.5 levels by 30–50 µg m−3 (observed changes in 2017 compared to 2013), as well as the associated aerosol optical depths and surface areas in GEOS-Chem, leads to about 3–5 ppbv of ozone enhancement in eastern China. We find in Fig. S8 that modeled May–August mean anthropogenic PM2.5 levels decrease by about 4–10 µg m−3 in central eastern China in 2017 from 2016 levels, which may then lead to about 0.4–1 ppbv of ozone enhancement. The above results reflect strong interannual variability of ozone induced by changes in meteorological conditions and also indicate that more stringent emissions controls on ozone precursors are required in the summertime to attain the air quality standard under unfavorable weather conditions.
In this study, we have estimated the sources contributing to surface MDA8 ozone over China in 2016–2017 using the state-of-art GEOS-Chem CTM at the horizontal resolution with the latest Chinese anthropogenic emission inventory. These 2 years show the highest surface ozone concentrations in record over many major Chinese cities, and ozone increases are observed in most Chinese cities in 2017 compared to 2016. We show that with the latest anthropogenic emission inventory and high horizontal resolution, the model captures the spatial variability of surface ozone in Chinese cities well, particularly in the peak ozone season (May–August, r=0.81–0.82), with a small positive mean bias (6.6 ppbv), although it has some limitations in reproducing the large daily variability in individual cities.
We quantify the contributions from background, natural, and anthropogenic sources and examine their relative roles in driving MDA8 ozone changes. We find that at the national scale the model identifies large contributions from background sources to surface MDA8 ozone concentrations, i.e., 90 % (49.4 ppbv) in March–April and 80 % (44.5 ppbv) in May–August averaged over China, including large proportions from natural sources (80 % in March–April and 72 % in May–August). Further diagnosing the major natural sources affecting background ozone, we find that biogenic VOC emissions alone enhance surface MDA8 ozone by more than 15 ppbv over central eastern China in July–August, mainly driven by high temperature. Lightning and stratospheric contributions are large (together over 20 ppbv of ozone on average during springtime) in western China due to the high elevation and can also enhance ozone in northern China by over 8 ppbv. Their contributions to ground-level ozone are linked to large-scale vertical transport and are less important in summer than other seasons. Soil emissions can lead to surface ozone increases by more than 5 ppbv in northern China during May–August. Biomass burning emissions are an important ozone contributor in southwestern China (up to 10 ppbv in Yunnan Province) during March–April but have low ozone enhancements (less than 2 ppbv) in other regions. In general, we find higher background ozone concentrations in western and northern China during springtime (March–April) due to the combined effect of larger natural contributions from the stratosphere, lightning emissions, and higher ozone imported from foreign anthropogenic sources.
MDA8 ozone contributions from domestic anthropogenic sources are about 19.5 % (10.8 ppbv) in May–August and less than 15 % in other months averaged over China. For the NCP, YRD, and FWP city clusters, domestic anthropogenic contributions are, respectively, 23.0 %, 34.1 %, and 26.5 % averaged for March–October. The contributions increase to 30.7 % in the NCP, 43.1 % in the YRD, and 32.2 % in the FWP in May–August, reflecting the increasing importance of domestic anthropogenic contributions to urban surface ozone in peak ozone seasons. For the extremely high ozone episodes with simulated MDA8 ozone > 100 ppbv, domestic anthropogenic contributions reach 42.0±5.3 ppbv (41 %) in NCP, 39.1±4.8 ppbv (38 %) in FWP, 61.4±7.7 ppbv (58 %) in YRD, and 73.2±7.0 ppbv (69 %) in PRD. Our model would predict no days with MDA8 ozone > 80 ppbv in the absence of domestic anthropogenic emissions in all 169 major Chinese cities. We also find that day-to-day ozone evolution in Beijing, Shanghai, and Xi'an shows significant positive correlations with the daily maximum temperature, and such significant correlations are widespread over central eastern China. The high ozone episodes in these cities are typically associated with high temperature conditions, which cause intensive biogenic VOC emissions and accelerate ozone production from both background and anthropogenic sources.
We further examine the relative contributions from different sources to surface MDA8 ozone changes in May–August 2017 compared to 2016. The model successfully reproduces the MDA8 ozone increases over central eastern China by 2–5 ppbv, although it underestimates the absolute change compared to the observation. The model attributes the ozone increases to background ozone changes. Higher background ozone concentrations are found in 2017 driven by hotter and drier weather conditions, which accelerate ozone chemical production and increase ozone enhancements from both natural soil NOx and BVOC emissions by 1–2 ppbv. Additional impacts of the 2017 meteorology include increasing air subsidence (therefore enhancing lightning and stratospheric ozone contributions), increasing thermal decomposition of PAN, and decreasing ozone dry deposition velocity. The 2017–2016 changes in anthropogenic emissions would have decreased surface MDA8 ozone by about 1 ppbv over central eastern China and 2 ppbv in the PRD regions. Our results indicate that more stringent emission control measures on both NOx and NMVOCs are needed to reduce present-day surface ozone pollution over China, particularly on days and in years with unfavorable meteorological conditions.
The focus of this study is to understand the sources contributing to surface ozone over China at present-day (2016 and 2017) emission levels, and it does not address the nonlinear changes in source attribution and the effect on surface ozone when anthropogenic emissions levels change in the future. To further estimate the nonlinear response of ozone to changes in sources, we conduct an additional sensitivity simulation with Chinese domestic anthropogenic emissions reduced by 20 % in the model for July 2017. As shown in Fig. S9, compared to the zero-out method, the 20 % perturbation method estimates much lower domestic anthropogenic contributions (6.8 ppbv vs. 11.8 ppbv averaged over China in July 2017) with similar spatial distributions, which is consistent with Ni et al. (2018). Such strong nonlinear responses of ozone to precursor emissions in China reflect the fact that more stringent anthropogenic emission control measures are required to mitigate ozone pollution. Although the 2016–2017 period is warmer than 2013–2015 over most regions in China (Fig. S10), we do not see continuous increases in temperature over central eastern China from 2013 to 2017. This implies that temperature changes alone are not enough to explain the continuously increasing ozone trends in Chinese cities over 2013–2017 (Lu et al., 2018a). Other meteorological factors and modes, such as the summer monsoon (Yang et al., 2014; Lu et al., 2018b) and the West Pacific Subtropical High (Zhao et al., 2017), may also modulate the interannual variability of ozone over China. More modeling studies are still needed to better understand ozone changes over China in a longer time period and to evaluate emission control strategies.
The datasets, including measurements and model simulations, used in this study can be accessed by contacting the corresponding authors (Lin Zhang, zhanglg@pku.edu.cn; Xiao Lu, luxiao_atchem@pku.edu.cn).
The supplement related to this article is available online at: https://doi.org/10.5194/acp-19-8339-2019-supplement.
LZ and XL designed the study. XL performed model simulations and conducted data analysis with the assistance of YFC, MZ, BZ, KL, and YML. JTL and TMF assisted in the interpretation of the results. BZ and QZ provided the Chinese anthropogenic emissions inventories. XL and LZ wrote the paper. All authors contributed to the discussion and improvement of the paper.
The authors declare that they have no conflict of interest.
This work is supported by the National Key Research and Development Program of China (2017YFC0210102) and the National Natural Science Foundation of China (41475112).
This research has been supported by the National Key Research and Development Program of China (grant no. 2017YFC0210102) and the National Natural Science Foundation of China (grant no. 41475112).
This paper was edited by Dwayne Heard and reviewed by two anonymous referees.
Amos, H. M., Jacob, D. J., Holmes, C. D., Fisher, J. A., Wang, Q., Yantosca, R. M., Corbitt, E. S., Galarneau, E., Rutter, A. P., Gustin, M. S., Steffen, A., Schauer, J. J., Graydon, J. A., Louis, V. L. St., Talbot, R. W., Edgerton, E. S., Zhang, Y., and Sunderland, E. M.: Gas-particle partitioning of atmospheric Hg(II) and its effect on global mercury deposition, Atmos. Chem. Phys., 12, 591–603, https://doi.org/10.5194/acp-12-591-2012, 2012.
Bey, I., Jacob, D. J., Yantosca, R. M., Logan, J. A., Field, B. D., Fiore, A. M., Li, Q., Liu, H. Y., Mickley, L. J., and Schultz, M. G.: Global modeling of tropospheric chemistry with assimilated meteorology: Model description and evaluation, J. Geophys. Res., 106, 23073–23095, https://doi.org/10.1029/2001jd000807, 2001.
Bian, H. and Prather, M. J.: Fast-J2: Accurate Simulation of Stratospheric Photolysis in Global Chemical Models, J. Atmos. Chem., 41, 281–296, https://doi.org/10.1023/a:1014980619462, 2002.
Chen, D., Wang, Y., McElroy, M. B., He, K., Yantosca, R. M., and Le Sager, P.: Regional CO pollution and export in China simulated by the high-resolution nested-grid GEOS-Chem model, Atmos. Chem. Phys., 9, 3825–3839, https://doi.org/10.5194/acp-9-3825-2009, 2009.
Chen, X., Liu, Y., Lai, A., Han, S., Fan, Q., Wang, X., Ling, Z., Huang, F., and Fan, S.: Factors dominating 3-dimensional ozone distribution during high tropospheric ozone period, Environ. Pollut., 232, 55–64, https://doi.org/10.1016/j.envpol.2017.09.017, 2018.
Cheng, J., Su, J., Cui, T., Li, X., Dong, X., Sun, F., Yang, Y., Tong, D., Zheng, Y., Li, Y., Li, J., Zhang, Q., and He, K.: Dominant role of emission reduction in PM2.5 air quality improvement in Beijing during 2013–2017: a model-based decomposition analysis, Atmos. Chem. Phys., 19, 6125–6146, https://doi.org/10.5194/acp-19-6125-2019, 2019.
CNEMC: Monthly/quarterly Report of Air Quality of 74 Cities, China National Environmental Monitoring Centre, available at: http://www.mee.gov.cn/hjzl/dqhj/cskqzlzkyb/201809/P020180905326235405574.pdf (last access: 22 June 2019), 2018 (in Chinese).
Ding, A. J., Fu, C. B., Yang, X. Q., Sun, J. N., Zheng, L. F., Xie, Y. N., Herrmann, E., Nie, W., Petäjä, T., Kerminen, V.-M., and Kulmala, M.: Ozone and fine particle in the western Yangtze River Delta: an overview of 1 yr data at the SORPES station, Atmos. Chem. Phys., 13, 5813–5830, https://doi.org/10.5194/acp-13-5813-2013, 2013.
Doherty, R. M., Wild, O., Shindell, D. T., Zeng, G., MacKenzie, I. A., Collins, W. J., Fiore, A. M., Stevenson, D. S., Dentener, F. J., Schultz, M. G., Hess, P., Derwent, R. G., and Keating, T. J.: Impacts of climate change on surface ozone and intercontinental ozone pollution: A multi-model study, J. Geophys. Res., 118, 3744–3763, https://doi.org/10.1002/jgrd.50266, 2013.
Eastham, S. D. and Jacob, D. J.: Limits on the ability of global Eulerian models to resolve intercontinental transport of chemical plumes, Atmos. Chem. Phys., 17, 2543–2553, https://doi.org/10.5194/acp-17-2543-2017, 2017.
Fiore, A. M., West, J. J., Horowitz, L. W., Naik, V., and Schwarzkopf, M. D.: Characterizing the tropospheric ozone response to methane emission controls and the benefits to climate and air quality, J. Geophys. Res., 113, D08307, https://doi.org/10.1029/2007jd009162, 2008.
Fiore, A. M., Naik, V., Spracklen, D. V., Steiner, A., Unger, N., Prather, M., Bergmann, D., Cameron-Smith, P. J., Cionni, I., Collins, W. J., Dalsoren, S., Eyring, V., Folberth, G. A., Ginoux, P., Horowitz, L. W., Josse, B., Lamarque, J. F., MacKenzie, I. A., Nagashima, T., O'Connor, F. M., Righi, M., Rumbold, S. T., Shindell, D. T., Skeie, R. B., Sudo, K., Szopa, S., Takemura, T., and Zeng, G.: Global air quality and climate, Chem. Soc. Rev., 41, 6663–6683, https://doi.org/10.1039/c2cs35095e, 2012.
Fleming, Z. L., Doherty, R. M., Von Schneidemesser, E., Malley, C. S., Cooper, O. R., Pinto, J. P., Colette, A., Xu, X., Simpson, D., Schultz, M. G., Lefohn, A. S., Hamad, S., Moolla, R., Solberg, S., and Feng, Z.: Tropospheric Ozone Assessment Report: Present-day ozone distribution and trends relevant to human health, Elem. Sci. Anth., 6, p. 12, https://doi.org/10.1525/elementa.273, 2018.
Fu, T.-M., Zheng, Y., Paulot, F., Mao, J., and Yantosca, R. M.: Positive but variable sensitivity of August surface ozone to large-scale warming in the southeast United States, Nat. Clim. Change, 5, 454–458, https://doi.org/10.1038/nclimate2567, 2015.
Gao, M., Beig, G., Song, S., Zhang, H., Hu, J., Ying, Q., Liang, F., Liu, Y., Wang, H., Lu, X., Zhu, T., Carmichael, G. R., Nielsen, C. P., and McElroy, M. B.: The impact of power generation emissions on ambient PM2.5 pollution and human health in China and India, Environ. Int., 121, 250-259, https://doi.org/10.1016/j.envint.2018.09.015, 2018.
Guenther, A. B., Jiang, X., Heald, C. L., Sakulyanontvittaya, T., Duhl, T., Emmons, L. K., and Wang, X.: The Model of Emissions of Gases and Aerosols from Nature version 2.1 (MEGAN2.1): an extended and updated framework for modeling biogenic emissions, Geosci. Model Dev., 5, 1471–1492, https://doi.org/10.5194/gmd-5-1471-2012, 2012.
Hoesly, R. M., Smith, S. J., Feng, L., Klimont, Z., Janssens-Maenhout, G., Pitkanen, T., Seibert, J. J., Vu, L., Andres, R. J., Bolt, R. M., Bond, T. C., Dawidowski, L., Kholod, N., Kurokawa, J.-I., Li, M., Liu, L., Lu, Z., Moura, M. C. P., O'Rourke, P. R., and Zhang, Q.: Historical (1750–2014) anthropogenic emissions of reactive gases and aerosols from the Community Emissions Data System (CEDS), Geosci. Model Dev., 11, 369–408, https://doi.org/10.5194/gmd-11-369-2018, 2018.
HTAP: Hemispheric Transport of Air Pollution 2010 Executive Summary ECE/EB.AIR/2010/10 Corrected, United Nations, available at: http://www.htap.org/publications/2010_report/2010_Final_Report/EBMeeting2010.pdf (last access: 1 February 2015), 2010.
Hu, J., Li, X., Huang, L., Ying, Q., Zhang, Q., Zhao, B., Wang, S., and Zhang, H.: Ensemble prediction of air quality using the WRF/CMAQ model system for health effect studies in China, Atmos. Chem. Phys., 17, 13103–13118, https://doi.org/10.5194/acp-17-13103-2017, 2017.
Hudman, R. C., Jacob, D. J., Turquety, S., Leibensperger, E. M., Murray, L. T., Wu, S., Gilliland, A. B., Avery, M., Bertram, T. H., Brune, W., Cohen, R. C., Dibb, J. E., Flocke, F. M., Fried, A., Holloway, J., Neuman, J. A., Orville, R., Perring, A., Ren, X., Sachse, G. W., Singh, H. B., Swanson, A., and Wooldridge, P. J.: Surface and lightning sources of nitrogen oxides over the United States: Magnitudes, chemical evolution, and outflow, J. Geophys. Res., 112, D12S05, https://doi.org/10.1029/2006jd007912, 2007.
Hudman, R. C., Russell, A. R., Valin, L. C., and Cohen, R. C.: Interannual variability in soil nitric oxide emissions over the United States as viewed from space, Atmos. Chem. Phys., 10, 9943–9952, https://doi.org/10.5194/acp-10-9943-2010, 2010.
Hudman, R. C., Moore, N. E., Mebust, A. K., Martin, R. V., Russell, A. R., Valin, L. C., and Cohen, R. C.: Steps towards a mechanistic model of global soil nitric oxide emissions: implementation and space based-constraints, Atmos. Chem. Phys., 12, 7779–7795, https://doi.org/10.5194/acp-12-7779-2012, 2012.
Ito, A., Sillman, S., and Penner, J. E.: Global chemical transport model study of ozone response to changes in chemical kinetics and biogenic volatile organic compounds emissions due to increasing temperatures: Sensitivities to isoprene nitrate chemistry and grid resolution, J. Geophys. Res., 114, D09301, https://doi.org/10.1029/2008jd011254, 2009.
IUPAC: Task group on atmospheric chemical kinetic data evaluation by International Union of Pure and Applied Chemistry (IUPAC), available at: http://iupac.pole-ether.fr/ (last access: 22 June 2019), 2013.
Jacob, D. J. and Winner, D. A.: Effect of climate change on air quality, Atmos. Environ., 43, 51–63, https://doi.org/10.1016/j.atmosenv.2008.09.051, 2009.
Jaffe, D. A., Cooper, O. R., Fiore, A. M., Henderson, B. H., Tonnesen, G. S., Russell, A. G., Henze, D. K., Langford, A. O., Lin, M., and Moore, T.: Scientific assessment of background ozone over the U.S.: Implications for air quality management, Elem. Sci. Anth., 6, p. 56, https://doi.org/10.1525/elementa.309, 2018.
Jin, X. and Holloway, T.: Spatial and temporal variability of ozone sensitivity over China observed from the Ozone Monitoring Instrument, J. Geophys. Res., 120, 7229–7246, https://doi.org/10.1002/2015jd023250, 2015.
Keller, C. A., Long, M. S., Yantosca, R. M., Da Silva, A. M., Pawson, S., and Jacob, D. J.: HEMCO v1.0: a versatile, ESMF-compliant component for calculating emissions in atmospheric models, Geosci. Model Dev., 7, 1409–1417, https://doi.org/10.5194/gmd-7-1409-2014, 2014.
Kuhns, H., Knipping, E. M., and Vukovich, J. M.: Development of a United States–Mexico Emissions Inventory for the Big Bend Regional Aerosol and Visibility Observational (BRAVO) Study, J. Air Waste Manage., 55, 677–692, https://doi.org/10.1080/10473289.2005.10464648, 2005.
Lee, L., Teng, A. P., Wennberg, P. O., Crounse, J. D., and Cohen, R. C.: On rates and mechanisms of OH and O3 reactions with isoprene-derived hydroxy nitrates, J. Phys. Chem. A, 118, 1622–1637, https://doi.org/10.1021/jp4107603, 2014.
Li, M., Zhang, Q., Kurokawa, J.-I., Woo, J.-H., He, K., Lu, Z., Ohara, T., Song, Y., Streets, D. G., Carmichael, G. R., Cheng, Y., Hong, C., Huo, H., Jiang, X., Kang, S., Liu, F., Su, H., and Zheng, B.: MIX: a mosaic Asian anthropogenic emission inventory under the international collaboration framework of the MICS-Asia and HTAP, Atmos. Chem. Phys., 17, 935–963, https://doi.org/10.5194/acp-17-935-2017, 2017a.
Li, G., Bei, N., Cao, J., Wu, J., Long, X., Feng, T., Dai, W., Liu, S., Zhang, Q., and Tie, X.: Widespread and persistent ozone pollution in eastern China during the non-winter season of 2015: observations and source attributions, Atmos. Chem. Phys., 17, 2759–2774, https://doi.org/10.5194/acp-17-2759-2017, 2017b.
Li, K., Jacob, D. J., Liao, H., Shen, L., Zhang, Q., and Bates, K. H.: Anthropogenic drivers of 2013–2017 trends in summer surface ozone in China, P. Natl. Acad. Sci. USA, 116, 422–427, https://doi.org/10.1073/pnas.1812168116, 2019.
Li, M., Zhang, Q., Streets, D. G., He, K. B., Cheng, Y. F., Emmons, L. K., Huo, H., Kang, S. C., Lu, Z., Shao, M., Su, H., Yu, X., and Zhang, Y.: Mapping Asian anthropogenic emissions of non-methane volatile organic compounds to multiple chemical mechanisms, Atmos. Chem. Phys., 14, 5617–5638, https://doi.org/10.5194/acp-14-5617-2014, 2014.
Li, N., He, Q., Greenberg, J., Guenther, A., Li, J., Cao, J., Wang, J., Liao, H., Wang, Q., and Zhang, Q.: Impacts of biogenic and anthropogenic emissions on summertime ozone formation in the Guanzhong Basin, China, Atmos. Chem. Phys., 18, 7489–7507, https://doi.org/10.5194/acp-18-7489-2018, 2018a.
Li, S., Wang, T., Huang, X., Pu, X., Li, M., Chen, P., Yang, X.-Q., and Wang, M.: Impact of East Asian Summer Monsoon on Surface Ozone Pattern in China, J. Geophys. Res., 123, 1401–1411, https://doi.org/10.1002/2017jd027190, 2018b.
Lin, J.-T., Patten, K. O., Hayhoe, K., Liang, X. Z., and Wuebbles, D. J.: Effects of future climate and biogenic emissions changes on surface ozone over the United States and China, J. Appl. Meteorol. Clim., 47, 1888–1909, https://doi.org/10.1175/2007jamc1681.1, 2008.
Lin, J.-T. and McElroy, M. B.: Impacts of boundary layer mixing on pollutant vertical profiles in the lower troposphere: Implications to satellite remote sensing, Atmos. Environ., 44, 1726–1739, https://doi.org/10.1016/j.atmosenv.2010.02.009, 2010.
Lin, J.-T.: Satellite constraint for emissions of nitrogen oxides from anthropogenic, lightning and soil sources over East China on a high-resolution grid, Atmos. Chem. Phys., 12, 2881–2898, https://doi.org/10.5194/acp-12-2881-2012, 2012.
Liu, F., Zhang, Q., Tong, D., Zheng, B., Li, M., Huo, H., and He, K. B.: High-resolution inventory of technologies, activities, and emissions of coal-fired power plants in China from 1990 to 2010, Atmos. Chem. Phys., 15, 13299–13317, https://doi.org/10.5194/acp-15-13299-2015, 2015.
Liu, H., Jacob, D. J., Bey, I., and Yantosca, R. M.: Constraints from 210Pb and 7Be on wet deposition and transport in a global three-dimensional chemical tracer model driven by assimilated meteorological fields, J. Geophys. Res., 106, 12109–12128, https://doi.org/10.1029/2000jd900839, 2001.
Liu, H., Liu, S., Xue, B., Lv, Z., Meng, Z., Yang, X., Xue, T., Yu, Q., and He, K.: Ground-level ozone pollution and its health impacts in China, Atmos. Environ., 173, 223–230, https://doi.org/10.1016/j.atmosenv.2017.11.014, 2018.
Lou, S., Liao, H., and Zhu, B.: Impacts of aerosols on surface-layer ozone concentrations in China through heterogeneous reactions and changes in photolysis rates, Atmos. Environ., 85, 123–138, https://doi.org/10.1016/j.atmosenv.2013.12.004, 2014.
Lu, K., Zhang, Y., Su, H., Brauers, T., Chou, C. C., Hofzumahaus, A., Liu, S. C., Kita, K., Kondo, Y., Shao, M., Wahner, A., Wang, J., Wang, X., and Zhu, T.: Oxidant (O3 + NO2) production processes and formation regimes in Beijing, J. Geophys. Res., 115, D07303, https://doi.org/10.1029/2009jd012714, 2010.
Lu, X., Zhang, L., Yue, X., Zhang, J., Jaffe, D. A., Stohl, A., Zhao, Y., and Shao, J.: Wildfire influences on the variability and trend of summer surface ozone in the mountainous western United States, Atmos. Chem. Phys., 16, 14687–14702, https://doi.org/10.5194/acp-16-14687-2016, 2016.
Lu, X., Hong, J., Zhang, L., Cooper, O. R., Schultz, M. G., Xu, X., Wang, T., Gao, M., Zhao, Y., and Zhang, Y.: Severe Surface Ozone Pollution in China: A Global Perspective, Environ. Sci. Tech. Let., 5, 487–494, https://doi.org/10.1021/acs.estlett.8b00366, 2018a.
Lu, X., Zhang, L., Liu, X., Gao, M., Zhao, Y., and Shao, J.: Lower tropospheric ozone over India and its linkage to the South Asian monsoon, Atmos. Chem. Phys., 18, 3101–3118, https://doi.org/10.5194/acp-18-3101-2018, 2018b.
Lu, X., Zhang L., Zhao, Y., Jacob, D.J., Hu, L., Gao, M., Liu, X., Petropavlovskikh, I., McClure-Begley, A., and Querel, R.: Surface and tropospheric ozone trends in the Southern Hemisphere since 1990: possible linkages to poleward expansion of the Hadley Circulation, Sci. Bull., 64, 400–409, https://doi.org/10.1016/j.scib.2018.12.021, 2019.
Mao, J., Paulot, F., Jacob, D. J., Cohen, R. C., Crounse, J. D., Wennberg, P. O., Keller, C. A., Hudman, R. C., Barkley, M. P., and Horowitz, L. W.: Ozone and organic nitrates over the eastern United States: Sensitivity to isoprene chemistry, J. Geophys. Res., 118, 11256–11268, https://doi.org/10.1002/jgrd.50817, 2013.
Marais, E. A. and Wiedinmyer, C.: Air Quality Impact of Diffuse and Inefficient Combustion Emissions in Africa (DICE-Africa), Environ. Sci. Technol., 50, 10739–10745, https://doi.org/10.1021/acs.est.6b02602, 2016.
McDonald-Buller, E. C., Allen, D. T., Brown, N., Jacob, D. J., Jaffe, D., Kolb, C. E., Lefohn, A. S., Oltmans, S., Parrish, D. D., Yarwood, G., and Zhang, L.: Establishing Policy Relevant Background (PRB) Ozone Concentrations in the United States, Environ. Sci. Technol., 45, 9484–9497, https://doi.org/10.1021/es2022818, 2011.
McLinden, C. A., Olsen, S. C., Hannegan, B., Wild, O., Prather, M. J., and Sundet, J.: Stratospheric ozone in 3-D models: A simple chemistry and the cross-tropopause flux, J. Geophys. Res., 105, 14653–14665, https://doi.org/10.1029/2000jd900124, 2000.
Mo, Z., Shao, M., Wang, W., Liu, Y., Wang, M., and Lu, S.: Evaluation of biogenic isoprene emissions and their contribution to ozone formation by ground-based measurements in Beijing, China, Sci. Total Environ., 627, 1485–1494, https://doi.org/10.1016/j.scitotenv.2018.01.336, 2018.
Monks, P. S., Archibald, A. T., Colette, A., Cooper, O., Coyle, M., Derwent, R., Fowler, D., Granier, C., Law, K. S., Mills, G. E., Stevenson, D. S., Tarasova, O., Thouret, V., von Schneidemesser, E., Sommariva, R., Wild, O., and Williams, M. L.: Tropospheric ozone and its precursors from the urban to the global scale from air quality to short-lived climate forcer, Atmos. Chem. Phys., 15, 8889–8973, https://doi.org/10.5194/acp-15-8889-2015, 2015.
Moorthi, S. and Suarez, M. J.: Relaxed Arakawa-Schubert. A Parameterization of Moist Convection for General Circulation Models, Mon. Weather Rev., 120, 978–1002, 1992.
Murray, L.: Lightning NOx and Impacts on Air Quality, Current Pollution Reports, 2, 115–133, https://doi.org/10.1007/s40726-016-0031-7, 2016.
Murray, L. T., Jacob, D. J., Logan, J. A., Hudman, R. C., and Koshak, W. J.: Optimized regional and interannual variability of lightning in a global chemical transport model constrained by LIS/OTD satellite data, J. Geophys. Res., 117, D20307, https://doi.org/10.1029/2012jd017934, 2012.
Murray, L. T., Logan, J. A., and Jacob, D. J.: Interannual variability in tropical tropospheric ozone and OH: The role of lightning, J. Geophys. Res., 118, 11468–11480, https://doi.org/10.1002/jgrd.50857, 2013.
Ni, R., Lin, J., Yan, Y., and Lin, W.: Foreign and domestic contributions to springtime ozone over China, Atmos. Chem. Phys., 18, 11447–11469, https://doi.org/10.5194/acp-18-11447-2018, 2018.
Ott, L. E., Pickering, K. E., Stenchikov, G. L., Allen, D. J., DeCaria, A. J., Ridley, B., Lin, R. F., Lang, S., and Tao, W. K.: Production of lightning NOx and its vertical distribution calculated from three-dimensional cloud-scale chemical transport model simulations, J. Geophys. Res.-Atmos., 115, D04301, https://doi.org/10.1029/2009jd011880, 2010.
Park, R. J., Jacob, D. J., Field, B. D., Yantosca, R. M., and Chin, M.: Natural and transboundary pollution influences on sulfate-nitrate-ammonium aerosols in the United States: Implications for policy, J. Geophys. Res.-Atmos., 109, D15204, https://doi.org/10.1029/2003jd004473, 2004.
Paulot, F., Henze, D. K., and Wennberg, P. O.: Impact of the isoprene photochemical cascade on tropical ozone, Atmos. Chem. Phys., 12, 1307–1325, https://doi.org/10.5194/acp-12-1307-2012, 2012.
Price, C. and Rind, D.: A simple lightning parameterization for calculating global lightning distributions, J. Geophys. Res., 97, 9919–9933, https://doi.org/10.1029/92jd00719, 1992.
Pu, X., Wang, T. J., Huang, X., Melas, D., Zanis, P., Papanastasiou, D. K., and Poupkou, A.: Enhanced surface ozone during the heat wave of 2013 in Yangtze River Delta region, China, Sci. Total Environ., 603–604, 807–816, https://doi.org/10.1016/j.scitotenv.2017.03.056, 2017.
Ran, L., Zhao, C., Geng, F., Tie, X., Tang, X., Peng, L., Zhou, G., Yu, Q., Xu, J., and Guenther, A.: Ozone photochemical production in urban Shanghai, China: Analysis based on ground level observations, J. Geophys. Res., 114, D15301, https://doi.org/10.1029/2008jd010752, 2009.
Sander, S. P., Golden, D., Kurylo, M., Moortgat, G., Wine, P., Ravishankara, A., Kolb, C., Molina, M., Finlayson-Pitts, B., and Huie, R.: Chemical kinetics and photochemical data for use in atmospheric studies, JPL Publ., 06-2, 684 pp., 2011.
Shao, J., Chen, Q., Wang, Y., Lu, X., He, P., Sun, Y., Shah, V., Martin, R. V., Philip, S., Song, S., Zhao, Y., Xie, Z., Zhang, L., and Alexander, B.: Heterogeneous sulfate aerosol formation mechanisms during wintertime Chinese haze events: air quality model assessment using observations of sulfate oxygen isotopes in Beijing, Atmos. Chem. Phys., 19, 6107–6123, https://doi.org/10.5194/acp-19-6107-2019, 2019.
Shen, L., Jacob, D. J., Liu, X., Huang, G., Li, K., Liao, H., and Wang, T.: An evaluation of the ability of the Ozone Monitoring Instrument (OMI) to observe boundary layer ozone pollution across China: application to 2005–2017 ozone trends, Atmos. Chem. Phys., 19, 6551–6560, https://doi.org/10.5194/acp-19-6551-2019, 2019.
Steiner, A. L., Davis, A. J., Sillman, S., Owen, R. C., Michalak, A. M., and Fiore, A. M.: Observed suppression of ozone formation at extremely high temperatures due to chemical and biophysical feedbacks, P. Natl. Acad. Sci. USA, 107, 19685–19690, https://doi.org/10.1073/pnas.1008336107, 2010.
Stohl, A., Bonasoni, P., Cristofanelli, P., Collins, W., Feichter, J., Frank, A., Forster, C., Gerasopoulos, E., Gaggeler, H., James, P., Kentarchos, T., Kromp-Kolb, H., Kruger, B., Land, C., Meloen, J., Papayannis, A., Priller, A., Seibert, P., Sprenger, M., Roelofs, G. J., Scheel, H. E., Schnabel, C., Siegmund, P., Tobler, L., Trickl, T., Wernli, H., Wirth, V., Zanis, P., and Zerefos, C.: Stratosphere-troposphere exchange: A review, and what we have learned from STACCATO, J. Geophys. Res.-Atmos., 108, 8516, https://doi.org/10.1029/2002jd002490, 2003.
Tan, Z., Lu, K., Jiang, M., Su, R., Dong, H., Zeng, L., Xie, S., Tan, Q., and Zhang, Y.: Exploring ozone pollution in Chengdu, southwestern China: A case study from radical chemistry to O3-VOC-NOx sensitivity, Sci. Total Environ., 636, 775–786, https://doi.org/10.1016/j.scitotenv.2018.04.286, 2018a.
Tan, Z., Lu, K., Dong, H., Hu, M., Li, X., Liu, Y., Lu, S., Shao, M., Su, R., Wang, H., Wu, Y., Wahner, A., and Zhang, Y.: Explicit diagnosis of the local ozone production rate and the ozone-NOx-VOC sensitivities, Sci. Bull., 63, 1067–1076, https://doi.org/10.1016/j.scib.2018.07.001, 2018b.
Turner, M. C., Jerrett, M., Pope, C. A., Krewski, D., Gapstur, S. M., Diver, W. R., Beckerman, B. S., Marshall, J. D., Su, J., Crouse, D. L., and Burnett, R. T.: Long-Term Ozone Exposure and Mortality in a Large Prospective Study, Am. J. Respir. Crit. Care Med., 193, 1134–1142, https://doi.org/10.1164/rccm.201508-1633OC, 2016.
van der Werf, G. R., Randerson, J. T., Giglio, L., van Leeuwen, T. T., Chen, Y., Rogers, B. M., Mu, M., van Marle, M. J. E., Morton, D. C., Collatz, G. J., Yokelson, R. J., and Kasibhatla, P. S.: Global fire emissions estimates during 1997–2016, Earth Syst. Sci. Data, 9, 697–720, https://doi.org/10.5194/essd-9-697-2017, 2017.
Vinken, G. C. M., Boersma, K. F., Maasakkers, J. D., Adon, M., and Martin, R. V.: Worldwide biogenic soil NOx emissions inferred from OMI NO2 observations, Atmos. Chem. Phys., 14, 10363–10381, https://doi.org/10.5194/acp-14-10363-2014, 2014.
Wang, P., Chen, Y., Hu, J., Zhang, H., and Ying, Q.: Source apportionment of summertime ozone in China using a source-oriented chemical transport model, Atmos. Environ., 211, 79–90, https://doi.org/10.1016/j.atmosenv.2019.05.006, 2019.
Wang, T., Ding, A., Gao, J., and Wu, W. S.: Strong ozone production in urban plumes from Beijing, China, Geophys. Res. Lett., 33, L21806, https://doi.org/10.1029/2006gl027689, 2006.
Wang, T., Xue, L., Brimblecombe, P., Lam, Y. F., Li, L., and Zhang, L.: Ozone pollution in China: A review of concentrations, meteorological influences, chemical precursors, and effects, Sci. Total Environ., 575, 1582–1596, https://doi.org/10.1016/j.scitotenv.2016.10.081, 2017.
Wang, Y., Jacob, D. J., and Logan, J. A.: Global simulation of tropospheric O3-NOx-hydrocarbon chemistry: 3. Origin of tropospheric ozone and effects of nonmethane hydrocarbons, J. Geophys. Res., 103, 10757–10767, https://doi.org/10.1029/98jd00156, 1998.
Wang, Y., McElroy, M. B., Martin, R. V., Streets, D. G., Zhang, Q., and Fu, T.-M.: Seasonal variability of NOx emissions over east China constrained by satellite observations: Implications for combustion and microbial sources, J. Geophys. Res., 112, D06301, https://doi.org/10.1029/2006JD007538, 2007.
Wang, Y., Zhang, Y., Hao, J., and Luo, M.: Seasonal and spatial variability of surface ozone over China: contributions from background and domestic pollution, Atmos. Chem. Phys., 11, 3511–3525, https://doi.org/10.5194/acp-11-3511-2011, 2011.
Wesely, M. L.: Parameterization of Surface Resistances to Gaseous Dry Deposition in Regional-Scale Numerical-Models, Atmos. Environ., 23, 1293–1304, https://doi.org/10.1016/0004-6981(89)90153-4, 1989.
Wild, O. and Prather, M. J.: Global tropospheric ozone modeling: Quantifying errors due to grid resolution, J. Geophys. Res., 111, D11305, https://doi.org/10.1029/2005jd006605, 2006.
Xu, W., Xu, X., Lin, M., Lin, W., Tarasick, D., Tang, J., Ma, J., and Zheng, X.: Long-term trends of surface ozone and its influencing factors at the Mt Waliguan GAW station, China – Part 2: The roles of anthropogenic emissions and climate variability, Atmos. Chem. Phys., 18, 773–798, https://doi.org/10.5194/acp-18-773-2018, 2018.
Xue, L. K., Wang, T., Gao, J., Ding, A. J., Zhou, X. H., Blake, D. R., Wang, X. F., Saunders, S. M., Fan, S. J., Zuo, H. C., Zhang, Q. Z., and Wang, W. X.: Ground-level ozone in four Chinese cities: precursors, regional transport and heterogeneous processes, Atmos. Chem. Phys., 14, 13175–13188, https://doi.org/10.5194/acp-14-13175-2014, 2014.
Yang, Y., Liao, H., and Li, J.: Impacts of the East Asian summer monsoon on interannual variations of summertime surface-layer ozone concentrations over China, Atmos. Chem. Phys., 14, 6867–6879, https://doi.org/10.5194/acp-14-6867-2014, 2014.
Yang, Y., Smith, S. J., Wang, H., Lou, S., and Rasch, P. J.: Impact of Anthropogenic Emission Injection Height Uncertainty on Global Sulfur Dioxide and Aerosol Distribution, J. Geophys. Res., 124, 4812–4826, https://doi.org/10.1029/2018jd030001, 2019.
Yu, K., Jacob, D. J., Fisher, J. A., Kim, P. S., Marais, E. A., Miller, C. C., Travis, K. R., Zhu, L., Yantosca, R. M., Sulprizio, M. P., Cohen, R. C., Dibb, J. E., Fried, A., Mikoviny, T., Ryerson, T. B., Wennberg, P. O., and Wisthaler, A.: Sensitivity to grid resolution in the ability of a chemical transport model to simulate observed oxidant chemistry under high-isoprene conditions, Atmos. Chem. Phys., 16, 4369–4378, https://doi.org/10.5194/acp-16-4369-2016, 2016.
Young, P. J., Naik, V., Fiore, A. M., Gaudel, A., Guo, J., Lin, M. Y., Neu, J. L., Parrish, D. D., Rieder, H. E., Schnell, J. L., Tilmes, S., Wild, O., Zhang, L., Ziemke, J. R., Brandt, J., Delcloo, A., Doherty, R. M., Geels, C., Hegglin, M. I., Hu, L., Im, U., Kumar, R., Luhar, A., Murray, L., Plummer, D., Rodriguez, J., Saiz-Lopez, A., Schultz, M. G., Woodhouse, M. T., and Zeng, G.: Tropospheric Ozone Assessment Report: Assessment of global-scale model performance for global and regional ozone distributions, variability, and trends, Elem. Sci. Anth., 6, p. 10, https://doi.org/10.1525/elementa.265, 2018.
Zhang, L. M., Gong, S. L., Padro, J., and Barrie, L.: A size-segregated particle dry deposition scheme for an atmospheric aerosol module, Atmos. Environ., 35, 549–560, https://doi.org/10.1016/S1352-2310(00)00326-5, 2001.
Zhang, L., Jacob, D. J., Boersma, K. F., Jaffe, D. A., Olson, J. R., Bowman, K. W., Worden, J. R., Thompson, A. M., Avery, M. A., Cohen, R. C., Dibb, J. E., Flock, F. M., Fuelberg, H. E., Huey, L. G., McMillan, W. W., Singh, H. B., and Weinheimer, A. J.: Transpacific transport of ozone pollution and the effect of recent Asian emission increases on air quality in North America: an integrated analysis using satellite, aircraft, ozonesonde, and surface observations, Atmos. Chem. Phys., 8, 6117–6136, https://doi.org/10.5194/acp-8-6117-2008, 2008.
Zhang, L., Jacob, D. J., Downey, N. V., Wood, D. A., Blewitt, D., Carouge, C. C., van Donkelaar, A., Jones, D. B. A., Murray, L. T., and Wang, Y.: Improved estimate of the policy-relevant background ozone in the United States using the GEOS-Chem global model with horizontal resolution over North America, Atmos. Environ., 45, 6769–6776, https://doi.org/10.1016/j.atmosenv.2011.07.054, 2011.
Zhang, L., Jacob, D. J., Yue, X., Downey, N. V., Wood, D. A., and Blewitt, D.: Sources contributing to background surface ozone in the US Intermountain West, Atmos. Chem. Phys., 14, 5295–5309, https://doi.org/10.5194/acp-14-5295-2014, 2014.
Zhang, L., Shao, J., Lu, X., Zhao, Y., Hu, Y., Henze, D. K., Liao, H., Gong, S., and Zhang, Q.: Sources and Processes Affecting Fine Particulate Matter Pollution over North China: An Adjoint Analysis of the Beijing APEC Period, Environ. Sci. Technol., 50, 8731–8740, https://doi.org/10.1021/acs.est.6b03010, 2016.
Zhao, Z. and Wang, Y.: Influence of the West Pacific subtropical high on surface ozone daily variability in summertime over eastern China, Atmos. Environ., 170, 197–204, https://doi.org/10.1016/j.atmosenv.2017.09.024, 2017.
Zheng, B., Huo, H., Zhang, Q., Yao, Z. L., Wang, X. T., Yang, X. F., Liu, H., and He, K. B.: High-resolution mapping of vehicle emissions in China in 2008, Atmos. Chem. Phys., 14, 9787–9805, https://doi.org/10.5194/acp-14-9787-2014, 2014.
Zheng, B., Tong, D., Li, M., Liu, F., Hong, C., Geng, G., Li, H., Li, X., Peng, L., Qi, J., Yan, L., Zhang, Y., Zhao, H., Zheng, Y., He, K., and Zhang, Q.: Trends in China's anthropogenic emissions since 2010 as the consequence of clean air actions, Atmos. Chem. Phys., 18, 14095–14111, https://doi.org/10.5194/acp-18-14095-2018, 2018.
- Abstract
- Introduction
- Observations and model description
- Sources contributing to surface ozone pollution in China
- Factors contributing to the ozone increase from 2016 to 2017
- Discussion and conclusion
- Data availability
- Author contributions
- Competing interests
- Acknowledgements
- Financial support
- Review statement
- References
- Supplement