the Creative Commons Attribution 4.0 License.
the Creative Commons Attribution 4.0 License.
 | 27 Jun 2019
Contrail cirrus radiative forcing for future air traffic
Ulrike Burkhardt
The climate impact of air traffic is to a large degree caused by changes in cirrus cloudiness resulting from the formation of contrails. Contrail cirrus radiative forcing is expected to increase significantly over time due to the large projected increases in air traffic. We use ECHAM5-CCMod, an atmospheric climate model with an online contrail cirrus parameterization including a microphysical two-moment scheme, to investigate the climate impact of contrail cirrus for the year 2050. We take into account the predicted increase in air traffic volume, changes in propulsion efficiency and emissions, in particular soot emissions, and the modification of the contrail cirrus climate impact due to anthropogenic climate change.
Global contrail cirrus radiative forcing increases by a factor of 3 from 2006 to 2050, reaching 160 or even 180 mW m−2, which is the result of the increase in air traffic volume and a slight shift in air traffic towards higher altitudes. Large increases in contrail cirrus radiative forcing are expected over all of the main air traffic areas, but relative increases are largest over main air traffic areas over eastern Asia. The projected upward shift in air traffic attenuates contrail cirrus radiative forcing increases in the midlatitudes but reinforces it in the tropical areas. Climate change has an insignificant impact on global contrail cirrus radiative forcing, while regional changes are significant. Of the emission reductions it is the soot number emission reductions by 50 % that lead to a significant decrease in contrail cirrus optical depth and coverage, leading to a decrease in radiative forcing by approximately 15 %. The strong increase in contrail cirrus radiative forcing due to the projected increase in air traffic volume cannot be compensated for by the decrease in initial ice crystal numbers due to reduced soot emissions and improvements in propulsion efficiency.


Air traffic contributed approximately 5 % to the anthropogenic climate forcing in 2005 (Lee et al., 2009), and its contribution is rising due to the large yearly increases in air traffic (ICAO, 2007). Radiative forcing due to contrail cirrus, consisting of linear contrails and the cirrus clouds arising from them, is the largest known radiative forcing component associated with air traffic, and is larger than the contribution of CO2 accumulated from aviation (Burkhardt and Kärcher, 2011). Contrail cirrus are central for mitigation efforts due to their short lifetimes by, for example, varying flight level, path or timing, using alternative fuels, new engine designs or other technological advances (e.g. Noppel and Singh, 2007; Lee et al., 2010; Newinger and Burkhardt, 2012; Deuber et al., 2013; Burkhardt et al., 2018). Both their large climate impact and their suitability for mitigation underline the importance of investigating contrail cirrus for future air traffic scenarios.
The climate impact of contrail cirrus in the future is determined by a number of factors: the strength and geographic distribution of the increase in air traffic volume, improved fuel efficiency, changes in aircraft emissions when using alternative fuels and the change in the background atmospheric state due to future climate change. Several projections for future air traffic volume and its emissions exist. According to ICAO (2007) and Airbus (2007), the distance flow by passengers is expected to double roughly every 15 years. The air traffic inventory Aviation Environmental Design Tool (AEDT) (Wilkerson et al., 2010) estimates that in 2050 the air traffic volume will have quadrupled relative to the year 2006. The distribution of air traffic, as well as its future increase, is globally very uneven. In 2006, 93 % of aviation fuel was burned in the Northern Hemisphere and 69 % between 30 and 60∘ N. More than half of global aviation CO2 is emitted over three regions: the United States (26 %), Europe (15 %) and East Asia (11 %) (Wilkerson et al., 2010). Due to historically low air traffic densities in the tropics, the relative increases are expected to be much larger in the tropical areas than in the extratropics.
Lee et al. (2009) estimate that fuel usage is expected to increase between 2000 and 2050 by factors of 2.7 to 3.9, depending on the Intergovernmental Panel on Climate Change's Special Report on Emissions Scenarios (IPCC SRES) while AEDT estimates an increase by factors of 2.7 to 5 between 2006 and 2050 (Chen and Gettleman, 2016). Aerodynamic changes, weight reductions, more fuel efficient engines and an increased operational efficiency lead to increased overall fuel efficiency (Lee et al., 2009). ICAO (2007) expects a fuel efficiency improvement of 2 % yr−1 until 2050. Increasing fuel efficiency of engines leads to an increase in the contrail formation probability and contrail radiative forcing (Marquart et al., 2003).
Measurements behind aircraft (Beyersdorf et al., 2014; Moore et al., 2017) show that the combustion of an alternative fuel, a blend of Jet A and Fischer–Tropsch fuel, induces a decrease in the mass and number of soot particles. This results in a lower number of nucleated ice crystals (Kärcher and Yu, 2009; Kärcher et al., 2015) and in a higher survival rate of ice crystals during the contrails' vortex phase (Unterstrasser, 2016). The change in the ice crystal number after the vortex phase has an impact on the microphysical process rates and the evolution of contrail cirrus (Bier et al., 2017) with ice crystals growing to larger sizes and sedimentation initiated earlier in the life cycle. This leads eventually to a decrease in the mean optical depth and lifetime of contrail cirrus (Burkhardt et al., 2018). This is particularly important in large-scale and long-lived contrail cirrus clusters (Bier et al., 2017) which are responsible for a large part of the contrail cirrus radiative forcing (Burkhardt et al., 2018).
With climate change caused by increasing greenhouse gas concentrations, contrail cirrus formation and properties may change. The increase in temperature may lead to a lower contrail formation probability in particular in the tropics and in summer in the subtropics (Marquart et al., 2003). An increase in atmospheric water vapour concentration may lead to higher contrail cirrus ice water content and optical depths. A decrease in the ice supersaturation frequency (Irvine and Shine, 2015) may result in lower contrail cirrus coverage and associated radiative forcing.
The radiative forcing of line-shaped contrails (the contrails that have retained their initial line shape and are, therefore, easily distinguishable from natural clouds in satellite images) and contrail cirrus for the year 2050 have been studied in a number of publications. Minnis et al. (1999) estimate a radiative forcing due to line-shaped contrails for the year 2050 of 100 mW m−2 when assuming a constant visible optical depth of 0.3. In Marquart et al. (2003), line-shaped contrail radiative forcing increases from 2015 to 2050 by a factor of approximately 1.6, amounting to 15 mW m−2 in the year 2050, or after a suitable correction for a low bias in optical depth, to about 45 mW m−2 (Kärcher et al., 2010). For contrail cirrus comprising of line-shaped contrails and the clouds developing from them, Lee et al. (2009) scaled present-day radiative forcing estimates, from models and observations, to 2050 arriving at a range between 27 and 315 mW m−2 with no best estimate given. Chen and Gettelman (2016) studied the change in cirrus cloudiness due to contrail formation using a model in which contrail formation is treated as a source term for cirrus ice crystals and the microphysics parameterization is applied to a mix of contrail and natural cirrus ice crystals. They estimated that contrail cirrus radiative forcing increased by a factor of 7 from 2006 to 2050, reaching 87 mW m−2 in the year 2050, a factor that is approximately double the factor of increase in air traffic volume. They argued that this is caused by the non-uniform regional increase in air traffic and different sensitivities of contrail cirrus radiative forcing to an increased air traffic volume in different regions.
Our aim is to estimate contrail cirrus radiative forcing for the year 2050 globally and regionally, isolating changes due to the increase and upward shift in air traffic volume, due to climate change and due to changes caused by the use of alternative fuels and changes in the propulsion efficiency. We use the atmospheric general circulation model coupled with a contrail cirrus scheme, ECHAM5-CCMod (Bock and Burkhardt, 2016a; Sect. 2.1), which treats contrail cirrus as an independent cloud class. The model simulates the whole life cycle of contrail cirrus and resolves the competition of the two cloud classes, natural clouds and aircraft-induced clouds, for water vapour. We apply ECHAM5-CCMod to future aviation emission scenarios from the AEDT inventory (Sect. 2.2) and estimate contrail cirrus coverage, optical depth and radiative forcing for air traffic for the year 2050 (Sect. 3). Discussion and conclusions are given in Sects. 4 and 5.
2.1 CCMod in ECHAM5
We use a contrail cirrus scheme developed for ECHAM5 (Bock et al., 2016a) which is based on the contrail scheme of Burkhardt and Kaercher (2009) and the two-moment microphysical scheme of Lohmann et al. (2008). The scheme introduces a new cloud class, contrail cirrus, in the ECHAM5-HAM model (Roeckner et al., 2003; Stier et al., 2005) with contrail cirrus modifying the atmospheric heat and water budget, thus feeding back on natural clouds (Burkhardt and Kärcher, 2011). The prognostic variables in the parameterization are contrail cirrus cover, volume and length, ice water content and ice crystal number concentration. Contrail cirrus properties change due to the following parameterized processes: contrail formation, contrail cirrus volume growth due to turbulent diffusion and sedimentation, contrail spreading due to vertical wind shear, water vapour deposition and sublimation on contrail ice crystals, contrail ice crystal sedimentation and precipitation and indirectly due to contrail-induced changes in the diabatic heating rates. Contrail cirrus form according to the Schmidt–Appleman criterion (Schumann, 1996) and persist in ice supersaturated regions which are parameterized in the model (Burkhardt et al., 2008; Lamquin et al., 2012). Contrail cirrus are initialized with the air traffic density (distance per grid box) and water vapour emissions prescribed by an air traffic inventory, and with an ice crystal number concentration and a contrail cross-sectional area inferred from observations (Bock and Burkhardt, 2016a. If persistent, contrails spread and accumulate more ice from ambient water vapour as long as supersaturation prevails. Contrail cirrus gradually vanish through ice crystal sedimentation into subsaturated areas and through sublimation. Hence, the whole life cycle of contrail cirrus is simulated.
We calculate total contrail cirrus coverage assuming a maximum random overlap of contrail cirrus in the vertical for each column (Burkhardt and Kärcher, 2011). This implies that contrail cirrus coverage above or below other cirrus overlaps maximally, whereas contrail cirrus that are vertically separated from other cirrus by cloud-free air overlap randomly. We estimate the stratosphere-adjusted radiative forcing that is the change in the radiation flux at the top of the atmosphere after the stratosphere has reached a new radiative balance (Hansen et al., 1997).
2.2 Inventory
The gridded aviation emissions database, developed at the Volpe National Transportation Systems Center using the U.S. Federal Aviation Administration's Aviation Environmental Design Tool (AEDT) (Roof et al., 2007; Barrett et al., 2010), is composed of one base case for the year 2006 (2006), which has been compared against other aviation emissions data sets (Wilkerson et al., 2010), and two future 2050 scenarios. The latter include the projected increase in air traffic (2050 Baseline), which is based on the IPCC FESG (Forecasting and Economic Analysis Sub-group) consensus demand forecast (ICAO/FESG, 1998) and additionally an increase in fuel efficiency by 2 % yr−1 (2050 Scenario 1). As fuel burn increases by a factor of 4.8 between 2006 to 2050 Baseline and still by a factor of 2.7 between 2006 and 2050 Scenario 1 (Unger et al., 2013), the specifications of the future projections do not meet the requirements of the international CORSIA agreement unless the remaining necessary CO2 emission reductions are introduced purely by carbon offsetting.
The AEDT flight inventory that we use in our model has originally a horizontal resolution with 30 vertical levels, transformed with a recursive discretization method (Jöckel, 2006) to our model resolution. We use inventory data of air traffic density (distance per grid box) and water vapour emissions to initialize contrails in the model. The flight path distance for 2050 Baseline and 2050 Scenario 1 is only provided as monthly mean aggregated ground projected path distance per grid cell (track distance). Therefore, we could not use the 3-D flight path distance per grid cell (slant distance) as in Bock and Burkhardt (2016b), which results in an underestimation of the initial volume and ice crystal number of contrails, and therefore in an underestimation of the total contrail cirrus radiative forcing (Bock and Burkhardt, 2016b). But we scale the resulting radiative forcing estimates using a factor calculated from radiative forcing for contrail cirrus when using slant distance and using track distance for the year 2006 (Bock and Burkhardt, 2016b).
Flight distance is expected to increase between 2006 and 2050 by approximately a factor of 4 (Table 1). Due to changes in aviation technologies, flight altitudes are expected to shift upwards by between 0.3 and 1.5 km (Mohan Gupta, personal communication, FAA, 2015), resulting in the shift to maximum flight density as seen in Fig. 1a. In 2006 air traffic is heaviest at about 240 hPa, whereas in 2050 air traffic is predicted to be heaviest at about 200 hPa. The regional distribution of air traffic for 2050 is expected to remain close to the distribution for 2006 with main air traffic maxima over Europe and the US (Fig. 1c). In addition to those air traffic maxima, air traffic over eastern and southeastern Asia is strongly increased. Maxima in zonal mean aircraft density remain between 30 and 50∘ N (Fig. 1b).
Table 1Overview over the model simulations. Air traffic distance is given as ground projected track distance. Coverage is given for all contrail cirrus and visible (visible optical depth >0.05) contrail cirrus only is given in brackets (Bock and Burkhardt, 2016b). The radiative forcing is given for track distance and slant distance (see Sect. 2.2) in brackets. Asterisks mark extrapolated values calculated with the factor resulting from the radiative forcing in 2006 associated with air traffic volume using slant distance and track distance (Bock and Burkhardt, 2016b).


Figure 1Vertical (a) and zonal (b) distribution of total annual flight distance and (c) horizontal distribution of vertically integrated air traffic density (km m−2 s−1) for the years (c) 2006 and (d) 2050.
2.3 Simulation setup
We have performed the following simulations:
-
a control simulation for the air traffic of 2006 (simulation C2006-T06)
-
a simulation with increased air traffic according to the AEDT projection of air traffic for the year 2050 (simulation C2006-T50)
-
a simulation that additionally accounts for a changed background climate in 2050 (simulation C2050-T50)
-
a simulation that considers additionally an increase in fuel and propulsion efficiency as well as a change in emissions connected with the use of renewable alternative fuel, in particular a reduction in soot emissions by 50 % and a slight increase in the water emission coefficient connected with the use of alternative fuels (simulation C2050-T50M).
The specifications for the different simulations are summarized in Table 1.
All simulations were performed over 5 years with ECHAM5-CCMod at T42L41 resolution with a time step of 15 min. The CO2 mixing ratio is prescribed for the respective base year (381 ppm for the year 2006 and 478 ppm for the year 2050 following the Representative Concentration Pathway 6.0; RCP6.0.) (Meinshausen et al., 2011). The annual cycle of sea surface temperature and sea ice concentration was taken from the Atmospheric Model Intercomparison Project (AMIP II) database for the year 2006 and from simulations with the Hadley Centre Global Environmental Model version 2 – Earth System (HadGEM2-ES) (Jones et al., 2011) following the Representative Concentration Pathway (RCP) 6.0 for the year 2050. Other than that, emissions and boundary data are not changed. In order to calculate the contrail formation criterion we prescribe the emission index of water vapour to be 1.21 kg H2O per kilogramme fuel and the combustion heat 43×106 J kg−1 (Chen et al., 2012). The radiation scheme is called every half hour calculating radiative transfer with and without contrail cirrus (see Bock and Burkhardt, 2016b, for details).
Using alternative aviation fuels reduces soot emissions in terms of mass as well as of particle number (Moore et al., 2015, 2017). This in turn leads to a reduction in ice crystal nucleation within contrails (Kärcher et al., 2015) and to a reduction in the ice crystal loss in the vortex phase (Unterstrasser, 2016). Additionally, using alternative fuels causes a slight increase of the water emission coefficient by 15 % (Moore et al., 2017). In our study we initialize contrails at a contrail age of ∼7 min with a contrail cross-sectional area of 200 m×200 m and an ice crystal number concentration of 150 cm−3, a value derived from in situ measurements of young contrails after the vortex phase (Bock and Burkhardt, 2016a), neglecting the variability due to the influence of the atmospheric state on ice crystal nucleation and ice crystal loss within the contrail's vortex phase. In simulation 2050 Scenario 1 we assume that a 50 % reduction in soot emissions causes a 50 % reduction in the initial ice crystal number.
We analyse the change in contrail cirrus properties in different areas defining four equally sized regions of high air traffic density, US–Mexico (20–45∘ N, 235–290∘ E), Europe (35–70∘ N, 20∘ W–35∘ E), South East Asia–India (10∘ S–20∘ N, 70–110∘ E) and eastern China–Japan (20–45∘ N, 95–150∘ E). Additionally two latitude bands (with different areal coverage) representing different background climate conditions, the tropics (0–30∘ N) and midlatitudes (40–70∘ N) (see Fig. 1c and d) are compared.
In this section we describe the change in simulated contrail cirrus properties and radiative forcing prescribing air traffic for the years 2006 and 2050. We distinguish between changes resulting only from the increase in air traffic and its upward shift, and from increasing air traffic within a changed climate state. Finally we discuss an additional change in propulsion efficiency and aircraft emissions.
3.1 Air traffic for the year 2006
Our simulation for the year 2006, which we use as a reference, has already been described in detail in Bock and Burkhardt (2016b). Differences between the simulation presented here and in Bock and Burkhardt (2016b) are due to the fact that we use here track distance as a measure for aircraft flight movements (Sect. 2.2). Using the 3-D flight path distance per grid cell (slant distance) instead of the ground-projected distance (track distance) leads to an increase in global air traffic volume by 1.8, with increases being largest at lower levels and over Europe and North America. The radiative forcing due to air traffic in the year 2006 using the ground projected estimate for air traffic distance amounts to approximately 49 mW m−2 (Fig. 2; see also Bock and Burkhardt, 2016b, Table 1), whereas the radiative forcing estimate using slant distance is larger by a factor of 1.14 (Bock and Burkhardt, 2016b).
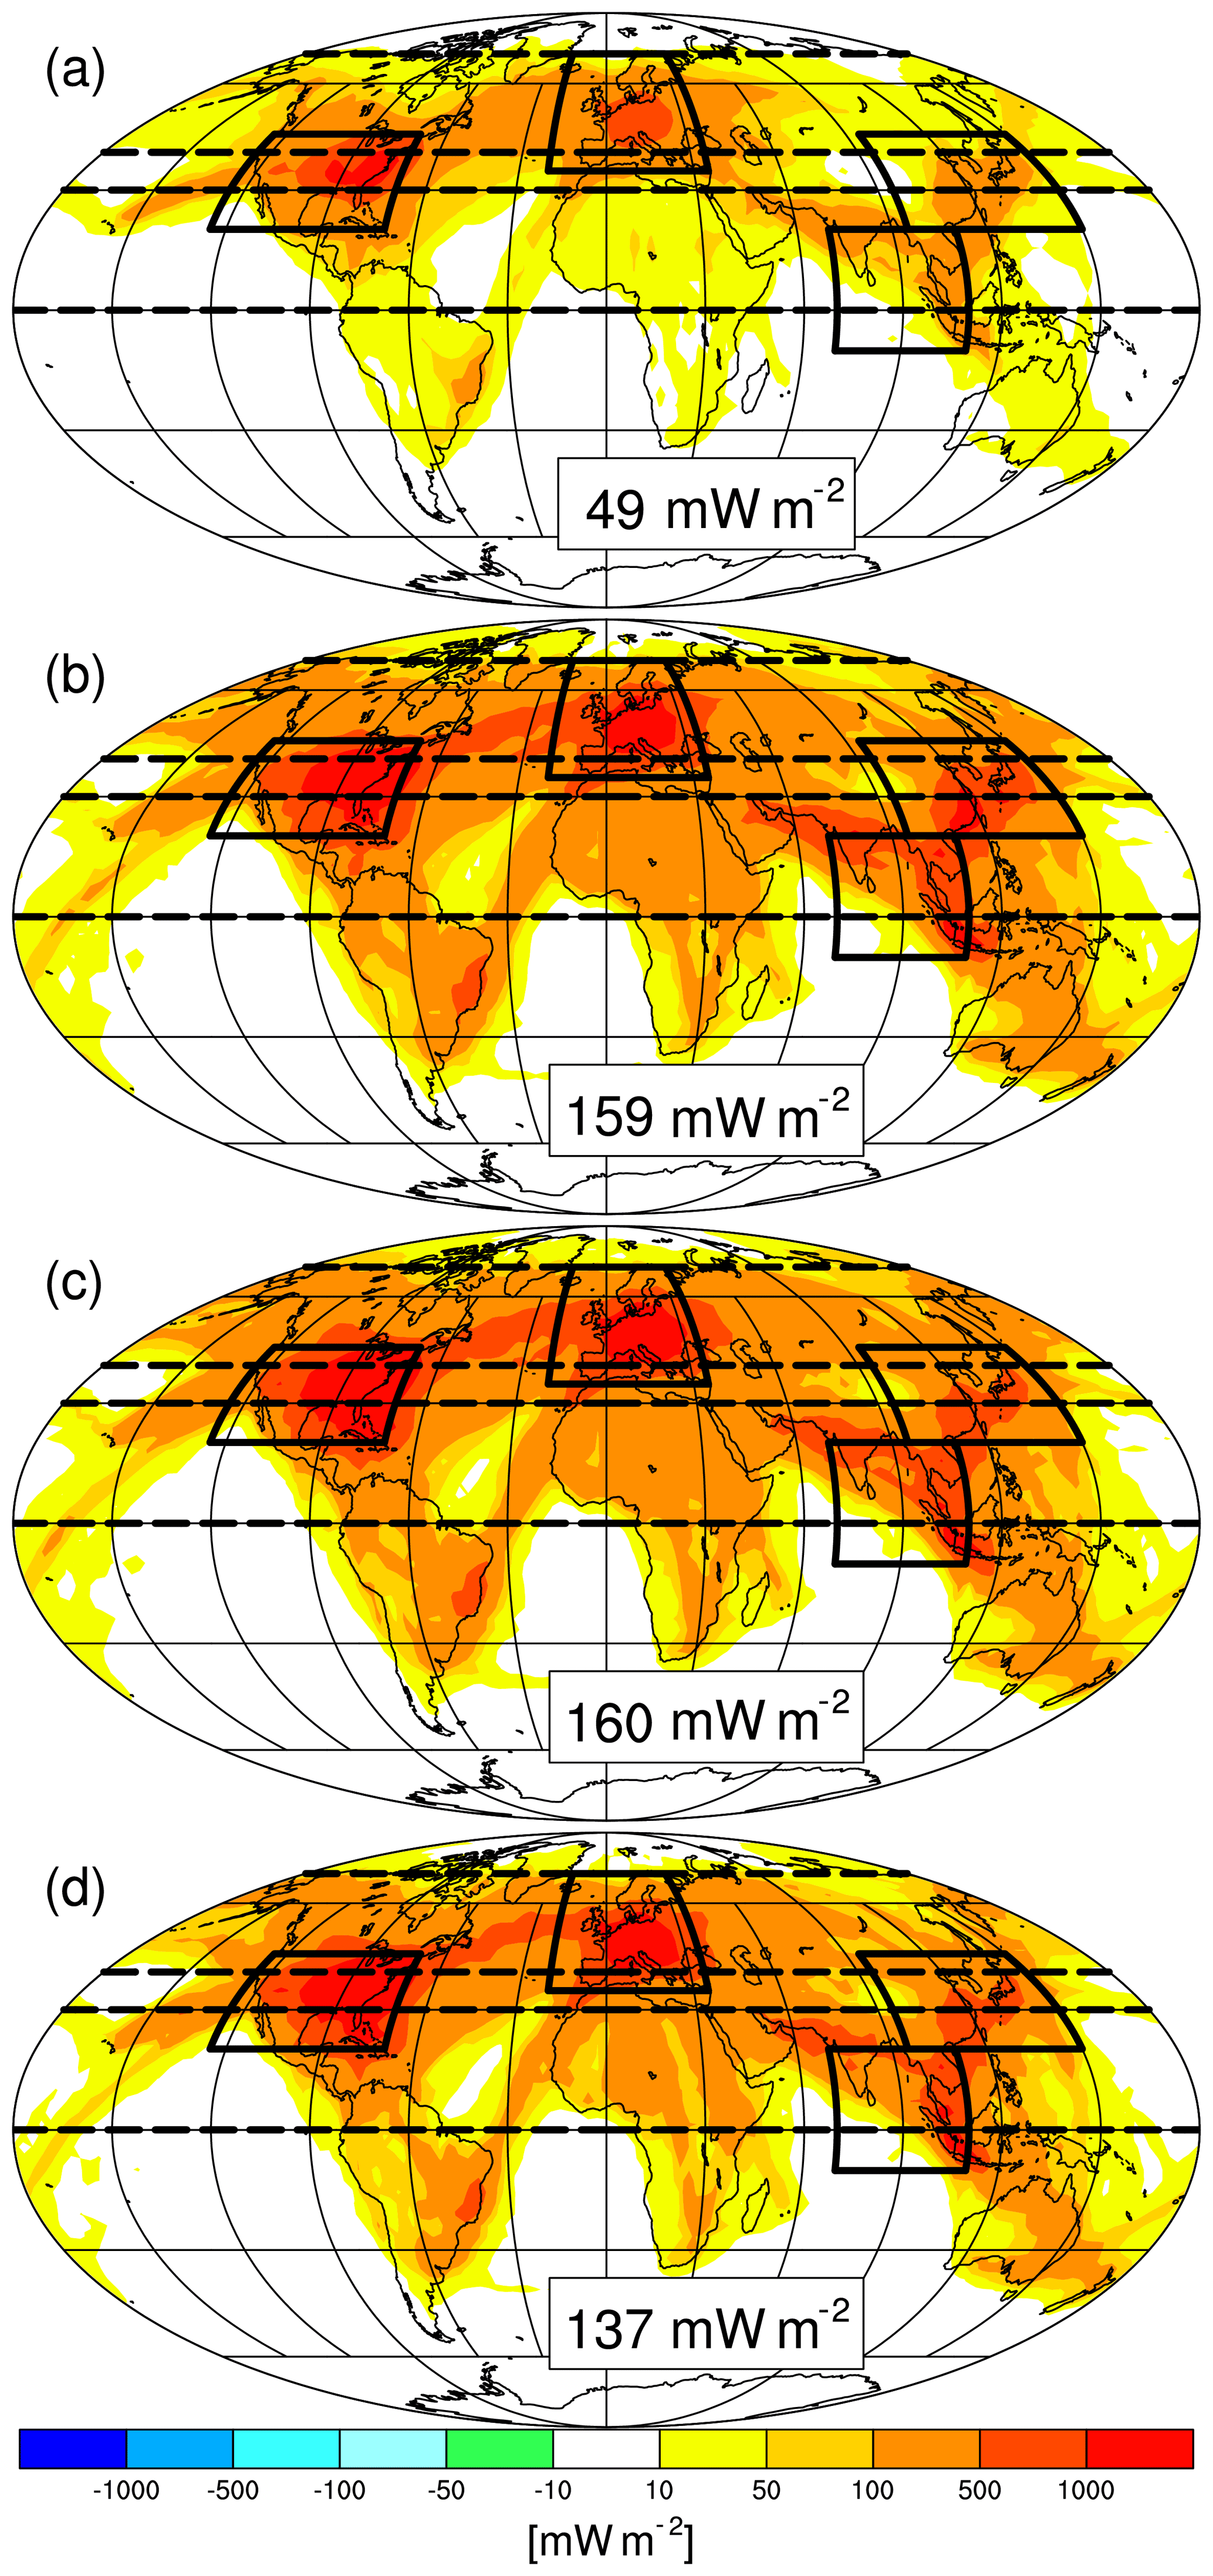
Figure 2Radiative forcing in scenarios C2006-T06 (a), C2006-T50 (b), C2050-T50 (c) and C2050-T50M (d). Boxes (solid lines) and latitude bands (dashed lines) indicate regions (defined in Sect. 2.3) which we compare in Figs. 3 and 4.
Of the four equally sized air traffic areas indicated in Figs. 1c and 2, flight density is largest over the US–Mexico area and second largest over Europe for the year 2006 (Fig. 3a). Consistently, the maxima of contrail cirrus coverage are over the US–Mexico area and Europe (Fig. 4d). The contribution to global contrail cirrus radiative forcing is largest from these two regions and amounts to 27 % and 18 %, respectively (Fig. 3b). Contrail cirrus radiative forcing per flight distance is significantly larger over Europe than over the US–Mexico area, and optical depth is larger over the US–Mexico area (Fig. 4e and f). This is in agreement with the fact that a large portion of the contrail cirrus coverage over Europe is due to aged contrail cirrus reinforced by contrail cirrus transported into Europe from the Atlantic air traffic corridor. The contribution of contrail cirrus radiative forcing from the South East Asia–India region to global mean radiative forcing is low (Fig. 3b), about 5 %, but relative to the air traffic distance flown in the area very high (Fig. 3c). In this area the ice supersaturation frequency is very high (Lamquin et al., 2012), leading to a high probability of contrail formation, and the amount of water vapour available for deposition is large, leading to a high optical depth (Fig. 4e and f; Bock and Burkhardt, 2016b). It needs to be pointed out that contrail optical depth is likely overestimated in the tropics, since in the tropics contrails form within a few degrees of the temperature threshold (Schmidt–Appleman criterion), limiting ice nucleation in the contrail (Bier and Burkhardt, 2019), a process that is not resolved in our simulations (Sect. 2.3). Therefore optical depth and lifetimes of contrails will be overestimated (Burkhardt et al., 2018) and consequently radiative forcing will be overestimated. On average, ice supersaturation frequencies (not shown) and contrail cirrus radiative forcing are in the whole tropical belt smaller than over South East Asia–India region.
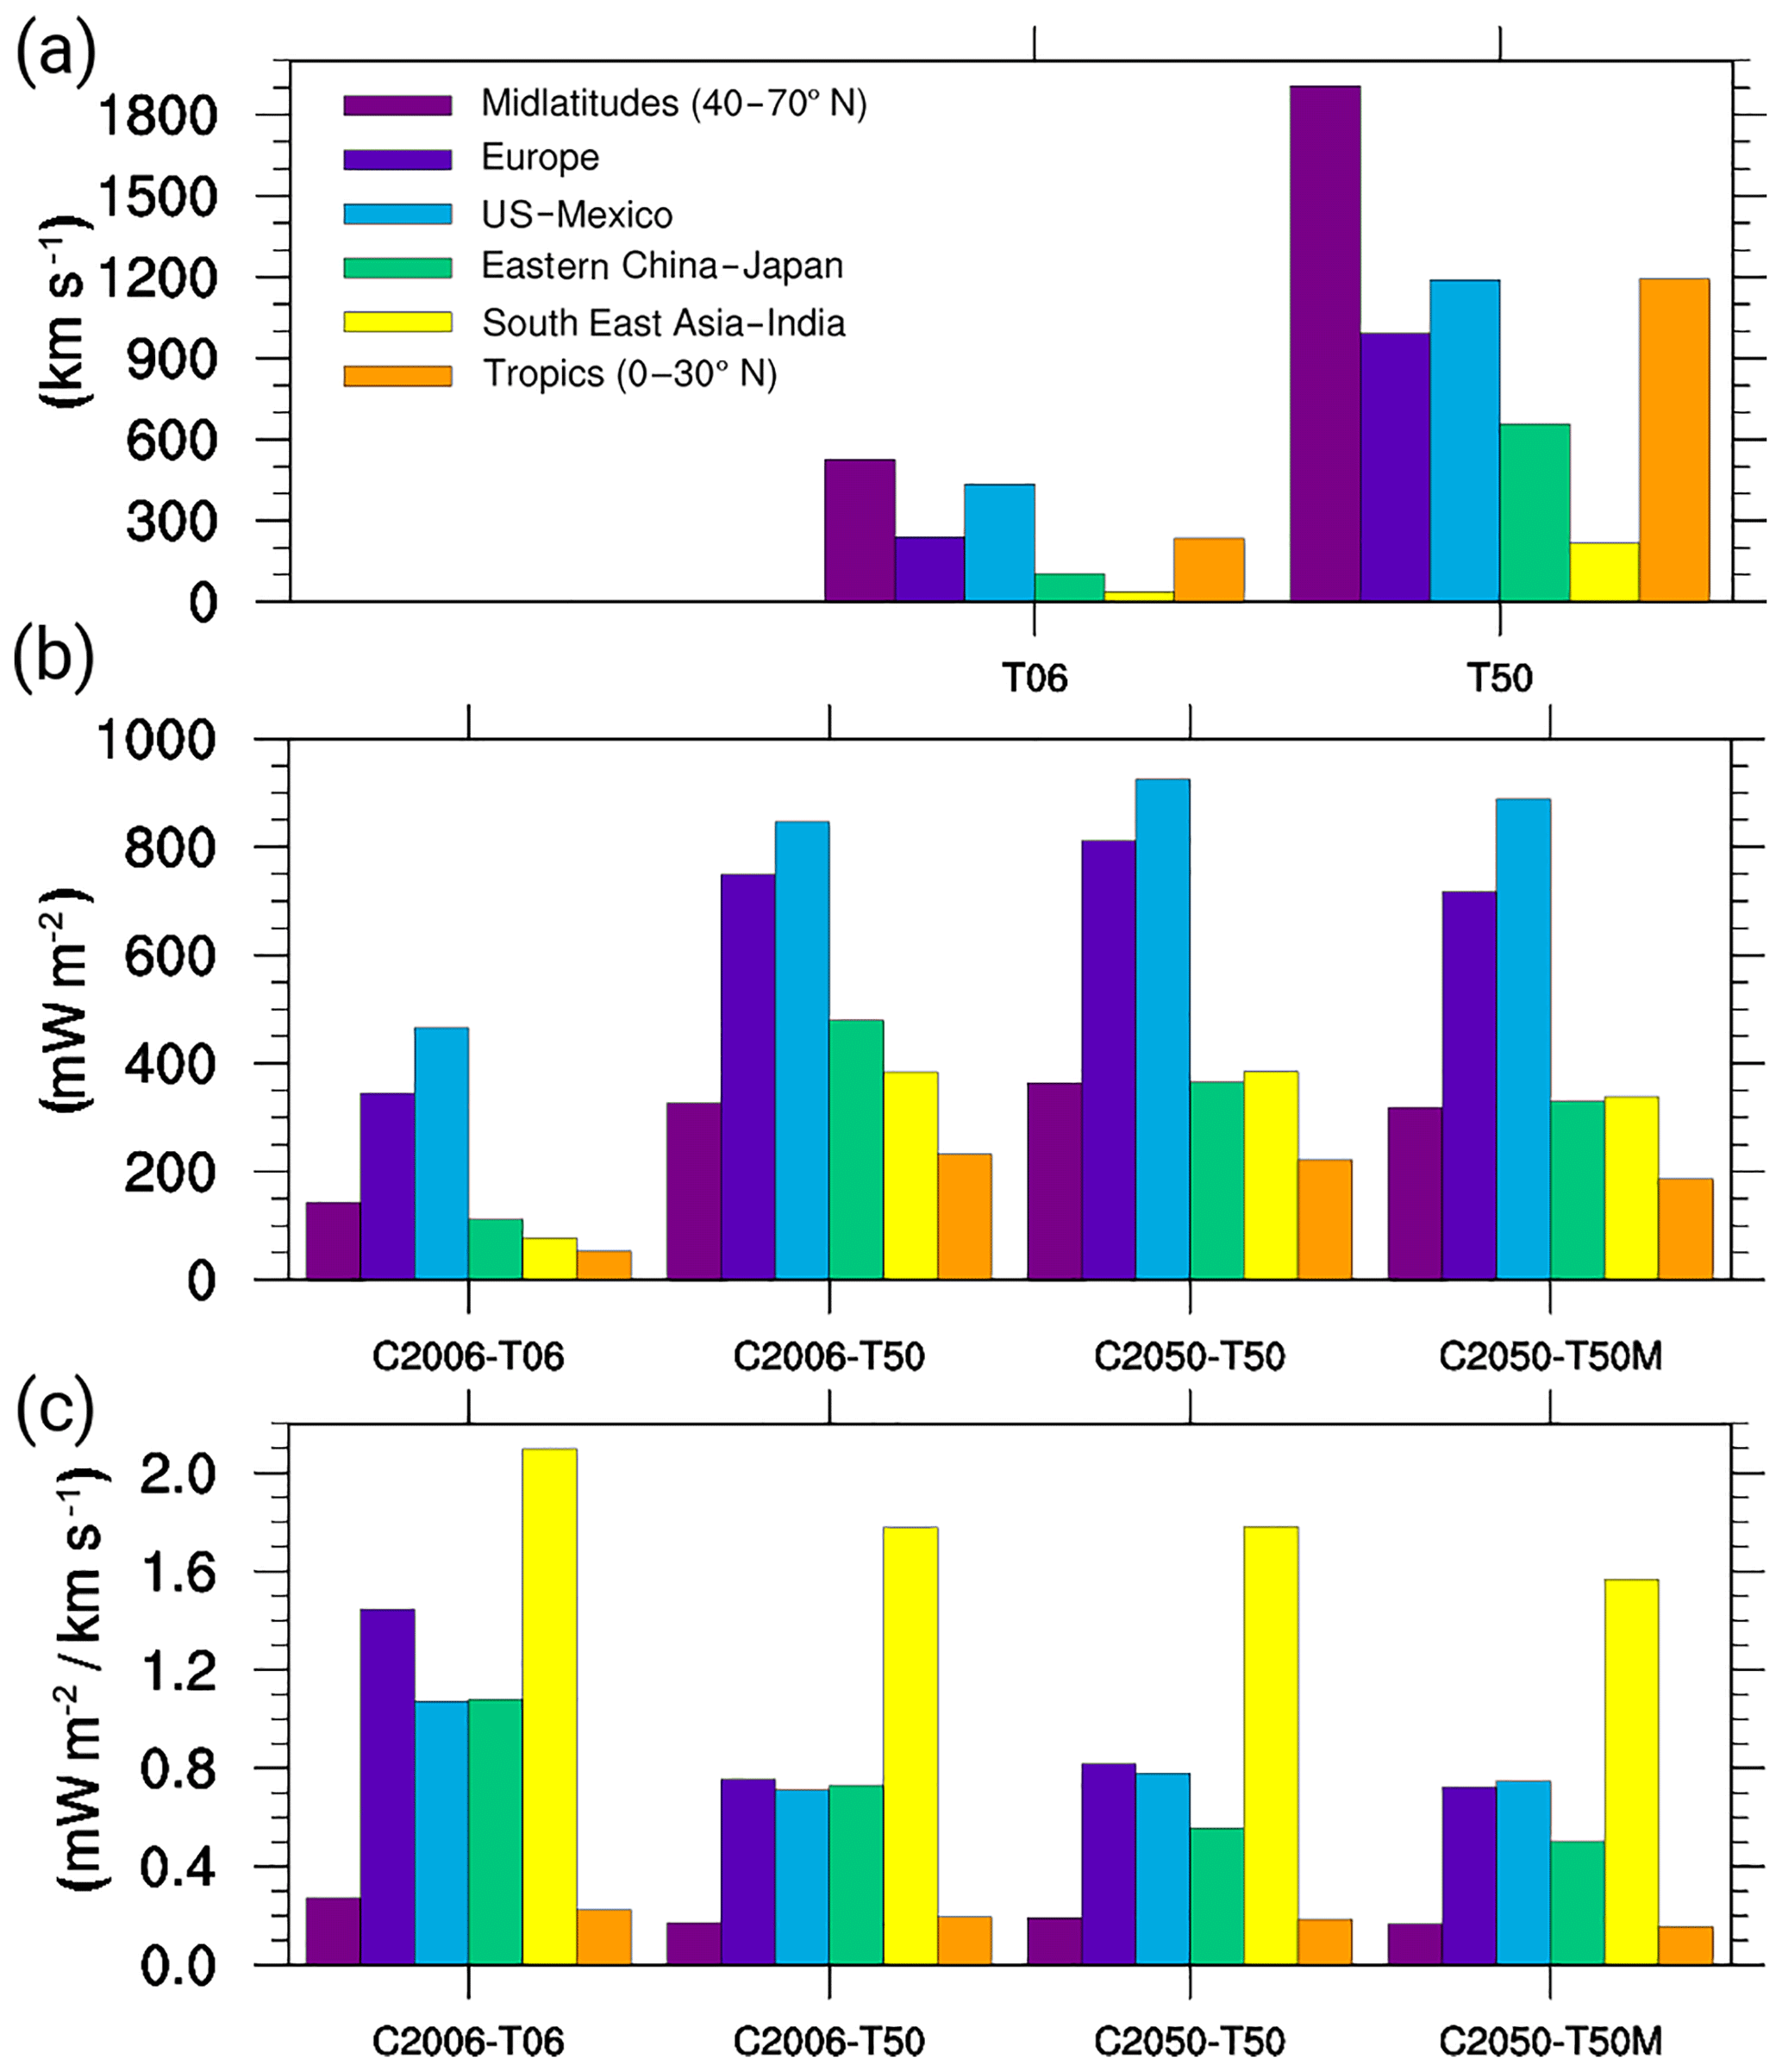
Figure 3(a) Flight distance (km s−1) for 2006 and 2050, (b) contrail cirrus radiative forcing (mW m−2) and (c) contrail cirrus radiative forcing per flight distance for simulations summarized in Table 1 in different regions (same area size), in the midlatitudes and in the tropics.
Contrail cirrus in the tropics are estimated to have a smaller radiative impact, absolute and per flight distance, than in the midlatitudes (Fig. 3b and c). The radiative impact per contrail cirrus coverage (not shown) is in the tropics larger than in the extratropics due to the larger specific humidity that leads to a larger optical depth than in the extratropics (Fig. 4e and f).
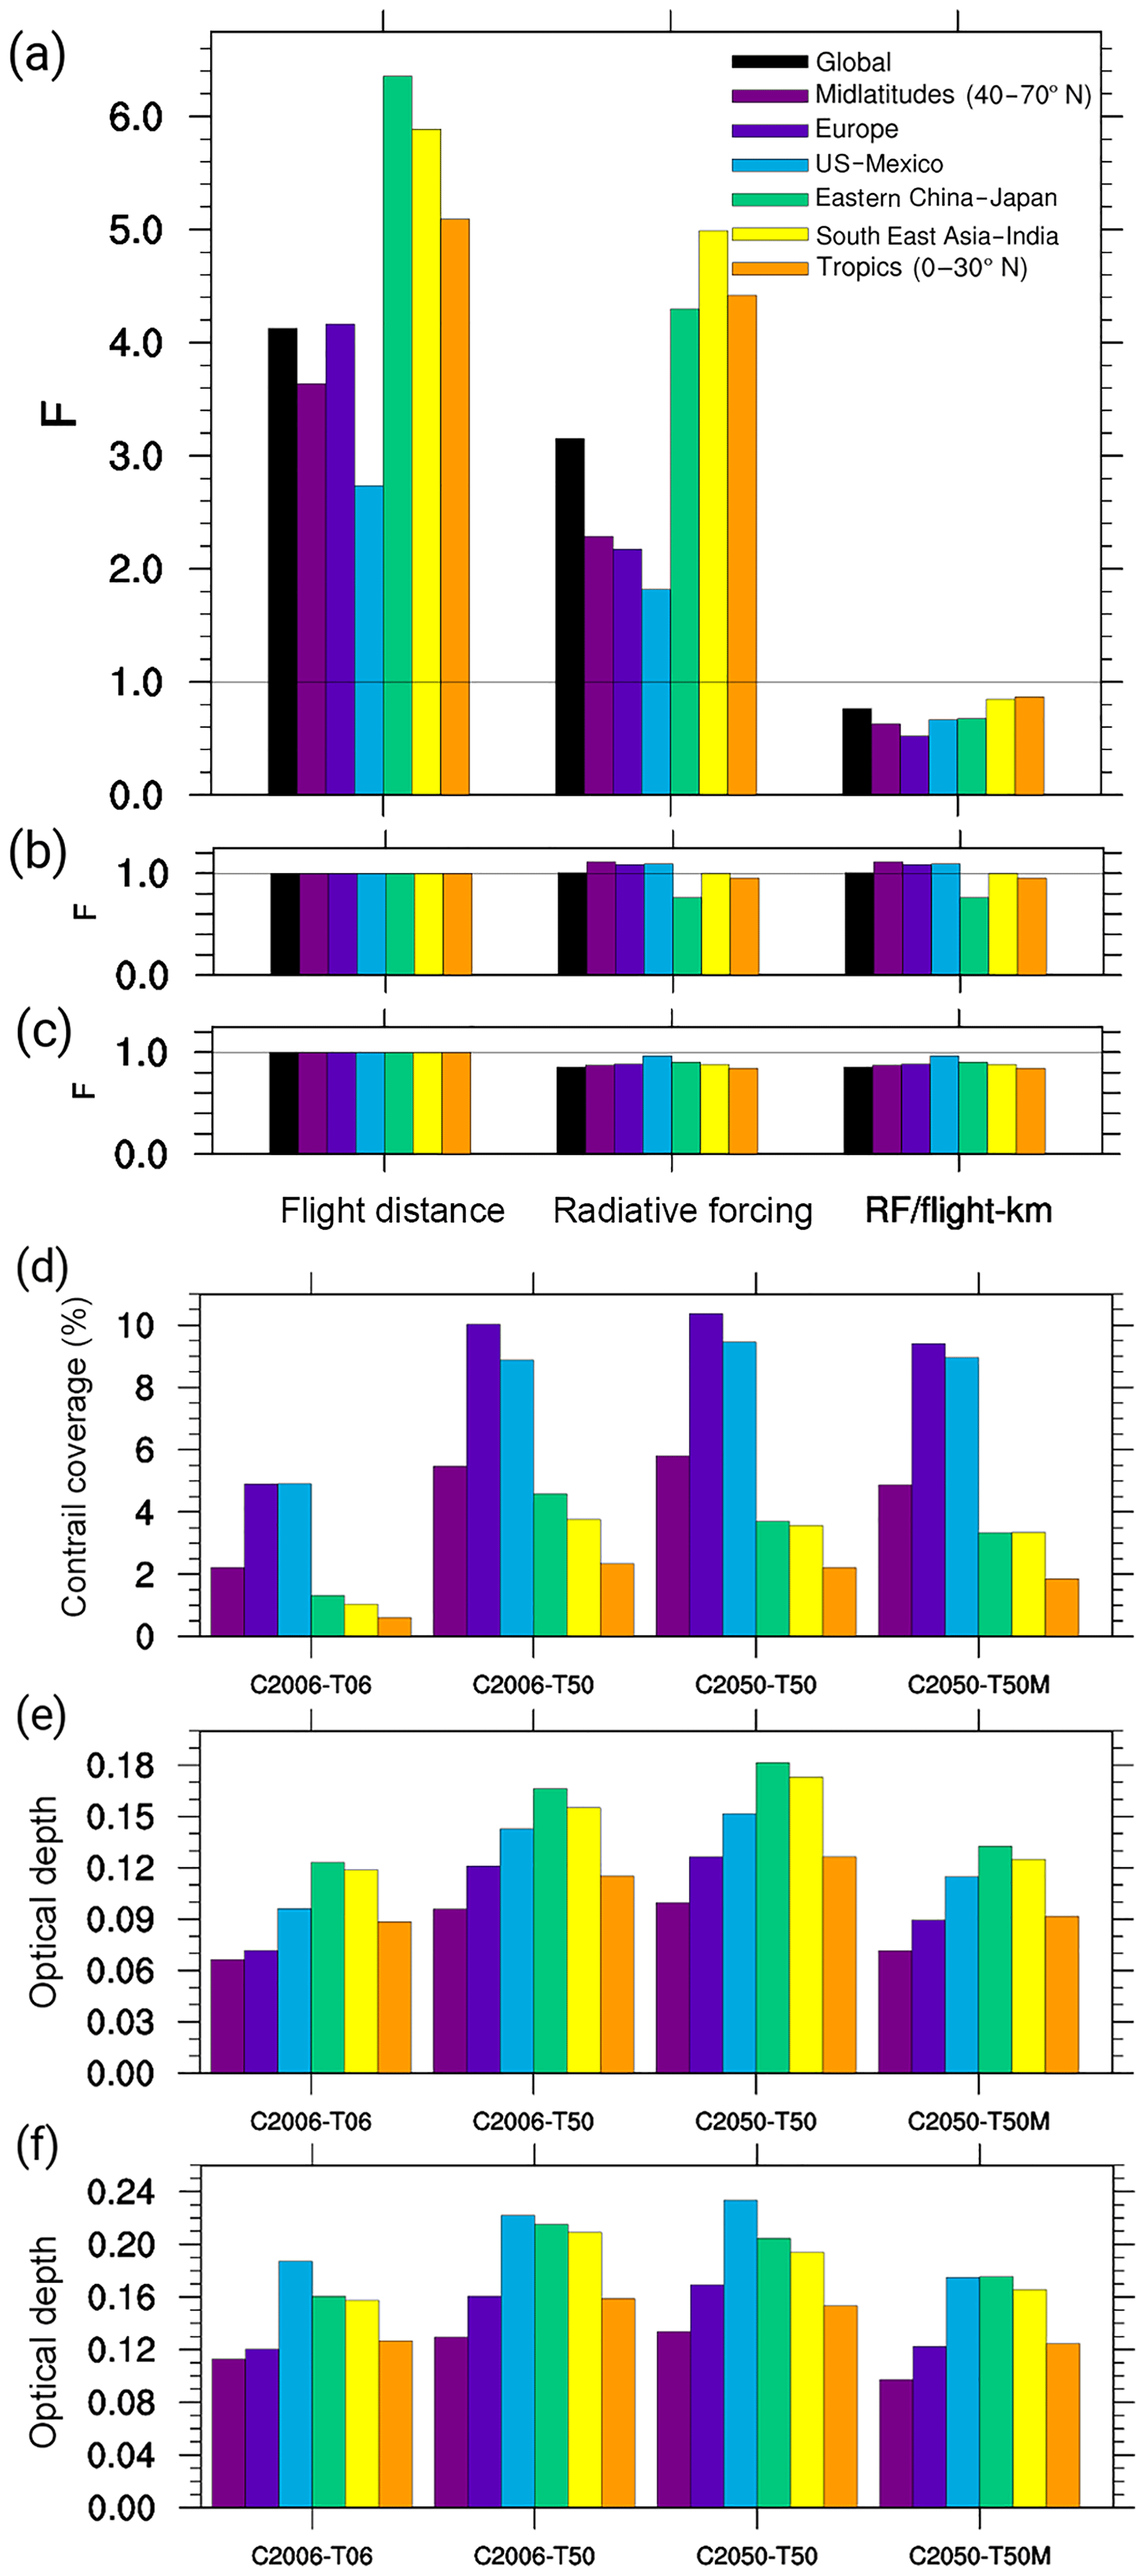
Figure 4Factor of change (F) for flight distance, radiative forcing (RF) and ratio RF over flight distance from scenario C2006-T06 to C2006-T50 (a), C2006-T50 to C2050-T50 (b) and C2050-T50 to C2050-T50M (c). Also shown is the mean contrail cirrus coverage (in %) due to contrail cirrus with a visible optical depth of >0.05 (d) and the mean visible optical depth at 200 hPa (e) and 240 hPa (f) for different areas.
3.2 Increased air traffic
The increase in global air traffic volume, including the shift to higher altitudes (Sect. 2.2), leads to a large increase in contrail cirrus radiative forcing (Table 1, Fig. 2). While the global flight distance increases from 2006 to 2050 by a factor of about 4, the global radiative forcing increases from 49 to 159 mW m−2 by a factor of about 3. The global pattern of contrail cirrus radiative forcing changes only slightly, with maxima over eastern and south-eastern Asia gaining in importance (Fig. 2). Spatial differences in the increase of contrail cirrus radiative forcing are largely due to the unequal global distribution of the increase in flight distance, due to differences in the response to shifting air traffic to higher altitudes and due to saturation effects.
The shift in air traffic to higher altitudes leads in the midlatitudes to a shift in a large fraction (in the northern midlatitudes the fraction increases on average from 16 % to 29 %) of air traffic into the stratosphere, where fewer persistent contrails can form due to the lower atmospheric humidity. Therefore, the increase in radiative forcing is substantially smaller than in flight distance, leading to a strong decrease (∼37 %) in contrail cirrus radiative forcing per flight distance in the midlatitudes (Fig. 3c). This decrease is most pronounced over Europe (amounting to ∼48 %), our most northern analysed area. Over the US–Mexico and eastern China–Japan areas, radiative forcing per flight distance decreases similarly by about 30 %.
In the tropics, the upwards shift in air traffic leads to a larger probability of contrail formation. Contrail formation at lower air traffic altitudes in the tropics is mostly limited by temperature which is too high for contrail formation (Burkhardt et al., 2008). The shifting of air traffic in the tropical troposphere upwards towards lower temperature conditions thus leads to a higher probability of contrail formation. This change in contrail formation probability together with the increase in flight distance leads to a large increase in contrail cirrus radiative forcing (Fig. 3b). The radiative forcing per flight distance decreases slightly but remains larger in the South East Asia–India area than in all other areas (Fig. 3c). The largest relative increase in flight distance and contrail cirrus radiative forcing is expected in the regions of eastern China–Japan and South East Asia–India (Fig. 4a), but their absolute contribution to global contrail cirrus radiative forcing still remains far smaller than those from the US–Mexico area and from Europe (Fig. 3b).
3.3 Climate change
We calculate contrail cirrus properties and radiative forcing for air traffic for the year 2050 within a warming climate in our C2050-T50 simulation. The background meteorology in 2050 is assumed to change according to the RCP6.0 scenario. The RCP scenario does not include the climate impact of contrail cirrus. In a changed climate we estimate contrail cirrus radiative forcing to amount to 160 mW m−2 (Table 1). The net impact of climate change on global contrail cirrus radiative forcing for the year 2050 is not significantly different from zero.
Figure 5a shows the zonal mean changes in probability of persistent contrail formation from 2006 to 2050 meteorology. North of about 30 to 40∘ N, the probability of persistent contrail formation increases above 250 hPa, whereas it decreases in the tropical regions to between 100 and 300 hPa. This leads to a slight decrease in contrail cirrus coverage and radiative forcing in the tropical areas (by ∼5 %) and over the eastern China–Japan region (by ∼20 %) (Fig. 4b and d). The contrail cirrus cover decreases in the eastern China–Japan region (Fig. 4d) due to a lower ice supersaturation frequency and a lower contrail formation probability. This leads to a decrease in radiative forcing (Fig. 4b) and in radiative forcing per flight distance (Fig. 3c) over the eastern China–Japan area. Over Europe and the US–Mexico area, contrail cirrus coverage and optical depth is slightly increased (by ∼5 %) (Fig. 4d, e and f), which leads to a slight increase in contrail cirrus radiative forcing over Europe and the US–Mexico area (Fig. 4b). These two different effects, an increase of contrail cirrus radiative forcing over the US–Mexico area and over Europe, and a decrease over the eastern China–Japan area and the tropical areas, almost compensate each other (Fig. 4b).
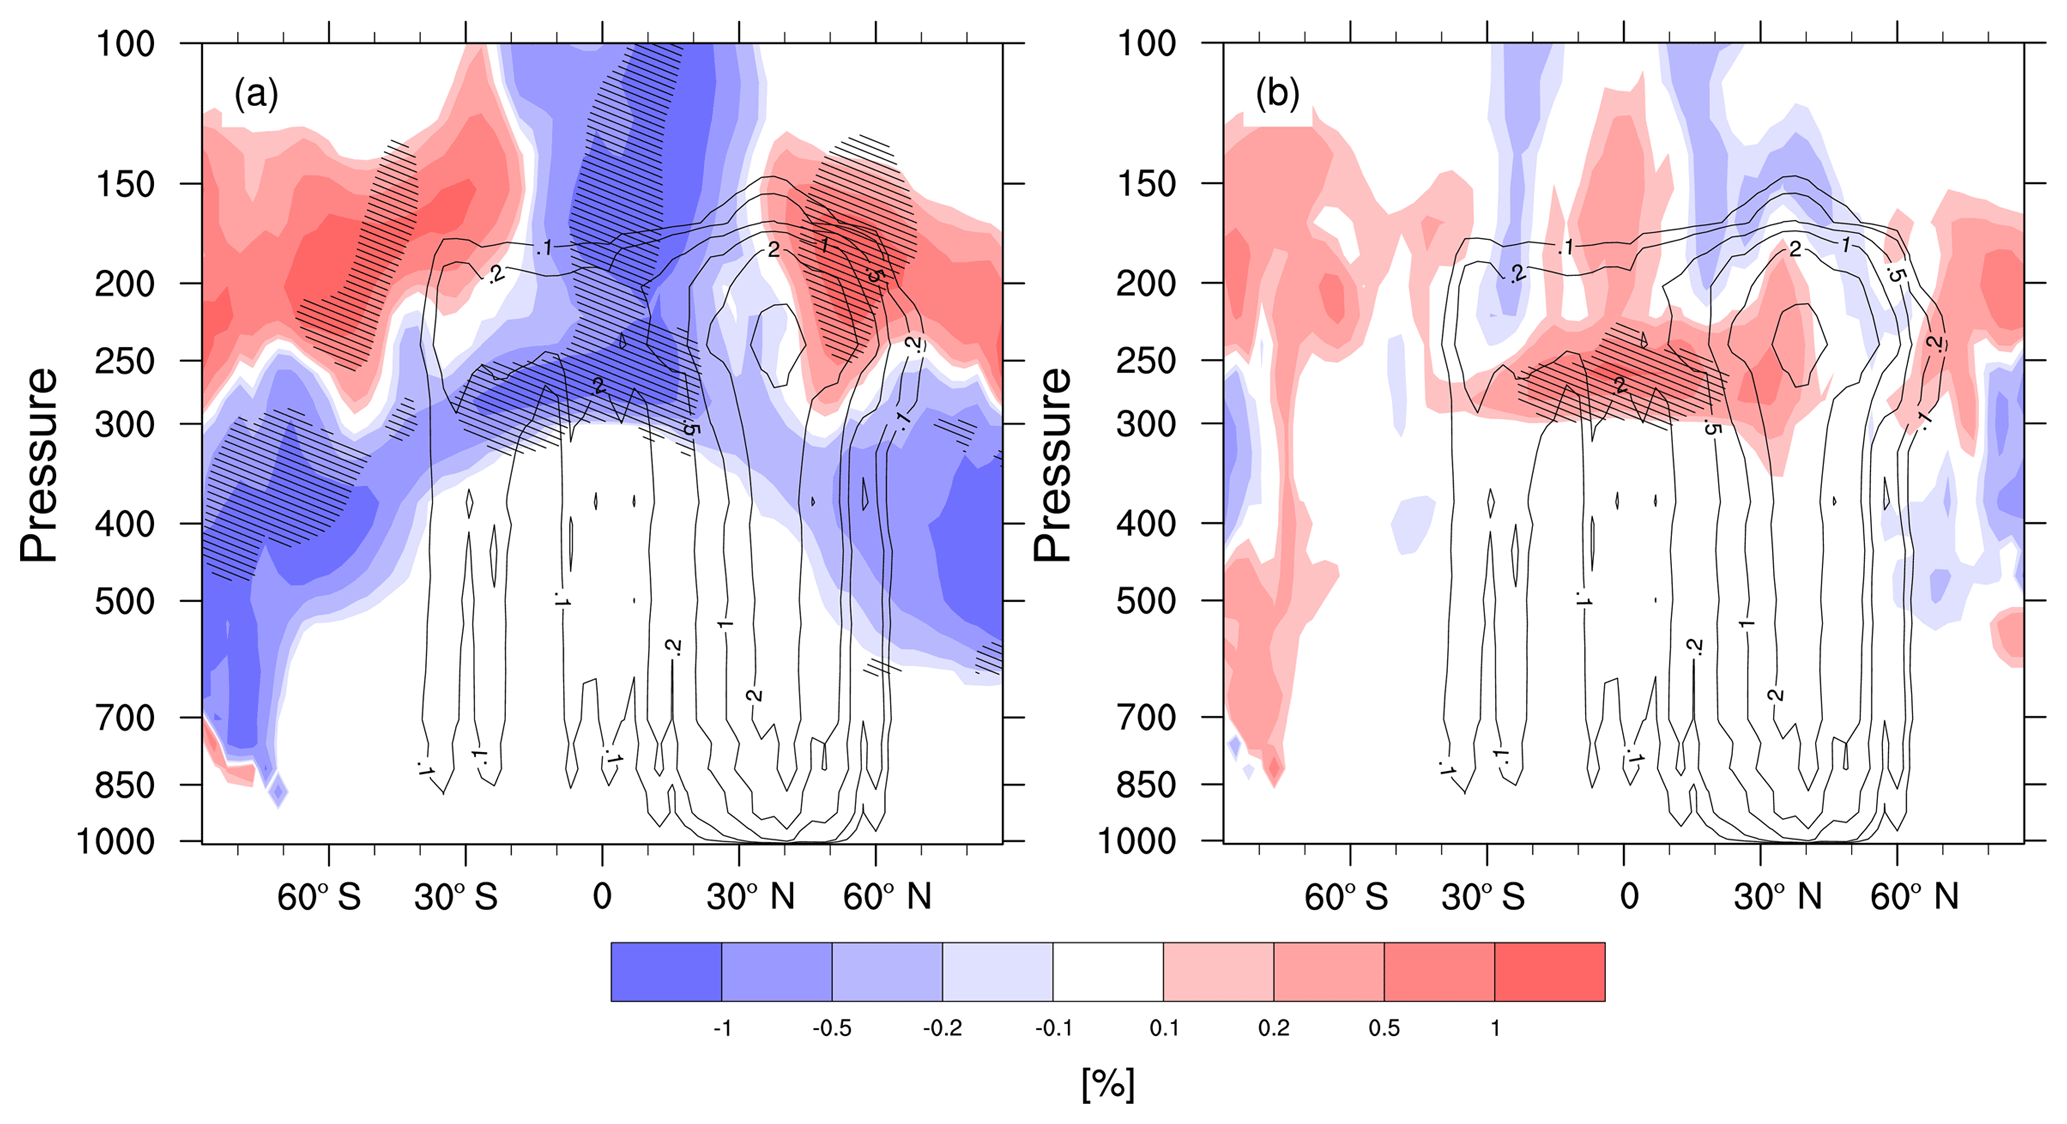
Figure 5Changes in persistent contrail formation probability from 2006 to 2050 due to climate change (a) and due to improved propulsion efficiency (b). Contour lines indicate annual flight distance (108 km) in 2050. Hatched areas indicate statistically significant changes.
3.4 Reduced soot emission and improvement in propulsion efficiency
A reduction in the initial contrail ice particle number by 50 % leads to a strong decrease in the climate impact of contrail cirrus reducing global radiative forcing for the year 2050 by 14 % from 160 to 138 mW m−2 (Table 1). A smaller number of initial ice crystals can grow faster assuming a constant amount of ambient water vapour available for deposition, leading to an earlier and larger sedimentation loss of ice crystals (Bier et al., 2017), and therefore to a decrease in contrail cirrus optical depth, lifetimes and radiative forcing (Burkhardt et al., 2018). The decrease in contrail cirrus radiative forcing for the year 2050 is caused by a decrease in contrail cirrus optical depth of up to 30 % (Figs. 4e, f and 6) and by a decrease in contrail cirrus coverage (Fig. 4d). The changes in radiative forcing are largest over the South East Asia–India area where sedimentation plays a greater role due to the larger amount of water vapour available for deposition. Over Europe the effect is slightly larger than over the US–Mexico area. This is because of its location downwind of the North Atlantic flight corridor where contrail cirrus coverage is strongly influenced by the lifetime of the contrail cirrus originating over the Atlantic. The smallest impact of the reduction in initial ice crystal numbers on contrail cirrus radiative forcing among the four studied regions can be found over the US–Mexico area (Fig. 4c) where contrail cirrus coverage mainly consists of young contrails.
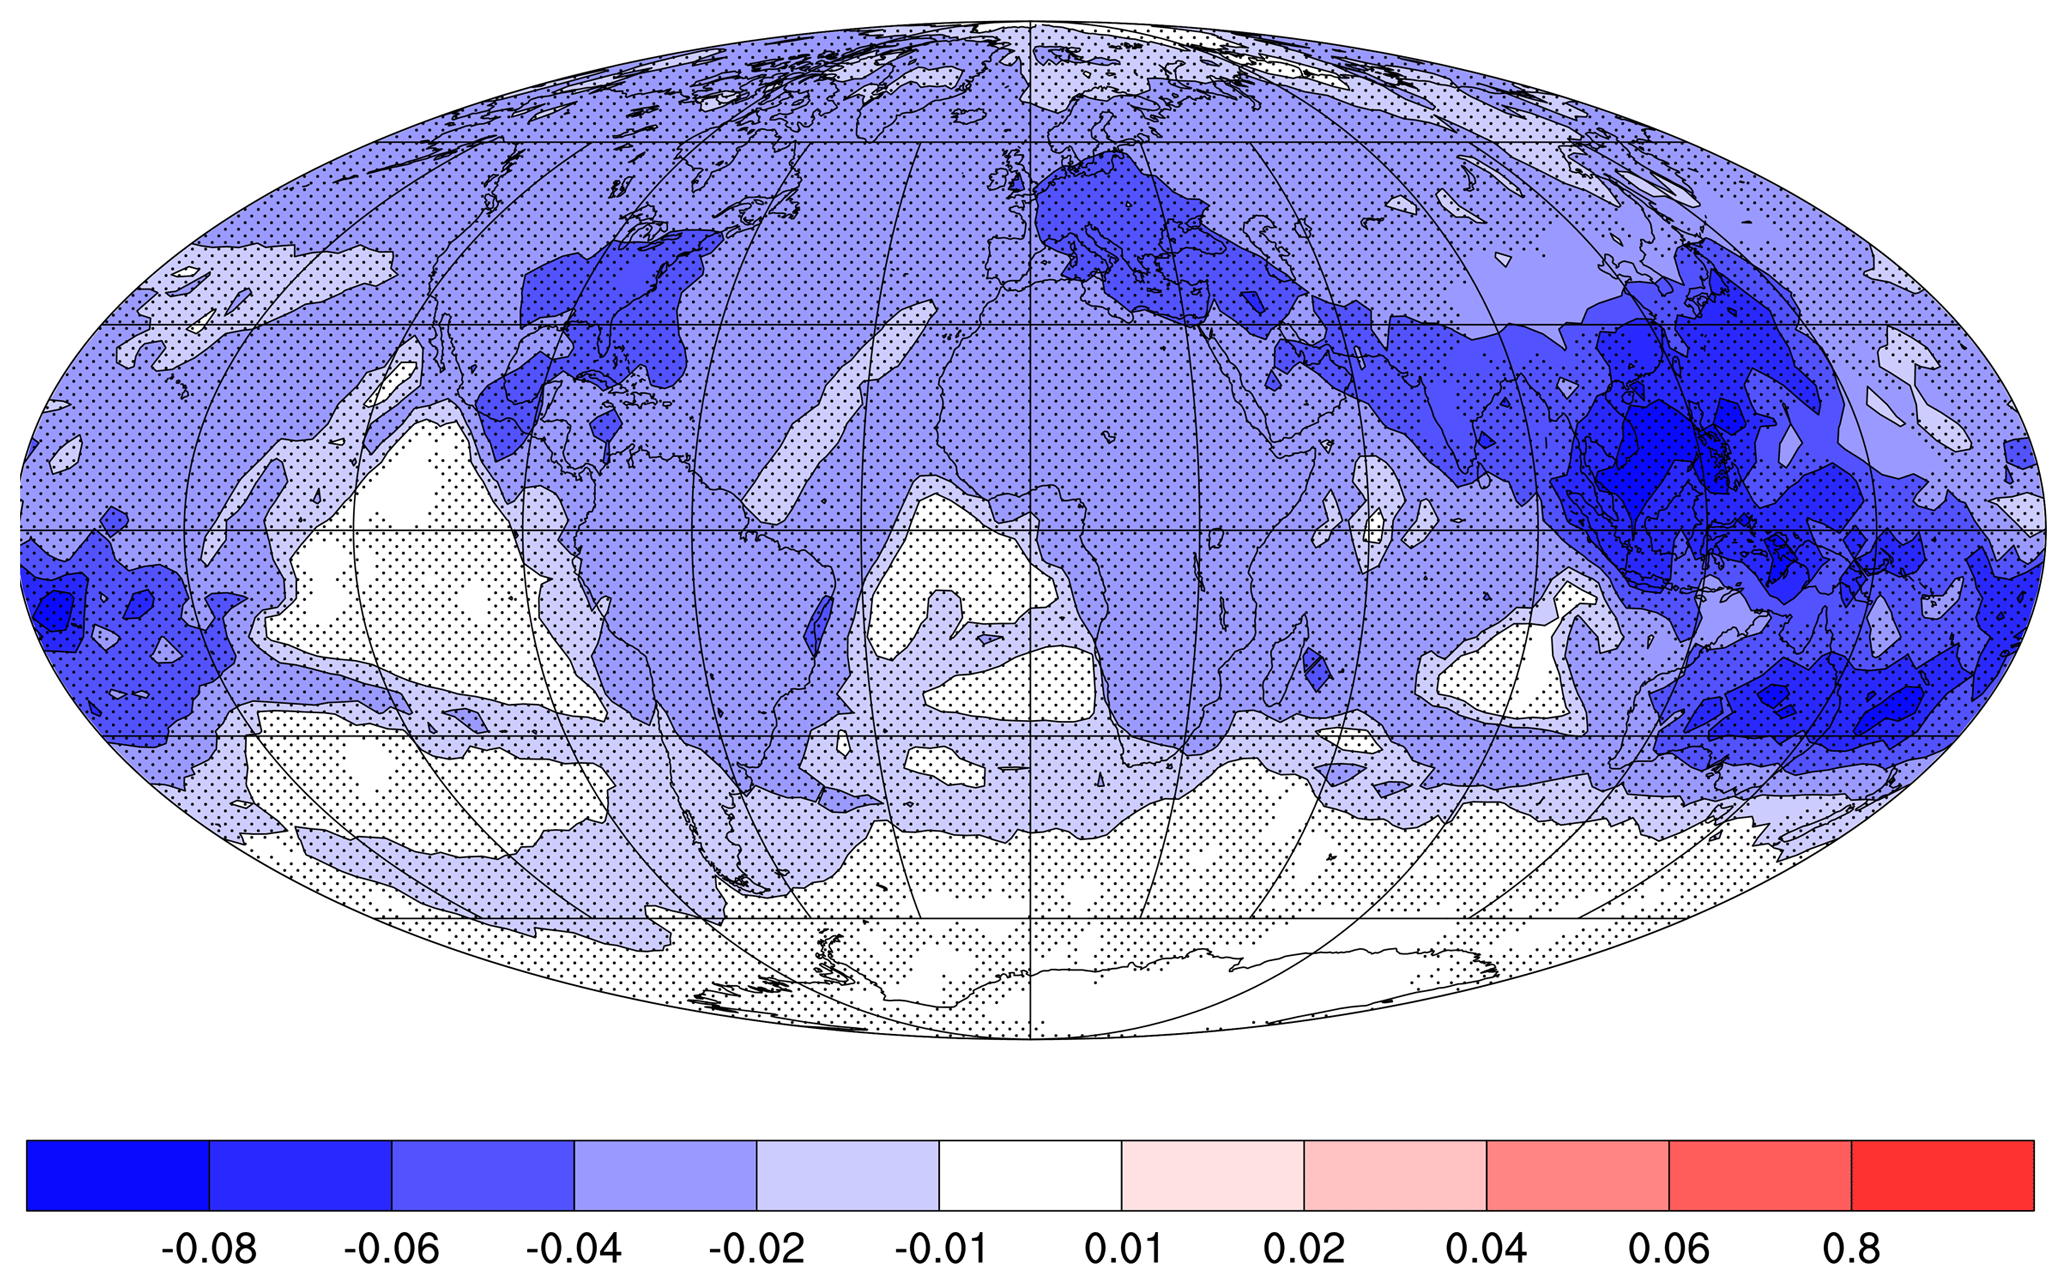
Figure 6Absolute difference in visible optical depth at 200 hPa between scenario C2050-T50 and C2050-T50M due to soot reductions. Dotted regions are significant.
The impact of soot reductions is smaller than estimated in Burkhardt et al. (2018), who found that a 50 % reduction in soot emissions causes a 20 % reduction in contrail cirrus radiative forcing for air traffic in the year 2006. The difference in sensitivity may be caused by the change in air traffic volume and pattern. Contrail cirrus radiative forcing is nonlinearly dependent on the initial ice crystal number (Burkhardt et al., 2018). This means that reducing initial ice crystal numbers in an increased air traffic environment has a smaller impact on contrail cirrus radiative forcing than for current air traffic since an abundance of contrail cirrus ice crystals will still exist even if nucleation rates are reduced.
The increase in propulsion efficiency and the change in water vapour emissions (Sect. 2.3) have no significant impact on contrail cirrus radiative forcing. Persistent contrail formation probability around 250 hPa is slightly increased only in the tropics (Fig. 5b), which has no significant impact on the global radiative forcing due to contrail cirrus.
Only one study exists that analyses the impact of contrail cirrus on the radiative balance in the future, and another study looks at the change in line-shaped contrails only. Chen and Gettleman (2016) use a very different approach to simulating contrail cirrus: calculating the number of newly formed contrail ice crystals from the available water vapour, setting the size of the ice crystals as constant and feeding this tendency in ice crystal number into the natural cloud scheme. Their resulting estimate of contrail cirrus radiative forcing for the year 2006, 13 mW m−2, is significantly smaller than our estimate which is likely connected with an underestimation of ice crystals formed at contrail formation resulting from assumed ice crystals sizes larger than those observed in young contrails (Schumann and Heymsfield, 2017). Due to the 4-fold increase in air traffic they estimate an increase in contrail cirrus radiative forcing by a factor of 7, which they argue is caused by non-uniform increases in air traffic and regional differences in sensitivity to air traffic. We calculate a 3-fold increase in contrail cirrus radiative forcing connected with the 4-fold increase in air traffic, which is in line with the 3-fold increase in contrail cirrus coverage predicted by our model. Finally, Chen and Gettelman (2016) estimate a decrease in contrail cirrus radiative forcing by about 12 % and 8 % assuming RCP8.5 and RCP4.5, respectively, whereas we find that regionally significant changes in contrail cirrus radiative forcing due the changing climate (assuming RCP6.0) cancel out globally. This difference in the impact of climate change on contrail cirrus radiative forcing is caused by differences in the estimated change in the persistent contrail formation probability (Fig. 5a). The decrease in contrail formation probability in the tropics, caused mainly by temperature changes, is captured by both models. In the northern extratropics we find an increase in the persistent contrail formation probability at about 250 to 350 hPa which lies north of 40∘ N, whereas in the simulations of Chen and Gettelman (2016, their Fig. 2) this increase is found further north starting at 60∘ N. Thus in our simulation, the increase in contrail formation probability still affects contrail formation over the US–Mexico region. This leads in our study to a cancellation of the decrease in contrail formation in the tropics and an increase in the extratropics due to climate change at main flight levels. The disagreement in the extratropics is not unexpected as future changes in contrail cirrus properties and radiative forcing due to a changing climate are much more uncertain in the midlatitudes than in the tropics since the trend in ice supersaturation frequency in the midlatitudes is strongly model dependent (Irvine and Shine, 2015).
Marquart et al. (2003), who study only line-shaped contrails, use an approach that relies on the scaling of the contrail formation probability over a specified area to observations. They show a strong decrease of line-shaped contrail coverage in the tropics due to climate change of up to 70 %. Their method is connected with a number of weaknesses, firstly there is an error in the parameterization of potential contrail coverage which is effective especially in the tropics (Burkhardt et al., 2008). They make assumptions about the scalability of contrail cirrus coverage (Burkhardt et al., 2010) that assume contrail cirrus life cycles to be equal in the extratropics and tropics, which is not justified (Burkhardt et al., 2018). Finally, they make the assumption that scaling coefficients can be transferred from our climate to a future climate.
However, all studies agree that increasing air traffic is the dominating effect that causes higher global mean contrail cirrus radiative forcing in the future. The Chen and Gettelman study and our study agree on the change in climate having only a small impact on global mean contrail cirrus radiative forcing.
Contrail cirrus radiative forcing per flight distance appears to be particularly high in the tropics. This result should still be viewed with some caution, since in the tropical areas contrails form close to the threshold conditions which lead to a lower contrail ice crystal nucleation rate (Bier and Burkhardt, 2019). This has implications not only for contrail optical depth but also for the ice crystal loss rates during the vortex phase, microphysical process rates and contrail cirrus lifetimes (Bier et al., 2017). When including a parameterization for contrail ice crystal nucleation this is likely to lead to a decrease in contrail cirrus radiative forcing in the tropics. The impact of the tropical areas on global contrail cirrus radiative forcing is still very limited so that the overestimation of contrail cirrus ice crystals has a limited impact on global contrail cirrus radiative forcing. As air traffic increases strongly in the tropical areas, future simulations should include the impact of lower nucleation rates and the associated changes in ice crystal loss rates, changes in optical depth, microphysical process rates and contrail cirrus lifetime in the tropics.
In this paper, we present contrail cirrus properties and radiative forcing for the year 2050 using AEDT emission scenarios. We isolate effects that can be expected from the change in air traffic volume and its geographic and vertical distribution, from climate change, from improvements in fuel and propulsion efficiency and decreases in soot and water vapour emissions caused by the use of alternative fuels. We study regional changes in the main air traffic areas and in areas where air traffic is projected to strongly increase.
We find that the future projected increase in air traffic and the slight shift to higher altitudes lead to a large increase in contrail cirrus coverage, optical depth and radiative forcing. With a 4-fold increase in air traffic contrail cirrus radiative forcing is increasing 3-fold, from 49 to 159 mW m−2. The results are based on an air traffic inventory of future air traffic measured as track (ground projected) distance rather than slant (3-D) distance. Assuming that the relation of contrail cirrus radiative forcing calculated from track or slant distance stays constant for future scenarios and therefore applying the factor 1.14 (Bock and Burkhardt, 2016b), this would correspond to a global mean contrail cirrus radiative forcing of 182 mW m−2 that would result from an inventory of future air traffic measured in slant distance. The main air traffic areas over North America and Europe continue to contribute the largest fraction of the contrail cirrus radiative forcing, but the Asian main air traffic areas gain in importance. Our estimates of current and future contrail cirrus radiative forcing are different to those given by Chen and Gettelman (2016) which are likely connected to their methodology estimating contrail ice nucleation (see Sect. 4). Contrail cirrus radiative forcing appears to be hardly affected by climate change assuming RCP6.0, which leads to a slight decrease in contrail cirrus coverage and radiative forcing over Asia and a compensating small increase over North America and Europe. This is in contrast to results from Chen and Gettelman (2016) which found contrail cirrus radiative forcing to decrease due to climate change by about 12 % assuming RCP8.5. The reason for this discrepancy can be traced back to a difference in the pattern of change of contrail formation probability in the Northern Hemisphere. Nevertheless, the studies agree that changes in contrail cirrus radiative forcing due to the projected increase in air traffic by far outweigh any damping effect that a change in climate may have.
Of the fuel and propulsion efficiency improvements and soot reductions due to the use of alternative fuels, it is the soot reduction that has the largest impact on contrail cirrus. The larger propulsion efficiency leads to a slight increase in the contrail formation probability in the tropics with little impact on global radiative forcing. The soot emissions cause a reduction in contrail cirrus optical depth and lifetime (Burkhardt et al., 2018) which leads again to a decrease in contrail cirrus coverage. Consequently, contrail cirrus radiative forcing is decreased by 15 %, less than estimated by Burkhardt et al. (2018), who infer a 20 % reduction for air traffic in the year 2006. This slight decrease in sensitivity connected with soot number emission reductions is likely caused by the fact that the strong increase in air traffic leads to an abundance of ice crystals which makes decreases in ice crystal numbers less effective.
Overall, the strong increase in radiative forcing from 2006 to 2050 due to larger air traffic volume and the shift in air traffic towards higher altitudes cannot be compensated by small reductions in radiative forcing due to changes expected from climate change, the projected reductions in reduced soot emissions and improvements in fuel efficiency. Even if soot number emissions could be reduced by 90 %, the associated reduction in the contrail cirrus radiative forcing (Burkhardt et al., 2018) in the year 2050 would likely not be enough to stabilize contrail cirrus radiative forcing at the level of the year 2006. Since larger reductions in soot number emissions are expected to lead to increases in ice nucleation (Kärcher and Yu, 2009) and in the contrail cirrus climate impact (Burkhardt et al., 2018) a further decrease of soot number emissions may not be expedient.
In order to understand the implications of our results for the overall air traffic climate impact, we calculated the aviation CO2 radiative forcing according to Myhre et al. (1998). CO2 emissions and contrail cirrus radiative forcing are the two largest aviation-related radiative forcing components besides the possibly large, but as yet unquantified, impact of indirect effects on clouds (Lee et al., 2009). Radiative forcing due to aviation CO2 emissions amounts for 2006 to 24.0 mW m−2; for the year 2050, assuming the C2050-T50 scenario, to 84.8 mW m−2; and assuming the C2050-T50M scenario to 58.0 mW m−2. This means that the factor of increase in CO2 radiative forcing from C2006-T06 to C2050-T50 is 3.5, slightly higher than 3.2 for the contrail cirrus radiative forcing. Considering the increase in fuel efficiency from C2006-T06 to C2050-T50M, the factor of change for the CO2 radiative forcing is reduced to 2.4, whereas the factor of change for the global contrail cirrus radiative forcing in this scenario is reduced to 2.8. The decrease in contrail cirrus radiative forcing in this scenario is caused by the decrease in soot emissions. This means that radiative forcing due to contrail cirrus can be expected to increase faster in the future than that due to CO2.
The increase in fuel efficiency included in the AEDT inventory does not conform with the CORSIA agreement unless a large part of the CO2 emission reduction is reached by carbon offsetting. It is important to point out that carbon offsetting deals only with the impact of CO2 emissions while leaving the impact of contrail cirrus on climate unchanged. Since the increase in contrail cirrus radiative forcing can be stronger than in CO2 radiative forcing, both radiative forcing components need to be considered in future agreements.
The data obtained from this study are available upon request from the authors.
LB performed and analysed simulations. LB and UB jointly discussed scientific results and wrote the paper.
The authors declare that they have no conflict of interest.
The authors thank Michael Ponater for helpful comments, the Volpe National Systems Transportation Center, the U.S. Federal Aviation Administration and C.-C. Chen for providing the AEDT inventories and two anonymous reviewer for their very helpful comments. We also thank Katrin Dahlmann for the comparison with CO2 radiative forcing. The work was funded by a postdoc program of Rolf Henke, member of the DLR executive board. The model simulations were performed at the German Climate Computing Centre (DKRZ) through support from the Bundesministerium für Bildung und Forschung (BMBF).
The article processing charges for this open-access publication were covered by a Research Centre of the Helmholtz Association.
This paper was edited by Toshihiko Takemura and reviewed by two anonymous referees.
Airbus: Global Market Forecast 2006–2026, Airbus, France, 2007.
Barrett, S., Prather, M., Penner, J., Selkirk, H., Balasubramania, S., Dopelheuer, A., Fleming, G., Gupta, M., Halthore, R., Hileman, J., Jacobson, M., Kuhn, S., Lukachko, S., Miake-Lye, R.,Petzold, A., Roof, C., Schaefer, M., Schumann, U., Waitz, I., and Wayson, R.: Guidance on the Use of AEDT Gridded aircraft Emissions in Atmospheric Models, MIT Laboratory for Aviation and the Environment, Report No: LAE-2010-008-N, 13 pp., available at: http://citeseerx.ist.psu.edu/viewdoc/download?doi=10.1.1.719.2090&rep=rep1&type=pdf (last access: 14 June 2019), 2010b.
Beyersdorf, A. J., Timko, M. T., Ziemba, L. D., Bulzan, D., Corporan, E., Herndon, S. C., Howard, R., Miake-Lye, R., Thornhill, K. L., Winstead, E., Wey, C., Yu, Z., and Anderson, B. E.: Reductions in aircraft particulate emissions due to the use of Fischer–Tropsch fuels, Atmos. Chem. Phys., 14, 11–23, https://doi.org/10.5194/acp-14-11-2014, 2014.
Bier, A. and Burkhardt, U.: Variability in contrail ice nucleation and its dependence on soot number emissions, J. Geophys. Res.-Atmos., 124, 3384–3400, https://doi.org/10.1029/2018JD029155, 2019.
Bier, A., Burkhardt, U., and Bock, L.: Synoptic control of contrail cirrus life cycles and their modification due to reduced soot number emissions, J. Geophys. Res.-Atmos., 122, 11584–11603, https://doi.org/10.1002/2017JD027011, 2017.
Bock, L. and Burkhardt, U.: The temporal evolution of a long-lived contrail cirrus cluster: Simulations with a global climate model, J. Geophys. Res.-Atmos., 121, 3548–3565, 2016a.
Bock, L. and Burkhardt, U.: Reassessing properties and radiative forcing of contrail cirrus using a climate model, J. Geophys. Res.-Atmos., 121, 9717–9736, 2016b.
Burkhardt, U. and Kaercher, B.: Process-based simulation of contrail cirrus in a global climate model, J. Geophys. Res., 114, D16201, https://doi.org/10.1029/2008JD011491, 2009.
Burkhardt, U. and Kärcher, B.: Global radiative forcing from contrail cirrus, Nat. Clim. Change, 1, 54–58, 2011.
Burkhardt, U., Kärcher, B., Ponater, M., Gierens, K., and Gettelman, A.: Contrail cirrus supporting areas in model and observations, Geophys. Res. Lett., 35, L16808, https://doi.org/10.1029/2008GL034056, 2008.
Burkhardt, U., Kärcher, B., and Schumann, U.: Global modeling of the contrail and contrail cirrus climate impact, B. Am. Meteorol. Soc., 91, 479–484, 2010.
Burkhardt, U., Bock, L., and Bier, A.: Mitigating the contrail cirrus climate impact by reducing aircraft soot number emissions, npj Climate and Atmospheric Science, 1, 37, https://doi.org/10.1038/s41612-018-0046-4, 2018.
Chen, C.-C. and Gettelman, A.: Simulated 2050 aviation radiative forcing from contrails and aerosols, Atmos. Chem. Phys., 16, 7317–7333, https://doi.org/10.5194/acp-16-7317-2016, 2016.
Chen, C.-C., Gettelman, A., Craig, C., Minnis, P., and Duda, D.: Global contrail coverage simulated by CAM5 with the inventory of 2006 global aircraft emissions, J. Adv. Model. Earth Syst., 4, M04003, https://doi.org/10.1029/2011MS000105, 2012.
Deuber, O., Matthes, S., Sausen, R., Ponater, M., and Lim, L.: A physical metric-based framework for evaluating the climate trade-off between CO2 and contrails – The case of lowering aircraft flight trajectories, Environ. Sci. Policy, 25, 176–185, 2013.
Hansen, J., Sato, M., and Ruedy, R.: Radiative forcing and climate response, J. Geophys. Res., 102, 6831–6864, 1997.
ICAO: Environmental Report 2007, Environmental Unit on the International Civil Aviation Organization, Montreal, Canada, 2007.
ICAO/FESG: Report of the Forecasting and Economic Analysis Sub-Group: Long-Range Scenarios, International Civil Aviation Organization Committee, on Aviation Environmental Protection, Steering Group Meeting, Report 4, Canberra, 1998.
Irvine, E. A. and Shine, K. P.: Ice supersaturation and the potential for contrail formation in a changing climate, Earth Syst. Dynam., 6, 555–568, https://doi.org/10.5194/esd-6-555-2015, 2015.
Jöckel, P.: Technical note: Recursive rediscretisation of geo-scientific data in the Modular Earth Submodel System (MESSy), Atmos. Chem. Phys., 6, 3557–3562, https://doi.org/10.5194/acp-6-3557-2006, 2006.
Jones, C. D., Hughes, J. K., Bellouin, N., Hardiman, S. C., Jones, G. S., Knight, J., Liddicoat, S., O'Connor, F. M., Andres, R. J., Bell, C., Boo, K.-O., Bozzo, A., Butchart, N., Cadule, P., Corbin, K. D., Doutriaux-Boucher, M., Friedlingstein, P., Gornall, J., Gray, L., Halloran, P. R., Hurtt, G., Ingram, W. J., Lamarque, J.-F., Law, R. M., Meinshausen, M., Osprey, S., Palin, E. J., Parsons Chini, L., Raddatz, T., Sanderson, M. G., Sellar, A. A., Schurer, A., Valdes, P., Wood, N., Woodward, S., Yoshioka, M., and Zerroukat, M.: The HadGEM2-ES implementation of CMIP5 centennial simulations, Geosci. Model Dev., 4, 543–570, https://doi.org/10.5194/gmd-4-543-2011, 2011.
Kärcher, B. and Yu, F.: Role of aircraft soot emissions in contrail formation, Geophys. Res. Lett., 36, L01804, https://doi.org/10.1029/2008GL036649, 2009.
Kärcher, B., Burkhardt U., Ponater, M., and Frömming, C.: Importance of representing optical depth variability for estimates of global line-shaped contrail radiative forcing, P. Natl. Acad. Sci. USA, 107, 19181–19184, 2010.
Kärcher, B., Burkhardt, U., Bier, A., Bock, L., and Ford, I. J.: The microphysical pathway to contrail formation, J. Geophys. Res.-Atmos., 120, 7893–7927, 2015.
Lamquin, N., Stubenrauch, C. J., Gierens, K., Burkhardt, U., and Smit, H.: A global climatology of upper-tropospheric ice supersaturation occurrence inferred from the Atmospheric Infrared Sounder calibrated by MOZAIC, Atmos. Chem. Phys., 12, 381–405, https://doi.org/10.5194/acp-12-381-2012, 2012.
Lee, D. S., Fahey, D., Forster, P., Newton, P., Wit, R., Lim, L., Owen, B., and Sausen, R.: Aviation and global climate change in the 21st century, Atmos. Environ., 43, 3520–3537, 2009.
Lee, D. S., Pitari, G., Grewe, V., Gierens, K., Penner, J. E., Petzold, A., and Iachetti, D.: Transport impacts on atmosphere and climate: Aviation, Atmos. Environ., 44, 4678–4734, 2010.
Lohmann, U., Spichtinger, P., Heidt, S., Peter, T., and Smit, H.: Cirrus clouds and ice supersaturation regions in a global climate model, Environ. Res. Lett., 3, 045022, https://doi.org/10.1088/1748-9326/3/4/045022, 2008.
Marquart, S., Ponater, M., Mager, F., and Sausen, R.: Future development of contrail cover, optical depth, and radiative forcing: Impacts of increasing air traffic and climate change, J. Climate, 16, 2890–2904, 2003.
Meinshausen, M., Smith, S. J., Calvin, K., Daniel, J. S., Kainuma, M. L. T., Lamarque, J., Matsumoto, K., Montzka, S. A., Raper, S. C. B., Riahi, K., Thomson, A., Velders, G. J. M., and van Vuuren, D. P. P.: The RCPgreenhouse gas concentrations and their extensions from 1765 to 2300, Climatic Change, 109, 213–241, 2011.
Minnis, P., Schumann, U., Doelling, D. R., Gierens, K. M., and Fahey, D. W.: Global distribution of contrail radiative forcing, Geophys. Res. Lett., 26, 1853–1856, 1999.
Moore, R. H., Shook, M., Beyersdorf, A., Corr, C., Herndon, S., Knighton, W. B., Miake-Lye, R., Thornhill, K. L., Winstead, E. L., Yu, Z., Ziemba, L. D., and Anderson, B. E.: Influence of Jet Fuel Composition on Aircraft Engine Emissions: A Synthesis of Aerosol Emissions Data from the NASA APEX, AAFEX, and ACCESS Missions, Energy Fuels, 29, 2591–2600, 2015.
Moore, R. H., Thornhill, K. L., Weinzierl, B., Sauer, D., D'Ascoli, E., Kim, J., Lichtenstern, M., Scheibe, M., Beaton, B., Beyersdorf, A. j., Bulzan, D., Corr, C. A., Crosbie, E., Jurkat, T., Martin, R., Riddick, D., Shook, M., Slover, G., Voigt, C., White, R., Winstead, E., Yasky, R., Ziemba, L. D., Brown, A., Schlager, H., and Anderson, B. E.: Biofuel blending reduces particle emissions from aircraft engines at cruise conditions, Nature, 543, 411–415, https://doi.org/10.1038/nature21420, 2017.
Myhre, G., Highwood, E. J., Shine, K. P., and Stordal, F.: New estimates of radiative forcing due to well mixed greenhouse gases, Geophys. Res. Lett., 25, 2715–2718, 1998.
Newinger, C. and Burkhardt, U.: Sensitivity of contrail cirrus radiative forcing to air traffic scheduling, J. Geophys. Res., 117, D10205, https://doi.org/10.1029/2011JD016736, 2012.
Noppel, F. and Singh, R.: Overview on contrail and cirrus cloud avoidance technology, J. Aircraft, 44, 1721–1726, 2007.
Roeckner, E., Baeuml, G., Bonaventura, L., Brokopf, R., Esch, M., Giorgetta, M., Hagemann, S., Kirchner, I., Kornblueh, L., Manzini, E., Rhodin, A., Schlese, U., Schulzweida, U., and Tompkins, A.: The atmospheric general circulation model ECHAM5. Part 1: Model description, Max-Planck-Inst., Hamburg, Germany, Report 349, 127 pp., 2003.
Roof, C., Hansen, A., Fleming, G., Thrasher, T., Nguyen, A., Hall, C., Dinges, E., Bea, R., Grandi, F., Kim, B., Usdrowski, S., and Hollingsworth, P.: Aviation environmental design tool (AEDT) system architecture, Tech. Report, Doc #AEDT-AD-01, 2007.
Schumann, U.: On conditions for contrail formation from aircraft exhausts, Meterol. Z., 5, 4–23, 1996.
Schumann, U. and Heymsfield, A.: On the life cycle of individual contrails and contrail cirrus, Meteor. Mon., 58, 3–1, 2017.
Stier, P., Feichter, J., Kinne, S., Kloster, S., Vignati, E., Wilson, J., Ganzeveld, L., Tegen, I., Werner, M., Balkanski, Y., Schulz, M., Boucher, O., Minikin, A., and Petzold, A.: The aerosol-climate model ECHAM5-HAM, Atmos. Chem. Phys., 5, 1125–1156, https://doi.org/10.5194/acp-5-1125-2005, 2005.
Unger, N., Zhao, Y., and Dang, H.: Mid-21st century chemical forcing of climate by the civil aviation sector, Geophys. Res. Lett., 40, 641–645, 2013.
Unterstrasser, S.: Properties of young contrails – a parametrisation based on large-eddy simulations, Atmos. Chem. Phys., 16, 2059–2082, https://doi.org/10.5194/acp-16-2059-2016, 2016.
Wilkerson, J. T., Jacobson, M. Z., Malwitz, A., Balasubramanian, S., Wayson, R., Fleming, G., Naiman, A. D., and Lele, S. K.: Analysis of emission data from global commercial aviation: 2004 and 2006, Atmos. Chem. Phys., 10, 6391–6408, https://doi.org/10.5194/acp-10-6391-2010, 2010.